leveraged loans - gallagher · leveraged loans growth of the leveraged loan market rimer...
TRANSCRIPT
Leveraged Loans: A Primer
By William N. Welsh, CIPMArea Assistant Vice PresidentInstitutional Investment & Fiduciary Services
Leveraged Loans: A Primer
ARTHUR J. GALLAGHER & CO. | MARCH 2017 ::INSTITUTIONAL INVESTMENT & FIDUCIARY SERVICES 2
Introduction
What are leveraged loans and how do investors obtain exposure to them? What are some of the potential benefits of adding leveraged loans to a portfolio, and is now a good time to invest in them? The purpose of this paper is to answer these questions, and provide a primer on leveraged loans as well as the rationale for considering adding them to their investment portfolios.
Leveraged Loans — Background
Leveraged loans — also commonly referred to as bank loans, floating-rate loans or senior-secured loans — are private debt obligations issued by companies seeking financing (i.e., borrowers). The “leveraged” aspect of these loans derives from the fact that companies obtaining this type of financing possess relatively high levels of debt — that is, they are “highly levered.” As such, these companies carry a below-investment grade credit rating (BB+ or lower). Commonly, these highly levered, lower-rated companies also issue public debt that is rated below-investment grade (so-called “high yield” debt).
Leveraged Loans vs. BondsLoans differ from bonds in three important ways:
1. Loans offer variable interest rates, while most bonds pay fixed interest rates. Interest payments on loans will vary based on an interest rate formula, according to which the interest rate is set as a “spread” above a benchmark rate, the most common of which is the London Interbank Offered Rate (LIBOR). 1 As an example, if the applicable LIBOR rate is 1% when a loan is issued and the established loan spread is 3%, the total expected initial interest rate will be 4%. If LIBOR increases to 2%, the interest rate will also increase, in this case to 5%.
2. Loans are typically senior to bonds in a borrower’s capital structure, meaning that interest payments are distributed to lenders before coupon payments are made to bondholders. Further, loans are usually “secured” by assets of the borrower, meaning there is collateral backing the loans, which is not always the case for bonds. The seniority and secured nature of loans is significant because it means that in the case of bankruptcies, loans are better positioned for a “recovery” of investors’ capital than bonds. The trade-off for this protection is that a company’s loan yields are typically lower than its bond yields.
3. Loans are not securities; they are private contracts between the borrower and lender. 2 Nonetheless, there is an active over-the-counter secondary trading market for bank loans.
Leveraged loans are private debt obligations issued by companies seeking financing.
1 In simple terms, LIBOR can be thought of as benchmark interest rates for inter-bank lending on a short-term basis.
2 Despite this distinction, both loans and bonds can include “covenants,” which are essentially terms to protect the lender from potentially harmful or risky behavior by the borrower that could compromise its ability to repay obligations.
Leveraged Loans: A Primer
ARTHUR J. GALLAGHER & CO. | MARCH 2017 ::INSTITUTIONAL INVESTMENT & FIDUCIARY SERVICES 3
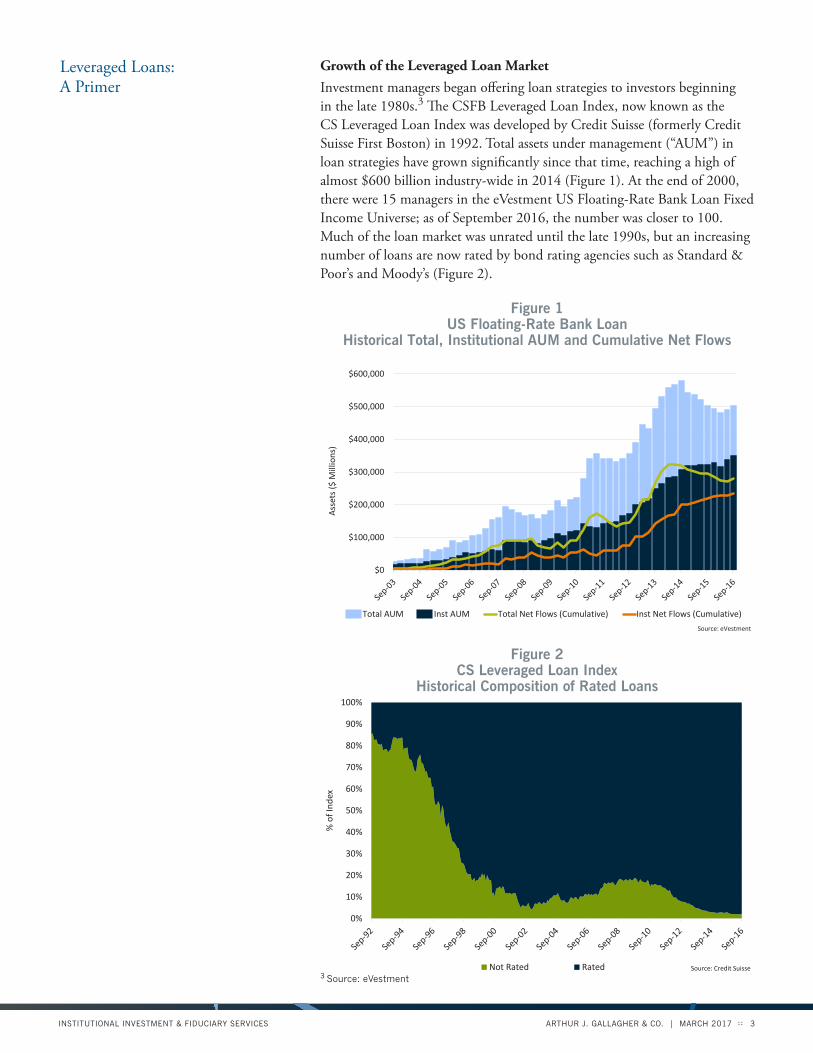
Growth of the Leveraged Loan MarketInvestment managers began offering loan strategies to investors beginning in the late 1980s.3 The CSFB Leveraged Loan Index, now known as the CS Leveraged Loan Index was developed by Credit Suisse (formerly Credit Suisse First Boston) in 1992. Total assets under management (“AUM”) in loan strategies have grown significantly since that time, reaching a high of almost $600 billion industry-wide in 2014 (Figure 1). At the end of 2000, there were 15 managers in the eVestment US Floating-Rate Bank Loan Fixed Income Universe; as of September 2016, the number was closer to 100. Much of the loan market was unrated until the late 1990s, but an increasing number of loans are now rated by bond rating agencies such as Standard & Poor’s and Moody’s (Figure 2).
Figure 1US Floating-Rate Bank Loan
Historical Total, Institutional AUM and Cumulative Net Flows
$0
$100,000
$200,000
$300,000
$400,000
$500,000
$600,000
Ass
ets
($ M
illio
ns)
US Floating-Rate Bank LoanHistorical Total, Institutional AUM & Cumulative Net Flows
Total AUM Inst AUM Total Net Flows (Cumulative) Inst Net Flows (Cumulative)
Source: eVestment
Figure 1
Figure 2CS Leveraged Loan Index
Historical Composition of Rated Loans
0%
10%
20%
30%
40%
50%
60%
70%
80%
90%
100%
% o
f Ind
ex
CS Leveraged Loan IndexHistorical Composition of Rated Loans
Not Rated Rated Source: Credit Suisse
Figure 2
3 Source: eVestment
Leveraged Loans: A Primer
ARTHUR J. GALLAGHER & CO. | MARCH 2017 ::INSTITUTIONAL INVESTMENT & FIDUCIARY SERVICES 4
Historical Performance Characteristics of Loans
The historical absolute returns, volatility and risk-adjusted returns of loans will be analyzed below and compared to other bond indexes.
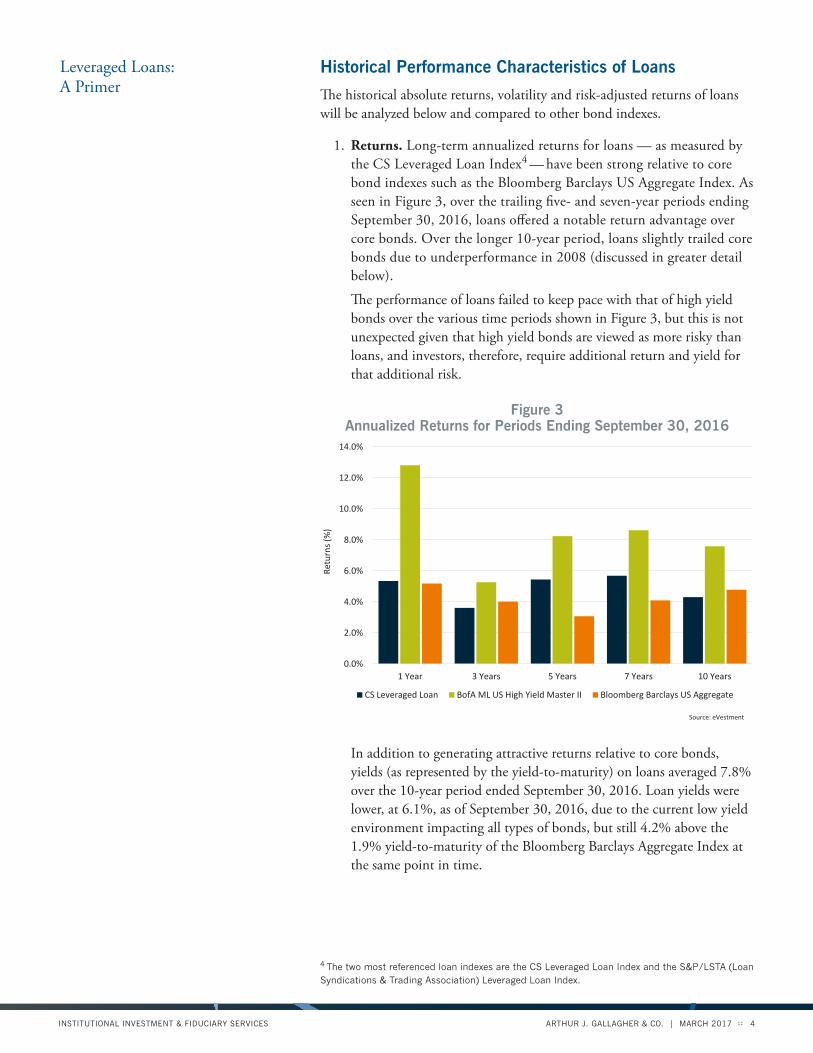
1. Returns. Long-term annualized returns for loans — as measured by the CS Leveraged Loan Index4 — have been strong relative to core bond indexes such as the Bloomberg Barclays US Aggregate Index. As seen in Figure 3, over the trailing five- and seven-year periods ending September 30, 2016, loans offered a notable return advantage over core bonds. Over the longer 10-year period, loans slightly trailed core bonds due to underperformance in 2008 (discussed in greater detail below).
The performance of loans failed to keep pace with that of high yield bonds over the various time periods shown in Figure 3, but this is not unexpected given that high yield bonds are viewed as more risky than loans, and investors, therefore, require additional return and yield for that additional risk.
In addition to generating attractive returns relative to core bonds, yields (as represented by the yield-to-maturity) on loans averaged 7.8% over the 10-year period ended September 30, 2016. Loan yields were lower, at 6.1%, as of September 30, 2016, due to the current low yield environment impacting all types of bonds, but still 4.2% above the 1.9% yield-to-maturity of the Bloomberg Barclays Aggregate Index at the same point in time.
4 The two most referenced loan indexes are the CS Leveraged Loan Index and the S&P/LSTA (Loan Syndications & Trading Association) Leveraged Loan Index.
0.0%
2.0%
4.0%
6.0%
8.0%
10.0%
12.0%
14.0%
1 Year 3 Years 5 Years 7 Years 10 Years
Retu
rns
(%)
Annualized Returns for Periods Ending September 30, 2016
CS Leveraged Loan BofA ML US High Yield Master II Bloomberg Barclays US Aggregate
Source: eVestment
Figure 3Figure 3
Annualized Returns for Periods Ending September 30, 2016
Leveraged Loans: A Primer
ARTHUR J. GALLAGHER & CO. | MARCH 2017 ::INSTITUTIONAL INVESTMENT & FIDUCIARY SERVICES 5
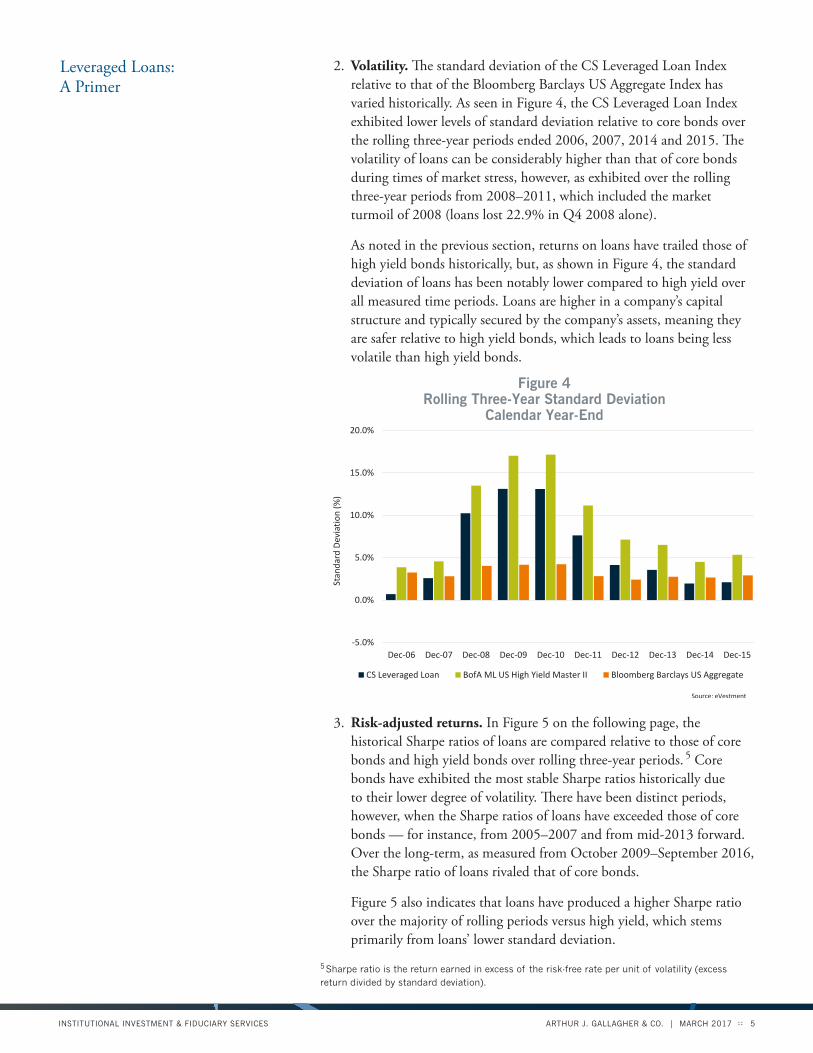
2. Volatility. The standard deviation of the CS Leveraged Loan Index relative to that of the Bloomberg Barclays US Aggregate Index has varied historically. As seen in Figure 4, the CS Leveraged Loan Index exhibited lower levels of standard deviation relative to core bonds over the rolling three-year periods ended 2006, 2007, 2014 and 2015. The volatility of loans can be considerably higher than that of core bonds during times of market stress, however, as exhibited over the rolling three-year periods from 2008–2011, which included the market turmoil of 2008 (loans lost 22.9% in Q4 2008 alone).
As noted in the previous section, returns on loans have trailed those of high yield bonds historically, but, as shown in Figure 4, the standard deviation of loans has been notably lower compared to high yield over all measured time periods. Loans are higher in a company’s capital structure and typically secured by the company’s assets, meaning they are safer relative to high yield bonds, which leads to loans being less volatile than high yield bonds.
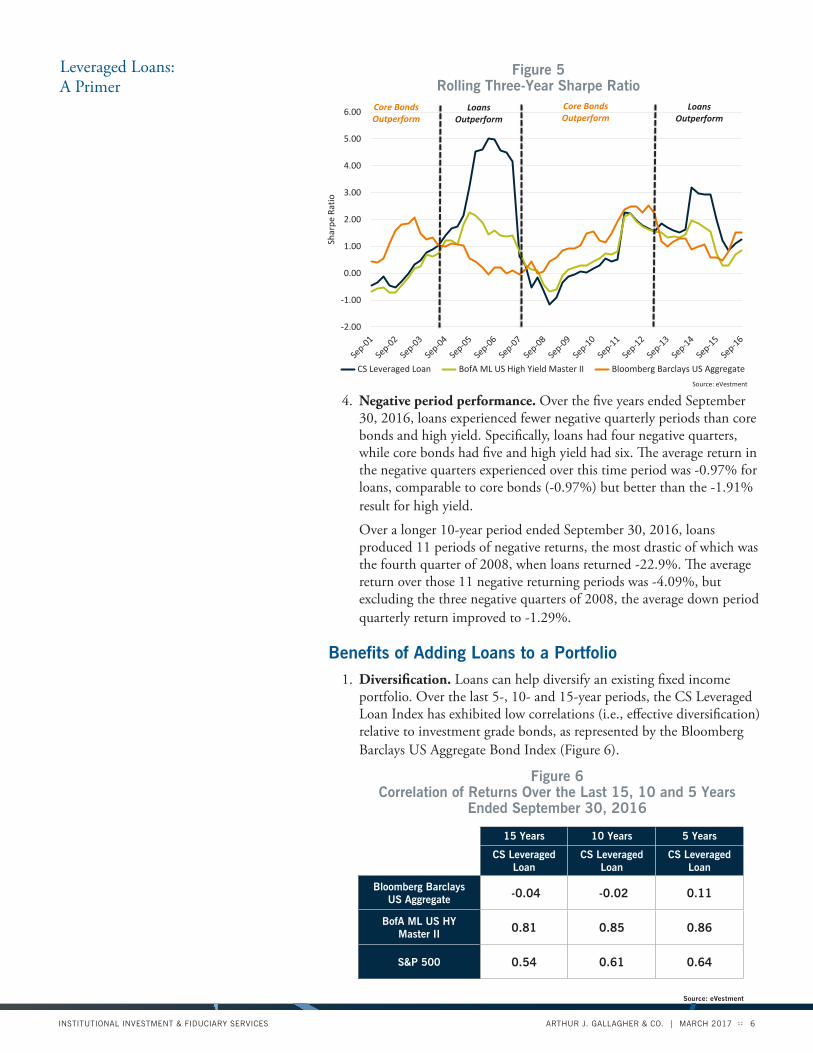
3. Risk-adjusted returns. In Figure 5 on the following page, the historical Sharpe ratios of loans are compared relative to those of core bonds and high yield bonds over rolling three-year periods. 5 Core bonds have exhibited the most stable Sharpe ratios historically due to their lower degree of volatility. There have been distinct periods, however, when the Sharpe ratios of loans have exceeded those of core bonds — for instance, from 2005–2007 and from mid-2013 forward. Over the long-term, as measured from October 2009–September 2016, the Sharpe ratio of loans rivaled that of core bonds.
Figure 5 also indicates that loans have produced a higher Sharpe ratio over the majority of rolling periods versus high yield, which stems primarily from loans’ lower standard deviation.
Figure 4Rolling Three-Year Standard Deviation
Calendar Year-End
-5.0%
0.0%
5.0%
10.0%
15.0%
20.0%
Dec-06 Dec-07 Dec-08 Dec-09 Dec-10 Dec-11 Dec-12 Dec-13 Dec-14 Dec-15
Stan
dard
Dev
iatio
n (%
)
Rolling Three-Year Standard DeviationCalendar Year-End
CS Leveraged Loan BofA ML US High Yield Master II Bloomberg Barclays US Aggregate
Source: eVestment
Figure 4
5 Sharpe ratio is the return earned in excess of the risk-free rate per unit of volatility (excess return divided by standard deviation).
Leveraged Loans: A Primer
ARTHUR J. GALLAGHER & CO. | MARCH 2017 ::INSTITUTIONAL INVESTMENT & FIDUCIARY SERVICES 6
4. Negative period performance. Over the five years ended September 30, 2016, loans experienced fewer negative quarterly periods than core bonds and high yield. Specifically, loans had four negative quarters, while core bonds had five and high yield had six. The average return in the negative quarters experienced over this time period was -0.97% for loans, comparable to core bonds (-0.97%) but better than the -1.91% result for high yield.
Over a longer 10-year period ended September 30, 2016, loans produced 11 periods of negative returns, the most drastic of which was the fourth quarter of 2008, when loans returned -22.9%. The average return over those 11 negative returning periods was -4.09%, but excluding the three negative quarters of 2008, the average down period quarterly return improved to -1.29%.
Benefits of Adding Loans to a Portfolio1. Diversification. Loans can help diversify an existing fixed income
portfolio. Over the last 5-, 10- and 15-year periods, the CS Leveraged Loan Index has exhibited low correlations (i.e., effective diversification) relative to investment grade bonds, as represented by the Bloomberg Barclays US Aggregate Bond Index (Figure 6).
Figure 5Rolling Three-Year Sharpe Ratio
-2.00
-1.00
0.00
1.00
2.00
3.00
4.00
5.00
6.00
Shar
pe R
atio
Rolling Three-Year Sharpe Ratio
CS Leveraged Loan BofA ML US High Yield Master II Bloomberg Barclays US Aggregate
Source: eVestment
Loans Outperform
Loans Outperform
Figure 5
Core Bonds Outperform
Core Bonds Outperform
15 Years 10 Years 5 Years
CS Leveraged Loan
CS Leveraged Loan
CS Leveraged Loan
Bloomberg Barclays US Aggregate -0.04 -0.02 0.11
BofA ML US HY Master II 0.81 0.85 0.86
S&P 500 0.54 0.61 0.64
Source: eVestment
Figure 6Correlation of Returns Over the Last 15, 10 and 5 Years
Ended September 30, 2016
Leveraged Loans: A Primer
ARTHUR J. GALLAGHER & CO. | MARCH 2017 ::INSTITUTIONAL INVESTMENT & FIDUCIARY SERVICES 7
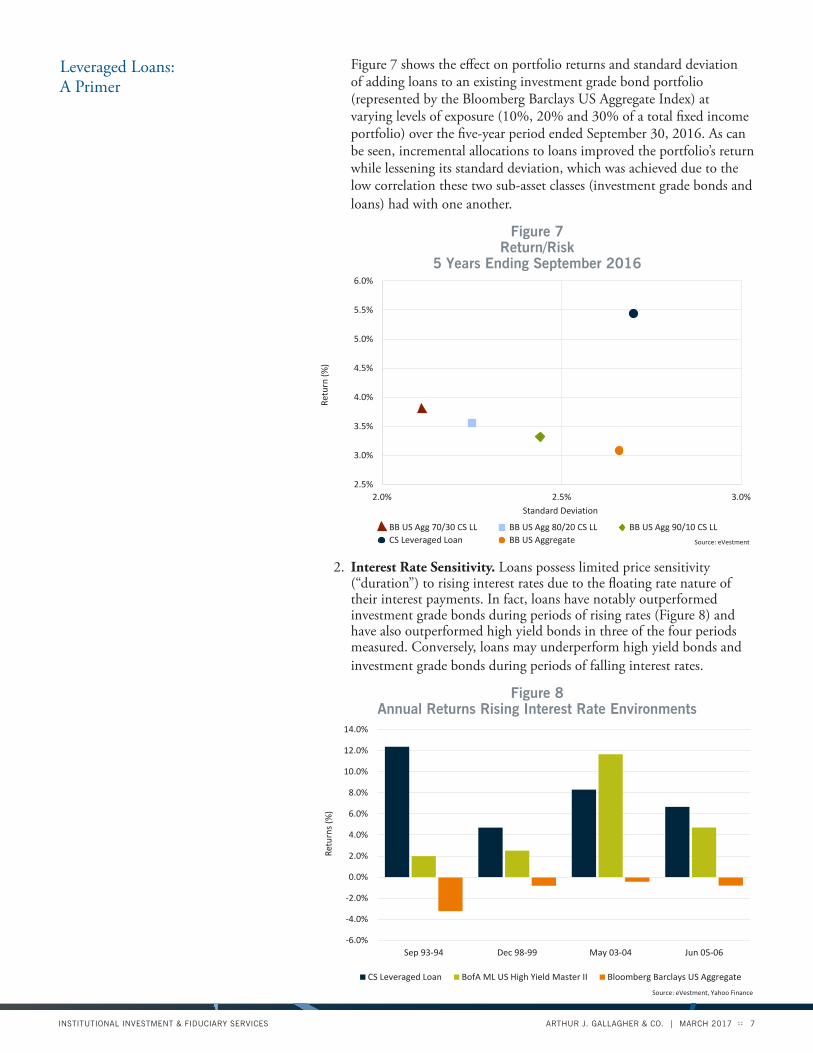
Figure 7 shows the effect on portfolio returns and standard deviation of adding loans to an existing investment grade bond portfolio (represented by the Bloomberg Barclays US Aggregate Index) at varying levels of exposure (10%, 20% and 30% of a total fixed income portfolio) over the five-year period ended September 30, 2016. As can be seen, incremental allocations to loans improved the portfolio’s return while lessening its standard deviation, which was achieved due to the low correlation these two sub-asset classes (investment grade bonds and loans) had with one another.
Figure 7Return/Risk
5 Years Ending September 2016
2. Interest Rate Sensitivity. Loans possess limited price sensitivity (“duration”) to rising interest rates due to the floating rate nature of their interest payments. In fact, loans have notably outperformed investment grade bonds during periods of rising rates (Figure 8) and have also outperformed high yield bonds in three of the four periods measured. Conversely, loans may underperform high yield bonds and investment grade bonds during periods of falling interest rates.
Figure 8Annual Returns Rising Interest Rate Environments
-6.0%
-4.0%
-2.0%
0.0%
2.0%
4.0%
6.0%
8.0%
10.0%
12.0%
14.0%
Sep 93-94 Dec 98-99 May 03-04 Jun 05-06
Retu
rns
(%)
Annual Returns Rising Interest Rate Environments
CS Leveraged Loan BofA ML US High Yield Master II Bloomberg Barclays US Aggregate
Source: eVestment, Yahoo Finance
Figure 8
2.5%
3.0%
3.5%
4.0%
4.5%
5.0%
5.5%
6.0%
2.0% 2.5% 3.0%
Retu
rn (%
)
Standard Deviation
Return / Risk 5 Years Ending September 2016
BB US Agg 70/30 CS LL BB US Agg 80/20 CS LL BB US Agg 90/10 CS LL CS Leveraged Loan BB US Aggregate Source: eVestment
Figure 7
Leveraged Loans: A Primer
ARTHUR J. GALLAGHER & CO. | MARCH 2017 ::INSTITUTIONAL INVESTMENT & FIDUCIARY SERVICES 8
Obtaining Exposure to Leveraged Loans
According to recent data from eVestment, less than 5% of US Core fixed income managers invest in loans, and for those that do, the average portfolio allocation is less than 5%. Among US Core Plus fixed income managers, approximately 25% invest in loans, with an average portfolio allocation of around 5%. Finally, approximately 30% of Global Unconstrained fixed income managers invest in loans, with an average portfolio allocation of 10%. Somewhat similar to Global Unconstrained managers, approximately 40% of US High Yield fixed income managers have exposure to loans with an average allocation of 12%. However, of the US High Yield managers who do have exposure to loans, approximately 45% have an allocation of less than 5%. The percentage of Core Plus and Global Unconstrained Fixed Income managers investing a portion of their portfolios in loans has risen over the years, but loans are still unlikely to be a material part of most fixed income portfolios.
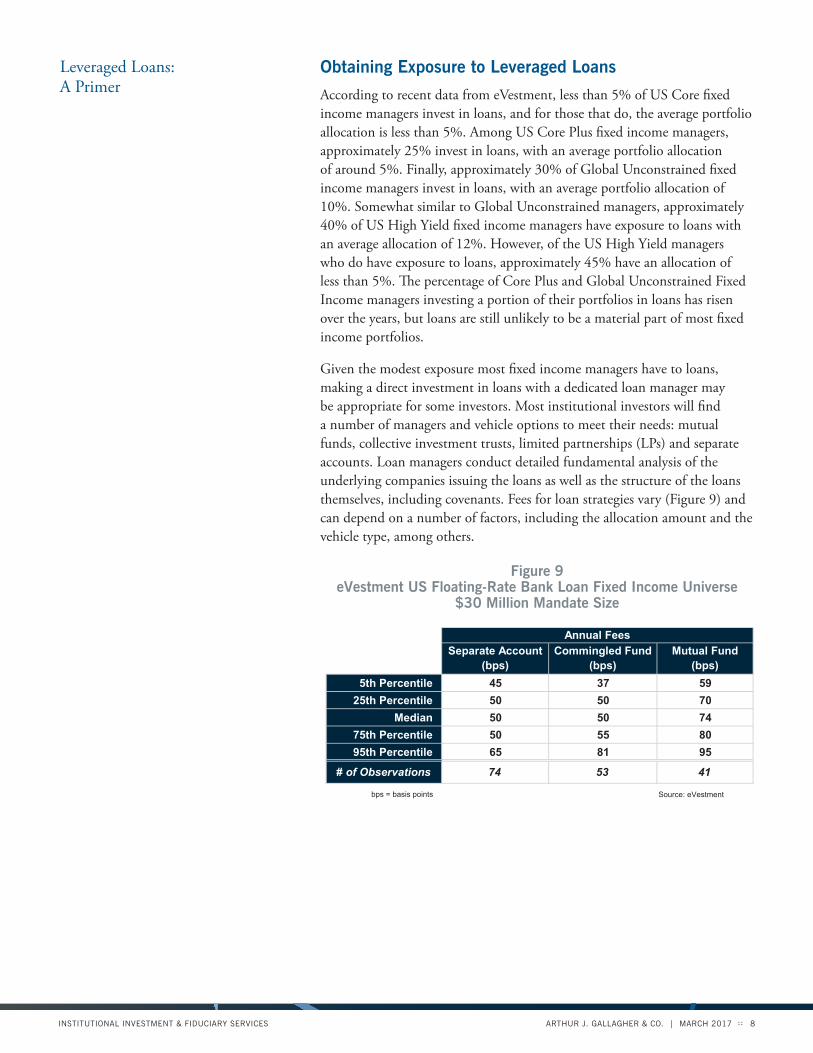
Given the modest exposure most fixed income managers have to loans, making a direct investment in loans with a dedicated loan manager may be appropriate for some investors. Most institutional investors will find a number of managers and vehicle options to meet their needs: mutual funds, collective investment trusts, limited partnerships (LPs) and separate accounts. Loan managers conduct detailed fundamental analysis of the underlying companies issuing the loans as well as the structure of the loans themselves, including covenants. Fees for loan strategies vary (Figure 9) and can depend on a number of factors, including the allocation amount and the vehicle type, among others.
Figure 9eVestment US Floating-Rate Bank Loan Fixed Income Universe
$30 Million Mandate Size
Separate Account Commingled Fund Mutual Fund(bps) (bps) (bps)
5th Percentile 45 37 5925th Percentile 50 50 70
Median 50 50 7475th Percentile 50 55 8095th Percentile 65 81 95
# of Observations 74 53 41
bps = basis points Source: eVestment
Annual Fees

Leveraged Loans: A Primer
ARTHUR J. GALLAGHER & CO. | MARCH 2017 ::INSTITUTIONAL INVESTMENT & FIDUCIARY SERVICES 9
Is Now a Good Time to Invest in Leveraged Loans?
Loans can be beneficial to an investor’s portfolio on a number of fronts, and some of these benefits may be particularly desirable in the current market environment. First, loans can offer attractive yields, which are welcomed in an interest rate environment where investors are starved for yield. Second, loans have exhibited lower volatility than high yield bonds and, on a risk-adjusted basis, have outperformed high yield bonds on a rolling three-year basis a majority of the time. Third, while loans possess credit risk due to their below investment grade ratings, they are higher in a company’s capital structure and considered safer than traditional high yield bonds. Fourth, loans’ low correlation with investment grade bonds over longer time periods makes them good diversifiers to an existing portfolio of investment grade bonds. Lastly, bank loans’ floating rate feature gives them a very low duration and can help offer protection in a rising rate environment.

Leveraged Loans: A Primer
ARTHUR J. GALLAGHER & CO. | MARCH 2017 ::INSTITUTIONAL INVESTMENT & FIDUCIARY SERVICES 10
About the Author
William N. Welsh is an Area Assistant Vice President with the Institutional Investment & Fiduciary Services practice of Arthur J. Gallagher & Co., Gallagher Fiduciary Advisors, LLC (“Gallagher”). He is responsible for working with clients on asset allocation, financial research and various other investment related projects. He serves as a member of the defined contribution task force and the Fixed Income research team.
The Institutional Investment & Fiduciary Services practice of Arthur J. Gallagher & Co. (Gallagher Fiduciary Advisors, LLC), focused on improving the investment program of your benefit plan and other investment pools. The practice is comprised of established, proven investment professionals who provide objective insights, analysis and oversight on asset allocation, investment managers, and investment risks, along with fiduciary responsibility for investment decisions as an independent fiduciary or outsourced CIO.
William N. Welsh, CIPM Area Assistant Vice President Institutional Investment & Fiduciary Services 202.312.5426 [email protected]
www.ajg.com
William N. Welsh, CIPM
17GBS31357A
Investment advisory, named and independent fiduciary services are offered through Gallagher Fiduciary Advisors, LLC, an SEC Registered Investment Adviser. This document contains proprietary information that belongs to Gallagher Fiduciary Advisors, LLC and is protected by copyright and other State and Federal laws. Gallagher Fiduciary Advisors, LLC is a single-member, limited-liability company, with Gallagher Benefit Services, Inc. as its single member. Neither Arthur J. Gallagher & Co., Gallagher Fiduciary Advisors, LLC nor their affiliates provide accounting, legal or tax advice.
© 2017 Gallagher Fiduciary Advisors, LLC