leukocyte image segmentation using novel saliency...
TRANSCRIPT
Research ArticleLeukocyte Image Segmentation Using Novel Saliency DetectionBased on Positive Feedback of Visual Perception
Chen Pan ,1 Wenlong Xu ,1 Dan Shen,2 and Yong Yang 3
1China Jiliang University, Hangzhou, Zhejiang 310018, China2Department of Hematology at the First Hospital Affiliated to Medical College, Zhejiang University, Hangzhou,Zhejiang 310003, China3School of Information Technology, Jiangxi University of Finance and Economics, Nanchang 330013, China
Correspondence should be addressed to Chen Pan; [email protected]
Received 24 February 2017; Revised 8 November 2017; Accepted 21 November 2017; Published 1 February 2018
Academic Editor: Maria Lindén
Copyright © 2018 Chen Pan et al. This is an open access article distributed under the Creative Commons AttributionLicense, which permits unrestricted use, distribution, and reproduction in any medium, provided the original work isproperly cited.
This paper presents a novel method for salient object detection in nature image by simulating microsaccades in fixationaleye movements. Due to a nucleated cell usually stained that is salient obviously, the proposed method is suitable tosegment nucleated cell. Firstly, the existing fixation prediction method is utilized to produce an initial fixation area.Followed EPELM (ensemble of polyharmonic extreme learning machine) is trained on-line by the pixels sampling fromthe fixation and nonfixation area. Then the model of EPELM could be used to classify image pixels to form new binaryfixation area. Depending upon the updated fixation area, the procedure of “pixel sampling-learning-classification” could beperformed iteratively. If the previous binary fixation area and the latter one were similar enough in iteration, it indicatesthat the perception is saturated and the loop should be terminated. The binary output in iteration could be regarded as akind of visual stimulation. So the multiple outputs of visual stimuli can be accumulated to form a new saliency map.Experiments on three image databases show the validity of our method. It can segment nucleated cells successfully indifferent imaging conditions.
1. Introduction
Microscopic leukocyte analysis is a powerful diagnostic toolfor many types of diseases for which it is vital to recognizeand count different lineages and maturity levels of leuko-cytes. Computer-aided automatic analysis not only savesmanpower and time but also reduces human error. The mostimportant step in automatic image analysis is segmentation.Human leukocytes (WBCs) are colorless. Blood and bonemarrow smears are conventionally prepared with Wright-Giemsa stain in order to visualize obviously and identifyWBCs. However, different smear preparation and imagingconditions may result in large biases and changes in imagecolor. It is difficult to segment entire leukocyte populationssince color distributions may be uncertain.
Nature image is typical unstructured data. Modeling suchdata via machine learning has been a hotspot for decades. Inrecent years, two classes’ learning-based algorithms, bottom-up and top-down, which composed with shallow and deepneural networks, respectively, are widely used to solve thesegmentation problem. In bottom-up framework, literatures[1, 2] had proposed data-driven methods to segment leuko-cyte image via “pixel sampling-learning-classification” proce-dure based on shallow network (SVM or ELM). However,those algorithms have some priori restrictions. For example,the algorithm assumes that the nuclei of WBCs are sur-rounded by cytoplasm and are always deeply stained so thatthe object intensity is low while the background intensity isbright. Moreover, preparing the training samples is very crit-ical in those methods. Because if the samples are not good
HindawiJournal of Healthcare EngineeringVolume 2018, Article ID 5098973, 11 pageshttps://doi.org/10.1155/2018/5098973
(or not pure) enough, the learning-based algorithm may out-put undesired object. It is a challenge to solve such noise-sample-sensitive problem in a learning-based framework.The state-of-the-art top-down model is developed from deeplearning, which has been successfully used for image segmen-tation [3]. Deep learning-based algorithm reflects the bestperformance in many applications so far, since that can dealwith object-level or image-level representative features fromtraining samples. However, deep networks often have hugeparameters than the shallow one, so that they need massivelabeled sample data to tune parameters repeatedly in train-ing. The most of the existing top-down learning-basedmethods are time-consuming in off-line training process orlabeling positive samples manually.
Due to nucleated cell usually stained with salient color,Zheng et al. [4] firstly locate nuclei by saliency detectionmethod and then extract the nucleated cell by maker-controlled watershed. However, saliency detection in Zheng’smethod was too simple and may be out of date. It is necessaryto find some new ways to update them.
In general, without prior knowledge and effective sam-ples, many segmentation methods may fail in practice. Inaddition, we note that the information is often feedforwardand lacks feedback process in most bottom-up or top-downmodels. It greatly differs from human vision. That may beone of the reasons the performance of machine vision is farfrom that of human vision.
Human accepts attention by making a series of eye move-ments. There are two forms of eye movement: saccades andmicrosaccades. (1) In saccade stage, human eyes aim to findcandidate object so it makes sharply shifts in the whole fieldof view. (2) While candidates are identified as target, the eyeswill make a series of dense tiny movements that is calledmicrosaccades around the target for the purpose of intensifyobjects and inhibit noises. Continuous microsaccades willlead to visual fading [5], and the eye movement will switchto the stage of saccades to find new objects. The integrationof saccades and microsaccades contributes to the quick andefficient performance of human vision system.
Motivated by the above reasons, this paper presents anovel saliency detection framework by simulating microsac-cades and visual fading, without prior knowledge and labeledsamples. We construct a positive feedback loop to focus onfixation area and intensify objects repeatedly. Ensemble ofpolyharmonic extreme learning machine (EPELM) [6, 7] isutilized to simulate the human neural system to producevisual stimulus. Depending on sampling from previous fixa-tion area (input), training EPELM model using the samples,and classifying image pixels by EPELM, new fixation areacan be output in iteration. If the input and output fixationarea were similar enough, it indicates that the perception issaturated and the iteration should be terminated. The finalfixation area is the segmentation result in our method. Exper-imental results show that new saliency method with positivefeedback loop can achieve better performance and cangreatly improve the performance of the existing saliencydetection methods.
In summary, the main contributions of our work are asfollows. (1) We propose a novel learning-based algorithm
to detect salient objects depending on bottom-up saliency.It is good to segment stained leukocyte without any priorknowledge and labeled samples. (2) A positive feedbackmodule based on EPELM is presented which focuses onfixation area for the purpose of intensifying objects, inhi-biting noises, and promoting saturation in perception.Positive feedback of perception may be indispensable insaliency detection.
In the rest of the paper, we introduce the works ofsaliency detection that are heavily related to our approachin Section 2. Then we describe our algorithm in Section 3and finally discuss the experimental result in Section 4.Section 5 is the conclusions.
2. Related Works
Visual attention is a remarkable capability of early primatevisual system, which helps human complete scene analysisin real-time with limited resources. Inspired by it, variouscomputational models, which are called saliency models,have been proposed according to the psychological and neu-robiological findings. Saliency model aims to identify themost salient foreground object from the background, andthis problem in its essence is a figure/ground segmentationproblem. In general, saliency detection can also be groupedinto two categories: top-down methods and bottom-upmethods. Bottom-up methods are rapid, data-driven, andtask-independent, which construct saliency maps based onlow-level visual information, such as pixel level or super pixellevel. Due to the absence of high-level knowledge, all bottom-upmethods rely on assumptions about the properties of objectsand backgrounds. The widely utilized assumptions could becontrast prior, boundary prior, center prior, background prior,and so on. In contrast, top-down approaches are slower,volition-controlled, and task-driven and require supervisedlearning based on training samples with manual labels.
The classic bottom-up computational model is Borjiet al.’s method [8], which gets saliency values of each pixelby center-surround contrast. Hou and Zhang [9] use theresidual Fourier amplitude spectrum to form saliency map.Both of the above two models aim to predict human fixationpoints; hence, saliency maps computed by these modelsare spatially discontinuous. While at the same time,models for the purpose of salient region detection havebeen proposed in [10], Goferman et al. proposed asaliency model based on context-aware, and Cheng et al.[11] presented global contrast-based saliency computationmethods, called histogram-based contrast (HC) and spatialinformation-enhanced region-based contrast (RC). Thesetypes of model can generate saliency maps with fine detailsand high resolution. Literature [8] indicates that models forsalient region detection shown actual advantage in contrastwith models for fixation prediction in terms of various com-puter vision applications.
Recently, many learning models are proposed forsaliency computation. Methods based on supervised learn-ing have emerged [12], and these approaches use large fineannotation images to train saliency model, which is a typ-ically knowledge-driven approach. At the same time, there
2 Journal of Healthcare Engineering
are some unsupervised learning approaches [13]. All of theabove methods either rely on large manual-labeled datasetand off-line training or lie on numbers of parameters setfor modeling.
In the bottom-up framework, [14–16] presented someeffective ways to to train a set of weak classifiers based on initialsaliencymaps and then obtained a strongmodel by integratingthe weak classifiers or their results. In their approaches, multi-ple types of classifiers, multiscale analysis, and graph cut algo-rithm could be taken together, such as Na et al. [14] presentedBL algorithm which detect objects via bootstrap learning ofSVMs. Huang et al. [15] presented MIL algorithm dependingon object proposals and multiple instance learning usingSVMs. And in [16], Zhang et al. presented salient object detec-tion based on ELM. Those methods are very attractive to ussince the learning-based approach is similar to human brain,and their results are very close to human perception. However,we noticed that those methods are almost no reference tohuman visual mechanism. They implement function fromcomputing rather than simulating human vision. It is time-consuming because of multiscale analysis and multimodel par-allel computing that may lose the speed of bottom-up model.In addition, the information is also feedforward and lacks feed-back process in those methods. There may be large room toimprove them.
3. Method
Our method consists of four main components:
(i) Generating a gaze area
(ii) Forming a preliminary object using coarse saliencymap by learning
(iii) Suppressing the background
(iv) Intensifying object to form a sense of saturation bylearning-based positive feedback
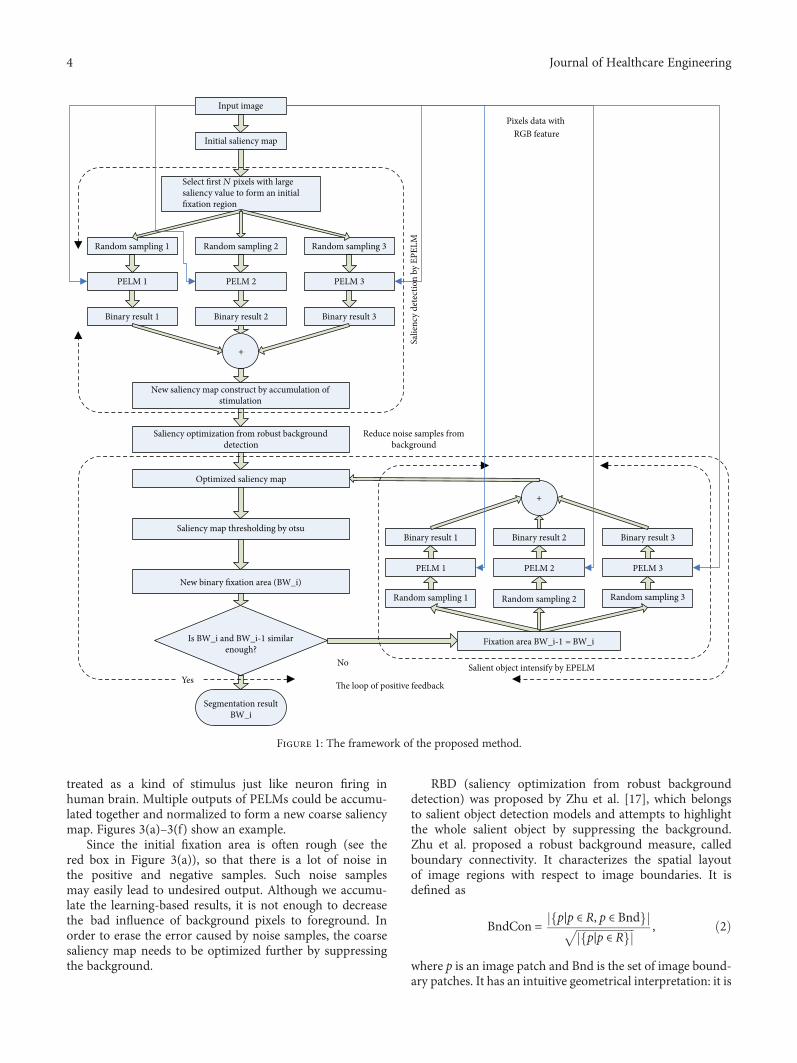
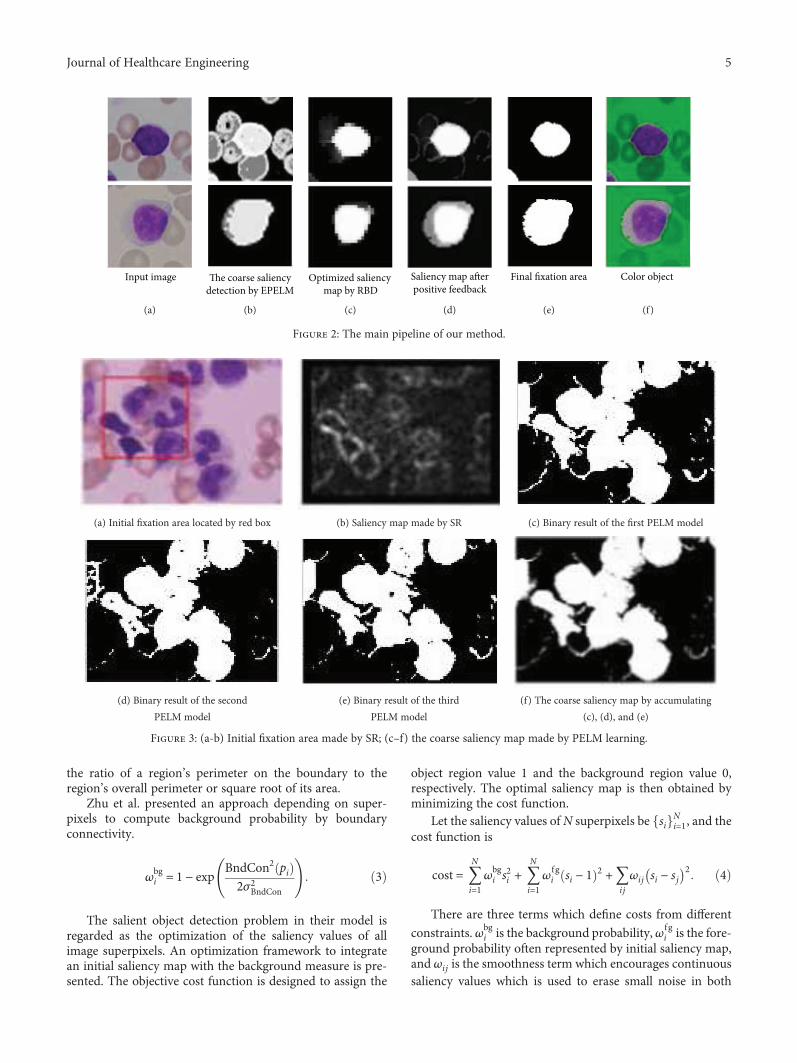
The framework of our method is illustrated in Figure 1.The key steps are listed as follows. See Figure 2, the main
pipeline of our method.
Step 1. An initial saliency map is made from input imageby SR algorithm.
Step 2. Use coarse saliency detection by EPELM learning:
(1) Sort pixels according to the saliency, and selectthe first n pixels with large value (n=100 inour experiment).
(2) The selected pixels form a minimum rectanglebox containing them. Inside the box is the fixa-tion area, so the outside is the nonfixation area.
(3) Random sample m pixels with high gradientare from the fixation area (positive samples).And random sample equal pixels are from thenonfixation area (negative samples) (m=500 inour experiment).
(4) Use training EPELM using the positive and nega-tive pixels with RGB features.
(5) Classify image pixels by EPELM. Each binaryoutput of PELM is regarded as single stimulation,could be normalized, and is added to form acoarse saliency map.
Step 3. RBD algorithm is used to reduce the noise in thecoarse saliency map, by background detectionand saliency optimization.
Step 4. Intensify objects using positive feedback loop:
(1) Threshold the optimized saliency map to makenew binary fixation area (BW_i).
(2) If BW_i-1 has been existed, then judge whetherBW_i is similar enough to BW_i-1. If true, go tostep 5 (break the loop); else, do the next step.
(3) Use Saliency detection by EPELM learning (sameas step 2). Each binary output of PELM could benormalized and added to the saliency map.
(4) Return to step 1 in the current step.
Step 5. The final segmentation result is BW_i (end).
3.1. The Function of SR and RBD Algorithms. SR (spectrumresidual) method was presented by Hou and Zhang [9],which aims to predict human fixations and often producesblob-like and sparse saliency map corresponding to thehuman fixation spots on scenes. Let I x be the image, x bethe pixel position, F be the Fourier transformation; then
A f = F I x ,P f = φ F I x ,L f = log A f ,R f = L f − hn f ∗L f ,SR x = F−1 exp R f + jP f
2,
1
where A f is the amplitude spectrum of image, P f is thephase spectrum of image, L f is the log of amplitude spec-trum, R f represents residual Fourier amplitude spectrum,SR x is the saliency map, φ is the operation to extractphase, and hn f is an average operator.
The salient points detected by SR often have strong corre-lationwith eye gaze spots. Besides, SR is very similar to humanperception since saliency map may change when the scale ofthe image changes. And it is one of the fastest fixation predic-tion algorithms [8]. So we select it to simulate human fixation.
In our method, we firstly provide an initial fixation areausing SR, then sampling from there, and learning byEPELM. Multiple random sampling may be equivalent tothe micro scan in the fixation region. Because the trainingsamples are few (m = 500 in this paper), the EPELM classi-fier can be trained in real-time. After that, those models areused to classify image pixels into classes of object or back-ground. The binary output of every PELM model could be
3Journal of Healthcare Engineering
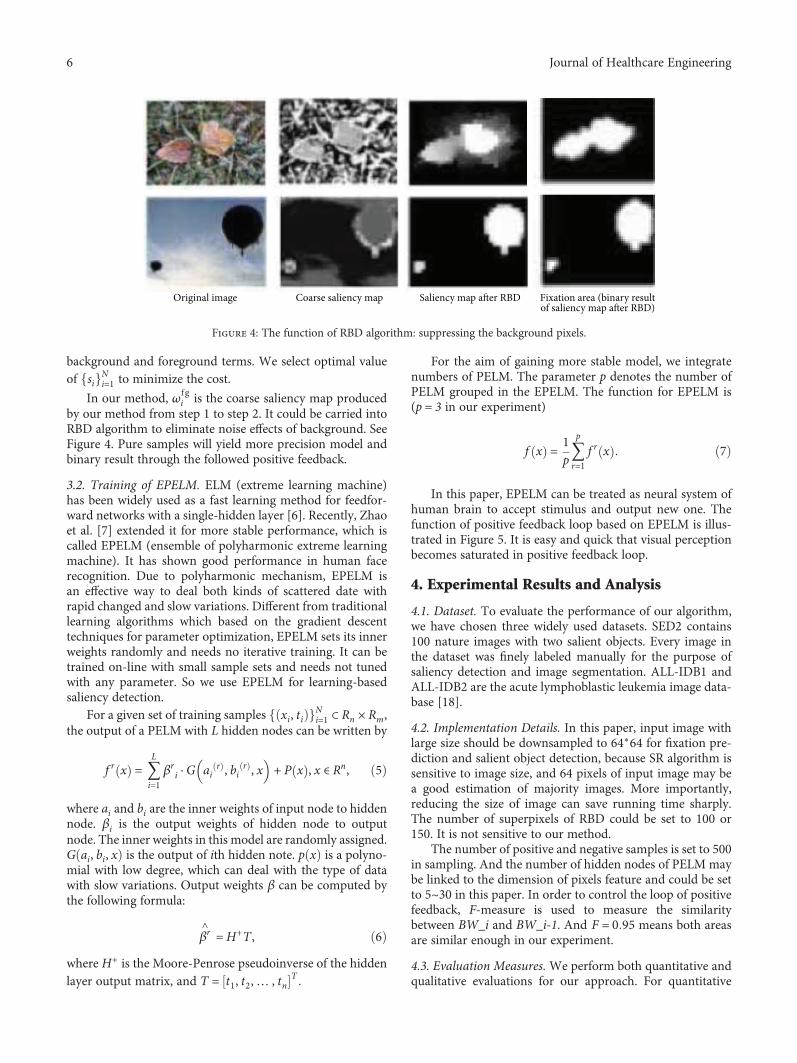
treated as a kind of stimulus just like neuron firing inhuman brain. Multiple outputs of PELMs could be accumu-lated together and normalized to form a new coarse saliencymap. Figures 3(a)–3(f) show an example.
Since the initial fixation area is often rough (see thered box in Figure 3(a)), so that there is a lot of noise inthe positive and negative samples. Such noise samplesmay easily lead to undesired output. Although we accumu-late the learning-based results, it is not enough to decreasethe bad influence of background pixels to foreground. Inorder to erase the error caused by noise samples, the coarsesaliency map needs to be optimized further by suppressingthe background.
RBD (saliency optimization from robust backgrounddetection) was proposed by Zhu et al. [17], which belongsto salient object detection models and attempts to highlightthe whole salient object by suppressing the background.Zhu et al. proposed a robust background measure, calledboundary connectivity. It characterizes the spatial layoutof image regions with respect to image boundaries. It isdefined as
BndCon = p∣p ∈ R, p ∈ Bndp∣p ∈ R
, 2
where p is an image patch and Bnd is the set of image bound-ary patches. It has an intuitive geometrical interpretation: it is
Input image
Initial saliency map
Select first N pixels with largesaliency value to form an initialfixation region
Random sampling 1
PELM 1
Binary result 1
Saliency map thresholding by otsu
Optimized saliency map
New binary fixation area (BW_i)
Is BW_i and BW_i-1 similarenough?
Random sampling 2 Random sampling 3
PELM 2
Binary result 2 Binary result 3
+
Saliency optimization from robust backgrounddetection
Random sampling 1
PELM 1
Binary result 1
Random sampling 2 Random sampling 3
PELM 2 PELM 3
Binary result 2 Binary result 3
+
Fixation area BW_i-1 = BW_i
Segmentation resultBW_i
Salie
ncy
dete
ctio
n by
EPE
LM
Salient object intensify by EPELM
�e loop of positive feedbackYes
No
PELM 3
Pixels data withRGB feature
Reduce noise samples frombackground
New saliency map construct by accumulation ofstimulation
Figure 1: The framework of the proposed method.
4 Journal of Healthcare Engineering
the ratio of a region’s perimeter on the boundary to theregion’s overall perimeter or square root of its area.
Zhu et al. presented an approach depending on super-pixels to compute background probability by boundaryconnectivity.
ωbgi = 1 − exp BndCon2 pi
2σ2BndCon3
The salient object detection problem in their model isregarded as the optimization of the saliency values of allimage superpixels. An optimization framework to integratean initial saliency map with the background measure is pre-sented. The objective cost function is designed to assign the
object region value 1 and the background region value 0,respectively. The optimal saliency map is then obtained byminimizing the cost function.
Let the saliency values of N superpixels be siNi=1, and the
cost function is
cost = 〠N
i=1ωbgi s2i + 〠
N
i=1ωfgi si − 1 2 +〠
ij
ωij si − sj2 4
There are three terms which define costs from different
constraints. ωbgi is the background probability, ωfg
i is the fore-ground probability often represented by initial saliency map,and ωij is the smoothness term which encourages continuoussaliency values which is used to erase small noise in both
Input image
(a)
The coarse saliencydetection by EPELM
(b)
Optimized saliency map by RBD
(c)
Saliency map afterpositive feedback
(d)
Final fixation area
(e)
Color object
(f)
Figure 2: The main pipeline of our method.
(a) Initial fixation area located by red box (b) Saliency map made by SR (c) Binary result of the first PELM model
(d) Binary result of the second
PELM model
(e) Binary result of the third
PELM model
(f) The coarse saliency map by accumulating
(c), (d), and (e)
Figure 3: (a-b) Initial fixation area made by SR; (c–f) the coarse saliency map made by PELM learning.
5Journal of Healthcare Engineering
background and foreground terms. We select optimal valueof si
Ni=1 to minimize the cost.
In our method, ωfgi is the coarse saliency map produced
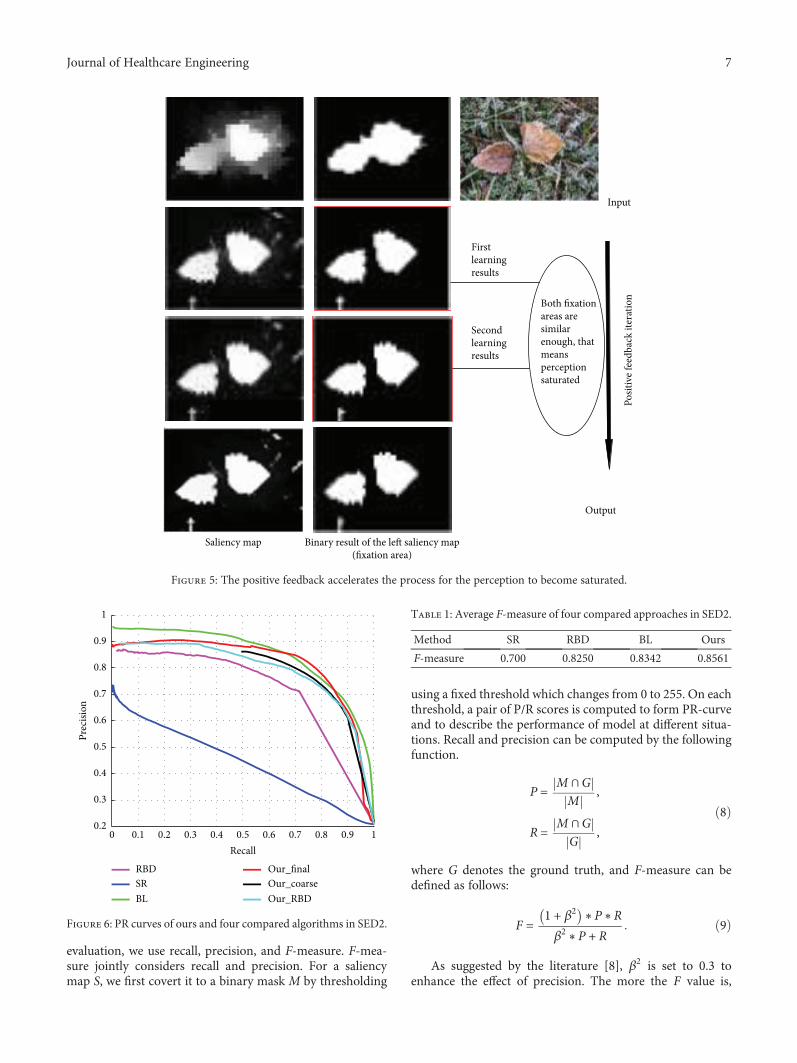
by our method from step 1 to step 2. It could be carried intoRBD algorithm to eliminate noise effects of background. SeeFigure 4. Pure samples will yield more precision model andbinary result through the followed positive feedback.
3.2. Training of EPELM. ELM (extreme learning machine)has been widely used as a fast learning method for feedfor-ward networks with a single-hidden layer [6]. Recently, Zhaoet al. [7] extended it for more stable performance, which iscalled EPELM (ensemble of polyharmonic extreme learningmachine). It has shown good performance in human facerecognition. Due to polyharmonic mechanism, EPELM isan effective way to deal both kinds of scattered date withrapid changed and slow variations. Different from traditionallearning algorithms which based on the gradient descenttechniques for parameter optimization, EPELM sets its innerweights randomly and needs no iterative training. It can betrained on-line with small sample sets and needs not tunedwith any parameter. So we use EPELM for learning-basedsaliency detection.
For a given set of training samples xi, ti Ni=1 ⊂ Rn × Rm,
the output of a PELM with L hidden nodes can be written by
f r x = 〠L
i=1βr
i ⋅G air , bi r , x + P x , x ∈ Rn, 5
where ai and bi are the inner weights of input node to hiddennode. βi is the output weights of hidden node to outputnode. The inner weights in this model are randomly assigned.G ai, bi, x is the output of ith hidden note. p x is a polyno-mial with low degree, which can deal with the type of datawith slow variations. Output weights β can be computed bythe following formula:
βr∧
=H+T , 6
where H+ is the Moore-Penrose pseudoinverse of the hiddenlayer output matrix, and T = t1, t2,… , tn T
For the aim of gaining more stable model, we integratenumbers of PELM. The parameter p denotes the number ofPELM grouped in the EPELM. The function for EPELM is(p = 3 in our experiment)
f x = 1p〠p
r=1f r x 7
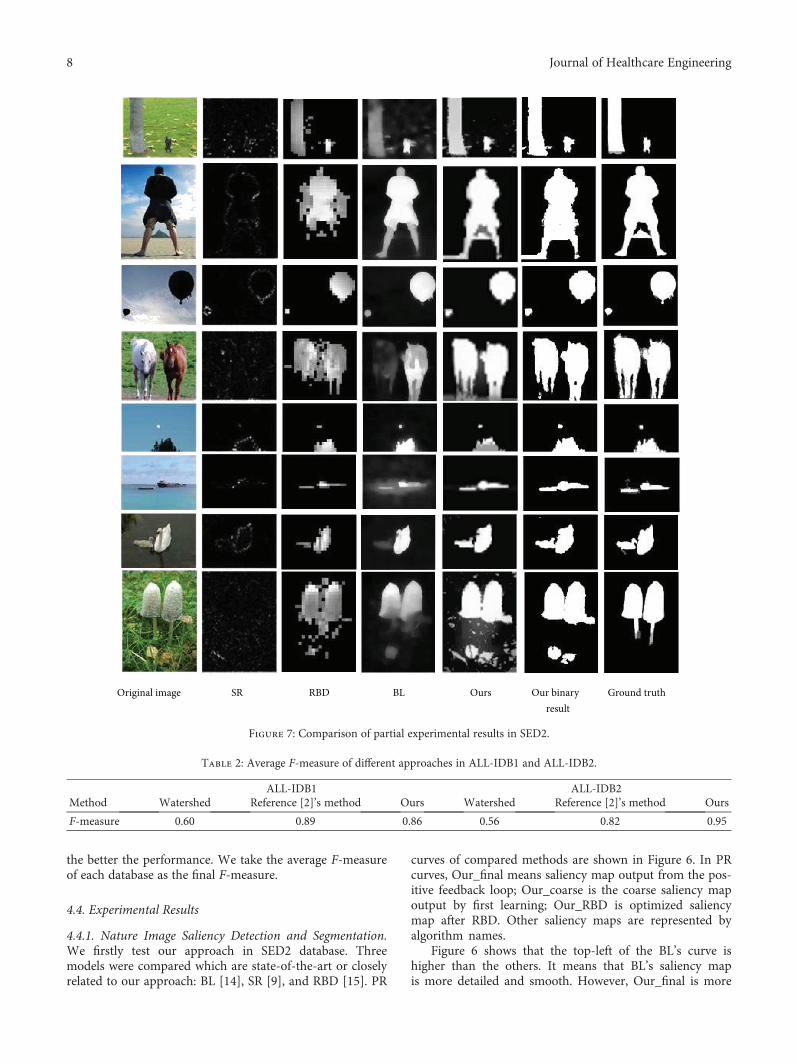
In this paper, EPELM can be treated as neural system ofhuman brain to accept stimulus and output new one. Thefunction of positive feedback loop based on EPELM is illus-trated in Figure 5. It is easy and quick that visual perceptionbecomes saturated in positive feedback loop.
4. Experimental Results and Analysis
4.1. Dataset. To evaluate the performance of our algorithm,we have chosen three widely used datasets. SED2 contains100 nature images with two salient objects. Every image inthe dataset was finely labeled manually for the purpose ofsaliency detection and image segmentation. ALL-IDB1 andALL-IDB2 are the acute lymphoblastic leukemia image data-base [18].
4.2. Implementation Details. In this paper, input image withlarge size should be downsampled to 64∗64 for fixation pre-diction and salient object detection, because SR algorithm issensitive to image size, and 64 pixels of input image may bea good estimation of majority images. More importantly,reducing the size of image can save running time sharply.The number of superpixels of RBD could be set to 100 or150. It is not sensitive to our method.
The number of positive and negative samples is set to 500in sampling. And the number of hidden nodes of PELM maybe linked to the dimension of pixels feature and could be setto 5~30 in this paper. In order to control the loop of positivefeedback, F-measure is used to measure the similaritybetween BW_i and BW_i-1. And F = 0 95 means both areasare similar enough in our experiment.
4.3. Evaluation Measures.We perform both quantitative andqualitative evaluations for our approach. For quantitative
Original image Coarse saliency map Saliency map a�er RBD Fixation area (binary resultof saliency map a�er RBD)
Figure 4: The function of RBD algorithm: suppressing the background pixels.
6 Journal of Healthcare Engineering
evaluation, we use recall, precision, and F-measure. F-mea-sure jointly considers recall and precision. For a saliencymap S, we first covert it to a binary mask M by thresholding
using a fixed threshold which changes from 0 to 255. On eachthreshold, a pair of P/R scores is computed to form PR-curveand to describe the performance of model at different situa-tions. Recall and precision can be computed by the followingfunction.
P = M ∩GM
,
R = M ∩GG
,8
where G denotes the ground truth, and F-measure can bedefined as follows:
F = 1 + β2 ∗P∗Rβ2 ∗P + R
9
As suggested by the literature [8], β2 is set to 0.3 toenhance the effect of precision. The more the F value is,
Input
Output
Posit
ive f
eedb
ack
itera
tion
Firstlearningresults
Secondlearningresults
Saliency map
Both fixationareas aresimilarenough, thatmeansperceptionsaturated
Binary result of the left saliency map(fixation area)
Figure 5: The positive feedback accelerates the process for the perception to become saturated.
RBDSRBL
Our_final
Our_RBD
0.1 0.2 0.3 0.4 0.5 0.6 0.7 0.8 0.9 1Recall
00.2
0.3
0.4
0.5
0.6
0.7
0.8
0.9
1
Prec
ision
Our_coarse
Figure 6: PR curves of ours and four compared algorithms in SED2.
Table 1: Average F-measure of four compared approaches in SED2.
Method SR RBD BL Ours
F-measure 0.700 0.8250 0.8342 0.8561
7Journal of Healthcare Engineering
the better the performance. We take the average F-measureof each database as the final F-measure.
4.4. Experimental Results
4.4.1. Nature Image Saliency Detection and Segmentation.We firstly test our approach in SED2 database. Threemodels were compared which are state-of-the-art or closelyrelated to our approach: BL [14], SR [9], and RBD [15]. PR
curves of compared methods are shown in Figure 6. In PRcurves, Our_final means saliency map output from the pos-itive feedback loop; Our_coarse is the coarse saliency mapoutput by first learning; Our_RBD is optimized saliencymap after RBD. Other saliency maps are represented byalgorithm names.
Figure 6 shows that the top-left of the BL’s curve ishigher than the others. It means that BL’s saliency mapis more detailed and smooth. However, Our_final is more
Original image SR RBD BL Ours Our binaryresult
Ground truth
Figure 7: Comparison of partial experimental results in SED2.
Table 2: Average F-measure of different approaches in ALL-IDB1 and ALL-IDB2.
ALL-IDB1 ALL-IDB2Method Watershed Reference [2]’s method Ours Watershed Reference [2]’s method Ours
F-measure 0.60 0.89 0.86 0.56 0.82 0.95
8 Journal of Healthcare Engineering
than BL in the middle of the PR curve that illustrates theability of our method to grasp the whole object is betterthan BL. Besides, Our_coarse and Our_RBD are higherthan the original RBD and SR. Although the curves ofOur_coarse and Our_RBD are little lower than those ofthe BL, Our_final achieves good result after the positivefeedback. Obviously, positive feedback has played a deci-sive role in improving performance.
Table 1 shows average F-measures for the 4 methods.Those results show that our method has the best perfor-mance, followed by BL and RBD, and SR is worst. It is alsoshown that the performance of SR and RBD can be improvedeffectively by adding learning-based positive feedback.
Figure 7 shows part of the images in the SED2 and theirsaliency maps obtained by the 4 methods. These results showthat the BL saliency map is better in smoothness and detail,and our method is better in overall perception. It should benoted that SR, RBD, and our methods reduce the size oforiginal image in saliency detection and their saliency mapsare rougher than BL’s one. From the view of qualitative
evaluation, it is clear that the binary object mask detectedby our method is closer to the ground truth.
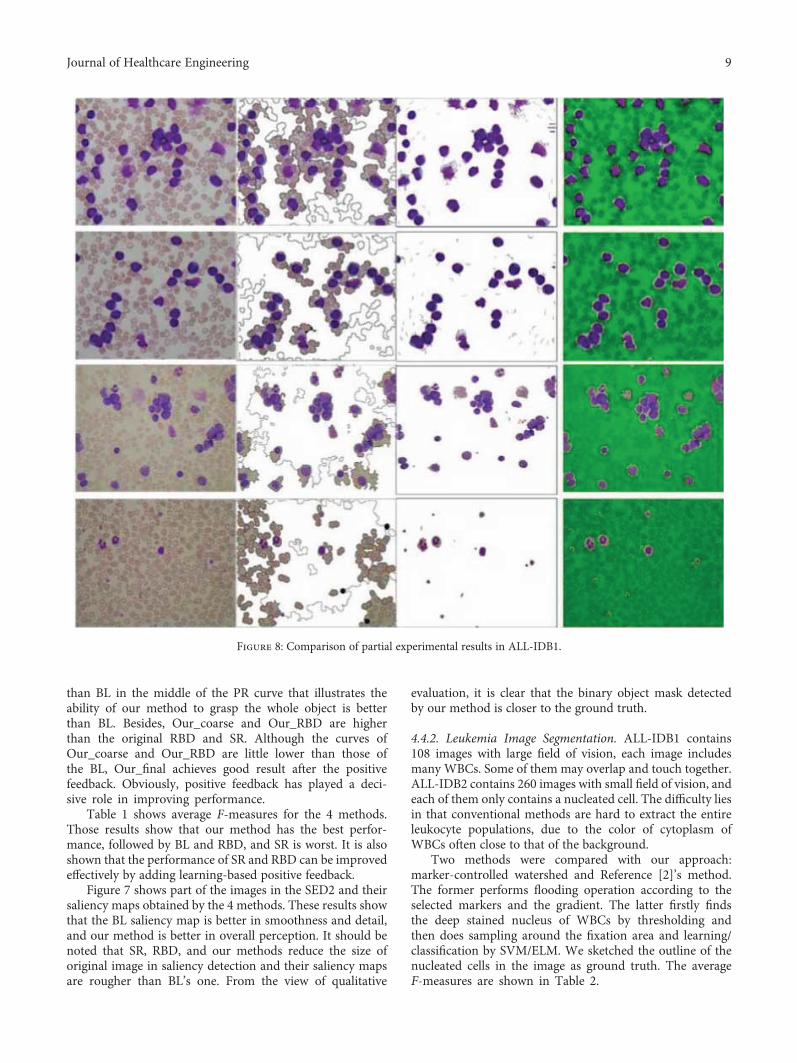
4.4.2. Leukemia Image Segmentation. ALL-IDB1 contains108 images with large field of vision, each image includesmany WBCs. Some of them may overlap and touch together.ALL-IDB2 contains 260 images with small field of vision, andeach of them only contains a nucleated cell. The difficulty liesin that conventional methods are hard to extract the entireleukocyte populations, due to the color of cytoplasm ofWBCs often close to that of the background.
Two methods were compared with our approach:marker-controlled watershed and Reference [2]’s method.The former performs flooding operation according to theselected markers and the gradient. The latter firstly findsthe deep stained nucleus of WBCs by thresholding andthen does sampling around the fixation area and learning/classification by SVM/ELM. We sketched the outline of thenucleated cells in the image as ground truth. The averageF-measures are shown in Table 2.
Figure 8: Comparison of partial experimental results in ALL-IDB1.
9Journal of Healthcare Engineering
Our method gets the highest score in ALL-IDB2, whileslightly worse than Reference [2]’s method in ALL-IDB1.Watershed-based method is worst in both datasets.
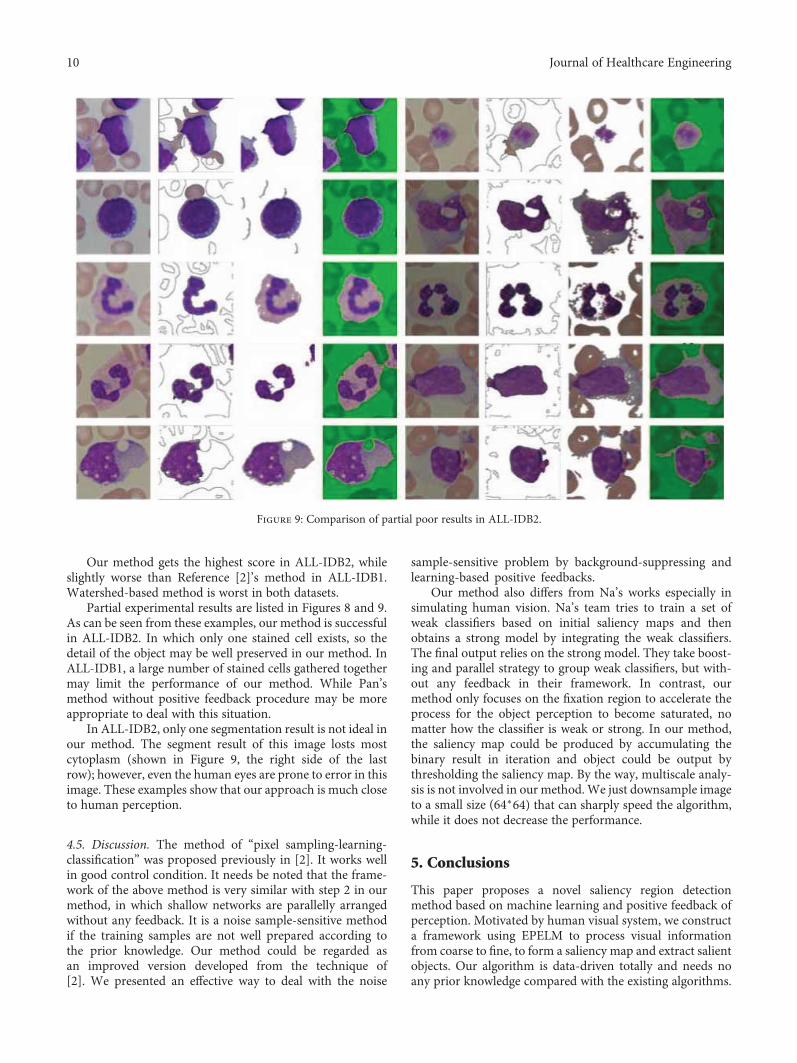
Partial experimental results are listed in Figures 8 and 9.As can be seen from these examples, our method is successfulin ALL-IDB2. In which only one stained cell exists, so thedetail of the object may be well preserved in our method. InALL-IDB1, a large number of stained cells gathered togethermay limit the performance of our method. While Pan’smethod without positive feedback procedure may be moreappropriate to deal with this situation.
In ALL-IDB2, only one segmentation result is not ideal inour method. The segment result of this image losts mostcytoplasm (shown in Figure 9, the right side of the lastrow); however, even the human eyes are prone to error in thisimage. These examples show that our approach is much closeto human perception.
4.5. Discussion. The method of “pixel sampling-learning-classification” was proposed previously in [2]. It works wellin good control condition. It needs be noted that the frame-work of the above method is very similar with step 2 in ourmethod, in which shallow networks are parallelly arrangedwithout any feedback. It is a noise sample-sensitive methodif the training samples are not well prepared according tothe prior knowledge. Our method could be regarded asan improved version developed from the technique of[2]. We presented an effective way to deal with the noise
sample-sensitive problem by background-suppressing andlearning-based positive feedbacks.
Our method also differs from Na’s works especially insimulating human vision. Na’s team tries to train a set ofweak classifiers based on initial saliency maps and thenobtains a strong model by integrating the weak classifiers.The final output relies on the strong model. They take boost-ing and parallel strategy to group weak classifiers, but with-out any feedback in their framework. In contrast, ourmethod only focuses on the fixation region to accelerate theprocess for the object perception to become saturated, nomatter how the classifier is weak or strong. In our method,the saliency map could be produced by accumulating thebinary result in iteration and object could be output bythresholding the saliency map. By the way, multiscale analy-sis is not involved in our method.We just downsample imageto a small size (64∗64) that can sharply speed the algorithm,while it does not decrease the performance.
5. Conclusions
This paper proposes a novel saliency region detectionmethod based on machine learning and positive feedback ofperception. Motivated by human visual system, we constructa framework using EPELM to process visual informationfrom coarse to fine, to form a saliency map and extract salientobjects. Our algorithm is data-driven totally and needs noany prior knowledge compared with the existing algorithms.
Figure 9: Comparison of partial poor results in ALL-IDB2.
10 Journal of Healthcare Engineering
Experiments on several standard image databases show thatour method not only improves the performance of the con-ventional saliency detection algorithms but also segmentsnucleated cells successfully in different imaging conditions.
Conflicts of Interest
The authors declare that there is no conflict of interestregarding the publication of this paper.
Acknowledgments
This research was supported by the Natural Science Founda-tion of Zhejiang Province of China (no. LY13F010004) andthe National Natural Science Foundation of China (nos.61672476 and 61462031).
References
[1] Z. Yu, H. S. Wong, and G. Wen, “A modified support vectormachine and its application to image segmentation,” Imageand Vision Computing, vol. 29, no. 1, pp. 29–40, 2011.
[2] C. Pan, D. S. Park, Y. Yang, and H. M. Yoo, “Leukocyte imagesegmentation by visual attention and extreme learningmachine,” Neural Computing and Applications, vol. 21, no. 6,pp. 1217–1227, 2012.
[3] J. Long, E. Shelhamer, and T. Darrell, “Fully convolutionalnetworks for semantic segmentation,” in 2015 IEEE Conferenceon Computer Vision and Pattern Recognition (CVPR),pp. 3431–3440, Boston, MA, USA, June 2015.
[4] X. Zheng, Y.Wang, G. Wang, and Z. Chen, “A novel algorithmbased on visual saliency attention for localization and segmen-tation in rapidly-stained leukocyte images,” Micron, vol. 56,pp. 17–28, 2014.
[5] R. Matrin, “Microsaccades: small steps on a long way,” VisionResearch, vol. 49, no. 20, pp. 2415–2441, 2009.
[6] G.-B. Huang, D. H. Wang, and Y. Lan, “Extreme learningmachines: a survey,” International Journal of MachineLearning and Cybernetics, vol. 2, no. 2, pp. 107–122, 2011.
[7] J. W. Zhao, Z. H. Zhou, and F. L. Cao, “Human face recogni-tion based on ensemble of polyharmonic extreme learningmachine,” Neural Computing and Applications, vol. 24, no. 6,pp. 1317–1326, 2014.
[8] A. Borji, M. M. Cheng, H. Z. Jiang, and J. Li, “Salient objectdetection: a benchmark,” IEEE Transactions on ImageProcessing, vol. 24, no. 12, pp. 5706–5722, 2015.
[9] X. D. Hou and L. Q. Zhang, “Saliency detection:a spectralresidual approach,” in IEEE Conference on Computer Visionand Pattern Recognition, pp. 1–8, Minneapolis, MN, USA,June 2007.
[10] S. Goferman, L. Z. Manor, and A. Tal, “Context-aware saliencydetection,” IEEE Transactions on Pattern Analysis andMachine Intelligence, vol. 34, no. 10, pp. 1915–1926, 2012.
[11] M. M. Cheng, N. J. Mitra, X. Huang, P. H. Torr, and S. M. Hu,“Global contrast based salient region detection,” IEEE Trans-actions on Pattern Analysis and Machine Intelligence, vol. 37,no. 3, pp. 569–582, 2015.
[12] J. Shi, Q. Yan, L. Xu, and J. Jia, “Hierarchical image saliencydetection on extended CSSD,” IEEE Transactions on PatternAnalysis and Machine Intelligence, vol. 38, no. 4, pp. 717–729, 2016.
[13] P. Siva, C. Russell, T. Xiang, and L. Agapito, “Looking beyondthe image: unsupervised learning for object saliency anddetection,” in 2013 IEEE Conference on Computer Vision andPattern Recognition (CVPR), pp. 3238–3245, Portland, OR,USA, June 2013.
[14] T. Na, L. U. Huchuan, R. Xiang, and M.-H. Yang, “Salientobject detection via bootstrap learning,” in 2015 IEEEConference on Computer Vision and Pattern Recognition(CVPR), pp. 1884–1892, Boston, MA, USA, June 2015.
[15] F. Huang, J. Qi, H. Lu, L. Zhang, and X. Ruan, “Salient objectdetection via multiple instance learning,” IEEE Transactionson Image Processing, vol. 26, no. 4, pp. 1911–1922, 2017.
[16] L. Zhang, J. Li, and H. Lu, “Saliency detection via extremelearning machine,” Neurocomputing, vol. 218, no. 8, pp. 103–112, 2016.
[17] W. Zhu, S. Liang, Y. Wei, and J. Sun, “Saliency optimizationfrom robust background detection,” in 2014 IEEE Conferenceon Computer Vision and Pattern Recognition (CVPR),pp. 2814–2821, Columbus, OH, USA, June 2014.
[18] R. D. Labati, V. Piuri, and F. Scotti, “ALL-IDB: the acutelymphoblastic leukemia image database for image processing,”in Proc. of the 2011 IEEE Int. Conf. on Image Processing (ICIP2011), pp. 2045–2048, Brussels, Belgium, September 2011.
11Journal of Healthcare Engineering

International Journal of
AerospaceEngineeringHindawiwww.hindawi.com Volume 2018
RoboticsJournal of
Hindawiwww.hindawi.com Volume 2018
Hindawiwww.hindawi.com Volume 2018
Active and Passive Electronic Components
VLSI Design
Hindawiwww.hindawi.com Volume 2018
Hindawiwww.hindawi.com Volume 2018
Shock and Vibration
Hindawiwww.hindawi.com Volume 2018
Civil EngineeringAdvances in
Acoustics and VibrationAdvances in
Hindawiwww.hindawi.com Volume 2018
Hindawiwww.hindawi.com Volume 2018
Electrical and Computer Engineering
Journal of
Advances inOptoElectronics
Hindawiwww.hindawi.com
Volume 2018
Hindawi Publishing Corporation http://www.hindawi.com Volume 2013Hindawiwww.hindawi.com
The Scientific World Journal
Volume 2018
Control Scienceand Engineering
Journal of
Hindawiwww.hindawi.com Volume 2018
Hindawiwww.hindawi.com
Journal ofEngineeringVolume 2018
SensorsJournal of
Hindawiwww.hindawi.com Volume 2018
International Journal of
RotatingMachinery
Hindawiwww.hindawi.com Volume 2018
Modelling &Simulationin EngineeringHindawiwww.hindawi.com Volume 2018
Hindawiwww.hindawi.com Volume 2018
Chemical EngineeringInternational Journal of Antennas and
Propagation
International Journal of
Hindawiwww.hindawi.com Volume 2018
Hindawiwww.hindawi.com Volume 2018
Navigation and Observation
International Journal of
Hindawi
www.hindawi.com Volume 2018
Advances in
Multimedia
Submit your manuscripts atwww.hindawi.com