lettuce: an economic assessment of the feasibility of ... · lettuce: an economic assessment of the...
TRANSCRIPT
Lettuce: An Economic Assessment of the Feasibility of Providing Multiple-Peril Crop Insurance
Prepared by the Economic Research Service, USDAin cooperation with the University of California
for the Federal Crop Insurance Corporation
June 1, 1994
Contributors: Diane Bertelson (202) 219-0883 Robert Dismukes (202) 219-0840 Joy Harwood (202) 219-0840 Fred Hoff (202) 219-0883 Hyunok Lee (916) 752-3508 Agapi Somwaru (202) 219-0812 Glenn Zepp, coordinator (202) 219-0883
Table of Contents
Executive Summary . . . . . . . . . . . . . . . . . . . . . . . . . . . . 3
Introduction . . . . . . . . . . . . . . . . . . . . . . . . . . . . . . 5
The Lettuce Market . . . . . . . . . . . . . . . . . . . . . . . . . . . 7Supply . . . . . . . . . . . . . . . . . . . . . . . . . . . . . . 7Demand . . . . . . . . . . . . . . . . . . . . . . . . . . . . . . 10
Industry Characteristics . . . . . . . . . . . . . . . . . . . . . . . . 13Lettuce Farms . . . . . . . . . . . . . . . . . . . . . . . . . . . 13Income Diversification on Lettuce Farms . . . . . . . . . . . . . . 15
Cultivation and Management Practices . . . . . . . . . . . . . . . . . . 18Climate . . . . . . . . . . . . . . . . . . . . . . . . . . . . . . 18Soils . . . . . . . . . . . . . . . . . . . . . . . . . . . . . . . 18Cultural Practices . . . . . . . . . . . . . . . . . . . . . . . . 19
Harvesting and Packing . . . . . . . . . . . . . . . . . . . . . . . . . 21
Marketing . . . . . . . . . . . . . . . . . . . . . . . . . . . . . . . . 23
Costs and Returns . . . . . . . . . . . . . . . . . . . . . . . . . . . . 23
Production Perils . . . . . . . . . . . . . . . . . . . . . . . . . . . . 25Diseases . . . . . . . . . . . . . . . . . . . . . . . . . . . . . 25Insects . . . . . . . . . . . . . . . . . . . . . . . . . . . . . . 26
State Analyses . . . . . . . . . . . . . . . . . . . . . . . . . . . . . 27California . . . . . . . . . . . . . . . . . . . . . . . . . . . . 27Arizona . . . . . . . . . . . . . . . . . . . . . . . . . . . . . . 35Florida . . . . . . . . . . . . . . . . . . . . . . . . . . . . . . 36Colorado . . . . . . . . . . . . . . . . . . . . . . . . . . . . . 39New Jersey . . . . . . . . . . . . . . . . . . . . . . . . . . . . 39New Mexico . . . . . . . . . . . . . . . . . . . . . . . . . . . . 40New York . . . . . . . . . . . . . . . . . . . . . . . . . . . . . 41Ohio . . . . . . . . . . . . . . . . . . . . . . . . . . . . . . . 41
Ad Hoc Disaster Assistance for Lettuce . . . . . . . . . . . . . . . . . 42
Lettuce Insurance Implementation Issues . . . . . . . . . . . . . . . . . 45Multiple Harvests in the Growing Season . . . . . . . . . . . . . . 45Setting Reference Prices . . . . . . . . . . . . . . . . . . . . . 45Actual Production History . . . . . . . . . . . . . . . . . . . . . 47Estimating "Appraised Production" . . . . . . . . . . . . . . . . . 47Insuring Price Risks . . . . . . . . . . . . . . . . . . . . . . . 48Moral Hazard . . . . . . . . . . . . . . . . . . . . . . . . . . . 48Micro-Climates and Adverse Selection . . . . . . . . . . . . . . . 48Individual Yield Data . . . . . . . . . . . . . . . . . . . . . . . 49
References . . . . . . . . . . . . . . . . . . . . . . . . . . . . . . . 50
3
Executive Summary
U.S. farms produced $1.5 billion worth of lettuce in 1993. Three types oflettuce dominate commercial production: head or iceberg, 74 percent of thevalue of output, leaf lettuce, 17 percent, and romaine, 9 percent. Lettuce isproduced and shipped year round in the U.S. with the source of supplieschanging with the seasons. U.S. lettuce production and utilization hasleveled off since 1987 after growing rapidly in the 1970s and early '80s. Only a small share of U.S. output is exported, mainly to Canada, and verylittle lettuce is imported.
Although lettuce is produced in many states, California and Arizona dominateU.S. production. California, which produces lettuce year round, accounted for76 percent of U.S. production in 1993. The major lettuce area in Californiais the Salinas Valley, where lettuce is harvested from early April throughearly November. In winter, most California production shifts southward toImperial County. Arizona is the leading lettuce state during winter,accounting for about 19 percent of U.S. annual production in 1993.
About 2,200 U.S. farms grow lettuce, according to the 1987 Census ofAgriculture. Most lettuce farms are large, and many grow other vegetables inaddition to lettuce. More than half of the farms producing lettuce in the topsix states (California, Arizona, Colorado, Florida, New Mexico, and NewJersey) had more than $100,000 in crop sales in 1987; about half of the farmsin California and more than 60 percent in Arizona had crop sales above$500,000. Lettuce farms are much smaller in the remaining top ten states. About 30 percent of the farms in Michigan, 40-45 percent in New York andTexas, and 50 percent in Washington sold less than $25,000 in crops in 1987. Lettuce is a cool season crop that grows best when day temperatures arebetween 70-75 degrees with nights at 45 degrees. Ideal conditions--cooltemperatures, low humidity, and adequate water for irrigation--are present indifferent parts of California at different times of the year and in Arizona inthe winter. The time from emergence to harvest of lettuce ranges from 55 to70 days under normal day length and temperature conditions. Fall-seededlettuce, however, may take upwards of 140 days to mature because of slowergrowth during the cool months.
Almost all lettuce acreage in the U.S. is irrigated. Major natural perilsduring the summer are excessive rain, excessive heat, and hail; in winter themajor perils are freeze damage, excessive moisture, and excessive wind. Poorweather not only can directly damage a crop but can weaken the plants, makingthem more susceptible to damage from diseases and pests. The major diseasesof lettuce in the U.S. are big vein, lettuce mosaic, downy mildew, andtipburn. Lettuce can be attacked by several insects, including cabbagelooper, beet armyworm, tobacco budworm, aphids, fleabeetles, sweetpotatowhitefly, and thrips. The whitefly has been a particularly serious problem inthe desert areas of California and Arizona in recent years.
Most lettuce is harvested by hand labor. Mechanical harvesting is rarebecause of the lack of uniformity in maturity within a field. Labor for
4
harvesting is usually supplied by a labor contractor who charges on a piecerates basis; thus harvesting costs vary directly with yield. Harvestingtypically accounts for more than half of production costs.
Historical ad-hoc disaster payments for lettuce provide an indication of high-loss areas and may indicate areas that would face relatively high risk under aFCIC lettuce policy. Disaster assistance payments for lettuce totalled morethan $8.2 million during 1988-93, peaking at $2.5 million in 1988, andexceeding $1 million in each of the years 1989, 1991, and 1993. Payments forlettuce were spread over a geographically broad area. Payments were made in38 states in at least one of the 6 years. Five states--Michigan, New Jersey,New York, Ohio, and Texas--collected payments in all years.
A crop insurance program for lettuce is complicated by lettuce's extendedgrowing season during which yields, risks, and market prices can vary greatly. In some areas, lettuce growers schedule planting over several months in orderto ensure a prolonged harvest. An insurable event that causes severe lossesto a crop may not result in indemnity payments if output over the rest of thegrowing season raises the season-average yield above the yield guarantee. InFlorida, for example, it is not uncommon for a freeze or excessive rain todestroy nearly all of the lettuce that would have been harvested during partof the season while reducing the season-average yield by only 10-20 percent.
Lettuce prices are volatile, and low prices may be lettuce growers' greatestperil. A steady demand for lettuce combined with lettuce's perishabilitymeans that small changes in production result in large changes in prices. Arevenue insurance scheme, covering low yields, low prices or a combination ofboth, would likely provide lettuce growers with much stronger risk protectionand could at the same time avoid indemnity payments to growers who, despitelow yields, had a good return because of high market prices.
5
Introduction
Lettuce, along with celery, escarole, and a variety of miscellaneous greenvegetables such as chicory and parsley, are called the salad crops. There arefour major types of lettuce: (1) crisphead, (2) butterhead, (3) cos orromaine, and (4) leaf or bunching. There is minor production of a fifth typecalled stem lettuce.
Most of the commercial lettuce produced in the United States is the crispheadtype. Crisphead lettuce is characterized by firm heads and the brittletexture of its leaves. Because of its firm heads, crisphead lettuce sustainsless damage from the rigors of harvest, long-distance shipment, and finalmarketing than the other types. The lettuce referred to in commercial tradeas "iceberg" or "head lettuce" is crisphead lettuce.
The butterhead type, smaller and more delicate than crisphead, ischaracterized by soft pliable leaves, which barely overlap to form a head. Butterhead lettuce must be handled with greater care than crisphead to preventtearing and crushing of the leaves. "Boston" and "Bibb" are butterheadlettuces.
The cos or romaine-type is characterized by the upright growth of the plant,the long loaf-shaped head, and the long and relatively narrow spatulateleaves. The most common cos varieties are self-closing--the leaves curlinward at the tips, forming compact heads, and the inner leaves becomeblanched. Loose-closing cos lettuce does not form closed heads and the leavesappear coarse, but they are tender and sweeter than other varieties.
Looseleaf or bunching lettuce forms clusters of leaves rather than heads. Looseleaf lettuce also requires delicate handling to prevent mechanical damageand leaf deterioration during long-distance transportation. The major looseleaf varieties are Black-seeded Simpson, Prize Head, Grand Rapids, and SaladBowl.
The edible part of stem lettuce is the enlarged seedstalk, which may be peeledand eaten raw or cooked. "Celtuce" is the only stem lettuce cultivar grown inthe United States.
The farm value of U.S. lettuce production was $1.5 billion in 1993, $1.1billion of which was head lettuce (USDA). Romaine production was valued at$135 million and leaf lettuce was valued at $250 million.
California ships lettuce year round and is the largest supplier (Figure 1). The farm value of California's production in 1993 was $1.1 billion, with headlettuce accounting for 73 percent of this amount.
Arizona is the second largest producer, with supplies available October-April. The farm value of Arizona's lettuce was $260 million, 74 percent of which washead lettuce varieties. Florida is third in production importance, selling$26 million in 1993.
6
Overall lettuce supplies are fairly constant throughout the year. There isusually a slight peak in romaine production from April to August, whilesupplies become somewhat less available between January and March.
This report examines considerations that pertain to the feasibility ofdeveloping a successful lettuce insurance policy. It first examines thesupply, demand, and price situation for lettuce, and then discusses industrycharacteristics. Cultivation and management practices are addressed, as arenatural perils, loss prevention methods, harvesting, and marketing. This isfollowed by a section containing state-specific analyses of factors pertainingto the offering of crop insurance for lettuce. The final sections examinehistorical disaster payments for lettuce and insurance implementation issues.
The Lettuce Market
Supply
Although head lettuce production increased substantially during the 1970's andearly 1980's, it has been relatively flat since 1987. Total lettuceproduction has risen slightly, however, because of an increase in romaine andleaf lettuce output, which nearly doubled between 1988 and 1993. Most lettuceis produced for the U.S. domestic market.
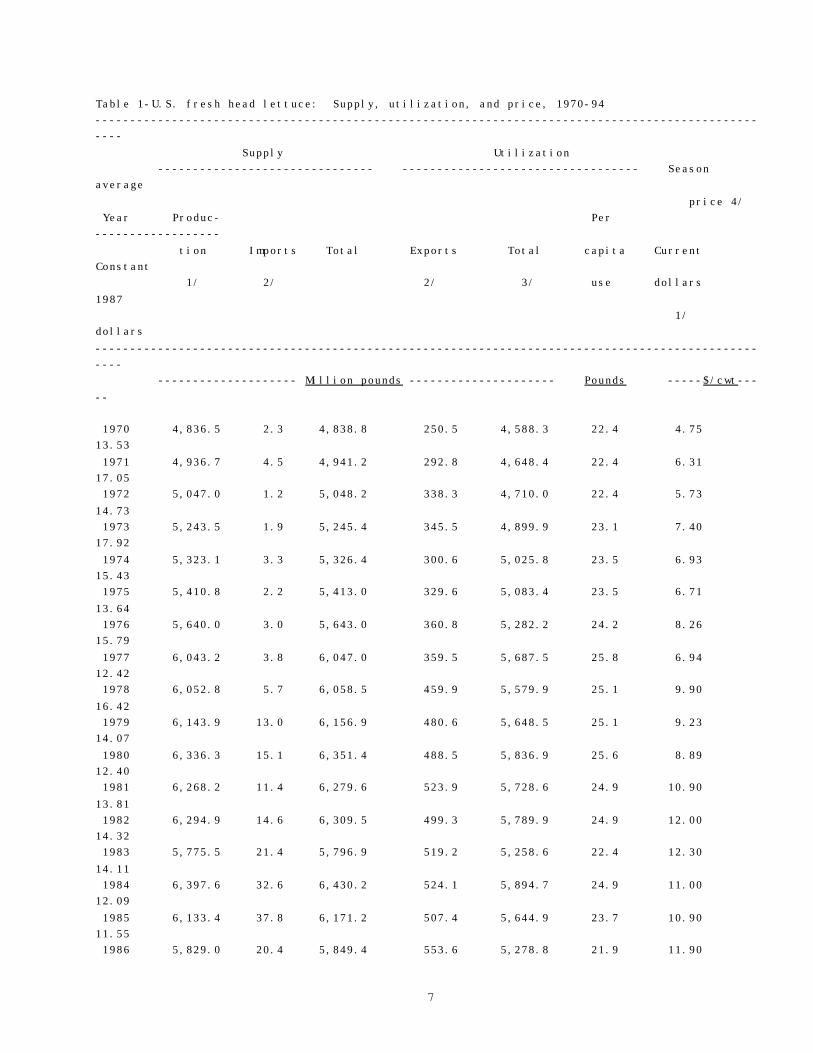
U.S. head lettuce production increased from 4.8 billion pounds in 1970 to 6.8billion in 1987 (Table 1). Annual production exceeded 7 billion poundsbetween 1988-92, dropped slightly to 6.8 billion in 1993, and is projected toreach 7 billion pounds in 1994. About 7 percent of U.S. production isexported, mostly to Canada. The United States imports a small amount oflettuce from Mexico and Canada, but imports account for a minuscule share oftotal supplies.
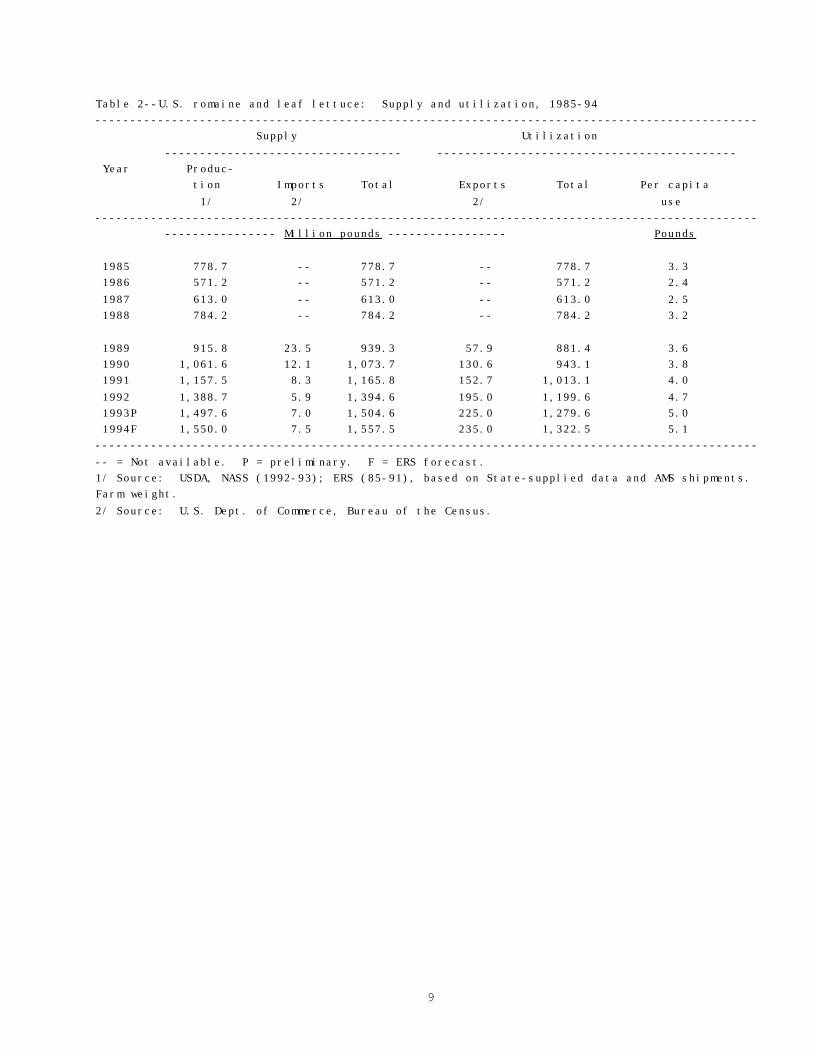
Romaine and leaf lettuce output rose sharply from 780 million pounds in 1985to 1,498 million in 1993 (Table 2). Most of the growth occurred in Californiaand Arizona. About 15 percent of romaine and leaf lettuce production wasexported in 1993. As with head lettuce, romaine and leaf lettuce importsaccount for a very small share of domestic supplies.
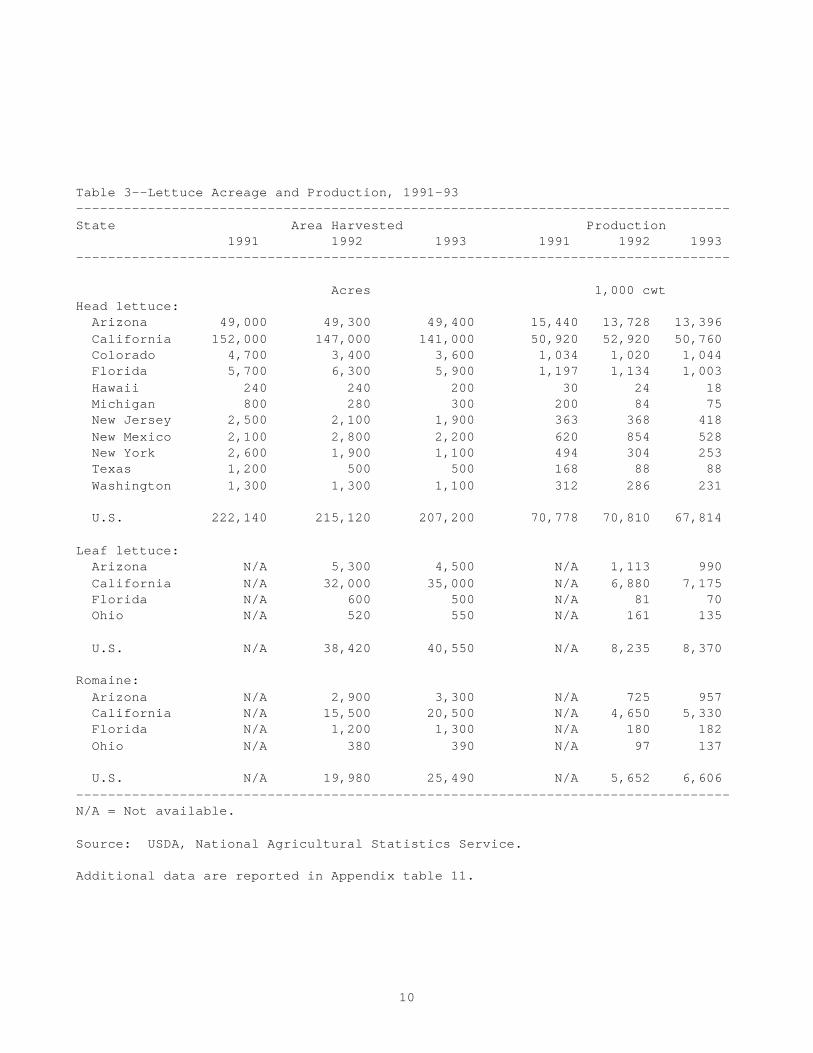
California is by far the major head lettuce-producing state (Table 3). Intotal, the National Agricultural Statistics Service (NASS) collects data for11 head lettuce-producing states. Four states are reported by NASS asproducing leaf and romaine lettuce.
All lettuce is sold for fresh use. Most is sold as whole heads, but aportion, perhaps as much as 15 percent in 1992, is marketed as freshprocessed--chopped or shredded and packaged, ready for use in salads andsandwiches. Fresh processed lettuce is sold mostly to foodservice chains andwholesalers. Increasingly, processors are preparing pre-cut salad mixes inretail-size packages. The fresh processing use is the fastest growing segmentof the lettuce market.
7
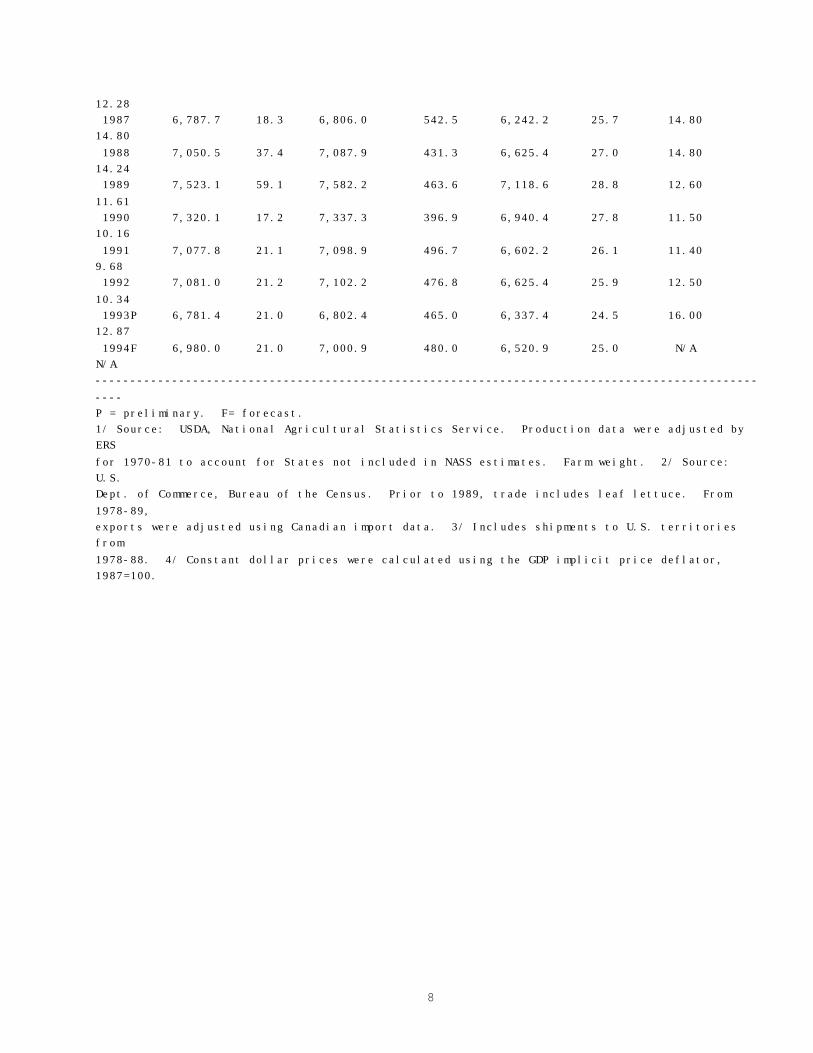
Table 1-U.S. fresh head lettuce: Supply, utilization, and price, 1970-94--------------------------------------------------------------------------------------------------- Supply Utilization ------------------------------- ---------------------------------- Seasonaverage price 4/ Year Produc- Per ------------------ tion Imports Total Exports Total capita Current Constant 1/ 2/ 2/ 3/ use dollars 1987 1/ dollars--------------------------------------------------------------------------------------------------- -------------------- Million pounds --------------------- Pounds -----$/cwt-----
1970 4,836.5 2.3 4,838.8 250.5 4,588.3 22.4 4.75 13.53 1971 4,936.7 4.5 4,941.2 292.8 4,648.4 22.4 6.31 17.05 1972 5,047.0 1.2 5,048.2 338.3 4,710.0 22.4 5.73 14.73 1973 5,243.5 1.9 5,245.4 345.5 4,899.9 23.1 7.40 17.92 1974 5,323.1 3.3 5,326.4 300.6 5,025.8 23.5 6.93 15.43 1975 5,410.8 2.2 5,413.0 329.6 5,083.4 23.5 6.71 13.64 1976 5,640.0 3.0 5,643.0 360.8 5,282.2 24.2 8.26 15.79 1977 6,043.2 3.8 6,047.0 359.5 5,687.5 25.8 6.94 12.42 1978 6,052.8 5.7 6,058.5 459.9 5,579.9 25.1 9.90 16.42 1979 6,143.9 13.0 6,156.9 480.6 5,648.5 25.1 9.23 14.07 1980 6,336.3 15.1 6,351.4 488.5 5,836.9 25.6 8.89 12.40 1981 6,268.2 11.4 6,279.6 523.9 5,728.6 24.9 10.90 13.81 1982 6,294.9 14.6 6,309.5 499.3 5,789.9 24.9 12.00 14.32 1983 5,775.5 21.4 5,796.9 519.2 5,258.6 22.4 12.30 14.11 1984 6,397.6 32.6 6,430.2 524.1 5,894.7 24.9 11.00 12.09 1985 6,133.4 37.8 6,171.2 507.4 5,644.9 23.7 10.90 11.55 1986 5,829.0 20.4 5,849.4 553.6 5,278.8 21.9 11.90
8
12.28 1987 6,787.7 18.3 6,806.0 542.5 6,242.2 25.7 14.80 14.80 1988 7,050.5 37.4 7,087.9 431.3 6,625.4 27.0 14.80 14.24 1989 7,523.1 59.1 7,582.2 463.6 7,118.6 28.8 12.60 11.61 1990 7,320.1 17.2 7,337.3 396.9 6,940.4 27.8 11.50 10.16 1991 7,077.8 21.1 7,098.9 496.7 6,602.2 26.1 11.40 9.68 1992 7,081.0 21.2 7,102.2 476.8 6,625.4 25.9 12.50 10.34 1993P 6,781.4 21.0 6,802.4 465.0 6,337.4 24.5 16.00 12.87 1994F 6,980.0 21.0 7,000.9 480.0 6,520.9 25.0 N/A N/A---------------------------------------------------------------------------------------------------P = preliminary. F= forecast.1/ Source: USDA, National Agricultural Statistics Service. Production data were adjusted byERS for 1970-81 to account for States not included in NASS estimates. Farm weight. 2/ Source: U.S.Dept. of Commerce, Bureau of the Census. Prior to 1989, trade includes leaf lettuce. From1978-89,exports were adjusted using Canadian import data. 3/ Includes shipments to U.S. territoriesfrom 1978-88. 4/ Constant dollar prices were calculated using the GDP implicit price deflator,1987=100.
9
Table 2--U.S. romaine and leaf lettuce: Supply and utilization, 1985-94----------------------------------------------------------------------------------------------- Supply Utilization ---------------------------------- ------------------------------------------- Year Produc- tion Imports Total Exports Total Per capita 1/ 2/ 2/ use----------------------------------------------------------------------------------------------- ---------------- Million pounds ----------------- Pounds
1985 778.7 -- 778.7 -- 778.7 3.3 1986 571.2 -- 571.2 -- 571.2 2.4 1987 613.0 -- 613.0 -- 613.0 2.5 1988 784.2 -- 784.2 -- 784.2 3.2
1989 915.8 23.5 939.3 57.9 881.4 3.6 1990 1,061.6 12.1 1,073.7 130.6 943.1 3.8 1991 1,157.5 8.3 1,165.8 152.7 1,013.1 4.0 1992 1,388.7 5.9 1,394.6 195.0 1,199.6 4.7 1993P 1,497.6 7.0 1,504.6 225.0 1,279.6 5.0 1994F 1,550.0 7.5 1,557.5 235.0 1,322.5 5.1------------------------------------------------------------------------------------------------- = Not available. P = preliminary. F = ERS forecast.1/ Source: USDA, NASS (1992-93); ERS (85-91), based on State-supplied data and AMS shipments. Farm weight.2/ Source: U.S. Dept. of Commerce, Bureau of the Census.
10
Table 3--Lettuce Acreage and Production, 1991-93----------------------------------------------------------------------------------State Area Harvested Production 1991 1992 1993 1991 1992 1993----------------------------------------------------------------------------------
Acres 1,000 cwtHead lettuce: Arizona 49,000 49,300 49,400 15,440 13,728 13,396 California 152,000 147,000 141,000 50,920 52,920 50,760 Colorado 4,700 3,400 3,600 1,034 1,020 1,044 Florida 5,700 6,300 5,900 1,197 1,134 1,003 Hawaii 240 240 200 30 24 18 Michigan 800 280 300 200 84 75 New Jersey 2,500 2,100 1,900 363 368 418 New Mexico 2,100 2,800 2,200 620 854 528 New York 2,600 1,900 1,100 494 304 253 Texas 1,200 500 500 168 88 88 Washington 1,300 1,300 1,100 312 286 231
U.S. 222,140 215,120 207,200 70,778 70,810 67,814
Leaf lettuce: Arizona N/A 5,300 4,500 N/A 1,113 990 California N/A 32,000 35,000 N/A 6,880 7,175 Florida N/A 600 500 N/A 81 70 Ohio N/A 520 550 N/A 161 135
U.S. N/A 38,420 40,550 N/A 8,235 8,370
Romaine: Arizona N/A 2,900 3,300 N/A 725 957 California N/A 15,500 20,500 N/A 4,650 5,330 Florida N/A 1,200 1,300 N/A 180 182 Ohio N/A 380 390 N/A 97 137
U.S. N/A 19,980 25,490 N/A 5,652 6,606----------------------------------------------------------------------------------N/A = Not available.
Source: USDA, National Agricultural Statistics Service.
Additional data are reported in Appendix table 11.
11
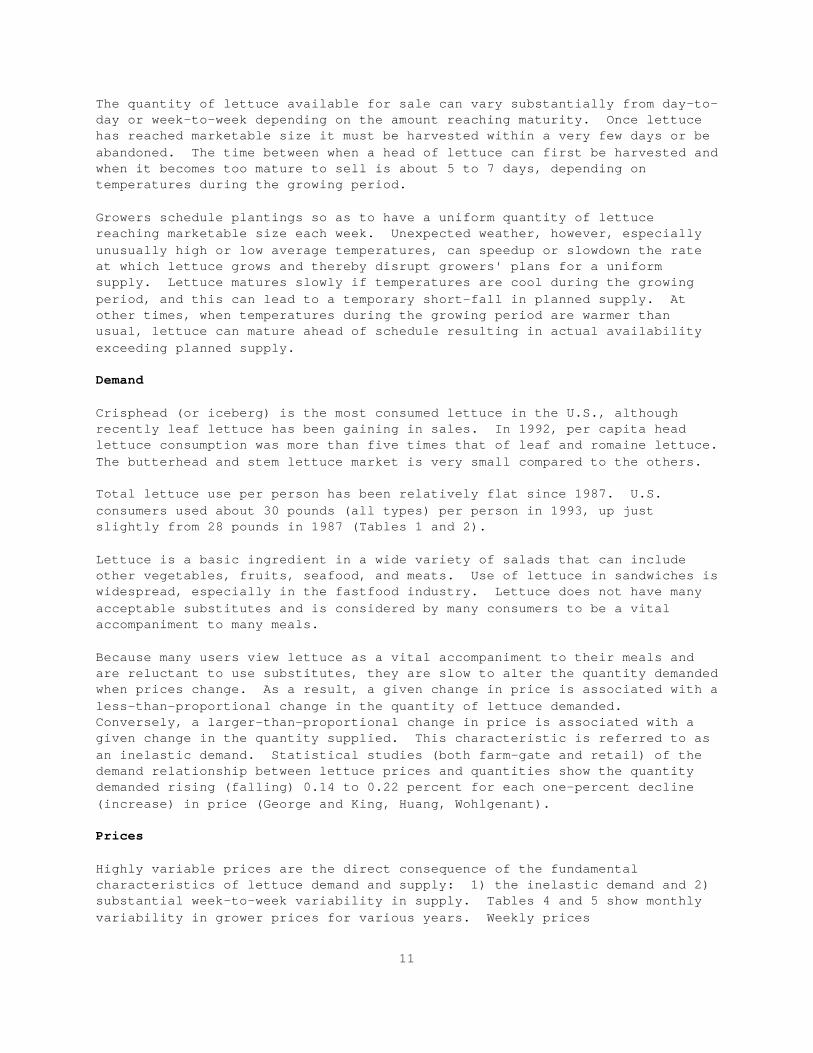
The quantity of lettuce available for sale can vary substantially from day-to-day or week-to-week depending on the amount reaching maturity. Once lettucehas reached marketable size it must be harvested within a very few days or beabandoned. The time between when a head of lettuce can first be harvested andwhen it becomes too mature to sell is about 5 to 7 days, depending ontemperatures during the growing period.
Growers schedule plantings so as to have a uniform quantity of lettucereaching marketable size each week. Unexpected weather, however, especiallyunusually high or low average temperatures, can speedup or slowdown the rateat which lettuce grows and thereby disrupt growers' plans for a uniformsupply. Lettuce matures slowly if temperatures are cool during the growingperiod, and this can lead to a temporary short-fall in planned supply. Atother times, when temperatures during the growing period are warmer thanusual, lettuce can mature ahead of schedule resulting in actual availabilityexceeding planned supply.
Demand
Crisphead (or iceberg) is the most consumed lettuce in the U.S., althoughrecently leaf lettuce has been gaining in sales. In 1992, per capita headlettuce consumption was more than five times that of leaf and romaine lettuce. The butterhead and stem lettuce market is very small compared to the others.
Total lettuce use per person has been relatively flat since 1987. U.S.consumers used about 30 pounds (all types) per person in 1993, up justslightly from 28 pounds in 1987 (Tables 1 and 2).
Lettuce is a basic ingredient in a wide variety of salads that can includeother vegetables, fruits, seafood, and meats. Use of lettuce in sandwiches iswidespread, especially in the fastfood industry. Lettuce does not have manyacceptable substitutes and is considered by many consumers to be a vitalaccompaniment to many meals.
Because many users view lettuce as a vital accompaniment to their meals andare reluctant to use substitutes, they are slow to alter the quantity demandedwhen prices change. As a result, a given change in price is associated with aless-than-proportional change in the quantity of lettuce demanded. Conversely, a larger-than-proportional change in price is associated with agiven change in the quantity supplied. This characteristic is referred to asan inelastic demand. Statistical studies (both farm-gate and retail) of thedemand relationship between lettuce prices and quantities show the quantitydemanded rising (falling) 0.14 to 0.22 percent for each one-percent decline(increase) in price (George and King, Huang, Wohlgenant).
Prices
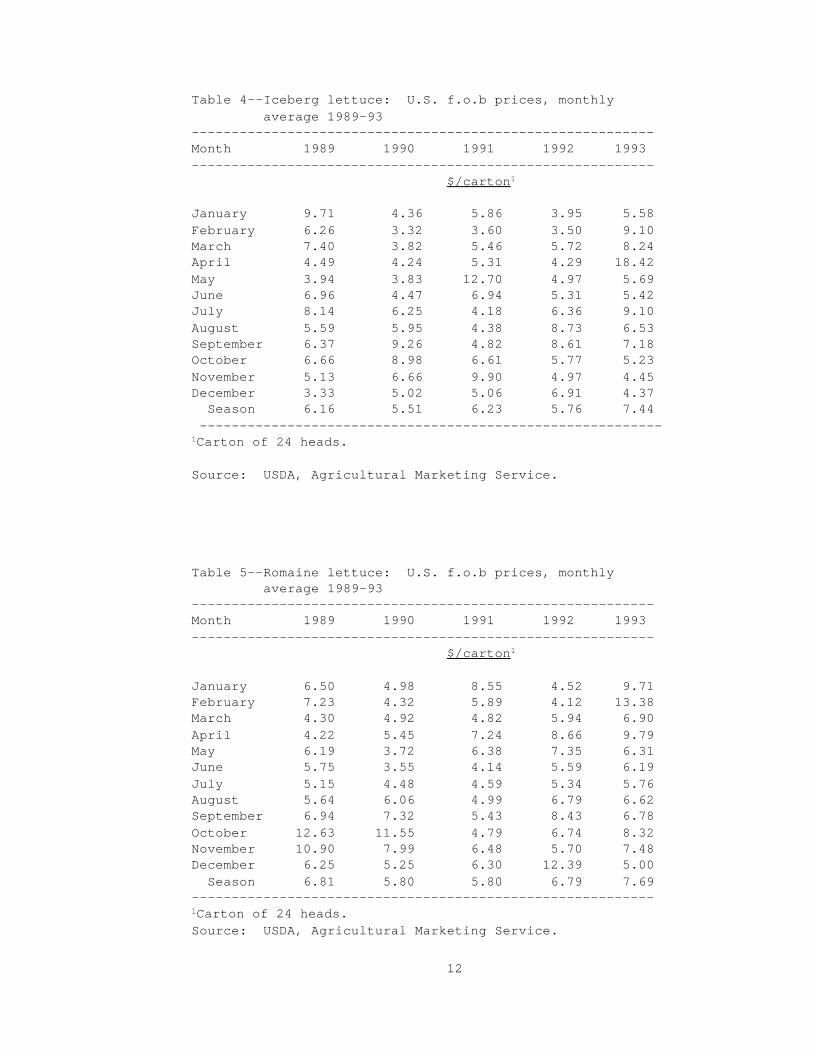
Highly variable prices are the direct consequence of the fundamentalcharacteristics of lettuce demand and supply: 1) the inelastic demand and 2)substantial week-to-week variability in supply. Tables 4 and 5 show monthlyvariability in grower prices for various years. Weekly prices
12
Table 4--Iceberg lettuce: U.S. f.o.b prices, monthly average 1989-93----------------------------------------------------------Month 1989 1990 1991 1992 1993---------------------------------------------------------- $/carton1
January 9.71 4.36 5.86 3.95 5.58February 6.26 3.32 3.60 3.50 9.10March 7.40 3.82 5.46 5.72 8.24April 4.49 4.24 5.31 4.29 18.42May 3.94 3.83 12.70 4.97 5.69June 6.96 4.47 6.94 5.31 5.42July 8.14 6.25 4.18 6.36 9.10August 5.59 5.95 4.38 8.73 6.53September 6.37 9.26 4.82 8.61 7.18October 6.66 8.98 6.61 5.77 5.23November 5.13 6.66 9.90 4.97 4.45December 3.33 5.02 5.06 6.91 4.37 Season 6.16 5.51 6.23 5.76 7.44 ----------------------------------------------------------1Carton of 24 heads.
Source: USDA, Agricultural Marketing Service.
Table 5--Romaine lettuce: U.S. f.o.b prices, monthly average 1989-93----------------------------------------------------------Month 1989 1990 1991 1992 1993---------------------------------------------------------- $/carton1
January 6.50 4.98 8.55 4.52 9.71February 7.23 4.32 5.89 4.12 13.38March 4.30 4.92 4.82 5.94 6.90April 4.22 5.45 7.24 8.66 9.79May 6.19 3.72 6.38 7.35 6.31June 5.75 3.55 4.14 5.59 6.19July 5.15 4.48 4.59 5.34 5.76August 5.64 6.06 4.99 6.79 6.62September 6.94 7.32 5.43 8.43 6.78October 12.63 11.55 4.79 6.74 8.32November 10.90 7.99 6.48 5.70 7.48December 6.25 5.25 6.30 12.39 5.00 Season 6.81 5.80 5.80 6.79 7.69----------------------------------------------------------1Carton of 24 heads.Source: USDA, Agricultural Marketing Service.
Results for the 1992 Census of Agriculture will become available inSeptember, 1994.
13
vary even more than monthly averages as illustrated by prices in Californiaduring the spring of 1993, which fell from $25 a carton during the third weekof April to $5 two weeks later (Agricultural Marketing Service, unpublishedprice data).
Between 1981 and 1992 the prices received by growers for lettuce averagedlowest during February and highest during November (Figure 3). Although theaverage of monthly prices moved upward from February to November and droppedsharply from January to February, lettuce prices can peak at almost any timeduring the year. The wide band encompassing one standard deviation on eitherside of the mean suggests that the seasonal price index is a weak indicator oftrend for lettuce prices.
Demand disruptions in the short-run can exacerbate price variability. Snowyweather at some major eastern terminal markets during the winter of 1994disrupted consumer shopping patterns and resulted in a decline in the demandfor lettuce. Growers in California reportedly sustained considerable economiclosses as a result of weakened demand and low prices.
Industry Characteristics
Those characteristics of the lettuce industry which hold particularsignificance with respect to determining the potential demand for cropinsurance are: 1) a moderate degree of diversification between lettuce andother farm enterprises, especially other vegetables, 2) limited incomediversification between farm and off-farm employment, 3) spreading of risk onthe part of some larger producers, achieved through harvesting and marketingover an extended season, and 4) widespread use of irrigation as a protectionagainst drought. The primary source of available information on farmsproducing lettuce is the 1987 Census of Agriculture.1
Lettuce Farms
The U.S. Census of Agriculture reported 2,200 farms with sales of lettuce in1987 (Appendix table 1). California had 31 percent of the farms and 67percent of the U.S. lettuce acreage in 1987. Arizona had just five percent ofthe farms but 21 percent of the acreage. New Jersey and New York each hadabout eight percent of farms and one percent of acreage.
Most farms growing lettuce in 1987 were large operations: over 46 percent(about 1,020) had total crop sales of $100,000 or more (Appendix table 2). InCalifornia, almost half the farms with lettuce reported crop sales of $500,000or more, while 30 percent had sales of less than $100,000. In Arizona, 67 ofthe 107 farms with lettuce reported total crop sales of $500,000 or more,while only 8 had sales of less than $100,000.
14
The most common type of ownership of farms growing lettuce was individual orfamily ownership (Appendix table 3). Partnerships or corporate arrangements(either family-held or other) were more common among larger farms, however. Seventy-five percent of the farms with sales of $500,000 or more reportedpartnership or corporate-type ownership.
Eighty-five percent of the operators on all farms growing lettuce reportedthat farming was their main occupation in 1987 (Appendix table 4). However,of operators of small farms, those with less than $25,000 in sales, about 67percent indicated that farming was their main occupation. About a third ofall farms reported an operator working off the farm at least 1 day during theyear.
Income Diversification on Lettuce Farms
Diversification enhances the ability of lettuce producers to manage risk. Themore diversified producers are between lettuce and other enterprises, thegreater their ability to recover from a loss of lettuce income with returnsfrom other crops. Lettuce growers in the major producing areas also spreadtheir risks by marketing over an extended season. This provides theopportunity to recoup losses from a part of the crop with returns from theremainder of the crop.
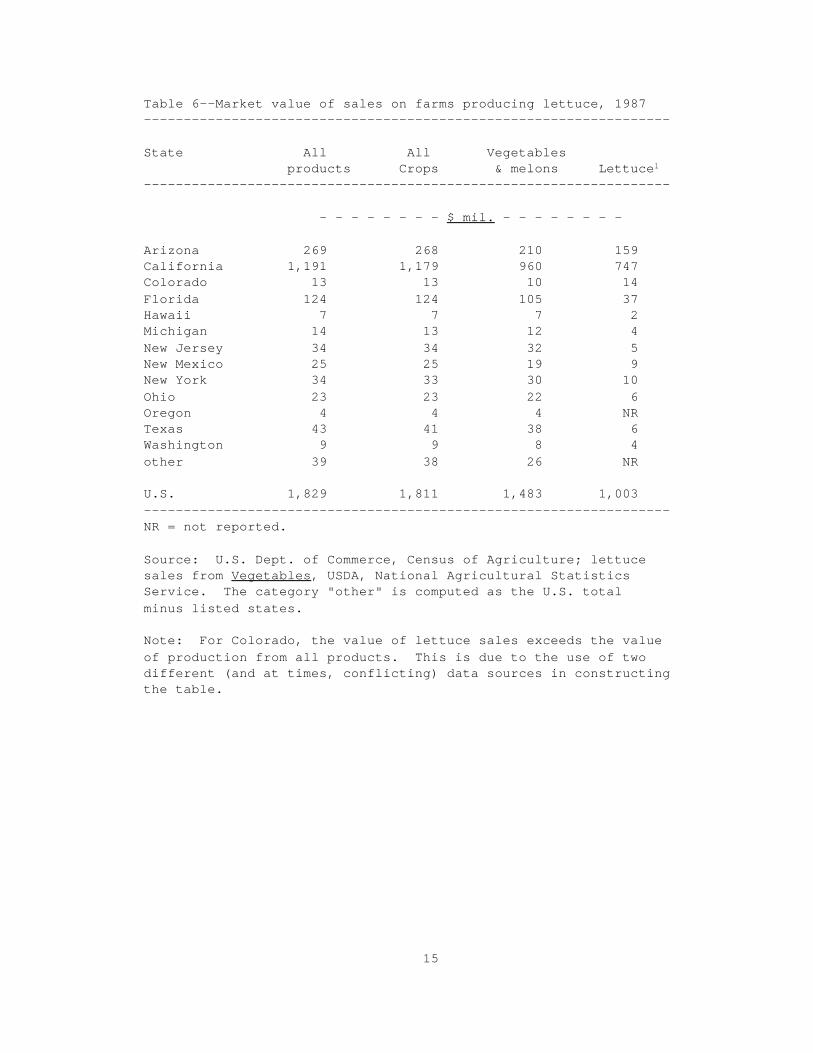
Market sales for lettuce growers are diversified between lettuce and othercrops, especially other vegetable crops. Of the $1,829 million in crop salesreported by farms growing lettuce in the 1987 Census of Agriculture, $1,483million (81 percent) were from vegetable crops including lettuce (Table 6). The Census does not report separately the sales of lettuce. The NationalAgricultural Statistics Service of USDA estimated the value of 1987 lettuceproduction at $1,003 million, 55 percent of the total crop sales of farmsgrowing lettuce reported in the Census.
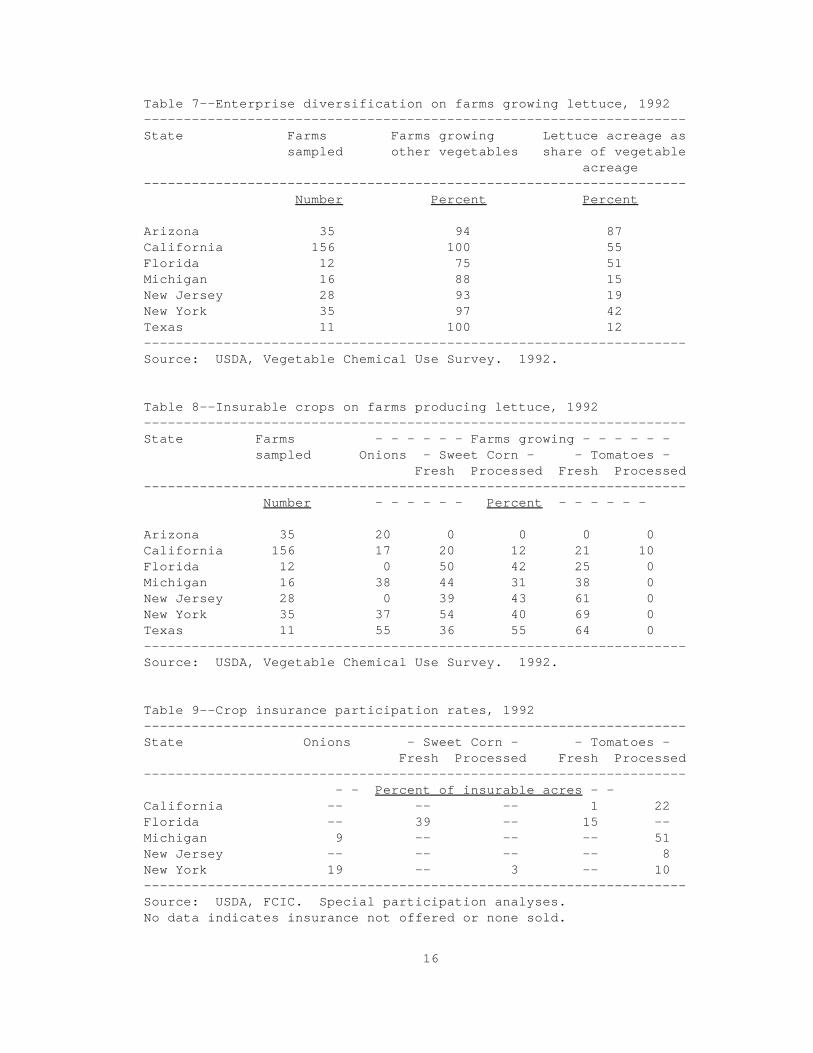
A more recent survey that included lettuce growers gives an indication of cropdiversity on farms producing lettuce. Lettuce and vegetable growers in 10states took part in USDA's 1992 Vegetable Chemical Use Survey. In California,all of the surveyed farms with lettuce also grew other vegetables, and lettuceaccounted for 55 percent of their total vegetable acreage (Table 7).
The variety of crops grown by farms producing lettuce may indicate lettucegrowers' familiarity with crop insurance. According to the Vegetable ChemicalUse Survey, 21 percent of California farms growing lettuce also grew freshtomatoes, a currently insurable vegetable crop (Table 8). FCIC data show aparticipation rate of just one percent for fresh tomatoes in California,however, and 22 percent for processed tomatoes (Table 9).
The practice by larger lettuce producers, especially in Arizona, Californiaand Florida, of scheduling planting and harvesting over a period of weeks ormonths effectively serves as a risk management technique. Insurable events,such as flooding, freeze, excess rain, and high winds, usually destroy onlythat part of the crop in the field at the point in time when the event occurs.
15
Table 6--Market value of sales on farms producing lettuce, 1987------------------------------------------------------------------ State All All Vegetables products Crops & melons Lettuce1 ------------------------------------------------------------------
- - - - - - - - $ mil. - - - - - - - -
Arizona 269 268 210 159California 1,191 1,179 960 747Colorado 13 13 10 14Florida 124 124 105 37Hawaii 7 7 7 2Michigan 14 13 12 4New Jersey 34 34 32 5New Mexico 25 25 19 9New York 34 33 30 10Ohio 23 23 22 6Oregon 4 4 4 NRTexas 43 41 38 6Washington 9 9 8 4other 39 38 26 NR
U.S. 1,829 1,811 1,483 1,003------------------------------------------------------------------NR = not reported.
Source: U.S. Dept. of Commerce, Census of Agriculture; lettuce sales from Vegetables, USDA, National Agricultural Statistics Service. The category "other" is computed as the U.S. totalminus listed states.
Note: For Colorado, the value of lettuce sales exceeds the value of production from all products. This is due to the use of two different (and at times, conflicting) data sources in constructing the table.
16
Table 7--Enterprise diversification on farms growing lettuce, 1992 --------------------------------------------------------------------State Farms Farms growing Lettuce acreage as sampled other vegetables share of vegetable acreage-------------------------------------------------------------------- Number Percent Percent
Arizona 35 94 87California 156 100 55Florida 12 75 51Michigan 16 88 15New Jersey 28 93 19New York 35 97 42Texas 11 100 12--------------------------------------------------------------------Source: USDA, Vegetable Chemical Use Survey. 1992.
Table 8--Insurable crops on farms producing lettuce, 1992--------------------------------------------------------------------State Farms - - - - - - Farms growing - - - - - - sampled Onions - Sweet Corn - - Tomatoes - Fresh Processed Fresh Processed-------------------------------------------------------------------- Number - - - - - - Percent - - - - - -
Arizona 35 20 0 0 0 0California 156 17 20 12 21 10Florida 12 0 50 42 25 0Michigan 16 38 44 31 38 0New Jersey 28 0 39 43 61 0New York 35 37 54 40 69 0Texas 11 55 36 55 64 0--------------------------------------------------------------------Source: USDA, Vegetable Chemical Use Survey. 1992.
Table 9--Crop insurance participation rates, 1992--------------------------------------------------------------------State Onions - Sweet Corn - - Tomatoes - Fresh Processed Fresh Processed-------------------------------------------------------------------- - - Percent of insurable acres - - California -- -- -- 1 22Florida -- 39 -- 15 --Michigan 9 -- -- -- 51New Jersey -- -- -- -- 8New York 19 -- 3 -- 10--------------------------------------------------------------------Source: USDA, FCIC. Special participation analyses.No data indicates insurance not offered or none sold.
17
Losses, consequently, may represent only a small part of the grower's expectedsales for the year.
Extended drought is a minimal risk in most areas because almost all lettuce isgrown on irrigated land. The Census of Agriculture indicated all the acreagein Arizona, California, Colorado, and New Mexico was irrigated in 1987 andvirtually all of the acreage in most of the other States (Appendix table 1).
Cultivation and Management Practices
Recommended cultivation and management practices provide the backgroundinformation on the growing conditions and production techniques necessary tomaintain high lettuce yields. Care requirements also provide an indicator ofthe potential for moral hazard as a problem in offering insurance.
The ideal conditions for head lettuce--cool temperatures, low humidity, andadequate moisture from irrigation--are present in different parts ofCalifornia at different times during the year, and Arizona offers theseconditions during the winter. Although lettuce is grown in other states, fewlocations have as ideal conditions as Arizona and California.
Climate
Lettuce is a cool season crop that grows best when there are wide differencesbetween day and night temperatures. The most favorable day temperature forgrowth and head formation is about 70-75oF with nights at 45oF. Temperaturerequirements are more critical for crisphead than for other types. Leaf widthincreases with day length and light intensities and leaf length increases withshort days and low light conditions. At temperatures above 80oF, headsdevelop poorly and the plants form seed stalks. Cool nights are essential forquality lettuce as high temperatures tend to produce bitterness.
Small, immature lettuce plants tolerate mild freezing, but as they approachmaturity, freezing damages the leaves and reduces shipping quality. Lettuceplantings in areas with high temperature and humidity are more likely tosuffer losses than those grown in cool, arid conditions.
Soils
The ideal soil for lettuce is fertile, well-drained, and sandy clay loam witha neutral pH. However, lettuce is grown successfully on a wide range of soilsranging from sand to clay and peat. Salinity in lettuce soils should beavoided as much as possible. It is especially harmful to germinating seed andseedlings.
Lettuce needs adequate soil moisture, especially at the time of heading. Lowsoil moisture and high temperature may cause a disorder called tipburn inwhich the tips of the inner leaves decay.
18
Excessive soil moisture also can be detrimental to lettuce. Excessiveirrigation or rain just before or during the harvest season, especially iftemperatures are high, may result in loose, puffy heads. Excessive moisturewhen heads are approaching market maturity or are overmature also may causebursting of the heads.
In western regions of the U.S., where lettuce is raised almost entirelywithout rainfall, irrigation enables the grower to accurately control soilmoisture. In the eastern and southern regions, growers can use supplementalirrigation to exercise some control over drought, but they can not avoidexcessive moisture due to extreme rainfall. One estimate places the rainfallrequirement for growing a crop of lettuce in the East and South during thespring at 5-8 inches or the equivalent in irrigation water (Thompson). Theamount required depends on such factors as temperature, character of the soil,amount of cloudy weather, and prevalence of winds.
Cultural Practices
In the Western and Southwestern states lettuce is planted in 40-inch beds, tworows per bed, with 14 inches between rows. Leaf lettuce may be spaced moreclosely. Lettuce is seed-planted at a higher rate than the desired finalplant population. The plants are thinned 2-4 weeks after planting to 10-14inches between plants. A desired final plant population for head lettuce isabout 29,000 per acre.
In other lettuce production areas of the United States, single rows on raisedbeds or on flat surfaces are used. Distance between single rows range from 12to 20 inches with a preference for spacings of 18 to 20 inches. Spacings of18 inches between rows and 12 inches between plants within the row give apotential plant population of 29,040 plants per acre.
Lettuce may be either direct seeded or transplanted. When direct seeded,pelleted seeds are mechanically planted and the field irrigated to obtain uniform emergence. Precision planting reduces the cost of labor required forthinning.
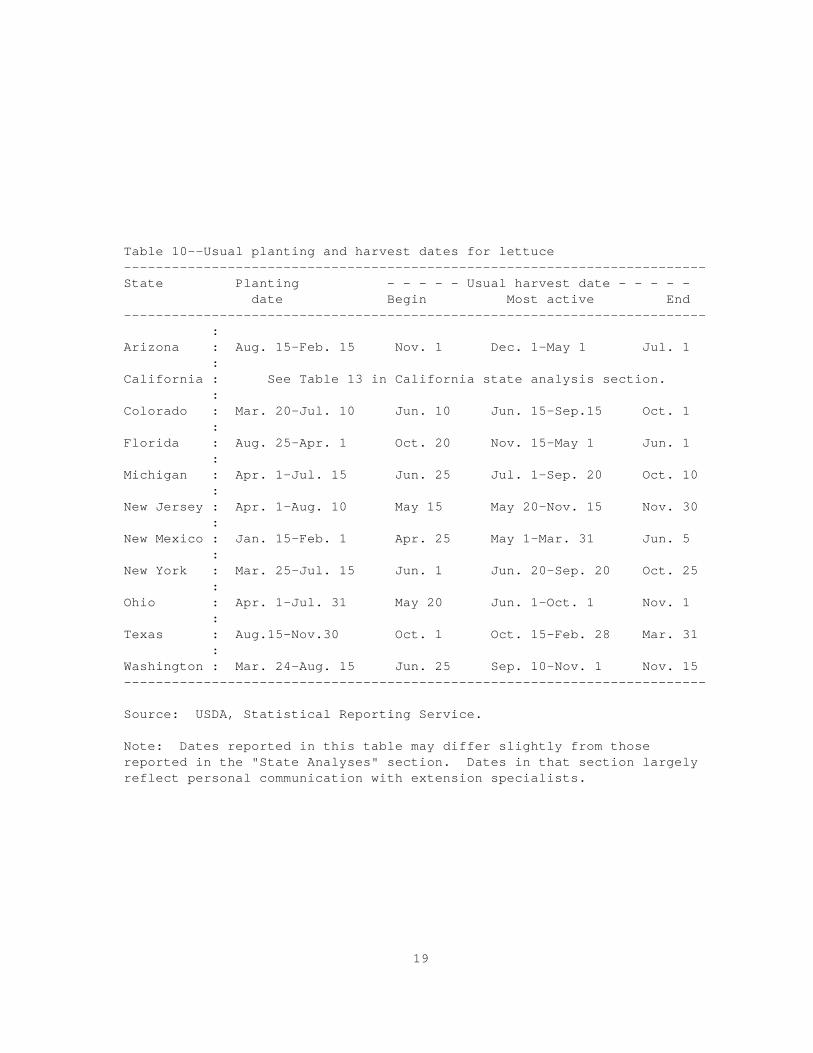
Planting Dates. Planting dates are usually used as reference time points inspecifying insurance sign-up dates and policy closing dates. Growers mayplant lettuce over a period of months in order to have crop maturing for anextended marketing period (Table 10).
Transplanting may be used to decrease the length of time plants are grown inthe open field and reduce the risk of exposure to frost or freezing or to hightemperature during periods of head development. Direct seeding is mosttypical in the southern California desert area (Imperial and Riversidecounties), but both direct seeding and transplanting are common inCalifornia's Salinas Valley.
The time from emergence to harvest ranges from 55 to 70 days under normal daylength and temperature conditions. But, fall-seeded lettuce may take upwardsof 140 days to mature due to slower growth during the cool months (Nonnecke).
19
Table 10--Usual planting and harvest dates for lettuce-------------------------------------------------------------------------State Planting - - - - - Usual harvest date - - - - - date Begin Most active End------------------------------------------------------------------------- :Arizona : Aug. 15-Feb. 15 Nov. 1 Dec. 1-May 1 Jul. 1 :California : See Table 13 in California state analysis section. :Colorado : Mar. 20-Jul. 10 Jun. 10 Jun. 15-Sep.15 Oct. 1 :Florida : Aug. 25-Apr. 1 Oct. 20 Nov. 15-May 1 Jun. 1 :Michigan : Apr. 1-Jul. 15 Jun. 25 Jul. 1-Sep. 20 Oct. 10 :New Jersey : Apr. 1-Aug. 10 May 15 May 20-Nov. 15 Nov. 30 :New Mexico : Jan. 15-Feb. 1 Apr. 25 May 1-Mar. 31 Jun. 5 :New York : Mar. 25-Jul. 15 Jun. 1 Jun. 20-Sep. 20 Oct. 25 :Ohio : Apr. 1-Jul. 31 May 20 Jun. 1-Oct. 1 Nov. 1 :Texas : Aug.15-Nov.30 Oct. 1 Oct. 15-Feb. 28 Mar. 31 :Washington : Mar. 24-Aug. 15 Jun. 25 Sep. 10-Nov. 1 Nov. 15-------------------------------------------------------------------------
Source: USDA, Statistical Reporting Service.
Note: Dates reported in this table may differ slightly from thosereported in the "State Analyses" section. Dates in that section largelyreflect personal communication with extension specialists.
20
Growing periods tend to be slightly shorter for leaf lettuce than headlettuce.
Thinning. Growers plant seeds closer than the desired spacing for maturelettuce to compensate for anticipated losses (due to insects, diseases, birds,and other hazards). Thinning is done 2 to 4 weeks following planting toremove the excess plants. Traditionally, thinning of lettuce has absorbedlarge amounts of labor.
Fertilization. Lettuce requires moderately large amounts of nitrogen andphosphorous and fertilization depends on the nutrients available in the soil. In California, growers apply 200-250 pounds of nitrogen per acre for theseason, usually one third at preplant and two-thirds during active growth. Phosphorus is applied prior to planting at 60-200 pounds per acre dependingupon the soil type.
Weed control. Weeds are a serious problem in lettuce culture because younglettuce plants are poor competitors and will not survive under weed pressure. Also, several common weeds are alternate hosts of insect and disease pests oflettuce. Both herbicides and hand hoeing are used to control weeds.
Irrigation. Almost all lettuce in the United States is grown with irrigation. In California, sprinkler irrigation is common for germination and seedlingemergence, but furrow irrigation is practiced through the remainder of theseason. The frequency of irrigation after thinning depends on the characterof the soil and climatic factors. In parts of the Monterey area, where theclimate is cool and the rate of evaporation is moderate to low, lettuce may goas long as 30 days without irrigation (Veihmeyer and Holland).
Crop Rotation. Crop rotation is used to help prevent buildup of serious soil-borne pests or diseases unique to lettuce or to control weeds and nematodes. Rotation with crops such as tomatoes, alfalfa, sweet corn, spinach, and beetsor carrots, which do not share soil pathogen organisms with lettuce, helpdisrupt the buildup of lettuce diseases and insects. During the early days oflettuce growing in the Imperial Valley, a lettuce-alfalfa rotation was commonbut now occurs less frequently than in the past. Today, barley, wheat, orcantaloupes often are grown after early lettuce in that area, and grainsorghum after late lettuce (Mayberry). Imperial Valley growers sometimesplant lettuce in the same fields for several years.
Harvesting and Packing
Harvesting is an important issue for crop insurance purposes becauseharvesting costs vary with yield and because they generate over half the totalproduction cost. Growers occasionally abandon a portion of their crop becausemarket prices drop below variable harvesting and marketing costs (expenses forcutting, packing, hauling, and selling). Economic abandonment creates thesituation where an insurance indemnity would result in a higher net returnthan harvesting and marketing. This situation may create moral hazard,particularly if prices are low near harvesttime.
21
Lettuce is harvested by hand labor with the occasional assistance ofmechanical aids. Although mechanical harvesting may be possible for uniformlymatured crops, commercial mechanical harvesting is rare because there is nopractical way to assess maturity and to remove lettuce heads flawlessly. Labor is the major part of harvest costs regardless of method of harvest(Zahara et al.). Labor for harvesting is usually supplied by a laborcontractor who charges on a piece rate basis; thus, harvesting costs vary withyield.
Per acre yield depends to some extent on the market price for lettuce, beinghigher when prices are high and being lower when prices are low. When pricesare higher, a grower will make a second or even third cutting at 7-10 dayintervals, giving small heads time to develop to marketable size. Inaddition, if prices are sufficiently high the market will accept smaller heads(such as those requiring 30 heads to fill a carton) that would have beenabandoned at lower prices.
Lettuce for the fresh market is field packed in cartons, hauled to vacuumcoolers, and shipped to market in refrigerated trucks. Field packing of"naked" heads in cartons is the most common. However, some companies bulkharvest a portion of their lettuce for fresh processing. In bulk harvesting,the cut lettuce is loaded into bulk bins which are then brought to a packingplant. Heads are cored and cut into various forms for sale to foodservice andretail establishments. The variable harvesting costs are substantially lowerfor bulk harvesting than for harvesting and placing the heads in cartons.
There are two basic field pack systems: ground pack and film wrap. The groundpack system is presently the standard harvest method in California, althoughabout a quarter of the lettuce reportedly is film wrapped. For ground-packlettuce, a team of two cutters and one packer cuts and hand-places 24 heads ineach box (18 for shipment to Canada). Placing the lettuce in a cardboard boxends the field operation. Cardboard cartons are lifted onto a lettuce fieldtruck which takes them directly to the vacuum cooler.
For the film-wrap system, packing is usually done on a portable field packingstation where the heads are wrapped in plastic film and heat treated to sealthe wrapping before being placed in the cartons. Once the lettuce is packedit is hauled to a vacuum cooler.
Before shipping, ground pack and film-wrapped lettuce are both vacuum cooledto 34oF to remove field heat and stored for truck transit to terminal markets. A small amount of lettuce is also shipped by rail. The key to successfuldelivery of fresh lettuce thousands of miles away rests upon rapid removal offield heat and shipping in refrigerated trucks or rail cars. Also, filmwrapping reduces water loss in transit which prevents deterioration duringtransit due to drying out (Nonnecke). Practically, the quality of lettucedeteriorates beyond marketability when stored beyond two weeks. Field grownleaf lettuce and butterhead lettuce can be cooled in the same way as headlettuce. Storage life of leaf lettuce is about one week if the product isheld at or near 32oF (Nonnecke).
Marketing
Detailed cost estimates for head lettuce in Monterey county, California,and leaf lettuce in Imperial county, California, are presented in Appendixtables 9 & 10.
22
Marketing considerations are important for insurance because the lack of aprofitable market raises the potential for moral hazard. Although uncertaintyas to availability of buyers does not appear to be a major issue for lettuce,low prices at times may cause growers to abandon portions of their crop.
Most lettuce is grown for the fresh market (including fresh processed). Although official USDA statistics do not report fresh and fresh processedseparately, shipment statistics indicate that about 15 percent of the U.S.lettuce crop was fresh processed in 1993 (USDA/AMS shipments).
Crisphead lettuce can be sold for either fresh or fresh processed. Thisprovides handlers having facilities for fresh processing sales with someflexibility for deciding between the fresh and processing markets near harvesttime. The amount of flexibility is limited, however, because processorsusually contract with packers for a certain quantity and lettuce diverted fromfresh use may exceed the contracted amount.
Producers in some cases pack their own fresh market lettuce and deliver it toa shipper who acts as the sales agent. In other cases, the grower contractswith a packer-shipper for packing services in a piece-rate agreement, orenters into a joint risk-sharing venture. A number of larger producers,however, act as their own shipper and sales agent. Due to lettuce'sperishability, practical storage is limited to just a few days.
The primary customers for fresh packed lettuce are chain stores and otherretailer-wholesalers, terminal market brokers, wholesale handlers, themilitary, and food processors. The biggest customers for fresh processedlettuce are fastfood chains, but retail chains increasingly are handling freshprocessed lettuce in retail-size packages.
Costs and Returns
The timing of expenditures is an important consideration for crop insurance. A second consideration is that the value of lettuce in the field is much lessthan its value at the first delivery point, which may create the potential formoral hazard.
Preplanting and planting expenses usually represent a large share of totalgrowing costs, but substantial expenses also are incurred throughout thegrowing period for pest control, supplemental fertilization and other culturaloperations. In Monterey county, California, for example, $855 of the $1,590in preharvest costs for iceberg lettuce are classed as growing expenses(Tables 11 & 12).2 If an insurable loss occurs prior to the crop reaching
23
Table 11--Iceberg lettuce production costs-------------------------------------------------------------------------------- - - California - - - - Arizona - - New Mexico Imperial Monterey Yuma Maricopa La Paz Dona Ana-------------------------------------------------------------------------------- 50 lbs. carton/acre
Yield 500 750 590 380 450 500
$/acre
Pre-harvest 1,491 1,590 1,556 1,022 805 842 Land preparation 271 219 196 187 183 104 Growing 835 855 923 601 486 575 Overhead 385 415 437 234 136 163
Harvesting 1,600 2,625 1,943 1,251 1,485 1,810
Total 3,091 4,215 3,498 2,274 2,290 2,652--------------------------------------------------------------------------------California costs are for 1992; Arizona for 1993. New Mexico does not include land rent in overhead. Harvesting costs per carton: California, $3.40-$3.50; Arizona, $2.40-$3.30; New Mexico, $3.62.Source: State-specific Cooperative Extension budgets.
Table 12--Leaf lettuce production costs------------------------------------------------------------------------- - - California - - - - Imperial Imperial Arizona New Jersey 1989 1992 Yuma Spring Fall------------------------------------------------------------------------- 35 lbs. carton/acre
Yield 700 700 690 1,200 1,200
$/acre
Pre-harvest 1,208 1,547 1,074 1,541 1,185 Land preparation 210 231 240 N/A N/A Growing 669 867 412 N/A N/A Overhead 329 450 423 N/A N/A
Harvesting 1,890 1,890 2,831 1,780 1,792
Total 3,098 3,437 3,905 3,322 2,979-------------------------------------------------------------------------Yuma county, Arizona costs are for 1993; New Jersey for 1986. Harvestingcosts per carton per carton: California, $2.70; Arizona, 3.50; New Jersey,$1.50.Source: State-specific Cooperative Extension budgets.
24
maturity, the grower may not have incurred all of the expenses classed aspreharvest cost.
In addition, harvesting and marketing expenses usually are not incurred if aninsurable loss occurs. Harvesting and marketing expenses typically amount toover half of total production costs. Consequently, FCIC may want to provideinsurance protection only for expenses actually incurred.
Production Perils
The natural perils that are most likely to result in indemnities under alettuce policy vary from area to area and depend partly on the time of yearproduction and harvesting activities are taking place. The major perilsduring the winter are freeze damage, excessive moisture, and excessive wind. In the summer, the major perils are excessive rain, excessive heat, and hail.
Diseases
Lettuce diseases are a serious problem for the lettuce grower. For manydiseases, there is no control once the crop has become infected. Lettucediseases may be due to virus, fungi, bacteria, nematodes, or nonpathogenicsources. Some are seed-borne and others are soil-borne. Some diseases aretransmitted by insects or microorganisms, others are carried by the wind,irrigation water, or the movement of contaminated soil and equipment.
Four major diseases of lettuce in the United States, ranked in order of theirprobable economic importance, are big vein, lettuce mosaic, downy mildew, andtipburn. Other diseases include Sclerotinia, aster yellows, botrytis, andbacterial spot.
Big vein. Big vein is a soil-borne disease of lettuce first reported from theImperial Valley in 1934 (USDA/ARS; Jagger and Chandler). Today, big vein is aproduction problem in a number of production areas.
Infected plants show a characteristic clearing of the area around the leafveins. Such plants remain small and stunted, never producing marketableheads. Big vein tends to develop when air temperatures are cool, between 42-60oF (USDA/ARS). The symptoms are less pronounced at higher temperatures andlettuce planted during warm periods frequently escapes infection. Chemicalcontrol of big vein has not been practical. The organism remains active inthe soil for many years. Development of tolerant cultivars offers the besthope for control. Lettuce Mosaic. Lettuce mosaic is a virus spread by insects, primarily thegreen peach aphid. Usually the virus is seed-borne to a maximum of aboutthree percent. This low percentage of infected seed is sufficient to spreadthe disease throughout the field as well as to adjacent plantings. A typicalsymptom of the disease is misshaped leaves--irregularly shaped and inwardrolling. Such plants remain stunted, yellowish, and never develop intomarketable heads. Planting virus-free seed is the best method to prevent thisdisease. The two major lettuce-producing areas in California, the Salinas and
25
Imperial Valleys, stipulate that all lettuce seed planted in the area must bemosaic-free. Most other areas require or ask for low-mosaic seed (USDA/ARS).
Downy Mildew. Downy mildew is present in most lettuce-growing regions duringcool, moist weather. The causal agent is a fungus, spread by windblown sporesthat require moisture to germinate and become infective. Symptoms areirregular spots on the underside of the outer leaves, sometimes covered withwhite, fluffy spore masses. The infected areas become brown and eventuallythe entire leaf is destroyed.
In California, downy mildew is often prevalent in the early spring and latefall or in summer in the coastal regions. The disease is of minor importancein the Imperial, Palo Verde, and Coachella Valleys. Resistant cultivars andfungicides provide control for downy mildew.
Tipburn. Tipburn is a plant disorder that occurs during warm, humid weather(USDA/ARS). Tipburn is caused by a calcium imbalance within the plant andtends to occur when there are: 1) low temperatures during early developmentfollowed by high temperatures as the crop nears maturity or 2) a fluctuatingwater supply as the crop matures. The symptoms are dark brown spots on themargins of the leaves. The breeding of resistant cultivars has improved thecontrol of tipburn, although it is still a problem.
Insects
Lettuce is attacked by a myriad of insects including the cabbage looper, thebeet armyworm, the tobacco budworm, aphids, fleabeetles, sweetpotato whitefly,and thrips. The whitefly has been a particularly serious problem in thedesert areas of California and Arizona in recent years. Insect control isachieved through following good field sanitation practices, careful monitoringof insect populations, and the use of an approved pesticide program.
Soil Salinity
High soil salinity is probably one of the most serious problems affectinglettuce in the desert areas (the Imperial Valley and Coachella Valley inCalifornia and the Arizona production areas). Excess salinity not onlyreduces and delays seed germination and seedling emergence but also reducesyield, head size, and crop uniformity. Slow-growing, weak, salt-affectedplants are also more subject to attack by insects and plant pathogens thanfast-growing, robust plants. Since fields are seldom uniform, salinitycommonly occurs unevenly within the field. Delays in emergence promotesirregular lettuce stands and usually results in variable crop maturity atharvest. There is no known chemical which can be applied to soils to reducesalinity. Salinity is controlled in the Imperial Valley by careful choice ofland, drainage improvements, and proper selection and use of irrigation andcultural practices.
This section uses California NASS and County Agriculture Commissioners'data, which are not necessarily consistent with the state data presentedelsewhere in this report. However, the county-level data provided in Appendixtables 5-8, and reported in this section, offer considerably greater detail forrecent years than is available from other sources.
26
State Analyses
The following section describes those aspects of lettuce production in themajor lettuce-growing areas which pertain to the feasibility of offering cropinsurance.
California3
California has many climatic zones that provide near optimal conditions forgrowing lettuce in one district or another throughout the year. Unlike otherstates, California produces lettuce in roughly equal quantities every month ofthe year.
The California discussion focuses primarily on the crisphead (iceberg) lettucebecause this type dominates production in California. To the extent it isavailable, information unique to production and marketing of leaf lettuce isalso included. In most cases, however, production and marketing practices aresimilar for both types.
Lettuce Production in California
California produced 76 percent of U.S. lettuce production on 72 percent ofU.S. lettuce acreage in 1993. Although leaf and romaine lettuce accounted foronly about 18 percent of all U.S. lettuce in 1993, California supplied 86percent of the leaf lettuce and 81 percent of romaine output. The total valueof California's lettuce production (head, leaf, and romaine) was $1.14 billion(USDA/NASS).
Head lettuce is the single most important vegetable crop in California,accounting for 17 percent of the State's total value of vegetable cropproduction. Among all of California's agricultural crops, head lettuce is the8th largest in value.
Although annual production of head lettuce in California has been relativelyflat at around 2.5 million tons since 1987, leaf lettuce output has increased(Appendix table 5). Over the period 1985-1992, leaf lettuce production roseabout 36 percent. This increase has been the result of acreage expansionbecause per acre yields remained fairly constant. Romaine acreage has alsoexpanded, more than doubling since 1985. Per acre yield for head lettuce ishigher than leaf or romaine lettuce because of the compactness and slightlyhigher water content of head lettuce. However, lower yields for leaf andromaine lettuce are compensated by higher unit prices, which result in peracre revenue being similar for all types.
Lettuce Producing Regions in California
27
Monterey and Imperial counties are the two most important counties for bothhead and leaf lettuce production in California (Appendix tables 6 and 7). Monterey county produces about 50 percent of California's head and leaflettuce. Imperial county produces about 15 percent of the state's head andleaf lettuce. Other important California lettuce counties are: Fresno(around 10 percent of California production), Riverside, Kern, Santa Barbara,San Luis Obispo, and Ventura counties.
Optimal planting and harvest dates depend on weather conditions. Given therange of weather in California, production practices tend to differ dependingon the geographical location. California lettuce growing areas can be broadlygrouped into five regions, each with similar growing seasons: 1) The Salinas region contains several districts surrounding the Salinas
Valley, but consists mainly of the Salinas-Watsonville and Gilroy-Hollister districts. The Salinas-Watsonville district extends from thesouthern tip of Santa Cruz county to Monterey county and the Gilroy-Hollister district includes the southern part of Santa Clara county andnorthern part of San Benito county. This area's lettuce production ismostly represented by Monterey county, where about half of the lettucecrop in California is produced. There is also a high concentration oflettuce producers in this area.
2) The Imperial Valley-Blythe region is represented by Imperial county andthe Blythe district in Riverside county. The Blythe district is a minorlettuce producing region compared to the Imperial Valley, which is thesecond largest lettuce producing region in California. Farms in theImperial Valley tend to be larger in size but fewer in number than thosein Monterey (Mayberry). Currently, there are about 30 farms in theImperial Valley-Blythe region.
3) The Santa Maria-Oceano district includes the northern coastal area ofSanta Barbara county and the southern coastal tip of San Luis Obispocounty.
4) The Inland area includes the southern part of the San Joaquin Valley--mainly the Westside district in Fresno county and the north central partof Kern county.
5) The South Coast region consists of the coastal area, south from the Oxnarddistrict in Ventura county. This area includes Ventura, Los Angeles, andOrange counties.
Ventura county (Oxnard district) is the third largest leaf lettuce producingcounty. However, given the small amount of leaf lettuce production comparedto head lettuce, this region contributes only a small amount to total lettuceoutput. In 1992, leaf lettuce produced in California (365 thousand tons)amounted to about 15 percent of the State's head lettuce production (2.5
28
million tons). Historical production of head, leaf, and romaine lettuce arepresented, by region and county, in Appendix tables 6, 7, and 8.
Head lettuce production in California may be becoming more geographicallyconcentrated. Production in all of the counties comprising the Salinas areaincreased between 1980 and 1992. With the exception of Fresno county in theInland area, production in the other areas either declined or showed nopronounced trend. Some of the decline in head lettuce production may havebeen the result of switching to leaf lettuce. Given the modest overall growthin California head lettuce output, this pattern suggests that production maybe concentrating in the Salinas Valley area.
Unlike head lettuce, leaf lettuce production has increased substantially inmost lettuce-growing counties. This growth in leaf lettuce productionreflects improvements in shipment technology and an expanding market for leaflettuce.
Since the Salinas Valley is the primary lettuce-growing region and providesthe most favorable climate for lettuce production, it's geographical featuresand climate will be described in greater detail. The Valley is bounded by twomountain ranges--Santa Lucia Range on the west and the Gabilan Range on theeast. It's soils are predominately alluvial and are highly productive. Thenorthern end of the Valley is open to the sea at Monterey Bay. During thesummer, the prevailing winds are from the ocean, producing cool weather andfog. This unique geophysical setting provides the northern end of the Valleywith an almost ideal climate for summer production of cool-season vegetablecrops which require low nighttime temperatures. Rainfall in the vegetable-producing portion of the Valley decreases with distance away from the ocean. Over 90 percent of the rainfall occurs in the six-month period from Novemberthrough April. Growers supplement the natural rainfall with irrigation waterbecause precipitation is inadequate for intense crop production. Virtuallyall of the irrigation water is pumped from the ground, which is recharged fromthe flow of the Salinas River.
Planting and Harvesting Dates
Planting and harvesting dates are usually used as reference time points inspecifying insurance sign-up dates and policy closing dates. With its diverseclimatic conditions, planting and harvesting dates in California differsubstantially from region to region and in some cases within regions. Table13 summarizes planting and harvesting periods for California's lettuce-producing regions.
In the Salinas area, planting starts from early- to mid-February and lastsuntil mid-September, and harvest starts in early April and lasts until earlyNovember. In the Imperial Valley, lettuce is planted from September throughmid-November and is harvested from mid-November through March.
Growers in California are able to harvest and market lettuce throughout theyear by shifting production from region to region according to the season. Inthe central coast area (from Monterey south to Santa Barbara), the harvest
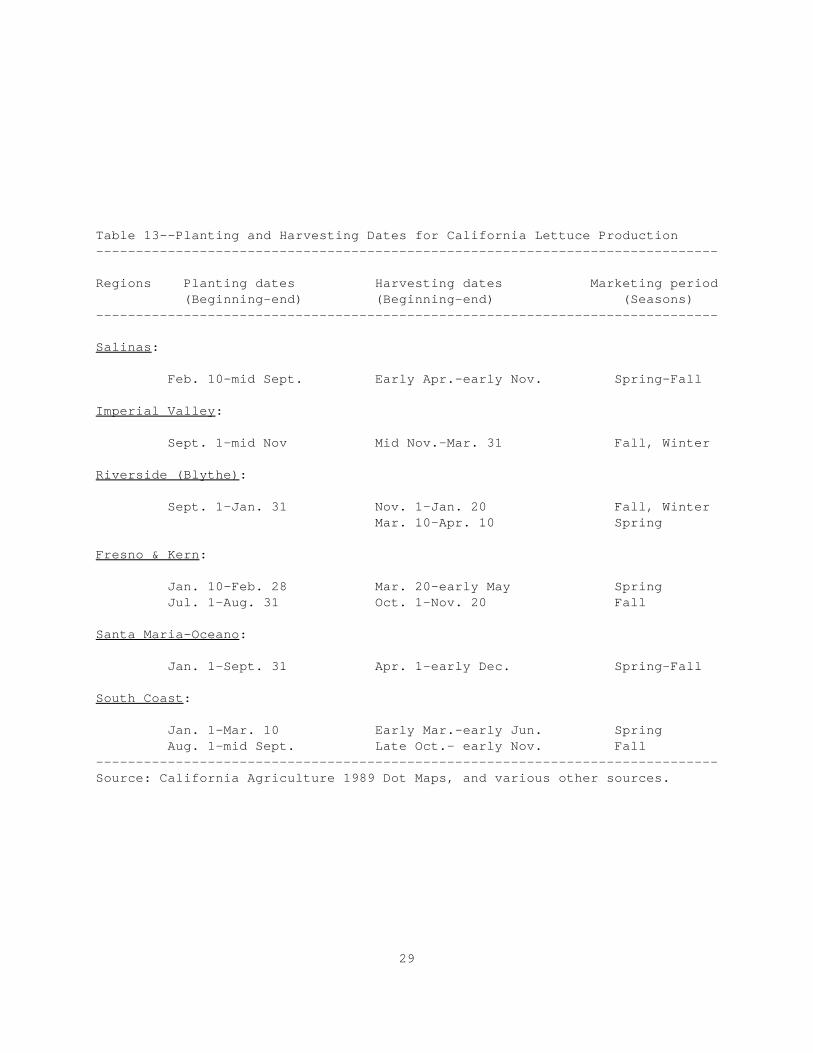
29
Table 13--Planting and Harvesting Dates for California Lettuce Production ------------------------------------------------------------------------------ Regions Planting dates Harvesting dates Marketing period (Beginning-end) (Beginning-end) (Seasons) ------------------------------------------------------------------------------
Salinas:
Feb. 10-mid Sept. Early Apr.-early Nov. Spring-Fall
Imperial Valley:
Sept. 1-mid Nov Mid Nov.-Mar. 31 Fall, Winter
Riverside (Blythe):
Sept. 1-Jan. 31 Nov. 1-Jan. 20 Fall, Winter Mar. 10-Apr. 10 Spring
Fresno & Kern:
Jan. 10-Feb. 28 Mar. 20-early May Spring Jul. 1-Aug. 31 Oct. 1-Nov. 20 Fall
Santa Maria-Oceano:
Jan. 1-Sept. 31 Apr. 1-early Dec. Spring-Fall
South Coast:
Jan. 1-Mar. 10 Early Mar.-early Jun. Spring Aug. 1-mid Sept. Late Oct.- early Nov. Fall------------------------------------------------------------------------------ Source: California Agriculture 1989 Dot Maps, and various other sources.
30
extends from spring through fall, while harvesting in the Imperial Valley runsfrom late fall through early spring. The Inland area (Fresno and Kern)produces fall and spring crops. The Imperial Valley and the Inland areas donot produce summer crops due to their warmer weather. Some minor producingregions in the south coast area (Ventura) produce spring (early March-earlyJune) and fall (late October-early November) crops.
Production Perils
There are a number of potential production perils in California, such asweather events, earthquakes, diseases, and insects, but growers generally feelthat they can deal with these problems. Losses from earthquake could occurdue to damage to water distribution systems or roads and bridges thatprevented irrigating or field access at critical times.
Weather Events. In general, direct losses from perils such as drought, wind,unusually warm or cold weather, hail, flood, and earthquake are rare inCalifornia and growers do not perceive them as serious production risks. Furthermore, unlike field crops, the season for lettuce (and some othervegetables) is spread over several months and the loss of part of the crop ispartly offset by replanting the damaged fields.
While weather is key for lettuce growing, the probability of extremely coldweather which would seriously damage the crop is low in the regions wherelettuce is grown. Weather problems mostly cause slow and weak growth of thecrop. And, when plant growth is not vigorous, plants become vulnerable todisease and insect attacks.
Diseases. Losses due to uncontrolled disease infections are a constantthreat, but growers feel that these risks can be managed through a combinationof constant observation and aggressive control measures.
Insects. As with plant diseases, lettuce losses from uncontrolled insectinfestations are a constant threat. In general, growers believe that they canmanage insect risks with aggressive monitoring and control. A serious whitewhitefly infestation, however, caused exceptionally low yields in 1982 and1983 in the desert area. Infestation by a new strain of whitefly (thesweetpotato whitefly) in the fall of 1991 resulted in lowered yields duringNovember 1991 to January 1992.
Production Costs
The Cooperative Extension Service of the University of California estimatescosts of production for major crops, including lettuce, in the leadingproducing areas in California. Estimates of production costs are summarizedfor Monterey and Imperial counties in Tables 11 and 12 (for detailedinformation see Appendix tables 9 and 10). Per acre yields are assumed to be750 50-lb cartons in Monterey county and 500 in Imperial county. The landpreparation costs include all variable costs incurred during the pre-plantingperiod. Growing period expenses include all variable preharvesting costs fromplanting forward.
31
For iceberg lettuce, the estimates indicate that per-acre costs are higher inMonterey county, $4,215, than in Imperial county, $3,091. Per-carton costsare similar in both areas ($5.62 in Monterey and $6.18 in Imperial) becausethe per-acre yield in Monterey county is also higher than in Imperial county. Harvesting costs are more than half of total costs, which is typical for hand-harvested vegetables. Lettuce is usually harvested on a contract basis andcosts include expenses for cutting, packing, and hauling. Per carton harvestcosts average $3.50 in Monterey county and $3.20 in Imperial county.
Irrigation Water Issues in California
Irrigation water availability is a critical issue for all of California'sagriculture, but it is particularly serious in the west side of the SanJoaquin Valley. Farmers in the West Side (mainly Kern county) are facingirrigation water shortages and higher water costs due to cutbacks of the waterfrom the Central Valley Project and state water projects.
Despite water shortages and higher costs, lettuce production is likely tocontinue in the San Joaquin Valley, while the acreage of other crops may bereduced. Lettuce is a minor user of irrigation water in the San JoaquinValley and the revenue per acre foot of consumptive water use for lettuce isamong the highest for the major crops grown (Kern County Water Agency). It islikely that irrigation water would be shifted from crops with relatively lowvalue per acre foot of water, such as cotton, alfalfa, and sugarbeets, tocrops with relatively high value, such as lettuce, if water is not availablefor all uses.
Another important water issue is salt water intrusion in the Salinas Valley. Sea water has been creeping into Salinas Valley aquifers for more than 50years because of heavy use of groundwater for irrigation. Since the 1930's,120 wells west of Salinas have been closed because of salt water problems. The rate of sea water encroachment increased during the last 5 years due toextended drought. Currently, farmers in the Salinas Valley must operatewithin a mandatory ground water management plan which establishes upperpumping limits, mandated use of water meters, and ground water extractionfees.
Grower-Shipper Arrangements
Because lettuce is a perishable product, precision coordination is neededbetween growers and shippers to assure swift and timely harvesting andmarketing (including packing, shipping, and finding buyers). The followingdiscusses the major ways growers and shippers coordinate the growing,harvesting, and marketing of lettuce in California and the risk-sharingimplications of these arrangements.
Most of California's lettuce is produced by a relatively few, large,vertically-integrated operations in which a single firm grows, harvests,packs, sells, and ships. These firms are referred to as grower-shippers.
Grower-shippers reportedly handle the largest share of California's lettuce. In 1979, approximately 40 shippers handled about 75-78 percent, by volume, of
32
California lettuce (Schaffner, Carter). Thirteen shippers handled about 56percent, and the three largest shippers handled roughly 30 percent.
Some shippers contract with individual farmers to grow lettuce for the shipperto pack and ship. Most small and medium size farms operate in a joint venturewith a shipper and grow lettuce at a fixed rate (price) per acre or under someoutput sharing arrangement.
Forward contracting between the grower and shipper--locally known as "deals" --provides a common method of: 1) assuring growers a market for theirproduction; 2) sharing the risk of the final market price; 3) and furnishingsome portion of the operating capital needed in growing. Contracts alsoprovide the shipper with a steady and predictable supply of produce (Moore andSnyder). Fresh vegetable "deals" can be broadly classified into the followingthree categories:
Flat-Rate Contract. A flat-rate contract specifies the crop, area to beplanted, the approximate planting date, and the amount of money to be paid peracre for the crop. Since the farmer receives his payment regardless of theeventual yield, the risk of price and yield variability is shifted to thepacker-shipper. Although not very common, this type of contract provides thegrower with an assured revenue and operating capital, since the payments aremade during the growing season. A county farm advisor estimated that 10percent or less of the acreage in Imperial county is grown under a flat-feearrangement between the grower and shipper (Mayberry).
Open-Price, Output-Sharing Contract. The most prevalent deal is the open-price contract with an output sharing arrangement. The contract does notspecify the price received by the grower but usually specifies the plantingdate and the amount of production inputs each party will provide. The shippergenerally harvests and markets the crop. There are two types of open-pricecontracts: 1) those with minimum price guarantees and 2) those withoutminimum price guarantees. In the case of contracts with no minimum priceprovision, the shipper usually purchases a specified share in the crop eitherthrough cash advances or by providing certain inputs (Moore and Snyder).
Open-price contracts specify a negotiated harvesting cost per carton, whichthe shipper subtracts from the gross sales price before splitting theremainder with the grower. The split between these two parties is typically50/50 but sometimes 60 for the grower and 40 for the shipper. Usually thegrowers receive at least a 50-percent share. The open-price contract betweenthe shipper and the grower provides an opportunity to share production/marketrisks and a source of operating capital to the grower.
Cooperative Membership. The third type of arrangement, the vegetablemarketing cooperative, is not a marketing contract in the strictest sense. The marketing co-op maintains labor crews and farm equipment and it harvests,packs, and markets lettuce for its members. Growers belonging to marketing
33
cooperatives continue to bear full market risks and to provide their ownoperating capital.
Demand for Crop Insurance
Crop insurance participation, particularly with a policy that protectedagainst yield loss alone, would likely be quite low among California lettucegrowers. Production perils are relatively minimal and the major risk comesfrom low market prices due to over-production. However, several Californiarequests for a lettuce insurance policy have been received by FCIC in recentyears. Perhaps a policy, such as a revenue insurance plan, that protectedagainst low returns regardless of whether it was due to low prices, productionlosses, or a combination of the two would be of interest to more Californialettuce growers than a plan providing only a yield guarantee.
Lack of Major Production Perils. Because several lettuce crops can be grownin a single season, production perils are usually less of a risk in growinglettuce in California than for producing field crops. Losses due to hail,wind, excess rainfall, and extreme temperature are uncommon in Californiabecause the climate in the major lettuce-growing areas is usually highlypredictable. Drought is not a big risk in California lettuce production. Because of its high value per acre, irrigation water would be reallocated tolettuce from other crops during periods of water shortages. Growers cangenerally control losses from lettuce insects and disease through carefulattention to pest control.
Greatest Risks are Low Market Prices. Lettuce growers in California are moreconcerned about excessive production and low prices than about yield losses. Excessive production results in market gluts which drive prices down andreduce total income. Lettuce growers as a group are better off when there isan industry-wide production shortfall than when there is excessive productionbecause higher market prices more than offset the smaller quantity.
The effects of production declines on incomes are illustrated by the organizedlabor strike in the winter of 1979 in the Imperial Valley. The strikeimpaired the lettuce harvest and lettuce prices skyrocketed (the ImperialValley was the major supplier at the time). As a result of the strike,lettuce producers may have received higher incomes than if there had not beena supply-disrupting strike (Carter et al.).
Excessive production is usually less of a risk for other states than forCalifornia. Any major shortfall (or glut) in production in other states doesnot have as significant a market impact (except perhaps in the case of Arizonaduring the fall) because of California's market domination.
Arizona
Arizona is surpassed only by California in the amount of lettuce produced,harvesting about 57,000 acres of head, leaf, and romaine lettuce annually. Lettuce is the highest value vegetable crop in Arizona, tallying $260 million
34
farm value in 1993 (USDA/NASS). Arizona accounted for 19 percent of totalU.S. lettuce production in 1993.
In 1987, the Census of Agriculture reported 107 farms with lettuce in Arizona,averaging 497 harvested acres. Sixty-three percent had crop sales totaling$500,000 or more and 93 percent had crop sales of $100,000 or more.
The largest acreage is in the Yuma-La Paz production area in southwestArizona, with Yuma County having the greater area. Production from the Yuma-La Paz area is primarily for the winter market. Other counties (Cochise,Maricopa, Pima, and Pinal) produce lettuce mostly for the spring and fallmarkets. All lettuce in Arizona is grown on irrigated land.
Lettuce planting in Yuma County begins in late August and extends through themiddle of February. Harvesting begins in mid-November and lasts throughApril.
Perils
The major perils in lettuce production in Arizona are insects (especially thewhite fly), plant pathogens (soil borne as well as mildews), and weather-related damage. Frost can damage mature plants from November through Marchwhile high winds can cause damage to small, immature plants.
Whitefly. The whitefly is a small insect which becomes destructive to lettuceand certain other crops when populations build up, usually in the fallfollowing unusually hot weather. Losses to lettuce can result from virusdiseases transmitted by the whitefly or from weakening of the plants due tothe feeding of the insects. Whitefly populations typically decline and theinsect ceases to be a serious problem with the onset of cooler temperatures. An unusually severe infestation of whitefly in the California and Arizonadesert areas in the fall of 1991 reduced lettuce yields from November-January. Growers usually control losses from whitefly infestations with a combinationof sanitation practices and insecticide spraying.
Plant diseases. Although lettuce in Arizona is subject to damage due to anumber of plant diseases, growers are able to control losses with a program ofcrop rotation and fungicide spraying.
Freeze. Extreme cold temperatures sometimes cause limited losses to lettucebetween November and March.
Floods. Limited losses of lettuce occurred in southern Arizona during thespring of 1993, when excessive rain on top of an abundant mountain snowpackcaused flooding of the Gila River.
Florida
There does not seem to be very much potential demand in Florida for cropinsurance for lettuce and romaine because most of Florida's production isgrown by a handful of large producers who manage risk through diversificationamong crops and by marketing over a long harvesting season. However, several
As indicated in the note to Table 10, slight inconsistencies existbetween NASS's Usual Planting and Harvesting Dates and extension specialists'indications.
35
Florida requests for a lettuce insurance policy have been sent to FCIC inrecent years.
Florida ranks a distant third in U.S. lettuce production, harvesting about8,000 acres of head, leaf, and romaine lettuce annually during the past twoyears. The farm value of Florida's lettuce output was $25.6 million in 1993(USDA/NASS), but Florida's output amounted to only about 1.5 percent of totalU.S. lettuce production.
Ninety percent of the lettuce in Florida is grown on the organic muck soils inPalm Beach County around the southern tip of Lake Okeechobee (the Evergladesarea). The remainder is grown on muck soils in central Florida. Head lettucein Florida is grown almost exclusively in the Everglades area.
There are currently only a handful of lettuce growers in the Everglades area. The Census of Agriculture reported 11 growers in Palm Beach County in 1987harvesting 9,169 acres. The 1992 Vegetable Chemical Use Survey sampled 12farms growing lettuce in Florida.
Two or three producers grow most of Florida's lettuce, in combination with amix of vegetables and other crops. Several producers also grow a largeacreage of sugarcane. The largest producers are vertically integrated in thatthey grow, pack, and sell their own lettuce.
Production Practices
Lettuce is harvested in Florida from October through May, but the most activeharvest is from December 1 to May 1 (USDA/FASS). The Florida shipping seasontypically ends by June 1.4 Lettuce is hard to grow in the heat and rainfalltypical of Florida's summers.
Lettuce in Florida is direct seeded from September 1 through April 1, andrequires about 65 days from seeding to harvest.
Virtually all of the lettuce in Florida is irrigated. Irrigation isaccomplished with a network of ditches and canals which maintain the sub-surface irrigation water table. The same network is used for rapid drainageafter heavy rains because excess water damages the roots of the lettuceplants.
Perils
Excessive rainfall, hail damage, wind damage, and severe cold are the majornatural perils to lettuce production in Florida. Frost and hail are minor
36
problems, while drought has not been a problem in the past because sufficientwater has always been available for irrigation (Schueneman).
Excessive Rainfall. Too much rain causes wet fields which can lead to abuildup of root-borne disease and crop losses. Excessive moisture can resultin damages ranging from poor quality to complete loss of the crop if thegrower can not get into the field to harvest on a timely basis. Excessivemoisture may occur several times during the year causing variable damagedepending on the stage of the lettuce's development and the amount ofrainfall.
Wind Damage. Excessive wind can cause severe losses by blowing dirt into thelettuce heads making it unsalable for the fresh market. While such dirt canbe partly washed out of leaf lettuce, it can not be removed from head lettuce. Growers may have little alternative other than to abandon head lettuce inwhich dirt becomes embedded within the head.
Some head lettuce containing wind-blown dirt may be shredded and marketed forinstitutional use such as fast food restaurants. The amount that can bemarketed this way is limited, however, because the processor usually has acontract for a specified amount of shredded lettuce. Lettuce diverted fromthe fresh market because of dirt within the head would often represent supplybeyond the processor's current needs.
Wind also can break off young lettuce plants, reducing potential yields.
Extreme Low Temperatures. Freezing temperatures damage the leaves and injurethe shipping quality of mature lettuce. A freeze in late December 1989damaged or destroyed much of Florida's lettuce planted at the time. Lettuceshipments from Florida dropped sharply during January and February, andrecovered in March after replanted lettuce became available. The freezeplayed a key role in a 30-percent decline in Florida production from theprevious year.
Frost. Frosts can injure small lettuce plants but is not considered a seriousperil in lettuce production in Florida.
Hail. Hail can cause damage to mature lettuce but is not considered a seriousproblem for lettuce production in Florida. Only a small portion of Florida'slettuce is damaged by hail each year.
Harvesting and Marketing
Two harvesting systems are used for lettuce in Florida: 1) hand-cut and field-pack, and 2) hand-cut and packing with mobile "mule trains." In the hand-cutand field-pack system, workers cut, trim, and place the lettuce in shippingcrates in the field. With the mule train system, workers hand cut the lettuceand place it on a conveyor belt attached to a mobile packing shed (muletrain). The mule train moves through the field harvesting 10 to 12 rows at atime.
Producers in Florida usually pack their own lettuce and deliver it to a
37
shipper who acts as the sales agent. The larger producers, however, act astheir own shipper and sales agent. Practical storage is limited to just a fewdays due to lettuce's perishability. The primary customers for lettuce arechain stores and other retailer-wholesalers, terminal market brokers,wholesale handlers, and the military.
Colorado
Colorado grew about 1.5 percent of all U.S. head lettuce in 1993. In 1993,2,700 of Colorado's 3,600 harvested acres of lettuce were located in the SanLuis Valley. This is a high valley with a cool climate which is well suitedfor growing lettuce. The Census of Agriculture reported 45 farms in Coloradowith 2,684 acres of lettuce in 1987 (Appendix table 1).
Much of the acreage is grown by 8 or 10 growers (Ellis). Some grower-shipperswith operations in California and Arizona come to the San Luis Valley toproduce lettuce for the summer market. Lettuce in the San Luis Valley isplanted during May and June and harvested during July and August. All lettucein Colorado is irrigated, either with furrow irrigation or a center pivotsystem.
The major production peril is hail damage. Excessive heat is not a problem inthe San Luis Valley because of its high elevation (7,600 feet). Because allthe acreage is irrigated, drought is not a production peril. Cold winters inthe Valley reduce pest populations so that insects are not a major concern. The crop is removed before the first frost in the fall so that excessive coldis not a major concern.
Low prices are viewed as a major peril. Sometime the price is too low towarrant the expense of harvesting, packing, and marketing the crop. In suchcases, the crop may be abandoned, sometimes before harvesting begins, at othertimes after partial harvest.
New Jersey
New Jersey produced less than 1 percent of U.S. head lettuce output in 1993. Most lettuce is grown in Cumberland County in south New Jersey. Producers aremostly small family operations (2 to 100 acres of lettuce) and grow lettuce incombination with other vegetables (Reiners). The Census of Agriculturereported 185 farms in New Jersey with 3,555 acres of lettuce in 1987. About95 percent of New Jersey's lettuce is irrigated.
Growers in New Jersey plant both a spring crop and a fall crop. Harvest forthe spring crop is completed by July 1 in order to avoid the summer heat. Thefall crop is planted during August and harvested during October and November. The major market outlet is the Vineland produce market in southern New Jersey. Growers harvest early in the morning and take the lettuce directly to themarket. A number of growers use the packing and vacuum-cooling facilities at
38
the Vineland market. A few larger growers may have their own packing andcooling facilities.
There is no industry-sponsored promotional program. The 'Jersey Fresh'program promotes lettuce along with other vegetables, but is sponsored by theNew Jersey Department of Agriculture. For many crops, the New JerseyDepartment of Agriculture assesses a fee (based on growers' production) forpromotion.
The major perils are hot, dry weather, insects and diseases, and freezingtemperatures. Growers deal with the heat problem by scheduling planting so asnot to have lettuce maturing during the heat of summer, and most growers dealwith drought by irrigating. The freezing peril is managed by schedulingplanting so that harvest is completed before the onset of severe coldtemperatures.
New Mexico
New Mexico is a minor lettuce producer, accounting for less than 1 percent ofU.S. head lettuce output in 1993. Most production is in Dona Ana county insouth central New Mexico. The Census of Agriculture reported 68 New Mexicofarms with 2,064 acres of lettuce in 1987.
Lettuce enterprises on New Mexico farms are small compared with those inArizona and California. Dona Ana county, with 90 percent of the State'slettuce acreage, has lettuce enterprises ranging from about 5-150 acres(Vargas). New Mexico's lettuce growers tend to be diversified, growingonions, chili peppers, and other vegetables as well as field crops such ascotton, alfalfa, and pecans. All lettuce acreage in New Mexico is irrigated. New Mexico has two main crops--spring and fall. The fall crop is usually alittle larger than the spring. The spring crop is planted from mid-Decemberto the end of January for harvest in May. The fall crop is planted in Augustand harvested in October (Gomez and Corgan, a & b).
Growers sell exclusively through packer-shippers. There are no lettucemarketing cooperatives. Because growers and packer-shippers usually have along-standing relationship, the packer-shipper knows the quality to expectfrom each grower. Arrangements to handle the grower's lettuce usually aremade before the crop is planted. Three or four packer-shippers handle lettucein Dona Ana County.
The major production peril in New Mexico is thunderstorms, which can result inhail damage or wash out planted seed. Thunderstorms are more of a threat tothe spring crop than to the fall crop. Since all of the lettuce is irrigated,dry weather is not a problem. Although potentially a peril, insects aregenerally kept under control through monitoring and spraying.
Tipburn is the most important disease of spring lettuce in New Mexico. Thedate of maturity of lettuce in southern New Mexico has a great influence on
39
the incidence of tipburn. Heads maturing after mid-May are often severelytipburned because of high temperatures.
New York
New York grew less than one percent of all U.S. head lettuce in 1993. NewYork also grows some leaf and romaine lettuce, though they are not reported inUSDA vegetable statistics.
Lettuce acreage in New York has dropped over the last 10 years from about3,000 to 2,000 acres in 1992 and 1,000 acres in 1993. Production is mainly onmuck soils in Oswego county (central New York) and Orange county (southeastNew York). Some lettuce is grown in the Eden Valley in western New York whichis not on muck soils.
The Census of Agriculture reported 165 farms with 3,347 acres of lettuce in1987, but most of the lettuce is grown by a few growers. Most lettuce isirrigated following seeding to insure germination, but there is not very muchirrigation during the growing period. Lettuce growers also produce onions anda number of other vegetable crops.
Planting begins in late March or early April and continues into mid-July. Harvesting begins in mid-June and continues to early October.
Growers mostly sell directly to supermarket buyers, to the military or tolocal retailers. One contact estimated that supermarkets and the militarypurchase 85 percent of New York lettuce (Ellerbrock).
The major perils are flooding, high winds which uproot young plants, andherbicide drift from onions growing alongside lettuce (happened 2-3 times inlast 5 years). Disease damage is usually not widespread. Growers plant toavoid fall freeze injury.
Ohio
Ohio grows a small acreage of lettuce. The Census of Agriculture reported 33farms in Ohio with 1,256 harvested acres of lettuce in 1987. The NationalAgricultural Statistics Service did not report any head lettuce statistics forOhio in 1993, but reported 940 harvested acres of leaf lettuce and romaine.
Most of Ohio's lettuce is grown on organic muck soils in the north centralpart of the State. Lettuce is usually grown in combination with othervegetables, often successively in the same season. Growers raise both aspring and fall crop. Virtually all lettuce in Ohio is irrigated.
The major perils are hail, excessive summer heat, and insect and diseasedamage. Hail is the most destructive. Excessive heat during the hottest partof the summer is dealt with by scheduling planting to have a spring and fallharvest. Insects and diseases are dealt with through rotating crops and pestspray programs (Gastier).
40
Ad Hoc Disaster Assistance for Lettuce
Ad hoc disaster assistance legislation was made available for losses ofcommercially-grown crops in each of the years 1988-93. Ad hoc paymentsprovide an indication of high-loss areas during that period, and may indicatestates and counties that would face relatively high risk under a potentialFCIC lettuce policy. These data may also suggest the areas where the demandfor a lettuce crop insurance policy would be relatively high.
Under the 1988-93 legislation, payments were made under the categories ofparticipating program crops, nonparticipating program crops, sugar, tobacco,peanuts, soybeans, sunflowers, nonprogram crops, ornamentals, and at times,aquaculture. Producers without crop insurance--the case for lettuce--wereeligible for payments for losses greater than 40 percent of expectedproduction. If a producer had no individual yield data to use in calculating"expected production," county-level or other data were used as a proxy. Payment rates for lettuce were based on 65 percent of a 5-year average price,dropping the high and low years.
Disaster assistance payments for lettuce totalled more than $8.2 million overthe 1988-93 period, and were made in the following lettuce categories: babygourmet, bibb, boston, fall, head, iceberg, leaf, red, romaine, and spring. Payments for lettuce losses peaked at $2.5 million in 1988, and were over $1million in each of the years 1989, 1991, and 1993. Ad hoc payments made forlettuce accounted for about 1.5 percent of all ad hoc payments for non-programcrops over the 1988-93 period, but far less than 1 percent of total payments(program and non-program crops).
Ad hoc disaster payments for lettuce were scattered over a geographicallybroad area (Figure 5). Thirty-eight states received payments in at least oneof the 6 years. Five states--Michigan, New Jersey, New York, Ohio, and Texas--collected payments for lettuce in all years. Further, payments were reportedin a variety of states for which neither NASS nor the Census collects data onlettuce--including Maine, Vermont, and Kansas.
In a ranking of counties, Oswego county, New York ranked first in payments,receiving over $950,000 over the 6-year period. Ingham county, Michigan andOrange county, New York received over $500,000 in payments. Among the top-10recipient counties, four were in Michigan, two were in New York, and one eachwere located in New Jersey, Washington, Ohio, and Arizona.
Ad hoc disaster data can be used to indicate which lettuce-producing areashave received large payments relative to their production. For example,California accounted for about 70 percent of total U.S. lettuce harvestedacreage between 1988-93, but received only 8 percent of the payments made forlettuce over that period (Table 14). Similarly, Arizona accounted for anaverage 21 percent of harvested acreage, and 3 percent of lettuce disasterassistance payments over the same period.
In contrast, Michigan and New York collected a high proportion of paymentsrelative to their production. Michigan accounted for 0.3 percent of U.S.
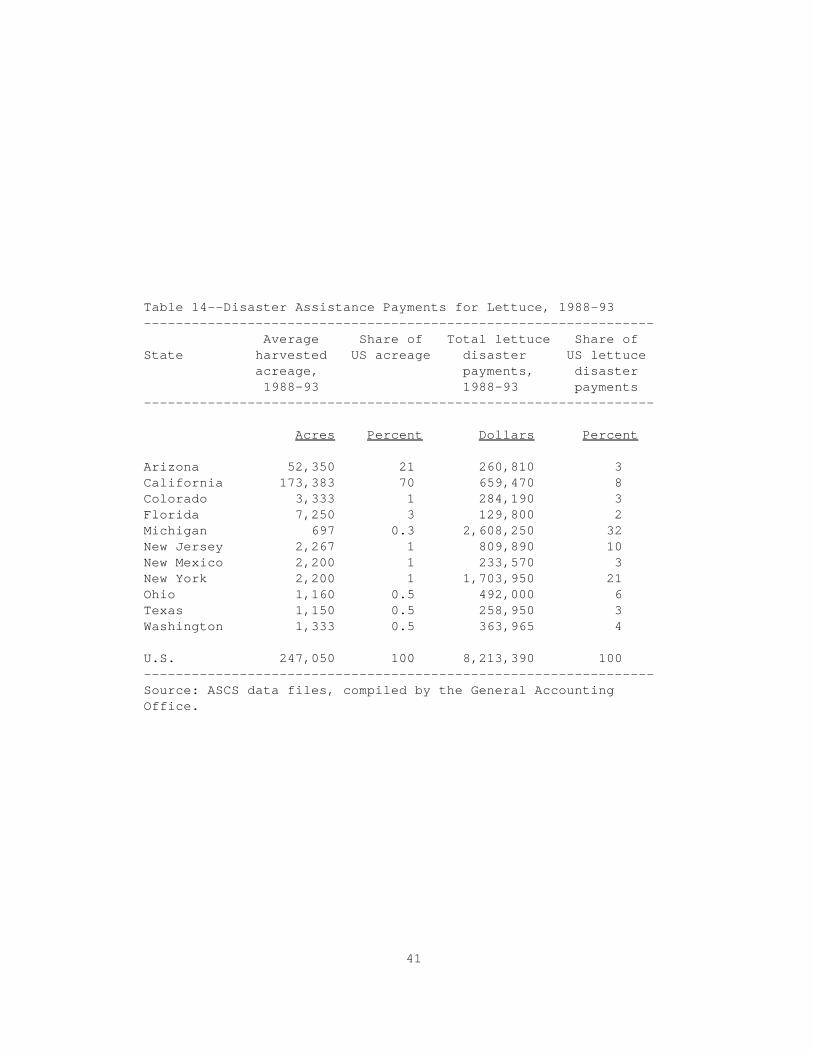
41
Table 14--Disaster Assistance Payments for Lettuce, 1988-93---------------------------------------------------------------- Average Share of Total lettuce Share ofState harvested US acreage disaster US lettuce acreage, payments, disaster 1988-93 1988-93 payments----------------------------------------------------------------
Acres Percent Dollars Percent
Arizona 52,350 21 260,810 3California 173,383 70 659,470 8Colorado 3,333 1 284,190 3Florida 7,250 3 129,800 2Michigan 697 0.3 2,608,250 32New Jersey 2,267 1 809,890 10New Mexico 2,200 1 233,570 3New York 2,200 1 1,703,950 21Ohio 1,160 0.5 492,000 6Texas 1,150 0.5 258,950 3Washington 1,333 0.5 363,965 4
U.S. 247,050 100 8,213,390 100----------------------------------------------------------------Source: ASCS data files, compiled by the General Accounting Office.
42
harvested area over the years 1988-93, and received 32 percent of all lettucedisaster payments. Michigan lettuce growers collected sizeable payments ineach of the 6 years; the minimum collected in any year in that state was$170,000. Likewise, New York accounted for 1 percent of harvested area, andreceived 21 percent of all lettuce disaster payments over the 6-year period.
These data suggest that the probability of yield loss in the Michigan-New Yorkarea is greater than in California and Arizona. Lettuce losses in Michiganwere attributed to drought in 1988 and wet, cool weather in 1992. A Michiganfarm advisor said that lettuce is too risky and that he does not recommend tothose interested in entering lettuce production that it be produced inMichigan. This risky production situation likely accounts for the dramaticdrop in Michigan and New York lettuce acreage in recent years (see Table 3). In contrast, yield risk in California seems very low.
Lettuce Insurance Implementation Issues
Multiple Harvests in the Growing Season
A major issue with a number of fresh vegetables, including lettuce, is thequestion of how to insure an extended-season crop for which the yields, risks,perils, and expected market prices may differ for different parts of theseason. Growers with extended seasons may be reluctant to purchase cropinsurance which only guarantees season-average yields because the severity oflosses during an interval within the season are concealed by averaging overthe season.
In some areas, lettuce growers schedule planting over a number of months inorder to ensure an extended harvest period. An insurable event that causessevere losses to a portion of the crop, however, may not qualify growers forindemnity payments because normal output for the remainder of the crop raisesthe season-average yield above the yield guarantee. In Florida, for example,it is not uncommon for a freeze or excessive rain to destroy nearly all thelettuce that would have been harvested during a portion of the season whilereducing the season-average yield by only 10 or 20 percent.
One method for dealing with this extended-season problem would be to definedistinct planting periods for intervals having more or less similar yieldexpectations and production risks and establish different premiums for eachperiod. With such a plan, growers would be more likely to qualify forindemnity payments when losses occurred to a part of their crop because lossesfor one planting period would not be off-set by normal yields during otherperiods.
Setting Reference Prices
FCIC provides a reference price (price election) for the insured crop whichbecomes the basis for assigning value (price guarantee) to yield losses. Theinsured grower elects a price guarantee, normally between 30 and 100 percentof the reference price. The reference price needs to be high enough toprovide reasonable protection for insuring farmers, but not so high that it
43
provides incentive for crop failure (moral hazard).
An appropriate reference price for lettuce may be a pre-harvest, or "in-field"price, because the grower does not bear the normal harvesting and marketingexpenses when a crop failure occurs. An in-field price is similar to the "on-tree" price which is used as a reference price in insuring tree crops. An in-field price may be obtained directly if a field market exists, but more likelya price would have to be calculated.
Two possible formulas for calculating "in-field" reference prices are: 1)actual market price minus estimated harvesting and marketing expenses, and 2)estimated total production expenses minus estimated harvesting and marketingexpenses. The market price refers to the "free-on-board" (fob) shipping-pointprice, not a retail price.
The market-price approach reflects the crop's value based on the potentialmarket returns, while the production-cost approach attempts to measure thevalue of production inputs. The market-price approach should result in alarger value than the production-expense approach in most years because itembodies grower returns for risk-bearing and management into the estimate ofin-field price. Because the market-price approach accounts for returns torisk and management, it may provide a more equitable measure of the economicloss from crop failure than the production-expense approach.
The data are readily available for computing in-field prices after the crophas been harvested and marketed. Weekly f.o.b. prices are reported by theU.S. Department of Agriculture's Market News Service and harvesting costs areeasily identifiable because harvesting and marketing are frequently contractedwith a shipper at a specified contract fee.
The production-expense approach, based on county-level data, is likely afeasible alternative for estimating in-field prices because productionpractices and expenses are fairly standard among farms within a county. County-level measures (such as representative enterprise budgets) may providea reasonable approximation of the costs for production inputs such as seed,fertilizer, chemicals, and labor.
FCIC would need projections of the in-field price prior to the season in orderfor growers to make a price selection at the time they sign up for insurance. The USDA does not project lettuce prices. One method for projecting a lettuceprice is to calculate an average for a recent period (perhaps 5 or 10 years). Using an average price to project in-field value, however, will almostcertainly result in a figure which, during some periods within the season, issubstantially higher than the actual value of the crop. At times during theseason, when there is a glut of lettuce on the market, the actual in-fieldvalue may fall to zero (the market price falls so low that "you can't give afield away"). If the projected in-field value were higher than the actualvalue of the crop, growers with crop insurance may have an economic incentivefor a crop loss, thus raising concern about moral hazard.
Actual Production History
44
The actual production history (APH) for insured farmers is established fromtheir production records over the past 4-10 years. But, in the lettuceindustry, the rate of harvest is closely related to market conditions, and production per planted acre varies more than if yield fluctuations were causedby natural conditions alone. If market prices fall below the costs forharvesting and marketing when lettuce is mature, the crop may be abandoned foreconomic reasons. Economic abandonment occurs because the grower incurs asmaller loss by abandoning the crop than by harvesting and selling. When themarket price is just slightly above the harvesting and marketing costs,growers may harvest selectively--recovering only that portion of the crop withthe best market quality.
Low harvest rates caused by a weak market (either for a year or for continuousyears) would lower the APH yield. Since a farmer's APH yields may not reflectyield risk, APH yields may not be a satisfactory basis for classifying farmsand setting insurance rates. APH yields also may not work well in settingcoverage levels. With a low production history, caused by a weak market, asituation may arise where 75 percent of the APH (the maximum guarantee whichgrowers may currently insure) does not provide an adequate productionguarantee. This could discourage growers from participating in cropinsurance.
Estimating "Appraised Production"
There is no widely accepted method for estimating appraised production forlettuce. Under typical price conditions, it is possible to make a pretty goodestimate of lettuce yield by knowing the number of plants with marketableheads. The reason for this is that packing 24 heads per carton is thestandard in the lettuce industry. Usually lettuce that is too small to fill acarton with 24 heads is discarded, though if prices are high enough, smallerheads may be packed 30 per carton. An experienced grower reportedly can lookat a field and judge the yield within a few cartons by observing theuniformity of the stand and the condition of the heads.
Modification of two methods used for fresh market tomatoes may provide aworkable procedure for an insurance adjuster to estimate an in-field lettuceyield. The modified procedure consists of: 1) estimating the number ofsurviving plants per acre on the basis of row samples, 2) multiplying thenumber of surviving plants by an average percentage of marketable heads, and3) converting to cartons per acre using 24 heads per carton.
A schedule of average percentage marketable heads would be needed fordifferent production areas because the percentage may be quite different fromone area to another. For example, in California's Salinas Valley, whereyields may average 800 cartons an acre, the packout percentage would be higherthan in the Imperial Valley, where average yields of 500 to 600 are moretypical.

45
Insuring Price Risks
Contacts in virtually all production areas cited market risks as the lettucegrower's greatest peril. Growers, they report, can manage insect and diseaserisks by following prudent pest management practices and can generally dealwith weather-related losses because usually only a part of the season's cropis damaged by natural perils. The situation which growers seem to have thehardest time dealing with is, having produced a perfectly good yield, to sellat less than their cost of production or even to abandon part or all of thecrop because of low market prices. To make crop insurance attractive tolettuce growers, especially in California, Arizona, and perhaps some otherareas where natural risks are at a minimum, a policy may have to contain anelement of protection against the risks of low market prices. A revenueinsurance plan may provide such protection.
With a revenue insurance plan, lettuce growers could insure against incomefalling below some guaranteed minimum, regardless of whether the cause was lowyield, low prices, or a combination of both. Such an insurance plan couldprovide a measure of market-risk protection, while at the same time avoiding indemnity payments to growers who, despite low yields, had a good returnbecause of high market prices.
Moral Hazard
There is potential for moral hazard in a lettuce insurance policy since thesituation frequently arises where, because of low market prices, an indemnitypayment would be higher than the net return from harvesting a crop. As apractical matter, however, moral hazard does not appear likely to be a majorproblem. In order for moral hazard to arise, a yield loss would need to bedue to some contributing action or lack of action (such as neglecting pestcontrol practices) on the part of the grower. Such grower-induced losses arenot likely to occur because the major perils in lettuce production areweather-related over which the grower has no influence.
Yield losses to insects and diseases could occur if a grower neglected tofollow prudent pest management practices. It is unlikely that a grower wouldneglect proper pest management in order to collect an insurance indemnity,however, because a pest buildup may be difficult to eradicate and create aperil for future crops when market prices may be higher. In addition, cropinsurance for lettuce may not need to include indemnification for insect anddisease losses because growers generally view these perils as manageableproblems with currently available control methods.
Micro-Climates and Adverse Selection
Variations in micro-climates within production areas could result in differentlettuce growers facing substantially different risks, raising the possibilityof problems with adverse selection. In Monterey County, California, forinstance, the Salinas Valley opens to the sea at Monterey Bay and extendsinland for 50 miles or more. The prevailing ocean winds produce an almostideal climate for lettuce during the summer near the northern end of theValley. The effects of the cool ocean breezes diminish, however, as the
46
distance from the sea increases. Lettuce further from the ocean harvestedduring the hottest part of the summer is more likely to suffer a yield lossdue to excessive heat than lettuce planted within 15 miles of the ocean. Consequently, growers further from the ocean would have an increased chance ofincurring a crop loss during mid-summer.
Individual Yield Data
The Iceberg Lettuce Advisory Board finances lettuce research from assessmentson its growers based on total cartons or carton equivalents sold. The Boarddoes not have any record of acreages, however, from which individual growers'per acre yields could be calculated (Kurtz). Nevertheless, the larger growersin California and Arizona reportedly keep detailed production records andcould derive a yield history for their own operations.
47
References
Carter, Colin A., D. Hueth, J. Mamer and A. Schmitz. Labor Strikes and GrowerReturns. Working Paper No. 83. Department of Agricultural and ResourceEconomics, University of California, Berkeley.
Ellerbrock, Roy. Cornell University Agricultural Extension Service. Personalcommunication. April 4, 1994.
Ellis, James. Department of Horticulture, Colorado State University. Personal communication. March 1994.
Gastier, Ted. Ohio State University Cooperative Extension Service. HuronCounty, Ohio. Personal Communication. April 4, 1994.
Gomez, Ricardo, E., and Joe N. Corgan. Spring Lettuce in Southern New Mexico. New Mexico State University Cooperative Extension Service. Guide 400 H212. April 1973.
__________. Fall Lettuce for Southern New Mexico. New Mexico StateUniversity Cooperative Extension Service. Guide 400 H213. April 1973.
George, P. S. and G. A. King. Consumer Demand for Food Commodities in theUnited States with Projections 1980. Giannini Foundation Monograph No. 26,March 1976.
Huang, K., R. C. Haidacher. "Estimation of a Composite Food Demand System forthe United States," Journal of Business and Economic Statistics. 1983, pp.285-91.
Jagger, I. C. and N. Chandler. "Big Vein, A disease of Lettuce."Phytopathology. 24:, 1934. pp.1253-56.
Kern County Water Agency. Water Supply Report, 1989. Kern County California. May 1990.
Kratky, B. A. and R. T. Nakano. Protecting Lettuce Plants from PreemergenceHerbicide Damage. University of Hawaii, Research-Extension Series 001.October 1980.
Kurtz, Ed. Iceberg Lettuce Advisory Board. Salinas, CA. Personalcommunication. May 5, 1994.
Mayberry, Keith. Lettuce Production in the Imperial Valley. University ofCalifornia Agricultural Extension Circular 135. November 1972.
__________. Cooperative Extension Service, Imperial County, California. Personal Communication. March 1994.
48
__________. Cooperative Extension Service, Imperial County, California. Personal Communication. April 29, 1994.
Moore, C. V. and J. H. Snyder. Risk and Uncertainty in Lettuce Production InSalinas Valley, California. Giannini Foundation Research Report No. 300. California Agricultural Experiment Station, Giannini Foundation ofAgricultural Economics. January 1969.
Nonnecke, Ib Libner. Vegetable Production. Van Nostrand Reinhold:New York. 1989.
Reiners, S. Department of Horticulture, Rutgers University. PersonalCommunication. April 1994.
Schaffner, David. Structure of the California Lettuce Industry. Ph.D.Dissertation. University of California, Berkeley. 1979.
Schueneman, Tom. Vegetable Extension Agent. Palm Beach county, Florida. Personal Communication. April 1994.
State of California. California Agricultural Commissioners' Report. Variousissues.
Thompson, R.C. Lettuce Varieties and Culture. U.S. Dept. Agr. Farmers' Bul.1953. 42 pp. (Revised) 1935.
U.S. Department of Agriculture. Agricultural Marketing Service. Unpublishedprice data.
U.S. Department of Agriculture. Agricultural Marketing Service. FreshFruits, Vegetables and Ornamental Crops Weekly Summary-Shipments and Arrivals. various issues.
U.S. Department of Agriculture. Agricultural Research Service. LettuceProduction in the United States. Agricultural Handbook No. 221. 1974.
U.S. Department of Agriculture. Agricultural Stabilization and ConservationService. Disaster Assistance Data Files, 1988-93. Compiled by the GeneralAccounting Office.
U.S. Department of Agriculture. California Agricultural Statistics Service. County-level data on lettuce acreage, production, and other variables. Various years.
U.S. Department of Agriculture. Florida Agricultural Statistics Service. Annual reports.
U.S. Department of Agriculture. Federal Crop Insurance Corporation. Specialparticipation analyses (Dan Orr). 1994.
49
U.S. Department of Agriculture. National Agricultural Statistics Service. Agricultural Chemical Usage, Vegetables, 1992 Summary. Ag Ch 1(93). June1993.
__________. Vegetables. Annual Summaries.
U.S. Department of Agriculture. Statistical Reporting Service. UsualPlanting and Harvesting Dates for Fresh Market and Processing Vegetables.Agricultural Handbook No. 507. February 1977.
U.S. Department of Commerce. Bureau of the Census. Export and import datafiles. Various years.
U.S. Department of Commerce. Census of Agriculture, 1987. (Including specialruns requested by USDA/ERS.)
University of California. Co-operative Extension Service. Cost of Productionbudgets. Various years.
Vargas, Javier. Dona Ana County Cooperative Extension Service, New MexicoSate University. Personal communication. March 30, 1994.
Veihmeyer, F. J., and A. H. Holland. Irrigation and Cultivation of Lettuce. Calif. Agr. Exp. Sta. Bul. 711. 1948.
Wohlgenant, Michael. "Demand for Farm Output in a Complete System of DemandFunctions," American Journal of Agricultural Economics. Vol. 71. pp. 241-252. 1989.
Yamaguchi, Mas. World Vegetables: Principles, Production, and NutritiveValues. An AVI Book Published by Van Nostrand Reinhold.
Zahara, M, S. S. Johnson, and R. E. Garrett. "Labor Requirements, HarvestCosts, and the Potential for Mechanical Harvest of lettuce," Journal of theAmerican Society for Horticultural Science. 99:6, November 1974. pp.535-37.
Zandstra, Bernie. Michigan State University Horticulture Department. Personal communication. May 24, 1994.
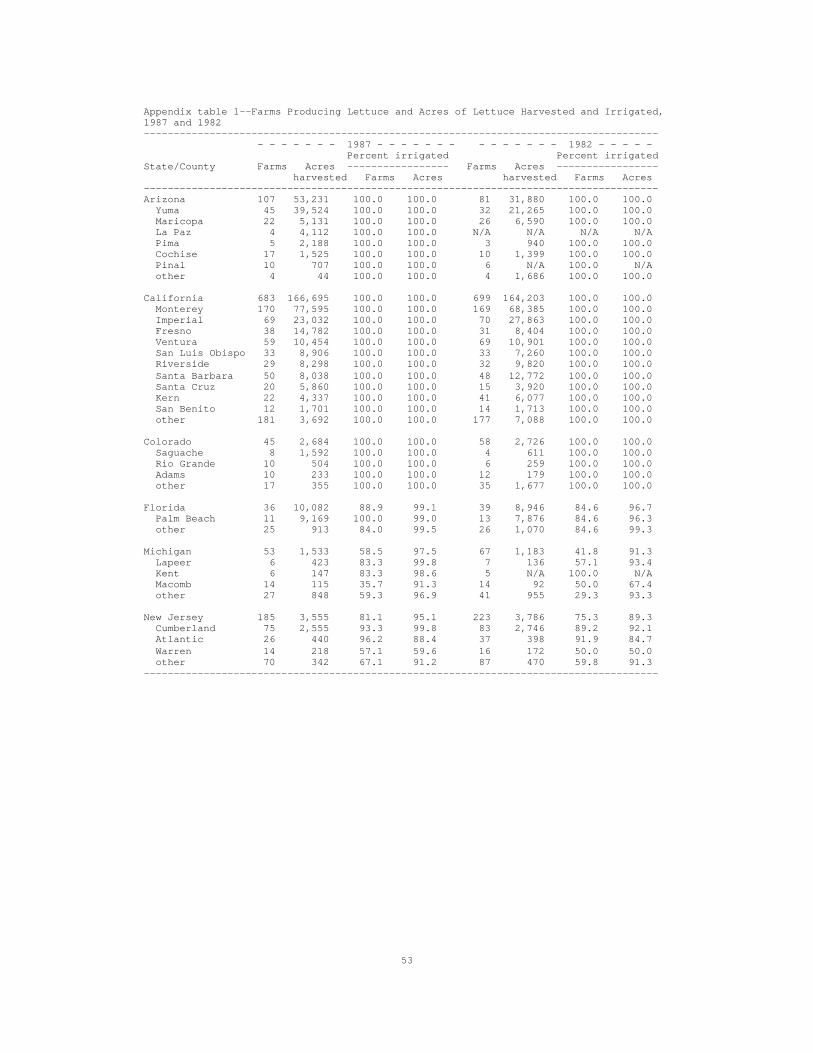
53
Appendix table 1--Farms Producing Lettuce and Acres of Lettuce Harvested and Irrigated, 1987 and 1982-------------------------------------------------------------------------------------- - - - - - - - 1987 - - - - - - - - - - - - - - 1982 - - - - - Percent irrigated Percent irrigatedState/County Farms Acres ----------------- Farms Acres ----------------- harvested Farms Acres harvested Farms Acres--------------------------------------------------------------------------------------Arizona 107 53,231 100.0 100.0 81 31,880 100.0 100.0 Yuma 45 39,524 100.0 100.0 32 21,265 100.0 100.0 Maricopa 22 5,131 100.0 100.0 26 6,590 100.0 100.0 La Paz 4 4,112 100.0 100.0 N/A N/A N/A N/A Pima 5 2,188 100.0 100.0 3 940 100.0 100.0 Cochise 17 1,525 100.0 100.0 10 1,399 100.0 100.0 Pinal 10 707 100.0 100.0 6 N/A 100.0 N/A other 4 44 100.0 100.0 4 1,686 100.0 100.0
California 683 166,695 100.0 100.0 699 164,203 100.0 100.0 Monterey 170 77,595 100.0 100.0 169 68,385 100.0 100.0 Imperial 69 23,032 100.0 100.0 70 27,863 100.0 100.0 Fresno 38 14,782 100.0 100.0 31 8,404 100.0 100.0 Ventura 59 10,454 100.0 100.0 69 10,901 100.0 100.0 San Luis Obispo 33 8,906 100.0 100.0 33 7,260 100.0 100.0 Riverside 29 8,298 100.0 100.0 32 9,820 100.0 100.0 Santa Barbara 50 8,038 100.0 100.0 48 12,772 100.0 100.0 Santa Cruz 20 5,860 100.0 100.0 15 3,920 100.0 100.0 Kern 22 4,337 100.0 100.0 41 6,077 100.0 100.0 San Benito 12 1,701 100.0 100.0 14 1,713 100.0 100.0 other 181 3,692 100.0 100.0 177 7,088 100.0 100.0
Colorado 45 2,684 100.0 100.0 58 2,726 100.0 100.0 Saguache 8 1,592 100.0 100.0 4 611 100.0 100.0 Rio Grande 10 504 100.0 100.0 6 259 100.0 100.0 Adams 10 233 100.0 100.0 12 179 100.0 100.0 other 17 355 100.0 100.0 35 1,677 100.0 100.0
Florida 36 10,082 88.9 99.1 39 8,946 84.6 96.7 Palm Beach 11 9,169 100.0 99.0 13 7,876 84.6 96.3 other 25 913 84.0 99.5 26 1,070 84.6 99.3
Michigan 53 1,533 58.5 97.5 67 1,183 41.8 91.3 Lapeer 6 423 83.3 99.8 7 136 57.1 93.4 Kent 6 147 83.3 98.6 5 N/A 100.0 N/A Macomb 14 115 35.7 91.3 14 92 50.0 67.4 other 27 848 59.3 96.9 41 955 29.3 93.3
New Jersey 185 3,555 81.1 95.1 223 3,786 75.3 89.3 Cumberland 75 2,555 93.3 99.8 83 2,746 89.2 92.1 Atlantic 26 440 96.2 88.4 37 398 91.9 84.7 Warren 14 218 57.1 59.6 16 172 50.0 50.0 other 70 342 67.1 91.2 87 470 59.8 91.3--------------------------------------------------------------------------------------
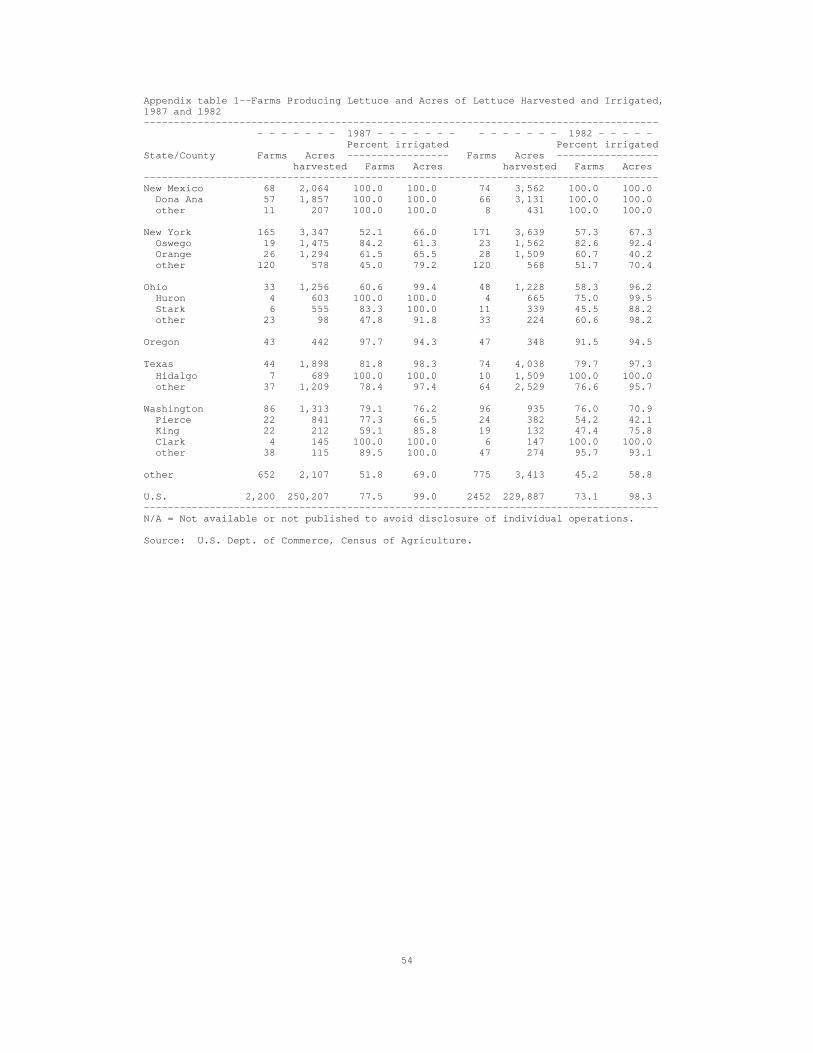
54
Appendix table 1--Farms Producing Lettuce and Acres of Lettuce Harvested and Irrigated, 1987 and 1982-------------------------------------------------------------------------------------- - - - - - - - 1987 - - - - - - - - - - - - - - 1982 - - - - - Percent irrigated Percent irrigatedState/County Farms Acres ----------------- Farms Acres ----------------- harvested Farms Acres harvested Farms Acres--------------------------------------------------------------------------------------New Mexico 68 2,064 100.0 100.0 74 3,562 100.0 100.0 Dona Ana 57 1,857 100.0 100.0 66 3,131 100.0 100.0 other 11 207 100.0 100.0 8 431 100.0 100.0
New York 165 3,347 52.1 66.0 171 3,639 57.3 67.3 Oswego 19 1,475 84.2 61.3 23 1,562 82.6 92.4 Orange 26 1,294 61.5 65.5 28 1,509 60.7 40.2 other 120 578 45.0 79.2 120 568 51.7 70.4
Ohio 33 1,256 60.6 99.4 48 1,228 58.3 96.2 Huron 4 603 100.0 100.0 4 665 75.0 99.5 Stark 6 555 83.3 100.0 11 339 45.5 88.2 other 23 98 47.8 91.8 33 224 60.6 98.2
Oregon 43 442 97.7 94.3 47 348 91.5 94.5
Texas 44 1,898 81.8 98.3 74 4,038 79.7 97.3 Hidalgo 7 689 100.0 100.0 10 1,509 100.0 100.0 other 37 1,209 78.4 97.4 64 2,529 76.6 95.7
Washington 86 1,313 79.1 76.2 96 935 76.0 70.9 Pierce 22 841 77.3 66.5 24 382 54.2 42.1 King 22 212 59.1 85.8 19 132 47.4 75.8 Clark 4 145 100.0 100.0 6 147 100.0 100.0 other 38 115 89.5 100.0 47 274 95.7 93.1
other 652 2,107 51.8 69.0 775 3,413 45.2 58.8
U.S. 2,200 250,207 77.5 99.0 2452 229,887 73.1 98.3--------------------------------------------------------------------------------------N/A = Not available or not published to avoid disclosure of individual operations.
Source: U.S. Dept. of Commerce, Census of Agriculture.
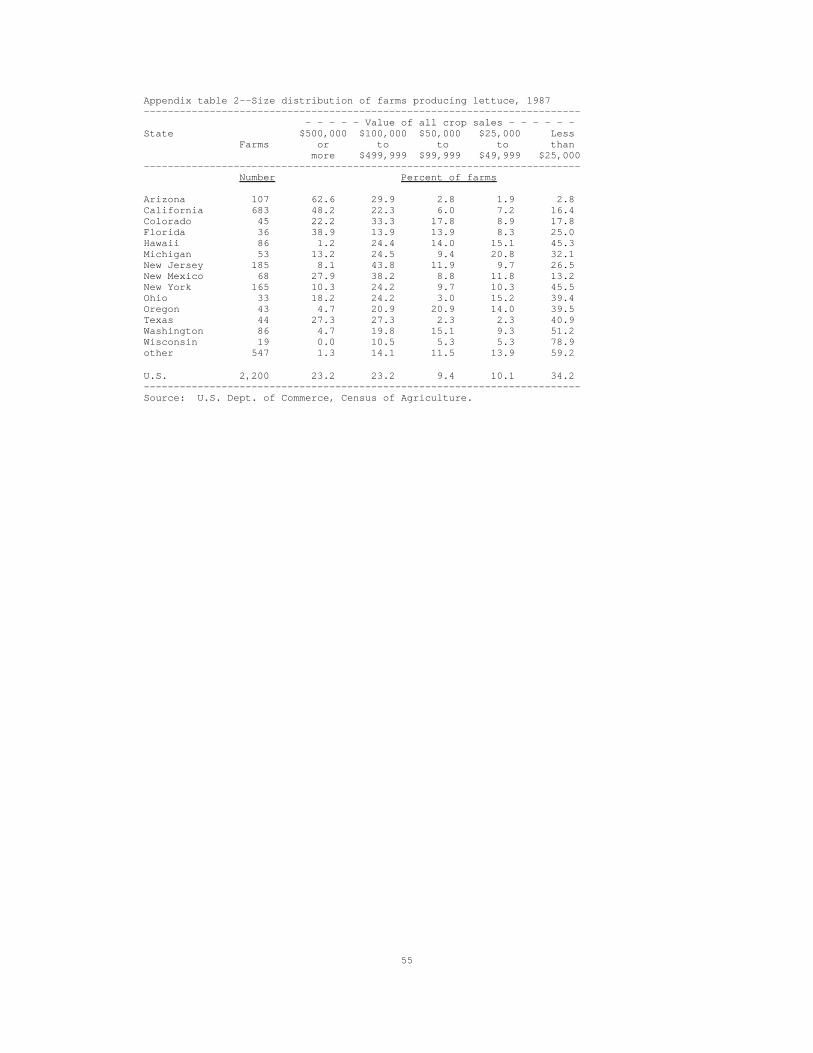
55
Appendix table 2--Size distribution of farms producing lettuce, 1987------------------------------------------------------------------------- - - - - - Value of all crop sales - - - - - -State $500,000 $100,000 $50,000 $25,000 Less Farms or to to to than more $499,999 $99,999 $49,999 $25,000------------------------------------------------------------------------- Number Percent of farms
Arizona 107 62.6 29.9 2.8 1.9 2.8California 683 48.2 22.3 6.0 7.2 16.4Colorado 45 22.2 33.3 17.8 8.9 17.8Florida 36 38.9 13.9 13.9 8.3 25.0Hawaii 86 1.2 24.4 14.0 15.1 45.3Michigan 53 13.2 24.5 9.4 20.8 32.1New Jersey 185 8.1 43.8 11.9 9.7 26.5New Mexico 68 27.9 38.2 8.8 11.8 13.2New York 165 10.3 24.2 9.7 10.3 45.5Ohio 33 18.2 24.2 3.0 15.2 39.4Oregon 43 4.7 20.9 20.9 14.0 39.5Texas 44 27.3 27.3 2.3 2.3 40.9Washington 86 4.7 19.8 15.1 9.3 51.2Wisconsin 19 0.0 10.5 5.3 5.3 78.9other 547 1.3 14.1 11.5 13.9 59.2
U.S. 2,200 23.2 23.2 9.4 10.1 34.2-------------------------------------------------------------------------Source: U.S. Dept. of Commerce, Census of Agriculture.
56
Appendix table 3--LETTUCE: Organizational type of farms, by sales class, 1987 Total value of crop sales Organizational All $500,000 $100,000 $50,000 $25,000 Less type farms or to to to than more $499,999 $99,999 $49,999 $25,000 -----------------Number of farms----------------Individual or family Arizona 40 17 18 2 0 3 California 320 72 90 26 38 94 Colorado 32 5 13 4 3 7 Florida 16 0 3 3 3 7 Hawaii 65 0 14 9 10 32 Michigan 35 0 7 3 9 16 New Jersey 128 3 51 12 15 47 New Mexico 44 9 15 6 5 9 New York 106 4 12 14 14 62 Ohio 23 0 5 1 4 13 Oregon 27 2 2 6 4 13 Texas 26 3 4 0 1 18 Washington 67 2 9 9 5 42 Wisconsin 15 0 1 1 0 13 Other States 426 2 40 42 56 286 United States 1,370 119 284 138 167 662
Partnership Arizona 28 19 9 0 0 0 California 192 125 32 10 7 18 Colorado 7 1 1 3 1 1 Florida 2 2 0 0 0 0 Hawaii 6 0 2 2 0 2 Michigan 9 3 2 1 2 1 New Jersey 29 4 17 6 1 1 New Mexico 10 3 4 0 3 New York 32 4 17 2 1 8 Ohio 2 1 1 0 0 0 Oregon 8 0 3 2 2 1 Texas 5 3 1 1 0 0 Washington 9 0 4 0 3 2 Wisconsin 4 0 1 0 1 2 Other States 77 0 26 14 10 27 United States 420 165 120 41 31 63
Corporation Family held Arizona 25 20 3 1 1 0 California 144 115 26 1 2 0 Colorado 6 4 1 1 0 0 Florida 12 9 1 0 0 2 Hawaii 11 1 4 1 3 2 Michigan 9 4 4 1 0 0 New Jersey 27 8 13 4 2 0 New Mexico 14 7 7 0 0 0 New York 25 9 11 0 2 3 Ohio 7 5 2 0 0 0 Oregon 5 0 4 1 0 0 Texas 7 4 3 0 0 0 Washington 10 2 4 4 0 0 Wisconsin 0 0 0 0 0 0 Other States 33 5 11 7 5 5 United States 335 193 94 21 15 12 continued
57
Appendix table 3--LETTUCE: Organizational type of farms, by sales class, 1987 continued Total value of crop sales Organizational All $500,000 $100,000 $50,000 $25,000 Less type farms or to to to than more $499,999 $99,999 $49,999 $25,000 -----------------Number of farms---------------- Corporation Other than family held Arizona 8 6 2 0 0 0 California 20 14 3 1 2 0 Colorado 0 0 0 0 0 0 Florida 5 3 0 2 0 0 Hawaii 0 0 0 0 0 0 Michigan 0 0 0 0 0 0 New Jersey 0 0 0 0 0 0 New Mexico 0 0 0 0 0 0 New York 1 0 0 0 0 1 Ohio 0 0 0 0 0 0 Oregon 1 0 0 0 0 1 Texas 1 1 0 0 0 0 Washington 0 0 0 0 0 0 Wisconsin 0 0 0 0 0 0 Other States 6 0 0 0 3 3 United States 42 24 5 3 5 5
Other Arizona 6 5 0 0 1 0 California 7 3 1 3 0 0 Colorado 0 0 0 0 0 0 Florida 1 0 1 0 0 0 Hawaii 4 0 1 0 0 3 Michigan 0 0 0 0 0 0 New Jersey 1 0 0 0 0 1 New Mexico 0 0 0 0 0 0 New York 1 0 0 0 0 1 Ohio 1 0 0 0 1 0 Oregon 2 0 0 0 0 2 Texas 5 1 4 0 0 0 Washington 0 0 0 0 0 0 Wisconsin 0 0 0 0 0 0 Other States 5 0 0 0 2 3 United States 33 9 7 3 4 10
Source: 1987 U.S. Census of Agriculture.
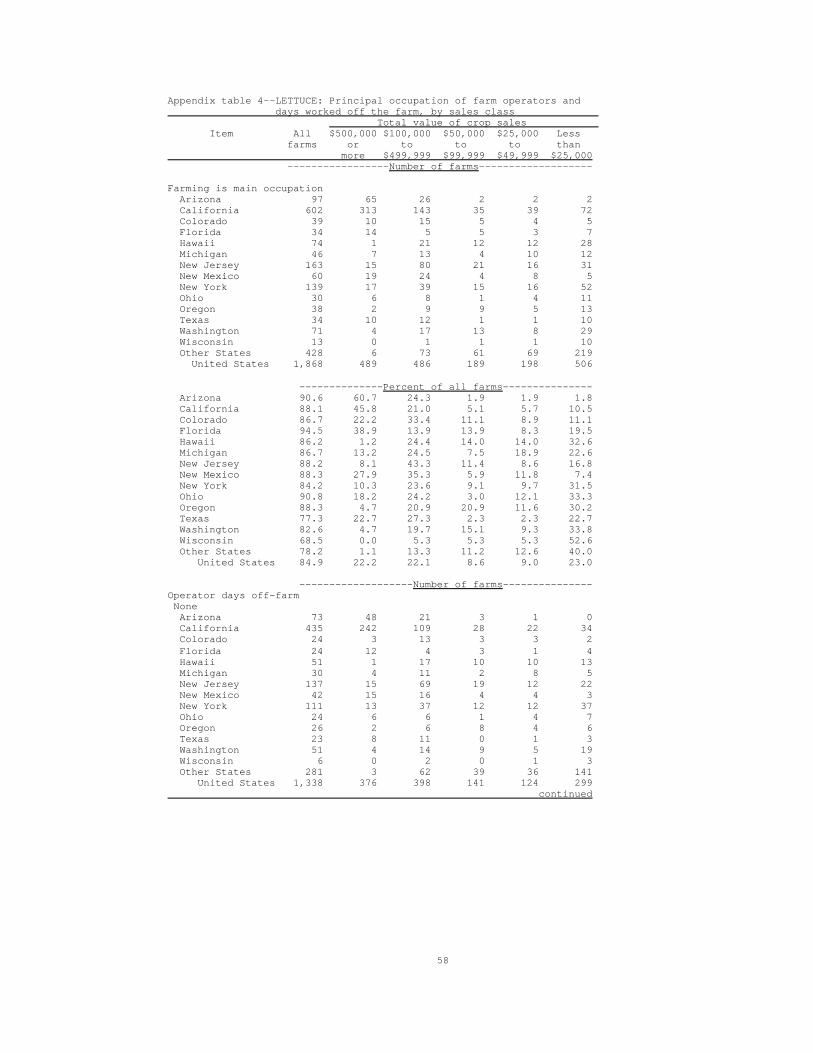
58
Appendix table 4--LETTUCE: Principal occupation of farm operators and days worked off the farm, by sales class Total value of crop sales Item All $500,000 $100,000 $50,000 $25,000 Less farms or to to to than more $499,999 $99,999 $49,999 $25,000 -----------------Number of farms-------------------
Farming is main occupation Arizona 97 65 26 2 2 2 California 602 313 143 35 39 72 Colorado 39 10 15 5 4 5 Florida 34 14 5 5 3 7 Hawaii 74 1 21 12 12 28 Michigan 46 7 13 4 10 12 New Jersey 163 15 80 21 16 31 New Mexico 60 19 24 4 8 5 New York 139 17 39 15 16 52 Ohio 30 6 8 1 4 11 Oregon 38 2 9 9 5 13 Texas 34 10 12 1 1 10 Washington 71 4 17 13 8 29 Wisconsin 13 0 1 1 1 10 Other States 428 6 73 61 69 219 United States 1,868 489 486 189 198 506
--------------Percent of all farms--------------- Arizona 90.6 60.7 24.3 1.9 1.9 1.8 California 88.1 45.8 21.0 5.1 5.7 10.5 Colorado 86.7 22.2 33.4 11.1 8.9 11.1 Florida 94.5 38.9 13.9 13.9 8.3 19.5 Hawaii 86.2 1.2 24.4 14.0 14.0 32.6 Michigan 86.7 13.2 24.5 7.5 18.9 22.6 New Jersey 88.2 8.1 43.3 11.4 8.6 16.8 New Mexico 88.3 27.9 35.3 5.9 11.8 7.4 New York 84.2 10.3 23.6 9.1 9.7 31.5 Ohio 90.8 18.2 24.2 3.0 12.1 33.3 Oregon 88.3 4.7 20.9 20.9 11.6 30.2 Texas 77.3 22.7 27.3 2.3 2.3 22.7 Washington 82.6 4.7 19.7 15.1 9.3 33.8 Wisconsin 68.5 0.0 5.3 5.3 5.3 52.6 Other States 78.2 1.1 13.3 11.2 12.6 40.0 United States 84.9 22.2 22.1 8.6 9.0 23.0
-------------------Number of farms---------------Operator days off-farm None Arizona 73 48 21 3 1 0 California 435 242 109 28 22 34 Colorado 24 3 13 3 3 2 Florida 24 12 4 3 1 4 Hawaii 51 1 17 10 10 13 Michigan 30 4 11 2 8 5 New Jersey 137 15 69 19 12 22 New Mexico 42 15 16 4 4 3 New York 111 13 37 12 12 37 Ohio 24 6 6 1 4 7 Oregon 26 2 6 8 4 6 Texas 23 8 11 0 1 3 Washington 51 4 14 9 5 19 Wisconsin 6 0 2 0 1 3 Other States 281 3 62 39 36 141 United States 1,338 376 398 141 124 299 continued
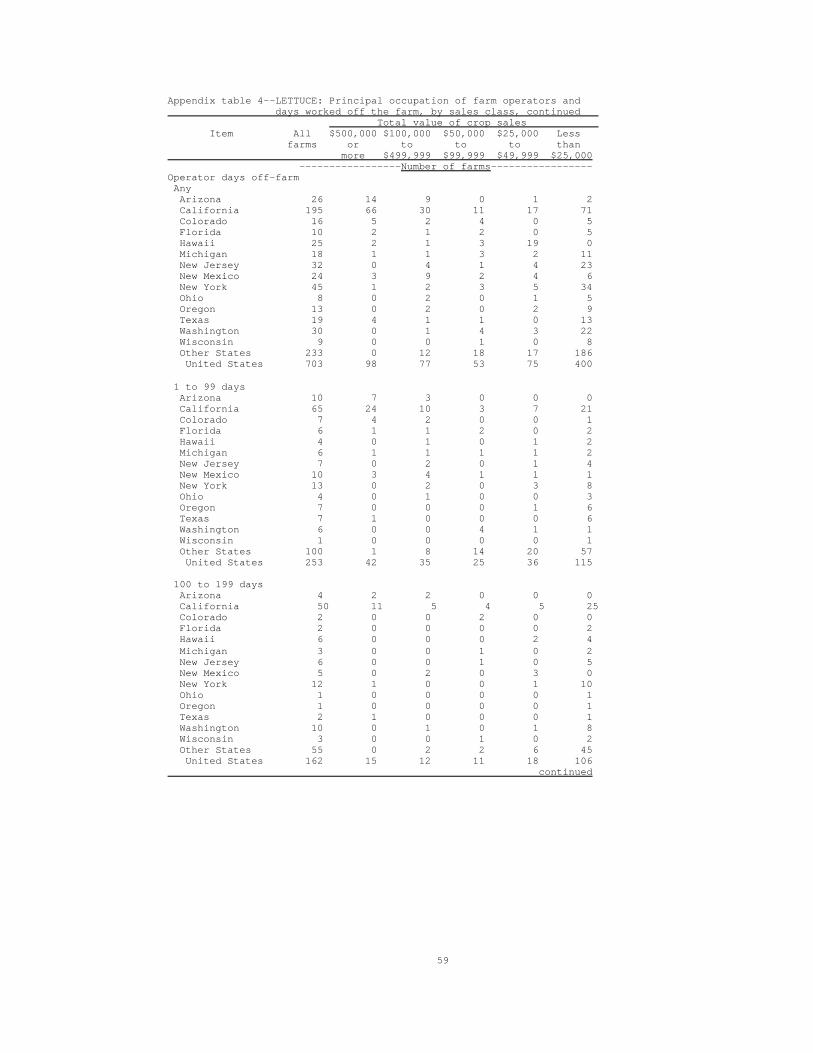
59
Appendix table 4--LETTUCE: Principal occupation of farm operators and days worked off the farm, by sales class, continued Total value of crop sales Item All $500,000 $100,000 $50,000 $25,000 Less farms or to to to than more $499,999 $99,999 $49,999 $25,000 -----------------Number of farms-----------------Operator days off-farm Any Arizona 26 14 9 0 1 2 California 195 66 30 11 17 71 Colorado 16 5 2 4 0 5 Florida 10 2 1 2 0 5 Hawaii 25 2 1 3 19 0 Michigan 18 1 1 3 2 11 New Jersey 32 0 4 1 4 23 New Mexico 24 3 9 2 4 6 New York 45 1 2 3 5 34 Ohio 8 0 2 0 1 5 Oregon 13 0 2 0 2 9 Texas 19 4 1 1 0 13 Washington 30 0 1 4 3 22 Wisconsin 9 0 0 1 0 8 Other States 233 0 12 18 17 186 United States 703 98 77 53 75 400
1 to 99 days Arizona 10 7 3 0 0 0 California 65 24 10 3 7 21 Colorado 7 4 2 0 0 1 Florida 6 1 1 2 0 2 Hawaii 4 0 1 0 1 2 Michigan 6 1 1 1 1 2 New Jersey 7 0 2 0 1 4 New Mexico 10 3 4 1 1 1 New York 13 0 2 0 3 8 Ohio 4 0 1 0 0 3 Oregon 7 0 0 0 1 6 Texas 7 1 0 0 0 6 Washington 6 0 0 4 1 1 Wisconsin 1 0 0 0 0 1 Other States 100 1 8 14 20 57 United States 253 42 35 25 36 115
100 to 199 days Arizona 4 2 2 0 0 0 California 50 11 5 4 5 25 Colorado 2 0 0 2 0 0 Florida 2 0 0 0 0 2 Hawaii 6 0 0 0 2 4 Michigan 3 0 0 1 0 2 New Jersey 6 0 0 1 0 5 New Mexico 5 0 2 0 3 0 New York 12 1 0 0 1 10 Ohio 1 0 0 0 0 1 Oregon 1 0 0 0 0 1 Texas 2 1 0 0 0 1 Washington 10 0 1 0 1 8 Wisconsin 3 0 0 1 0 2 Other States 55 0 2 2 6 45 United States 162 15 12 11 18 106 continued
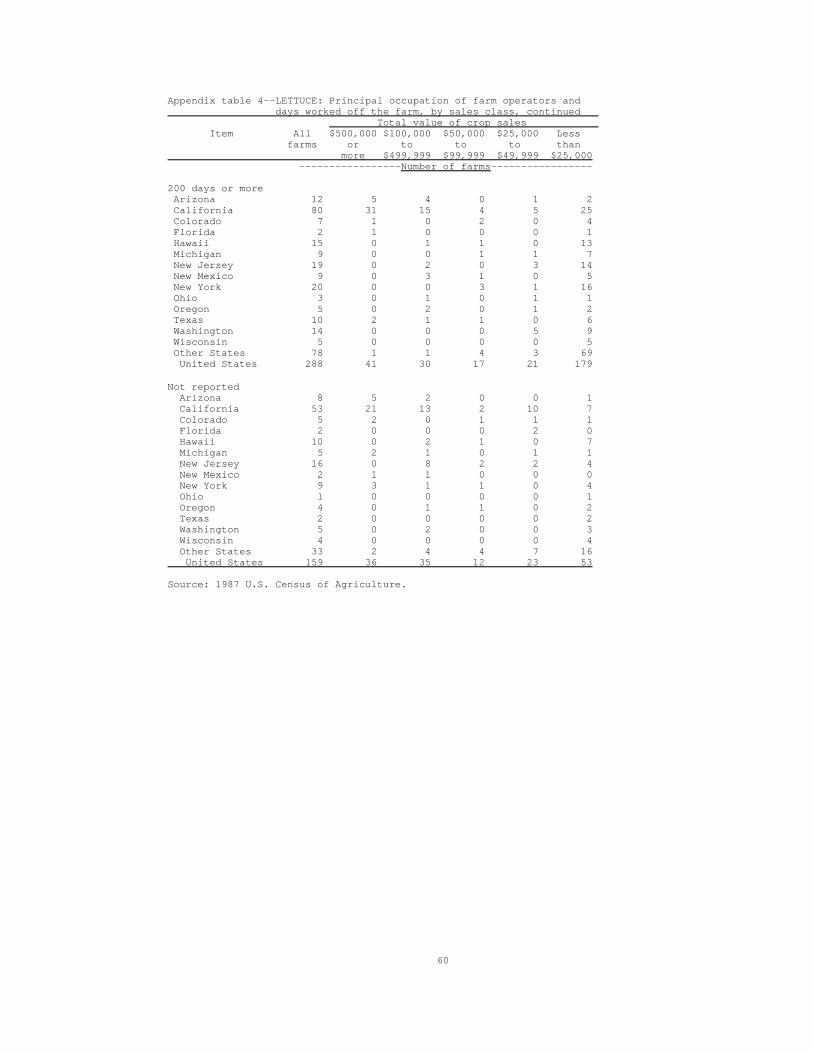
60
Appendix table 4--LETTUCE: Principal occupation of farm operators and days worked off the farm, by sales class, continued Total value of crop sales Item All $500,000 $100,000 $50,000 $25,000 Less farms or to to to than more $499,999 $99,999 $49,999 $25,000 -----------------Number of farms-----------------
200 days or more Arizona 12 5 4 0 1 2 California 80 31 15 4 5 25 Colorado 7 1 0 2 0 4 Florida 2 1 0 0 0 1 Hawaii 15 0 1 1 0 13 Michigan 9 0 0 1 1 7 New Jersey 19 0 2 0 3 14 New Mexico 9 0 3 1 0 5 New York 20 0 0 3 1 16 Ohio 3 0 1 0 1 1 Oregon 5 0 2 0 1 2 Texas 10 2 1 1 0 6 Washington 14 0 0 0 5 9 Wisconsin 5 0 0 0 0 5 Other States 78 1 1 4 3 69 United States 288 41 30 17 21 179
Not reported Arizona 8 5 2 0 0 1 California 53 21 13 2 10 7 Colorado 5 2 0 1 1 1 Florida 2 0 0 0 2 0 Hawaii 10 0 2 1 0 7 Michigan 5 2 1 0 1 1 New Jersey 16 0 8 2 2 4 New Mexico 2 1 1 0 0 0 New York 9 3 1 1 0 4 Ohio 1 0 0 0 0 1 Oregon 4 0 1 1 0 2 Texas 2 0 0 0 0 2 Washington 5 0 2 0 0 3 Wisconsin 4 0 0 0 0 4 Other States 33 2 4 4 7 16 United States 159 36 35 12 23 53
Source: 1987 U.S. Census of Agriculture.
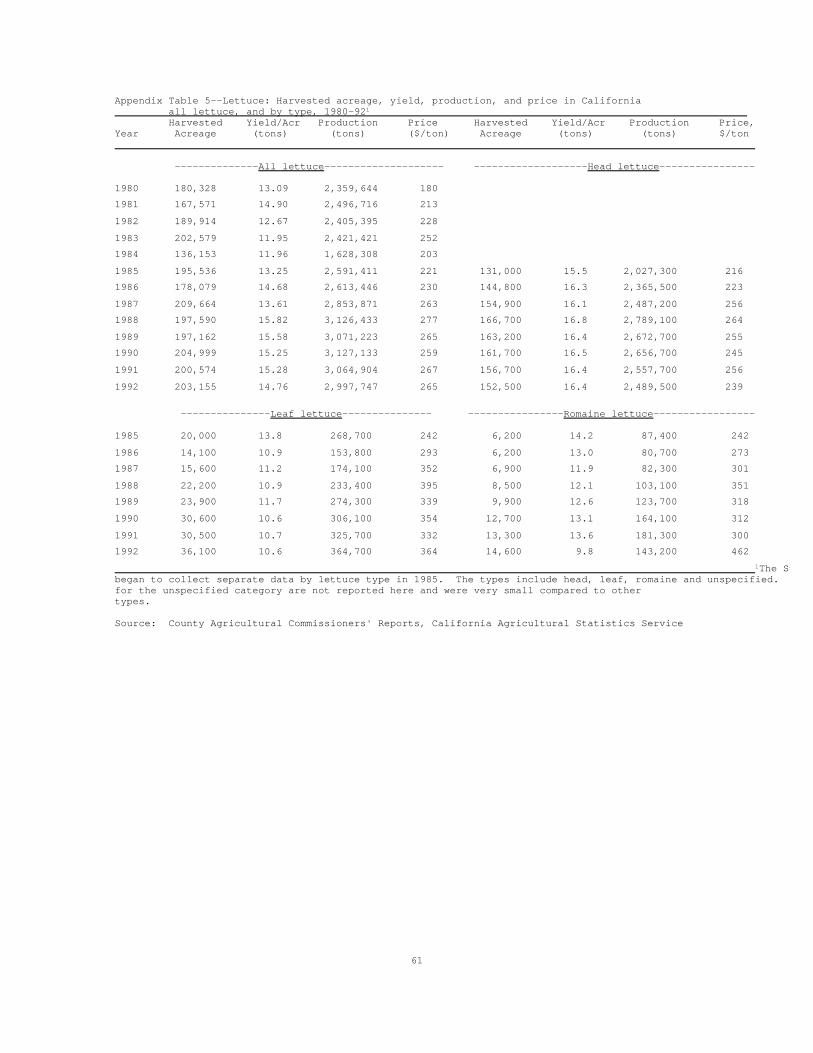
61
Appendix Table 5--Lettuce: Harvested acreage, yield, production, and price in California all lettuce, and by type, 1980-921 Harvested Yield/Acr Production Price Harvested Yield/Acr Production Price,Year Acreage (tons) (tons) ($/ton) Acreage (tons) (tons) $/ton
--------------All lettuce-------------------- -------------------Head lettuce----------------
1980 180,328 13.09 2,359,644 180
1981 167,571 14.90 2,496,716 213
1982 189,914 12.67 2,405,395 228
1983 202,579 11.95 2,421,421 252
1984 136,153 11.96 1,628,308 203
1985 195,536 13.25 2,591,411 221 131,000 15.5 2,027,300 216
1986 178,079 14.68 2,613,446 230 144,800 16.3 2,365,500 223
1987 209,664 13.61 2,853,871 263 154,900 16.1 2,487,200 256
1988 197,590 15.82 3,126,433 277 166,700 16.8 2,789,100 264
1989 197,162 15.58 3,071,223 265 163,200 16.4 2,672,700 255
1990 204,999 15.25 3,127,133 259 161,700 16.5 2,656,700 245
1991 200,574 15.28 3,064,904 267 156,700 16.4 2,557,700 256
1992 203,155 14.76 2,997,747 265 152,500 16.4 2,489,500 239
---------------Leaf lettuce--------------- ----------------Romaine lettuce-----------------
1985 20,000 13.8 268,700 242 6,200 14.2 87,400 242
1986 14,100 10.9 153,800 293 6,200 13.0 80,700 273
1987 15,600 11.2 174,100 352 6,900 11.9 82,300 301
1988 22,200 10.9 233,400 395 8,500 12.1 103,100 351
1989 23,900 11.7 274,300 339 9,900 12.6 123,700 318
1990 30,600 10.6 306,100 354 12,700 13.1 164,100 312
1991 30,500 10.7 325,700 332 13,300 13.6 181,300 300
1992 36,100 10.6 364,700 364 14,600 9.8 143,200 462
1The Statebegan to collect separate data by lettuce type in 1985. The types include head, leaf, romaine and unspecified. Datafor the unspecified category are not reported here and were very small compared to othertypes.
Source: County Agricultural Commissioners' Reports, California Agricultural Statistics Service
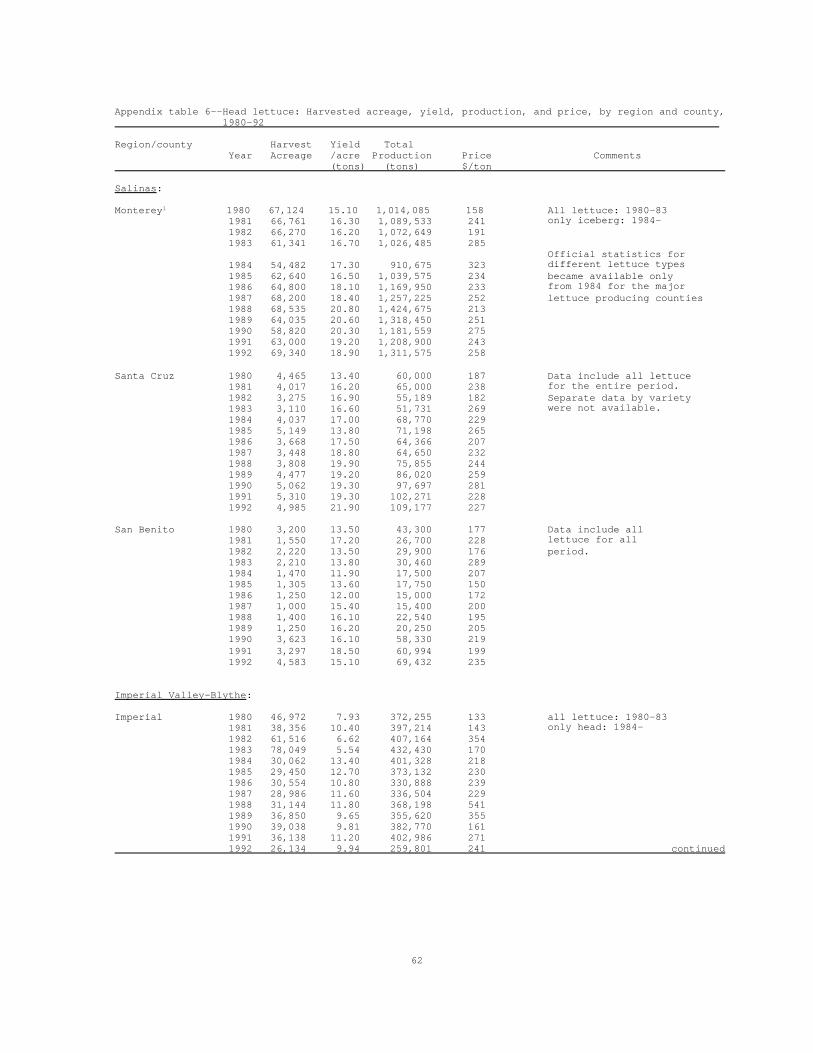
62
Appendix table 6--Head lettuce: Harvested acreage, yield, production, and price, by region and county, 1980-92
Region/county Harvest Yield Total Year Acreage /acre Production Price Comments (tons) (tons) $/ton
Salinas:
Monterey1 1980 67,124 15.10 1,014,085 158 All lettuce: 1980-83 1981 66,761 16.30 1,089,533 241 only iceberg: 1984- 1982 66,270 16.20 1,072,649 191 1983 61,341 16.70 1,026,485 285 Official statistics for 1984 54,482 17.30 910,675 323 different lettuce types 1985 62,640 16.50 1,039,575 234 became available only 1986 64,800 18.10 1,169,950 233 from 1984 for the major 1987 68,200 18.40 1,257,225 252 lettuce producing counties 1988 68,535 20.80 1,424,675 213 1989 64,035 20.60 1,318,450 251 1990 58,820 20.30 1,181,559 275 1991 63,000 19.20 1,208,900 243 1992 69,340 18.90 1,311,575 258
Santa Cruz 1980 4,465 13.40 60,000 187 Data include all lettuce 1981 4,017 16.20 65,000 238 for the entire period. 1982 3,275 16.90 55,189 182 Separate data by variety 1983 3,110 16.60 51,731 269 were not available. 1984 4,037 17.00 68,770 229 1985 5,149 13.80 71,198 265 1986 3,668 17.50 64,366 207 1987 3,448 18.80 64,650 232 1988 3,808 19.90 75,855 244 1989 4,477 19.20 86,020 259 1990 5,062 19.30 97,697 281 1991 5,310 19.30 102,271 228 1992 4,985 21.90 109,177 227
San Benito 1980 3,200 13.50 43,300 177 Data include all 1981 1,550 17.20 26,700 228 lettuce for all 1982 2,220 13.50 29,900 176 period. 1983 2,210 13.80 30,460 289 1984 1,470 11.90 17,500 207 1985 1,305 13.60 17,750 150 1986 1,250 12.00 15,000 172 1987 1,000 15.40 15,400 200 1988 1,400 16.10 22,540 195 1989 1,250 16.20 20,250 205 1990 3,623 16.10 58,330 219 1991 3,297 18.50 60,994 199 1992 4,583 15.10 69,432 235
Imperial Valley-Blythe:
Imperial 1980 46,972 7.93 372,255 133 all lettuce: 1980-83 1981 38,356 10.40 397,214 143 only head: 1984- 1982 61,516 6.62 407,164 354 1983 78,049 5.54 432,430 170 1984 30,062 13.40 401,328 218 1985 29,450 12.70 373,132 230 1986 30,554 10.80 330,888 239 1987 28,986 11.60 336,504 229 1988 31,144 11.80 368,198 541 1989 36,850 9.65 355,620 355 1990 39,038 9.81 382,770 161 1991 36,138 11.20 402,986 271 1992 26,134 9.94 259,801 241 continued
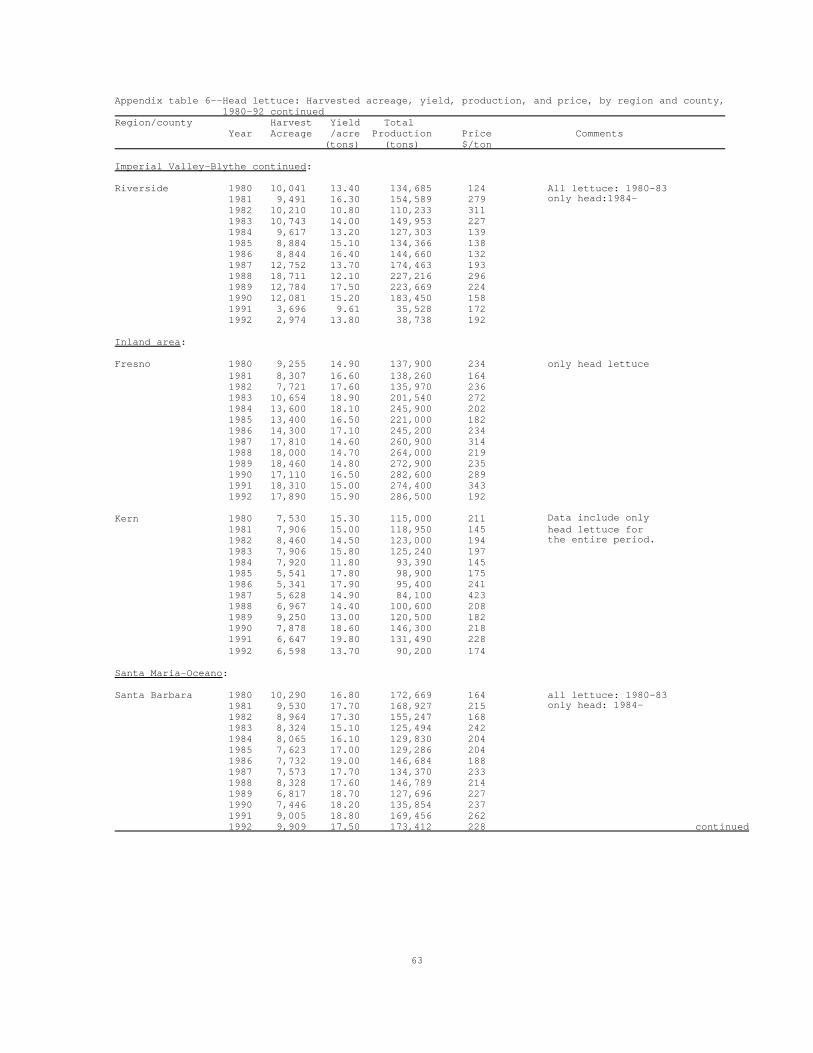
63
Appendix table 6--Head lettuce: Harvested acreage, yield, production, and price, by region and county, 1980-92 continued Region/county Harvest Yield Total Year Acreage /acre Production Price Comments (tons) (tons) $/ton
Imperial Valley-Blythe continued:
Riverside 1980 10,041 13.40 134,685 124 All lettuce: 1980-83 1981 9,491 16.30 154,589 279 only head:1984- 1982 10,210 10.80 110,233 311 1983 10,743 14.00 149,953 227 1984 9,617 13.20 127,303 139 1985 8,884 15.10 134,366 138 1986 8,844 16.40 144,660 132 1987 12,752 13.70 174,463 193 1988 18,711 12.10 227,216 296 1989 12,784 17.50 223,669 224 1990 12,081 15.20 183,450 158 1991 3,696 9.61 35,528 172 1992 2,974 13.80 38,738 192
Inland area:
Fresno 1980 9,255 14.90 137,900 234 only head lettuce 1981 8,307 16.60 138,260 164 1982 7,721 17.60 135,970 236 1983 10,654 18.90 201,540 272 1984 13,600 18.10 245,900 202 1985 13,400 16.50 221,000 182 1986 14,300 17.10 245,200 234 1987 17,810 14.60 260,900 314 1988 18,000 14.70 264,000 219 1989 18,460 14.80 272,900 235 1990 17,110 16.50 282,600 289 1991 18,310 15.00 274,400 343 1992 17,890 15.90 286,500 192
Kern 1980 7,530 15.30 115,000 211 Data include only 1981 7,906 15.00 118,950 145 head lettuce for 1982 8,460 14.50 123,000 194 the entire period. 1983 7,906 15.80 125,240 197 1984 7,920 11.80 93,390 145 1985 5,541 17.80 98,900 175 1986 5,341 17.90 95,400 241 1987 5,628 14.90 84,100 423 1988 6,967 14.40 100,600 208 1989 9,250 13.00 120,500 182 1990 7,878 18.60 146,300 218 1991 6,647 19.80 131,490 228 1992 6,598 13.70 90,200 174
Santa Maria-Oceano:
Santa Barbara 1980 10,290 16.80 172,669 164 all lettuce: 1980-83 1981 9,530 17.70 168,927 215 only head: 1984- 1982 8,964 17.30 155,247 168 1983 8,324 15.10 125,494 242 1984 8,065 16.10 129,830 204 1985 7,623 17.00 129,286 204 1986 7,732 19.00 146,684 188 1987 7,573 17.70 134,370 233 1988 8,328 17.60 146,789 214 1989 6,817 18.70 127,696 227 1990 7,446 18.20 135,854 237 1991 9,005 18.80 169,456 262 1992 9,909 17.50 173,412 228 continued
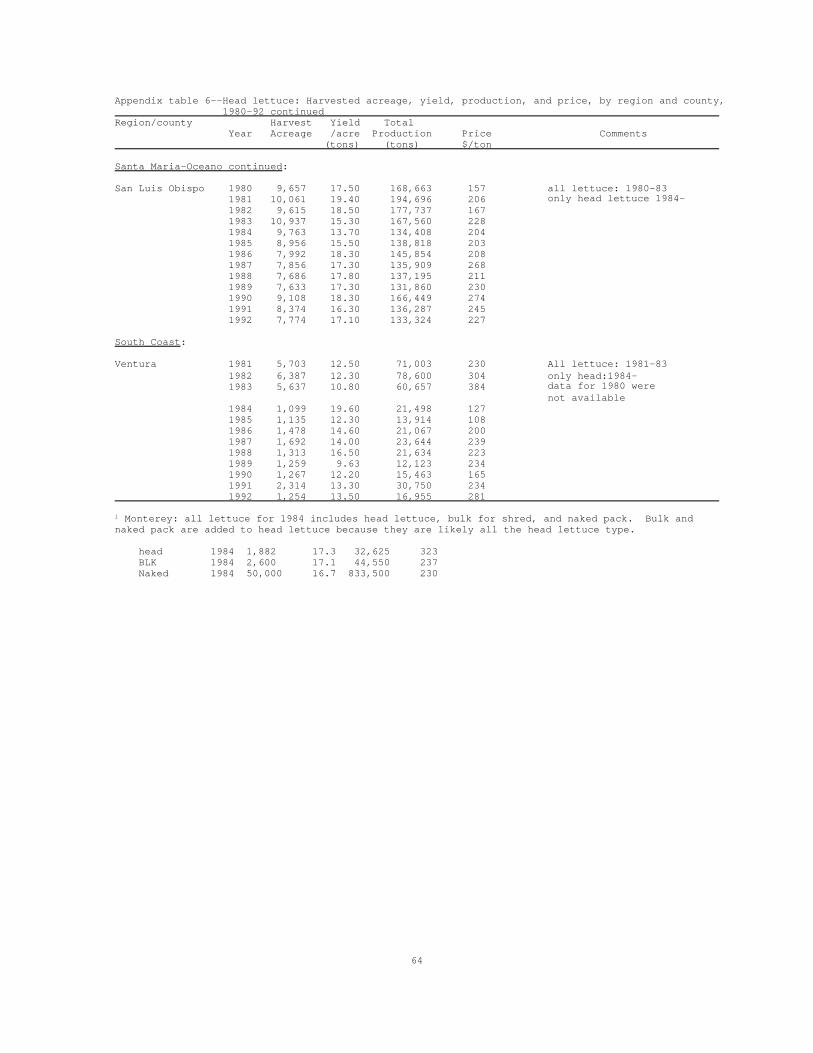
64
Appendix table 6--Head lettuce: Harvested acreage, yield, production, and price, by region and county, 1980-92 continued Region/county Harvest Yield Total Year Acreage /acre Production Price Comments (tons) (tons) $/ton
Santa Maria-Oceano continued:
San Luis Obispo 1980 9,657 17.50 168,663 157 all lettuce: 1980-83 1981 10,061 19.40 194,696 206 only head lettuce 1984- 1982 9,615 18.50 177,737 167 1983 10,937 15.30 167,560 228 1984 9,763 13.70 134,408 204 1985 8,956 15.50 138,818 203 1986 7,992 18.30 145,854 208 1987 7,856 17.30 135,909 268 1988 7,686 17.80 137,195 211 1989 7,633 17.30 131,860 230 1990 9,108 18.30 166,449 274 1991 8,374 16.30 136,287 245 1992 7,774 17.10 133,324 227
South Coast:
Ventura 1981 5,703 12.50 71,003 230 All lettuce: 1981-83 1982 6,387 12.30 78,600 304 only head:1984- 1983 5,637 10.80 60,657 384 data for 1980 were not available 1984 1,099 19.60 21,498 127 1985 1,135 12.30 13,914 108 1986 1,478 14.60 21,067 200 1987 1,692 14.00 23,644 239 1988 1,313 16.50 21,634 223 1989 1,259 9.63 12,123 234 1990 1,267 12.20 15,463 165 1991 2,314 13.30 30,750 234 1992 1,254 13.50 16,955 281
1 Monterey: all lettuce for 1984 includes head lettuce, bulk for shred, and naked pack. Bulk and naked pack are added to head lettuce because they are likely all the head lettuce type.
head 1984 1,882 17.3 32,625 323 BLK 1984 2,600 17.1 44,550 237 Naked 1984 50,000 16.7 833,500 230
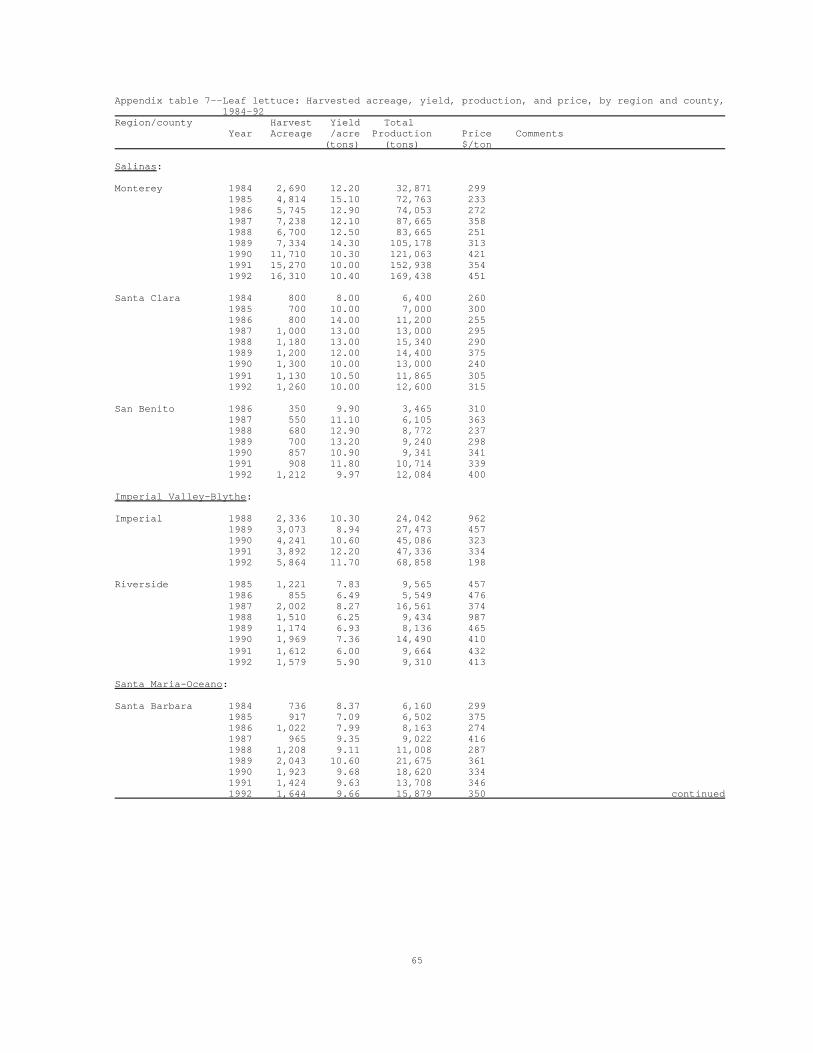
65
Appendix table 7--Leaf lettuce: Harvested acreage, yield, production, and price, by region and county, 1984-92 Region/county Harvest Yield Total Year Acreage /acre Production Price Comments (tons) (tons) $/ton
Salinas:
Monterey 1984 2,690 12.20 32,871 299 1985 4,814 15.10 72,763 233 1986 5,745 12.90 74,053 272 1987 7,238 12.10 87,665 358 1988 6,700 12.50 83,665 251 1989 7,334 14.30 105,178 313 1990 11,710 10.30 121,063 421 1991 15,270 10.00 152,938 354 1992 16,310 10.40 169,438 451
Santa Clara 1984 800 8.00 6,400 260 1985 700 10.00 7,000 300 1986 800 14.00 11,200 255 1987 1,000 13.00 13,000 295 1988 1,180 13.00 15,340 290 1989 1,200 12.00 14,400 375 1990 1,300 10.00 13,000 240 1991 1,130 10.50 11,865 305 1992 1,260 10.00 12,600 315
San Benito 1986 350 9.90 3,465 310 1987 550 11.10 6,105 363 1988 680 12.90 8,772 237 1989 700 13.20 9,240 298 1990 857 10.90 9,341 341 1991 908 11.80 10,714 339 1992 1,212 9.97 12,084 400
Imperial Valley-Blythe:
Imperial 1988 2,336 10.30 24,042 962 1989 3,073 8.94 27,473 457 1990 4,241 10.60 45,086 323 1991 3,892 12.20 47,336 334 1992 5,864 11.70 68,858 198
Riverside 1985 1,221 7.83 9,565 457 1986 855 6.49 5,549 476 1987 2,002 8.27 16,561 374 1988 1,510 6.25 9,434 987 1989 1,174 6.93 8,136 465 1990 1,969 7.36 14,490 410 1991 1,612 6.00 9,664 432 1992 1,579 5.90 9,310 413
Santa Maria-Oceano:
Santa Barbara 1984 736 8.37 6,160 299 1985 917 7.09 6,502 375 1986 1,022 7.99 8,163 274 1987 965 9.35 9,022 416 1988 1,208 9.11 11,008 287 1989 2,043 10.60 21,675 361 1990 1,923 9.68 18,620 334 1991 1,424 9.63 13,708 346 1992 1,644 9.66 15,879 350 continued
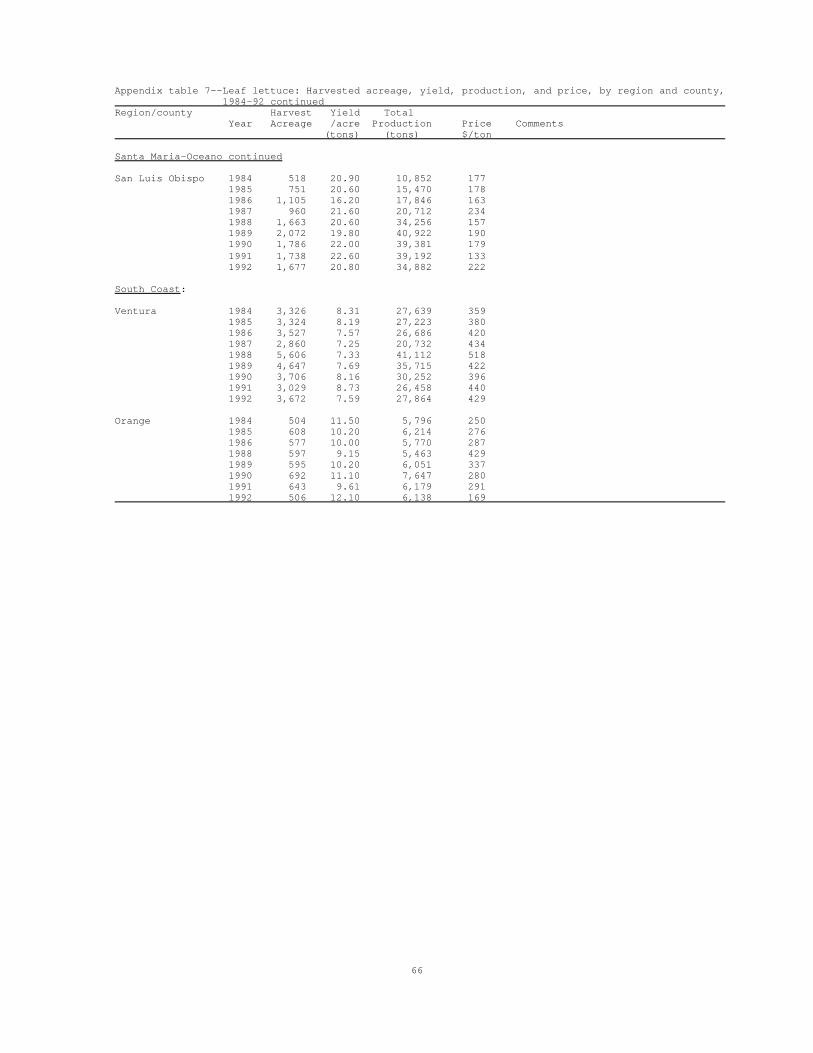
66
Appendix table 7--Leaf lettuce: Harvested acreage, yield, production, and price, by region and county, 1984-92 continued Region/county Harvest Yield Total Year Acreage /acre Production Price Comments (tons) (tons) $/ton
Santa Maria-Oceano continued
San Luis Obispo 1984 518 20.90 10,852 177 1985 751 20.60 15,470 178 1986 1,105 16.20 17,846 163 1987 960 21.60 20,712 234 1988 1,663 20.60 34,256 157 1989 2,072 19.80 40,922 190 1990 1,786 22.00 39,381 179 1991 1,738 22.60 39,192 133 1992 1,677 20.80 34,882 222
South Coast:
Ventura 1984 3,326 8.31 27,639 359 1985 3,324 8.19 27,223 380 1986 3,527 7.57 26,686 420 1987 2,860 7.25 20,732 434 1988 5,606 7.33 41,112 518 1989 4,647 7.69 35,715 422 1990 3,706 8.16 30,252 396 1991 3,029 8.73 26,458 440 1992 3,672 7.59 27,864 429
Orange 1984 504 11.50 5,796 250 1985 608 10.20 6,214 276 1986 577 10.00 5,770 287 1988 597 9.15 5,463 429 1989 595 10.20 6,051 337 1990 692 11.10 7,647 280 1991 643 9.61 6,179 291 1992 506 12.10 6,138 169
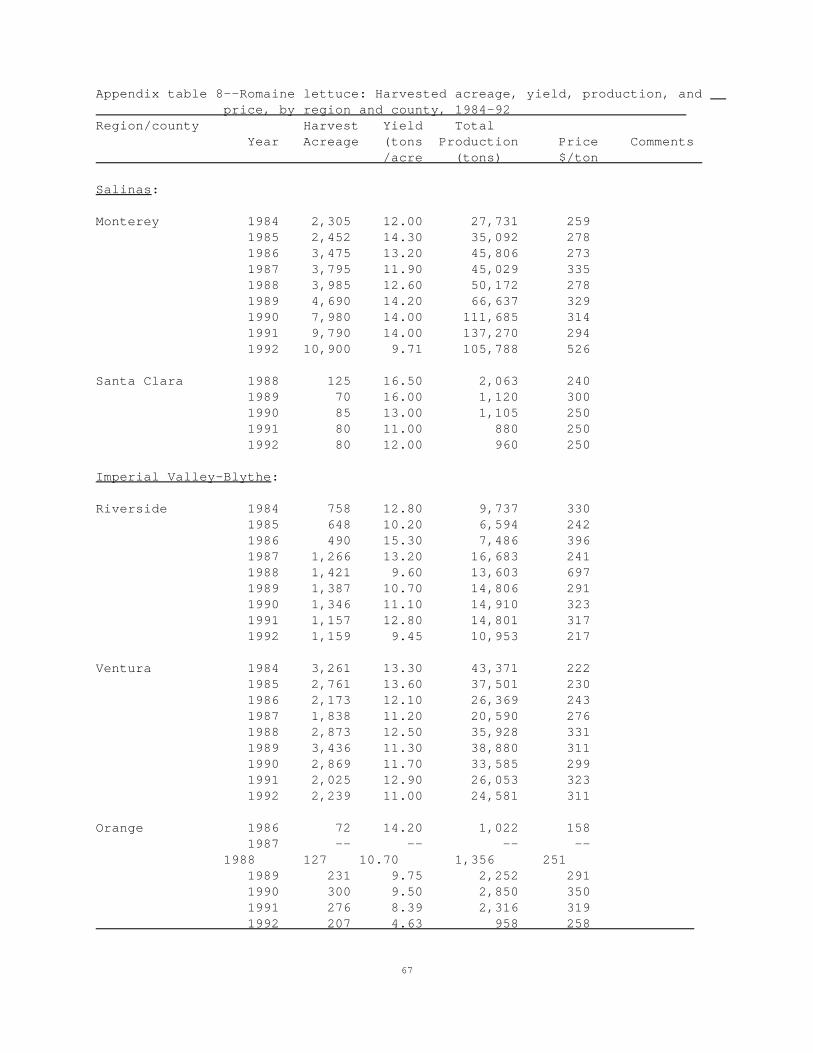
67
Appendix table 8--Romaine lettuce: Harvested acreage, yield, production, and price, by region and county, 1984-92 Region/county Harvest Yield Total Year Acreage (tons Production Price Comments /acre (tons) $/ton
Salinas:
Monterey 1984 2,305 12.00 27,731 259 1985 2,452 14.30 35,092 278 1986 3,475 13.20 45,806 273 1987 3,795 11.90 45,029 335 1988 3,985 12.60 50,172 278 1989 4,690 14.20 66,637 329 1990 7,980 14.00 111,685 314 1991 9,790 14.00 137,270 294 1992 10,900 9.71 105,788 526
Santa Clara 1988 125 16.50 2,063 240 1989 70 16.00 1,120 300 1990 85 13.00 1,105 250 1991 80 11.00 880 250 1992 80 12.00 960 250
Imperial Valley-Blythe:
Riverside 1984 758 12.80 9,737 330 1985 648 10.20 6,594 242 1986 490 15.30 7,486 396 1987 1,266 13.20 16,683 241 1988 1,421 9.60 13,603 697 1989 1,387 10.70 14,806 291 1990 1,346 11.10 14,910 323 1991 1,157 12.80 14,801 317 1992 1,159 9.45 10,953 217
Ventura 1984 3,261 13.30 43,371 222 1985 2,761 13.60 37,501 230 1986 2,173 12.10 26,369 243 1987 1,838 11.20 20,590 276 1988 2,873 12.50 35,928 331 1989 3,436 11.30 38,880 311 1990 2,869 11.70 33,585 299 1991 2,025 12.90 26,053 323 1992 2,239 11.00 24,581 311
Orange 1986 72 14.20 1,022 158 1987 -- -- -- -- 1988 127 10.70 1,356 251 1989 231 9.75 2,252 291 1990 300 9.50 2,850 350 1991 276 8.39 2,316 319 1992 207 4.63 958 258