letter from the soil & water...getting into soil & water 2 ˜e soil and water conservation...
TRANSCRIPT


Getting Into Soil & Water 2
�e Soil and Water Conservation Club is excited to present Getting into Soil and Water 2011. �e pur-pose of this publication is to educate individuals about soil and water issues ranging from within the state of Iowa to around the world, also to peak interest in natural resource conservation. �e Iowa State Soil and Water Conservation Club is grateful to be in an area where agriculture and soil and water conservation can come together. Our knowledge can be applied to con-serve soil and water in one of the world’s richest areas for agriculture. While on the Iowa State University campus, we feel it is our duty as a club to promote and teach conservation of our earth’s greatest resources, soil and water.
Our club consists of many diverse individuals from various di�erent backgrounds, who have taken it upon themselves to help improve public knowledge of soil and water conservation. It has become everyone’s responsibility to maintain soil and water quality. Some of the ways our club members have made a di�er-ence are by collaborating with the Iowa SWCS and in presenting the ground water �ow model. We have presented the ground water �ow model on Iowa State Campus, elementary schools, and at various confer-ences and events dealing with soil and water conserva-tion.
A big thank you goes out to everyone who has donat-ed their time and e�orts this year to increase awareness of the quality of our soil and water, especially to the publication contributors, committee members, and Lee Rudebusch, our publication editor. �e success of the ISU Soil and Water Conservation Club would not be possible without help from its members and our advisors Dr. Rick Cruse and Dr. Amy Kaleita.
Sincerely,
Ashley Waller
SWCC President (2010)
LETTER FROM THE SOIL & WATER CONSERVATION CLUB PRESIDENT
CLUB MEMBERSMember Major Hometown
Aaron Daigh Soil Science/Environmental Science Fayetteville, IA
Allison Vincent Environmental Science Perry, IA
Andrew Paxson Environmental Science Algonquin, IA
Ashley Waller* Environmental Science/Civil Engineering Bernard, IA
Aubrey Dalbec Environmental Science Gurnee, IL
Brandon Kann* Agronomy Guttenberg, IA
Casey Crozier Agronomy Tracy, IA
Danielle Koester Environmental Science Ankeny, IA
David Hagopain Agronomy West Bloom�eld, MI
Deb McDonough* Environmental Science Muscatine, IA
Eric Ryan Environmental Science Dallas Center, IA
Jessical Vacala Environmental Science Crystal Lake, IA
Jon Erdahl Environmental Science Ankeny, IA
Lee Rudebusch* Environmental Science/Chemistry St. Paul, MN
Lauren Hartmen Environmental Science Wahoo, NE
�eo Gunther* Agronomy Muscatine, IA
Rick Cruse** Ames, IA
*Publication Committee **Club Advisor
Getting Into Soil & Water 3
TABLE OF CONTENTS4 Message from the Iowa Water Center
Jim Newman & Rick Cruse
6 The Life, Near-Death and Rebirth of Nahant MarshBrian Ritter
8 Water Quality Benefits of Wetlands in Agricultural LandscapesWilliam Crumpton
12 Volunteer Water MonitoringErwin E. Klaas
14 Soil Carbon: The Key to High Sustainable Productivity and Global Carbon SequestrationRichard C. Shultz & �omas M. Isenhart
16 Recent Trends in Iowa Streamflow: 1948 - 2002K. J. Franz and Kayla J. Ste�ens
19 “We Want to Help Our Stream...”Mimi Wagner
22 The Early Years of the Iowa State Student Chapter of the SWCSHugh J. Brown
24 The Soil Survey Program in Iowa�omas E. Fenton
26 An Affair with our LandRichard Jensen
28 Drainage Water Management for Reducing Nitrate Losses from Tile Drained FieldsDan B. Jaynes, Rob Malone, & Kelly �orp
31 Visible and Invisible Causes for Soil Erosion in Northeast ChinaXiangwei Chen & Enhen Wang
34 Iowa Flood Center: Living With FloodsJackie Hartling Stolze
36 Unraveling Water Quality and Quantity Effects of Biofuels ProductionDouglas L. Karlen
Lee RudebuschEditor
The suggested format for citing an article from this publication is:
Author. 2010. Title of Article. Page(s) of Article. In Lee Rudebusch (ed.) Getting Into Soil and Water: 2010. Iowa Water Center, Ames, IA.

Getting Into Soil & Water 4
�e Iowa Water Center is proud to participate in this annual student publication, Getting Into Soil and Water, now in its third year. Today’s students and young farmers and professionals increasingly recognize the reality of the soil and water inter-relationship, and look beyond the narrow interests of past generations toward a way of life that will share the earth’s bounty with their children. �e natural resources profession has acknowl-edged the inseparability of our soil and water resources. We have learned to consider all natural resources as part of one complex system, with all natu-ral resources and alterations to these resources having an impact on one another and directly impacting the quality of human life on the planet. It is our goal to educate and raise awareness of this critical connection as rising populations; increased food, feed, and fuel demands; and changing climate add production stress to our soil and water resources.
�e challenge of today is to take the science of natural resources manage-ment to the broader community. A quick search for natural resources in Iowa on the internet will give beef, corn and soybeans as our state’s most prominent natural resources, with rich soils as the source of this wealth of agricultural production. �e gross domestic product (GDP) of agriculture in the United States has increased relative to the GDP of mining of non-renewable resources (metal, coal, oil and gas) (http://www.allcountries.org/uscensus/1145_gross_do-mestic_product_of_agri-culture_forestry.html). An identical internet search for the nation of China gives much di�erent data. Coal, iron ore, gas, tin, tungsten, mercury, manganese, alumi-num, zinc, lead, uranium, the traditional/industrial natural resources ele-ments, dominate the online conversation. �e sense that China is now the strongest economy in the world tells us much about the importance given to soil and water resources and renewable agricultural production, com-pared to consumption of non-renewable products. To much of the world, natural resources are still materials to be extracted, used, and disposed as waste. Today’s youth are charged with bringing a new de�nition of natural resources into the mainstream. �is annual student publication is part of the shift toward a truly sustainable future. S
MESSAGE FROM THE IOWA WATER CENTERJim Newman, Program CoordinatorRick Cruse, Director
The natural resources profession has acknowledged the inseparability of our soil and water resources.

Getting Into Soil & Water 5
A t l a n t i c
I n d i a n
O c e a n
O c e a n
A r c t i c O c e a nA r c t i c O c e a n
P a c i f i c
O c e a n
R U S S I A
R U S S I A
FINLAND
AUSTRIA
ITALY
SPAIN
SWEDEN
NORWAY
GERMANY
FRANCE
PORTUGAL
HUNGARY
ROMANIA
BULGARIA
TURKEY
DENMARK
POLAND
BELARUS
UKRAINECZECH
SLOVAKIA
GREECE
CYPRUSNORTH CYPRUS
NETH.
BELGIUM
IRELAND
YUGOSLAVIA
ALBANIA
MOLDOVA
LITHUANIA
LATVIA
ESTONIA
LUX.
BOSNIAAND
HERZ.
CROATIASLOVENIA
SWITZ.
MACEDONIA
GREENLAND
ICELAND
U. S. A.
CANADA
MEXICO THE BAHAMAS
CUBA
PANAMA
EL SALVADORGUATEMALA
BELIZEHONDURAS
NICARAGUA
COSTA RICA
JAMAICAHAITI
DOM. REP.
ARGENTINA
BOLIVIA
COLOMBIA
VENEZUELA
PERU
BRAZIL
FRENCH GUIANASURINAME
GUYANA
CHILE
ECUADOR
PARAGUAY
URUGUAY
FALKLAND ISLANDS
SOUTH GEORGIA ISLAND
KENYA
ETHIOPIA
ERITREA
SUDAN
EGYPT
NIGER
MAURITANIA
MALI
NIGERIA
SOMALIA
NAMIBIA
LIBYA
CHAD
SOUTH AFRICA
TANZANIA
Dem. Rep.of Congo
ANGOLA
ANGOLA
ALGERIA
MADAGASCAR
MOZAMBIQUE
BOTSWANA
ZAMBIA
GABON
CENTRAL AFRICANREPUBLIC
TUNISIA
MOROCCO
UGANDA
SWAZILAND
LESOTHO
MALAWI
BURUNDI
RWANDA
TOGO
BENINGHANA
COTED'IVOIRE
LIBERIA
SIERRA LEONE
GUINEABURKINA FASO
GAMBIA
CAMEROON
SAO TOME & PRINCIPE
ZIMBABWE
CONGO
EQUATORIAL GUINEA
WESTERNSAHARA
(occupied by Morocco)
DJIBOUTI
SENEGAL
GUINEA BISSAU
CanaryIslands
Azores
Cape Verde
JORDAN
ISRAEL
LEBANON
ARMENIAAZERBAIJAN
GEORGIA KYRGYZSTAN
TAJIKISTAN
KUWAIT
QATAR
U. A. E.
YEMEN
SYRIA
IRAQIRAN
OMAN
SAUDI ARABIA
AFGHANISTAN
PAKISTAN
INDIA
CHINA
KAZAKHSTAN
TURKMENISTAN
UZBEKISTAN
CHINA
MYANMAR
THAILAND
CAMBODIA
NEPALBHUTAN
VIETNAM
SRI LANKA
LAOS
BANGLADESH
PAPUANEW GUINEA
BRUNEI
SINGAPORE
PHILIPPINES
TAIWAN
MALAYSIA
I N D O N E S I A
JAPAN
MONGOLIA
SOUTH KOREA
NORTH KOREA
AUSTRALIA
NEW ZEALAND
U. K.
NEW CALEDONIA
FIJI
PALAU
VANUATU
SOLOMONISLANDS
GUAMMARSHALLISLANDS
MICRONESIA
TONGA
SAMOAISLANDS
FRENCHPOLYNESIA
KIRIBATI
EAST TIMOR
P a c i f i cP a c i f i c
AUSTRIA
ITALY
SPAIN
NORWAY
GERMANY
FRANCEFRANCEHUNGARY
DENMARK
POLAND
CZECHCZECH
NETH.
BELGIUMBELGIUMLUX.LUX.
BOSNIABOSNIABOSNIAAND
HERZ.
CROATIACROATIASLOVENIASLOVENIA
SWITZ.SWITZ.
FALKLAND ISLANDSFALKLAND ISLANDS
SOUTH GEORGIA ISLANDSOUTH GEORGIA ISLAND
NIGERMALI
NIGERIA
NAMIBIANAMIBIA
LIBYA
ANGOLA
ANGOLA
ALGERIA
GABON
CENTRAL AFRICAN
TUNISIATUNISIATUNISIA
MOROCCO
TOGOTOGOTOGO
BENINGHANA
BURKINA FASO
CAMEROON
SAO TOME & PRINCIPESAO TOME & PRINCIPESAO TOME & PRINCIPESAO TOME & PRINCIPESAO TOME & PRINCIPE CONGO
EQUATORIAL GUINEAEQUATORIAL GUINEA
NEW ZEALANDNEW ZEALAND
U. K.
NEW CALEDONIANEW CALEDONIA
FIJIFIJIVANUATUVANUATU
SOLOMONSOLOMONISLANDS
MARSHALLISLANDS
MICRONESIA
SWEDEN
P a c i f i c
FIJI
TONGA
SAMOAISLANDS
A t l a n t i cA t l a n t i c
O c e a nO c e a n
SPAINSPAINPORTUGALPORTUGAL
IRELANDIRELAND
THE BAHAMAS
CUBA
PANAMA
BELIZEHONDURAS
NICARAGUA
COSTA RICA
JAMAICAHAITI
DOM. REP.
ARGENTINA
BOLIVIABOLIVIA
COLOMBIACOLOMBIACOLOMBIA
VENEZUELAVENEZUELAVENEZUELAVENEZUELAVENEZUELA
PERUPERU
BRAZILBRAZIL
FRENCH GUIANAFRENCH GUIANASURINAME
GUYANA
CHILE
ECUADOR
PARAGUAYPARAGUAY
URUGUAYURUGUAY
MAURITANIA
MOROCCO
COTED'IVOIRE
LIBERIA
SIERRA LEONESIERRA LEONE
GUINEAGUINEAGUINEABURKINA FASO
GAMBIA
SAO TOME & PRINCIPESAO TOME & PRINCIPE
WESTERNSAHARA
(occupied by Morocco)
SENEGAL
GUINEA BISSAU
CanaryCanaryIslands
AzoresAzores
Cape VerdeCape Verde
GREENLAND
ICELAND
CANADA
EL SALVADOREL SALVADOR
BELIZE
COSTA RICACOSTA RICA
ECUADOR
P a c i f i c
O c e a nO c e a n
U. S. A.
MEXICO
GUATEMALA
SAMOAISLANDS
FRENCHPOLYNESIAPOLYNESIA
KIRIBATI
CANADA
EL SALVADORGUATEMALA
Sustainable agriculture systematically addresses many environmental and social concerns of the entire food system. Sustainable agriculture integrates three main goals: environmental stewardship, farm profitability, and prosperous farming communities.
Agronomists manage our plant and soil resources as a sustainable system through all of the interactions that support crop growth including the impacts on the environment and society. Agronomists integrate concepts of soil science, plant science, climatology, and social science.
Developerof sustainablesystems
www.ImAnAgronomist.net
Getting Into Soil & Water 6
THE LIFE, NEAR-DEATH AND REBIRTH OF NAHANT MARSHBrian RitterFacilitator of Nahant Marsh, Eastern Iowa Community College District
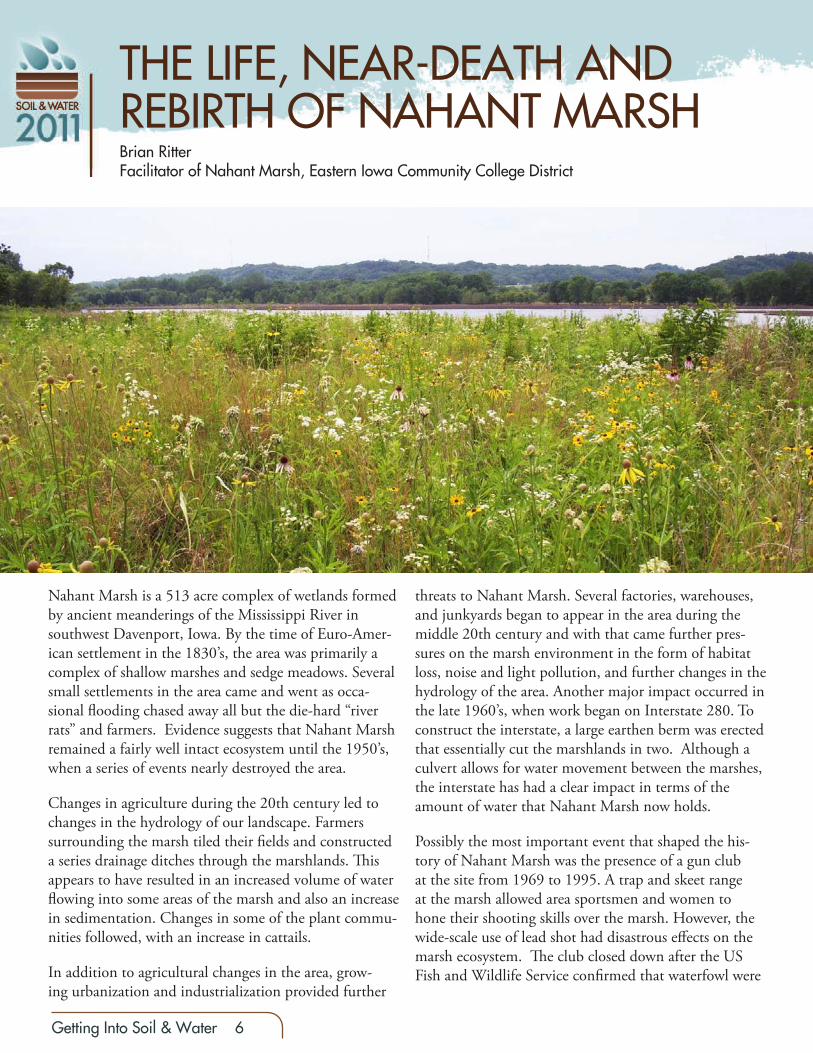
Nahant Marsh is a 513 acre complex of wetlands formed by ancient meanderings of the Mississippi River in southwest Davenport, Iowa. By the time of Euro-Amer-ican settlement in the 1830’s, the area was primarily a complex of shallow marshes and sedge meadows. Several small settlements in the area came and went as occa-sional �ooding chased away all but the die-hard “river rats” and farmers. Evidence suggests that Nahant Marsh remained a fairly well intact ecosystem until the 1950’s, when a series of events nearly destroyed the area.
Changes in agriculture during the 20th century led to changes in the hydrology of our landscape. Farmers surrounding the marsh tiled their �elds and constructed a series drainage ditches through the marshlands. �is appears to have resulted in an increased volume of water �owing into some areas of the marsh and also an increase in sedimentation. Changes in some of the plant commu-nities followed, with an increase in cattails.
In addition to agricultural changes in the area, grow-ing urbanization and industrialization provided further
threats to Nahant Marsh. Several factories, warehouses, and junkyards began to appear in the area during the middle 20th century and with that came further pres-sures on the marsh environment in the form of habitat loss, noise and light pollution, and further changes in the hydrology of the area. Another major impact occurred in the late 1960’s, when work began on Interstate 280. To construct the interstate, a large earthen berm was erected that essentially cut the marshlands in two. Although a culvert allows for water movement between the marshes, the interstate has had a clear impact in terms of the amount of water that Nahant Marsh now holds.
Possibly the most important event that shaped the his-tory of Nahant Marsh was the presence of a gun club at the site from 1969 to 1995. A trap and skeet range at the marsh allowed area sportsmen and women to hone their shooting skills over the marsh. However, the wide-scale use of lead shot had disastrous e�ects on the marsh ecosystem. �e club closed down after the US Fish and Wildlife Service con�rmed that waterfowl were

Getting Into Soil & Water 7
being poisoned when they ingested lead pellets from the bottom of the marsh. Survey work at the site con�rmed that at least thirteen acres were heavily contaminated with concentrations of lead in some spots exceeding 500 shot per square foot. As a comparison, “acceptable” levels at the time were considered to be less than ten lead shot per square foot. Not only were waterfowl su�ering as a result of the contamination, but certain plant species were found to have had mutations as a result of exposure to lead. �e contamination was possibly working its way up the food chain.
�e long road to recovery came about when several area organizations banded together to get the marsh cleaned-up and to develop a new purpose for the area. Groups such as the Quad City Audubon Society and River Action, Inc. joined forces with City of Davenport and the US Fish and Wildlife Service to convince the US Environmental Protection Agency to take action. As a result, Nahant Marsh was declared a Superfund site and in 1998, a $2 million clean-up and restoration began on the thirteen most contaminated acres of the marsh. �e area was drained and approximately 143 tons of lead-laced soil was removed from the marsh.
For the �rst time, in the history of the EPA Super-fund program, after the clean-up was complete, the area was turned into a nature preserve and educational facility. �e City of Davenport took possession of the 78 acres that had previously been owned by the gun club. �e old club house was converted into an educational center and the non-pro�t Nahant Board was formed to acquire more land and oversee educational activities. Since the clean-up occurred, the area of land within the preserve has grown to 262 acres. �e educational programming, headed up by the Eastern Iowa Community College District, now provides opportunities for over 6,000 people annually.
Although it still faces significant challenges, Nahant Marsh stands as a symbol of the resiliency of nature.
Although Nahant Marsh will probably never be exactly the same as it was prior to settlement, visitors are still able to experience a diverse ecosystem through low-impact recreational and educational opportunities and through Nahant’s network of trails, boardwalks, bird-blind, and dock. Since the clean-up, over 360 plant species, 149 bird species, and numerous reptiles, amphibians, �sh, and mammals have been observed at the marsh, including the State threatened Blanding’s Turtle, the protected Ear-leaved false foxglove, river otters, beavers, and bobcats. Today, Nahant Marsh is thought to be the largest urban wetland on the Upper Mississippi River. Although it still faces signi�cant challenges, Nahant Marsh stands as a symbol of the resiliency of nature. S

Getting Into Soil & Water 8
Agricultural applications of fertilizers and pesticides have increased dramati-cally since the middle 1960s and the impact of agrochemicals on water quality has become a serious environ-mental concern. Nitrate is a particular concern; (1) because of the potential adverse impacts on both public health and ecosystem function, (2) because of the high mobility of nitrate in surface and groundwater, and (3) because of the widespread use of nitrogen in modern agriculture. Annual application of fertilizer-N in the U.S. has grown from a negligible amount prior to World War II to approximately ten million met-ric tons of N per year. �e impacts of chemical intensive agriculture are a spe-cial concern in the U.S. Corn Belt. �is region is characterized by intensive row crop agriculture (Figure 1). Non-point source nitrogen loads to surface waters in the region are among the highest in the Mississippi River Basin and are re�ected by signi�cantly elevated stream nutrient concentrations. In addition to the potential local impacts on receiv-ing waters in the Corn Belt, nitrogen loads from the region are suspected as a primary source of nitrate contributing to hypoxia in the Gulf of Mexico.
�e problem of excess nitrate loads can probably be ameliorated by a combina-tion of in �eld and o� site practices, but the limitations and appropriateness of alternative practices must be considered. Although soil nitrogen transformations involve complex spatial and temporal patterns, nitrogen is transported from cultivated �elds primarily by leaching
WATER QUALITY BENEFITS OF WETLANDS IN AGRICULTURAL LANDSCAPESWilliam Crumpton,Department of Ecology, Evolution and Organismal Biology, Iowa State University
Figure 1. Land cover (top) and stream nitrate-nitrogen concentrations (bottom) in the Upper Mississippi and Ohio River basins (Derived from Landsat data and STORET and state data sets).
Getting Into Soil & Water 9
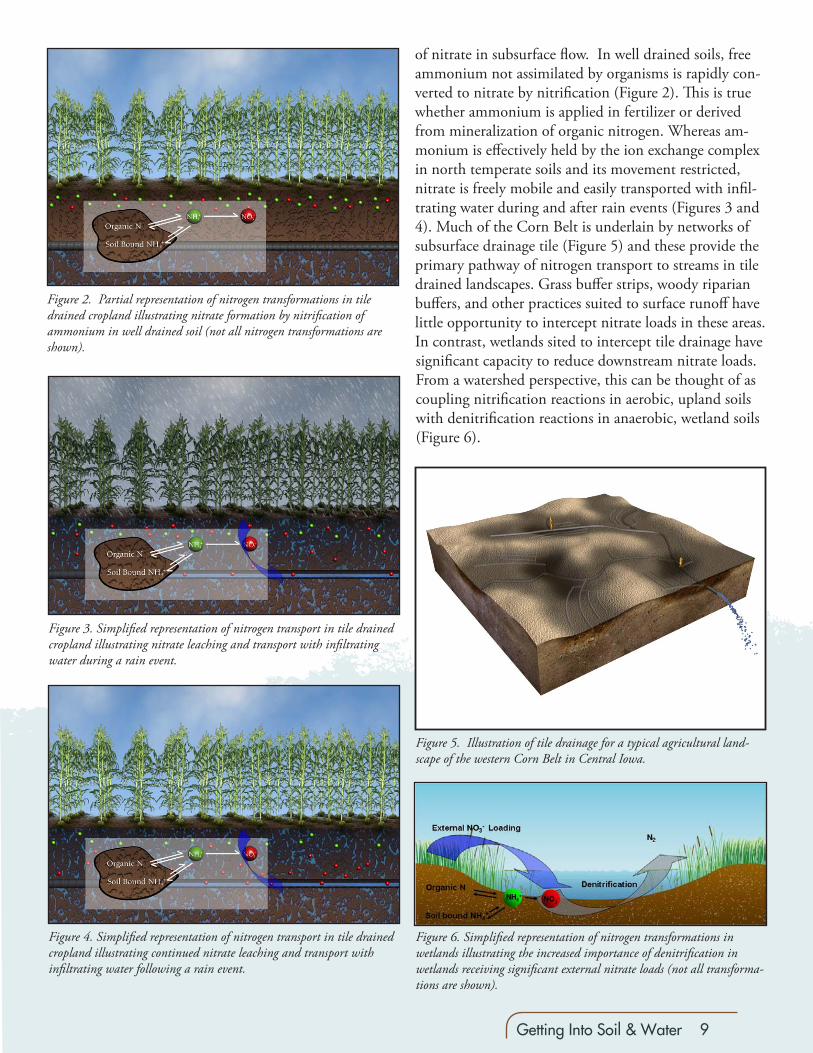
of nitrate in subsurface �ow. In well drained soils, free ammonium not assimilated by organisms is rapidly con-verted to nitrate by nitri�cation (Figure 2). �is is true whether ammonium is applied in fertilizer or derived from mineralization of organic nitrogen. Whereas am-monium is e�ectively held by the ion exchange complex in north temperate soils and its movement restricted, nitrate is freely mobile and easily transported with in�l-trating water during and after rain events (Figures 3 and 4). Much of the Corn Belt is underlain by networks of subsurface drainage tile (Figure 5) and these provide the primary pathway of nitrogen transport to streams in tile drained landscapes. Grass bu�er strips, woody riparian bu�ers, and other practices suited to surface runo� have little opportunity to intercept nitrate loads in these areas. In contrast, wetlands sited to intercept tile drainage have signi�cant capacity to reduce downstream nitrate loads. From a watershed perspective, this can be thought of as coupling nitri�cation reactions in aerobic, upland soils with denitri�cation reactions in anaerobic, wetland soils (Figure 6).
Figure 3. Simpli�ed representation of nitrogen transport in tile drained cropland illustrating nitrate leaching and transport with in�ltrating water during a rain event.
Figure 4. Simpli�ed representation of nitrogen transport in tile drained cropland illustrating continued nitrate leaching and transport with in�ltrating water following a rain event.
Figure 5. Illustration of tile drainage for a typical agricultural land-scape of the western Corn Belt in Central Iowa.
Figure 6. Simpli�ed representation of nitrogen transformations in wetlands illustrating the increased importance of denitri�cation in wetlands receiving signi�cant external nitrate loads (not all transforma-tions are shown).
Figure 2. Partial representation of nitrogen transformations in tile drained cropland illustrating nitrate formation by nitri�cation of ammonium in well drained soil (not all nitrogen transformations are shown).

Getting Into Soil & Water 10
Wetland restoration is a particularly promising ap-proach for heavily tile drained areas like the Corn Belt. �is region was historically rich in wetlands, and in many areas, farming was made possible only as a result of extensive drainage. �ere are opportunities for wetland restoration throughout the region and considerable potential for restored wetlands to inter-cept nitrate transported in tile �ow. Over the past 15 years, our research group has worked on siting, design and assessment of wetland restorations in agricultural watersheds. �is work elucidated many of the bene�ts and limitations of wetland restorations in tile drained
Figure 8. Modeled nitrate mass balance for Walnut Creek watershed with wetland restorations in di�erent landscape positions.
landscapes and provided the research founda-tion for targeted wetland restorations through the Iowa Conservation Reserve Enhancement Program. �e Iowa CREP was created by the Iowa Department of Agriculture and Land Stewardship, in partnership with USDA as a targeted, performance based strategy for nitrate reduction in tile drained landscapes. �e program provides incentives to landowners to voluntarily establish wetlands strategically located and designed to remove nitrate from tile-drainage water from cropland areas. As an integral part of the Iowa CREP, representative wetlands are monitored each year to document nitrate reduction. By design, the wetlands selected for monitoring span the 0.5% - 2% wetland/watershed area ratio range approved
for Iowa CREP wetlands. �e wetlands also span a range in average nitrate-N concentration from less than 10
mg/l (parts per million) to approximately 30 mg/l. �e wetlands thus provide a broad spec-trum of those factors most a�ecting wetland performance: hydraulic loading rate, residence time, and nutrient concentration. Hydrau-lic loading rate is the total volume of in�ow divided by wetland area and is thus a function of �ow and the ratio of wetland:watershed area. Percent nitrogen removal by wetlands is strongly dependent on hydraulic loading rate (Figure 7) and in combination with concen-tration explains most of the variability in mass nitrogen removed.
Results demonstrate that wetlands can be extremely e�ective in reducing nutrient loads in agricultural watersheds, but only if they are appropriately positioned and designed to achieve that function.�e e�ectiveness of wet-lands for water quality improvement depends
Figure 7. Measured and modeled percent nitrate removal by IA wetlands as function of hydraulic loading rate.
This region was historically rich in wetlands, and in many areas, farming was made possible only as a result of extensive drainage.
Getting Into Soil & Water 11
�rst on the wetlands intercepting a signi�cant fraction of the nutrient load and second on the wetlands being large enough to adequately treat the load they receive. If wetland restoration is to be e�ective in reducing nitrate loads at the watershed scale, the wetlands must be re-stored in appropriate landscape positions (Figure 8).
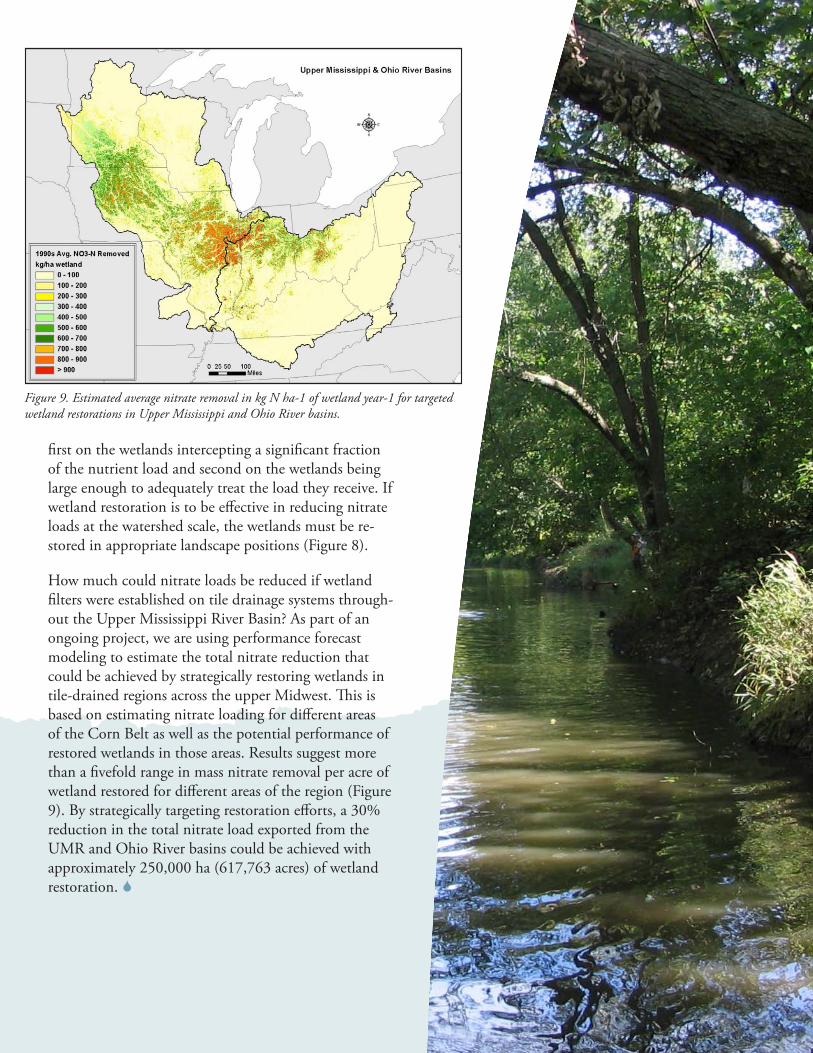
How much could nitrate loads be reduced if wetland �lters were established on tile drainage systems through-out the Upper Mississippi River Basin? As part of an ongoing project, we are using performance forecast modeling to estimate the total nitrate reduction that could be achieved by strategically restoring wetlands in tile-drained regions across the upper Midwest. �is is based on estimating nitrate loading for di�erent areas of the Corn Belt as well as the potential performance of restored wetlands in those areas. Results suggest more than a �vefold range in mass nitrate removal per acre of wetland restored for di�erent areas of the region (Figure 9). By strategically targeting restoration e�orts, a 30% reduction in the total nitrate load exported from the UMR and Ohio River basins could be achieved with approximately 250,000 ha (617,763 acres) of wetland restoration. S
Figure 9. Estimated average nitrate removal in kg N ha-1 of wetland year-1 for targeted wetland restorations in Upper Mississippi and Ohio River basins.

Getting Into Soil & Water 12
�e Iowa Geological and Water Survey Section of the Iowa Department of Natural Resources (DNR) is responsible for the design, implementation and manage-ment of Iowa’s Ambient Water Monitoring and Assess-ment Program. According to the DNR’s website, www.iowadnr.gov, the purpose of the program is to develop and deliver consistent, unbiased information about the condition of Iowa’s surface and groundwater resources so that decisions regarding the development, management and protection of these resources may be improved. Monitoring is done by DNR employees or through con-tracts with researchers at Iowa universities. However, the state does not provide the funding to hire enough sta� to monitor all of the lakes, beaches, and streams on a continual basis.
In May 1998, the Survey organized a volunteer moni-toring program, called IOWATER, to widen the scope of monitoring across the state. IOWATER’s mission is “to protect and improve Iowa’s water quality by raising citizen awareness about Iowa’s watersheds, supporting and encouraging the growth and networking of Iowa’s volunteer water monitoring communities, and promot-ing water monitoring activities as a means of assessing and understanding Iowa’s aquatic resources. Although the protocols for volunteer monitoring are not as rigid as those used for the Ambient Water Monitoring Program, volunteers must attend training classes and use �eld test-ing equipment and reagents provided by the IOWATER program.
VOLUNTEER WATER MONITORINGErwin E. KlaasProfessor Emeritus of Animal Ecology

Getting Into Soil & Water 13
�e Squaw Creek Watershed Coalition was organized in 2001. Members of the coalition and I began sampling water under the IOWATER program soon after. I received training from the DNR in the fall of 2001 and collected my �rst samples on November 15 from Squaw Creek near the 4th Street and Du� Avenue bridges in Ames. I have continued to collect samples every month
except when the creek is completely ice covered. Fol-lowing IOWATER protocols, I measure air and water temperature, water clarity, pH, nitrite, nitrate, dissolved oxygen, chloride, and phosphate. I also make notes on cloud cover, water levels, human and animal use, and any unusual changes to the stream. Once or twice a year, I survey the stream bed for the presence of aquatic macro-invertebrates such as insects, cray�sh, worms, mussels, and snails. Adjacent and upstream land use is also monitored annually.
In 2003, I received advanced training to monitor bacte-ria. Using a sterile pipette, I collect three replicate one-milliliter (ml) samples of water at each site and transfer
the sample into a vial of specially prepared media. At home, I transfer each vial of media to a sterile petri dish and place the dishes in an incubator. �e incubator is a Styrofoam box with a small light bulb inside and a meat thermometer in the lid. Samples are incubated for 48 hours at 95 degrees Fahrenheit. Colonies of fecal coli-form bacteria growing on the media are then counted and recorded. �e media is prepared to di�erentiate between Escherichia coli (appears purple in color) and other fecal coliforms (pink). E. coli occurs in the gut of all warm-blooded animals including humans. E. coli is considered an indicator of pollution but only certain strains of the bacterium are harmful to humans. Pos-sible sources of E. coli in Squaw Creek are wild animals, livestock, and human waste. In two cases, my monitor-ing of E. coli detected breaks in sanitary sewers. When the breaks were located, the city quickly �xed them.
In 2008, the Squaw Creek Watershed Coalition began snapshot monitoring on a Saturday in May and October. On snapshot days, volunteers visit all of the more than 50 registered sites in the watershed, conduct the usual �eld testing, and collect water samples that are sent to the University of Iowa’s Hygienic Laboratory for bacte-rial analysis.
Data collected from IOWATER volunteers is posted on the IOWATER web site at www.iowater.net. To �nd my data on this site, click on “view data” on the drop-down menu under “Database” on the toolbar. Find the line on the page that says “select monitor” and click on my name in the alphabetical list of last names. �is will take you directly to my sites. Click on the numbers at the far left side and it will take you to the page where the data can be viewed according to date of the collection. �ere are data logs for biological, chemical and physical, habitat, and photos. Similarly, you can view data for all the sampling sites in a watershed by selecting the appro-priate watershed. Squaw Creek is listed as a watershed with the Hydrological Unit Code (HUC) 10. Anyone interested in becoming a water monitoring volunteer can contact me at [email protected] or any of the IOWA-TER sta� listed on the web site. S
To protect and improve Iowa’s water quality by raising citizen awareness about Iowa’s watersheds, supporting and encouraging the growth and networking of Iowa’s volunteer water monitoring communities, and promoting water moni-toring activities as a means of assessing and understanding Iowa’s aquatic resources.

Getting Into Soil & Water 14
SOIL CARBON:THE KEY TO HIGH SUSTAINABLE PRODUCTIVITY AND GLOBAL CARBON SEQUESTRATIONRichard C. Schultz, University Professor & Thomas M. Isenhart, Associate Professor, Department of Natural Resource Ecology and Management
Soil carbon is the key to Iowa’s claim of having some of the world’s most productive soils. Undisturbed natural soil is the most complex ecosystem on earth because of its high activity and storage of both living and dead organic matter. Approximately 57% of that organic matter is carbon. Soil carbon is found in the tissues of living plant roots and the millions of microbes, ants, beetles, earthworms, etc. that constitute the living soil ecosystem. It is also present in the fresh litter and stover that falls to the surface and to in the soil as roots die. �e decomposition of dead material added to organic matter leaves behind modi�ed and resistant carbon compounds which provide long-term carbon sequestra-tion. Soil organic matter is the key to soil development. Soil develops from inert raw material such as glacial till (the Des Moines Lobe of central Iowa), accumulations of loess (the Loess Hills of western Iowa) or bedrock that has broken into small pieces by natural geologic weather-ing. Living plants, animals and microbes add organic
matter to the inert “parent material” and thoroughly mix them together over long periods of time creating thecomplex me-dium we call soil.
�e distribution of carbon in the soil is in�uenced by the plant community under which it develops. In undisturbed prairie soils native plant root systems can reach depths of 10-15 feet (Figure 1). �ese plant rootsystems are completely replaced approximately every four years. �is results in organic matter carbon being distributed to great depths providing the deep rich soils that are being farmed in much of the Midwestern United States. In contrast, forest soils are relatively shal-low because much of the organic matter is added to surface by the annual leaf drop. As a result, most of the mixing takes place at the surface and �ne tree roots arefound in the upper 12-18 inches where most of the nutrients are located. Contrary to
popular belief tree roots, even the large structural ones, generally do not go much below three to �ve feet, but rather spread in all directions around the tree to lengths of at least one tree height (Figure 1).
Soil carbon is the energy source for soil ecosystems.�e decomposition food web is critical to releasing nutri-ents that are stored in the dead organic matter, but are needed for growth of living plants. �e rate of decom-position depends on the kind of organic matter that is available and climatic conditions. Litter produced by conifer forests is slow to decompose because of the com-
Figure 1.Comparison of root characteristics and depths of trees, native prairie plants and corn. Note vertical distribution common under prairie plants compared to the horizontal distribution common under trees. �is di�erence has a major impact in the distribution of soil carbon in the soil pro�le.
Soil carbon is the energy source for soil ecosystems.

Getting Into Soil & Water 15
plexity of organic matter and the cool and relatively dry soils. Conifer ecosystem productivity can be low because nutrients are locked in the litter. At the other extreme is organic matter that decomposes rapidly in the tropical rain forest where temperatures and moisture are high. In those settings signi�cantly less soil carbon is stored in or on top of the soil and soil nutrients can be rapidly lost when natural plant communities are converted to cultivated crop production.
In the process of decomposition modi�ed and resistant soil organic matter is produced by the organisms. It is this organic matter that is most important in long-term soil carbon sequestration. Some of this carbon can be locked up in the soil for hundreds of years. Soils around the world contain more sequestered carbon than all the carbon in the atmosphere and plants, combined.
In addition to being an energy source and providing storage for carbon, soil organic matter helps glue min-eral soil particles together helping to create soil structure with large pores that are critical for aeration and wa-ter in�ltration. Soil organic matter itself also acts as a sponge increasing the water holding potential of a soil. �ese physical actions are very important in maintain a healthy soil ecosystem.
Land-use can have major impacts on soil carbon. When soil is cultivated surface soils are mixed and exposed to more oxygen and warm temperatures resulting in dra-matic increases in soil organism activity and decomposi-tion. In addition cultivation breaks down the structure of the soil that was created by soil organisms as they decompose organic matter. �e reduction in structure means a reduction in soil porosity which reduces water in�ltration potential and aeration (Figure 3). �is leads to higher runo� and potential �ooding. In the process surface erosion carries both sediment and carbon from hilltops to low spots or to nearby water bodies (Figure 4). Modifying soil tillage by use of minimum or no-till, using rotations that include several years of cover crops, and leaving residue on the �elds after harvest can mini-mize the loss of soil carbon. Soil organic matter is the key to sustainable production and to long-term carbon sequestration. We must carefully manage the fragile fertile soils of Iowa if they are to remain the breadbasket of the world and mitigators of climate change. S
Figure 2.Comparison of forest and prairie soil development. Note the very thin dark layer in the forest soil compared to the much thicker zone in the prairie soil. �e darker color is indicative of soil carbon concen-trations (source – Jon Sandor, ISU)
Figure 3. An undisturbed prairie soil (left) from the same soil mapping unit as the cultivated soil on the right. Note the color di�erence and the lack of porosity and living organic matter in the cultivated soil. Con-sider the potential di�erence in water in�ltration between these to soils.
Figure 4.Erosion of carbon rich top soil. Notice small gullies, rills, on the hill sides and loss of soil from the �eld into the adjacent ditch. Signi�cant amounts of this soil and organic carbon can make its way into local water bodies creating major pollution problems. Loss of this soil and organic material reduces the long-term sustainability of crop production and sequestration of carbon for climate change mitigation.

Getting Into Soil & Water 16
In the past century (1906-2005), the average global temperature has risen by nearly 1°C, with the linear warming trend over the last 50 years nearly twice of the previous 100 years (IPCC, 2007). From 1901-1994 there has been an increase in precipitation of approximately 20% across the U.S., largely due to more frequent and intense heavy and extreme precipita-tion events in recent decades (Todd et al., 2006). Corresponding with increased pre-cipitation, increased stream�ow has been observed across the U.S. as well (Lins and Slack, 1999; McCabe and Wolock, 2002). Given the climatic and hydrologic observations across the country, we undertook a study to investigate stream-�ow trends in Iowa (Ste�ens and Franz, in review).
We chose ten watersheds located throughout the state (Figure 1), ranging in size from 521 km2 to 4522 km2 (1 mi2 = 2.56 km2). US Geological Survey (USGS) stream�ow data from 1948-2003 were obtained for each watershed. Five stream�ow variables were analyzed for the presence of increasing or decreasing trends over the study period (Table 1). Summer and winter low �ow values were determined for each year by �nding the
lowest average discharge value for seven consecutive days in the months of May to October and November to April, respectively. A high �ow day is a day in which the discharge was larger than the average daily �ow plus one standard deviation, and an extreme �ow day is one in which the discharge is larger than the average daily �ow plus two standard deviations.
�e annual values were �rst visually analyzed using plots of the 10-year moving averages. A 10-year moving aver-age takes a ten year window in time and averages the values within the window, starting from the beginning of the record and incrementing by one year until the end of the record is reached. �e stream�ow values were also tested for the presence of a positive or negative trends using the Mann-Kendall test (MK) (Mann,1945; Kend-all, 1975). A signi�cance level of 10% was used, indicat-ing there is a 90% certainty the trend is real and not due to normal variability.
Plots of the 10-year running average of mean daily dis-charge suggests average discharge is increasing at all sites (Figure 2). �e MK test veri�es the increasing trend for eight of the ten sites, though the trend was statisti-cally signi�cant for only four basins (Shell Rock, Boone, North Raccoon, and Salt Creek Rivers) (Table 1).
�e MK test reveals �ve sites had a statistically signi�-cant negative trend for both winter and summer low
RECENT TRENDS IN IOWA STREAMFLOW: 1948-2002K. J. Franz and Kayla J. SteffensDepartment of Geological and Atmospheric Sciences, Iowa State University
Figure 1: Iowa watersheds used in this study. �e Des Moines Lobe is the shaded region in the north central portion of the state.
Figure 2: 10-year moving average of mean daily discharge in cubic meters per second for 10 Iowa watersheds.

Getting Into Soil & Water 17
�ows, and only the North Raccoon River has a statisti-cally signi�cant increase in summer low �ows (Table 1). �ese results are in contrast to other studies, which found signi�cant upwards trends in low �ows in the Midwest (Douglas et al., 2000; Schilling and Libra, 2003; Lins and Slack, 2005; Novotny and Stefan, 2006; Juckem et al., 2008).
�e MK test also reveals an increase in the number of high �ow days for all but one site (�ompson River), with �ve sites being statistically signi�cant (Boone, Maple, North Raccoon, Iowa and Salt Creek Rivers) (Table 1). Only three sites (Boone River, Maple River, and North Raccoon Rivers) have an increasing trend in the number of extreme �ow days per year, none of which were statistically signi�cant. �e decrease in extreme �ow days was signi�cant for the �ompson River, the southern-most basin studied (Table 1).
Our discharge analysis suggests, while discharge is increasing in the watersheds, the incidence of extreme �ows are not (at least this was unproven by the data used). Similarly, Novotny and Stefan (2007) found more basins in their Minnesota study have increases in the number of high �ow days relative to extreme �ow days.
�e central U.S. has been experiencing more variable summer precipitation and more intense rain events (Tak-
le, 2009); therefore, it is logi-cal that stream�ow would be increasing in Iowa. However, several studies have shown increasing precipitation alone does not su�ciently account for the increasing stream�ow observed in the Midwest, particularly in agricultural regions (Schilling and Libra, 2003; Juckem et al., 2008). In heavily managed areas, it is di�cult to separate the impact
of climate change from land use on the watershed pro-cesses (Tomer and Schilling, 2009). Shifts in land cover and land management are known to have impacts on the hydrologic response of Midwestern watersheds (Tomer et al., 2005; Jukem et al., 2008), and therefore must be kept in mind when considering the trends observed in Iowa stream�ow. S
Acknowledgements
Financial support for this work provided by Iowa State University and the University of Iowa’s Center for Global and Environmental Research are greatly appreciated.
References
IPCC (2007), Climate Change 2007: �e physical sci-ence basis. Contribution of Working Group I to the Fourth Assessment Report of the Intergovernmental Panel on Climate Change, S. Solomon, D. Qin, M. Manning, Z. Chen, M. Marquis, K. B. Averyt, M. Tignor, and H. L. Miller, eds., Cambridge University Press, Cambridge, U.K.
Juckem, P.F., R.J. Hunt, M. P. Anderson, and D.M. Robertson (2008), E�ects of climate and land man-agement change on stream�ow in the driftless area of Wisconsin, J.Hydrol., 355, 123-130. doi:10.1016/j.jhydrol.2008.03.010.
Kendall, M. G. (1975), Rank Correlation Methods, Gri�n, London.
Lins, H. F. and J. R. Slack (1999), Stream�ow trends in the United States, Geophys. Res. Lett., 26, 227-230. doi:10.1029/1998GL900291.
MK trend (# sites) pos/neg
Statistical signi�cance (# sites) pos/neg
Mean daily discharge 8/2 4/0.07-day summer low �ow 3/7 1/57-day winter low �ow 2/8 0/5High �ow days 9/1 5/0Extreme �ow days 3/7 0/1
Table 1: Number of sites with an increasing (pos) or decreasing (neg) Mann-Kendall (MK) trend, the number of sites with a statistically signi�cant trend at a 10% level.
Our discharge analysis suggests, while discharge is increasing in the watersheds, the incidence of extreme flows are not.
Continued on p. 12

Getting Into Soil & Water 18
Mann, H. B. (1945), Non-Parametric tests against trend, Economentrica, 13, 245-259.
McCabe G.J. and D.M. Wolock (2002), A step in-crease in stream�ow in the conterminous Unit-ed States, Geophys. Res. Lett., 29 (24), 2185. doi:10.1029/2002GL015999.
Novotny, E. V. and H. G. Stefan (2007), Stream �ow in Minnesota: Indicator of climate change, J.Hydrol., 334, 319-333. doi:10.1016/j.jhydrol.2006.10.011.
Schilling, K.E., and R.D. Libra (2003), Increased base�ow in Iowa over the second half of the 20th century, J. Am. Water Resour. Assoc., 39, 851–860. doi:10.1111/j.1752-1688.2003.tb04410.x.
Ste�ens, K., and K.J. Franz (2010) Late 20th century trends in upper Midwest watersheds: an investiga-tion of observed and modeled hydrologic storages and �uxes, International Journal of Climatology, in review.
Takle, G. (2009), Assessment of potential impacts of cli-mate changes on Iowa using current trends and future projections, Climate Science Initiative, Iowa State Uni-versity, Ames, IA, http://climate.engineering.iastate.edu/Document/Climate_Changes_for_Iowa_12.pdf
Todd, C.E. Davis, J.M Harbor, and B. Tyner (2006), Increasing magnitudes and frequencies of extreme precipitation events used for hydraulic analysis in the Midwest. J. Soil Water Conserv.61, 179-185.
Tomer, M.D., D.W. Meek, and L.A. Kramer (2005), Ag-ricultural Practices In�uence Flow Regimes of Head-water Streams in Western Iowa, J. Environ. Qual.34, 1547-1558. doi:10.2134/jeq2004.0199.
Tomer, M. D., and K.E. Schilling (2009), A simple approach to distinguish land-use and climate-change e�ects on watershed hydrology, J. Hydrol., 376, 24-33. doi:10.1016/j.jhydrol.2009.07.029.

Getting Into Soil & Water 19
Much attention is focused on the condition of Iowa urban streams and water quality. Small streams, such as College Creek in Ames, often serve as play areas for children and form the back-bone of community green spaces. �is article focuses on one Ames neighborhood and their approach to pollution their yards were contributing to neighboring Col-lege Creek. Working with Iowa State University researchers and students, residents constructed stormwater best management practices designed to remove the majority of pollutants from �rst �ush rains coming from their yards.
Problem
While the quality of water in streams is a product of runo� from its entire watershed, urban areas, by their nature, are known to consistently contribute certain pollutants. Both volunteer and technical water quality monitor-ing of Iowa streams, including College Creek, indicate persis-tently high concentrations of bacteria and nutrients such as nitrogen. Monitoring also indicated that pollutant concentrations tended to in-crease within urban areas compared with upstream rural portions of the watershed. �e sheer volume of stormwa-ter generated by urban streets and roofs also negatively impacts stream condition and water quality. Faced with these results, residents of Emerson Drive cul-de-sac in Ames (Figure 1) agreed to coordinate construction of stormwater treatment practices in their yards in order
to �lter stormwater runo� from their roofs and yards before entering the storm drain system leading to Col-lege Creek.
What They Did
�e goal of this community-university research e�ort was to capture and treat the �rst 1.25 inches of rainfall occurring in a given storm, eliminating this drainage reaching the storm drain system. Iowa State University’s Landscape Architecture Department coordinated with
“WE WANT TO HELP OUR STREAM...”Mimi Wagner
Associate Professor of Landscape Architecture, ISU College of Design
Figure 1. Base map of study site depicting both the stormwater treatment and control areas.

Getting Into Soil & Water 20
homeowners to both construct the bioretention cells used to treat the stormwater, as well as to measure the amount of water leaving their cul-de-sac before and after construction. Faculty and students �rst installed �ow meters in the storm drain pipe draining the cul-de-sac one year before construction began. Flow meters continuously monitor and record the amount of water �owing through the pipe. A second �ow me-ter was installed in a similar adjacent cul-de-sac and used as the “control” area where no stormwater practices were installed.
Residents and students constructed 18 bioretention cells on private property. �e cells were designed to appear as landscaped areas with local rock and native vegetation. Each cell included a 3’ deep exca-vated hole that was back�lled with an engineered soil mix, planted, edged and mulched. Iowa engineer-ing standards suggest this practice is e�ective in removing 65-100% of phosphorus, metals and bacteria as well as 30-65% of nitrogen and hydrocarbons from the stormwa-ter they in�ltrate. Bioretention cells were positioned in places to intercept the maximum amount of roof, driveway, and lawn drain-age. �is enabled treatment of as much stormwater as possible while reducing the quantity of stormwater released directly to the stream.
Fourteen of �fteen Emerson Drive homeowners agreed to participate in the project. �e average cost of bioretention cell construction was $609, not including labor. Of the total drainage area entering the storm drain system and Col-lege Creek, bioretention cells were
Figure 3. Completed and planted bioretention cell on Emerson Drive.
Figure 2. Bioretention cell under construction in homeowner’s yard.

Getting Into Soil & Water 21
constructed to capture and treat 80% of the roof drainage and 54% of lawn areas. �e 18 cells constructed totaled 2,128 square feet in size.
How it is working
Post-construction, signi�cantly less stormwater entered College Creek from the Emerson Drive cul-de-sac compared to the control area. Flow meters measured a 70% reduction in stormwa-ter volume reaching the storm drain during the �rst inch of rainfall compared with the control area (Figure 4). When rainstorms were larger than 1.25 inches, measured stormwater �ow was identical between the two sites (Figure 5). As designed, this feature assures homeowners that bioretention cells won’t contribute to �ooding in the event of large rainstorms, as excess water enters the storm drain system as originally con-structed. Importantly, near-record Ames rainfalls in August 2010 did not damage the bioretention cells nor cause �ooding.
�e Emerson Drive homeowners reported a sense of satisfaction with their contribution to water quality enhancement. �ey appreciated having “hard data” demonstrating their e�orts have paid o� in terms of converting stormwater runo� to groundwater in�ltration. Homeown-ers also acknowledged the amount of labor they invested in the bioretention gardens as well as the no-cost aspect of the project to them.
Conclusion
�is project provides an important precedent for urban areas and neighborhoods. �is project was funded and overseen by the City of Ames Public Works Department and through competitive funds from the Iowa Watershed Improvement Board. Iowa State University provided in-kind professional ser-vices. �ough this e�ort was low-cost, we can now dem-onstrate the bene�ts that can be derived from homeown-ers taking action to manage the stormwater their homes and yards produce. We also realize the importance of cooperative e�orts between stormwater management professionals, city sta� and homeowners. S
Figure 3. Pre-construction stormwater runo� monitoring indicated the treatment area (Emerson Drive cul-de-sac show in red) shed more water than the control area (shown in blue).
Pre-Construction – June 18, 2009 Storm Event (T= < 3-mo; 0.5 inches in 2 hrs)
Post-Construction – Sept. 25, 2009 Storm Event (T= < 3-mo; 0.54 inches in 8 hours)
Figure 2. Post-construction stormwater runo� monitoring demonstrated the treatment area (Emerson Drive cul-de-sac show in red) shed far less water than the than the control area (shown in blue) as water was captured in the bioretention cells rather than entering the storm drain system.
Getting Into Soil & Water 22
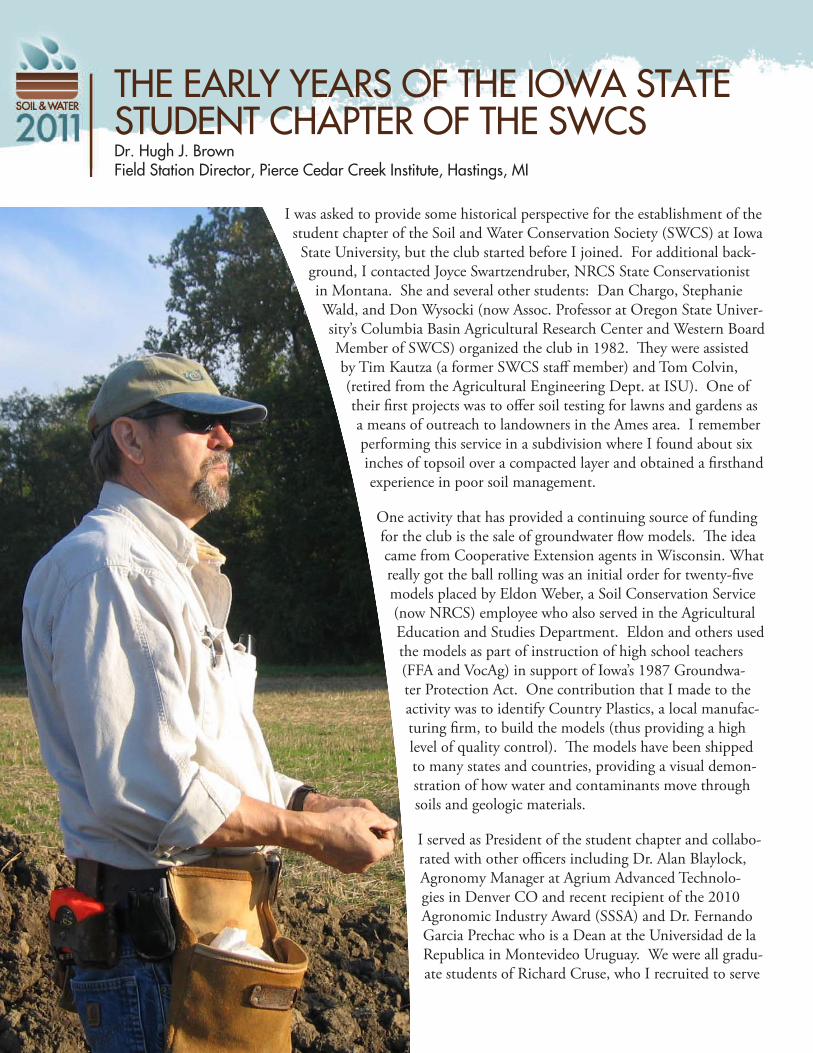
I was asked to provide some historical perspective for the establishment of the student chapter of the Soil and Water Conservation Society (SWCS) at Iowa State University, but the club started before I joined. For additional back-ground, I contacted Joyce Swartzendruber, NRCS State Conservationist in Montana. She and several other students: Dan Chargo, Stephanie Wald, and Don Wysocki (now Assoc. Professor at Oregon State Univer-sity’s Columbia Basin Agricultural Research Center and Western Board Member of SWCS) organized the club in 1982. �ey were assisted by Tim Kautza (a former SWCS sta� member) and Tom Colvin, (retired from the Agricultural Engineering Dept. at ISU). One of their �rst projects was to o�er soil testing for lawns and gardens as a means of outreach to landowners in the Ames area. I remember performing this service in a subdivision where I found about six inches of topsoil over a compacted layer and obtained a �rsthand experience in poor soil management.
One activity that has provided a continuing source of funding for the club is the sale of groundwater �ow models. �e idea came from Cooperative Extension agents in Wisconsin. What really got the ball rolling was an initial order for twenty-�ve models placed by Eldon Weber, a Soil Conservation Service (now NRCS) employee who also served in the Agricultural Education and Studies Department. Eldon and others used the models as part of instruction of high school teachers (FFA and VocAg) in support of Iowa’s 1987 Groundwa-ter Protection Act. One contribution that I made to the activity was to identify Country Plastics, a local manufac-turing �rm, to build the models (thus providing a high level of quality control). �e models have been shipped to many states and countries, providing a visual demon-stration of how water and contaminants move through soils and geologic materials.
I served as President of the student chapter and collabo-rated with other o�cers including Dr. Alan Blaylock, Agronomy Manager at Agrium Advanced Technolo-gies in Denver CO and recent recipient of the 2010 Agronomic Industry Award (SSSA) and Dr. Fernando Garcia Prechac who is a Dean at the Universidad de la Republica in Montevideo Uruguay. We were all gradu-ate students of Richard Cruse, who I recruited to serve
THE EARLY YEARS OF THE IOWA STATE STUDENT CHAPTER OF THE SWCSDr. Hugh J. BrownField Station Director, Pierce Cedar Creek Institute, Hastings, MI
Getting Into Soil & Water 23
as advisor for the club. In my last year at ISU, I served as the student member on the Board of Directors and attended the SWCS conferences in Salt Lake City and Edmonton Canada.
After completing my Ph.D. at ISU in 1989, I did a post doc at the University of Vermont and then joined the Natural Resources and Environmental Management Department at Ball State University in Muncie Indiana. After 18 years of teaching and research, I retired from the university to pursue consulting and conservation goals. Today, I continue to be active in the SWCS, in 2009 and I gave presentations on conservation col-laborations at the International SWCS meeting and on the history of conservation to the Hoosier Chapter. I am now very involved in the land trust community and
published a curriculum guide “Caring for Land Trust Properties” with the Land Trust Alliance (a national advocacy and support organization).
With the planet’s population approaching seven bil-lion people, our resources are being stretched to the limit. Protecting our future productivity and survival will require a dedicated e�ort on the part of farmers, consumers, government, and non-pro�t organizations. Over my career, I have seen how important it is to form conservation partnerships to implement management practices to save soil and protect water quality. �e Soil and Water Conservation Society and its members are key players in this conservation collaboration. As evidenced by the names above, many of the students associated with the club have gone on to careers that contribute to improved resource management and environmental protection. S
Over my career, I have seen how important it is to form conserva-tion partnerships to implement management practices to save soil and protect water quality.
Getting Into Soil & Water 24
�e soil survey program in the United States began in the late 1890’s. �e �rst soil survey in Iowa was of the Dubuque County area. Field work was completed in 1902 and the report was published in 1903. �e “life” of a soil survey is estimated to be about 30 years, so all Iowa counties have had multiple surveys.
Beginning in the mid 1960’s Iowa began an accelerated e�ort to map all counties in a short time. �e agencies involved were the Soil Conservation Service, Division of Soil Conservation, Iowa State University through the Ex-periment Station and Cooperative Extension Service and the counties. Costs were shared equally among federal, state, and county.
Most counties were mapped at a scale of 1:15840 (4 inches = 1 mile) on an aerial photo base. Approximately 12 person-years were required to map a 16 township county.
Soil surveys have gone through many phases over time. Since the initial surveys our knowledge of soils has in-creased, methods of collecting and presenting data have improved, and the present surveys are more detailed and accurate. However, soil surveys have always followed the same procedures of mapping, classi�cation, correlation, interpretation, and publication.
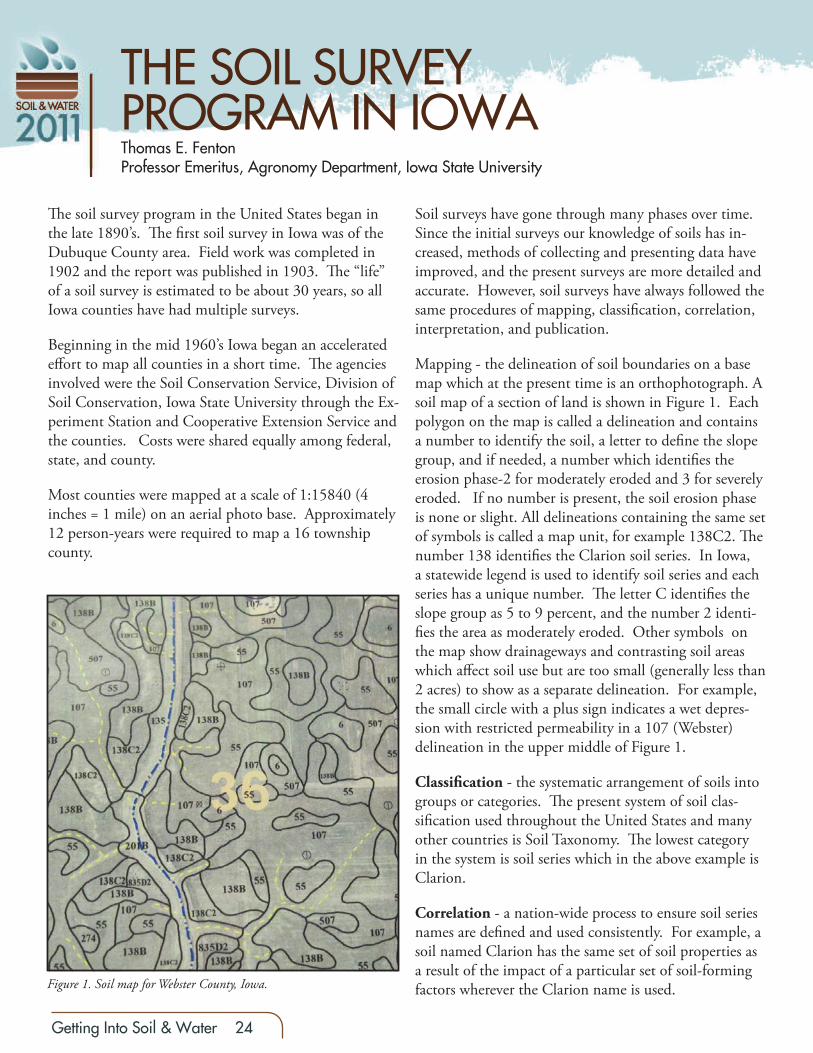
Mapping - the delineation of soil boundaries on a base map which at the present time is an orthophotograph. A soil map of a section of land is shown in Figure 1. Each polygon on the map is called a delineation and contains a number to identify the soil, a letter to de�ne the slope group, and if needed, a number which identi�es the erosion phase-2 for moderately eroded and 3 for severely eroded. If no number is present, the soil erosion phase is none or slight. All delineations containing the same set of symbols is called a map unit, for example 138C2. �e number 138 identi�es the Clarion soil series. In Iowa, a statewide legend is used to identify soil series and each series has a unique number. �e letter C identi�es the slope group as 5 to 9 percent, and the number 2 identi-�es the area as moderately eroded. Other symbols on the map show drainageways and contrasting soil areas which a�ect soil use but are too small (generally less than 2 acres) to show as a separate delineation. For example, the small circle with a plus sign indicates a wet depres-sion with restricted permeability in a 107 (Webster) delineation in the upper middle of Figure 1.
Classi�cation - the systematic arrangement of soils into groups or categories. �e present system of soil clas-si�cation used throughout the United States and many other countries is Soil Taxonomy. �e lowest category in the system is soil series which in the above example is Clarion.
Correlation - a nation-wide process to ensure soil series names are de�ned and used consistently. For example, a soil named Clarion has the same set of soil properties as a result of the impact of a particular set of soil-forming factors wherever the Clarion name is used.
THE SOIL SURVEY PROGRAM IN IOWAThomas E. FentonProfessor Emeritus, Agronomy Department, Iowa State University
Figure 1. Soil map for Webster County, Iowa.
Getting Into Soil & Water 25
Interpretation - the prediction of soil behavior for spe-ci�c uses or management based on inferences from soil properties. �ey may be either qualitative or quantita-tive estimates of soil behavior.
Publication - Compilation of soil information of a survey area including the descriptions, properties, clas-si�cation, interpretations, and maps. �e publications are available in hard copy and digital format. In the near future, they will be available only in digital format at: http://soildatamart.nrcs.usda.gov/state.aspx
Additional soil and land use information, plus a state-wide soil data base called the Iowa Soil and Interpreta-tions Database (ISPAID) are available at http://exten-sion.agron.iastate.edu/soils/
A great advance in contributing to improvement of soil surveys was the use of aerial photographs. �ey came into common usage in the late 1930’s. �eir use greatly increased the precision with which soil boundaries could be delineated on soil maps. Another important variable is the scale at which the soil map is made. Early surveys were made at a scale of one inch per mile. Beginning in the late 1950’s and continuing until 1990, the most common scale of mapping was 4 inches per mile. Since 1990, the scale used is 5.28 inches per mile.
Understanding of soils, their development, and proper-ties is based on knowledge of the �ve classic factors of soil formation-climate, organisms, topography, parent material, and time. Because of intensive use of the soil, human activity is considered by many to be a sixth soil forming factor. �e need for updates of soil surveys will continue as our knowledge of the interactions of the above factors continues to increase with introduction of new technologies including improved remote sens-ing techniques, Light Detection And Ranging (LiDAR), smart phones, and many other innovations. S
Approximately 12 person-years were required to map a 16 township county.
More planningin less time.
1238 Heires Ave. • Carroll, IA 51401 • 712.792.6248
Why spend 40 hours or more planning a conservation practice like a pond, waterway or wetland when you can create multiple options in 20 minutes with smart online software from Agren™.
Agren’s conservation planning tools help you convert LiDAR elevation data into high-quality plans with highly accurate estimates.
And that means you’ll spend less time at your desk and more time in the field, making a difference.
Call Stan at 712.792.6248 to schedule a webinar to see Agren’s software in action.
Extension educates.
From curiosity to positive life change.
www.extension.iastate.edu
photo courtesy Jerry DeWitt

Getting Into Soil & Water 26
As a young lad growing up on a farm, 70 and more years ago, I be-came aware of my personal reverence for the land. I am not refer-ring to the plat book de�nition of the land; my boundaries in-cluded all members of nature’s community: water, plants, animals and soil. I found my rootage and citizenship so natural, with my father always there to give de�nition and meaning to my deep-est questions and concerns. He was an ordinary man who respected nature and understood how to live in harmony with it. I learned very early in life that man shares the same fate as all other fellow land members. With this conserva-tion ethic wholly accepted, I grew to become a respecter and a defender of my complex community. It became abundantly clear that it is wrong to bring poverty to the land, so the user can achieve a pro�t. My a�ection for the land has never abandoned me.
Here in Northeast Iowa, we have hills. Where you have hills you have ditches; where you have ditches you have plows, and when they are combined you have erosion. In the early 1940s, my grandfather purchased his �rst tractor, a Minneapolis Moline with a two bottom plow. Nearly every farmer was moving from horse power to gas power.
Grandfather’s new tractor wasn’t equipped with fenders, which would have covered those rear steel wheels. For traction, the wheels were lined with sharp steel lugs that would penetrate into the ground. It also had a seat that could be swung from right to left for easy viewing ahead. Very little operator safety was designed into his new, modern machine. I am sure he sat on that seat with a proud grin that farmers today can still identify with. �at unfortunately was about to be replaced with cries of pain and agony.
On an early spring morning he climbed onto his new machine and went to the �eld to “plow in the ditches,” a common and accepted practice of �lling an eroded
AN AFFAIR WITH OUR LANDRichard JensenSoil Commissioner of Fayette County, Iowa
Getting Into Soil & Water 27
out ditch with soil by plowing in the edges, until the ditch is �lled with new soil. �e e�ects of this practice were temporary at best as it always eroded away again, somewhat like putting more �rewood in a stove after the �re has consumed the previous �ll. �e wood goes up in smoke and the soil goes down the nearest river. �e problem is that wood is a renewable resource, while the soil is not. �e land is left impoverished and depleted of nutrients used to grow healthy plants.
What was he thinking as he steered his iron horse along the unstable, soft side of that ditch? Were his thoughts of losing soil, conservation or proper land treatment? �ough he loved his farm, I doubt it. His purpose and objective was to �ll in the ditch in order to produce another corn crop. He was in strictly an economic mode and felt little or no obligation to the land. �en sud-denly, one wheel dropped over the side of the ditch; the seat slid violently over on to the moving wheel. Grand-pa was grabbed by the lugs and pulled under the wheel and crushed into the ground. With a mangled hip and a broken, bleeding leg, he watched as his new tractor and plow continued a short distance, as the tractor met its fate rolling over into the steep ditch.
Grandma was not tolerant of folks who showed up late for dinner, no excuse was acceptable and everyone respected that rule. When Grandpa did not show up for dinner she went to see why. She found him barely alive.
�e rest of the story is of the grief, sorrow and misery he endured until his death. It was not easy in those days to farm with an arti�cial leg. Without total physical abilities, Grandpa’s farm was crippled and threatened with �nancial failure. Hospitalized for ten months and a full-time hired man to pay were a few of the conse-quences of that unforgettable day. After several years of struggle and defeat, I was given the opportunity to “take over.” My story is written in honor and memory of them; although I do not believe they would approve of my sharing.
Many changes have occurred in the last 60 years. �e tractors are safer and arti�cial limbs enable the user
more comfort and the opportunity to lead a normal life. Technology has bene�ted and enlightened our lives tremendously. New inventions, tools and methods have enabled farmers to make changes to the landscape of unprecedented violence, rapidity and scope. �e result is less food and �ber producers operating the land, more humans reaching out to �ll their stomachs, and at the same time, plundering the shrinking planet of vanishing natural resources.
To make matters ever worse, each generation of children are more discon-nected from nature than ever before. �is separa-tion from the land is det-rimental to the wholesome development of our kids. �ey have been “high jacked” by the arti�cially synthetic virtual world of
amusement and now lack opportunity or desire to go outdoors. Without interactive exposure to the awesome natural world, they won’t develop a loving relationship with the earth. �ese future decision makers will de-termine the fate of our forests and open lands, our lakes and streams, our parks and agricultural lands. A simple truth is that we only take care of things we love and understand.
I have witnessed the assault on the land all my life; see-ing impaired waterways, abused forests, eroded soils and disappearing wildlife. We are more production orientated than ever before, but it is primarily for eco-nomic bene�t. We have more government regulation in wide forms of conservation management e�orts that pay farmers for decent land care behavior. Technology has lulled us all into a false sense of security; given time, more gadgets and gismos will enable mankind a substi-tute for a healthy environment. Anyway you look at it, our landscape cannot wait patiently for aid and comfort.
Could it be that my Grandfather’s accident holds some clue as to how we should treat the land? Are we all on a perilous road with disastrous results brought about due to our apathy and detachment from the life giving land? Do we need more fathers who illuminate for children the truth that the land should not su�er poverty for man to pro�t? I hope someday soon, we come to the under-standing that all life on earth shares the same fate. S
I have witnessed the assault on the land all my life; seeing impaired waterways, abused forests, eroded soils and disappearing wildlife.

Getting Into Soil & Water 28
DRAINAGE WATER MANAGEMENT FOR REDUCING NITRATE LOSSES FROM TILE DRAINED FIELDS
Excessive nitrate in surface waters increases the cost of water treatment for domestic use and each summer drives the formation of a hypoxic or low oxygen zone in the Northern Gulf of Mexico. Much of the nitrate in surface waters comes from arti�cially drained row crop land in the Midwest. �ere are over 7.8 million acres of drained lands in Iowa alone with an additional 43.8 million acres in the Midwest1. Research in Iowa and surrounding states over the past 10 years has clearly demonstrated nitrogen fertilizer manage-ment alone cannot reduce nitrate losses from drained �elds su�ciently to meet water quality goals2, thus additional methods to reduce nitrate losses are needed. Drainage water management (DWM) is a promising technology for reducing nitrate losses from arti�cially drained �elds. While there is an extensive history for the practice in North Carolina, little is known about the e�cacy or cost e�ective-ness of the practice under Midwest conditions.
DWM di�ers from conventional free arti�cial drainage in that a control structure such as a �ashboard riser is installed at the drainage outlet (Fig 1) allowing the farmer to manage the �eld’s drainage. By setting the elevation of the riser, the depth of the water table can be adjusted whenever drainage is occurring. When using DWM, the drain outlet is typi-cally set just below the soil surface during the winter or o�-season when a high water table within the �eld would not hinder agricultural activity or crop growth. During planting
and harvesting, the outlet is set to the depth of the tile drain to give maximum drainage for good tra�c-ability and seed bed tilth. �e option also exists to manage the water table during the growing season by raising the outlet within a few feet of the surface to retain some water in
the �eld which would otherwise drain and have the water available for crop uptake – potentially increasing crop yields. DWM is best suited for �elds that are �at, with slopes less than 0.5%. �erefore, a control structure can control the
Dan B. Jaynes, Soil ScientistRob Malone, Agricultural Engineer, USDA-ARSKelly Thorp, Agricultural Engineer, USDA-ARS
Figure 1. Schematic of a drainage water management control structure. In the winter the water table is raised to conserve water and nitrate that may be dis-solved in it (left). In the spring before planting and in the fall before harvest, the water table is lowered to allow for �eld operations (middle). In the summer, the water table can be partially raised to prevent over drainage and retain some water (and nutrients) for the growing crop. After Frankenberger et al.7
If DWM were adopted on all of this land, nitrate losses in tile drainage could be reduced by approximately 83 million kg/yr.

Getting Into Soil & Water 29
water table within 1 or 2 feet of elevation for at least 20 acres and where pattern drainage systems have been installed.
In earlier studies, DWM has been found to primarily reduce the annual amount of water discharged at the drain outlet3
rather than lower the concentration of nitrate in the drain-age. �e reduction in discharge also reduces the loss of agricultural chemicals such as nitrate dissolved in the water. Reductions observed outside of the Midwest have ranged
Figure 2. Reduction in nitrate losses from arti�cial drainage if Drainage Water Management is installed on all suitable corn ground. From Jaynes et al.5
Table 1. Annual and 4-yr average mass loss by drainage treatment and F statistic for individual year and 4-yr average comparisons.Year 2006 2007 2008 2009 4-yr sumCrop corn soybean corn soybean all
Treatment kg ha-1
CNV 27.6 52.3 45.6 16.0 137.2DWM 20.5 30.5 35.1 13.2 95.6
DWM-CNV -7.1 -21.8 -10.5 -2.8 -41.6*signi�cant at P=0.05
Table 2. Average crop yield for conventional, CNV, and drainage water management, DWM, for 2006–2009 and the F statistic for the within year comparisons.
Year 2006 2007 2008 2009Crop corn soybean corn soybean
Treatment bu ac-1
CNV 165.0 55.6 211.3 56.3DWM 174.2 62.2 210.9 60.0
DWM-CNV 9.2 6.6 -0.4 3.7signi�cant at P=0.05
Getting Into Soil & Water 30
from 30 to 50%3, and it has been estimated that DWM is being used on as much as 1.98 million acres in the U.S.3. However, little is known of the potential for this practice to reduce nitrate contamination of Midwest Rivers.
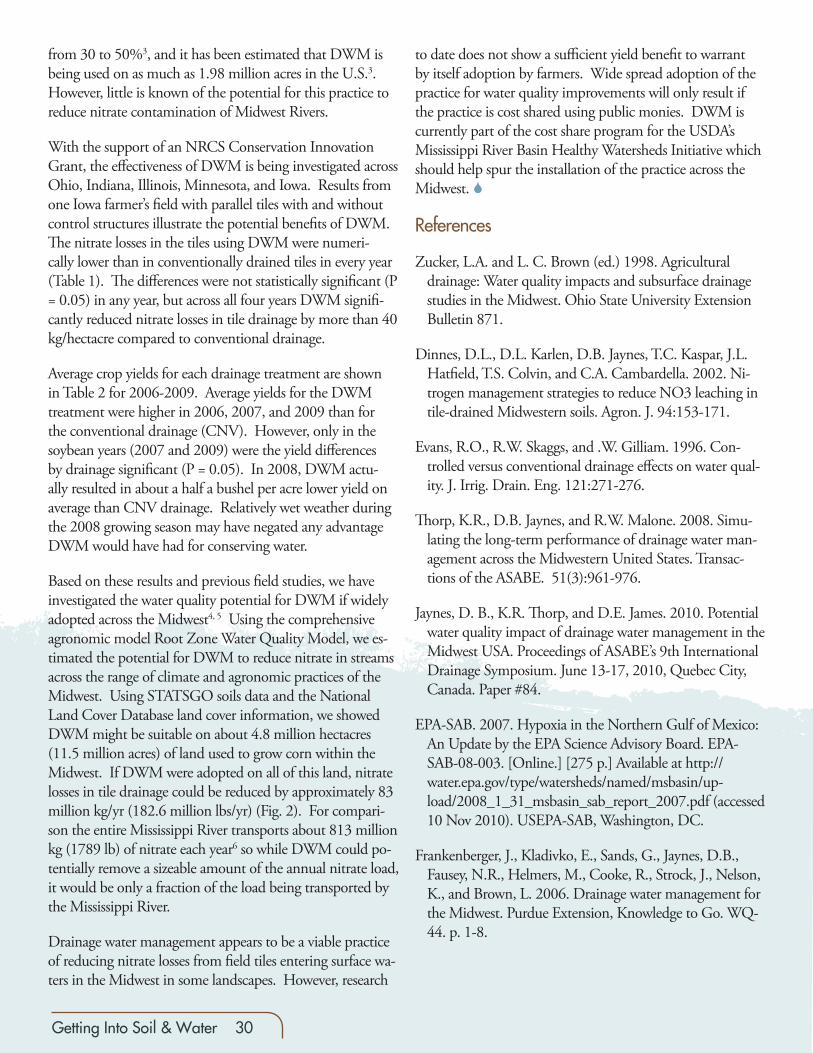
With the support of an NRCS Conservation Innovation Grant, the e�ectiveness of DWM is being investigated across Ohio, Indiana, Illinois, Minnesota, and Iowa. Results from one Iowa farmer’s �eld with parallel tiles with and without control structures illustrate the potential bene�ts of DWM. �e nitrate losses in the tiles using DWM were numeri-cally lower than in conventionally drained tiles in every year (Table 1). �e di�erences were not statistically signi�cant (P = 0.05) in any year, but across all four years DWM signi�-cantly reduced nitrate losses in tile drainage by more than 40 kg/hectacre compared to conventional drainage.
Average crop yields for each drainage treatment are shown in Table 2 for 2006-2009. Average yields for the DWM treatment were higher in 2006, 2007, and 2009 than for the conventional drainage (CNV). However, only in the soybean years (2007 and 2009) were the yield di�erences by drainage signi�cant (P = 0.05). In 2008, DWM actu-ally resulted in about a half a bushel per acre lower yield on average than CNV drainage. Relatively wet weather during the 2008 growing season may have negated any advantage DWM would have had for conserving water.
Based on these results and previous �eld studies, we have investigated the water quality potential for DWM if widely adopted across the Midwest4, 5 Using the comprehensive agronomic model Root Zone Water Quality Model, we es-timated the potential for DWM to reduce nitrate in streams across the range of climate and agronomic practices of the Midwest. Using STATSGO soils data and the National Land Cover Database land cover information, we showed DWM might be suitable on about 4.8 million hectacres (11.5 million acres) of land used to grow corn within the Midwest. If DWM were adopted on all of this land, nitrate losses in tile drainage could be reduced by approximately 83 million kg/yr (182.6 million lbs/yr) (Fig. 2). For compari-son the entire Mississippi River transports about 813 million kg (1789 lb) of nitrate each year6 so while DWM could po-tentially remove a sizeable amount of the annual nitrate load, it would be only a fraction of the load being transported by the Mississippi River.
Drainage water management appears to be a viable practice of reducing nitrate losses from �eld tiles entering surface wa-ters in the Midwest in some landscapes. However, research
to date does not show a su�cient yield bene�t to warrant by itself adoption by farmers. Wide spread adoption of the practice for water quality improvements will only result if the practice is cost shared using public monies. DWM is currently part of the cost share program for the USDA’s Mississippi River Basin Healthy Watersheds Initiative which should help spur the installation of the practice across the Midwest. S
References
Zucker, L.A. and L. C. Brown (ed.) 1998. Agricultural drainage: Water quality impacts and subsurface drainage studies in the Midwest. Ohio State University Extension Bulletin 871.
Dinnes, D.L., D.L. Karlen, D.B. Jaynes, T.C. Kaspar, J.L. Hat�eld, T.S. Colvin, and C.A. Cambardella. 2002. Ni-trogen management strategies to reduce NO3 leaching in tile-drained Midwestern soils. Agron. J. 94:153-171.
Evans, R.O., R.W. Skaggs, and .W. Gilliam. 1996. Con-trolled versus conventional drainage e�ects on water qual-ity. J. Irrig. Drain. Eng. 121:271-276.
�orp, K.R., D.B. Jaynes, and R.W. Malone. 2008. Simu-lating the long-term performance of drainage water man-agement across the Midwestern United States. Transac-tions of the ASABE. 51(3):961-976.
Jaynes, D. B., K.R. �orp, and D.E. James. 2010. Potential water quality impact of drainage water management in the Midwest USA. Proceedings of ASABE’s 9th International Drainage Symposium. June 13-17, 2010, Quebec City, Canada. Paper #84.
EPA-SAB. 2007. Hypoxia in the Northern Gulf of Mexico: An Update by the EPA Science Advisory Board. EPA-SAB-08-003. [Online.] [275 p.] Available at http://water.epa.gov/type/watersheds/named/msbasin/up-load/2008_1_31_msbasin_sab_report_2007.pdf (accessed 10 Nov 2010). USEPA-SAB, Washington, DC.
Frankenberger, J., Kladivko, E., Sands, G., Jaynes, D.B., Fausey, N.R., Helmers, M., Cooke, R., Strock, J., Nelson, K., and Brown, L. 2006. Drainage water management for the Midwest. Purdue Extension, Knowledge to Go. WQ-44. p. 1-8.

Getting Into Soil & Water 31
China experiences serious soil erosion due to its complex diverse topography across the 9,600,000 km2 (3,700,000 mi2) of its mainland (slightly smaller than the U.S.) and pressure brought on by its high population - more than 1.3 billion citizens. According to the U.S. soil classi�cation system, the Black Soil (Molli-sol - similar to most Iowa soils) region of Northeast China includes 185,100 km2 (72,200 mi2) in Heilongjiang Province, 57,700 km2 (22,500.5 mi2) in Jilin Province, 45,500 km2 (17,700 mi2) in the eastern part of Inner Mon-golian Province, and 14,600 km2 (4,700 mi2) in Liaoning Province (Liu & Zhang, 2006).
As the most important commodity grain production base of China, the Black Soil region of Northeast China is su�ering water runo� and unsustainable soil loss annually. �e area in black soil region experi-encing heavy soil erosion approached 276,000 km2 (107,812 mi2) in 2010 with water erosion heavily impacting an area of 180,000 km2 (70,312 mi2), freeze/thaw erosion impacting an area of 62,000 km2 (24,219 mi2), and wind erosion impacting an area of 34,000 km2 (13,281 mi2). Approximately 460,000 erosion created gullies have been identi�ed (Chinese Ministry of Water Resources et al., 2010). During the last half century, on average top soil depth has been reduced from approximately 60 – 70 cm (24 – 28 inches) to 20 – 30 cm (8 – 12 inches), organic matter has been reduced from 12% to 2 – 3% , bulk density has increased from 0.79 g·cm-3 to 1.26 g·cm-3. Gulley formation has lim-ited farming on 4,830 km2 (1,887 mi2) and soil loss induced crop loss in this area amounts to more than 19,000,000 t yr-1.
�e high erosion rate in the Black Soil region of China re-sults from a combination of natural and anthropic factors. �e Northeast China landscape is characterized by hills with gentle gradient of 3 – 5° and long slopes of 500 m (1,640 ft) – 1,000 m (3,280 ft), which gives rise to a large erosion potential of 3,000 – 5,000 t·km-2·yr-1 (13 – 22 ton ac-1 yr-1) (Shen et al.,1993). In addition, 75% of the yearly precipitation typically falls in June to August because of the prevailing temperate continental monsoon climate in the Black Soil region. �ese intensive rain-falls increase soil erosion by 70%, comparing with the rainfalls well distributed throughout the year (Cui et al., 2007). Freeze/thaw cycle induced erosion increases in the
VISIBLE AND INVISIBLE CAUSES FORSOIL EROSION IN NORTHEAST CHINA
Xiangwei Chen & Enhen Wang
Getting Into Soil & Water 31

Getting Into Soil & Water 32
Black Soil area of Northeast China are of great concern. Absence of crop residue on the soil surface in winter in-creases the frequency and intensity of freeze/thaw cycles, impacting aggregate stability which in turn impacts soil erosion potential from spring rainfall. In this region, the retreat rate of gully heads may reach rates as high as 12 m·yr-1 (39.4 ft yr-1) (Hu et al., 2007). Additionally, the nature and proper-ties of black soil in this region also favors elevated soil erosion rates. Black soil in Northeast China is developed from lacus-trine deposits, Quaternary Loessial Loam. Higher clay content and lower water conductivity in the subsoil inhibits in�ltration and further aggravates the topsoil erosion problems. Where these situations exist the subsoil also has a higher erodibility compared to top-soil (Zhang et al., 2002). �is means gullies will develop quickly and the subsoil may be eroded rapidly once the topsoil is lost.
Human in�uence on soil erosion is also critical in the Black Soil region of Northeast China. Setting a variety of obvious factors aside, land ownership is the root of soil erosion in a way. Farmers in China do not own the land they farm. Every square inch of land in China belongs to the nation/government. Farmers can use the farm land handed out by the government; however, they are not al-lowed to trade or sell that land - ever. So the farmers do
not care about soil quality in the long run. �ey overuse their temporal lands to maximize pro�ts as much as possible. Most farmers still use conventional tillage or some form of conservation tillage, but no farmers have enough land to use no-tillage. �ey cannot a�ord to pay for expensive machines and of course they cannot a�ord
the matched no-tillage services, such as weed and insect pest management. Is it fair to say that the Chinese government is blocking development of agriculture and increasing soil erosion potential in black soil region of China? It is too early to judge.
�e Chinese government directs Chinese farmers to
feed 25% of the world’s people while using only 9% of the world’s farm land, which would be a great contribu-tion to world food security. Socialist public ownership of land was a very important policy for maintaining public stability at the beginning of modern day China and before China joined World Trade Organization (WTO). More and more agricultural products are allowed to be imported since China’s accession to WTO, which in theory should reduce the pressure on land use in China and therefore lower the soil erosion risk. However, it is not yet the right time to encourage Chinese farmers to step into the world market and trade by themselves. In 2008, two thirds of Chinese farmers had less than 8 years of education and still need Chinese government’s
Farmers can use the farm land handed out by the government; however, they are not allowed to trade or sell that land - ever. So the farmers do not care about soil quality in the long run.

Getting Into Soil & Water 33
protection. Improved policy and economic development is more important than advances in science and technol-ogy in China, a socialist state with a population of 1.3 billion.
Farm �elds in the Black Soil region in Northeast China are being “cut up and cut o�” by numerous gullies; however, Mollisol �elds in Iowa are “sewn together” by grass �lter strips. �e same productive soil resource have di�erent pictures in the world’s di�erent hemispheres, but they will have one ultimate fate theoretically — bur-ied in seabed of the world’s oceans if not managed more appropriately. We hope the funeral can be stopped, or postponed as long as we possibly can. S
References
Cai M. Cui M. and Fan H.M. 2007. Progress on Soil Erosion Research in Northeast China. Research of Soil and Water Conservation.14 (5):29 – 34.
Chinese Ministry of Water Resources, Chinese Academy of Sciences, Chinese Academy of Engineering. 2010. Soil and Water Conservation and Ecological Security of China (Black Soil Region of Northeast China). Beijing: Science Press.
Hu G., Wu Y. Q., Liu B. Y., Yu Z. T., You Z. M. and Zhang Y. G. 2007. Short-term gully retreat rates in the rolling hills of the black soils in NE China. Catena. 71: 321-327.
Liu C.M. and Zhang Z.Y. 2006. Mollisol in Northeast China: Area and Distribution. Agricultural Science of Heilongjiang Province, (2): 23 - 25.
Shen B. and Yang H.J. 1993. Soil Erosion in Songliao Basion and controlling countermeasure. Bulletin of Soil and Water Conservation.13 (2):28 – 32.
Zhang A.G., Ma Z.Z., Yang Q.K. and Zhang P.C.2002. �e Research Advance in Soil Factor of Water and Soil Loss in China. Journal of Shanxi Teacher’s University (Natural Science Edition).16(1):79 - 85.
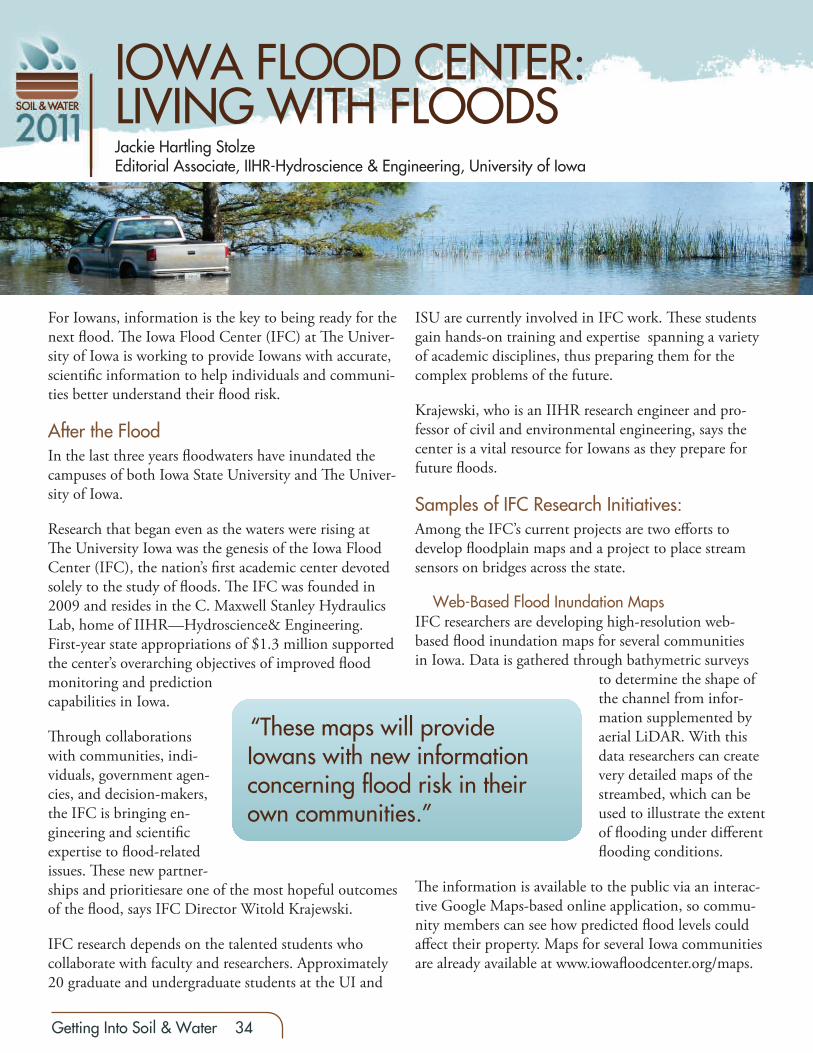
Getting Into Soil & Water 34
For Iowans, information is the key to being ready for the next �ood. �e Iowa Flood Center (IFC) at �e Univer-sity of Iowa is working to provide Iowans with accurate, scienti�c information to help individuals and communi-ties better understand their �ood risk.
After the FloodIn the last three years �oodwaters have inundated the campuses of both Iowa State University and �e Univer-sity of Iowa.
Research that began even as the waters were rising at �e University Iowa was the genesis of the Iowa Flood Center (IFC), the nation’s �rst academic center devoted solely to the study of �oods. �e IFC was founded in 2009 and resides in the C. Maxwell Stanley Hydraulics Lab, home of IIHR—Hydroscience& Engineering. First-year state appropriations of $1.3 million supported the center’s overarching objectives of improved �ood monitoring and prediction capabilities in Iowa.
�rough collaborations with communities, indi-viduals, government agen-cies, and decision-makers, the IFC is bringing en-gineering and scienti�c expertise to �ood-related issues. �ese new partner-ships and prioritiesare one of the most hopeful outcomes of the �ood, says IFC Director Witold Krajewski.
IFC research depends on the talented students who collaborate with faculty and researchers. Approximately 20 graduate and undergraduate students at the UI and
ISU are currently involved in IFC work. �ese students gain hands-on training and expertise spanning a variety of academic disciplines, thus preparing them for the complex problems of the future.
Krajewski, who is an IIHR research engineer and pro-fessor of civil and environmental engineering, says the center is a vital resource for Iowans as they prepare for future �oods.
Samples of IFC Research Initiatives:Among the IFC’s current projects are two e�orts to develop �oodplain maps and a project to place stream sensors on bridges across the state.
Web-Based Flood Inundation MapsIFC researchers are developing high-resolution web-based �ood inundation maps for several communities in Iowa. Data is gathered through bathymetric surveys
to determine the shape of the channel from infor-mation supplemented by aerial LiDAR. With this data researchers can create very detailed maps of the streambed, which can be used to illustrate the extent of �ooding under di�erent �ooding conditions.
�e information is available to the public via an interac-tive Google Maps-based online application, so commu-nity members can see how predicted �ood levels could a�ect their property. Maps for several Iowa communities are already available at www.iowa�oodcenter.org/maps.
IOWA FLOOD CENTER:LIVING WITH FLOODSJackie Hartling StolzeEditorial Associate, IIHR-Hydroscience & Engineering, University of Iowa
“These maps will provide Iowans with new information concerning flood risk in their own communities.”

Getting Into Soil & Water 35
The Iowa Floodplain Mapping ProjectBuilding on the success of the �ood inundation maps, IFC researchers have begun work on a project that will provide less-detailed �oodplain maps for most of Iowa. �e four-year Iowa Floodplain Mapping project is funded with $10 million from the U.S. Department of Housing and Urban Development. Working closely with the Iowa Department of Natural Resources (DNR), the IFC will develop FEMA-approved �oodplain maps for the 85 Iowa counties that were declared federal disaster areas after the 2008 �oods.
“�ese maps will provide Iowans with new information concerning �ood risk in their own communities, so they are empowered to make informed land use and land management decisions,” says Nathan Young, an IIHR associate research engineer and manager of the project.
IFC researchers will map all streams draining one square mile or more in each of the 85 Iowa counties, relying on statewide LiDAR data recently collected by the DNR. LiDAR is a remote sensing technology used to develop digital elevation models of the land surface. Young says this will make it possible to accurately describe Iowa’s river and stream networks, develop computer-based �ood simulations, and delineate �oodplains. In the process, researchers hope to develop innovative, e�cient new �oodplain mapping tools. Once completed, the maps will be available online to guide �oodplain regula-tion and management.
Affordable Stream Stage MonitoringUntil recently, gauges to measure river and stream levels were few and far between in Iowa. IFC students aided in the development of an a�ordable electronic sensor to measure stream levels and transmit up-to-the-minute data to the center. �e sensor is placed on bridges and uses sonar to measure the distance from the water’s surface to the sensor (Figure 1). �is information, trans-mitted via cell phone to a central database, provides an accurate picture of current stream levels.
�e DNR and the IFC recently completed a pilot proj-ect to deploy a preliminary network of 50 sensors across the state. A statewide system that could be in place within a few years would enhance the ability to monitor stream stages and predict �ooding.
Renewed state funding in 2010 and other grants al-low the IFC to continue advancing our understanding of �oods. In November 2010, for example, new fund-ing from the U.S. Department of Housing and Urban Development was announced to support pilot projects that help Iowa minimize erosion, manage runo�, and mitigate future �ood damage. �is project and others to come will help ensure that Iowa is better prepared to handle inevitable future �ooding.
To learn more about these projects and others at the IFC, visitwww.iowa�oodcenter.org. S
Figure 1. A gauge measuring water levels under a bridge transmits up-to-the-minute data to the Iowa Flood Center.

Getting Into Soil & Water 36
Developing a viable biofuels industry is crucial because: (1) we are rapidly approaching “peak oil” when all known, recoverable petroleum reserves will begin to diminish; (2) our dwindling global oil supplies will likely increase tension between petroleum suppliers and consumers; (3) oil price ultimately controls societal cost for food, feed, �ber, and manufactured goods; (4) oil use contributes to negative environmental impacts, including greenhouse gas (GHG) emissions; (5) oil supports current agricultural production systems that often have unintended environmental consequences, such as increased sedimentation, nutrient runo�, leaching and hypoxia; and (6) global demand for energy will increase as population and economic equity continue to rise. Sustainable production of many di�erent biofuels will help to simultaneously address all of these complex interrelated challenges, but how will it a�ect our water resources? Winning a multimillion dollar lottery is undoubtedly easier than providing a de�nitive answer, but as students and teachers, it is imperative that we examine the multiple factors that make this seemingly simple question such a wicked challenge.
According to the U.S. Government Accountability O�ce (GAO), the impact of increased biofuels production on water resources will depend on the type of feedstock (the material used to produce biofuels such as corn grain, crop residue, switchgrass, miscanthus, poplar, or willow), how it’s grown, and where it’s grown. Di�erent feedstocks use di�erent amounts of water and di�erent areas have more or less rainfall. �e biofuels impact on water resources will also depend on the vulnerability of local water resources as well as the type of conversion process and the re�nery’s water use e�ciency.
To understand the complexity of predicting biofuel e�ects on water quantity and quality, we must �rst step back from biofuels production per se and examine the global hydrologic cycle. In a recent viewpoint prepared for the Soil and Water Conservation Society, Dr. Warren Busscher, USDA-ARS (personal communication, 2010) pointed out that our planet is three quarters ocean, and although at �rst glance, one would expect that there would be enough water for everyone, 99% of that water is either too saline or exists as ice and therefore unavailable to humans. Less than 1% of global water exists in groundwater, lakes, or streams, and because of competition from industry, municipalities, and other energy producers, not all of that is available to agriculture or more speci�cally biofuels production. Currently, the U.S. uses 48% of its
UNRAVELING WATER QUALITY AND QUANTITY EFFECTS OF BIOFUELS PRODUCTIONDouglas L. KarlenNational Laboratory for Agriculture and the EnvironmentUSDA – Agricultural Research Service (ARS)

Getting Into Soil & Water 37
fresh and weakly saline water for thermoelectric power generation, but evaporation and the power generation consume only 2 to 3% of this water. �at is 97 to 98% of the water used for power generation is returned in its original form and is therefore potentially available for reuse, while 2 to 3% is lost by evaporation or becoming a part of the product. Municipal withdrawals account for another 10%, but nearly 90% of that water is returned as wastewater that can be treated and reused. Finally, industry accounts for another 21% of U.S. freshwater withdrawals, but the quantity and quality being returned is highly variable.
Agricultural water use di�ers from use by these other entities in that most of the water is consumed through evapotranspiration (ET) that supports plant growth and development. Water is also consumed when used to leach salts from the soil and thus manage soil salinity. With or without a biofuels industry, agriculture uses large quantities of water. Freshwater extraction ranges from less than 20% to more than 90% for di�erent countries depending upon climate, productivity and water use e�ciency (WUE) of the crops being grown. �e ratio quantifying the amount of plant dry matter produced for a speci�c quantity of water used is de�ned as water use e�ciency. �e WUE value varies greatly depending on crop species, location, culture practice, climate and weather, and other factors. Growing plants is very water intensive because as much as 1000 pounds of water may be required to produce just one pound of plant material. Fortunately, the transpired water is recycled in the hydrologic cycle. It falls as precipitation, and after in�ltrating into the soil, running o� into streams or lakes, or percolating to deeper aquifers, it is once again available for ET in support of plant growth or other uses. Unfortunately, the groundwater portion of the cycle cannot always be replenished as fast as it is used in many drier regions and as a result groundwater is often irreversibly mined. �e Ogallala Aquifer, located in the U.S. Great Plains, is one example where water mining has occurred. A 2009 U.S. Geological Survey (USGS) report stated that in parts of southwest Kansas and the Texas Panhandle, groundwater levels have dropped by
more than 150 feet due to intensive crop irrigation and minimal aquifer recharge.
With a more complete understanding of the hydrologic cycle, we can now return to the core question – how will increased biofuels production a�ect water quantity and quality? As an agricultural product, the feedstock used for production of biofuels is highly dependent on water that can be provided through either rainfall or irrigation. �erefore, to accurately assess the impact of biofuels, the value of water and appropriateness of using it for feedstock production must be examined separately for rainfed and irrigated systems. Rainfed or natural systems where biomass production is based on water coming solely from precipitation can be sustained; water will not normally be limiting well into the future unless climate changes substantially. Conversely, if irrigation from a depleting aquifer is needed to produce feedstock for biofuels, there is little doubt the practice cannot
be sustained. When the aquifer’s water is gone, crop production ends. Additionally, several challenging questions must be asked: is the remaining water best used for human consumption, food production, recreation, or biofuel production? How important is using water to produce biofuel compared
to other water uses when water is limited?
Water is also important for conversion of feedstocks into biofuels, speci�cally for heating, cooling, and the chemical processes involved. For the corn based biofuels conversion process, water consumption has decreased dramatically during the past decade, falling from an average of 5.8 gallons of water per gallon of ethanol in 1998, to 3.0 gallons/gallon or less in 2009. For comparison, the recovery and re�ning of crude oil requires 3.6 to 7.0 gallons of water per gallon of fuel. Water requirements for conversion of cellulosic materials will depend on the feedstock and the conversion process. �ese systems are not fully developed, but current estimates of water use range from 1.9 to 6.0 gallons/gallon for ethanol production or 1.0 gallon/gallon for biodiesel.
�e real impact of biofuels production on water use will
The real impact of biofuels production on water use will therefore depend on which feedstock is being considered and where it is being grown.

Getting Into Soil & Water 38
therefore depend on which feedstock is being considered and where it is being grown. For corn, approximately 1.7 million gallons of water per acre are required to produce a crop averaging 225 bu/acre. Water use to grow the corn for each quarter section of land (160 acres) will therefore be approximately 272 million gallons which is similar to the 300 million gallons of water required annually for a 100 million gallon ethanol biofuels conversion facility. Approximately 160,000 acres of corn will be required to supply the corn grain for such a facility. �e quantity of water needed to grow the feedstock (corn grain in this example) is orders of magnitude greater than that needed for converting feedstock to ethanol. For irrigated areas, the impact of water use by the conversion facility would be small compared to the amount of water used for crop production, but for communities where irrigation is not common, water withdrawal and use in the conversion facility would be relatively large and the main potential
impact.
With regard to location, 89% of the U.S. corn crop in 2007 and 95% of the ethanol was produced in the upper and lower Midwest. Irrigation water use in this area ranges from 7 to 321 gallons of water per gallon of ethanol depending upon location. Obviously, climate is the driving force with North Dakota, South Dakota, Nebraska, and Kansas consuming an average of 865 gallons of irrigation-derived water per bushel of grain compared to between 19 and 38 gallons/bushel of irrigation-derived water in the predominantly rain-fed areas of Iowa, Illinois, Indiana, Ohio, Missouri, Minnesota, Michigan, and Wisconsin (Table 1).
Water use by feedstock for cellulosic biofuels is relatively unknown because they are not being grown at a commercial scale. However, cellulosic feedstock is expected to have less water use impact for several reasons.
Table 2. Estimated evapotranspiration for selected potential biofuels feedstock crops in Illinois†.
Observation period Rainfall (in) PET (in) Estimated ET (in)
Miscanthus Switchgrass Corn
2006 to 2008 average 15.83 24.57 14.49 9.76 10.39
14 May - 8 Oct. 2007 12.40 29.80 14.76 12.05 10.47
12 June - 19 Oct. 2006 15.04 21.50 15.00 7.99 10.75
†Adapted from McIsaac et al. 2010. J. Environ. Qual. 39:1790-1799.
Table 1. Average irrigation-derived water consumption for corn grain ethanol production in the primary corn producing regions of the United States†.
Water UseUSDA Region 5
(Iowa, Indiana, Illinois, Ohio, & Missouri)
USDA Region 6(Minnesota, Wisconsin,
& Michigan)
USDA Region 7(North Dakota, South Dakota, Nebraska, &
Kansas)
Gallons of water / gallons of ethanol
Groundwater irrigation 6.7 10.7 281.2
Surface water irrigation 0.4 3.2 39.4
Total 7.1 13.9 320.6
Conversion 3.0 3.0 3.0
Total water consumption ‡ 10.0 16.8 323.6
† Adapted from GAO-10-116 ‡ Not including precipitation

Getting Into Soil & Water 39
First, agricultural residues (e.g. corn stover, wheat or rice straw, sugarcane bagasse) are co-products for which water use is generally calculated based on grain or sugar production. �erefore, many people argue that no additional water is required for those materials. Perennial grasses (e.g. switchgrass, miscanthus, mixed prairie) may require less water than corn grain provided adequate supplies can be produced without irrigation, but if rainfall is limited, water use may actually be greater (See Table 2). For students and teachers interested in learning more about crop water use and its potential impact on ethanol production, please see http://www.ars.usda.gov/main/site_main.htm?modecode=54-07-00-00 and select the section entitled “Products and Services.”
With regard to water quality, there is generally greater concern regarding increased corn production as a biofuel feedstock because of the potential for increased runo� and leaching of nutrients into lakes and streams. �ere is also concern that if prices for biofuels feedstock increase, marginal lands will once again be brought into row crop production without proper soil and water conservation practices. If this occurs, higher applications of fertilizers and pesticides to support feedstock production could result in greater delivery of sediment, nutrients, and pesticides to surrounding water resources. Biofuels production could also a�ect water quality as a result of the contaminate discharge from conversion facilities. However, once again the type of contaminants and discharge rates are mostly unknown for cellulosic conversion to biofuels because of potential di�erences in the conversion processes.
With equal vigor, others argue that increased perennial plant lignocellulosic feedstock production, especially in marginal lands and selected environmentally sensitive areas, would improve soil and water quality by intercepting runo� and capturing nutrients moving through the shallow groundwater �ow. Use of diverse cellulosic feedstocks as bu�ers between intensive crop production areas and vulnerable water quality areas is the basis for managing biofuels production systems using a “landscape vision.” Diverse management zones could be created starting with deep-rooted woody species near streams with adapted, deep-rooted perennial grasses between the trees and grain crops. Such a landscape design would provide multiple ecosystem services, especially with regard to reducing the contaminant load entering streams.
In summary, passage of the Energy Independence and Security Act (EISA) of 2007 requiring increased biofuel use in the U.S. raised many unanswered questions including the probable e�ects of biofuels on water quantity and quality. Undoubtedly, the most realistic answer to that question is “It Depends.” �is may not be a satisfying answer for many readers, but hopefully this article has provided a better understanding of how complex and di�cult it is to answer this seemingly simple question. S
Selected References
Boutraa, T. 2010. Improvement of water use e�ciency in irrigated agriculture: A review. J. of Agronomy. 9:1-8.
FAO, 2001. Crops and Drops: Making te best use of water for irrigation. Food and Agriculture Organiza-tion of the United Nations, Rome, Italy.
GAO. 2009. Energy-water nexus. Report to the Chair-man, Committeee on Science and Technology, Hose of Representatives. GAO-10-116. http://www.gao.gov/new.items/d10116.pdf (veri�ed 12-12-10)
Gopalakrishnan, G., M.C. Negri, M. Wang, M. Wu, S. Snyder, and L. LaFreniere, 2009. Biofels, land and water: A systems approach to sustainability, Environ. Sci. Technol., 43:6094–6100.
Hutson, S. S., N.L. Barber, J.F> Kenny, K.S. Linsey, D.S. Lumia, and M.A. Mauin. 2000. Estimated use of water in the United States. USGS Circular 1268. http://pubs.er.usgs.gov (veri�ed 12-12-10)
National Academy of Sciences (NAS). 2009. Liquid transportation fuels form coal and biomass: Techno-logical status, costs, and environmental impacts. �e National Academies Press, Washington, D.C. 322 pp.
Solley, W.B., R.R. Pierce, and H.A. Perlman. 1995. Estimated use of water in the United States. USGS Circular 1200, USGS. Denver, CO.
Wilhelm, W.W., J.R. Hess, D.L. Karlen, J. M. F. John-son, D.J. Muth, J.M. B, H.T. Gollany, J.M. Novak, D.E. Stott, and G.E. Varvel. 2010. Balancing limiting factors & economic drivers for sustainable Midwestern US agricultural residue feedstock supplies. Industrial Biotechnology 6(5): 271-287.

If you would like to recieve future publications, or to be considered as an author for future article submissions, please contact the Iowa Water Center.
2218 Agronomy HallAmes, Iowa 50011-1010(515)[email protected]