lessons learned from measuring software development processes
TRANSCRIPT
© S
oft
war
e Q
ua
lity
Lab
Software Quality Lab
Markus UnterauerConsultant and trainer
Lessons Learned from measuring software
development processes
© S
oft
war
e Q
ua
lity
Lab
www.software-quality-lab.com | improve your quality
At the end of this session you know …Agenda
Introduction to process measurement
Experience from practise
Lessons learned from the project
Slide 2
© S
oft
war
e Q
ua
lity
Lab
www.software-quality-lab.com | improve your quality
The Why? and first ideas on the How?
Introduction to process measurement
Slide 3
© S
oft
war
e Q
ua
lity
Lab
www.software-quality-lab.com | improve your quality
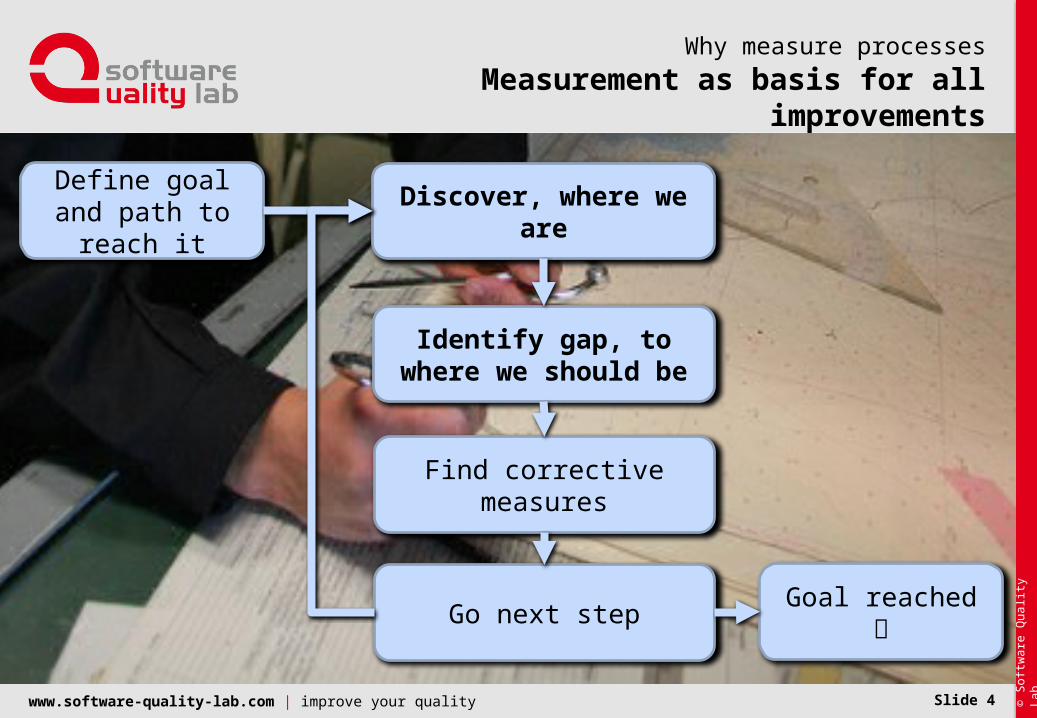
Measurement as basis for all improvements
Why measure processes
Slide 4
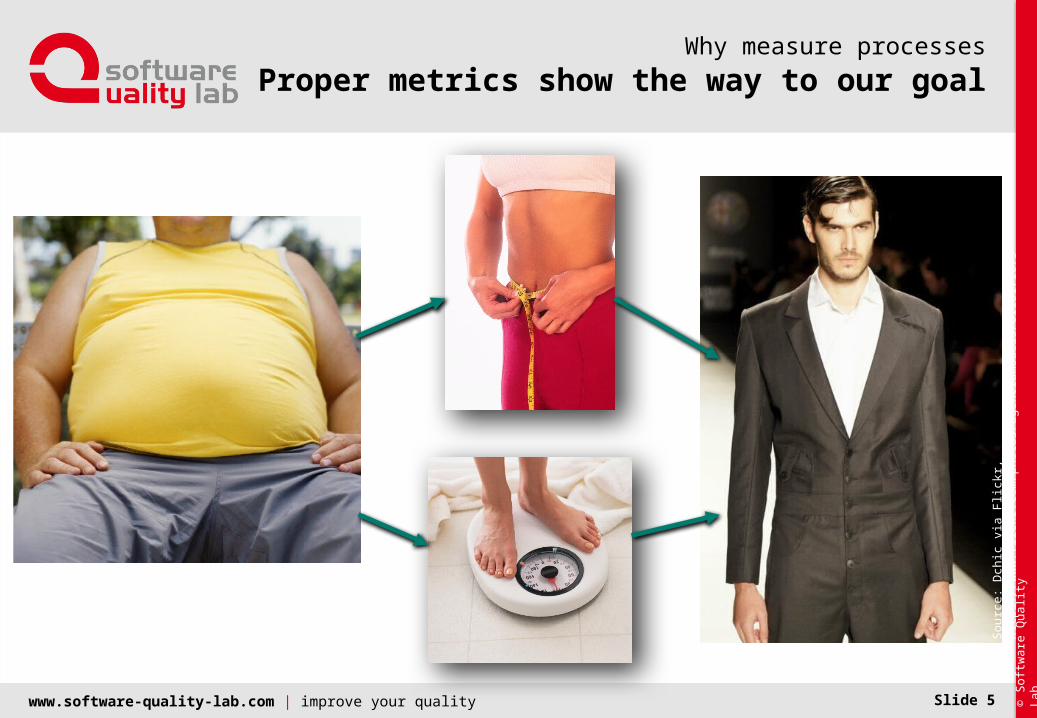
Define goal and path to reach it
Discover, where we are
Identify gap, to where we should be
Find corrective measures
Go next step Goal reached
© S
oft
war
e Q
ua
lity
Lab
www.software-quality-lab.com | improve your quality
Proper metrics show the way to our goalWhy measure processes
Slide 5
Sou
rce
: D
chic
via
Flic
kr,
htt
ps:
//w
ww
.flic
kr.c
om
/ph
oto
s/a
ge
ncia
mod
els
/611
817
16
75
© S
oft
war
e Q
ua
lity
Lab
www.software-quality-lab.com | improve your quality
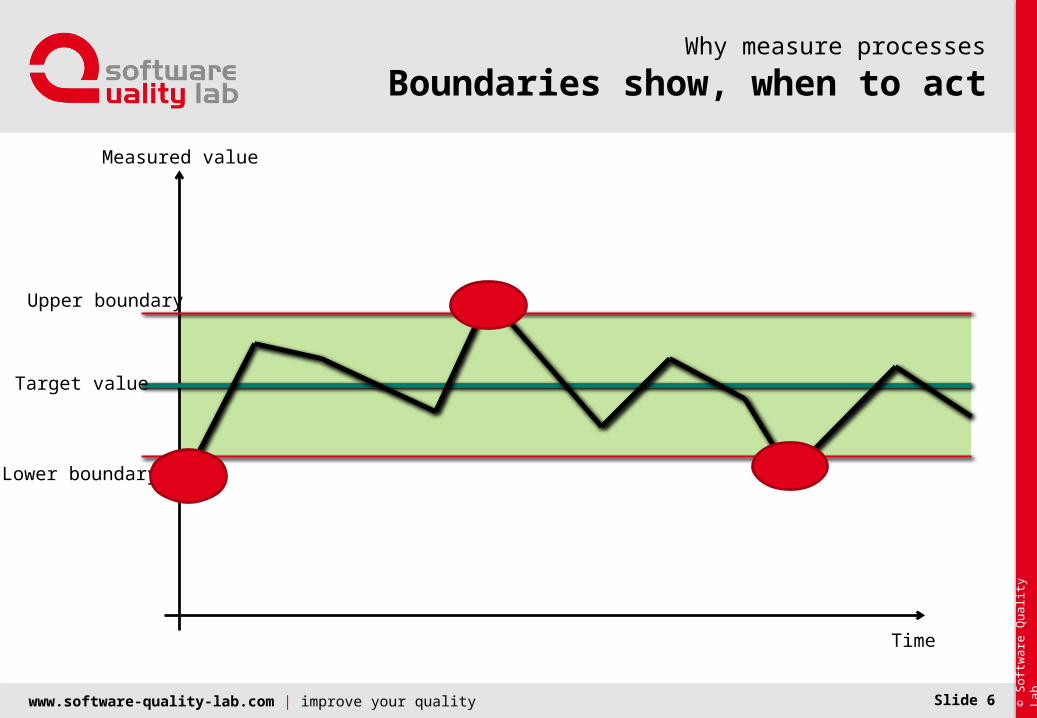
Boundaries show, when to actWhy measure processes
Slide 6
Upper boundary
Lower boundary
Target value
Measured value
Time

© S
oft
war
e Q
ua
lity
Lab
www.software-quality-lab.com | improve your quality
Define proper metrics with G-Q-MGQM for defining metrics
1. Goal What should be done for whom? Which aspects do we want to change? What is the context?
e.g. „Improve the quality for all new projects“
2. Question Which questions guide us to the measurement goal?
e.g. „Are we finding the right bugs?“
3. Metric How can we answer the questions using metrics?
e.g. „Ratio of bugs found per severity class“
Slide 7
Define goals
Find questions
Answer questions
© S
oft
war
e Q
ua
lity
Lab
www.software-quality-lab.com | improve your quality
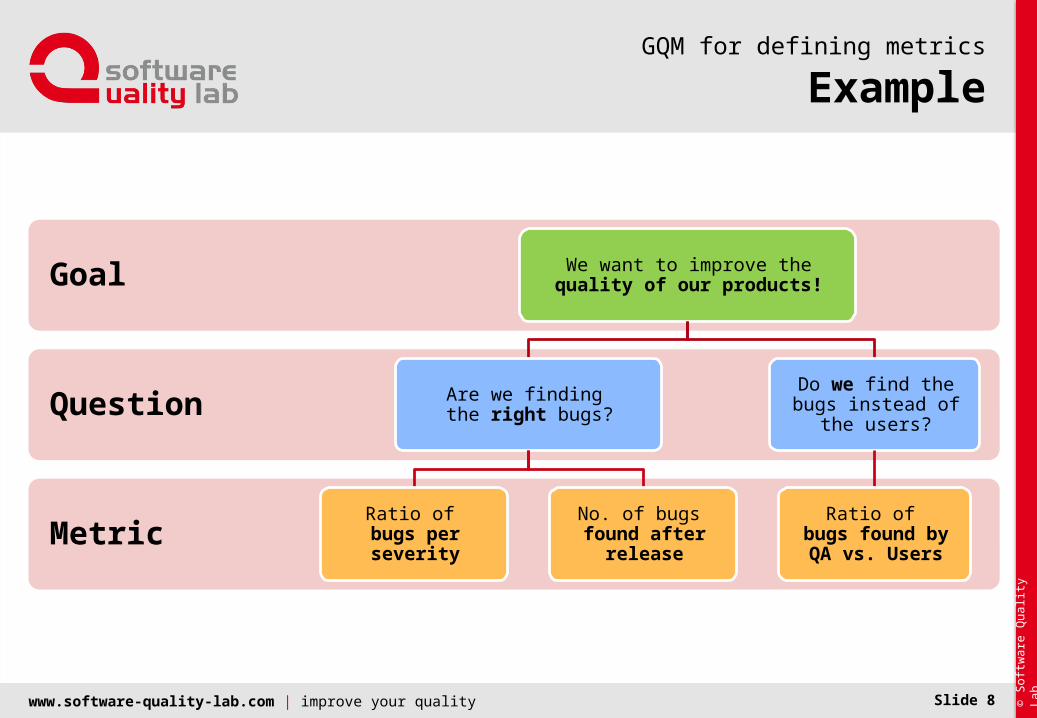
ExampleGQM for defining metrics
Slide 8
Metric
Question
Goal We want to improve thequality of our products!
Are we finding the right bugs?
Ratio of bugs per severity
No. of bugs found after release
Do we find the bugs instead of the users?
Ratio of bugs found by QA
vs. Users
© S
oft
war
e Q
ua
lity
Lab
www.software-quality-lab.com | improve your quality
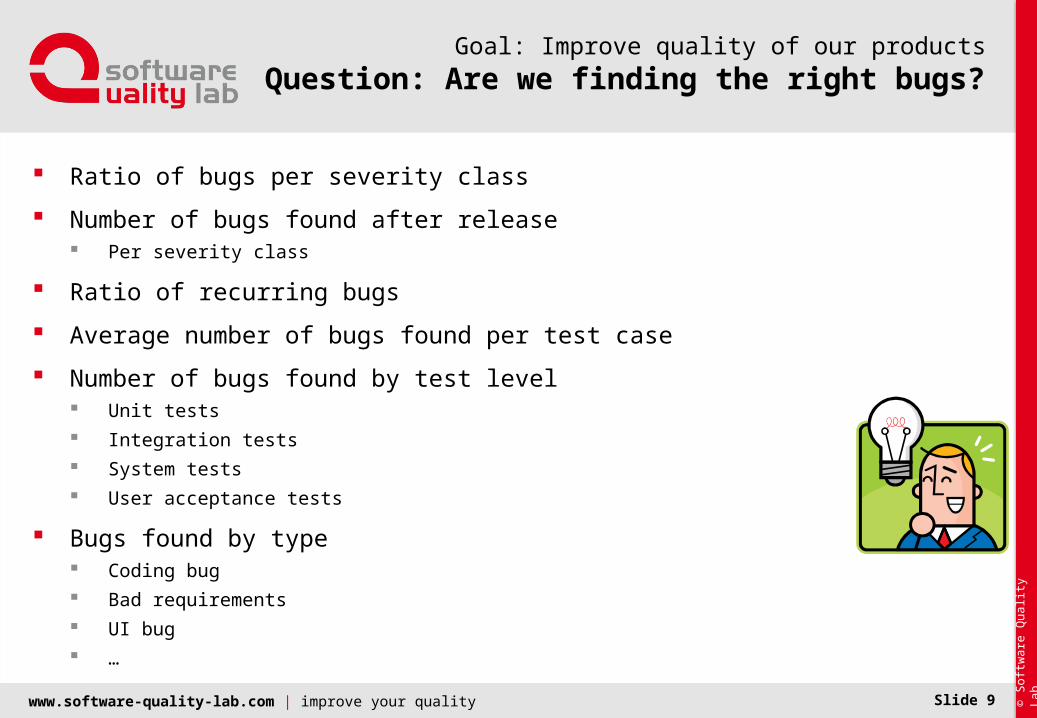
Question: Are we finding the right bugs?Goal: Improve quality of our products
Ratio of bugs per severity class
Number of bugs found after release Per severity class
Ratio of recurring bugs
Average number of bugs found per test case
Number of bugs found by test level Unit tests
Integration tests
System tests
User acceptance tests
Bugs found by type Coding bug
Bad requirements
UI bug
…
Slide 9
© S
oft
war
e Q
ua
lity
Lab
www.software-quality-lab.com | improve your quality
So much for the theory, let‘s turn to practise …Experience from practise
Slide 10
© S
oft
war
e Q
ua
lity
Lab
www.software-quality-lab.com | improve your quality
Situation at our customerExperience from practise
Slide 11
http://pixabay.com/en/desert-road-sand-forward-winds-609316/
© S
oft
war
e Q
ua
lity
Lab
www.software-quality-lab.com | improve your quality
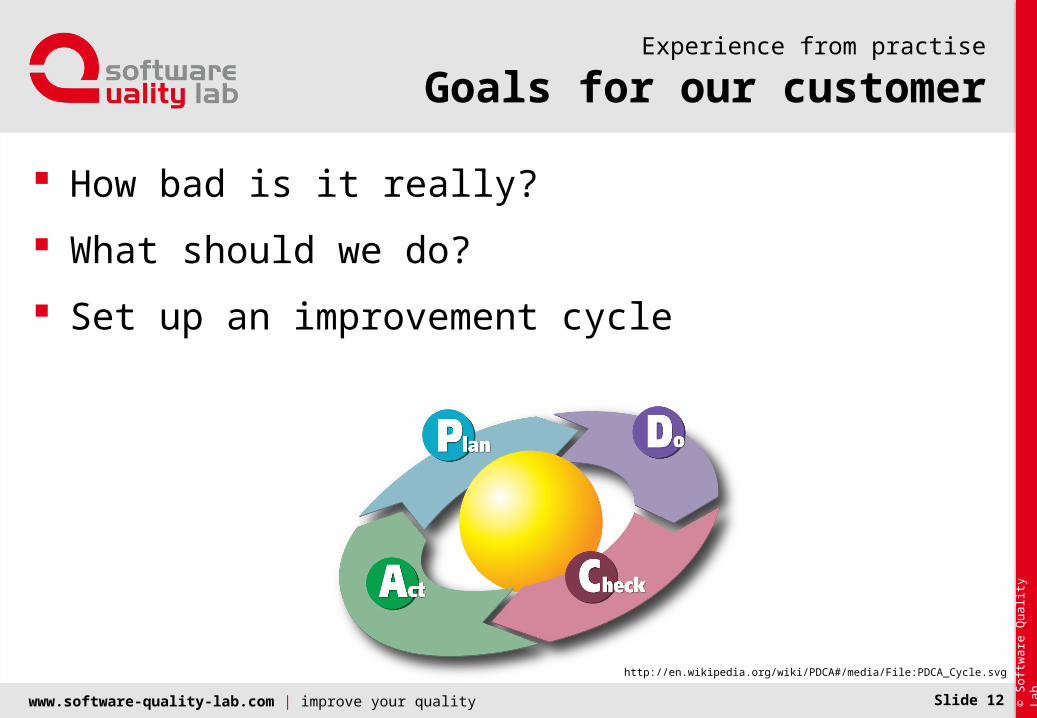
Goals for our customerExperience from practise
How bad is it really?
What should we do?
Set up an improvement cycle
Slide 12
http://en.wikipedia.org/wiki/PDCA#/media/File:PDCA_Cycle.svg
© S
oft
war
e Q
ua
lity
Lab
www.software-quality-lab.com | improve your quality
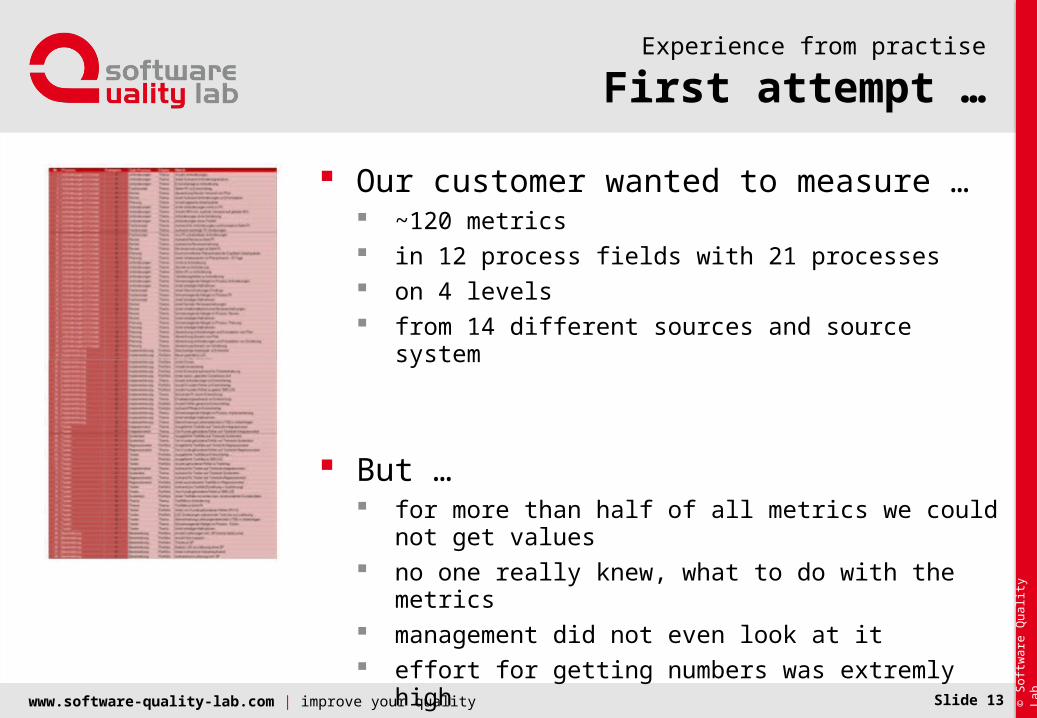
First attempt …Experience from practise
Our customer wanted to measure … ~120 metrics in 12 process fields with 21 processes on 4 levels from 14 different sources and source system
But … for more than half of all metrics we could not get values no one really knew, what to do with the metrics management did not even look at it effort for getting numbers was extremly high
Slide 13
© S
oft
war
e Q
ua
lity
Lab
www.software-quality-lab.com | improve your quality
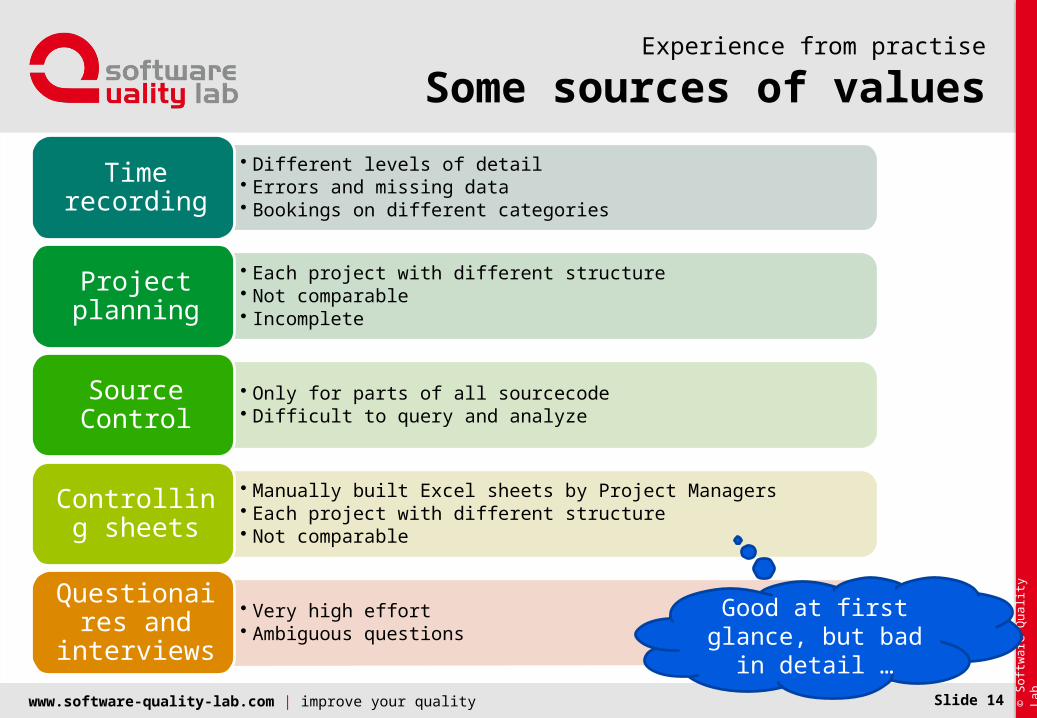
Some sources of valuesExperience from practise
Slide 14
• Different levels of detail• Errors and missing data• Bookings on different categories
Time recording
• Each project with different structure• Not comparable• Incomplete
Project planning
• Only for parts of all sourcecode• Difficult to query and analyze
Source Control
• Manually built Excel sheets by Project Managers• Each project with different structure• Not comparable
Controlling sheets
• Very high effort• Ambiguous questions
Questionaires and interviews
Good at first glance, but bad in detail …
© S
oft
war
e Q
ua
lity
Lab
www.software-quality-lab.com | improve your quality
Everything very difficultExperience from practise
Slide 15
http://pixabay.com/en/squirrel-reading-books-surprise-304021/
© S
oft
war
e Q
ua
lity
Lab
www.software-quality-lab.com | improve your quality
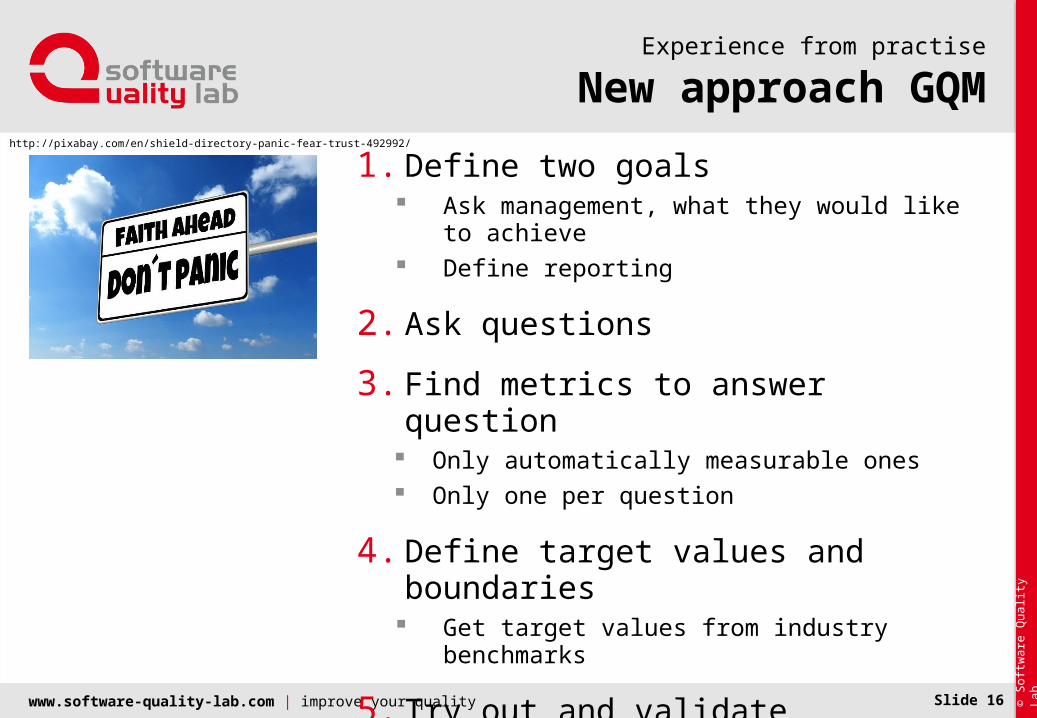
New approach GQMExperience from practise
1. Define two goals Ask management, what they would like to achieve Define reporting
2. Ask questions
3. Find metrics to answer question Only automatically measurable ones Only one per question
4. Define target values and boundaries Get target values from industry benchmarks
5. Try out and validate
6. Report to management
Slide 16
http://pixabay.com/en/shield-directory-panic-fear-trust-492992/
© S
oft
war
e Q
ua
lity
Lab
www.software-quality-lab.com | improve your quality
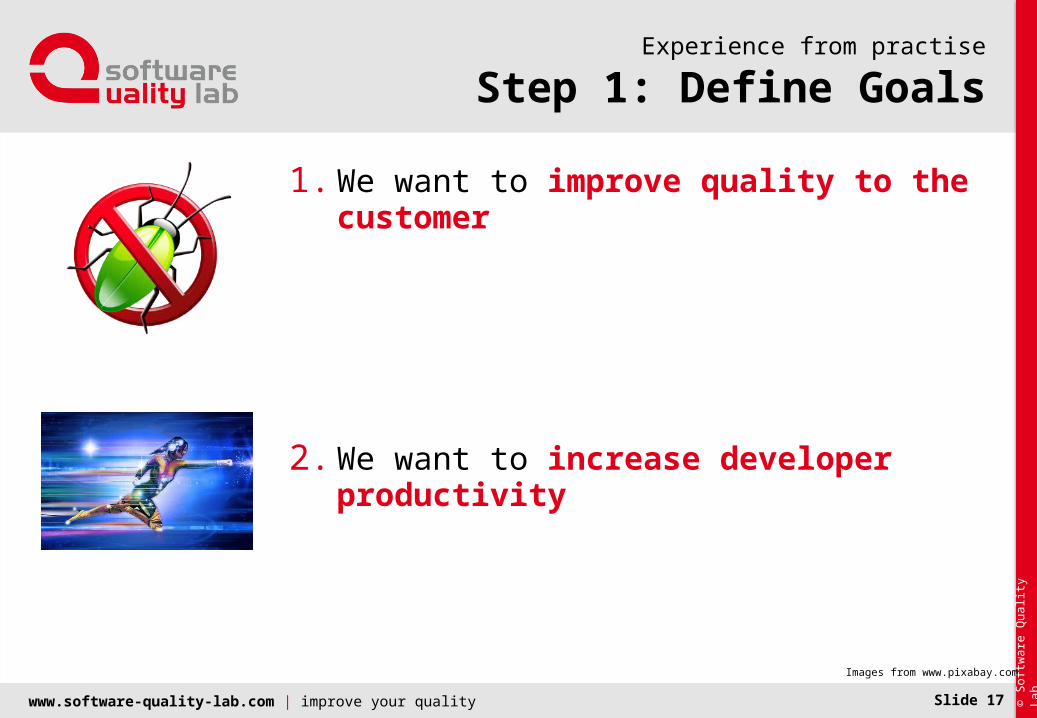
Step 1: Define GoalsExperience from practise
1. We want to improve quality to the customer
2. We want to increase developer productivity
Slide 17
Images from www.pixabay.com
© S
oft
war
e Q
ua
lity
Lab
www.software-quality-lab.com | improve your quality
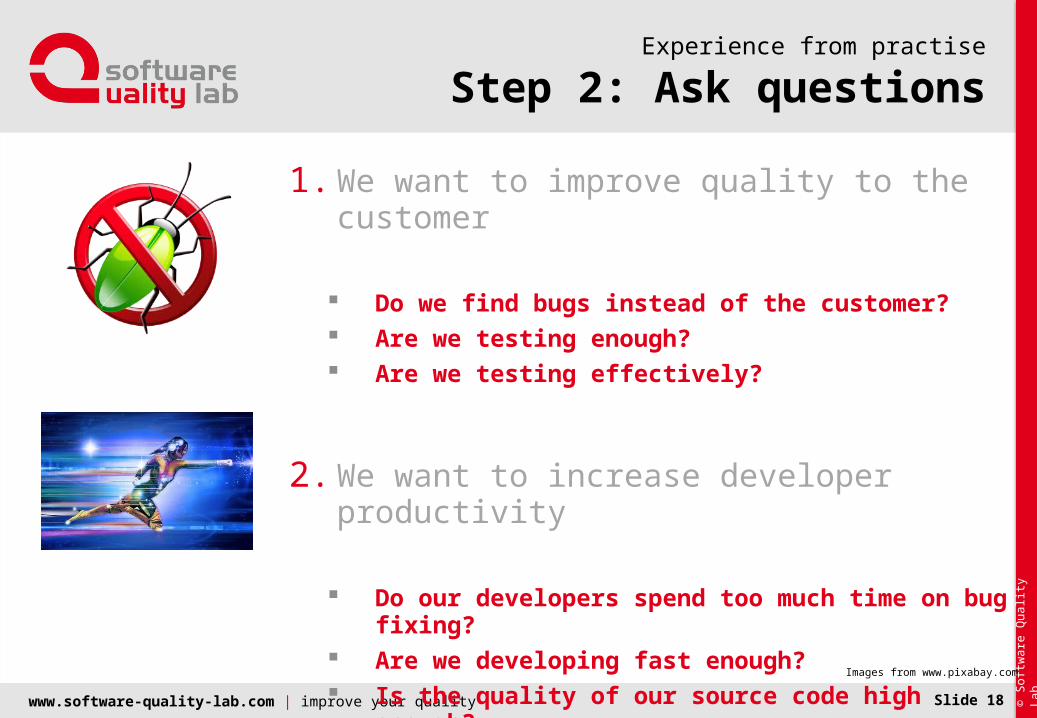
Step 2: Ask questionsExperience from practise
1. We want to improve quality to the customer
Do we find bugs instead of the customer? Are we testing enough? Are we testing effectively?
2. We want to increase developer productivity
Do our developers spend too much time on bug fixing? Are we developing fast enough? Is the quality of our source code high enough?
Slide 18
Images from www.pixabay.com
© S
oft
war
e Q
ua
lity
Lab
www.software-quality-lab.com | improve your quality
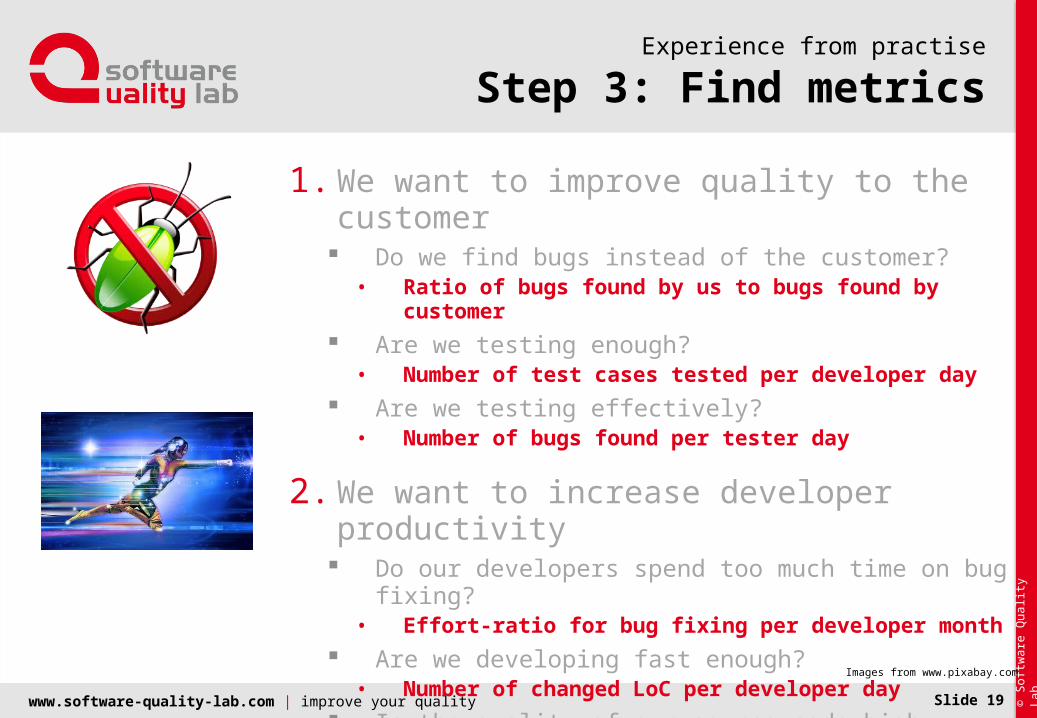
Step 3: Find metricsExperience from practise
1. We want to improve quality to the customer Do we find bugs instead of the customer?
• Ratio of bugs found by us to bugs found by customer
Are we testing enough?• Number of test cases tested per developer day
Are we testing effectively?• Number of bugs found per tester day
2. We want to increase developer productivity Do our developers spend too much time on bug fixing?
• Effort-ratio for bug fixing per developer month
Are we developing fast enough?• Number of changed LoC per developer day
Is the quality of our source code high enough?• Number of bugs found by customer per developer month
Slide 19
Images from www.pixabay.com
© S
oft
war
e Q
ua
lity
Lab
www.software-quality-lab.com | improve your quality
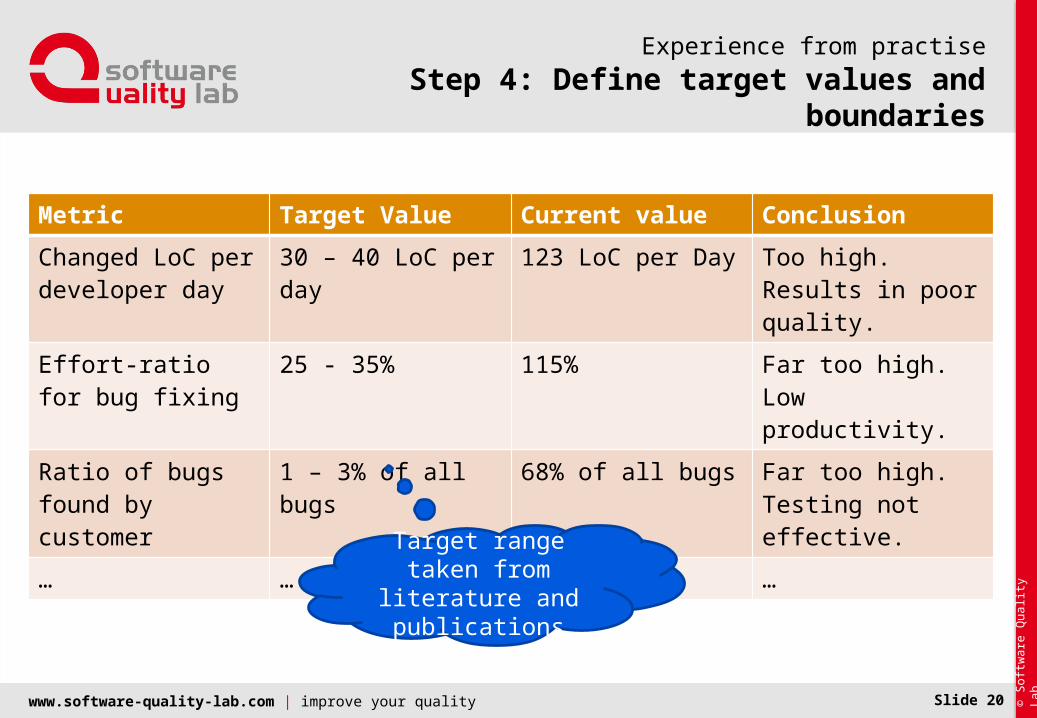
Step 4: Define target values and boundaries
Experience from practise
Slide 20
Metric Target Value Current value Conclusion
Changed LoC per developer day
30 – 40 LoC per day 123 LoC per Day Too high. Results in poor quality.
Effort-ratio for bug fixing
25 - 35% 115% Far too high. Low productivity.
Ratio of bugs found by customer
1 – 3% of all bugs 68% of all bugs Far too high. Testing not effective.
… … … …
Target range taken from literature and
publications
© S
oft
war
e Q
ua
lity
Lab
www.software-quality-lab.com | improve your quality
Step 5: Try out and validate
Experience from practise
Slide 21
http://pixabay.com/en/calculator-calculation-insurance-385506/
© S
oft
war
e Q
ua
lity
Lab
www.software-quality-lab.com | improve your quality
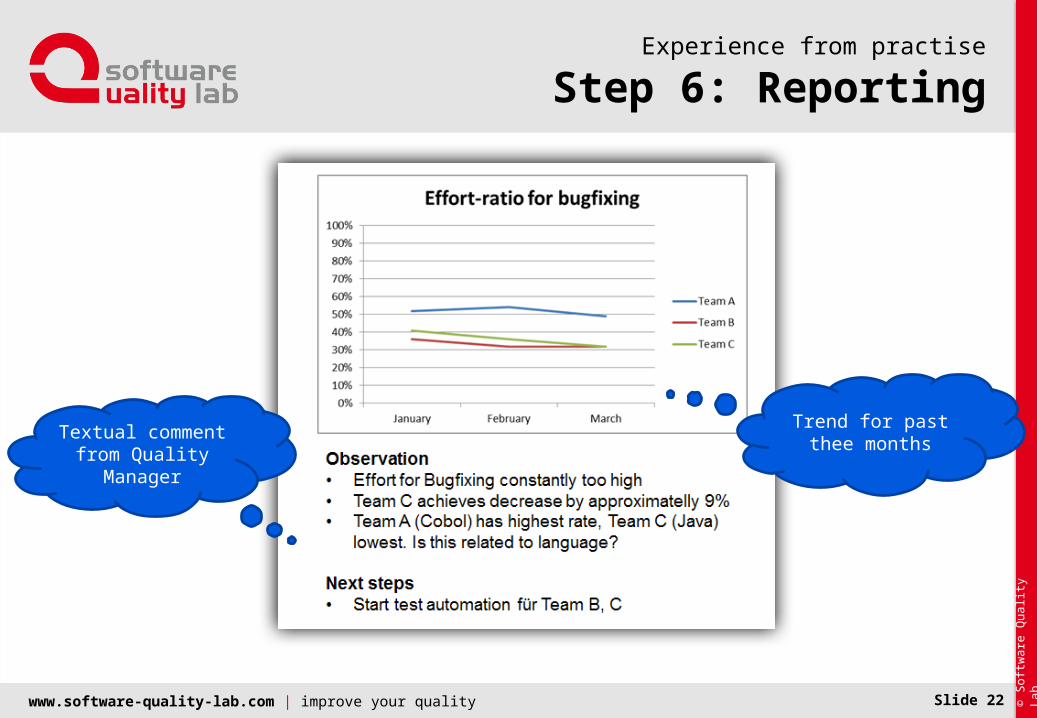
Step 6: ReportingExperience from practise
Slide 22
Trend for past thee months
Textual comment from Quality
Manager
© S
oft
war
e Q
ua
lity
Lab
www.software-quality-lab.com | improve your quality
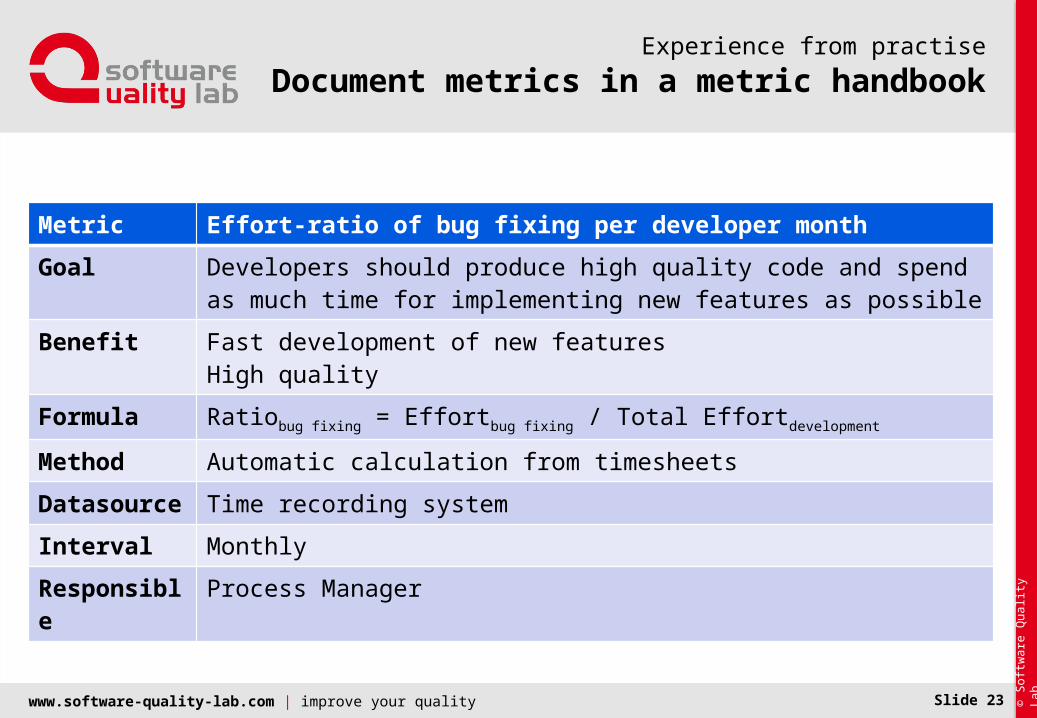
Document metrics in a metric handbookExperience from practise
Slide 23
Metric Effort-ratio of bug fixing per developer month
Goal Developers should produce high quality code and spend as much time for implementing new features as possible
Benefit Fast development of new featuresHigh quality
Formula Ratiobug fixing = Effortbug fixing / Total Effortdevelopment
Method Automatic calculation from timesheets
Datasource
Time recording system
Interval Monthly
Responsible
Process Manager
© S
oft
war
e Q
ua
lity
Lab
www.software-quality-lab.com | improve your quality
From practiseLessons Learned
Slide 24
© S
oft
war
e Q
ua
lity
Lab
www.software-quality-lab.com | improve your quality
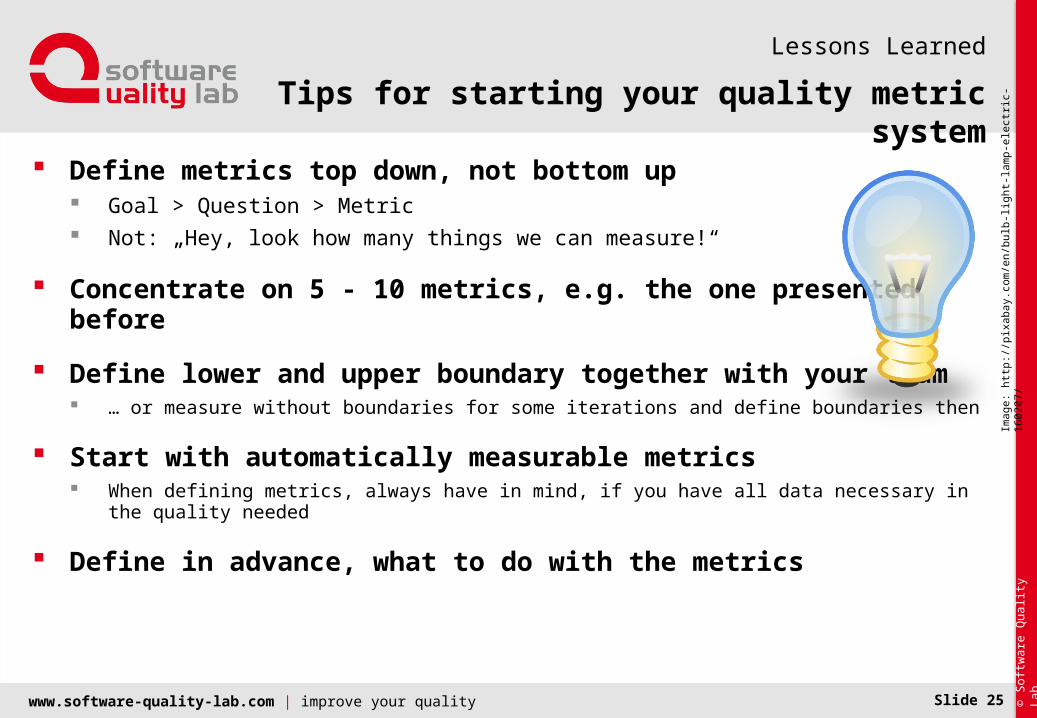
Tips for starting your quality metric system
Lessons Learned
Define metrics top down, not bottom up Goal > Question > Metric
Not: „Hey, look how many things we can measure!“
Concentrate on 5 - 10 metrics, e.g. the one presented before
Define lower and upper boundary together with your team … or measure without boundaries for some iterations and define boundaries then
Start with automatically measurable metrics When defining metrics, always have in mind, if you have all data necessary in the quality needed
Define in advance, what to do with the metrics
Slide 25
Imag
e: h
ttp:
//pi
xaba
y.co
m/e
n/bu
lb-li
ght-
lam
p-el
ectr
ic-1
6020
7/
© S
oft
war
e Q
ua
lity
Lab
www.software-quality-lab.com | improve your quality
Questions?
Lessons Learned from measuring software development processes
Slide 26
© S
oft
war
e Q
ua
lity
Lab
Your Partner in Software Quality and Testing
Software Quality Lab GmbH
www.software-quality-lab.com
Consulting | Service | Academy | Tool Expertise
Markus [email protected]