lesson learning report: aid comilla - gov.uk · lesson learning report: aid comilla 2012 1 ......
TRANSCRIPT

Lesson Learning Report: Aid-Comilla
shiree
2012
Lesson Learning Report: Aid-Comilla


Table of Contents
Introduction ............................................................................................................................................... 1
Chapter One: Summary of Project 2009-2012 ....................................................................................... 4
Chapter Two: Endline to Baseline Findings ...................................................................................... 11
Chapter Three: Beneficiary Focus Group Discussion ...................................................................... 24
Chapter Four: NGO Lesson Learning Workshop ............................................................................. 30
Conclusion: Progress against Logical Framework ............................................................................ 34
Annex ........................................................................................................................................................ 37
CMS 2 and CMS 4 Findings ................................................................................................................ 37
FGD Questionnaire .............................................................................................................................. 45
Exit Strategy .......................................................................................................................................... 48
Financial Overview .............................................................................................................................. 50
Case Study ............................................................................................................................................. 51

Lesson Learning Report: Aid Comilla 2012
1 | P a g e
Introduction
ECONOMIC EMPOWERMENT OF THE POOREST (SHIREE)
The Economic Empowerment of the Poorest (EEP) Project is a partnership between UKAID from the Department for International Development and the Government of Bangladesh that aims to take one million people out of extreme poverty by 2015. The programme has adopted the name shiree meaning steps in Bangla, reflecting the approach towards helping people to progress out of poverty. There are two shiree challenge funds, the Scale Fund and the Innovation Fund. Both are distributed to NGO implementing partners via a competitive process with selection made by an Independent Assessment Panel. The Scale Fund supports proven approaches to addressing extreme poverty while the Innovation Fund enables innovative approaches to be tested and enhanced in implementation. Scale Fund grants are typically of the order of £3million, covering around 10,000 direct beneficiary households each. Innovation Fund grants are also substantial, averaging £300,000 and up to 1,000 households. In August 2012 there were 36 active sub projects, 9 Scale Fund and 27 Innovation Fund working with over 200,000 households. Inherent in the inclusion of an Innovation Fund in programme design is the objective that these projects will be closely and continuously monitored and evaluated with successes scaled up, either directly utilising available shiree resources, or indirectly for example through other funding routes or by influencing the design of other projects and programmes. The shiree programme also has a mandate to research the dynamics of extreme poverty and of the effectiveness of interventions designed to address extreme poverty. This research and the learning from shiree projects feeds a growing stream of pro extreme poor advocacy activity, including the development of a Manifesto for the Extreme Poor1. The big objective of this work is to make a significant contribution towards the eradication of extreme poverty in Bangladesh by 2021.
INNOVATION ROUNDS ONE AND TWO
The Innovation Fund is distributed via themed bidding rounds. Round One focussed on peripheral or marginalised regions exhibiting a high incidence of extreme poverty. The result of the competitive process was 6 projects located in: the Haors (CNRS, HSI), the Chittagong Hill Tracts (Greenhill, HKI), the Southern Coastal belt (Shushilan) and one in the border area of Feni District (Aid Comilla). The theme for Round Two was innovative approaches towards addressing seasonal hunger (Monga) and resulted in a further 6 projects (Action Aid, MJSKS, SKS, NDP, HSI, Puamdo) located in Monga prone regions of the North West. While the Round Two projects were initially for two years they were later extended by a year to bring them into synch with the three-year Round One projects2. This gave Round Two projects more time to test and establish the intervention model and allowed for a common evaluation process.
1 See: http://www.shiree.org/ 2 Except Puamdo ends Jan 2013

Lesson Learning Report: Aid Comilla 2012
2 | P a g e
The total value of 6 Round One contracts was £1,541,283 with 7,000 beneficiaries. Round Two value was £1,794,863 with 5,465 beneficiaries.
THE LESSON LEARNING REPORTS
This is one of 12 lesson learning reports, one for each of the Innovation Round One and Two projects. The reports have been produced for three main reasons: firstly to capture and to make available the significant learning from each individual project, secondly to provide an impact assessment that can inform decisions regarding the potential scale up of project activities, thirdly to provide a vehicle for a process of interaction, reflection and appreciative dialogue between the shiree team, NGO project staff and beneficiaries, hence generating learning and helping the formulation of ideas that build on project experience even prior to the publication of the report. Each report follows a similar structure that reflects the key elements of this intensive and interactive process that spanned over 6 months. 12 individual reports have been produced rather than a single report with tables comparing NGOs. This was a deliberate choice. Each project is delivered in a different context, with a different client group (although all extreme poor), differing geographic, social and economic conditions. Furthermore each project has faced a range of external shocks (from flash floods to communal conflict) during implementation. While a similar methodology was adopted in preparing each report (see below) it is not possible to simply rank the projects in terms of impact from most to least successful. Rather the complexities of each context and the implementation challenges faced by each project need to be considered case by case. The success of any one project was heavily influenced by project design (i.e. the nature of the innovation), but perhaps to an even greater extent was contingent upon the changing circumstances of implementation and the success of the project teams, working with shiree support to adjust, evolve and enhance the project as it rolled out. Hence each report is quite long and contains a full description of how the project developed over time as well as the evaluative reflections of the implementing team and beneficiaries.
THE PROCESS LEADING TO THE REPORT
A similar process was followed during the preparation of each report. Chapter One was drafted to summarise the narrative of the project from design and inception through to completion. This chapter draws on the initial project memoranda as well as the output of several independent (SILPA) or Internal (Internal OPR) reviews conducted during the course of the project. NGOs were asked to submit relevant documents to inform this chapter and the chapter was reviewed and endorsed by each NGO prior to finalisation. Chapter Two reports the output of an Impact Survey conducted according to a standard methodology for all 12 projects. This survey was undertaken by trained enumerators under the guidance of the University of Cambridge adopting a similar methodology to that used for the Scale Fund CMS3 instrument.3 In all but one case4 the baseline census (CMS1) is used for before and after intervention comparisons. Chapter Three summarises the output of two Focus Group Discussions conducted with project beneficiaries. Chapter Four reports on a lesson learning workshop with the NGO team – during which the outputs of the Impact Survey were shared. The Conclusion is a comparison between
3 See: http://www.shiree.org/extreme-poverty-monitor/#.UGp4U03A-a8 4 HKI did not undertake CMS1

Lesson Learning Report: Aid Comilla 2012
3 | P a g e
final project achievements and the original logical framework. Annexes include an analysis of the outcome of the CMS2 mobile phone based “monthly snapshot” monitoring pilot5 and CMS4 beneficiary responses, the discussion guide used for the Focus Group Discussions, a summary of the project exit strategy, a brief sub project financial profile, and a case study. In all cases the report has been shared in draft, at several stages, with the concerned NGOs, feedback has been received and appropriate adjustments made. In a few cases an additional Annex has been included to provide a space for NGOs to provide an alternative perspective on any specific report findings with which they disagree. The reports are quite long but they are also rich in content and we hope and expect that readers, especially development practitioners, will find them of real value.
5 Itself a significant process innovation

Lesson Learning Report: Aid Comilla 2012
4 | P a g e
Chapter One: Summary of Project 2009-2012
DOCUMENTS CITED
Inception Report, 2009; shiree and Aid Comilla
Project Memorandum, 2009; shiree and Aid Comilla
Quarterly Change Reports and Self-Review Workshops; shiree
Innovation Fund Output-to-Purpose Review, 2010; shiree
SILPA 1.5 Review, 2010; shiree
Monthly and Quarterly Reports; Aid Comilla
INTRODUCTION
CMS 6: Summary of Aid Comilla Interventions
Aid Comilla is an Innovation Round 1 (IF1) NGO and implements the „Alternative Livelihoods Options‟ (ALO) project in the Parsuram Upazila of Feni district. The duration of the project is 3 years, from September 2009 to August 2012.
Goal The Goal of the project is to support the Government of Bangladesh meet MDG targets 1 and 2 on income poverty reduction and hunger achieved by 2015. Purpose The ALO project sets out to work with 1,850 exclusively female headed households (HHs) to generate alternative livelihoods options, strengthen social cohesiveness amongst target BHHs and their community, increase HH productive assets, and ensure food security during lean seasons. The BHHs receive a combination of direct and indirect transfers. The project sought to
6 The BHH target was changed from 1,850 to 1,500 in Year 2
Beneficiary Information 2009 2010 2011 2012 Cumulative
Target (according
to log frame)6
BHH selection complete 0 853 745 0 1598 1,850
BHH profiles (CMS 1) complete 0 808 410 282 1500 1,850
BHH who dropped out or migrated 0 45 41 12 98 0
BHHs receiving asset transfer 0 785 544 159 1488 1,850
BHHs receiving cash transfer 0 0 0 1,188,230 1,188,230 0
BHHs receiving IGA/skill training/other capacity building 0 814 937 932 2,683 1,850
Total value of assets/cash distributed
17,013,450 16,852,250
NOTE: this data is collected and reported by the NGOs to shiree as CMS 6 (reporting requirements to the Government of Bangladesh)

Lesson Learning Report: Aid Comilla 2012
5 | P a g e
strengthen and enhance the capacity of extreme poor households to manage livestock and produce home grown nutritious cash crops, vegetables and fruits; develop Para-vets as part of a community-based technical support system and develop market linkages ensuring that local service providers respond towards the market related and other needs of extreme poor women.
Major Activities
The direct transfers include asset transfer of cattle and grant stipends; and artificial
insemination services of cattle. Each BHH receives assets worth around Tk.15,000 as well as
Tk.200 per month for 12 months feed cost support. The innovation of the project lies in the calf-
transfer from Year 1 BHHs to Year 2 BHHs. 750 BHHs receive one heifer, stipends and artificial
insemination services, each on the condition of transferring the first off-spring to other
beneficiaries. 750 calves will be born in project Year 1 and conditionally transferred to a new
batch of 750 BHHs in project Year 2. In Year 3 a further 300 BHHs will receive calves as transfers
from the earlier batch of recipients. The average live body weight of heifers should increase by
50% within 6 months and BHHs will rear the newborn calf up to 4 months. The beneficiary will
donate the first calf to another extreme poor neighbour who qualifies to become a project
beneficiary. If it is a male calf, the beneficiary will rear it as beef cattle and sell it after eighteen
months and purchase a Heifer. Aid Comilla will ensure that intra-beneficiaries‟ assets transfer
take place in time and will ensure quality.
Project Outcomes/Outputs
BHHs will have greater access to income options and increased cash earnings, food security and asset ownership. The beneficiaries are provided support (supplementary cattle feed, de-worming and preventative vaccination, medication, hands-on cattle husbandry and management training, input support and advice) and supply of quality vegetable seeds to generate both a source of cash and a nutritious crop for households. BHHs are encouraged to purchase additional livestock or further expand and diversify income generating opportunities in order sustain economic well-being resulting from the project.
YEAR 1: SEPTEMBER 2009-AUGUST 2010
The first year activities of the project cover the period from September 2009 to August 2010. The inception period of the project totalled 4 months from September 2009 to December 2009 during which the targeting and selection criteria were developed. By December 2010 Aid Comilla had selected 750 BHHs, all verified by shiree. Each had been transferred a heifer and provided initial training in cattle rearing. Vaccinations, deworming and vitamin supplements were regularly provided through the enlisted 15 Livestock Service Providers (LSPs). As of December 2010, 204 BHHs had started receiving milk from their cattle, approximately 4,150 litres of milk was produced in the first 4 months. All 750 BHHs had been using cow dung as fuel and saving Tk.100 per month (Annual Report 2010). Also 61 BHHs from the second round had been selected, verified by shiree, and included in the transfer list. 808 BHHs had been provided with fodder cuttings and seed of jumbo and Napier grass. Many of the BHHs cultivated jumbo grass in groups on plots of 5 to 10 decimals owned by local government or borrowed from neighbours with permission.

Lesson Learning Report: Aid Comilla 2012
6 | P a g e
During project design Aid Comilla calculated a mature heifer would cost approximately Tk. 15,000. During the inception phase Aid Comilla learnt that, within the local and nearby markets, heifer costs were in the range of Tk.16, 000 - 17, 000. This was due to a shortage of heifers in the local market. Aid Comilla requested shiree management to consider the issue and approve higher procurement cost heifers. Aid Comilla learnt that some target BHHs were so extremely poor that they did not agree to undertake cattle rearing because of their inability to bear the feeding and other management costs, without project support (approximately 50-60% of the total cattle rearing cost). The Annual Report notes that many BHHs found it difficult to feed their own families let alone livestock. They also learnt that some beneficiaries could not afford to construct cattle sheds from their own means. The Annual Report 2010 highlights other challenges faced by Aid Comilla. Some animals had to be replaced through finances from the contingency budget due to poor performing heifers. In addition, Aid Comilla learnt that semen for AI collected from the government livestock department gave a very poor rate of conception, whilst semen collected from BRAC centres produced better results. Non-availability of vaccines was also a problem. Contextual problems also centred on theft of cattle by smugglers close to the Indian border, leading to BHHs keeping livestock within their sleeping quarters at night. A major setback for Aid Comilla in its first year arose when a flash flood adversely affected the area. There was significant damage with most areas seeing more than 20% of land flooded, with 80% land flooding in a few extreme cases. Around 20-80% of BHH‟s vegetables, 20-80% of BHH‟s fodder and about 75% of BHH‟s compost were destroyed in the flash flood. Due to heavy rainfall, most BHH‟s rice straw was also destroyed so cattle feed scarcity occurred and as a result the price of cattle feed increased.
Where Aid Comilla, according the SILPA Report 2010, had done well includes the tracking of household inputs (all participants had a passbook to record their project activities) and developing clear monthly and quarterly output figures. However, the SILPA Report highlights that progress had been slower than originally planned, in part due to the flash flooding. 120 BHHs had received agricultural training and livestock training, 435 BHHs have received monthly stipends, 23 cattle had successfully received AI and 720 BHHs had received quality summer vegetable seeds for homestead gardening. The report mentions that Aid Comilla argued that delays had been caused by a prolonged inception period, unavailability of purchasable heifers in the local market and the lack of anthrax and FMD vaccinations. ALO stopped purchasing heifers for a two week period as middle-men were artificially increasing prices. The report mentions that some of these factors are reasonable but that as an experienced cattle asset transfer partner, Aid Comilla should have been able to plan well ahead for vaccine procurement.
Aid Comilla worked extensively with local government and regularly held meetings at district and upazila level to share information and learnings from the project. It also reported that the NGO would like shiree‟s help to hold a bigger workshop at the end of the project to share all three years of learning and to showcase its successes, as there was some skepticism at the project inception workshop. The OPR report also pointed out that the heifers procured for the project required very close monitoring from staff with a high level of technical knowledge, expressing some concern that the existing staff did not have enough expertise in this specific

Lesson Learning Report: Aid Comilla 2012
7 | P a g e
field. Aid Comilla and shiree agreed that a shiree Programme Manager would take a more active role in assisting with the vital technical aspects of the project. A significant concern emanating from the first year stems from a criticism from the SILPA Report over Aid Comilla‟s innovation model whereby it is cited that (as of May 2010) the transfer model was unlikely to meet the project‟s purpose level targets. Although Aid Comilla had transferred the first assets to the first round BHHs early in Year 1, only 12 heifers were purchased pregnant and only 20 had subsequently given birth by the 8th month of the project. The review called into question the feasibility of 750 calf transfers happening by the end of Year 1, with major project-level implications for the second cycle calf transfer. The issue was also raised as a significant point in the OPR 2010. The OPR mentions that Aid Comilla had not decided on the exact revision of the model, but the options of goat transfers to second year BHHs or buying calves for transfer at market were options Aid Comilla came up with in light of the projected project short falls. Another option presented included selling non-pregnant cows and buying two small heifers and providing one heifer to primary beneficiaries in the second year and another one to secondary beneficiaries in the third year. Another criticism stemming from the SILPA Report mentions that transferring cattle in the final year of the programme would not be beneficial for those BHHs unless they received a full year‟s support from Aid Comilla, identifying a need to ensure that the calves raised for transfer are well maintained and cared for.
YEAR 2: SEPTEMBER 2010-AUGUST 2011
A significant revision to project activities in Year 2 was the decision by Aid- Comilla and shiree to revise the number of BHHs down from 1,850 to 1,500. The 300 BHHs to have been selected in the third year of the project were cut and the decision made that the remaining time of the project would focus on the calf transfer from the primary 750 BHHs selected in the first year to the remaining 750 BHHs over Year 2 and 3 of the project. In Year 2 Aid Comilla selected 505 BHHs from the remaining 750 BHHs to be covered over Year 2 and 3. This was above the target of 398 BHHs that had been set at the beginning of the year. The target for Year 2 for calf transfer was 398 calves, the same number as the target number of beneficiaries. Aid Comilla was able to transfer 323 calves to the new set of beneficiaries, an achievement of 81%. Aid Comilla successfully completed refresher calf management training for the 750 BHHs from the first year and an additional 281 BHHs from the second year selection. Fodder and seed supply was provided 207 BHHs to ensure better feeding for cattle. The feeding support for heifer and calf was increased to Tk.250 per month for 12 months. In the December 2010 Self-Review Workshop Report Aid Comilla noted that the poor quality heifers that were selected in the first year originated from the nearby Indian hilly areas and therefore it took time to acclimatise. Aid Comilla further explained that project activities from then on tried to get the best out of a poor original stock of cattle. In the report Aid Comilla expressed that the budgeted amount was not enough to procure good quality heifers and that in future projects the budget should be increased to reflect this. In addition, Aid Comilla noted that it rushed to meet the deadline of purchasing heifer from the local market and had to pay a higher than normal market rate at the time. Aid Comilla expressed that in any future project it would ensure selection to suit the specific purposes of the project and should avoid the border area market. In the report Aid Comilla reflected that more careful selection is needed in

Lesson Learning Report: Aid Comilla 2012
8 | P a g e
purchasing of heifers to avoid selection of animals with unsound reproductive capacity. A similar lesson related to purchase of cattle is that of transportation. In the same report it is mentioned that there is no budget for cattle transport, and that therefore beneficiaries did not show interest to buy heifers from distant markets. A significant lesson learnt from the flash flood in the first year was that staff needed more training on disaster management and disaster risk preparedness. Aid Comilla trained all BHHs on „coping with disaster‟ but noted that extra financial support is necessary in future. In the December 2010 Self-Review Workshop Report Aid Comilla suggested that heifers be kept on raised beds during times of heavy rain or flooding. Feeding support was an issue raised consistently in Year 2 with the suggestion that stipend needed to be increased to ensure proper nutrition for heifer and calf. Cattle feed and fodder prices remained high rendering BHHs unable to procure from the market. Aid Comilla suggested that it could motivate BHHs to use fallow land, roadsides and the banks of rivers and streams (khasland), and ensure fodder cultivation through large scale land leasing. In the March 2011 Self-Review Workshop Report it is noted that calves were not receiving sufficient milk from their mothers due to poor feeding practices and therefore milk production was very low due to lack of green grass and high market prices for concentrate feeds like oil-cake, molasses and pulse bran. Only a small number of BHHs could collect grass from elsewhere for their heifers and cows. Aid Comilla started to supply milk for naturally very weak calves but also suggested that calf-starters should be given to the weakest calves. A big issue from the first and second year was that of inadequate feeding and management, with further knock-on effects resulting in immaturity, delayed maturity and reproductive problems reducing conception rates for cattle.
The lesson from this is educating and motivating BHHs for proper feeding and management of cattle. In the March 2011 report Aid Comilla suggested that LSPs needed to be trained more and motivated to provide better service to BHHs on feeding management, treatment and fodder cultivation. Vitamin and mineral-supplementing medicines were given out in the second year to improve health conditions of cattle. In the same report, Aid Comilla suggested that stipend support should be continued beyond the calf transfer as stipend is given for one year after the purchase of the initial heifer. However, Aid Comilla learnt that some BHHs‟ heifers were not producing calves from the second issue of heifers, leading to disinterest of some BHHs in rearing their heifers, so further support is needed and motivation given to help rear heifers to produce a calf.
The health of most cattle was reported to not be very good so Aid Comilla decided to ensure routine deworming every 6 months. It was recognised that deworming every 4 months is preferable but not feasible, due to the cost and inadequate supply of medicine. Another issue was that of poor quality fluid semen provided by Department of Livestock Services AI workers, with Aid Comilla citing conception rates as very poor. To mitigate this Aid Comilla contracted BRAC AI workers operating in the working area to provide more reliable frozen semen for AI. Aid Comilla suggested that a separate cadre of AI workers is needed for this component alone and that LSPs can be trained as AI workers. In the March Self-Review Workshop Report Aid Comilla reported that the LSPs showed a keener interest in preventative vaccines and primary disease treatment. By August, Aid Comilla reported in the August report that the LSPs were continuing to participate in preventative vaccination in the area. The LSPs also extended first

Lesson Learning Report: Aid Comilla 2012
9 | P a g e
aid and primary animal health care to BHHs and other cattle of the community. The project provided an honorarium for the vaccinations. Aid Comilla learnt that establishing linkages between the LSPs and the Upazila livestock office was important.
As part of the overall project package, Aid Comilla provided improved vegetable seed and skill development training for homestead vegetable gardening as Aid Comilla learnt many BHHs lacked year round income. In the March report the NGO recognised that BHHs need access to supporting supplementary IGAs, which is why it promoted homestead gardening as an option that could work according to their budget. In the August 2011 Self-Review Workshop Report Aid Comilla noted that as heifers do not provide year round income and homestead gardening was only enough for home food security, it would consider adding a second IGA in the third year if possible with budget provision.
YEAR 3: SEPTEMBER 2011-SEPTEMBER 2012
In the December 2011 Self-Review Workshop Report it was recognised by Aid Comilla that old and infirm beneficiaries created limitations to project implementation. It realised that they needed to work more closely with this particular group. In the report Aid Comilla again reported that old age BHHs should have minimum capacity to rear and manage heifers and should be physically fit for work. It reported that it was working more closely with this group but that they were ultimately a limitation to project success. The lesson learnt was that beneficiaries should be physically fit to care for livestock and related work as it requires intense support and attention.
Furthermore, during the same self-review workshop Aid Comilla noted that BHHs showed a greater interest in giving their calves to other BHHs and that BHHs had been transferring and sharing ideas, knowledge, experience and interest among other BHHs. Aid Comilla reported that it was motivating all BHHs through the weekly group meetings so that they could learn from each other and help each other improve their livelihoods. Aid Comilla reported that most BHHs had a desire to learn new things about their livelihoods but that emphasizing the practice of new ideas is important to sustain and recover from any difficulties.
The final quarter of Aid Comilla‟s ALO project focused on developing a robust exit strategy with support of shiree programme staff.7 In order to prepare for the phase out of the project, they also prepared contingency plans to support any disadvantaged beneficiaries.
CONCLUSION
Aid Comilla delivered heifers to the original 750 BHHs in the first year but had to revise its innovation model as it was unable to meet the targets of transferring calves to the 1,050 remainder BHHs in project years 2 and 3. The number of BHHs was cut from 1,850 to 1,500 and the calf transfer was stretched over the remainder of the project time from the end of year 1. This meant that the original 750 BHHs that had received heifers would transfer their first-born calf to the second set of 750 BHHs over the last 2 years of the project. In addition, Aid Comilla rushed to procure 750 heifers in the inception period and as a result ended up with low quality foundation stock of heifers. The project suffered another major blow during the flash flooding in the first year. Poor feed and fodder availability meant that BHHs struggled to adequately
7 see annex for full exit plan.

Lesson Learning Report: Aid Comilla 2012
10 | P a g e
feed heifers. The low conception rates may be attributed to this leading to a much lower than projected number of calf births in the first year, thus impacting on the innovation model and resulting its subsequent revision. However, Aid Comilla was able to meet most other targets and provide training to all of its BHHs. It constantly strove to address the issue of poor cattle feeding management and was able to successfully develop its LSPs. Many of the BHHs saw increases in income due to the project activities (see Chapter 2) and the project was able to get back on track after an initial inconsistent year.
ISSUES REGARDING SCALABILITY
Aid Comilla required considerable technical support regarding their livestock intervention. If the project were to be scaled up, widespread technical support (e.g. vaccinations) may present considerable constraints to project activities. Strong linkages with the Department of Livestock Services or other service providers would be critical to success. Furthermore at a larger scale the procurement of adequate high quality stock would be even more challenging with the risk of disrupting the market (i.e. driving up prices). Careful planning and sequencing of market activities (for buying or selling) would hence be critical.
Lesson Learning Report: Aid Comilla 2012
11 | P a g e
Chapter Two: Endline to Baseline Findings
INTRODUCTION
A total of 12 projects received funding under Innovation Fund Rounds One and Two with the project period ending in September 20128. The present section seeks to establish the efficiency and effectiveness of these innovation modalities in uplifting people from extreme poverty in the given communities and regions through comparing socio-economic conditions towards the end of the intervention (March/April 2012) with baseline information (2009) using specific indicators. Objective: The objective of the Endline Study is to assess the change in socio-economic status of the project beneficiary households since the baseline in 2009. Study design: From each organization 64 representative sample households were randomly selected to carry out an endline study. Taking advantage of the uniqueness of the household identities, the same 64 households were selected from the baseline database (which had been compiled as a census of all beneficiaries) to compare change. Field Work: A total of 28 enumerators, 9 Research Assistants from Scale Fund organizations, 3 M&E/MIS personnel, and 1 Bengali Young Professional, under the guidance of a researcher from Cambridge University carried out the data collection for the endline study in 30 days from 16th March 2012. The entire study was managed by the Decision Support Unit at shiree and for the purpose of smooth implementation considering travel time and availability of accommodation and accessibility of sample households, the study team was divided into two smaller teams. The two smaller teams collected the data after 14 days of orientation on the questionnaire and methods. Trained enumerators carried out interviews primarily of household heads on their socio-economic conditions using a pre-tested semi-structured questionnaire focusing on the following indicators:
Demographic characteristic
Household Assets
Household income
Household expenditure
Loan and saving status
Access to safe water, sanitation, electricity
Housing condition
Food security
Access to safety nets
The endline questionnaire was developed by a faculty member of Cambridge University and follows closely the format used for the CMS3 panel survey instrument applied to shiree Scale
8 Except: Greenhill ends June 2012, ActionAid Oct 2012, PUAMDO Jan 2013
Lesson Learning Report: Aid Comilla 2012
12 | P a g e
fund projects. As the baseline questionnaire is to some extent different to the endline study questionnaire, data analysis has been done only on the common indicators existing in both of the questionnaires. Constraints: It should be noted that the data for the endline study for all the projects was collected during the same time period, but the baseline data was collected phase by phase at different times and seasons. Moreover, the data collected for the endline study was conducted by more trained enumerators in comparison to the data collectors of the baseline information. Therefore, the data may contain seasonal variations particularly related to economic activities in the rural context where agriculture is the single largest employment sector. It may also contain some variation due to the different levels of understanding and experience of data collectors. Organization of the chapter: The report does not aim to compare effectiveness of innovation projects to each other but rather the socio-economic changes of BHHs of specific projects since baseline. Therefore, an analysis of each project has been done separately considering the fact that each project is different in terms of modalities, locality and targeted communities. In the following section findings from Aid Comilla‟s project are presented.
HOUSEHOLD BASIC DEMOGRAPHIC CHARACTERSTICS
Table 1.1: Basic socio-demographic characteristics according to sex of household head.
Category Baseline Endline
N % N %
Male headed household 40 62.5 43 67.2
Female headed household 24 37.5 21 32.8
Both 64 100. 64 100
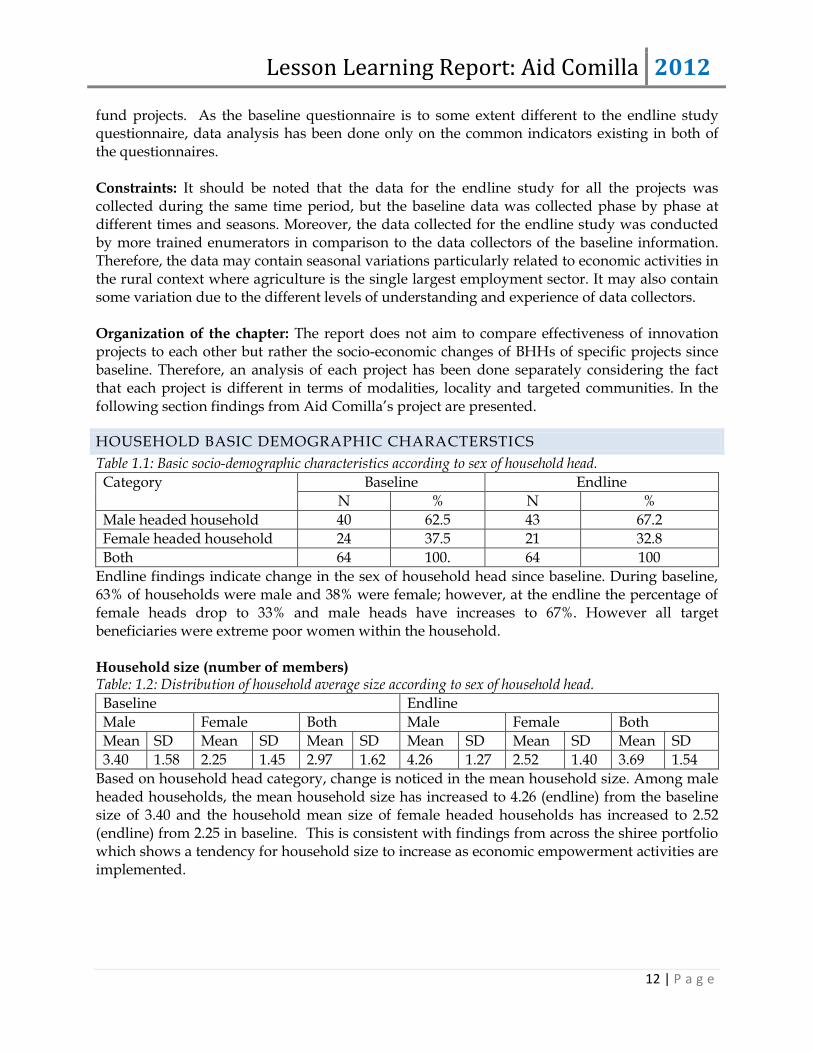
Endline findings indicate change in the sex of household head since baseline. During baseline, 63% of households were male and 38% were female; however, at the endline the percentage of female heads drop to 33% and male heads have increases to 67%. However all target beneficiaries were extreme poor women within the household. Household size (number of members) Table: 1.2: Distribution of household average size according to sex of household head.
Baseline Endline
Male Female Both Male Female Both
Mean SD Mean SD Mean SD Mean SD Mean SD Mean SD
3.40 1.58 2.25 1.45 2.97 1.62 4.26 1.27 2.52 1.40 3.69 1.54
Based on household head category, change is noticed in the mean household size. Among male headed households, the mean household size has increased to 4.26 (endline) from the baseline size of 3.40 and the household mean size of female headed households has increased to 2.52 (endline) from 2.25 in baseline. This is consistent with findings from across the shiree portfolio which shows a tendency for household size to increase as economic empowerment activities are implemented.

Lesson Learning Report: Aid Comilla 2012
13 | P a g e
OCCUPATION
Table 2.1: Change in primary occupation of household head.
Occupation Baseline Endline
N % N %
Agricultural day labour 7 10.9 10 15.6
Other Day labour 30 46.9 15 23.4
Domestic maid 5 7.8 11 17.2
Rickshaw/van/boat/bullock/push cart
2 3.1 9 14.1
skilled labour (manual) 2 3.1 2 3.1
Fishing in open water 1 1.6 3 4.7
Petty trade 2 3.1 - -
Other business 3 4.7 - -
Begging 6 9.4 - -
Own agricultural - - 1 1.6
Livestock/Poultry - - 2 3.1
Industrial /Garment - - 1 1.6
Cottage industry - - 1 1.6
Service - - 1 1.6
Transport worker - - 1 1.6
Housewife - - 5 7.8
Others 3 4.7 - -
Does not work 3 4.7 2 3.1
Total 64 100 64 100
The endline findings for the primary occupation of beneficiary households indicate considerable change since the baseline, particularly in the category of other labour and begging. At the baseline the primary occupation of 47% of households was agricultural day labour and 9% was begging. In the endline, diversity in primary occupation is reported. Among 64 sample households 14 types of primary occupation is reported, of which 23% of households are involved in other labour and 15% in agricultural labour. Furthermore, 17% reported working as domestic maids and 14% reported Rickshaw/van/boat/bullock/push cart pulling as primary occupation during endline. Endline findings further indicate that most of the households (67%) have additional income sources other than the primary source. Nearly 20% of households have 2 additional income sources, 39% of households have 1 additional occupation and 8% of households have 3 additional occupations other than the primary one. Nonetheless, 33% households do not have any additional income source other than the primary one.

Lesson Learning Report: Aid Comilla 2012
14 | P a g e
Table: 2.2: Distribution number of other occupations of household head according to sex.
Number of other jobs
Endline
Male headed household
Female headed household
Both
N % N % N %
0 16 37.2 5 23.8 21 32.8
1 16 37.2 9 42.9 25 39.1
2 9 20.9 4 42.9 13 20.3
3 2 4.7 3 19.0 5 7.8
Total 43 100 21 100 64 100
Test X= 2.58832917543881, p= 0.4595392678119111 NB: Number of occupation other then household main occupation.
INCOME
Table 3.1: Mean distribution of household monthly income (cash and kind).
Baseline Endline Differences Test
Mean SD Mean SD Mean SD
1611.49 666.65 4867.31 6134.23 3255.81 6103.33 T=-4.267, p=0.067
Endline findings indicate a considerable change in income. The mean income at baseline was 1611 BDT and SD 666 BDT while at the endline mean income is 4867 BDT and SD 6134 BDT. The mean increase in income is 3256 BDT. In this table, income includes income both cash and in kind. Table 3.2 provides information of cash and in kind income separately. The mean monthly household cash income in baseline was 1447 BDT which increased to 3691 BDT at endline. Similarly, change is also observed in kind income. The mean kind income in baseline was 98 BDT while in endline it is 1177 BDT. Table 3.2: Mean distribution of household monthly income
Variables /Categories
Baseline Endline Differences Test
Mean SD Mean SD Mean SD
Cash income
1446.62 688.25 3690.62 4971.15 2243.99 4909.46 t=3.657 p=0.054
Kind income
98.05 133.09 1176.68 1597 1078.63 1464.02 T=5.894 P=1.605
Moreover, the daily per capita mean income also increased considerably between baseline and endline. The mean daily per capita regular income in baseline was 26 BDT which increased to 46 BDT at endline. Table 3.3: Mean distribution of household monthly regular income per capita/day.
Variables /Categories
Baseline Endline Differences Test
Mean SD Mean SD Mean SD
Cash income 24.56 22.44 32.82 31.47 8.25 36.13 t=1.829; p= 0.072
Kind income 1.50 1.69 13.82 15.08 12.0 13.80 T=6.95, p=2.36
Total 26.06 24.13 46.64 46.55 20.25 49.93

Lesson Learning Report: Aid Comilla 2012
15 | P a g e
Income change in percentage The endline findings indicate that income (cash and kind) of nearly 67% of households increased more than 55% in comparison to the baseline. However the increase in income of 20% of households remains within 15%. Table 3.5: Household income increase according to household regular income and total income in percentage (including in kind income).
Income increase (%)
Cash income Income including in-kind
N % N %
Up to 15 22 34.4 13 20.3
16 - 25 4 6.3 2 3.1
26-35 2 3.1 3 4.7
36 -45 4 6.3 4 6.3
46 - 55 - - - -
55+ 32 50 42 65.5
Total 64 100 64 100
CHANGE IN POVERTY THRESHOLDS
Table 3.6: Distribution of household poverty levels according to cash income per capita/day and sex of household head.
Variables (sex)
Baseline Endline
Extreme poverty
Poor Non poor
Total Extreme poverty
Poor Non poor
Total
N % N % N % N % N % N % N % N %
Male 36 90.0 - - 4 10.0 40 100 40 93.0 1 2.3 2 4.7 43 100
Female 20 83.3 - - 4 16.7 24 100 20 95.2 - - 3 4.7 21 100
Total 56 87.5 - - 8 12.5 64 100 60 93.8 1 1.6 3 4.7 64 100
Test X=0.609 p=0.341 X=0.496 p=0.780 NB: Inflation adjusted to 2011 according to rural food index inflation 12.03% Despite the large increase in income, after inflation adjustments for 2011, 94% of households at endline remain below the extreme poverty line according to HIES thresholds (daily per capita income below 48 BDT). However, 5% have crossed not only the extreme poverty line but also the poverty line and their daily per capita income is more than 55 BDT. The percentage of households in the non poor category increases further if kind income is included along with cash income. At the endline, 22% of households fall under the non poor category and the percentage of households earning less than 48 BDT drops to 72%.

Lesson Learning Report: Aid Comilla 2012
16 | P a g e
Table 3.7: Distribution of household poverty level according to total income (cash and in kind) per capita/day and sex of household head.
Variables (sex)
Baseline Endline
Extreme poverty
Poor Non poor
Total Extreme poverty
Poor Non poor
Total
N % N % N % N % N % N % N % N %
Male 35 87.5 - - 5 12.5 40 100 34 79.1 3 14.0 6 14.0 43 100
Female 20 83.3 - - 4 16.7 24 100 12 57.1 1 4.8 8 38.1 21 100
Total 55 85.9 - - 9 14.1 64 100 46 71.9 4 6.3 14 21.9 64 100
Test X= 0.215 p=0.454 X= 4.813 p= 0.090 NB: Inflation adjusted to 2011 according to rural food index inflation 12.03%
EXPENDITURE
Table 4.1: Mean distribution of household monthly expenditures.
Baseline Endline Differences Paired t-Test
Mean SD Mean SD Mean SD
1865.53 798.90 3006.15 2617.73 1140.61 2666.69 T=3.422, p= 0.001
Endline findings indicate considerable change in monthly expenditure. The mean monthly expenditure at baseline was 1866 BDT, while at endline the mean expenditure is 3006 BDT. The mean increase in monthly expenditure is 1141 BDT. For these findings, expenditure means only cash expenditure but includes irregular expenditure such as house repair, purchase of furniture etc. Nevertheless, when increase in family size is considered, the daily per capita regular expenditure at endline is 26 BDT while at baseline it was 25 BDT. Table 4.2: Mean distribution of household monthly regular expenditures per capita/day.
Baseline Endline Differences Test
Mean SD Mean SD Mean SD
24.56 22.44 27.27 17.83 2.70 25.32 t= 0.854, p= 0.395
Percentage increase in expenditure The endline findings indicate that total monthly expenditure including irregular expenditure of nearly 8% of households has increased by more than 55% in comparison to baseline. However, the increase in total monthly expenditure for 90% of households remains within 15%. Table 4.3: Percentage of increase in household monthly regular and total expenditure including irregular expenditure
Income increase (%) Regular expenditure Total expenditure (include irregular expenditure)
N % N %
Up to 15 32 50.0 57 89.1
16 – 25 3 4.7 - -
26-35 2 3.1 - -
36 -45 4 6.3 - -
46 – 55 4 3.1 2 3.1
55+ 21 32.8 5 7.8
Total 64 100 64 100

Lesson Learning Report: Aid Comilla 2012
17 | P a g e
ASSETS
Endline findings indicate some change in ownership of assets under all categories except household belongings. At the baseline only 33% of households owned livestock and 25% owned poultry. However, according to endline findings 100% of households own livestock and 52% own poultry. Among the households that have livestock, 28% have 2 and 72% own 1 livestock, while 27% of households have 3 or more poultry assets. Table 5.1 Ownership of asset household according to household head categories in percentage
Assets type
Number of items
Baseline Endline
Male Female Both Male Female Both
Livestock
N % N % N % N % N % N %
0 27 67.5 16 66.7 43 67.2 - - - - - -
1 3 7.5 2 8.3 5 7.8 30 69.8 16 76.2 46 71.9
2 2 5.0 1 4.2 3 4.7 13 30.2 5 23.8 18 28.1
3+ 8 20.0 5 20.8 13 20.3 - - - - - -
Total 40 100 24 100 64 100 43 100 21 100 64 100
Poultry
N % N % N % N % N % N %
0 30 75.0 18 75.0 48 75.0 18 41.9 13 61.9 31 48.4
1 3 7.5 4 16.7 7 10.9 5 11.6 2 9.5 7 10.9
2 1 2.5 - - 1 1.6 6 14.0 3 14.3 9 14.1
3+ 6 15.0 2 8.3 8 12.5 14 32.6 3 14.3 17 26.6
Total 40 100 24 100 64 100 43 100 21 100 64 100
Working equipment
0 4 10.0 3 12.5 7 10.7 8 18.6 5 23.8 13 20.3
1 7 17.5 5 20.8 12 18.8 9 20.9 2 9.5 11 17.2
2 13 32.5 9 37.5 22 34.4 7 16.3 5 23.8 12 18.8
3+ 16 40.0 7 29.2 23 35.9 19 44.2 9 42.9 28 43.8
Total 40 100 24 100 64 100 43 100 21 100 64 100
Household belongings
0 - - - - - - 0 - - - - - -
1 - - - - - - 1 - - - - - -
2 - - - - - - 2 - - - - - -
3+ 40 100 24 100 64 100 43 100 21 100 64 100
Total 40 100 24 100 64 100 43 100 21 100 64 100

Lesson Learning Report: Aid Comilla 2012
18 | P a g e
The value of assets Table 5.2: Mean asset value of asset transferred from shiree supported project
Variables /Categories
Endline
Male Female Both
Mean SD Mean SD Mean SD
Shiree livestock
11209.06 3354.86 13383.33 2763.52 11922.50 3314.60
Agriculture 2068.18 944.51 2269.23 2466.01 2137.39 1617.47
Business support
- - - - - -
Capital IGA - - - - - -
Khas land decimal
- - - - - -
Lease or mortgaged land
- - - - - -
The value of assets was not collected during baseline. Furthermore, the endline information also includes the value of assets transferred under the project. As such, it is very difficult to mention anything about change in value of asset since baseline. Nevertheless, the general shiree selection criteria for the extreme poor is that all beneficiary households did not own assets valued more than 5000 BDT during baseline. The mean asset value of Aid Comilla transferred assets is 11,921 BDT for livestock and 2137 BDT for agricultural inputs (see table 5.2). At endline the mean value of assets of Aid Comilla beneficiaries 17,235 BDT for livestock and poultry. Table 5.3: Mean distribution of household’s according to assets mean value and sex of HH head.
Variables /Categories
Endline
Male Female Both
Mean SD Mean SD Mean SD
Livestock 17483.00 10598.25 16726.19 4868.20 17234.68 9084.82
Working equipment
397.90 1243.66 293.80 760.34 363.79 1103.11
Household belongings
4301.39 2641.05 2704.52 2527.56 3777.42 2692.45
HOUSEHOLD SAVINGS AND LOANS
Endline findings indicate that mean cash monthly income is more than mean monthly expenditure which indicates the possibility of cash savings of households apart from the purchasing of assets. The endline findings on savings indicate change from the baseline. During baseline no households had any savings but at the endline it shows that 58% of households have some amount of savings of which 9% and 2% have savings between 1000-5000 BDT and 5001-10000 BDT respectively while 45% of households practice savings but the saving amount is less than 1000 BDT.

Lesson Learning Report: Aid Comilla 2012
19 | P a g e
Table 6.1: Distribution of household reporting to have savings as per household head category.
Category (BDT)
Baseline Endline
Male Female Both Male Female Both
N % N % N % N % N % N %
0 40 100 24 100 64 100 15 34.9 12 57.1 27 42.2
<1000 - - - - - - 21 48.8 8 38.1 29 45.3
1000-5000 - - - - - - 6 14.0 - - 6 9.4
5001-10000 - - - - - - 1 2.3 - - 1 1.6
10001-15000 - - - - - - - - 1 4.8 1 1.6
15001-20000 - - - - - - - - - - - -
20000+ - - - - - - - - - - - -
Total 35 100 29 100 64 100 43 100 21 100 64 100
Test X=7.48, p=0.11
In regards to loans, no households reported having any loans during baseline while at the endline nearly 34% of the households informed having a loan, of which 2% of households have taken loans from an MFI. Table 6.2: household percentage reporting to have outstanding loans and sex of household heads.
Sources of loan
Baseline Endline
Yes
No Outstanding mean (BDT)
Yes No Outstanding mean (BDT)
N %
N % N % N %
Informal without interest
- - 64 100 - 6 14.0 37 86.0 4990.36
With interest informal loan
- - 64 100 - 5 7.8 59 92.2 12880.00
Formal loan with interest MFI
- - 64 100 - 1 1.6 63 98.4 25000.00
Formal loan with GoB
- - 64 100 - - - - - -
Loan from shomity or CBO With interest
- - 64 100 - 1 1.6 63 98.4 7000.00
Other loan - - 64 100 - 6 14.0 37 86.0 4990.36

Lesson Learning Report: Aid Comilla 2012
20 | P a g e
HOUSING CONDITION AND ACCESS TO WATER SUPPLY, SANITATION AND ELECTRICITY
Change in wall and roof material of house Table 7.1 Distribution of households according to wall construction materials and sex of household heads.
Materials (walls)
Baseline Endline
Male Female Both Male Female Both
N % N % N % N % N % N %
Grass/jute stick/ leaves/plastic
27 67.5 18 75.0 45 70.3 3 7.0 3 4.7
Bamboo 2 5.0 - - 2 3.1 10 23.3 4 19.0 14 21.9
Wood 1 1.6 1 4.2 2 3.1
Mud - - - - - - 5 11.6 2 9.5 7 19.9
Tiles - - - - - -
Tin/CI sheets 10 25.0 5 20.8 15 23.4 25 58.1 13 61.9 38 59.4
Cement/brick - - - - - - - - 1 4.8 1 1.6
Others - - - - - - - - 1 4.8 1 1.6
Total 40 100 24 100 64 100 43 100 21 100 64 100
Test X=1.564, p=0.667 X= 5.765, p= 0.329
Endline findings indicate a change in the quality of wall material for the majority of households. During the baseline house walls for the majority of houses (70%) were made of grass/jute stick/leaves/plastic and 23% were made of tin/CI sheets. However, at the endline only 5% of houses have walls made of grass/jute stick/leaves/plastic and 59% are made of tin/CI sheets. Endline findings also indicate changes in the roof material for the majority households. During baseline only 70% of households had roofs made of Tin/CI sheet while at the endline it increased to 100%. Table 7.2 Distribution of households according to roofing materials and sex of household heads
Materials (roof)
Baseline Endline
Male Female Both Male Female Both
N % N % N % N % N % N %
Grass/jute stick/ leaves/plastic
11 27.5 6 25.0 17 26.6 - - - - - -
Bamboo 1 2.5 1 4.2 2 3.1 - - - - - -
Wood - - - - - - - - - - - -
Mud - - - - - - - - - - - -
Tiles - - - - - - - - - - - -
Tin/CI sheets 28 70.0 17 70.8 45 70.3 43 100 21 100 64 100
Cement/brick - - - - - - - - - - - -
Others - - - - - - - - - - - -
Total 40 100 24 100 64 100 43 100 21 100 64 100
Test X= 0.170, p= 0.918
Lesson Learning Report: Aid Comilla 2012
21 | P a g e
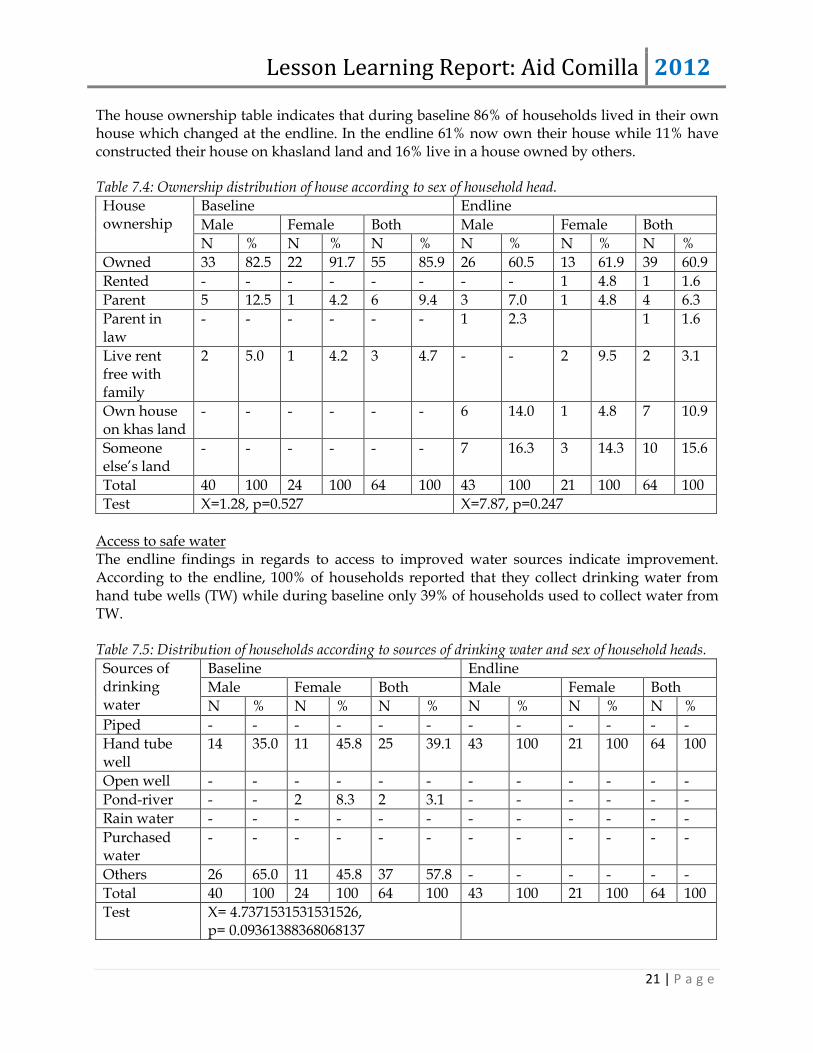
The house ownership table indicates that during baseline 86% of households lived in their own house which changed at the endline. In the endline 61% now own their house while 11% have constructed their house on khasland land and 16% live in a house owned by others. Table 7.4: Ownership distribution of house according to sex of household head.
House ownership
Baseline Endline
Male Female Both Male Female Both
N % N % N % N % N % N %
Owned 33 82.5 22 91.7 55 85.9 26 60.5 13 61.9 39 60.9
Rented - - - - - - - - 1 4.8 1 1.6
Parent 5 12.5 1 4.2 6 9.4 3 7.0 1 4.8 4 6.3
Parent in law
- - - - - - 1 2.3 1 1.6
Live rent free with family
2 5.0 1 4.2 3 4.7 - - 2 9.5 2 3.1
Own house on khas land
- - - - - - 6 14.0 1 4.8 7 10.9
Someone else‟s land
- - - - - - 7 16.3 3 14.3 10 15.6
Total 40 100 24 100 64 100 43 100 21 100 64 100
Test X=1.28, p=0.527 X=7.87, p=0.247
Access to safe water The endline findings in regards to access to improved water sources indicate improvement. According to the endline, 100% of households reported that they collect drinking water from hand tube wells (TW) while during baseline only 39% of households used to collect water from TW. Table 7.5: Distribution of households according to sources of drinking water and sex of household heads.
Sources of drinking water
Baseline Endline
Male Female Both Male Female Both
N % N % N % N % N % N %
Piped - - - - - - - - - - - -
Hand tube well
14 35.0 11 45.8 25 39.1 43 100 21 100 64 100
Open well - - - - - - - - - - - -
Pond-river - - 2 8.3 2 3.1 - - - - - -
Rain water - - - - - - - - - - - -
Purchased water
- - - - - - - - - - - -
Others 26 65.0 11 45.8 37 57.8 - - - - - -
Total 40 100 24 100 64 100 43 100 21 100 64 100
Test X= 4.7371531531531526, p= 0.09361388368068137

Lesson Learning Report: Aid Comilla 2012
22 | P a g e
Ownership of protected source During baseline no households owned any protected sources and most of them were collecting water from sources owned by others. However, at the endline findings indicate that 50% of households own tube wells, which also includes households having shared ownership (45%). Table 7.6: Distribution of households according to ownership of hand tube wells and sex of household.
Sources of drinking water
Baseline Endline
Male Female Both Male Female Both
N % N % N % N % N % N %
Owned by household
- - - - - - 2 4.7 1 4.8 3 4.7
Shared ownership
- - - - - - 19 44.2 10 47.6 29 45.3
Own by others
14 100 11 100 25 100 22 51.2 10 47.6 32 50.0
Not applicable
- - - - - - - - - - - -
Total 14 100 11 100 64 100 43 100 21 100 64 100
Test X=0.072, p=0.964
The endline findings indicate change in defecation practices since baseline. During baseline 80% of households used to defecate in ring-slab which increased to 88% during endline. Table 7.7: Distribution of household according to place of defecation and sex of household heads.
Place of defecation
Baseline Endline
Male Female Both Male Female Both
N % N % N % N % N % N %
Open spaces - - - - - - 1 2.3 - - 1 1.6
Hanging latrine
- - - - - - 1 2.3 - - 1 1.6
Pit latrine 10 23.3 3 14.3 13 20.3 5 11.6 1 4.8 6 9.4
Ring/slab latrine
33 76.7 18 85.7 51 79.7 36 83.7 20 95.2 56 87.5
Total 40 100 24 100 64 100 43 100 21 100 64 100
Test X=0.7013724989101187, p=0.40232289869712634
X=1.9001212888256076, p=0.5933933841862571
Electricity In regards to access to electricity some change has been observed since the baseline regarding electricity connectivity. During the baseline only 2% of households had a connection to electricity and at the endline it has increased to 16%. Table7.8: Distribution of households according to connection of electricity and sex of household heads
Type of electricity connection
Baseline Endline
Male Female Both Male Female Both
N % N % N % N % N % N %
No electricity 40 100 23 95.8 63 98.4 36 83.7 18 85.7 54 84.4

Lesson Learning Report: Aid Comilla 2012
23 | P a g e
Connected to main line
- - 1 4.2 1 1.6 7 16.3 3 14.3 10 15.6
Connected to other house
- - - - - - - - - - - -
Connected to generator
- - - - - - - - - - -
Solar power - - - - - - - - - - - -
Others - - - - - - - - -
Total 40 100 24 100 64 100 43 100 21 100 64 100
Test X= 1.693, p= 0.193 X= 0.0425, p= 0.836
CONCLUSION
The endline findings indicate that the situation of Aid Comilla beneficiary households has improved in the area of income, expenditure, value of asset, and savings. However, although 66% of households‟ income has increased by more than 55%, the income of 72% beneficiary households still remains below an inflation adjusted HIES lower poverty line of 48 BDT monthly income. However this should not be taken as diminishing the success of the project as it is largely a reflection of the level of extreme poverty of those enrolled on the programme who, despite significant improvements in their livelihood, remain below the HIES threshold which, in 2010, accounted for 17.6% of the entire population.

Lesson Learning Report: Aid Comilla 2012
24 | P a g e
Chapter Three: Beneficiary Focus Group Discussion
INTRODUCTION
Part of the lesson learning process is to hear from the beneficiaries on how they perceive the impact of the interventions on their livelihoods. For Aid Comilla, two Focus Group Discussions (FGD) were conducted in which approximately 16 male and female beneficiaries, 8 in each group, were interviewed to gauge their experiences with the interventions. Each FGD took two to three hours and was conducted by a three-person team: one shiree Programme Manager; one shiree Young Professional; and one Research Assistant for help with translations. The discussions focused on discovering key findings relevant to economic empowerment given the geographical and social contexts of the working area.
BEFORE INTERVENTION
Before the beneficiaries joined the Aid Comilla project, they were living in a state of destitution and absolute extreme poverty. Many of them only found work as domestic maids or day labourers and had an average monthly income below 22 BDT a day. Often their homes would be split during the lean period for many months because the male earners would be forced to migrate elsewhere. This would leave the family highly vulnerable, particularly the women who would likely have small children to care for. Meeting their basic needs was a constant daily struggle for them and they often only had one or two meals a day.
DAY ONE – FGD 1:
Number of BHHs: 8 women
After the Intervention.
They all received a heifer from Aid Comilla and they were able to get milk from the cow and sell it at the local market for income as well as reinvestment in additional livestock and vegetable cultivation. Assets amounted to about 30,000 BDT - one cow and one calf – plus an additional 200 BDT per month to cover food costs for the heifer. On average, they have to work four hours a day to take care of the heifer and the rest of the time can be used to engage in other economic generating activities, taking care of their families, housework, or market engagement. They all received training in fertilizer and compost preparations for their vegetable gardens. They are able to grow vegetables for self-consumption and selling at the local market.
Economic Security. Khadija Akter opened a DPS (Delta life insurance) and puts 105 BDT per month from her earnings from selling the milk. She is also engaged in home gardening. She thinks she could receive an additional IGA to further increase her income. She keeps her savings in a small pot and adds 100 BDT per month. She also recently sold a duck and chicken for 1100 BDT. They all see the trainings as the most important part of the project interventions because it has provided them with a life-long skill.

Lesson Learning Report: Aid Comilla 2012
25 | P a g e
Most of their husbands are not working at the moment so they are dependent on their wives‟ income. Their husbands are only able to find work as day labourers, which is seasonally dependent. When asked whether they want to continue with this IGA in the future, they all responded that they do but they also want to get involved with other IGAs. Also, they want their sons and husbands to begin working with them in taking care of the cow and other livestock. For them, it is very important that their husbands begin working so that both of them are earning income. The biggest challenge they face with maintaining economic security is during the rainy season. During this period, there is a lack of grass to feed their cows as well as safe shelter for their livestock in the case of flash floods. The rainy season brings the most challenges as the land often floods and they have a lack of food for themselves as well as their cows. To cope, they have saved some rice and some straw for cow feed. They can also sell their chickens for extra funds if needed. Empowerment and Confidence. They have learned a lot from the trainings on how to maintain their livestock and vegetable gardens. They think they have become cleverer since the intervention and feel engaged with their activities. They chose their own cow from the market with the support of Aid Comilla. For most of them, the trainings have increased their confidence the most because they feel more knowledgeable and can teach others what they have learned. They also felt that they formed a relationship with the other extreme poor family they gave their calf to. They all feel much more vocal and comfortable in speaking out in groups and they are not as shy as before. They have somewhat improved their positions within the community, but they have seen the biggest improvement in their confidence within their households. IGA suitability. They said that the IGA would not be suitable for the elderly or disabled. One old woman received a cow and had to get a caretaker to help her take care of it. They think old and disabled people should receive safety net support so that they do not have to work. However, it is difficult to find suitable IGAs for that demographic. In some cases, they would have preferred an IGA that is more female friendly, like a sewing machine or a grocery store. They would also prefer a split sharing system of cows within the community so that they could focus on other IGAs. However, they would recommend this IGA to other people because they have seen benefits from it. Gender Awareness and Household Dynamics. They all received training on gender as a part of project activities. They say that gender means to live comfortably between husband and wife. One beneficiary said that her husband used to beat her but now that she owns the asset and her husband no longer beats her. Their husbands used to make all decisions, but now they jointly make decisions together. Their husbands are supportive of their activities and trainings and they try to include them in trainings and

Lesson Learning Report: Aid Comilla 2012
26 | P a g e
meetings so they feel they are also part of the project. Both husband and wife attended the gender awareness trainings. However, they think that if the IGA had been given to the husband, their situation would not have improved. The husband would have preferred to sell their cow rather than maintain it. Overall, they feel that their relationship has improved with their husbands. Improved Health and Nutrition. They have improved their health conditions because they are able to consume more protein and vegetables than before. They have improved their consumption of milk, egg and vegetable. They are now teaching their children about proper sanitation and hygiene. They would choose to go to the government hospital for treatment (small illness only); they would have to go to a bigger health clinic for anything more severe. At times of critical illness, the whole group comes together to support and lend small funds. Community Engagement and Mobility. There is some jealously within the community that other poor people are not receiving similar support or trainings. Overall though, relationships have improved in the community. Other community members will now lend them small loans if necessary and they will support them by purchasing their milk. They are also invited to community festivals now. In some cases, they are able to give advice to others in the community on how to improve their livelihoods. Their relationship with community leaders has improved and they have increased their ability to negotiate. They also feel more comfortable now going to the market without their husbands. Market Engagement. They sell their product in the community and they face problems getting fair prices. However, they realize that if they went to the main market they would receive higher prices for their product, particularly milk, but that requires a lot of travel time. Access to Services. The government has provided them with one tube well and one toilet for ten households. They live in a cluster village and they all have to maintain the tube well and toilet amongst each other. All of their kids are now in school and receive a school stipend. One woman‟s husband who is disabled (he is blind and deaf) does not receive disability allowance. Sustainability. They feel that they can continue with their IGA without the support of Aid Comilla, but they would prefer to continue with ALO if it was an option. They will continue to hold group meetings and they feel that they can support each other to overcome any problems in the future. They feel that they can now meet their basic needs but their husbands need to get an IGA so that they can further improve their situations and ability to cope with shocks during the lean period. Overall, they feel more confident about their future than before.

Lesson Learning Report: Aid Comilla 2012
27 | P a g e
DAY ONE – FGD 2:
Number of BHHs: 8 women
After Intervention. They all joined the Aid Comilla ALO project in year one and received a heifer, cow vaccinations, vegetable seeds, feed costs and bamboo to shade the compost fertilizer. They thought it was better that ALO selected their IGA for them. If they had received cash, they likely would have used it to purchase food rather than to invest it. They have now reared a calf and given it to another extreme poor family in the community. They all received training on how to maintain the cow, on vegetable farming and compost fertilizer. For them, the trainings have been the most effective in improving their livelihoods.
Economic Security. They have daily work taking care of their cows. They are selling milk, compost fertilizer, vegetables from their gardens, and fuel made from cow dung. They usually sell their products within the community, but sometimes traders will buy their product to sell in the bigger market. They have been able to reinvest earnings in other livestock assets, such as chickens and ducks. One woman took out life insurance to plan for her families‟ future. Some have also opened up a savings account with Grameen Bank and they deposit about 30 BDT a week in it.9 During the rainy season they still face problems meeting their basic needs. They do not have to work during the lean period and can survive off of their small vegetable cultivation. They also store extra pulses during this time. Some of them grow trees to sell for wood during the lean period, or they sell cow dung as fuel. Fortunately, a new dam has been built nearby to minimize the flooding. Empowerment and Confidence. They feel much more vocal than before and confident to travel to the market. They have increased bargaining power as well and feel comfortable contacting the UP. Their family situations have improved. One woman says her husband shows her more affection now. They all have their own IGAs and feel empowered. Their husbands will not take food or money from them as they used to. Now they are respected and treated more equally than before. IGA suitability. They think this IGA is suitable for others in the community and they would encourage others to take on cow rearing. They do not think it would be suitable for the elderly or disabled; rather a small store would be better. All of them want to continue with cow rearing, but they would also like to start another IGA, such as a small sewing business.
9 Normally, you have to take out a loan to open the savings account, but they explained their situation that they
were part of the ALO project to the bank and an exception was made.

Lesson Learning Report: Aid Comilla 2012
28 | P a g e
Gender Awareness and Household Dynamics. Their husbands now understand that men and women are equal. The women feel that they have more value in the households than before. They own the assets, but they still try to share the decision making with their husbands. Their husbands sometimes participated in the gender trainings. Overall, the household dynamics have improved. They all agreed that it was better for them to manage the IGA rather than their husbands. If their husbands had owned the IGA than they would not have shared it with them and in some instances it would have led to further abuse. Also their husbands may have sold the cow for immediate cash. Owning the IGA has improved their dignity in society and within their households. It has helped increase their confidence and realize their own value. They are all aware that early marriage is bad and understand that they should not marry their daughters off before age 18 or their sons before age 21. Improved Health and Nutrition. They have improved food consumption due to their vegetable gardens and they regularly consume milk from their cows. Their children are much healthier now and do not get sick as often as before. They have also improved their hygiene and sanitation practices. They all know how to prepare oral saline solution and if someone falls ill they will take them to a nearby hospital. In some cases, they will call a doctor to come to them if necessary. One woman‟s husband fell really ill from the hard work of pulling a rickshaw. For many of them, health seems to be a major challenge. Community Engagement and Mobility. They used to have to ask their neighbours for help, but now their situation has improved and they are even able to share their food with others. They are now invited to community events and weddings and asked to participate in community meetings. Market Access. Very little was mentioned about their access to markets. They mostly sell their good within their community and sometimes a trader will come visit them to buy their products to sell at the bigger market. Access to Services. Their children all receive school stipends. They are not getting any safety net provisions from the government, with the exception of one elderly woman who received 300 BDT per month for Widow‟s Allowance. They now have good relations with the UP Chairman and can call him if they need anything. They do not want to get more help from the government. They just want to lead their own lives. Sustainability. They feel that they can meet their basic needs now and they are confident that they can continue to improve their livelihoods without the help from ALO. They try to save every month between themselves and their husbands. They do not think they should receive more help from ALO; rather it should go to other extreme poor households in the community.

Lesson Learning Report: Aid Comilla 2012
29 | P a g e
They would like to invest in other IGAs, such as sewing machines, and continue to improve their lives. They never used to think of their future, but now they can dream of a better life for their children. Many of them would like to build a big house for their families.

Lesson Learning Report: Aid Comilla 2012
30 | P a g e
Chapter Four: NGO Lesson Learning Workshop
INTRODUCTION
Part of the lesson learning process is to capture the experiences of the field staff involved in the innovation project. The field staff provide an essential view on the successes and challenges faced in the implementation of the innovation. They have worked closely with the beneficiaries and have had to mitigate the effect of a number of both small and large challenges on the livelihoods of the beneficiaries. In order to capture their experiences with the project, shiree held a day-long workshop with all project field staff present. The agenda consisted of:
1. Exploring challenges 2. Exploring successes 3. Summarising key lessons learnt 4. Review of the original innovation 5. Identifying potential challenges if the project were to go to scale 6. Discussing NGO feedback on report findings 7. Exit Strategy (see Annex)
CHALLENGES
All Field (15) staff from Aid Comilla ALO were asked to identify three challenges they felt the innovation project faced in the last three years. The challenges identified were as follows:
Access to services:
Inadequate supply of cattle vaccinations to protect against foot and mouth disease
Insufficient technical support for Artificial Insemination (AI) for cow rearing
Unavailability of khas land
Unavailability of quality seeds in the local market Targeting and working with the Extreme Poor:
Targeting the extreme poor based on shiree‟s selection criteria
Working with the disabled and elderly was particularly challenging considering the IGA was not appropriate for this demographic
The beneficiaries‟ lack of experience with livestock rearing meant intensive training was required
Working with females was challenging due to the conservative society of the district
Poor health and nutrition levels resulted in low working capital and high susceptibility to disease
Lack of interest in productive work among beneficiaries Intervention challenges:
Selection and training of local service providers for AI
Insufficient grazing land and fodder supply for cows/heifers

Lesson Learning Report: Aid Comilla 2012
31 | P a g e
Very challenging to birth calves from 100% of the cows/heifers (fertility rate was 80-85%)
Procuring cows from the local market meant that they were not as good of quality, but they had to use the local market due to high travel costs and the involvement of the beneficiaries in cow/heifer selection
Land is not suitable for cultivating crops due to its high levels of soil infertility
No available cow sheds led to insecurity and some livestock loss due to theft
There were problems with natural insemination from the bulls because the owners of the bulls were superstitious that a cow from a poor family would weaken their bull
External Shocks:
Disasters such as flash flooding and severe draught negatively impacted project activities
SUCCESSES
All field staff were asked to identify three successes of the project over the last three years. The successes identified were as follows:
Intervention successes:
They have been able to meet 95% of asset transfers
Beneficiaries are all actively involved with the IGAs partly due to the trainings and them building up their confidence and interest in the IGA
They have achieved more than targeted in the log frame for vegetable production
Developed local service providers (15) for vaccinations who now provide services to the beneficiaries as well the greater community; they have also been linked with livestock veterinarians and can now provide medicines when needed
Trainings on health awareness and increased vegetable consumption have improved health and nutrition levels
Rate of disease among livestock has decreased due to vaccination and deworming programme
Very low mortality rate: 1.06% among heifers whereas the national rate is 2.5%
Beneficiary Empowerment:
Social bonds were formed within the communities through the transfer of knowledge and trainings from the beneficiaries to other community members
Lending capacity has increased
Beneficiaries now have decision making power
By building up their bargaining capacity they were able to sell their own products in the market and get fair prices
Gender training improved household relationships between husband and wife
Increased empowerment when they donate a calf to another extreme poor household

Lesson Learning Report: Aid Comilla 2012
32 | P a g e
Access to Services:
Strong networks developed within the community between local service providers and beneficiaries
Market linkages developed for both input and output – cow feed is now available and beneficiaries can sell their products in the market (i.e. vegetables, cow milk)
Able to overcome the problems with AI and Natural Insemination (NI) by creating linkages with BRAC
Increased school rate among children of beneficiaries Sustainability and other successes:
Beneficiaries have now started saving and using Deposit Pension Scheme PS
Skilled in cattle rearing now and interested in increasing their cattle stock and continuing with the IGA
Aware of what to do in cases of health emergencies
Beneficiaries are conscious of dowry, early marriage and marriage registration
Many husbands returned after the women received assets
KEY LESSONS LEARNT
Based on the challenges and successes realized by field staff, they were then asked to reflect on the key lessons learnt over the last three years. Their responses were as follows:
Key lessons learnt on the innovation/intervention:
They thought that they could get 750 cows to all have calves, but this goal was not realistic and had to be adjusted
It was easier to convince the beneficiaries to give their calf to another EP than first thought; this was largely due to the convenient environment created; it was found that they were eager to help another extreme poor family in the community
Established AI centre and available technical staff is essential to run any technical project like ALO
Quality seeds were important to bring quality product
The elderly and disabled beneficiaries need another SSN mechanism as cow rearing was not suitable for them
Quality services of LSP were accepted by the community
Social networks were solidified within the communities because of the trainings and transfers of assets between community members;
Connections made with local elites and UP chairmen helped create community solidarity
To get fair prices market linkages need to be established Key lessons learnt on working with the extreme poor:
The extreme poor only need a little motivation and support to get engaged in IGAs
Economic empowerment motivated beneficiaries to send their children to school
The group approach worked well in motivating and empowering the beneficiaries
Diverse skill training helped to motivate beneficiaries and engage them with the IGA

Lesson Learning Report: Aid Comilla 2012
33 | P a g e
REVIEW OF THE INNOVATION
Aid Comilla submitted its original concept note at the beginning of 2009 and the final project proposal was won as a contract a few months later. However, as challenges arose due to unpredictability or a lack of understanding of a number of factors, such as environmental or social contexts, alterations to the original innovation had to be made in order to maximize gains made by the beneficiaries and ensure their climb out of extreme poverty. Part of the lesson learning process is to reflect on changes to the original innovation and most importantly look at why those changes took place and what it can tell us about the innovation. During the lesson learning workshop, Aid Comilla was asked to reflect on how the innovation has changed since the original project proposal was submitted in 2009. It was found that the overall innovation stayed the same with the exception of small activity changes. Initially, it was expected that each beneficiary would receive a heifer which would give birth to a calf that they would then give to another extreme poor beneficiary in their community. However, it was found that the fertility rate among heifers was lower than expected and not all heifers were able to rear calves. Additionally, there were some deaths among the heifers, which also resulted in a lower number of calf transfers during the second phase of the project. The low fertility rates and unexpected heifer deaths meant that Aid Comilla had to adjust its log frame and decrease the number of beneficiaries it had originally set out to work with from 1850 to 1500 households. This was the most notable change in project activities.
CHALLENGES: TAKING THE INNOVATION TO SCALE
Aid Comilla was asked to identify challenges they may face if they were to take their innovation to scale. Their initial response was that they would not face any challenges at scale because their innovation has been successful in its application. However, on probing it was found that disaster risk, political instability, social taboos and rumours, geographical constraints such as grass land, infrastructure and accessibility (roads), and local governance could pose constraints to the replication of the model at scale. Otherwise, they felt that the original model of heifer rearing then transferring the calf to another extreme poor community member would be applicable at scale and face few challenges.

Lesson Learning Report: Aid Comilla 2012
34 | P a g e
Conclusion: Progress Against Logical Framework
Objective Verifiable Indicators Means of verification
Achievement Assumption
Goal: Government of Bangladesh MDG targets 1 and 2 on income poverty reduction and hunger achieved by 2015.
Reduction in the proportion of people living in extreme poverty from 28 percent in 1991/92 to 9.5 percent by 2015 in line with „Poverty Reduction Strategic Plan‟ (PRSP) target.
National Statistics, UNDP, WB, MDG-Report
Purpose: 1,850 households have lifted themselves out of extreme poverty in coastal Feni district by 2012. Immediate objective: Target households have strengthened their livelihood outcomes and social capital
80 percent of women have access to secured income options year round Increased households assets value by 50 percent over baseline 70 percent of targeted households have at least two meal a day 80 percent households consume more milk and nutritious vegetables. 50 percent Community groups emerged as a local platform for and collectively contributes in disaster preparedness, response and mitigation efforts
Household baseline and end line surveys Project M&E data and secondary information. Focus Group Discussion (FGD). External evaluation
1488 (99%) of women have access to secured income options year round Increased households assets value by 67% over baseline
1140 (76%) of targeted households increase average meal and consume more milk and nutritious vegetables taking 2 or more meal a day 1488 (99%) households are consuming more milk and nutritious vegetables, 1488 (99%) of target beneficiaries households provided with means to
No severe cyclone make land fall in Feni or nearby districts during project period. Prices of livestock and kitchen gardening related inputs and outputs do not fluctuate extremely.

Lesson Learning Report: Aid Comilla 2012
35 | P a g e
engage in community initiatives and improve their relationships within the community. 102 Community groups are emerged as a local platform and collectively contributes in disaster preparedness, response and mitigation efforts
Outputs:
1. Knowledge on improved livestock management and kitchen gardening disseminated to 1,850 extreme poor households and 15 Para-vets developed 2. Heifers conditionally transferred to 750 target households with technical support. 3. Target households facilitated to form marketing groups and build bargaining capacity 4. Communities facilitated to improve capacity for disaster preparedness, response and mitigation
1.1. 80 percent of targeted women able to explain the heifer management and rearing technologies. 1.2. 80 percent of women articulate at least 7 types of nutritious and profitable vegetables and 5 improved production technologies. 1.3. 80 percent of women beneficiaries who attended courtyard sessions are aware of basic health and hygienic behavioral practices. 1.4. 90 percent Para-vets clearly explains most common 5 diseases and vaccines. 2.1. 750 women receive one heifer, stipends and artificial insemination support each on condition of transferring first off-spring to other beneficiaries. 2.2 750 calves born in PY-1 and conditionally transferred to new batch of 750 women in PY-2
Baseline survey and periodic monitoring report. KAP studies on training and assets transferred Physical presence Purchase receipts for livestock and other items
1488 (99%) of targeted women able to explain the heifer management and rearing technologies.
1488 (99%) of women articulate at least 7 types of nutritious and profitable vegetables and 5 improved production technologies. 1488 (99%) of women beneficiaries who attended courtyard sessions are aware of basic health and hygienic behavioral practices. 15 (100%) LSPs clearly explain most common 5 diseases and vaccines. Assets/ stipend
Sterilized heifer can be screened out by project activities. Vaccines are available and of proper potency from recognised sources. Project is able to motivate and engage local communities including UPs to encourage the second/third year beneficiaries to handover calves. .

Lesson Learning Report: Aid Comilla 2012
36 | P a g e
2.3 300 women receive calves as transfers from earlier batch of recipients in PY-3. 2.4 Average weight of heifers increase by 50 percent within 6 months. 2.5. Male calves are reared for beef fattening and sold at high price 2.6. 50 percent heifer rearer received services from Upazila livestock department 2.7 80 percent households have kitchen gardens for at least five varieties of vegetables 3.1 80 percent women receive support from the marketing groups 3.2. 70 percent beneficiaries receive fair price in local markets milk and beef, other by-products. 3.3. 50 percent beneficiaries sold by-products (milk, fertilizer/ cow-dung) 4.1 80 percent of most vulnerable communities are aware about the allied organizations and accumulate common resources for disaster preparedness and response 4.2 80 percent women know about the activities of the volunteers
transferred in kinds to 1488 (99%) by EoP. In Yr2&3, 738 HHs receive calves from the beneficiaries of Yr1&2 Average weight gain by 70% of the female heifers within 6 months. Male calves are reared for beef fattening and sold at high price. 1488 (99%) BHHs cultivated an average of 5 different vegetables in a year. 1200 (80%) beneficiaries accessed to local markets. 870 (58%) beneficiaries sold by-products (milk, fertilizer/ cow-dung) 1450 (97%) of most vulnerable communities are aware about the allied organizations and accumulate common resources/ tools for early warning system

Lesson Learning Report: Aid Comilla 2012
37 | P a g e
Annex: CMS 2 and CMS 4 Findings
CMS 1 BASELINE SUMMARY
Household Target:
1,500 (No.) (%)
CMS1 records available:
1,148
Total Household Members
3,293
Average HH Income: 807.3
Tk. per month Average HH Size: 2.9
Average HH Expenditure: 867.4
Tk. per month Male Headed HH 542 47.2
Average HH Land: 3.1 decimal Female Headed HH 606 52.8
Khasland 0.3 No of under 5 children 89 7.8
Owned land 1.6 No. of under 18 girls 679 59.1
Not Owned land 1.2 HH having disabled member 67
8.3
SUMMARY OF CMS 2 AND CMS 4
This annex provides a brief summary of change comparing CMS 2 data from the pilot study with CMS 4 findings.
CMS 2 is a monthly snapshot that allows tracking of household livelihoods and of events capable of impacting these livelihoods. It uses innovative mobile phone technology to collect data with the survey being delivered by NGO staff during their normal round of BHH visits. The survey is short and simple, focusing on beneficiary self-assessment of change using a multiple-choice format. The data collected from Aid Comilla beneficiaries was a part of the pilot study of CMS2. Therefore, the data only tracks an average of 300 BHHs over a 7 month period from June 2011-January 2012 and change from intervention impact cannot be accurately monitored using only this tool.
CMS 4 provides a forum for beneficiaries to explain changes in their lives and the reasons for these changes, as well as creating a platform for NGOs to adapt and improve their innovations according to the needs of the beneficiaries. This is implemented only by Innovation Fund NGOs. The objective of CMS 4 is to undertake a participatory evaluation and review of project experience at both the level of beneficiaries and for the implementing NGO. The focus on CMS 4 is in depth understanding of the innovation, enabling identification of successes and challenges and quick feedback into project management decisions. CMS4 began in the third quarter of 2010 and Aid Comilla has only carried out CMS 4 four times during the project with 10-12 HHs in a total of 10 groups (100 HHs total).This has resulted in limited findings and therefore should not be used as a sole reflection of intervention impact, but rather an additional tool to track changes in beneficiaries‟ lives during their participation in the project.

Lesson Learning Report: Aid Comilla 2012
38 | P a g e
Chapter Two provides a more accurate quantitative summary of intervention impact using an endline to baseline comparison of key indicators- income, expenditure, savings, assets, health and confidence.
CMS 2 METHODOLOGY
The CMS-2 pilot questionnaire used a 5-point scale for responses to questions on the following indicators: income, expenditure, health status, and self-confidence. The questions asked the beneficiary to assess the change in each indicator with qualitative responses. In order to take average readings across the project the qualitative responses were converted into quantitative ones. The weights range from +2 to -2 and are equivalent to the qualitative responses, as shown in the table below:
Income Decreased a
lot Decreased a
little Remained the same
Increased a little
Increased a lot
Expenditure Decreased a
lot Decreased a
little Remained the same
Increased a little
Increased a lot
Health Significantly deteriorated
Deteriorated Remained the same
Improved Much
improved
Self-Confidence
Highly decreased
Slightly decreased
Unchanged Slightly
increased Highly
increased
Weighted Scale
-2 -1 0 1 2
For questions on savings and assets, the CMS-2 questionnaire responses were binary, with only two possible answers. The questions asked whether the beneficiary had savings or had purchased any assets in that month. The weighted score are equivalent to the qualitative responses, as shown in the table below:
Savings Have cash savings No cash savings
Asset Bought an asset No asset bought
Weight Score 1 0
To obtain a monthly value for each of the six variables the weighted average was taken for each one. For example, the monthly income variable for Aid Comilla would be the sum average of all the converted responses given for income.
An „Economic‟ index was created as a composite of four of the above variables: income, expenditure, cash savings and asset bought. The monthly scores from each of the economic variables can be added together to give a monthly economic composite value for each beneficiary. The absolute maximum score is +6 and the absolute minimum score can be -4. Hence the formula:
Economic = Income + Expenditure + Savings + Asset Bought
A monthly Economic index value for Aid Comilla beneficiaries is then calculated by taking the sum average of all of the „Economic‟ scores. The scale is then converted to qualitative responses based on the weighted score given equivalent to the maximum and minimum possible scores:
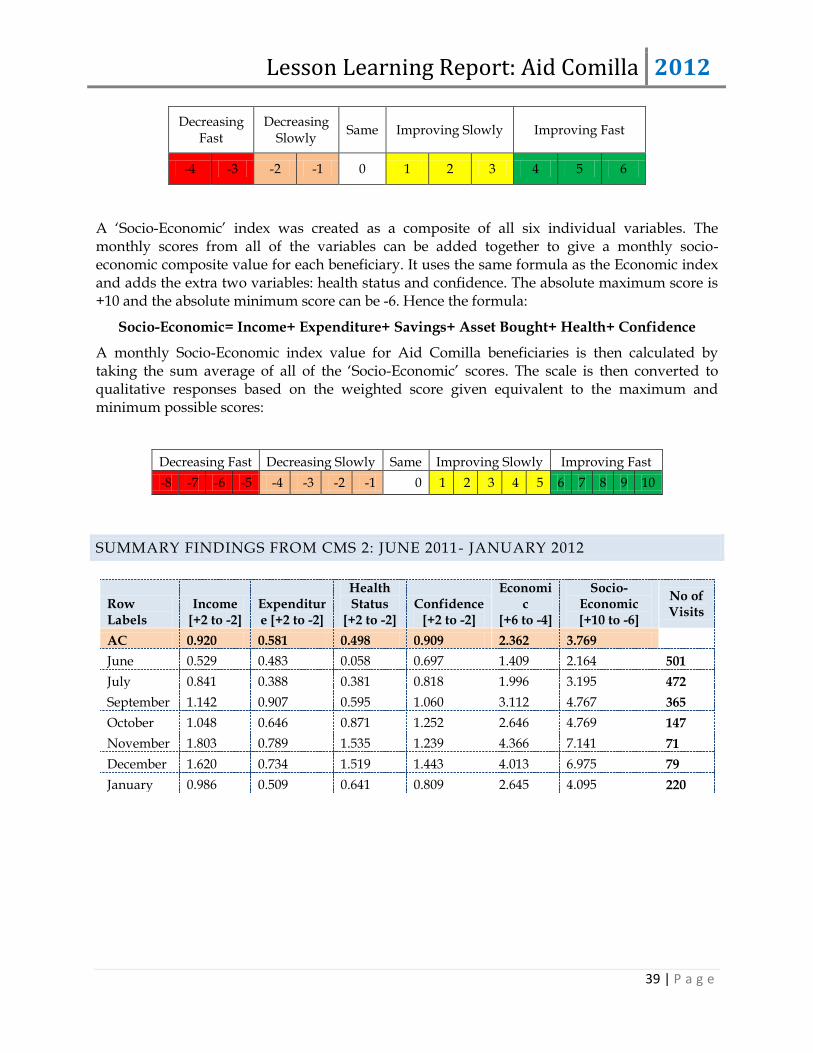
Lesson Learning Report: Aid Comilla 2012
39 | P a g e
Decreasing Fast
Decreasing Slowly
Same Improving Slowly Improving Fast
-4 -3 -2 -1 0 1 2 3 4 5 6
A „Socio-Economic‟ index was created as a composite of all six individual variables. The monthly scores from all of the variables can be added together to give a monthly socio-economic composite value for each beneficiary. It uses the same formula as the Economic index and adds the extra two variables: health status and confidence. The absolute maximum score is +10 and the absolute minimum score can be -6. Hence the formula:
Socio-Economic= Income+ Expenditure+ Savings+ Asset Bought+ Health+ Confidence
A monthly Socio-Economic index value for Aid Comilla beneficiaries is then calculated by taking the sum average of all of the „Socio-Economic‟ scores. The scale is then converted to qualitative responses based on the weighted score given equivalent to the maximum and minimum possible scores:
SUMMARY FINDINGS FROM CMS 2: JUNE 2011- JANUARY 2012
Row Labels
Income [+2 to -2]
Expenditure [+2 to -2]
Health Status
[+2 to -2] Confidence
[+2 to -2]
Economic
[+6 to -4]
Socio-Economic [+10 to -6]
No of Visits
AC 0.920 0.581 0.498 0.909 2.362 3.769
June 0.529 0.483 0.058 0.697 1.409 2.164 501
July 0.841 0.388 0.381 0.818 1.996 3.195 472
September 1.142 0.907 0.595 1.060 3.112 4.767 365
October 1.048 0.646 0.871 1.252 2.646 4.769 147
November 1.803 0.789 1.535 1.239 4.366 7.141 71
December 1.620 0.734 1.519 1.443 4.013 6.975 79
January 0.986 0.509 0.641 0.809 2.645 4.095 220
Decreasing Fast Decreasing Slowly Same Improving Slowly Improving Fast
-8 -7 -6 -5 -4 -3 -2 -1 0 1 2 3 4 5 6 7 8 9 10

Lesson Learning Report: Aid Comilla 2012
40 | P a g e
INCOME AND EXPENDITURE: CMS 2 AND CMS 4
CMS 2
CMS 4
CMS 4 asked BHHs on a quarterly basis whether their income and expenditure were either getting better or worse in their life. The graph shows negative responses from BHHs with an average of 20% of BHHs saying their situation has gotten worse and only 15% saying it has gotten better since the project began.
CMS 2 indicates that the majority of BHHs have seen positive, although small changes in both income and expenditure since June 2011. For income, the average BHH has seen a slight increase with some higher increases in change during the third quarter. Expenditure has been increasing slightly from June through January. One reason for the increase in income during November may have been Eid when beneficiaries may have received cash in kind from friends or neighbours.
These findings do not agree with CMS 4 findings, which show negative responses from BHHs regarding changes in income and expenditure.

Lesson Learning Report: Aid Comilla 2012
41 | P a g e
ECONOMIC STATUS: CMS 2 AND CMS 4
CMS 2
CMS 4
CMS 4 asked BHHs on a quarterly basis whether or not their assets and savings were getting better or worse. BHHs have indicated that savings and assets have gotten worse with nearly 20% indicating it is a problem in the last CMS 4 report.
The second graph shows the percent of BHHs who have saved money. There is a slight decline since February 2011 from 54% of BHHs savings money to 48.7%. November 2010 data was not collected and therefore shows zero responses.
CMS 2 findings for composite changes in economic status, including: income, expenditure, cash savings and assets bought show positive changes from June 2011. The majority of BHHs found a positive rate of change in their economic status, which continued to increase through January.

Lesson Learning Report: Aid Comilla 2012
42 | P a g e
HEALTH STATUS: CMS 2 AND CMS 4
CMS 2
BHHs whose overall health status has shown positive change during the period of June 2011 to January 2012.
CMS 4
CMS 4 asked BHHs on a quarterly basis if their health and WATSAN was improving. The graph indicates that there has been a decline in health and WATSAN and an increase in the number of BHHs who find it is a problem.
CMS 2 indicates that the majority of BHHs have experienced little change in health status, with the exception of November and December when they saw significant positive changes in health status.
This is not fully reflected in CMS 4 data which actually shows a steady decline in health and WATSAN among BHHs.

Lesson Learning Report: Aid Comilla 2012
43 | P a g e
CONFIDENCE STATUS: CMS 2 AND CMS 4
CMS 2
CMS 4
CMS 4 asked BHHs on a quarterly basis whether their social status and empowerment has improved. The graph shows improvements in both indicators from BHHs, but a slight decline in the last report with only 12% responding positively and 11% saying it is a problem.
CMS 2 indicates that the majority of BHHs have seen slight improvements in their confidence levels, with the exception of the fall when BHHs began to see greater improvements in confidence.
This is reflected in CMS which also show the majority of BHHs find their social status and empowerment improving.

Lesson Learning Report: Aid Comilla 2012
44 | P a g e
SOCIO-EONOMIC STATUS (COMPOSITE)
CMS 2
CMS 2 findings for composite changes in socio-economic status, including: income, expenditure, cash savings, assets bought, health and confidence show positive changes from June 2011. BHHs show a steady increase in socio-economic status moving from 2.2 to 7.1 from June through November, then showing a slight decreasing in positive change in December and January. BHHs were still experiencing positive change, only to a lesser extent than before.

Lesson Learning Report: Aid Comilla 2012
45 | P a g e
Annex: FGD Questionnaire
Aim: To reflect the BHHs‟ view on project‟s success and impact of interventions
- 1st year BHHs - 5 to 8 beneficiaries for in-depth analysis (different locations)
Process in selecting households:
1) One where someone mentioned an interesting success story and why
2) One where it failed or did not work so well
Preamble: Thank you for taking the time to sit and speak with us today. We would like to talk to you about your experience participating in the SKS project and to understand what worked and what didn‟t work in the intervention. We are interested to know how the interventions have or haven‟t impacted your lives in different areas, what challenges you have faced over the last two-three years, and how you envision your future now that you have been a part of this project. Try to think of what you had before you joined this project and what you have now after two-three years of training and support. We will be asking questions regarding changes in your income, assets, savings, health, food intake, ability to overcome shocks (environmental or health related), relationships with key people – friends, family, moneylenders, shopkeepers, UP chairman/members, political figures – and overall well-being.
We are the students and you are the teachers today – only you know the truth and details of how the intervention worked for you. What we learn today will not directly change your position; however it will be used to improve other extreme poor programmes and better shape the way NGOs and the government work with the extreme poor. Our learnings will hopefully influence the government to sponsor programmes that actually work for the poor and improve their lives.
It is also important to understand that “This is a safe place to share your thoughts and feelings in regards to the Aid Comilla project and nothing you say will impact your relationship with the project field staff.”
FGD Questionnaire:
Exploring IGA Impact
1. What was your life like one year before you joined the project? What is your life like now? Why?
2. What type of intervention(s) did you receive from the project/NGO? What is the status of your IGA now?
3. How was the IGA chosen for you? Did you ask for it or was it selected by the NGO? 4. Did you receive any previous experience or exposure to the intervention? If not, did you
receive training? By whom? 5. What was your income, assets and savings before the interventions? Were there any
changes in income, assets, and savings due to interventions?

Lesson Learning Report: Aid Comilla 2012
46 | P a g e
6. Where do you sell your produce? Do you get fair prices? (specific to type of IGA) 7. Will you continue with the same types of IGAs? 8. What would you say worked best about the intervention you received? Why? What
worked least well? Can you discuss why it didn‟t work? Would any of you have preferred to have another type of IGA? If yes, why?
9. What have been some of the key challenges you have faced during this project (regarding the implementation of the IGA)?
10. Would you recommend this IGA to other people? Why/why not? Will you be continuing with this IGA post-project involvement?
11. How long have you spent on this IGA and how has this impacted your daily routine? Did you have to give up other paid work or do less work at home? (Opportunity cost)
12. How suitable is this IGA for FHHs? Disabled? Elderly? If not, why? 13. (For women) If a husband operated the IGA, in what ways did his wife benefit and in
what ways did she fail to benefit? What would happen if a husband or son who managed the asset later left this wife?
Other Indicators
14. What has been the community‟s perception of your involvement in this project? Has it improved or worsened your engagement within the community? Explain how and why it changed and what it means for you and your family.
15. How has this intervention impacted your resiliency- your ability to cope during the lean period? How has it affected your ability to respond and recover from environmental shocks?
16. Has the health conditions of your HH improved over the project period? Explain. 17. Do you have better access to health care services than before the intervention? 18. Have your food habits changed since you joined this project? Explain. 19. In general, what has this project intervention meant for you and your family? How have
your kids benefitted or not? 20. Do you feel you are more or less mobile than before? Specific for FHHs. 21. Confidence- How mentally strong did you feel before the intervention? Do you feel
more confident now? In what area are you confident and why? 22. Do you feel assured you can meet your basic needs regularly in the coming year? Why
or why not? Do you feel you can prosper beyond your meeting your basic needs in the coming year? Why?
23. Empowerment- In negotiation with your husband, has your power in decision making improved since the intervention? In what areas and why? In what areas has your decision making not improved? Why?
24. Has your power in negotiations with family, community members, shopkeepers, employers, patrons, moneylenders, political official changed? If so how and why? Please explain.
25. Security/resiliency- Do you feel you are more or less able to cope with shocks? What kind of shocks and why?
26. Sustainability- Do you feel you need further assistance, such as safety net support? Why?
27. How has your future planning changed? Has your future outlook changed? How and why?

Lesson Learning Report: Aid Comilla 2012
47 | P a g e
28. What has your relationship been like with the field staff? Do you feel the NGO staff respect you? Have they ever been rude to you? This question should not be asked in front of the NGO staff to ensure honest answers.
29. Has your access to local services improved? For example, access to sanitation and education services?

Lesson Learning Report: Aid Comilla 2012
48 | P a g e
Annex: Exit Strategy
OBJECTIVE OF EXIT STRATEGY:
i) Achieve sustainability of the project purpose so that it would able to contribute in achieving the goal;
ii) Guide all concerned in strengthening capacity of group and individual so that extreme poor households can lift themselves from poverty line.
Component of exit strategy
Descriptions Action Plan Comments
Exit Meeting with BHHs and other Stakeholder of the Union
AID-COMILLA will organize Exit meeting in each of three Unions of Porshuram Upazila between 1st through 2nd week of August 2012.
Exit-meeting participants:
Participants will be members of LGI, i.e. Upazila Livestock Officer, Upazila Agricultural officer, Chairman and Members of the Union, Local Shop-keepers, Pharmaceutical Representatives, Union-based BHHs and concerned LSPs of the ALO project.
The total participants per meeting may be limited to 200. Therefore, there may be 2 or 3 meetings in a Union.
Mirjanagar =3
Chitholia =3
Box-Mahmud =2
AID-COMILLA will provide the list of BHHs to the LGI; in the meeting they will again highlight project goals and achievements; they will also inform the terms and conditions of what the beneficiaries will be doing post-project so that they can continue monitoring their status.
Continuation of livestock services through Local Service Providers(LSPs)
AID-COMILLA has developed Fifteen (15) Local Service
Providers (LSPs) from inhabitants of local community in the project area. They will continue their treatment with medicine and other technical support like de worming, vaccination, AI etc. to beneficiaries for their cattle at fair price or reasonable service charge. Those LSPs will also extend their services on marketing of cattle-feed, milk and vegetables products.
LSPs will deliver services at reasonable service charge to the BHHs and will keep supply of medicines at fair prices.
MoUs have been signed between LSPs and Aid- Comilla to continue their (LSPs) services to the community as a whole and especially to the BHHs of ALO project. However, the service charge is not fixed as the matter depends on the situation; that will be decided in a participatory way between LSP & BHHs
Established Network in terms of Public Private Partnership
AID-COMILLA established linkage/networking among Govt. Livestock Department at district & Upazila level, representatives of private veterinary companies and
This matter will be further discussed in the Exit meetings as
MoU is not feasible, but an alternative is to encourage the beneficiary groups to connect with the government for increased services. LSP can play

Lesson Learning Report: Aid Comilla 2012
49 | P a g e
(PPP) local elite persons with BHHs as well as with Local Service Providers (LSPs).
planned above.
the role as the mediator between beneficiaries and LGI and other stakeholders.
Established Market development and service delivery linkage
AID-COMILLA established market development linkage among producer, seller, buyer and consumers. AID-COMILLA has facilitated to develop strong networking of LSPs with Representatives of different Pharmaceutical companies for supply of medicines, with BRAC staff of local branch for supply of AI, the local shop-keepers for supply of cattle-feeds and the Upazila Livestock Officer and DLO for technical support.
This matter will be informed to the community people in the Exit meetings as planned above.
MoU is not feasible, but an alternative is to encourage the beneficiary groups to connect with the government for increased services. LSP can play the role as the mediator between beneficiaries and LGI and other stakeholders.
Economic independence
Beneficiaries will have greater access to income options and increased cash earning, gradually improved by means of economic solvency, food security and assets ownership.
LSPs will continue to supervise activities and ensure that BHHs continue with the IGA; they will also increase secondary IGAs
Helping attitude developed among the beneficiaries (BHHs)
Our BHH help to others / neighbours on cattle, marketing and agriculture related problem in and out of group members.
Group meetings have helped develop community solidarity which will carry on post-project and continue to increase social capital among the BHHs and other community members.
Incorporate a micro finance programme.
AID-COMILLA will merge the BHHs in its micro finance Programme.
Only Interested beneficiaries.
This is only for interested BHHs and they are thinking of involving them only with AID-COMILLA MFI and they will play a supportive role for the BHHs and will not pose the same dangers as other MFIs.
Follow-up Staff members of Parshuram branch office of AID-COMILLA (if any) will provide follow-up services on occasional terms.
So long as the office of AID-COMILLA will be present at Porshuram.
LSP will organize quarterly meeting with all BHHs and stakeholders and AID-COMILLA staff will also be present in that meeting.
Other AID-COMILLA project staff in the area will keep an eye on BHHs post-project.

Lesson Learning Report: Aid Comilla 2012
50 | P a g e
Annex: Financial Overview
Budget Line Total Contract budget
Total Expenditure as of June 2012
Human Resource Cost 6,941,740 6,215,284
Travelling Cost 218,580 200,890
Vehicles & Equipment 955,801 955,801
Office Rent & Utilities 412,663 383,138
Administration cost 932,488 820,707
Operational Cost 943,437 643,780
Direct Delivery to Beneficiaries 17,169,721 16,333,303
Total Direct Cost 27,574,430 25,552,903
Contingencies 11,463 -
Management Cost(Over head) 413,615 383,283
Total Cost 27,999,508 25,936,186
No of Beneficiaries 1,850
Total cost per BHH 15,135
Direct cost per BHH 9,037
Note: amount in BDT

Lesson Learning Report: Aid Comilla 2012
51 | P a g e
Annex: Case Study
Prior to becoming a beneficiary of Alternative Livelihoods Options (ALO) project of AID-COMILLA-Shiree, Jaheda was destitute and excluded from any safety net programme from the government or any other organizations. It was very difficult for her to afford two meals a day when there was no work in the area. She had to send her son to a Madrasha. In spite of her poverty she was determined to continue her child’s education. As a partner NGO of Shiree, AID-COMILLA provided Jaheda with support including a Heifer, compost shed, various types of vegetables seeds in different cropping seasons, cattle feed, along with different types of cattle saving essential vaccine and medicine. Now she is living with her only college-attending daughter. Jaheda proudly gave away her first calf to another extreme poor Razia Akter; supporting another in a way that she never imagined she could.
Prior to joining Aid Comilla, she was living in North Teteshwor on the bank of ‘Kohua’ river. She was about 65 years old with two beloved sons and a daughter. The only earning member of the family was her elder son who got married and left her because of the poverty strain of the family. So Jaheda was in a poor state to provide for her other children. At that time AID-COMILLA reached her with the ALO project in the process of searching for extreme poor women like her to involve her in project activities. So Jaheda was selected as direct beneficiary on 30th January 2010.
Apart from receiving assets from the ALO project, Jaheda received additional training on heifer management, vegetables cultivation, compost production, disaster management and gender and leadership development. Through weekly group meetings she was also made aware of her civic rights, and proper practices regarding water, sanitation and hygiene, dowry, acid throwing, early marriage, verbal divorce, domestic abuse, indifference to the rights of the girl child, education etc. Following her Livestock, Agriculture, Gender and Disaster management training she understands the importance of vaccination, de-worming, prompt treatments of disease, benefits of AI, year round vegetables production, compost preparation and fodder cultivation. She got some Napier cutting from the project and has sown three rows from them. Jaheda’s good practices encourage others. Sometimes her neighbours come to her for advice when they face problems with their cattle. She feels proud and empowered.
Jaheda is re-investing the earnings from her heifer in her child’s education. She also gets 1.5-2 litre milk a day whose market value is around 60-80 taka. She consumes half litre for her children and rest of the milk is sold in the local market or among the neighbours. Now she uses a part of her earning money for her daughter’s education expenses and a part for her son’s ‘National Imam Training Programme’. She is really happy and proud of it. She is determined to continue her daughter’s education up to graduation.
Jaheda is using compost in her homestead gardening, cow-dung as homemade fuel sticks for cooking, as manure for fodder plot and rest of them is sold among the neighbours. These are strong supports for her poor family. She is preserving seeds for future use through technical support from AID-COMILLA. Jaheda is proud of what she has achieved through her hard work, with the assistance from AID-COMILLA. She is growing vegetables round the year. She sells vegetables among the neighbours after meeting her family requirements. Jaheda saved some money from selling vegetables, compost and milk.
These days she thinks about the future with optimism. She can eat three meals a day with vegetables and consumes fish, milk etc after the project intervention. Jaheda’s story is a good example of how the AID-COMILLA helps ultra poor to lift them from extreme poverty line. The package of inputs, support and training provides skills, assets and confidence to improve their livelihoods. . “It is a generosity of the project that one poor can help another poor” – she uttered proudly.

shireeHouse 5, Road 10, BaridharaDhaka 1212, BangladeshPhone: 88 02 8822758, 88 02 9892425E-mail: [email protected]
www.shiree.org