lesson 1 where in the world is water? 1: where in the world is water? ... activity concepts: affects...
TRANSCRIPT
WATER QUALITY AWARENESS IN URBAN ENVIRONMENTS
LESSON 1 WHERE IN THE WORLD IS WATER?
4-H SET: WATER QUALITY AWARENESS IN URBAN ENVIRONMENTS - LESSON 1 [1]
Lesson Overview: Water, one of Earth’s most limited resources, is “re-cycled” over and over again. It is important to understand the restricted accessibility of fresh water available on earth to sustain human, animal and plant life.
We may think that water is everywhere, but is it? Although water covers 70-75% of the earth’s surface, most of it is in the world’s oceans (97 %!) in the form of salt water, which cannot be used to support life on land because of its salinity (salt content). (Note: A very small amount of saltwater is found in inland bodies of water like Utah’s Great Salt Lake). After oceans, 2% of the remaining water is frozen in icecaps and glaciers. Although this is fresh water, it is also unavailable to plants and animals that live on land because it is frozen. The remaining water on earth – less than 1% – is found in groundwater, freshwater lakes, streams, and as water vapor in the atmosphere.
Activity Concepts: Global water distribution
Subject Links: Science: hydrologic cycle
Vocabulary: Global water distribution; salt water; freshwater; groundwater; lakes; streams; water vapor; and water conservation.
Purpose of activities: Youth will have the opportunity to explore how water is distributed on Earth.
Overview of activities: Youth will explore global water distribution through hands-on activities.
Time Required: Approximately 20-30 minutes (Activity 1); approximately 30-40 minutes (Activity 2).
LESSON 1: Where in the World is Water?
4-H SET: WATER QUALITY AWARENESS IN URBAN ENVIRONMENTS - LESSON 1 [2]
Getting Ready:
Divide the participants into small groups of 4-6 youth.
Provide each group with the materials needed for both activities.
Opening Questions:
Ask the youth the questions below. Ask them to explain their thoughts. Ask them to record their thoughts and ideas on the butcher paper or flip chart.
What are some things you know about water?
Where, outside of our homes and schools, do we find water?
Why do you think water is important to humans? Why do you think it is important to plants and animals?
Materials Needed for each Group:
12-inch inflatable globe (Activity 1)
One five-gallon container (e.g., aquarium; bucket; bottle) (Activity 2)
Writing materials, preferably markers and flip chart paper (Activities 1 and 2)
Calculator (Activities 1 and 2)
Measuring cup (Activity 2)
One set of measuring spoons (1 TBSP; 1 TSP; ¾ TSP; ½ TSP; ¼ TSP)(Activity 2)
One mL syringe
Handout: Water Distribution on Earth
4-H SET: WATER QUALITY AWARENESS IN URBAN ENVIRONMENTS - LESSON 1 [3]
Experiencing (Procedure):
Have each group inflate their globe and stand in a circle. Playing “soft toss” catch, have them throw the globe to one another a total of 100 times. After each catch, they should look at where their left thumb is on the globe. Is it on water? Is it on land?
Ask the groups to assign a record-keeper to keep record of how many times they catch the globe “on water” and “on land” using the paper provided.
Ask each group to share their totals and record the numbers on the paper provided.
Ask the groups to total the numbers for all groups and determine the percentages of the globe covered by water and the percentage of the globe covered by land using the paper provided.
Sharing, Processing, and Generalizing:
Once the youth have completed their individual and combined calculations, discuss the questions below:
1. What are some of the things you learned about the make-up of earth? Please share your thoughts.
2. What does this new knowledge tell you or make you wonder about where plants and animals live? Please share your thoughts.
Concept and Term Introduction:
At this point, it is important to ensure that the concept of global water distribution has been introduced or discovered by the youth. (Note: The goal is to have the youth discover terms and concepts independently within each group.) If their calculations are accurate, the youth should have discovered that 70-75% of the earth’s surface is covered by water, and most of it is in the world’s oceans as salt water; the remaining water is fresh water.
Activity 1:
4-H SET: WATER QUALITY AWARENESS IN URBAN ENVIRONMENTS - LESSON 1 [4]
Experiencing (Procedure):
Based on what they learned in Activity 1, ask the youth to now predict how much water on the earth is salt water and how much is fresh water. Ask them to record their predictions on the paper provided and explain how they arrived at their figures.
Ask each group to fill their 5-gallon container (80 cups) with water. Tell them that this represents all of the water on the earth. Using their measuring spoons and/or plastic syringe, ask them to remove the following amounts and place that water into the measuring cup provided:
0.2 mL or .0008 cups = amount of freshwater in the atmosphere as water vapor.
0.9 mL or .004 cups = amount of fresh water in soil moisture.
1.7 mL or .0072 cups = amount of fresh water in the world’s rivers, streams, and lakes.
½ cup = amount of the world’s fresh water in groundwater.
1 ¾ cups = amount of the world’s freshwater in polar ice caps and glaciers.
Inform the youth that the water remaining in the 5-gallon container (1,245 TBSP) represents salt water, most of which is in the world’s oceans. This water is unavailable for use by plants and animals that live on land because of its salt content.
Ask the youth to calculate the percentages of freshwater in streams, water vapor, lakes, groundwater, polar ice caps/glaciers, and oceans.
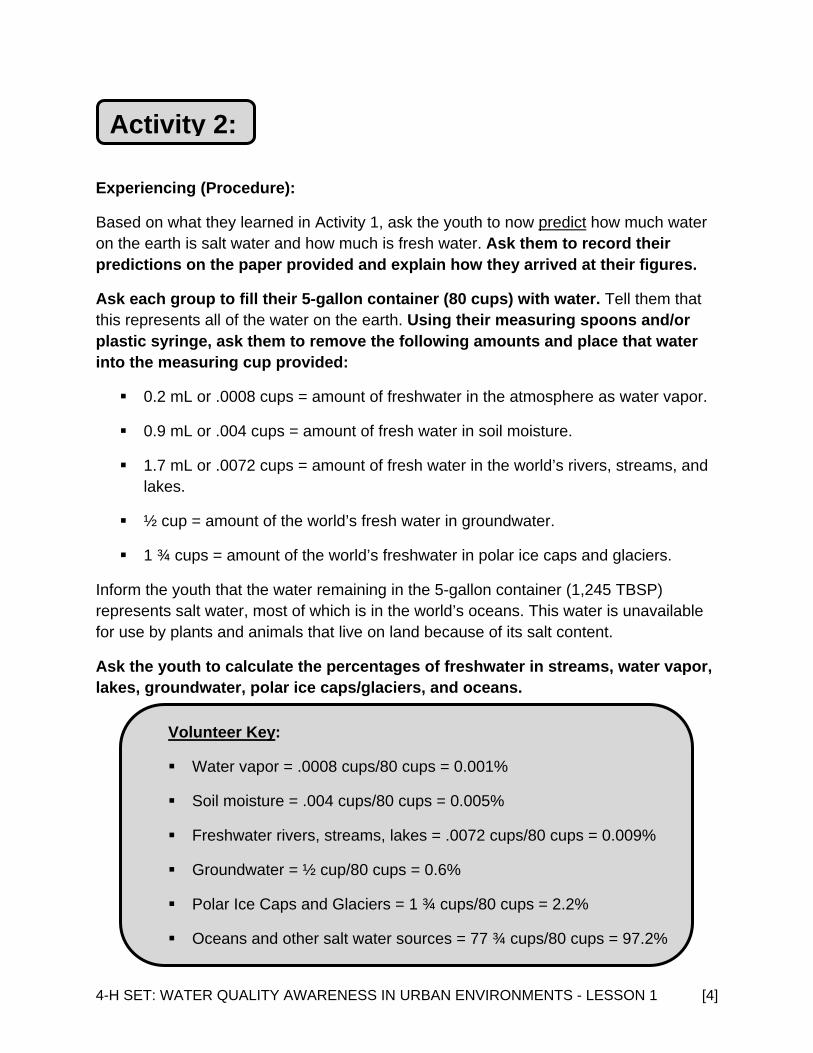
Volunteer Key:
Water vapor = .0008 cups/80 cups = 0.001%
Soil moisture = .004 cups/80 cups = 0.005%
Freshwater rivers, streams, lakes = .0072 cups/80 cups = 0.009%
Groundwater = ½ cup/80 cups = 0.6%
Polar Ice Caps and Glaciers = 1 ¾ cups/80 cups = 2.2%
Oceans and other salt water sources = 77 ¾ cups/80 cups = 97.2%
Activity 2:
4-H SET: WATER QUALITY AWARENESS IN URBAN ENVIRONMENTS - LESSON 1 [5]
Sharing, Processing, and Generalizing:
Once the youth have completed their calculations, discuss the questions below:
1. What are some of the things you learned about the distribution of water on the earth? Please share your thoughts.
2. What does this new knowledge tell you or make you wonder about water availability for plants and animals that live on land? What about water availability for humans? Please share your thoughts.
3. What does water conservation mean to you? Please explain. Based on what you know about the distribution of water on the earth, why do you think that water conservation might be important? Please explain.
Concept and Term Introduction: At this point, it is important to ensure that the concepts of global water distribution and water conservation have been introduced or discovered by the youth. Important terms to introduce include: salt water; freshwater; groundwater; lakes; streams; and water vapor. (Note: The goal is to have the youth discover terms and concepts independently within each group.) Additionally, provide each youth with a copy of the handout entitled Water Distribution on Earth. Concept Application: The Where in the World is Water? curriculum activities provide youth with a wide variety of opportunities to apply their new knowledge in authentic contexts. Some examples include:
Develop a list of ways to conserve water in the home environment. Present this list to your parents or care givers and try to estimate how many gallons of water you conserve in one week.
Develop a list of ways to conserve water at school. Make a presentation to your
class, your teachers, and/or your principal. Ask the school to adopt water conservation measures in order to help make the school more earth friendly.
Develop a plan to conserve water in your community. Make a presentation to
community leaders and propose your ideas. Write an article for a local paper that outlines your plan.
4-H SET: WATER QUALITY AWARENESS IN URBAN ENVIRONMENTS - LESSON 1 [6]
LESSON HANDOUT
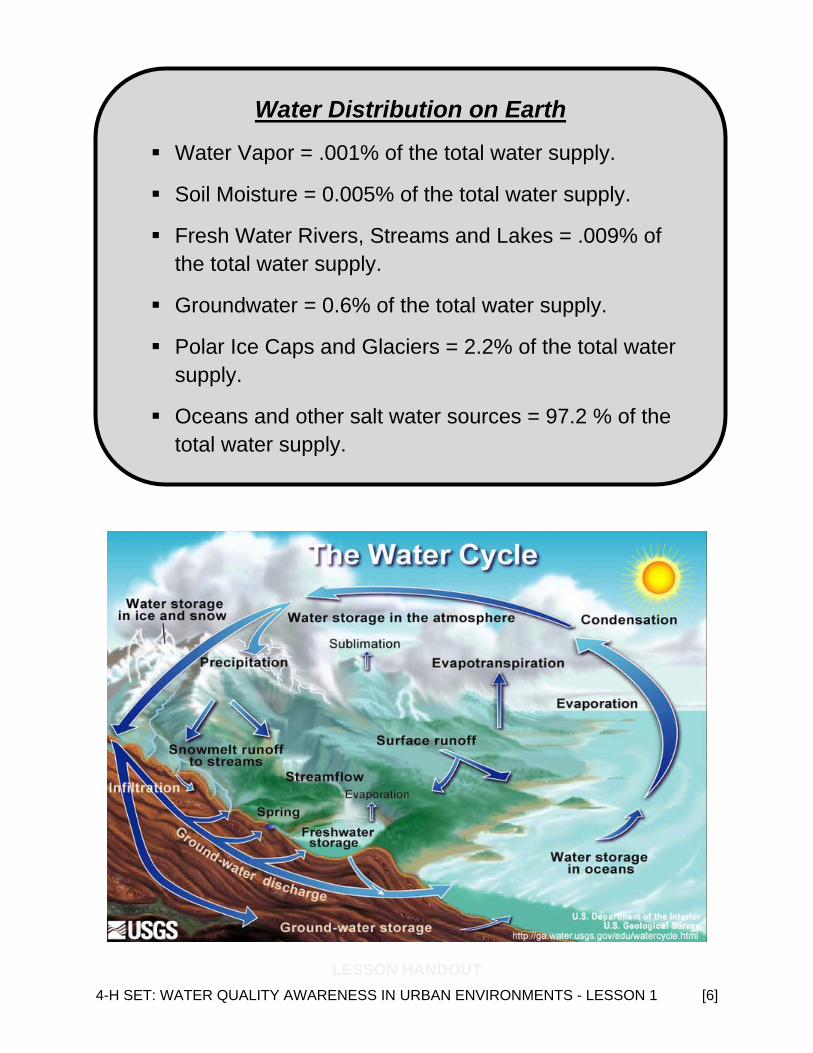
Water Distribution on Earth
Water Vapor = .001% of the total water supply.
Soil Moisture = 0.005% of the total water supply.
Fresh Water Rivers, Streams and Lakes = .009% of the total water supply.
Groundwater = 0.6% of the total water supply.
Polar Ice Caps and Glaciers = 2.2% of the total water supply.
Oceans and other salt water sources = 97.2 % of the total water supply.
4-H SET: WATER QUALITY AWARENESS IN URBAN ENVIRONMENTS - LESSON 1 [7]
Resources: Project WILD Aquatic. (1992). Aquatic education activity guide. Houston, Texas: Council for Environmental Education. Harter, T. (2008). Watersheds, Groundwater, and Drinking Water: A Practical Guide. University of California Agriculture and Natural Resources. Publication 3497. Wikipedia; http://commons.wikimedia.org/wiki/File:Water_cycle.png
The University of California prohibits discrimination or harassment of any person on the basis of race, color, national origin, religion, sex, gender identity, pregnancy (including childbirth, and medical conditions related to pregnancy or childbirth), physical or mental disability, medical condition (cancer‐related or genetic characteristics), ancestry, marital status, age, sexual orientation, citizenship, or service in the uniformed services (as defined by the Uniformed Services Employment and Reemployment Rights Act of 1994: service in the uniformed services includes membership, application for membership, performance of service, application for service, or obligation for service in the uniformed services) in any of its programs or activities.
University policy also prohibits reprisal or retaliation against any person in any of its programs or activities for making a complaint of discrimination or sexual harassment or for using or participating in the investigation or resolution process of any such complaint.
University policy is intended to be consistent with the provisions of applicable State and Federal laws.
Inquiries regarding the University’s nondiscrimination policies may be directed to the Affirmative Action/Equal Opportunity Director, University of California, Agriculture and Natural Resources, 1111 Franklin Street, 6th Floor, Oakland, CA 94607, (510) 987‐0096.
WATER QUALITY AWARENESS IN URBAN ENVIRONMENTS
LESSON 2 HOW DOES YOUR FOOTPRINT AFFECT
THE WATER QUALITY OF LOCAL RIVERS, LAKES AND THE OCEAN?
4‐H SET: WATER QUALITY AWARENESS IN URBAN ENVIRONMENTS – LESSON 2 [1]
Subject Overview: Water quality is impacted by direct and indirect human action. How does your daily routine affect the health of local rivers, lakes, and the ocean? Water contaminants come in many different forms from various sources. Chemicals (chlorine, pesticides, fertilizers), automotive fluids, restaurant fats, and packing products are just a few items that we come in contact with on a daily basis which have the potential to become a hazardous water contaminant. Water pollution occurs when contaminants reach levels that impair the health of an ecosystem. Activity Concepts: Affects of water contaminants.
Subject Links: Science: water contaminants.
Vocabulary: contaminant; pollution; dissolved oxygen; nitrogen (ammonia, nitrate, and nitrite); pesticides, pH; phosphorus; salinity; turbidity. (See supplemental material.)
Purpose of activities: Youth will have the opportunity to explore how water is affected through daily activities.
Overview of activities: Youth will explore how their actions affect the health of local waters through hands-on activities.
Time Required: Approximately 1 hour.
LESSON 2: How Does Your Footprint Affect the Water Quality of Local Rivers, Lakes and the Ocean?
4‐H SET: WATER QUALITY AWARENESS IN URBAN ENVIRONMENTS – LESSON 2 [2]
Getting Ready:
Pour enough water into aquariums so they are approximately ¾ full. Divide the youth participants into three small groups.
Group One – Local government (Scenario #1) Group Two – Homeowners (Scenario #2) Group Three – Business Owners (Scenario #3)
Pass out a “scenario and solution worksheet” to each group. Provide each group with flip chart paper and markers.
Opening Questions: Ask the youth to discuss these questions in their groups, record their thoughts on the flip chart paper provided, and share their ideas with the other groups.
What are some things you know about water pollution? Where do you think water pollution comes from?
Materials Needed:
Handout – Scenario #1, Scenario #2, Scenario #3 (2) Aquariums or other large containers to hold water Water (enough to fill each aquarium ¾ full) Trash bag for cleanup Measuring cups (1/4, 1/2, 3/4 cups) Representative Materials as suggested in the
Contaminant Key on page 4
4‐H SET: WATER QUALITY AWARENESS IN URBAN ENVIRONMENTS – LESSON 2 [3]
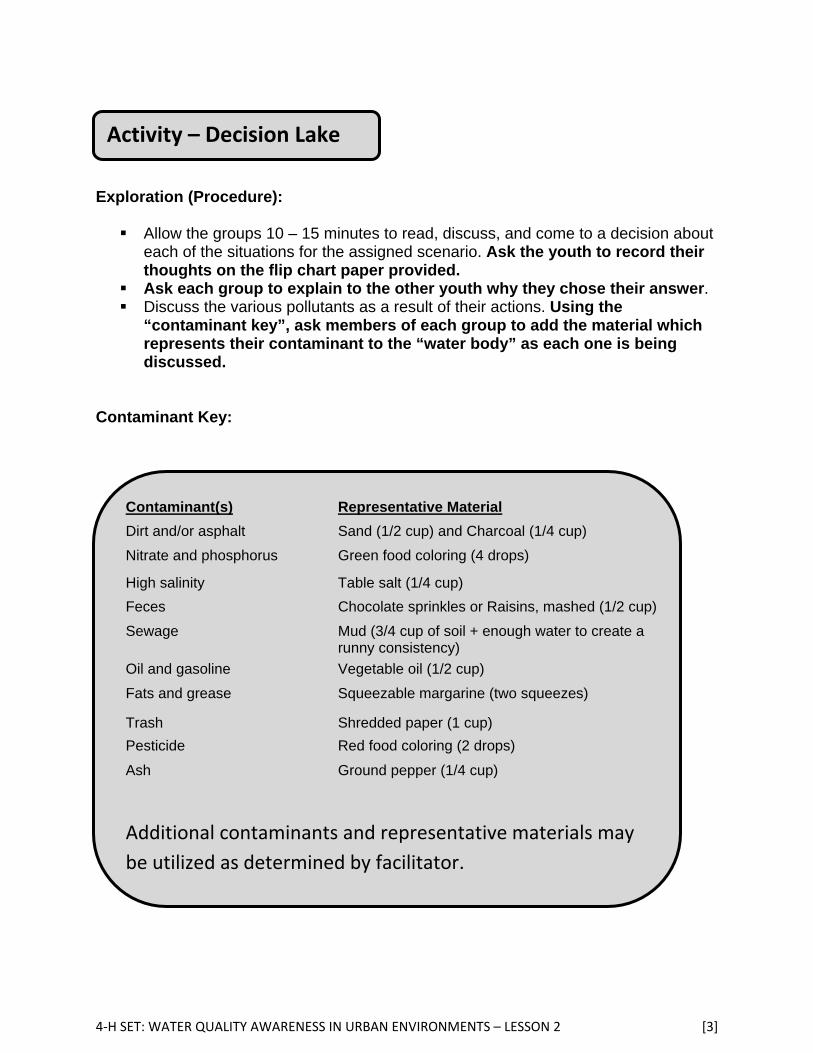
Exploration (Procedure):
Allow the groups 10 – 15 minutes to read, discuss, and come to a decision about each of the situations for the assigned scenario. Ask the youth to record their thoughts on the flip chart paper provided.
Ask each group to explain to the other youth why they chose their answer. Discuss the various pollutants as a result of their actions. Using the
“contaminant key”, ask members of each group to add the material which represents their contaminant to the “water body” as each one is being discussed.
Contaminant Key:
Contaminant(s) Representative Material Dirt and/or asphalt Sand (1/2 cup) and Charcoal (1/4 cup)
Nitrate and phosphorus Green food coloring (4 drops)
High salinity Table salt (1/4 cup) Feces Chocolate sprinkles or Raisins, mashed (1/2 cup)
Sewage Mud (3/4 cup of soil + enough water to create a runny consistency)
Oil and gasoline Vegetable oil (1/2 cup)
Fats and grease Squeezable margarine (two squeezes)
Trash Shredded paper (1 cup) Pesticide Red food coloring (2 drops)
Ash Ground pepper (1/4 cup)
Additional contaminants and representative materials may be utilized as determined by facilitator.
Activity – Decision Lake
4‐H SET: WATER QUALITY AWARENESS IN URBAN ENVIRONMENTS – LESSON 2 [4]
Sharing, Processing, and Generalizing: Once the youth have completed their worksheet, discuss the questions below as a large group:
What were the consequences of their actions? What do they think the long-term effects of these contaminants would be? How do the students think they can personally make a difference?
Concept and Term Introduction: At this point, it is important to ensure the concept of water contaminants resulting from everyday actions have the potential to pollute local water bodies, aquatic life, and human life has been introduced or discovered by the youth. The following terms should also be introduced: nitrogen (ammonia, nitrate, nitrite); contaminant; pollution; dissolved oxygen; pH; phosphorus; pesticides; salinity; turbidity. (Note: The goal is to have the youth discover terms and concepts themselves.) Discuss the following question with the youth:
When do you think a water contaminant results in pollution?
Concept Application:
Develop a list of ways to improve the quality of runoff around your home or neighborhood. Present this list to your parents or care givers
Develop a list of ways to improve the quality of runoff at school. Make a presentation to your class, your teachers and/or your principal. Ask the school to adopt clean up measures in order to help make the school more water friendly.
Develop a plan to improve the quality of runoff in your community. Make a presentation to community leaders and propose your ideas. Write an article for a local paper that outlines your plan.
4‐H SET: WATER QUALITY AWARENESS IN URBAN ENVIRONMENTS – LESSON 2 [5]
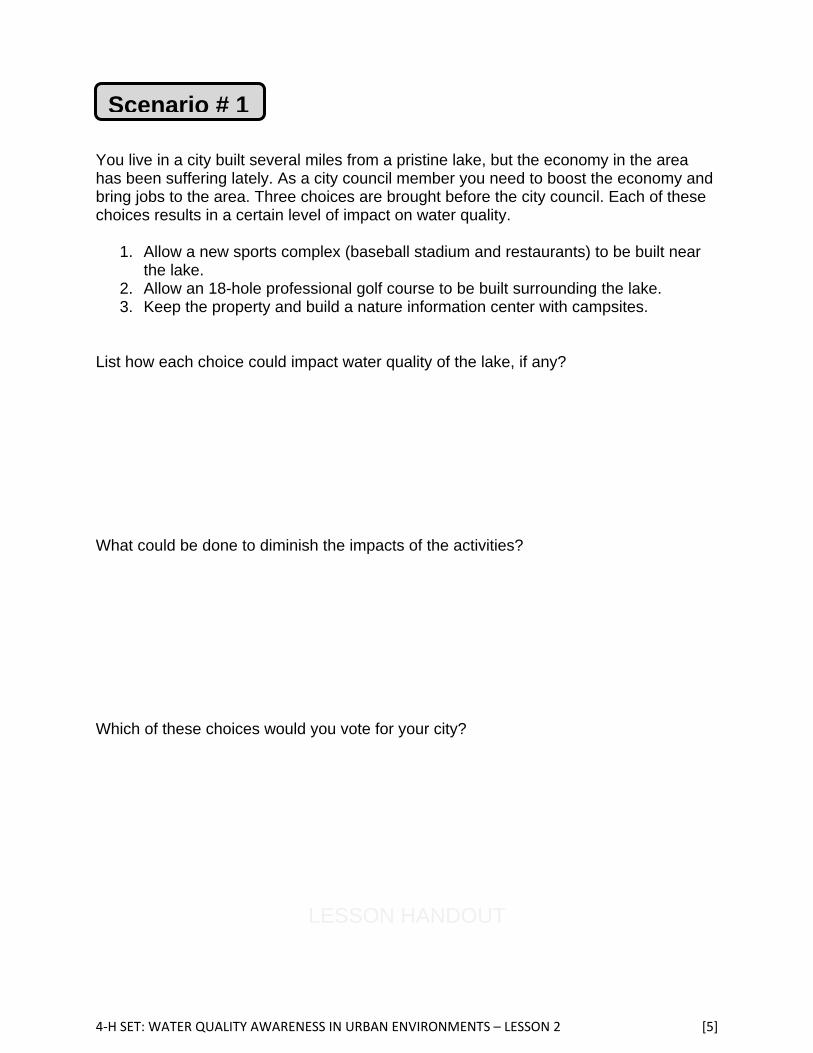
You live in a city built several miles from a pristine lake, but the economy in the area has been suffering lately. As a city council member you need to boost the economy and bring jobs to the area. Three choices are brought before the city council. Each of these choices results in a certain level of impact on water quality.
1. Allow a new sports complex (baseball stadium and restaurants) to be built near the lake.
2. Allow an 18-hole professional golf course to be built surrounding the lake. 3. Keep the property and build a nature information center with campsites.
List how each choice could impact water quality of the lake, if any? What could be done to diminish the impacts of the activities? Which of these choices would you vote for your city?
LESSON HANDOUT
Scenario # 1
4‐H SET: WATER QUALITY AWARENESS IN URBAN ENVIRONMENTS – LESSON 2 [6]
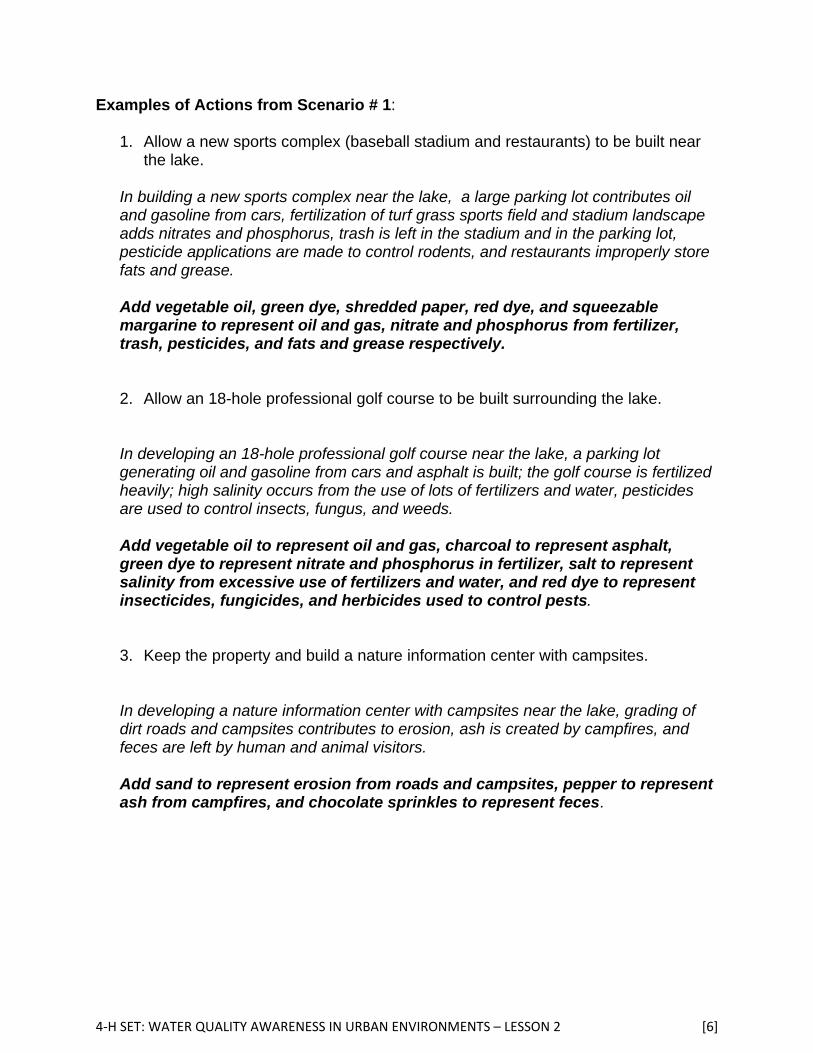
Examples of Actions from Scenario # 1:
1. Allow a new sports complex (baseball stadium and restaurants) to be built near the lake.
In building a new sports complex near the lake, a large parking lot contributes oil and gasoline from cars, fertilization of turf grass sports field and stadium landscape adds nitrates and phosphorus, trash is left in the stadium and in the parking lot, pesticide applications are made to control rodents, and restaurants improperly store fats and grease. Add vegetable oil, green dye, shredded paper, red dye, and squeezable margarine to represent oil and gas, nitrate and phosphorus from fertilizer, trash, pesticides, and fats and grease respectively.
2. Allow an 18-hole professional golf course to be built surrounding the lake.
In developing an 18-hole professional golf course near the lake, a parking lot generating oil and gasoline from cars and asphalt is built; the golf course is fertilized heavily; high salinity occurs from the use of lots of fertilizers and water, pesticides are used to control insects, fungus, and weeds. Add vegetable oil to represent oil and gas, charcoal to represent asphalt, green dye to represent nitrate and phosphorus in fertilizer, salt to represent salinity from excessive use of fertilizers and water, and red dye to represent insecticides, fungicides, and herbicides used to control pests.
3. Keep the property and build a nature information center with campsites.
In developing a nature information center with campsites near the lake, grading of dirt roads and campsites contributes to erosion, ash is created by campfires, and feces are left by human and animal visitors. Add sand to represent erosion from roads and campsites, pepper to represent ash from campfires, and chocolate sprinkles to represent feces.
4‐H SET: WATER QUALITY AWARENESS IN URBAN ENVIRONMENTS – LESSON 2 [7]
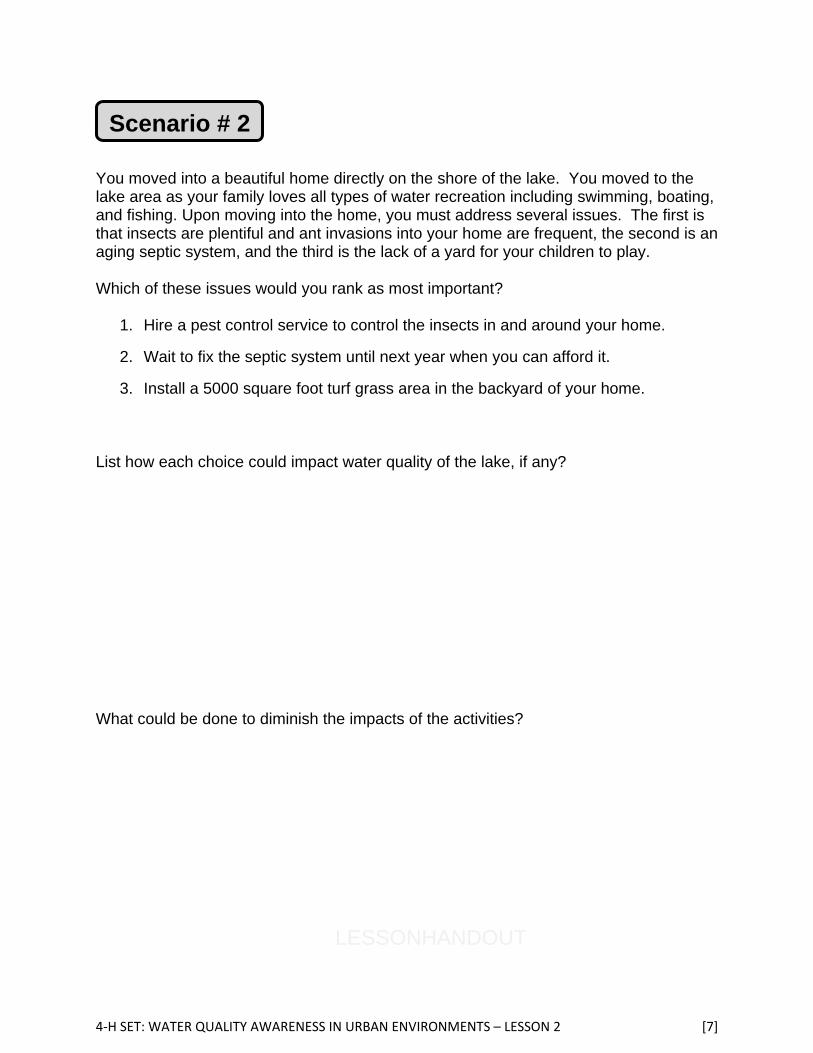
You moved into a beautiful home directly on the shore of the lake. You moved to the lake area as your family loves all types of water recreation including swimming, boating, and fishing. Upon moving into the home, you must address several issues. The first is that insects are plentiful and ant invasions into your home are frequent, the second is an aging septic system, and the third is the lack of a yard for your children to play. Which of these issues would you rank as most important?
1. Hire a pest control service to control the insects in and around your home.
2. Wait to fix the septic system until next year when you can afford it.
3. Install a 5000 square foot turf grass area in the backyard of your home. List how each choice could impact water quality of the lake, if any? What could be done to diminish the impacts of the activities?
LESSONHANDOUT
Scenario # 2
4‐H SET: WATER QUALITY AWARENESS IN URBAN ENVIRONMENTS – LESSON 2 [8]
Examples of Actions from Scenario # 2:
1. Hire a pest control service to control the insects in and around your home.
Hiring a pest control service to control the insects in and around your home near the lake results in runoff of chemicals. This results in pesticides applied to the inside and outside of the house on a monthly basis running into the lake as a result of irrigation and storm runoff. Add 2 drops of red dye for each month of the year (24 drops) to represent the pesticides added to the landscape.
2. Wait to fix the septic system until next year when you can afford it.
By waiting to fix the septic system until next year when you can afford it, raw sewage seeps into the soil and groundwater. This results in sewage leaking into the surrounding soil and groundwater over the course of the year. Add ¼ of mud for each month of the year (3 cups) to represent the amount of sewage leaking into lake.
3. Install a 5000 square foot turf grass area in the backyard of your home.
By installing a 5000 square foot turf grass area in the backyard of your home, the homeowner increases the amount of fertilizer and pesticide applied next to the lake. Without proper irrigation these chemicals can easily move from where they are applied into the lake in irrigation and storm water runoff. This results in nutrients (nitrate and phosphorus) entering the lake as well as any pesticides the homeowner uses to control insects and weeds in the lawn. Add green food dye to represent nitrate and phosphorus from fertilizer and red dye to represent pesticides.
4‐H SET: WATER QUALITY AWARENESS IN URBAN ENVIRONMENTS – LESSON 2 [9]
You own Rob’s Water Recreation rental facility and business has been slow. You rent boats, jet skis, and other watercraft to locals and tourists. Besides business being slow, most of your rentals are old, leak oil, and are in need of major repairs or replacement. What choice would you make if you were in this situation?
1. Lay off your mechanic and postpone repairs and purchasing of new equipment.
2. Sell your property to a developer that builds an amusement park complete with water slides, go-carts, and fast food restaurants.
3. Sell the property to the city where they decide to return the area into a natural shoreline complete with nature trail.
List how each choice could impact water quality of the lake, if any? What could be done to diminish the impacts of the activities? .
LESSON HANDOUT
Scenario # 3
4‐H SET: WATER QUALITY AWARENESS IN URBAN ENVIRONMENTS – LESSON 2 [10]
Examples of Actions from Scenario # 3:
1. Lay off your mechanic and postpone repairs and purchasing of new equipment.
By laying off your mechanic and postponing repairs and purchasing of new equipment, leaking of oil and gasoline into the lake will continue and even increase if repairs are postponed or not done properly. Add vegetable oil to represent the oil and gas continually leaking into the lake. Because the contaminants are a chronic problem add twice the amount listed on the key.
2. Sell your property to a developer that builds an amusement park complete with
water slides, go-carts, and fast food restaurants.
By selling your property to a developer that builds an amusement park complete with water slides, go-carts, and fast food restaurants, a large parking lot will need to be built. The parking lot will generate trash left by visitors, oil and gasoline from leaking cars, and asphalt from erosion. The landscape will require fertilizer and irrigation will carry nitrate and phosphorus into the storm drains and into the lake. Pesticides will need to be used to control rodents. Restaurants wash fats and grease down the drain or store them improperly outside resulting in a sewage blockage and spill outside the restaurants. Add shredded paper to represent trash, vegetable oil to represent oil and gas, charcoal to represent asphalt, green dye to represent fertilizer (nitrate and phosphorus), red dye to represent pesticides, squeezable margarine to represent fats and grease, and mud to represent sewage.
3. Sell the property to the city where they decide to return the area into a natural
shoreline complete with nature trail.
By selling the property to the city where they decide to return the area into a natural shoreline complete with nature trail, erosion results from the construction of dirt access roads and trails. Erosion results in a slight increase in soil entering the lake. Add sand to represent erosion from access road and hiking trails.
4‐H SET: WATER QUALITY AWARENESS IN URBAN ENVIRONMENTS – LESSON 2 [11]
REFERENCES AND RESOURCES: ANR Publication 8118 Self Evaluation Techniques: Evaluating Water Quality; http://ucanr.org/freepubs/docs/8118.pdf
Potential Pollutants Generated by Land Use Type; California Stormwater Quality Association (CASQA) U.S. Department of the Interior | U.S. Geological Survey URL: http://ga.water.usgs.gov/edu/earthgwquality.html
What is a Pesticide?;U.S. EPA; http://www.epa.gov/pesticides/about/index.htm
The University of California prohibits discrimination or harassment of any person on the basis of race, color, national origin, religion, sex, gender identity, pregnancy (including childbirth, and medical conditions related to pregnancy or childbirth), physical or mental disability, medical condition (cancer‐related or genetic characteristics), ancestry, marital status, age, sexual orientation, citizenship, or service in the uniformed services (as defined by the Uniformed Services Employment and Reemployment Rights Act of 1994: service in the uniformed services includes membership, application for membership, performance of service, application for service, or obligation for service in the uniformed services) in any of its programs or activities.
University policy also prohibits reprisal or retaliation against any person in any of its programs or activities for making a complaint of discrimination or sexual harassment or for using or participating in the investigation or resolution process of any such complaint.
University policy is intended to be consistent with the provisions of applicable State and Federal laws.
Inquiries regarding the University’s nondiscrimination policies may be directed to the Affirmative Action/Equal Opportunity Director, University of California, Agriculture and Natural Resources, 1111 Franklin Street, 6th Floor, Oakland, CA 94607, (510) 987‐0096.
4-H SET: WATER QUALITY AWARENESS IN URBAN ENVIRONMENTS – LESSON 2: Vocabulary Supplement [1]
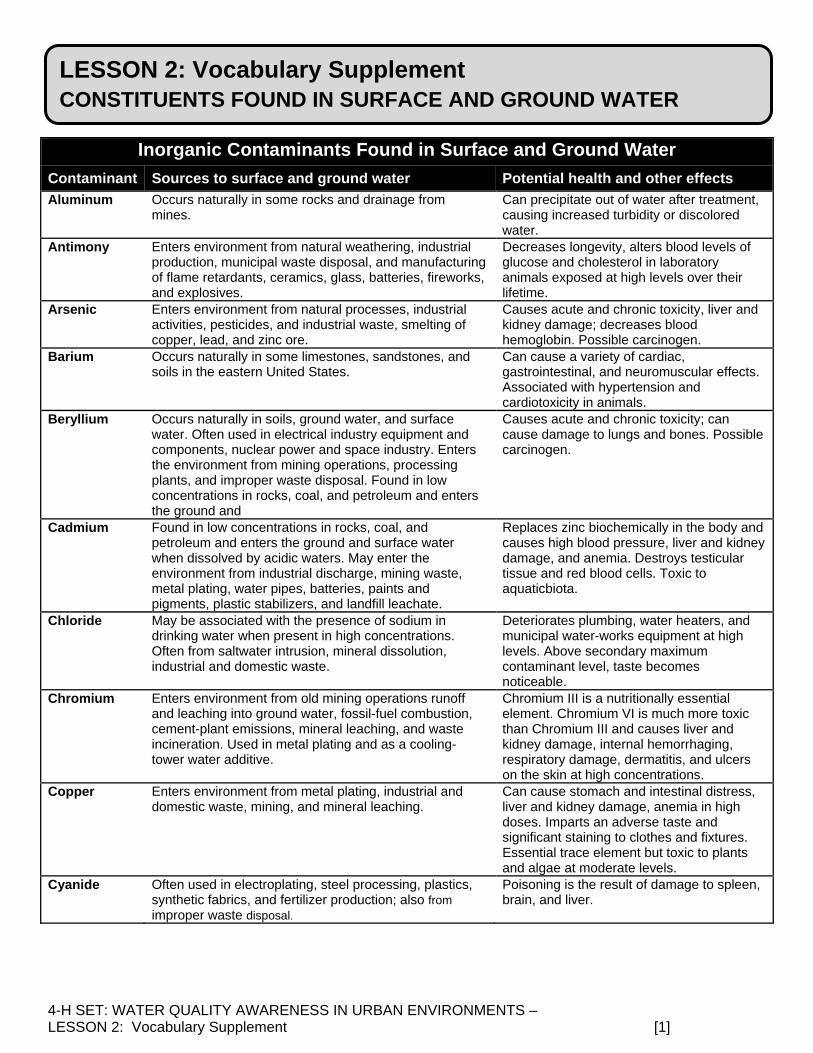
Inorganic Contaminants Found in Surface and Ground Water Contaminant Sources to surface and ground water Potential health and other effects Aluminum Occurs naturally in some rocks and drainage from
mines. Can precipitate out of water after treatment, causing increased turbidity or discolored water.
Antimony Enters environment from natural weathering, industrial production, municipal waste disposal, and manufacturing of flame retardants, ceramics, glass, batteries, fireworks, and explosives.
Decreases longevity, alters blood levels of glucose and cholesterol in laboratory animals exposed at high levels over their lifetime.
Arsenic Enters environment from natural processes, industrial activities, pesticides, and industrial waste, smelting of copper, lead, and zinc ore.
Causes acute and chronic toxicity, liver and kidney damage; decreases blood hemoglobin. Possible carcinogen.
Barium Occurs naturally in some limestones, sandstones, and soils in the eastern United States.
Can cause a variety of cardiac, gastrointestinal, and neuromuscular effects. Associated with hypertension and cardiotoxicity in animals.
Beryllium Occurs naturally in soils, ground water, and surface water. Often used in electrical industry equipment and components, nuclear power and space industry. Enters the environment from mining operations, processing plants, and improper waste disposal. Found in low concentrations in rocks, coal, and petroleum and enters the ground and
Causes acute and chronic toxicity; can cause damage to lungs and bones. Possible carcinogen.
Cadmium Found in low concentrations in rocks, coal, and petroleum and enters the ground and surface water when dissolved by acidic waters. May enter the environment from industrial discharge, mining waste, metal plating, water pipes, batteries, paints and pigments, plastic stabilizers, and landfill leachate.
Replaces zinc biochemically in the body and causes high blood pressure, liver and kidneydamage, and anemia. Destroys testicular tissue and red blood cells. Toxic to aquaticbiota.
Chloride May be associated with the presence of sodium in drinking water when present in high concentrations. Often from saltwater intrusion, mineral dissolution, industrial and domestic waste.
Deteriorates plumbing, water heaters, and municipal water-works equipment at high levels. Above secondary maximum contaminant level, taste becomes noticeable.
Chromium Enters environment from old mining operations runoff and leaching into ground water, fossil-fuel combustion, cement-plant emissions, mineral leaching, and waste incineration. Used in metal plating and as a cooling-tower water additive.
Chromium III is a nutritionally essential element. Chromium VI is much more toxic than Chromium III and causes liver and kidney damage, internal hemorrhaging, respiratory damage, dermatitis, and ulcers on the skin at high concentrations.
Copper Enters environment from metal plating, industrial and domestic waste, mining, and mineral leaching.
Can cause stomach and intestinal distress, liver and kidney damage, anemia in high doses. Imparts an adverse taste and significant staining to clothes and fixtures. Essential trace element but toxic to plants and algae at moderate levels.
Cyanide Often used in electroplating, steel processing, plastics, synthetic fabrics, and fertilizer production; also from improper waste disposal.
Poisoning is the result of damage to spleen, brain, and liver.
LESSON 2: Vocabulary SupplementCONSTITUENTS FOUND IN SURFACE AND GROUND WATER
4-H SET: WATER QUALITY AWARENESS IN URBAN ENVIRONMENTS – LESSON 2: Vocabulary Supplement [2]
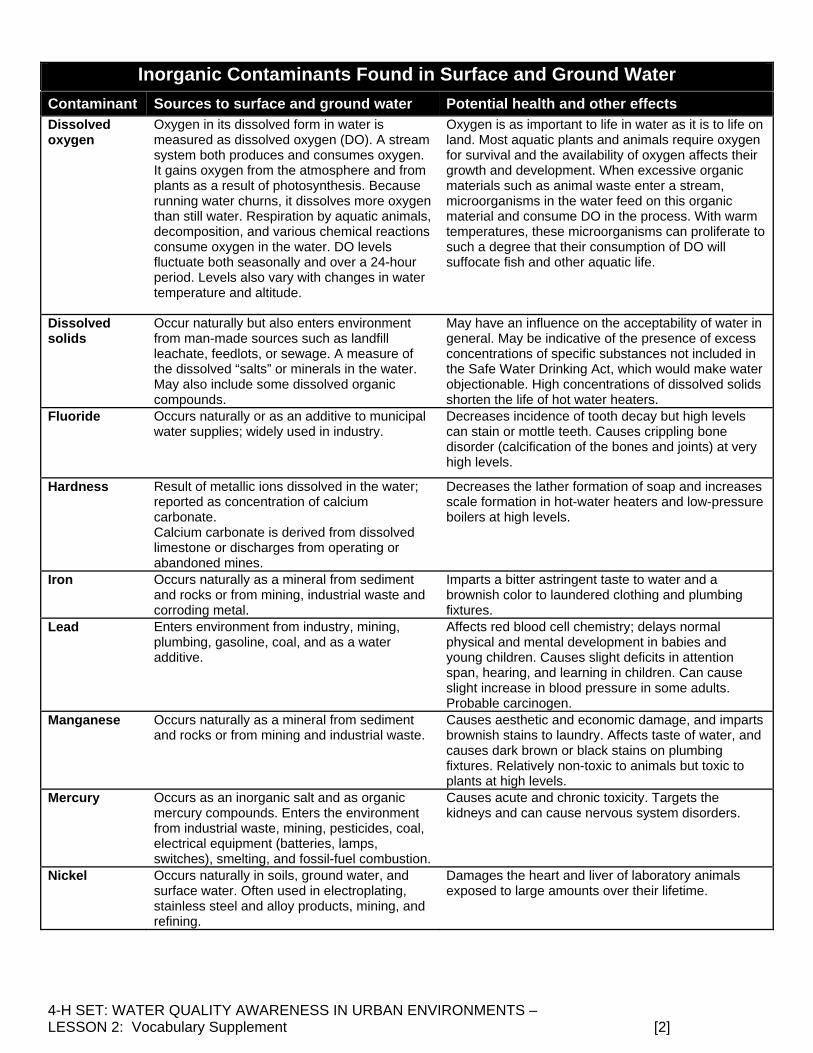
Inorganic Contaminants Found in Surface and Ground Water
Contaminant Sources to surface and ground water Potential health and other effects Dissolved oxygen
Oxygen in its dissolved form in water is measured as dissolved oxygen (DO). A stream system both produces and consumes oxygen. It gains oxygen from the atmosphere and from plants as a result of photosynthesis. Because running water churns, it dissolves more oxygen than still water. Respiration by aquatic animals, decomposition, and various chemical reactions consume oxygen in the water. DO levels fluctuate both seasonally and over a 24-hour period. Levels also vary with changes in water temperature and altitude.
Oxygen is as important to life in water as it is to life on land. Most aquatic plants and animals require oxygen for survival and the availability of oxygen affects their growth and development. When excessive organic materials such as animal waste enter a stream, microorganisms in the water feed on this organic material and consume DO in the process. With warm temperatures, these microorganisms can proliferate to such a degree that their consumption of DO will suffocate fish and other aquatic life.
Dissolved solids
Occur naturally but also enters environment from man-made sources such as landfill leachate, feedlots, or sewage. A measure of the dissolved “salts” or minerals in the water. May also include some dissolved organic compounds.
May have an influence on the acceptability of water in general. May be indicative of the presence of excess concentrations of specific substances not included in the Safe Water Drinking Act, which would make water objectionable. High concentrations of dissolved solids shorten the life of hot water heaters.
Fluoride Occurs naturally or as an additive to municipal water supplies; widely used in industry.
Decreases incidence of tooth decay but high levels can stain or mottle teeth. Causes crippling bone disorder (calcification of the bones and joints) at very high levels.
Hardness Result of metallic ions dissolved in the water; reported as concentration of calcium carbonate. Calcium carbonate is derived from dissolved limestone or discharges from operating or abandoned mines.
Decreases the lather formation of soap and increases scale formation in hot-water heaters and low-pressure boilers at high levels.
Iron Occurs naturally as a mineral from sediment and rocks or from mining, industrial waste and corroding metal.
Imparts a bitter astringent taste to water and a brownish color to laundered clothing and plumbing fixtures.
Lead Enters environment from industry, mining, plumbing, gasoline, coal, and as a water additive.
Affects red blood cell chemistry; delays normal physical and mental development in babies and young children. Causes slight deficits in attention span, hearing, and learning in children. Can cause slight increase in blood pressure in some adults. Probable carcinogen.
Manganese Occurs naturally as a mineral from sediment and rocks or from mining and industrial waste.
Causes aesthetic and economic damage, and imparts brownish stains to laundry. Affects taste of water, and causes dark brown or black stains on plumbing fixtures. Relatively non-toxic to animals but toxic to plants at high levels.
Mercury Occurs as an inorganic salt and as organic mercury compounds. Enters the environment from industrial waste, mining, pesticides, coal, electrical equipment (batteries, lamps, switches), smelting, and fossil-fuel combustion.
Causes acute and chronic toxicity. Targets the kidneys and can cause nervous system disorders.
Nickel Occurs naturally in soils, ground water, and surface water. Often used in electroplating, stainless steel and alloy products, mining, and refining.
Damages the heart and liver of laboratory animals exposed to large amounts over their lifetime.
4-H SET: WATER QUALITY AWARENESS IN URBAN ENVIRONMENTS – LESSON 2: Vocabulary Supplement [3]
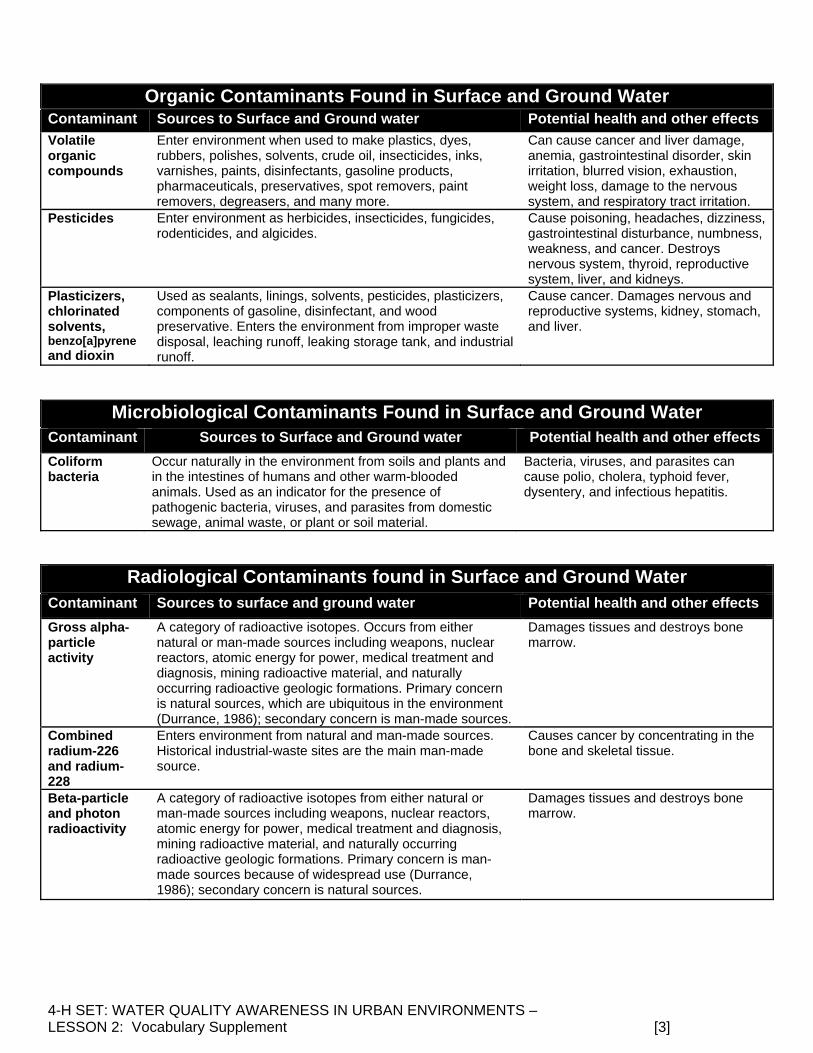
Microbiological Contaminants Found in Surface and Ground Water
Contaminant Sources to Surface and Ground water Potential health and other effects Coliform bacteria
Occur naturally in the environment from soils and plants and in the intestines of humans and other warm-blooded animals. Used as an indicator for the presence of pathogenic bacteria, viruses, and parasites from domestic sewage, animal waste, or plant or soil material.
Bacteria, viruses, and parasites can cause polio, cholera, typhoid fever, dysentery, and infectious hepatitis.
Organic Contaminants Found in Surface and Ground Water Contaminant Sources to Surface and Ground water Potential health and other effects Volatile organic compounds
Enter environment when used to make plastics, dyes, rubbers, polishes, solvents, crude oil, insecticides, inks, varnishes, paints, disinfectants, gasoline products, pharmaceuticals, preservatives, spot removers, paint removers, degreasers, and many more.
Can cause cancer and liver damage, anemia, gastrointestinal disorder, skin irritation, blurred vision, exhaustion, weight loss, damage to the nervous system, and respiratory tract irritation.
Pesticides Enter environment as herbicides, insecticides, fungicides, rodenticides, and algicides.
Cause poisoning, headaches, dizziness, gastrointestinal disturbance, numbness, weakness, and cancer. Destroys nervous system, thyroid, reproductive system, liver, and kidneys.
Plasticizers, chlorinated solvents, benzo[a]pyrene and dioxin
Used as sealants, linings, solvents, pesticides, plasticizers, components of gasoline, disinfectant, and wood preservative. Enters the environment from improper waste disposal, leaching runoff, leaking storage tank, and industrial runoff.
Cause cancer. Damages nervous and reproductive systems, kidney, stomach, and liver.
Radiological Contaminants found in Surface and Ground Water
Contaminant Sources to surface and ground water Potential health and other effects Gross alpha-particle activity
A category of radioactive isotopes. Occurs from either natural or man-made sources including weapons, nuclear reactors, atomic energy for power, medical treatment and diagnosis, mining radioactive material, and naturally occurring radioactive geologic formations. Primary concern is natural sources, which are ubiquitous in the environment (Durrance, 1986); secondary concern is man-made sources.
Damages tissues and destroys bone marrow.
Combined radium-226 and radium-228
Enters environment from natural and man-made sources. Historical industrial-waste sites are the main man-made source.
Causes cancer by concentrating in the bone and skeletal tissue.
Beta-particle and photon radioactivity
A category of radioactive isotopes from either natural or man-made sources including weapons, nuclear reactors, atomic energy for power, medical treatment and diagnosis, mining radioactive material, and naturally occurring radioactive geologic formations. Primary concern is man-made sources because of widespread use (Durrance, 1986); secondary concern is natural sources.
Damages tissues and destroys bone marrow.
4-H SET: WATER QUALITY AWARENESS IN URBAN ENVIRONMENTS – LESSON 2: Vocabulary Supplement [4]
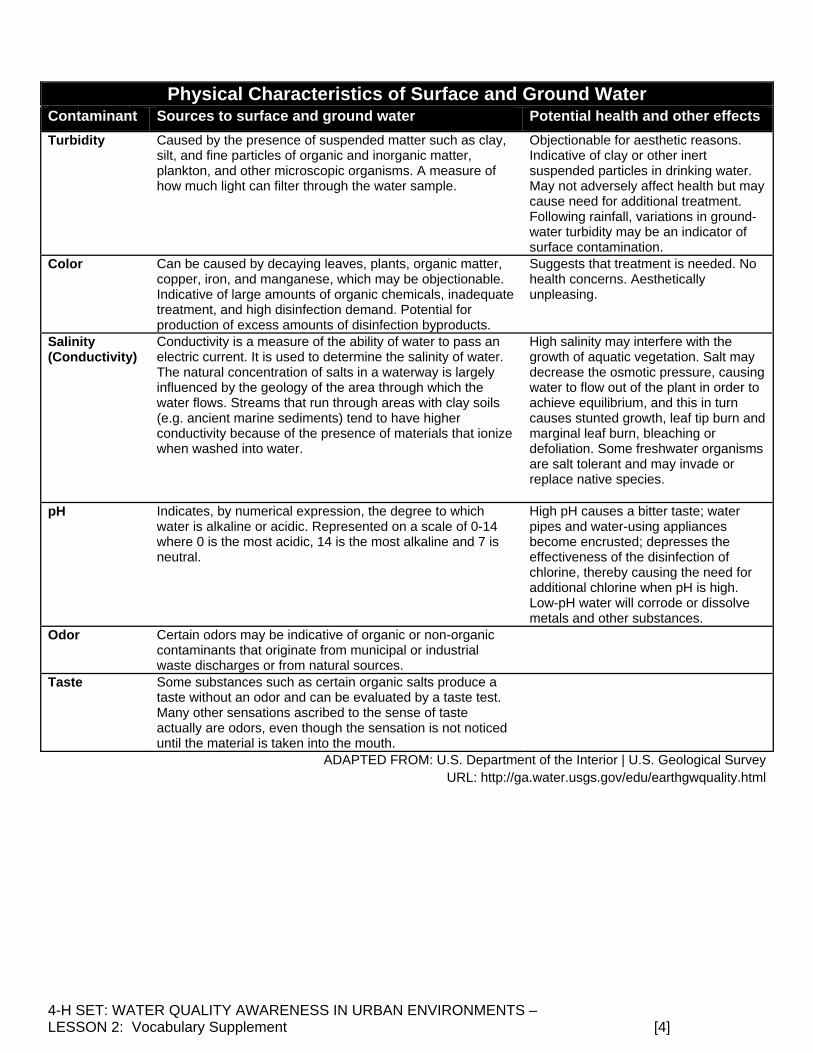
Physical Characteristics of Surface and Ground Water Contaminant Sources to surface and ground water Potential health and other effects Turbidity Caused by the presence of suspended matter such as clay,
silt, and fine particles of organic and inorganic matter, plankton, and other microscopic organisms. A measure of how much light can filter through the water sample.
Objectionable for aesthetic reasons. Indicative of clay or other inert suspended particles in drinking water. May not adversely affect health but may cause need for additional treatment. Following rainfall, variations in ground-water turbidity may be an indicator of surface contamination.
Color Can be caused by decaying leaves, plants, organic matter, copper, iron, and manganese, which may be objectionable. Indicative of large amounts of organic chemicals, inadequate treatment, and high disinfection demand. Potential for production of excess amounts of disinfection byproducts.
Suggests that treatment is needed. No health concerns. Aesthetically unpleasing.
Salinity (Conductivity)
Conductivity is a measure of the ability of water to pass an electric current. It is used to determine the salinity of water. The natural concentration of salts in a waterway is largely influenced by the geology of the area through which the water flows. Streams that run through areas with clay soils (e.g. ancient marine sediments) tend to have higher conductivity because of the presence of materials that ionize when washed into water.
High salinity may interfere with the growth of aquatic vegetation. Salt may decrease the osmotic pressure, causing water to flow out of the plant in order to achieve equilibrium, and this in turn causes stunted growth, leaf tip burn and marginal leaf burn, bleaching or defoliation. Some freshwater organisms are salt tolerant and may invade or replace native species.
pH Indicates, by numerical expression, the degree to which water is alkaline or acidic. Represented on a scale of 0-14 where 0 is the most acidic, 14 is the most alkaline and 7 is neutral.
High pH causes a bitter taste; water pipes and water-using appliances become encrusted; depresses the effectiveness of the disinfection of chlorine, thereby causing the need for additional chlorine when pH is high. Low-pH water will corrode or dissolve metals and other substances.
Odor Certain odors may be indicative of organic or non-organic contaminants that originate from municipal or industrial waste discharges or from natural sources.
Taste Some substances such as certain organic salts produce a taste without an odor and can be evaluated by a taste test. Many other sensations ascribed to the sense of taste actually are odors, even though the sensation is not noticed until the material is taken into the mouth.
ADAPTED FROM: U.S. Department of the Interior | U.S. Geological Survey URL: http://ga.water.usgs.gov/edu/earthgwquality.html
WATER QUALITY AWARENESS IN URBAN ENVIRONMENTS
LESSON 3 WATER WEB OF LIFE
4-H SET: WATER QUALITY AWARENESS IN URBAN ENVIRONMENTS - LESSON 3 [1]
Subject Overview: John Muir once wrote that, “If you tug at a single part of nature, you’ll find it’s connected to the rest of the world.” This concept is easily understood when looking at food webs where resources are shared and a “web of life” is formed. Animals occupy different levels of food webs, with herbivores at the bottom and carnivores at the top. All organisms in nature need food energy to survive. Plants are producer organisms; they make their own food through a process called photosynthesis that uses energy from the sun. Animals are consumers; they cannot produce their own food, and therefore must acquire it from some outside source. Some animals eat only plants for food (herbivores); some animals eat only animals (carnivores); and other animals eat both plants and animals (omnivores). Typically, animals do not have a single food source; resources are shared among consumers. In nature, producers and consumers are intertwined in webs of life where different organisms feed upon others to meet their energy needs and different parts of an ecosystem depend on each other. Activity Concepts: Food webs; webs of life; interdependency. Subject Links: Science; Art. Vocabulary: Food web; producers; consumers; herbivore; omnivore; carnivore; interdependency. Purpose of activities: Youth will have the opportunity to explore how food resources are shared in a food web/web of life. Overview of activities: Youth will explore food webs/webs of life through a hands-on activity. Time Required: 40-60 minutes
LESSON 1: Water Web of Life
4-H SET: WATER QUALITY AWARENESS IN URBAN ENVIRONMENTS - LESSON 3 [2]
Getting Ready:
Make certain the yarn is rolled into balls.
Print the Water Web of Life clues and images (see Appendix A and B).
Divide the youth into pairs/small groups (depending on the number of youth, they may work as individuals or pairs within the main group).
Provide each individual/pair with one “water web of life image.” Make certain that all 35 images are handed out randomly to the youth. If you have less than 35 youth, each individual/pair will receive more than one image.
Have the pairs/small groups of youth stand in a circle; each individual/pair should be one least arm’s length from the next.
Opening Questions: Ask the youth the questions listed below. Ask them to discuss and explain their thoughts and record them on the flip chart and butcher paper provided.
How and where do they get the food they eat? How and where do they think wild animals get their food?
Do wild animals obtain their food the same way people do? Why, or why not?
Materials Needed:
Two balls of yarn; different colors Printout - 35 “water web of life images” (see Appendix A) Printout - 35 “water web of life” clues (see Appendix B) Large open space (playground; gymnasium; multipurpose room)
4-H SET: WATER QUALITY AWARENESS IN URBAN ENVIRONMENTS - LESSON 3 [3]
Exploration (Procedure):
Begin the activity with the facilitator reading the water web of life clues in order 1-35. Note: Provide the youth with opportunities to “guess” what the answers to the clues are. Make certain they explain the reasoning behind their “guesses.”
When the correct answer is determined, have the youth connect the two points by passing the ball of yarn. For example:
Clue 1. I am the sun. Plants use my energy to make food. Even tiny microscopic plants like……………….Guess what?
Algae
In this situation, the person who is in possession of the picture of the sun will hold the end of the string of yarn. The ball of yarn is then taken across the room to the person holding the picture of algae.
Continue this process through all 35 clues and images. This allows the youth to see the interdependencies within a water web of life.
The activity is finished when all water web of life options have been connected.
Sharing, Processing, & Generalizing:
Ask the youth to explain, using their words, what happened in the activity. Ask them to record their thoughts on the butcher paper or flip chart provided.
Ask the youth to look at the water web of life carefully and imagine if something
were removed (e.g., sun; algae). How might this affect other parts of the web? Ask them to record their thoughts on the butcher paper or flip chart provided.
Activity
4-H SET: WATER QUALITY AWARENESS IN URBAN ENVIRONMENTS - LESSON 3 [4]
If necessary, use more targeted questions as prompts to get to specific points. Additional questions might include: Ask the youth to explain the different types of connections that they observed in
the activity. Have the youth draw a chart of all of the different foods that were available to
different animals in this water web of life.
Concept and Term Introduction: At this point, teachers/facilitators need to ensure that the concepts and terms web of life, producer, consumer, herbivore, omnivore, and carnivore have been introduced. Note: The goal is to have the youth develop these concepts through their exploration and define the terms using their own words. Concept Application (Optional Extension Exercise):
Take a field trip to a lake, pond, stream, or coastal area. Have the youth observe the different plants and animals. Identify whether the animals they observe are herbivores, omnivores, or carnivores.
Have the youth predict how a food web would be affected if one part of it were
eliminated for one reason or another (e.g., habitat destruction; pollution).
4-H SET: WATER QUALITY AWARENESS IN URBAN ENVIRONMENTS - LESSON 3 [5]
The University of California prohibits discrimination or harassment of any person on the basis of race, color, national origin, religion, sex, gender identity, pregnancy (including childbirth, and medical conditions related to pregnancy or childbirth), physical or mental disability, medical condition (cancer-related or genetic characteristics), ancestry, marital status, age, sexual orientation, citizenship, or service in the uniformed services (as defined by the Uniformed Services Employment and Reemployment Rights Act of 1994: service in the uniformed services includes membership, application for membership, performance of service, application for service, or obligation for service in the uniformed services) in any of its programs or activities. University policy also prohibits reprisal or retaliation against any person in any of its programs or activities for making a complaint of discrimination or sexual harassment or for using or participating in the investigation or resolution process of any such complaint. University policy is intended to be consistent with the provisions of applicable State and Federal laws. Inquiries regarding the University’s nondiscrimination policies may be directed to the Affirmative Action/Equal Opportunity Director, University of California, Agriculture and Natural Resources, 1111 Franklin Street, 6th Floor, Oakland, CA 94607, (510) 987-0096.
4-H WATER SET: Water Quality Awareness in Urban Environments – Lesson 3 Appendix A [1]
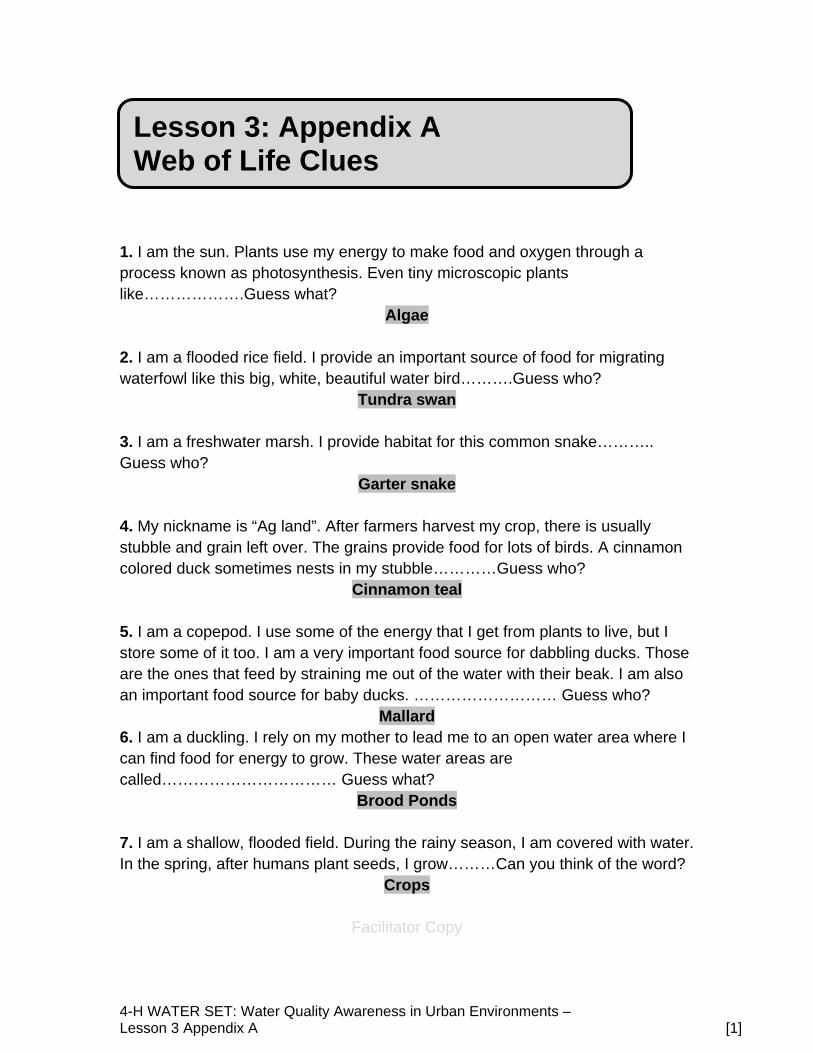
1. I am the sun. Plants use my energy to make food and oxygen through a process known as photosynthesis. Even tiny microscopic plants like……………….Guess what?
Algae 2. I am a flooded rice field. I provide an important source of food for migrating waterfowl like this big, white, beautiful water bird……….Guess who?
Tundra swan 3. I am a freshwater marsh. I provide habitat for this common snake……….. Guess who?
Garter snake 4. My nickname is “Ag land”. After farmers harvest my crop, there is usually stubble and grain left over. The grains provide food for lots of birds. A cinnamon colored duck sometimes nests in my stubble…………Guess who?
Cinnamon teal 5. I am a copepod. I use some of the energy that I get from plants to live, but I store some of it too. I am a very important food source for dabbling ducks. Those are the ones that feed by straining me out of the water with their beak. I am also an important food source for baby ducks. ……………………… Guess who?
Mallard 6. I am a duckling. I rely on my mother to lead me to an open water area where I can find food for energy to grow. These water areas are called…………………………… Guess what?
Brood Ponds 7. I am a shallow, flooded field. During the rainy season, I am covered with water. In the spring, after humans plant seeds, I grow………Can you think of the word?
Crops
Facilitator Copy
Lesson 3: Appendix A Web of Life Clues
4-H WATER SET: Water Quality Awareness in Urban Environments – Lesson 3 Appendix A [2]
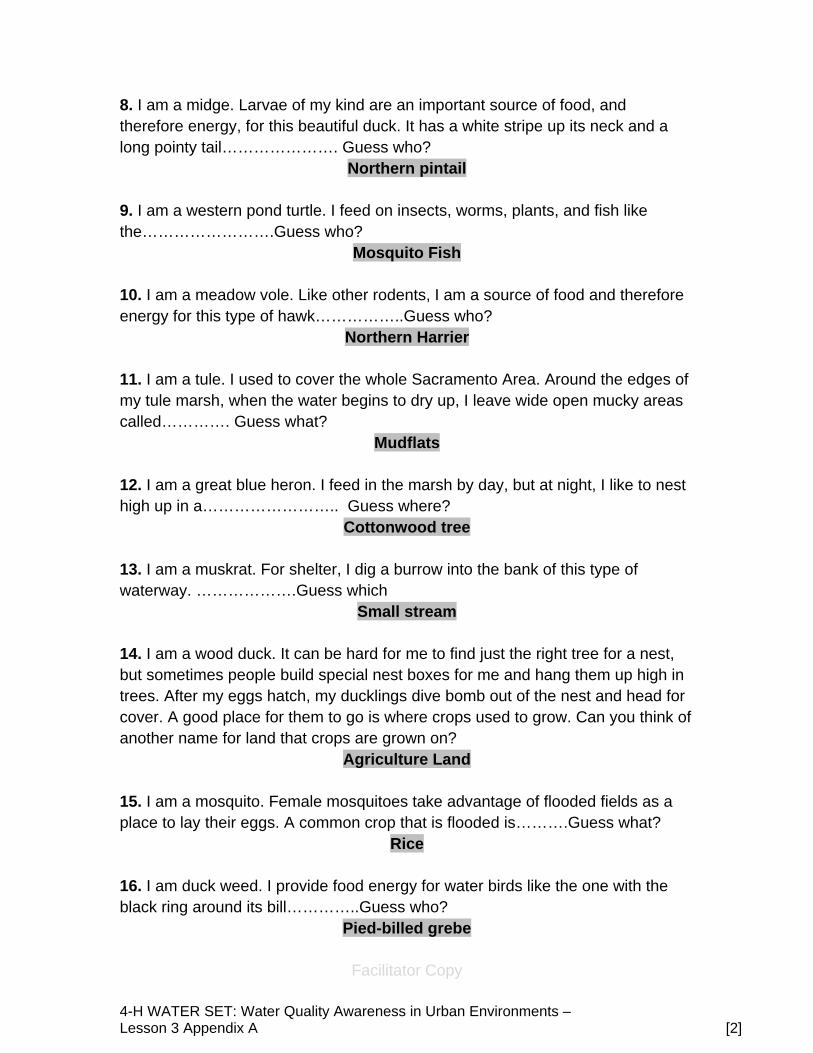
8. I am a midge. Larvae of my kind are an important source of food, and therefore energy, for this beautiful duck. It has a white stripe up its neck and a long pointy tail…………………. Guess who?
Northern pintail 9. I am a western pond turtle. I feed on insects, worms, plants, and fish like the…………………….Guess who?
Mosquito Fish 10. I am a meadow vole. Like other rodents, I am a source of food and therefore energy for this type of hawk……………..Guess who?
Northern Harrier 11. I am a tule. I used to cover the whole Sacramento Area. Around the edges of my tule marsh, when the water begins to dry up, I leave wide open mucky areas called…………. Guess what?
Mudflats 12. I am a great blue heron. I feed in the marsh by day, but at night, I like to nest high up in a…………………….. Guess where?
Cottonwood tree 13. I am a muskrat. For shelter, I dig a burrow into the bank of this type of waterway. ……………….Guess which
Small stream 14. I am a wood duck. It can be hard for me to find just the right tree for a nest, but sometimes people build special nest boxes for me and hang them up high in trees. After my eggs hatch, my ducklings dive bomb out of the nest and head for cover. A good place for them to go is where crops used to grow. Can you think of another name for land that crops are grown on?
Agriculture Land 15. I am a mosquito. Female mosquitoes take advantage of flooded fields as a place to lay their eggs. A common crop that is flooded is……….Guess what?
Rice 16. I am duck weed. I provide food energy for water birds like the one with the black ring around its bill…………..Guess who?
Pied-billed grebe
Facilitator Copy

4-H WATER SET: Water Quality Awareness in Urban Environments – Lesson 3 Appendix A [3]
17. I am a black-necked stilt. I like to make my nest on the open ground. I try to nest close to a place where I can find my food. Can you think of a human-altered area that is pretty good habitat for me?
Shallow, flooded fields 18. I am a garter snake. My cousin the giant garter snake is a threatened species. One of my sources of food for energy is a common frog…………Guess who?
Pacific tree frog 19. I am a tundra swan. Flooded fields also make it easier for me to land. Like other migrating ducks and geese, I use a drier, grassy habitat as a place to ‘loaf’ or rest………..Guess where?
Upland habitat 20. I am unpolluted water. I am especially important to insects that live and grow under my surface. Like the larvae of this mosquito-looking insect……….Guess who?
Midge 21. I am a nesting Mallard duck. My ducklings will use the energy they get from eating copepods and other tiny animals to grow. I rely on plants to hide my nest. The plant with the long flat leaves and a hot dog shaped seed pod on a stick provides a safe place to build a nest. Guess what plant I am talking about?
Cattail 22. I am a Northern harrier. In addition to rodents I also prey on these young feathered animals…………………Guess who?
Ducklings 23. I am algae. I grow readily in the marsh. I use the sun’s energy to make food and oxygen through photosynthesis. I use some of that food to stay alive, but I store some of it too. I am eaten by tiny bullet-shaped, shrimp-like animals called………..Guess who?
Copepods 24. I am a Northern pintail duck. I spend the spring and summer months in Canada and Alaska. In the winter, I rely on a special aquatic habitat in the Central Valley for food and shelter……….Guess which habitat?
Fresh water marsh
Facilitator Copy
4-H WATER SET: Water Quality Awareness in Urban Environments – Lesson 3 Appendix A [4]
25. I am a cinnamon teal. After my duckling hatch, they rely on me to lead them to a brood pond where they can find food. Food isn’t the only important thing thought. Brood ponds also need to have lots of plant cover for hiding. A good plant to hide in has long, round stalks and grows in thick clumps……..Guess what plant I’m talking about?
Tule 26. I am a crop. I could be beans, safflower, melons, sugar beets or maybe tomatoes. Whichever crop I am, I am like cattails, tules, duckweed and other plants. We all need this thing as a source of energy to make food…………..What is it?
The sun 27. I am a small stream. I provide habitat for this shelled reptile that might soon be added to the list of threatened species. …..Guess who?
Western pond turtle 28. I am a brood pond. I am a great place for this small, bright green aquatic plant to grow. It is called………..Guess what?
Duck weed 29. I am a mosquito fish. People put me in ponds and streams to control the larvae of the insect I am named after…………….who is it?
Mosquito 30. I am a Pacific tree frog. Snakes are not my only predator. The energy I store from eating insects, earthworms, snails and small fish will become energy for any predator that might eat me. I have to watch out for that long-legged wading bird with a beak that warns me to watch out……..Guess who?
Great blue heron 31. I am an upland habitat. My grass is habitat for many rodents such as the……….Guess who?
Meadow vole 32. I am a mud flat. Even though I may be covered with a little bit of water, under the surface of my muck you can find lots of tiny invertebrates, or animals without backbones. They sure make great food for shorebirds with “poke-in-the-mud beaks like the……………………guess who?
Black-necked stilt
Facilitator Copy
4-H WATER SET: Water Quality Awareness in Urban Environments – Lesson 3 Appendix A [5]
33. I am a cattail. I am in important source of food for this aquatic mammal……………………………………….Guess who?
Muskrat 34. I am a cottonwood tree. I am fairly common at the edge of wetland areas. If there are several of me along a stream, we are called a riparian habitat. If I am hollow inside, I can provide nesting space for this colorful perching duck………….Guess who?
Wood duck 35. I am a pied-billed grebe. Like all other wetland plants and animals, I rely on water that is……………….Guess what?
Unpolluted water
Facilitator Copy
WATER QUALITY AWARENESS IN URBAN ENVIRONMENTS
LESSON 4 Salinity’s Significance
4H SET: Water Quality Awareness in Urban Environments – Lesson 4 [1]
Subject Overview: Salinity is the measurement of dissolved salts found in a specific amount of water. Scientists measure salinity to detect increases or decreases in the amount of dissolved salts in the water. Salinity in water increases as water evaporates or as additional salts are added from natural and manmade sources. Since most aquatic animals can only tolerate a narrow range of salinities, significant changes in salinity often result in the inability of an animal to grow, reproduce, and survive. Water contains varying amounts of dissolved salts, mainly ordinary table salt (sodium chloride). Dissolved salts are solids you can see, such as table salt, until they dissolve in solution (i.e. water) rendering them invisible. Aquatic plants and animals are adapted to live in waters of a specific salinity and have a narrow tolerance for change in salinity. As a result, even small changes in salinity impacts their ability to grow and survive. Ocean water is very high in salinity (35,000 milligrams per liter); while freshwater is usually less than 1,000 milligrams per liter. Other dissolved salts contributing to salinity, besides sodium and chloride, include: magnesium, sulfur, calcium, and potassium. Activity Concepts: salinity, tolerance Subject Links: Science: chemistry, ecology Vocabulary: salinity; dissolved salts; tolerance Purpose of activities: Youth will have the opportunity to explore how dissolved salts in water impact aquatic organisms. Overview of activities: Youth will explore salinity through a hands-on activity. Time Required: Approximately 40-60 minutes
Lesson 4: Salinity’s Significance
4H SET: Water Quality Awareness in Urban Environments – Lesson 4 [2]
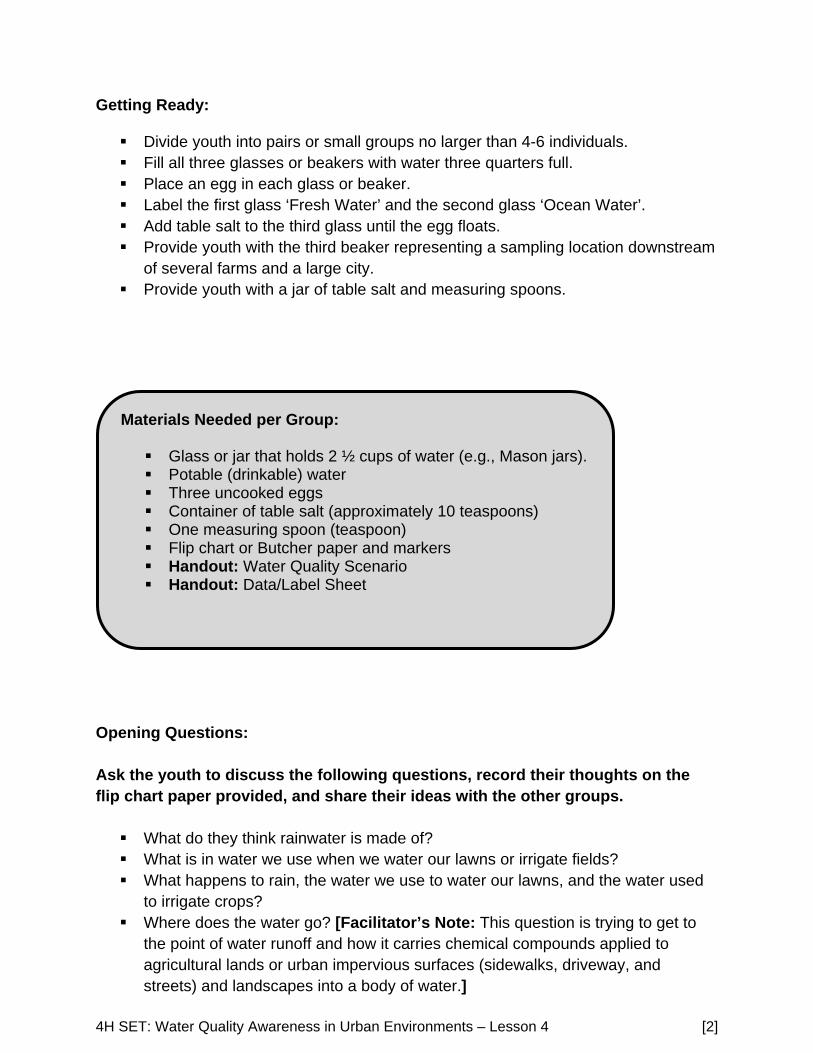
Getting Ready:
Divide youth into pairs or small groups no larger than 4-6 individuals. Fill all three glasses or beakers with water three quarters full. Place an egg in each glass or beaker. Label the first glass ‘Fresh Water’ and the second glass ‘Ocean Water’. Add table salt to the third glass until the egg floats. Provide youth with the third beaker representing a sampling location downstream
of several farms and a large city. Provide youth with a jar of table salt and measuring spoons.
Opening Questions: Ask the youth to discuss the following questions, record their thoughts on the flip chart paper provided, and share their ideas with the other groups.
What do they think rainwater is made of? What is in water we use when we water our lawns or irrigate fields? What happens to rain, the water we use to water our lawns, and the water used
to irrigate crops? Where does the water go? [Facilitator’s Note: This question is trying to get to
the point of water runoff and how it carries chemical compounds applied to agricultural lands or urban impervious surfaces (sidewalks, driveway, and streets) and landscapes into a body of water.]
Materials Needed per Group:
Glass or jar that holds 2 ½ cups of water (e.g., Mason jars). Potable (drinkable) water Three uncooked eggs Container of table salt (approximately 10 teaspoons) One measuring spoon (teaspoon) Flip chart or Butcher paper and markers Handout: Water Quality Scenario Handout: Data/Label Sheet
4H SET: Water Quality Awareness in Urban Environments – Lesson 4 [3]
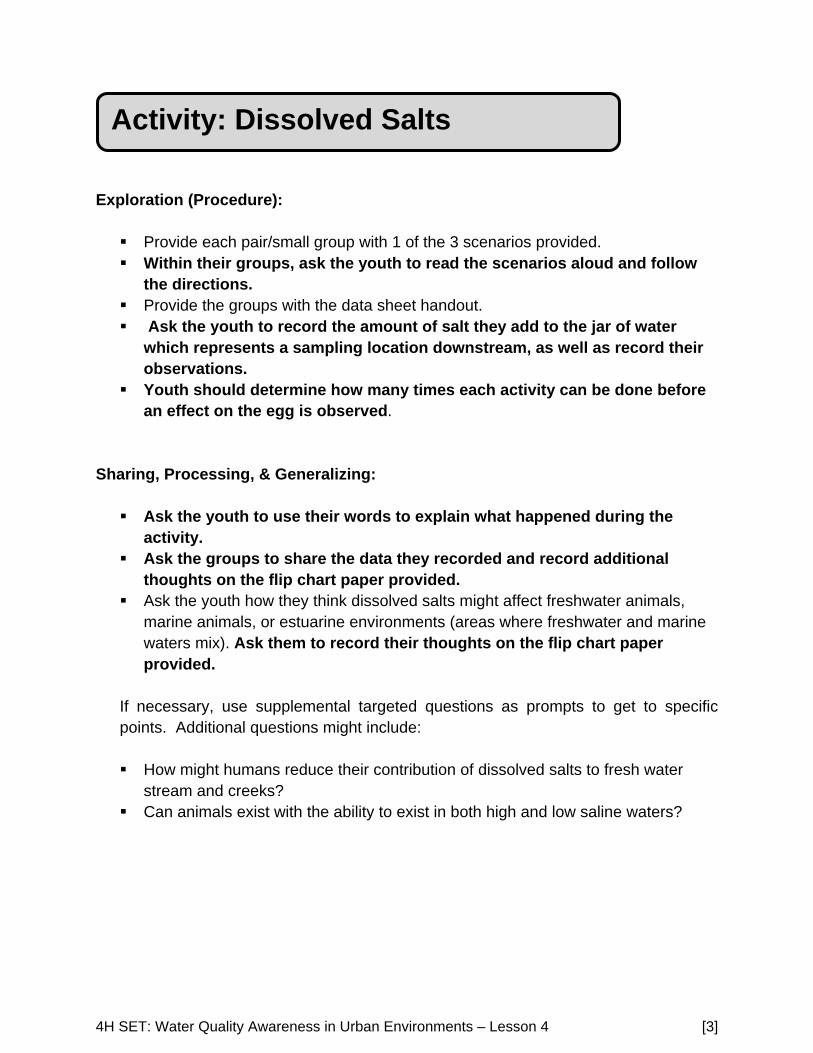
Exploration (Procedure):
Provide each pair/small group with 1 of the 3 scenarios provided. Within their groups, ask the youth to read the scenarios aloud and follow
the directions. Provide the groups with the data sheet handout. Ask the youth to record the amount of salt they add to the jar of water
which represents a sampling location downstream, as well as record their observations.
Youth should determine how many times each activity can be done before an effect on the egg is observed.
Sharing, Processing, & Generalizing:
Ask the youth to use their words to explain what happened during the activity.
Ask the groups to share the data they recorded and record additional thoughts on the flip chart paper provided.
Ask the youth how they think dissolved salts might affect freshwater animals, marine animals, or estuarine environments (areas where freshwater and marine waters mix). Ask them to record their thoughts on the flip chart paper provided.
If necessary, use supplemental targeted questions as prompts to get to specific points. Additional questions might include: How might humans reduce their contribution of dissolved salts to fresh water
stream and creeks? Can animals exist with the ability to exist in both high and low saline waters?
Activity: Dissolved Salts
4H SET: Water Quality Awareness in Urban Environments – Lesson 4 [4]
Concept and Term Introduction: At this point, facilitators need to ensure that the concepts and terms salinity, dissolved salts, and tolerance have been introduced. Note: The goal is to have the youth develop these concepts through their exploration and define the terms using their own words and ensure that:
The youth understand the concept of salinity and how waters differ in their dissolved salt content.
The youth have identified (from the scenarios) major sources of dissolved salts in surface runoff from agricultural lands.
The youth have identified (from the scenarios) major sources of dissolved salts in surface runoff from urban and suburban areas.
Concept Application (Optional Extension Exercise):
Take a field trip to a lake, pond, stream, or coastal area. Have the youth observe the different plants and animals. Identify whether the animals they observe are adapted to low, intermediate, or high salinity water.
Have the youth predict how a food web would be affected if the salinity of a fresh
water stream suddenly increased during the rainy season (e.g. impact on insect population, plants, and fish).
4H SET: Water Quality Awareness in Urban Environments – Lesson 4 [5]
LESSON HANDOUT
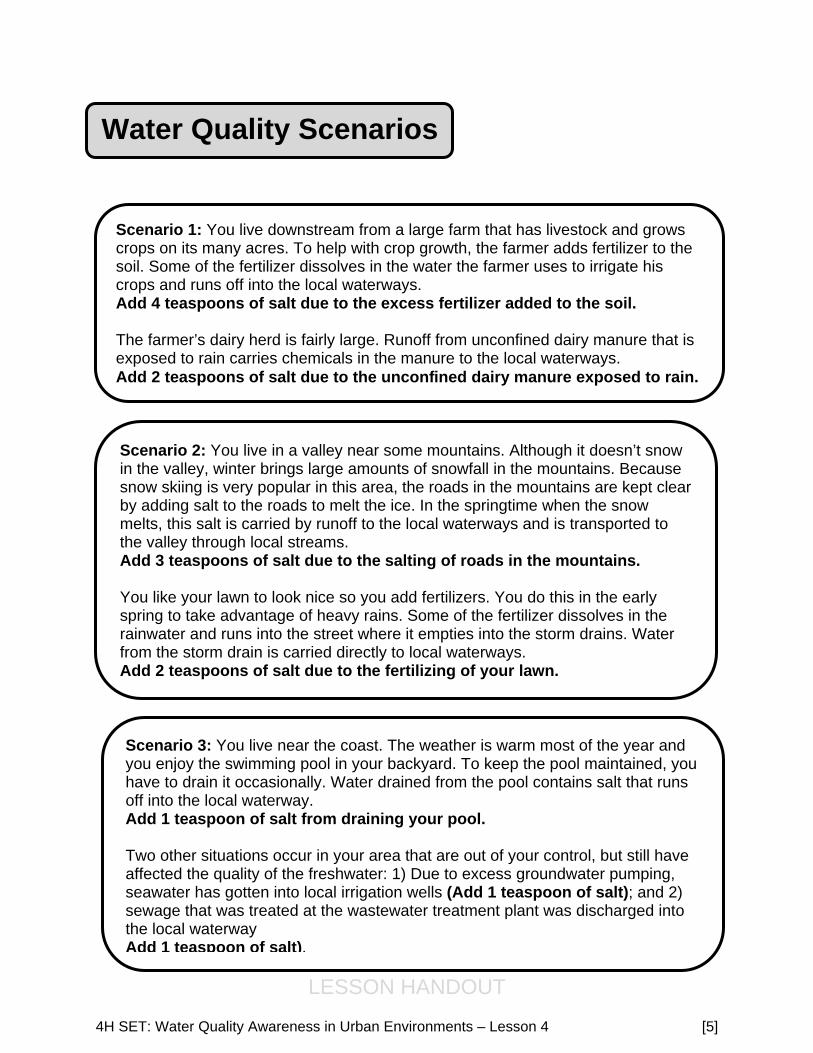
Water Quality Scenarios
Scenario 1: You live downstream from a large farm that has livestock and grows crops on its many acres. To help with crop growth, the farmer adds fertilizer to the soil. Some of the fertilizer dissolves in the water the farmer uses to irrigate his crops and runs off into the local waterways. Add 4 teaspoons of salt due to the excess fertilizer added to the soil. The farmer’s dairy herd is fairly large. Runoff from unconfined dairy manure that is exposed to rain carries chemicals in the manure to the local waterways. Add 2 teaspoons of salt due to the unconfined dairy manure exposed to rain.
Scenario 2: You live in a valley near some mountains. Although it doesn’t snow in the valley, winter brings large amounts of snowfall in the mountains. Because snow skiing is very popular in this area, the roads in the mountains are kept clear by adding salt to the roads to melt the ice. In the springtime when the snow melts, this salt is carried by runoff to the local waterways and is transported to the valley through local streams. Add 3 teaspoons of salt due to the salting of roads in the mountains. You like your lawn to look nice so you add fertilizers. You do this in the early spring to take advantage of heavy rains. Some of the fertilizer dissolves in the rainwater and runs into the street where it empties into the storm drains. Water from the storm drain is carried directly to local waterways. Add 2 teaspoons of salt due to the fertilizing of your lawn.
Scenario 3: You live near the coast. The weather is warm most of the year and you enjoy the swimming pool in your backyard. To keep the pool maintained, you have to drain it occasionally. Water drained from the pool contains salt that runs off into the local waterway. Add 1 teaspoon of salt from draining your pool. Two other situations occur in your area that are out of your control, but still have affected the quality of the freshwater: 1) Due to excess groundwater pumping, seawater has gotten into local irrigation wells (Add 1 teaspoon of salt); and 2) sewage that was treated at the wastewater treatment plant was discharged into the local waterway Add 1 teaspoon of salt).
4H SET: Water Quality Awareness in Urban Environments – Lesson 4 [6]
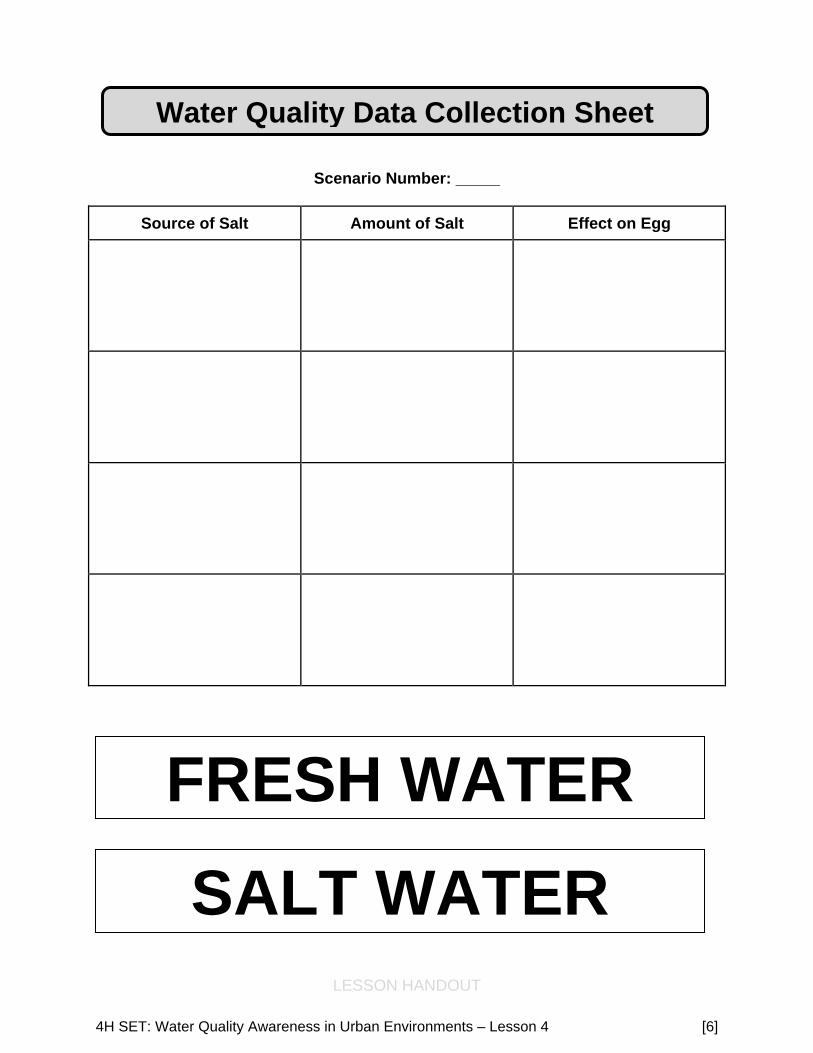
Scenario Number: _____
Source of Salt Amount of Salt Effect on Egg
LESSON HANDOUT
Water Quality Data Collection Sheet
FRESH WATER
SALT WATER
4H SET: Water Quality Awareness in Urban Environments – Lesson 4 [7]
The University of California prohibits discrimination or harassment of any person on the basis of race, color, national origin, religion, sex, gender identity, pregnancy (including childbirth, and medical conditions related to pregnancy or childbirth), physical or mental disability, medical condition (cancer-related or genetic characteristics), ancestry, marital status, age, sexual orientation, citizenship, or service in the uniformed services (as defined by the Uniformed Services Employment and Reemployment Rights Act of 1994: service in the uniformed services includes membership, application for membership, performance of service, application for service, or obligation for service in the uniformed services) in any of its programs or activities. University policy also prohibits reprisal or retaliation against any person in any of its programs or activities for making a complaint of discrimination or sexual harassment or for using or participating in the investigation or resolution process of any such complaint. University policy is intended to be consistent with the provisions of applicable State and Federal laws. Inquiries regarding the University’s nondiscrimination policies may be directed to the Affirmative Action/Equal Opportunity Director, University of California, Agriculture and Natural Resources, 1111 Franklin Street, 6th Floor, Oakland, CA 94607, (510) 987-0096.
WATER QUALITY AWARENESS IN URBAN ENVIRONMENTS
LESSON 5 Erosion Effects
4H SET: WATER QUALITY AWARENESS IN URBAN ENVIRONMENTS – LESSON 5 [1]
Subject Overview: Dissolved Oxygen (DO) is essential for healthy lakes and streams. Most plants and animals that live in freshwater need DO in order to survive. Without DO, lakes and streams will be practically devoid of these organisms.
Some of the DO in lakes and streams comes from the atmosphere. As waves and fast-moving water move and mix with the air, oxygen from the atmosphere dissolves in the water. Algae and rooted aquatic plants also produce oxygen through photosynthesis. In order to do this, however, sunlight must penetrate the water so the algae and rooted aquatic plants can undergo photosynthesis. Therefore, the water cannot be too cloudy or turbid. If the turbidity of the water is too high, adequate amounts of sunlight will not reach the algae and rooted aquatic plants, and therefore the amount of oxygen produced will drop.
One main factor that contributes to increased turbidity in lakes and streams is soil erosion. Soil erosion happens naturally through processes like wind and rain; however human activities cause soil erosion, and at a rate that is estimated to be 10 greater than natural causes. Examples of how humans cause soil erosion include: agriculture (plowing fields; harvesting crops); grazing and deforestation; building houses and roads; and watering lawns and gardens.
When the amount of DO in an aquatic environment drops, it can disrupt the “water web of life.” For example, aquatic insects may not survive, and this affects the fish that feed on them by lowering the amount of available food. Furthermore, even if the fish could find enough other food to eat, there may not be enough DO for them to breathe in through their gills to stay alive.
Activity Concepts: Webs of life; interdependency; dissolved oxygen (DO); turbidity; soil erosion. Subject Links: Science. Vocabulary: Web of life; dissolved oxygen (DO); turbidity; soil erosion; interdependency. Purpose of activities: Youth will have the opportunity to explore how soil erosion affects the water web of life. Overview of activities: Youth will explore the effects of soil erosion through a hands-on activity. Time Required: Approximately 25-40 minutes
Erosion Effects
4H SET: WATER QUALITY AWARENESS IN URBAN ENVIRONMENTS – LESSON 5 [2]
Getting Ready:
Group the youth into pairs. Handout (2) Why Photosynthesis? labels to each pair of youth. Distribute (2) clear glass jars or glasses to each pair of youth. Tape the Why Photosynthesis? labels on one side of each jar. Fill the jars/glasses ¾ full with water. Provide each pair of youth with paper towels in case of spills. Provide each pair of youth with a tablespoon. Copy the human intervention erosion scenarios so each pair of youth receives
one copy of each scenario. Opening Questions Ask the youth to discuss the following questions, record their thoughts on the butcher or flip chart paper provided, and share their ideas with the other groups.
Where do they get the air that they breathe?
How and where do wild animals in a forest get the air that they breathe?
Do wild animals obtain their food the same way people do? Why or why not?
How and where do animals in a stream or lake (e.g., insects; fish) get the air that they breathe?
Do wild animals obtain their food the same way people do? Why or why not?
Note: The concept of photosynthesis was introduced in the previous “Water Web of Life” activity.
Materials Needed:
(2) one-quart jars or glasses (must be clear) per pair of youth.
One bag of potting soil (shared). One tablespoon per pair of youth. Tap water (shared). Paper towels (shared). Print: (2) Why Photosynthesis? labels per pair of youth. Handout: Human Intervention Erosion scenarios. Butcher paper or Flip Chart. Markers Clear tape (shared).
4H SET: WATER QUALITY AWARENESS IN URBAN ENVIRONMENTS – LESSON 5 [3]
Exploration (Procedure):
Request each group to look through the glass of water and read what’s written on the “Why Photosynthesis?” label taped to each jar. Are they able to read what’s on the labels? Ask the groups to record their observations on the butcher or flip chart paper proved.
Provide each pair of youth with one human intervention erosion scenario. Ask them to read the scenario and follow the directions that indicate how much soil to add to the water. (Note: Soil will only be added to one jar; the second jar is the “control” to be used for comparison.)
Request the youth to again look through the glass of water and read what’s on the “Why Photosynthesis” label taped to each jar. Are they able to read what’s on the stickers? Ask the groups to record their observations on the butcher or flip chart paper provided.
Repeat the previous two steps with each pair of youth until they have completed all of the human intervention scenarios.
Sharing, Processing, & Generalizing:
Ask the youth to use their words and explain what happened in the activity.
Ask them to record their thoughts on the flip chart or butcher paper provided.
Which human activities caused the most erosion, and how might this affect the different parts of the “water web of life”? Ask them to record their thoughts on the flip chart or butcher paper provided.
If necessary, use supplemental target questions as prompts to get to specific points. Additional questions might include: Explain how soil erosion might affect photosynthesis. How might this affect plants
and animals living in the water?
What are some things that humans could do in order to reduce the amount of soil erosion we cause?
ACTIVITY
4H SET: WATER QUALITY AWARENESS IN URBAN ENVIRONMENTS – LESSON 5 [4]
Concept and Term Introduction: At this point, facilitators need to ensure that the following concepts and terms have been introduced: web of life; dissolved oxygen (DO); turbidity; soil erosion; interdependency. Note: The goal is to have the youth develop these concepts through their exploration and define the terms using their own words. Concept Application (Optional Extension Exercise):
Take a field trip to a lake, pond, or stream. Have the youth observe the clarity of the water. Have them pick up rocks in the water and look at the number and types of insects living on them. A wide variety and high number of insects is usually a good indicator of high DO levels.
Have the youth look for sources of soil erosion in their homes and/or
communities. Ask them to develop ideas to help decrease the soil erosion (e.g., planting trees or shrubs).
4H SET: WATER QUALITY AWARENESS IN URBAN ENVIRONMENTS – LESSON 5 [5]
LESSON HANDOUT
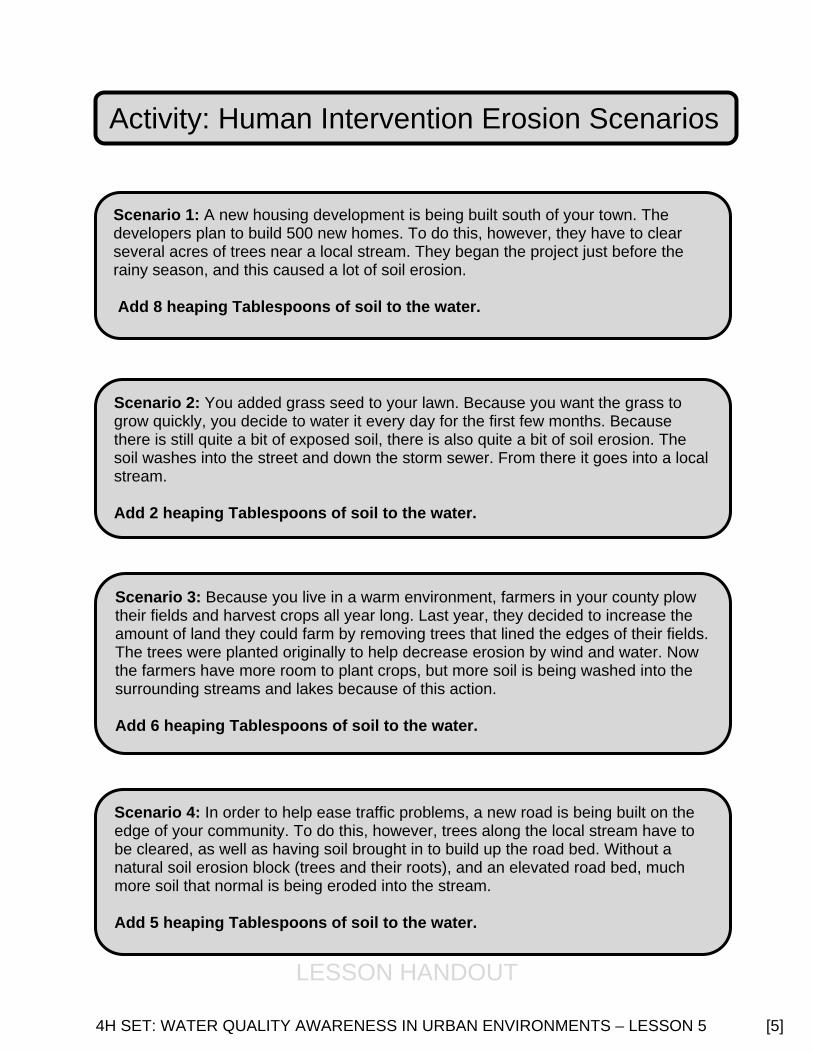
Activity: Human Intervention Erosion Scenarios
Scenario 1: A new housing development is being built south of your town. The developers plan to build 500 new homes. To do this, however, they have to clear several acres of trees near a local stream. They began the project just before the rainy season, and this caused a lot of soil erosion. Add 8 heaping Tablespoons of soil to the water.
Scenario 2: You added grass seed to your lawn. Because you want the grass to grow quickly, you decide to water it every day for the first few months. Because there is still quite a bit of exposed soil, there is also quite a bit of soil erosion. The soil washes into the street and down the storm sewer. From there it goes into a local stream. Add 2 heaping Tablespoons of soil to the water.
Scenario 3: Because you live in a warm environment, farmers in your county plow their fields and harvest crops all year long. Last year, they decided to increase the amount of land they could farm by removing trees that lined the edges of their fields. The trees were planted originally to help decrease erosion by wind and water. Now the farmers have more room to plant crops, but more soil is being washed into the surrounding streams and lakes because of this action. Add 6 heaping Tablespoons of soil to the water.
Scenario 4: In order to help ease traffic problems, a new road is being built on the edge of your community. To do this, however, trees along the local stream have to be cleared, as well as having soil brought in to build up the road bed. Without a natural soil erosion block (trees and their roots), and an elevated road bed, much more soil that normal is being eroded into the stream. Add 5 heaping Tablespoons of soil to the water.
4H SET: WATER QUALITY AWARENESS IN URBAN ENVIRONMENTS – LESSON 5 [6]
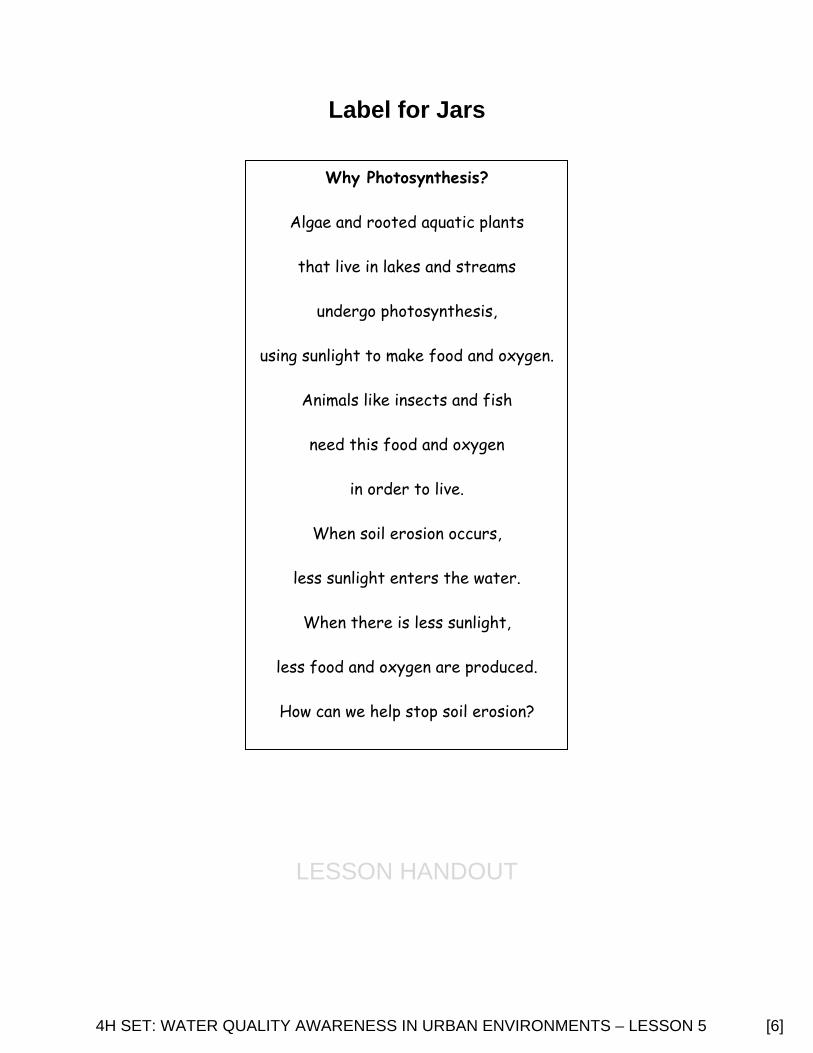
Label for Jars
LESSON HANDOUT
Why Photosynthesis?
Algae and rooted aquatic plants
that live in lakes and streams
undergo photosynthesis,
using sunlight to make food and oxygen.
Animals like insects and fish
need this food and oxygen
in order to live.
When soil erosion occurs,
less sunlight enters the water.
When there is less sunlight,
less food and oxygen are produced.
How can we help stop soil erosion?
4H SET: WATER QUALITY AWARENESS IN URBAN ENVIRONMENTS – LESSON 5 [7]
The University of California prohibits discrimination or harassment of any person on the basis of race, color, national origin, religion, sex, gender identity, pregnancy (including childbirth, and medical conditions related to pregnancy or childbirth), physical or mental disability, medical condition (cancer-related or genetic characteristics), ancestry, marital status, age, sexual orientation, citizenship, or service in the uniformed services (as defined by the Uniformed Services Employment and Reemployment Rights Act of 1994: service in the uniformed services includes membership, application for membership, performance of service, application for service, or obligation for service in the uniformed services) in any of its programs or activities. University policy also prohibits reprisal or retaliation against any person in any of its programs or activities for making a complaint of discrimination or sexual harassment or for using or participating in the investigation or resolution process of any such complaint. University policy is intended to be consistent with the provisions of applicable State and Federal laws. Inquiries regarding the University’s nondiscrimination policies may be directed to the Affirmative Action/Equal Opportunity Director, University of California, Agriculture and Natural Resources, 1111 Franklin Street, 6th Floor, Oakland, CA 94607, (510) 987-0096.
WATER QUALITY AWARENESS IN URBAN ENVIRONMENTS
LESSON 6 Nutrient No-No’s
4H SET: WATER QUALITY AWARENESS IN URBAN ENVIRONMENTS – LESSON 6 [1]
Subject Overview: Fresh water streams, rivers, and lakes contain varying amounts of nutrients. These nutrients supply living organisms with the basic materials they need to grow and reproduce. Nitrogen and phosphorus are essential to the growth of aquatic plants which in turn become a food source to other organisms. Excess nitrogen and phosphorus, however, can lead to excess plant growth in water, most notably in the form of algae. Large mats of algae block sunlight from reaching more beneficial photosynthetic organisms just below the water’s surface. As algae dies and begins to decompose, oxygen levels in the water decrease as the molecules are utilized in the decomposition process, resulting in less available oxygen for fish and other aquatic organisms. Minimizing the input of excess nutrients from fertilizer applications and landscape clippings reduces the occurrences of algae mats and the negative impact of decomposition. Nitrogen and phosphorus are essential nutrients for the growth of aquatic and terrestrial plants. Plant growth and appearance can be significantly improved with the addition of these nutrients in the form of fertilizers. Nitrogen is found in environment in a number of different forms with nitrate being the form most available for plants for uptake and utilization for growth. Phosphorus is also available in many forms, but plants utilize the soluble form phosphate. In most dry environments, nitrogen is the limiting nutrient to growth as phosphorus is present at sufficient levels. Urban environments, through the use of fertilizers, increase the input of soluble nitrate and phosphate into streams and creeks adapted to lower nutrient levels. Algae growth normally limited by the lack of sufficient nitrogen is increased, resulting in algal blooms floating on the surface of creeks, streams, and rivers. Decomposing plant material sinks to the bottom of the water and begins to utilize the oxygen in the water to break down the plant material. Significant decomposition in a lake or river “robs” fish of oxygen resulting in what are called ‘fish kills’. Excess algae also reduce the quality of recreational activities such as boating, swimming, and fishing. This process is called eutrophication. (Western Pennsylvania Conservancy – “To Fertilize or Not To Fertilize”) In order to grow, plants require essential minerals and elements, along with sunlight and water. If the soil doesn’t provide enough nutrients for plants to grow, fertilizers may need to be added. A fertile soil has adequate amounts of the major plant nutrients – nitrogen, phosphorus and potassium; a sufficiency of the micronutrients (sometimes called trace minerals) – zinc, manganese, boron, iron, sulfur, an abundance of organic matter, and humus. To be fertile, the soil must also have a nearly neutral soil pH as well as good structure and drainage.
Lesson 6: Nutrient No-No’s
4H SET: WATER QUALITY AWARENESS IN URBAN ENVIRONMENTS – LESSON 6 [2]
Nitrogen, phosphorus and potassium can be obtained from natural sources (animal and vegetable matter) or from inorganic fertilizers that are chemically produced. When you buy fertilizers commercially, most are labeled with a formula that states the percentage of nitrogen, phosphorus and potassium that the preparations contain. The chemical symbols for these three elements are N, P and K respectively, and the elements are referred to by their symbols on fertilizer bags. If a bag of fertilizer says it is “5-10-5,” for example, that means that it contains 5 percent N, 10 percent P and 5 percent K. For example, a 100-pound bag of 5-10-5 would supply 5 pounds of nitrogen to your garden, 10 pounds of phosphorous and 5 pounds of potassium. The rest is inert filler. Both organic and inorganic commercial fertilizers are labeled using these initial letters. Amounts of these elements can vary in fertilizer depending on what you want or need the plant to do. Nitrogen maintains plants’ green color and is largely responsible for good leaf and stem growth. Nitrogen provides a quick boost of energy to a plant just like a candy bar does to us. It is very soluble in water and thus leaches out of the soil quickly. If your plants run out of nitrogen you will see pale foliage and spindly growth. Phosphorous is especially important to the root development of a plant. It also helps the plant to produce fruit and seeds and resist disease. Root crops and flower bulbs require a lot of phosphorous. It is not highly soluble and can be applied in the fall. Potassium is essential for plant growth and for resistance to disease. It is highly soluble and leaches out quickly so must be applied from time to time. Activity Concepts: nutrients, eutrophication, nitrogen cycle Subject Links: Science: chemistry, ecology Vocabulary: eutrophication, nitrogen, phosphorus, and decomposition Purpose of activities: Youth will have the opportunity to learn about the composition of fertilizers and how nutrients (nitrogen and phosphorus) from fertilizers impacts aquatic organisms. Overview of activities: Youth will explore nutrients through hands-on activities. Time Required: Approximately 20-30 minutes (Activity 1); approximately 40-50 minutes (Activity 2).
Did you know that if you forget which element is P and which is K, you can use a memory device such as “Phosphorus” is P because the word has two P’s in it?
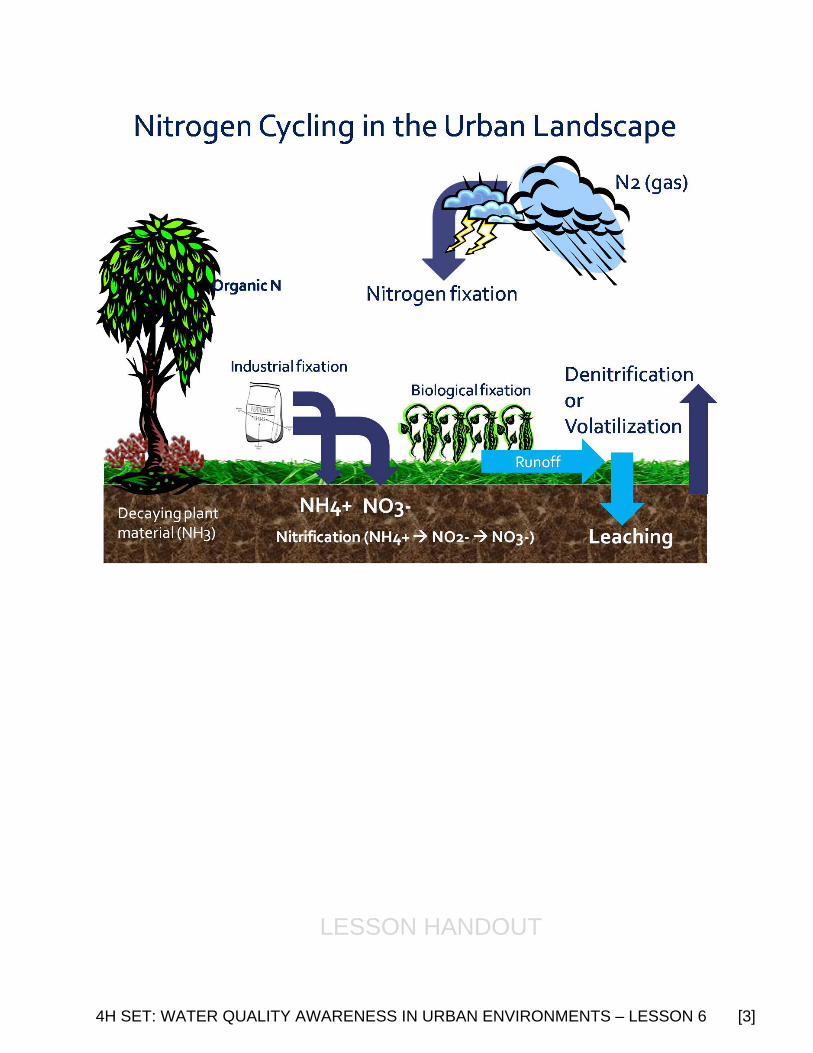
4H SET: WATER QUALITY AWARENESS IN URBAN ENVIRONMENTS – LESSON 6 [3]
LESSON HANDOUT
4H SET: WATER QUALITY AWARENESS IN URBAN ENVIRONMENTS – LESSON 6 [4]
Experiencing (Procedure): Using the color/ingredient key, ask the group to appropriately label the jars. Allow the group 10 – 15 minutes to discuss their answers. Discuss the need for different rates of fertilizers. Sharing, Processing, and Generalizing: Discuss the questions below: What are the advantages of using organic fertilizers compared to inorganic fertilizers? Are there any disadvantages to utilizing manures as a fertilizer? If so, explain. Getting Ready:
Assign one colored candy to represent each of the following: Nitrogen Phosphorous Potassium Inert Filler
Apply a blank label to each jar. Count out candies; fill and close each jar accordingly: 16 – 16 – 16 (Balanced) :
16 – Nitrogen 16 – Phosphorous 16 – Potassium 52 – Inert Filler
21 – 0 – 0 (High Nitrogen): 21 – Nitrogen 79 – Inert Filler
12 – 55 – 6 (High Phosphorous): 12 – Nitrogen 55 – Phosphorous 6 – Potassium 27 – Inert Filler
7 – 3 – 2 (Organic: Cottonseed Meal) : 7 – Nitrogen 3 – Phosphorous 2 – Potassium 88 – Inert Filler
Or 1 – 1 – 1 (Organic: Manure):
1 – Nitrogen 1 – Phosphorous 1 – Potassium 97 – Inert Filler
Activity #1: Nutrient Math
4H SET: WATER QUALITY AWARENESS IN URBAN ENVIRONMENTS – LESSON 6 [5]
Opening Questions: Ask the youths to provide their answers on the flip chart paper provided.
What is a fertilizer? What do the numbers on the product bag represent? What is the difference between organic and inorganic fertilizers? Why is Nitrogen necessary for plant health? Phosphorous? Potassium? In what situation might you use a fertilizer with more Nitrogen? Phosphorous?
Materials Needed: (4) 32oz. Clear Jars with Lids 400 pieces each of (4) different colored candies:
(Example: Red Hots, Lemon Heads, Good and Plenty (colors separated), M&Ms (colors separated), Baked Beans, Mike and Ikes (colors separated), Sugar Babies etc.
Printout: (4) Labels: 16 – 16 – 16 Fertilizer 21 – 0 – 0 Fertilizer 12 – 55 – 6 Fertilizer 7 – 3 – 2 Fertilizer or 1 – 1 – 1 Fertilizer Key for paired color and fertilizer ingredients.
4H SET: WATER QUALITY AWARENESS IN URBAN ENVIRONMENTS – LESSON 6 [6]
Suggested Grouping: Pairs or small groups no larger than 4-6 individuals Getting Ready:
Fill glass bowl with 1 quart of water representing a lake or pond. Provide youth with at least a tablespoon of ‘Super Snow’ that represents nitrogen and
phosphorus fertilizer (algae) and a set of measuring spoons containing ½ teaspoon and 1 teaspoon.
Green ‘Super Snow’ can be created by adding food dye to hydrated mixture and then drying in an oven at a low temperature to prevent burning.
Trash bag to dispose of ‘Super Snow’ once activity is complete. Material will dry in 4-6 weeks and can be utilized again.
Opening Questions: 1. Ask youth how they think nutrients are obtained and utilized by plants. Ask them to
explain their thoughts. Ask them to record their thoughts and ideas on the flip chart paper provided.
2. Ask the youth: Why are fertilizers added to lawns and agricultural crops? Where does fertilizer end up if it is not utilized by plants? Ask them to record their thoughts and ideas on the flip chart paper provided. [Facilitator’s Tip: This question is trying to get to the point of water runoff and how it carries nutrients applied to agricultural lands or urban impervious surfaces (sidewalks, driveway, and streets) and landscapes into a body of water.]
ACTIVITY #2: Fertilizer Foolishness
Materials Needed per Group:
Glass bowl slightly larger than 1 quart Potable (drinking) water Bulk Super Snow (Dunecraft.com or Lakeshore Learning) Measuring spoons (1/2 teaspoon and 1 teaspoon) Flip chart paper and markers Lesson Handout - Water Quality Scenario
4H SET: WATER QUALITY AWARENESS IN URBAN ENVIRONMENTS – LESSON 6 [7]
Experiencing (Procedure): Provide each pair/small group with the four scenarios provided below (pp. 8 & 9). Within their groups, ask them to read the scenarios aloud and follow the directions. Ask them to record the amount of ‘Super Snow’ crystals they add to the glass bowl that represents a lake, pond or bay. Youth should observe and record how the ‘Super Snow’ would make it difficult for fish to swim, boats to navigate, and other recreational activities. Sharing, Processing, & Generalizing:
Ask the youth to use their words to explain what happened in the activity. Ask them to share the data they recorded and record additional thoughts on the flip chart paper provided.
Ask the youth how they think nutrients might affect freshwater animals, marine animals, or estuarine environments (areas where freshwater and marine waters mix). Ask them to record their thoughts on the flip chart paper provided.
If necessary, use more targeted questions as prompts to get to specific points. Additional questions might include:
How can humans to reduce their contribution of nutrients to fresh water stream and creeks?
Do they think nutrients impact rivers, streams, and the ocean differently at different times of the year?
Concept and Term Introduction: At this point, facilitators need to ensure that the concepts and terms eutrophication, nitrogen, and phosphorus have been introduced. Note: The goal is to have the youth develop these concepts through their exploration and define the terms using their own words. The facilitator also needs to ensure that:
The youth understand the concept of eutrophication and how excess nutrients impact waters.
The youth have identified (from the scenarios) major sources of nutrients in surface runoff.
Concept Application (Optional Activities):
Take a field trip to a lake, pond, stream, or coastal area. Have the youth observe the different plants and animals. Identify whether the plants growing in the water are invasive or native.
Have the youth predict how a food web would be affected if the nutrients in a fresh water stream suddenly increased during the rainy season (e.g. impact on insect population, plants, and fish).
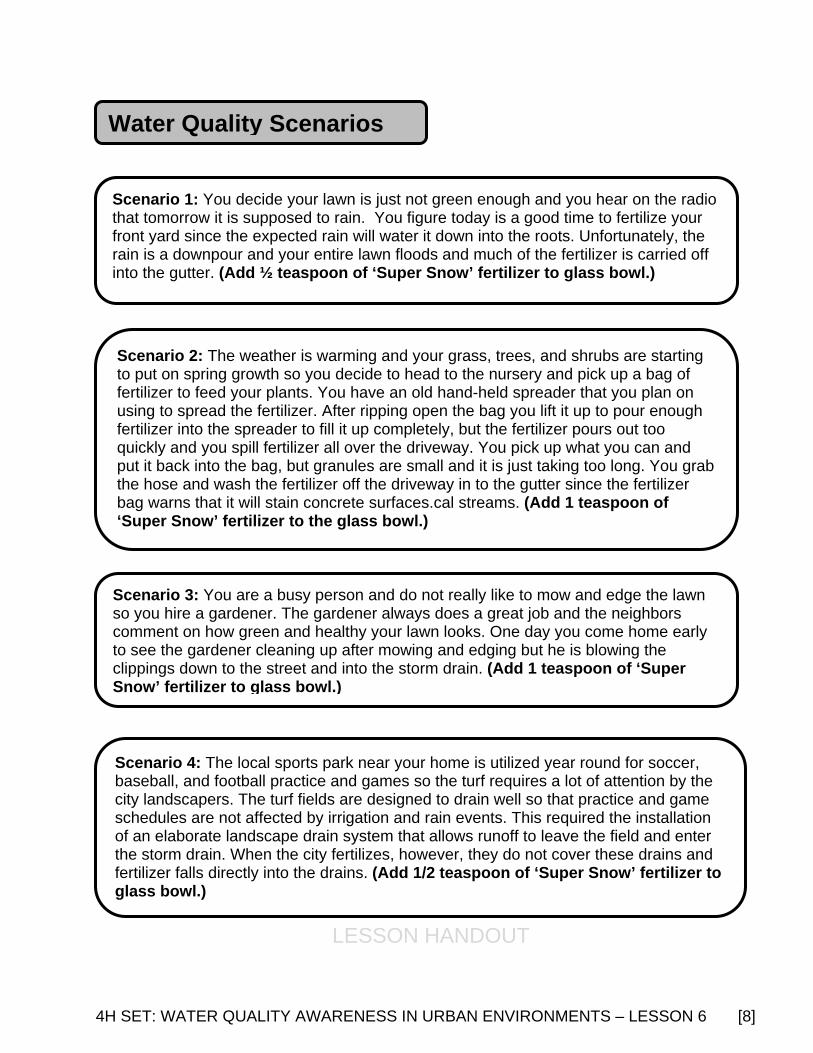
4H SET: WATER QUALITY AWARENESS IN URBAN ENVIRONMENTS – LESSON 6 [8]
LESSON HANDOUT
Scenario 1: You decide your lawn is just not green enough and you hear on the radio that tomorrow it is supposed to rain. You figure today is a good time to fertilize your front yard since the expected rain will water it down into the roots. Unfortunately, the rain is a downpour and your entire lawn floods and much of the fertilizer is carried off into the gutter. (Add ½ teaspoon of ‘Super Snow’ fertilizer to glass bowl.)
Scenario 2: The weather is warming and your grass, trees, and shrubs are starting to put on spring growth so you decide to head to the nursery and pick up a bag of fertilizer to feed your plants. You have an old hand-held spreader that you plan on using to spread the fertilizer. After ripping open the bag you lift it up to pour enough fertilizer into the spreader to fill it up completely, but the fertilizer pours out too quickly and you spill fertilizer all over the driveway. You pick up what you can and put it back into the bag, but granules are small and it is just taking too long. You grab the hose and wash the fertilizer off the driveway in to the gutter since the fertilizer bag warns that it will stain concrete surfaces.cal streams. (Add 1 teaspoon of ‘Super Snow’ fertilizer to the glass bowl.)
Scenario 3: You are a busy person and do not really like to mow and edge the lawn so you hire a gardener. The gardener always does a great job and the neighbors comment on how green and healthy your lawn looks. One day you come home early to see the gardener cleaning up after mowing and edging but he is blowing the clippings down to the street and into the storm drain. (Add 1 teaspoon of ‘Super Snow’ fertilizer to glass bowl.)
Scenario 4: The local sports park near your home is utilized year round for soccer, baseball, and football practice and games so the turf requires a lot of attention by the city landscapers. The turf fields are designed to drain well so that practice and game schedules are not affected by irrigation and rain events. This required the installation of an elaborate landscape drain system that allows runoff to leave the field and enter the storm drain. When the city fertilizes, however, they do not cover these drains and fertilizer falls directly into the drains. (Add 1/2 teaspoon of ‘Super Snow’ fertilizer to glass bowl.)
Water Quality Scenarios
4H SET: WATER QUALITY AWARENESS IN URBAN ENVIRONMENTS – LESSON 6 [9]
Resources: The University of California prohibits discrimination or harassment of any person on the basis of race, color, national origin, religion, sex, gender identity, pregnancy (including childbirth, and medical conditions related to pregnancy or childbirth), physical or mental disability, medical condition (cancer-related or genetic characteristics), ancestry, marital status, age, sexual orientation, citizenship, or service in the uniformed services (as defined by the Uniformed Services Employment and Reemployment Rights Act of 1994: service in the uniformed services includes membership, application for membership, performance of service, application for service, or obligation for service in the uniformed services) in any of its programs or activities. University policy also prohibits reprisal or retaliation against any person in any of its programs or activities for making a complaint of discrimination or sexual harassment or for using or participating in the investigation or resolution process of any such complaint. University policy is intended to be consistent with the provisions of applicable State and Federal laws. Inquiries regarding the University’s nondiscrimination policies may be directed to the Affirmative Action/Equal Opportunity Director, University of California, Agriculture and Natural Resources, 1111 Franklin Street, 6th Floor, Oakland, CA 94607, (510) 987-0096.
WATER QUALITY AWARENESS IN URBAN ENVIRONMENTS
INDEPENDENT ACTIVITY: Water Quality Poster/Game/Collage/Music Project
[1]
Objective: Youth will create a poster, collage, game, or song about how they can improve water quality in their homes or communities. The idea behind this project is to have the youth exhibit the knowledge they have gained through the previous water quality activities. Use the following information as resources to help you learn about water quality at home and in your community:
A. Find books in the library about water quality. B. Use the following web sites (look for others, too!) to help learn more about water
quality.
http://www.epa.gov/ogwdw/kids/index.html http://ga.water.usgs.gov/edu/
http://www.njawwa.org/kidsweb/waterfacts/waterfacts.htm
http://www.kidzone.ws/water/ http://ga.water.usgs.gov/edu/waterquality.html http://www.metrokc.gov/DNR/kidsweb/water_main.htm http://www.swfwmd.state.fl.us/education/kids/watermonitoring/
2. Take notes from the resources about how water is used in your home and in your community
and how its use affects water quality. Use the organizational chart provided to record your notes.
3. Create your poster, collage, game, or song based on the information you have learned.
4. Once completed, have the youth share their poster, collage, game, or song with the entire group.
Water Quality Poster/Game/Collage/Music Project
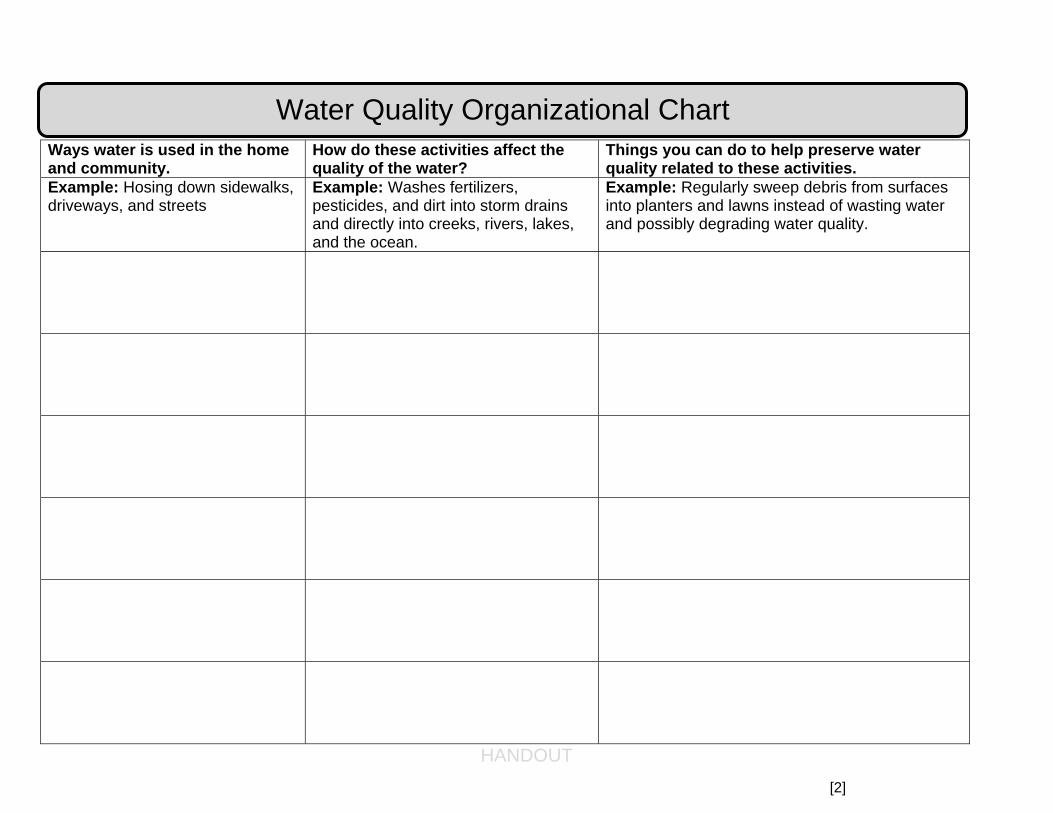
[2]
Ways water is used in the home and community.
How do these activities affect the quality of the water?
Things you can do to help preserve water quality related to these activities.
Example: Hosing down sidewalks, driveways, and streets
Example: Washes fertilizers, pesticides, and dirt into storm drains and directly into creeks, rivers, lakes, and the ocean.
Example: Regularly sweep debris from surfaces into planters and lawns instead of wasting water and possibly degrading water quality.
HANDOUT
Water Quality Organizational Chart
WATER QUALITY AWARENESS IN URBAN ENVIRONMENTS
FIELD ACTIVITY:
Monitoring the Water Quality in Your Watershed
4H SET: WATER QUALITY AWARENESS IN URBAN ENVIRONMENTS – Field Activity [1]
Adapted from Earth Force/Green’s Standard Water Monitoring Kit Manual in partnership with LaMotte Company
STEP 1: ESTABLISH A MONITORING LOCATION IN YOUR WATERSHED
IDENTIFY YOUR WATERSHED
Obtain a map of your watershed. Maps can be obtained from your library, local soil conservation district, county planning and zoning office, city or county courthouse, or state environmental agency. Orange County Watershed and Coastal Resources’ web site (www.ocwatershed.com) is an excellent resource to help you identify and explore your watershed. Actual aerial, drainage, and land use maps are available on the web site for review.
1. Locate a potential water sampling location(s) on a map (watershed map, road map, etc...)
2. Visit the location(s) and if suitable for sampling, mark the water sampling location on the map taking note of any other useful reference points (a school, park, bridge, etc...).
3. Attempt to identify the sources of the water and any upstream sources of contamination. Note these sources and any other contributing factors you think are important to the quality of the water.
a. Locate natural features of your watershed including hills, wetlands, etc.
b. Locate major land-use areas contributing water to your sampling location including industrial areas, agricultural areas and residential areas. In some cases it may only be one land use or it may be many.
CREATE A LIST OF GOALS
• Educational – students will: o plan, implement and analyze a scientific investigation; o develop field and laboratory skills necessary for water quality testing; o compile and compare water quality data.
• Community – students will: o develop an awareness and responsibility to their watershed as an
individual and as a community; o communicate findings and the results of their actions to the community.
FIELD ACTIVITY: MONITORING THE WATER QUALITY IN YOUR WATERSHED
4H SET: WATER QUALITY AWARENESS IN URBAN ENVIRONMENTS – Field Activity [2]
• Environmental – students will: o become familiar with their watershed; o learn to recognize water quality problems and their sources; o understand relationships between land use and water quality; o make a responsible, action-oriented contribution toward protecting their
watershed.
STEP 2: DESIGN A MONITORING PLAN
PLANNING A STUDY
• Chose a type of study. o Look at your watershed map. o Choose a study that will accomplish your goals.
• Site Comparison Study o Test two sampling sites, one above and one below a specific
land-use to determine if changes in water quality can be attributed to that land-use.
o Coordinate with other groups to sample a larger watershed allowing for data to be compared between sites.
• Water Quality Standards Study o Test one or more sampling sites to compare your results to
local, state, or federal standards.
• Chose the tests. You can explore chemical and physical characteristics of the watershed. The tests you choose to perform will be based on your study.
• Kit includes: o Dissolved Oxygen o Nitrate o pH o Phosphate o Temperature o Turbidity o BOD (N/A) o Benthic Macro invertebrate (N/A)
• Make water sampling schedule o Number of sites o Frequency of sampling o Number of test factors o Weather conditions o Individuals assigned to each sampling site
4H SET: WATER QUALITY AWARENESS IN URBAN ENVIRONMENTS – Field Activity [3]
STEP 3: CONDUCT THE STUDY
SITE ANALYSIS (Conducted at the Sampling Site)
• Guidelines for Sampling: o Safety in Sampling
Wear rubber gloves and appropriate shoes (closed toe, rubber or waffle bottom such as athletic shoes or boots).
Wear safety goggles. Avoid sampling from high traffic areas. Sites with steep banks or
heavy brush should also be avoided. o Safety in Running Tests
Read the safety information on the label of each module. These labels provide very specific first aid and chemical information.
Understand the danger of treating reagents casually or endangering others through “horseplay”.
Wear safety goggles particularly when performing water quality tests that require shaking a chemical mixture.
Wash hands after performing water quality tests. Avoid placing hands in contact with eyes or mouth during monitoring.
Ensure a safe monitoring experience by using the following: • Safety goggles for each student • Clean pail or bucket for washing hands • Jug of clean water for washing hands • Soap (biodegradable if possible) • Towels • Waster container for chemical waste
o All reacted samples can be disposed of by flushing down the drain with excess water. While in the field, reacted samples can be poured into a waste container for later disposal.
• Plastic gloves • Eye wash bottle • First aid kit
• Guidelines for Collecting a Water Sample: o Collecting Samples
Wear protective gloves. Remove the cap of the sampling container. Rinse the container 2-3 times with the river water. Hold the container near its base and plunge it (opening downward)
below the surface of the water. Turn the submerged container into the flow and away from you.
4H SET: WATER QUALITY AWARENESS IN URBAN ENVIRONMENTS – Field Activity [4]
Allow the water to flow into the container until full. Cap the container while it is still submerged. Remove the full container from the water. Repeat procedure for replicate water samples.
o Evaluate land use Observe the surrounding area. Note characteristics of geological and physical features of your
sampling site (homes, streets, vegetation, animals, etc.). Note any additional contributions to sampling site (pipes, upstream
runoff/irrigation, storm channels, etc.). Note the direction the water is flowing. Repeat for each sampling site.
o Evaluate water odor Odor in water may be caused by
Decaying plants and algae; Sewage; Industrial, agricultural, domestic, or urban wastes; Soil run-off.
PROCEDURE:
1. Collect the water sample in a large mouthed container. 2. Use your hand to wave the air above the water sample toward you. 3. Use the table below to describe what you smell. 4. Record the type and intensity (faint, distinct, or strong) of the water odor on the
data sheet.
ODORS IN WATER POTENTIAL POLLUTANTS AND SOURCES Sulfur (rotten egg): May indicate organic pollution, such as domestic or industrial
wastes. Musky: May indicate presence of sewage discharge, livestock waste,
decaying algae, or decomposition of other organic material. Harsh: May indicate the presence of industrial or pesticide pollution. Chlorine: May indicate the presence of over-chlorinated effluent from a
sewage treatment facility or a chemical industry. No unusual smell: Not necessarily an indicator of clean water. Many pesticides
and herbicides from agricultural and urban run-off are colorless and odorless, as are many chemicals discharge by industry.
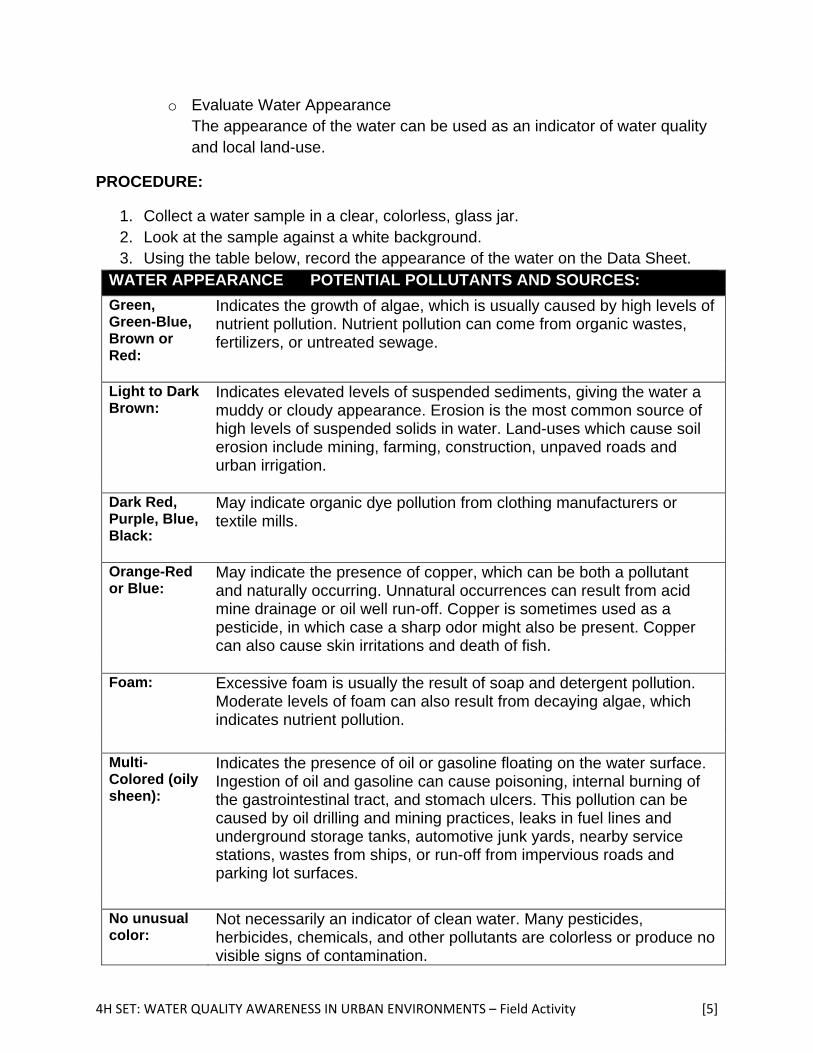
4H SET: WATER QUALITY AWARENESS IN URBAN ENVIRONMENTS – Field Activity [5]
o Evaluate Water Appearance The appearance of the water can be used as an indicator of water quality and local land-use.
PROCEDURE:
1. Collect a water sample in a clear, colorless, glass jar. 2. Look at the sample against a white background. 3. Using the table below, record the appearance of the water on the Data Sheet.
WATER APPEARANCE POTENTIAL POLLUTANTS AND SOURCES: Green, Green-Blue, Brown or Red:
Indicates the growth of algae, which is usually caused by high levels of nutrient pollution. Nutrient pollution can come from organic wastes, fertilizers, or untreated sewage.
Light to Dark Brown:
Indicates elevated levels of suspended sediments, giving the water a muddy or cloudy appearance. Erosion is the most common source of high levels of suspended solids in water. Land-uses which cause soil erosion include mining, farming, construction, unpaved roads and urban irrigation.
Dark Red, Purple, Blue, Black:
May indicate organic dye pollution from clothing manufacturers or textile mills.
Orange-Red or Blue:
May indicate the presence of copper, which can be both a pollutant and naturally occurring. Unnatural occurrences can result from acid mine drainage or oil well run-off. Copper is sometimes used as a pesticide, in which case a sharp odor might also be present. Copper can also cause skin irritations and death of fish.
Foam: Excessive foam is usually the result of soap and detergent pollution.
Moderate levels of foam can also result from decaying algae, which indicates nutrient pollution.
Multi-Colored (oily sheen):
Indicates the presence of oil or gasoline floating on the water surface. Ingestion of oil and gasoline can cause poisoning, internal burning of the gastrointestinal tract, and stomach ulcers. This pollution can be caused by oil drilling and mining practices, leaks in fuel lines and underground storage tanks, automotive junk yards, nearby service stations, wastes from ships, or run-off from impervious roads and parking lot surfaces.
No unusual color:
Not necessarily an indicator of clean water. Many pesticides, herbicides, chemicals, and other pollutants are colorless or produce no visible signs of contamination.
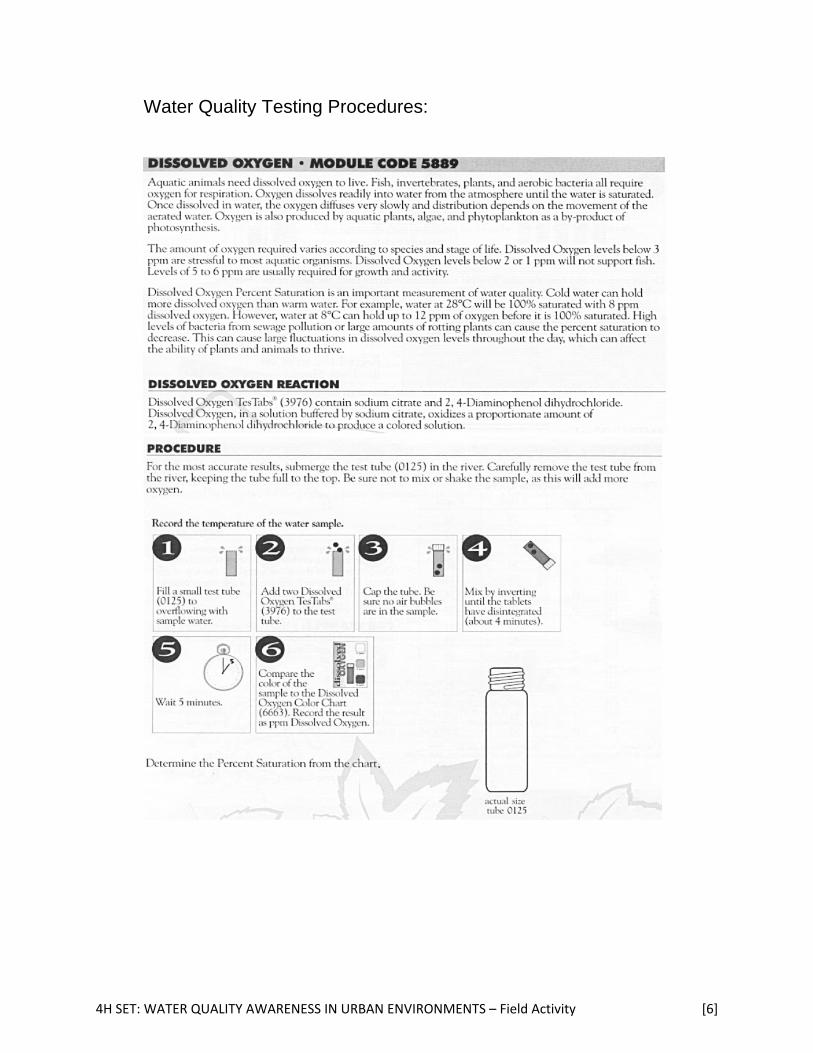
4H SET: WATER QUALITY AWARENESS IN URBAN ENVIRONMENTS – Field Activity [6]
Water Quality Testing Procedures:
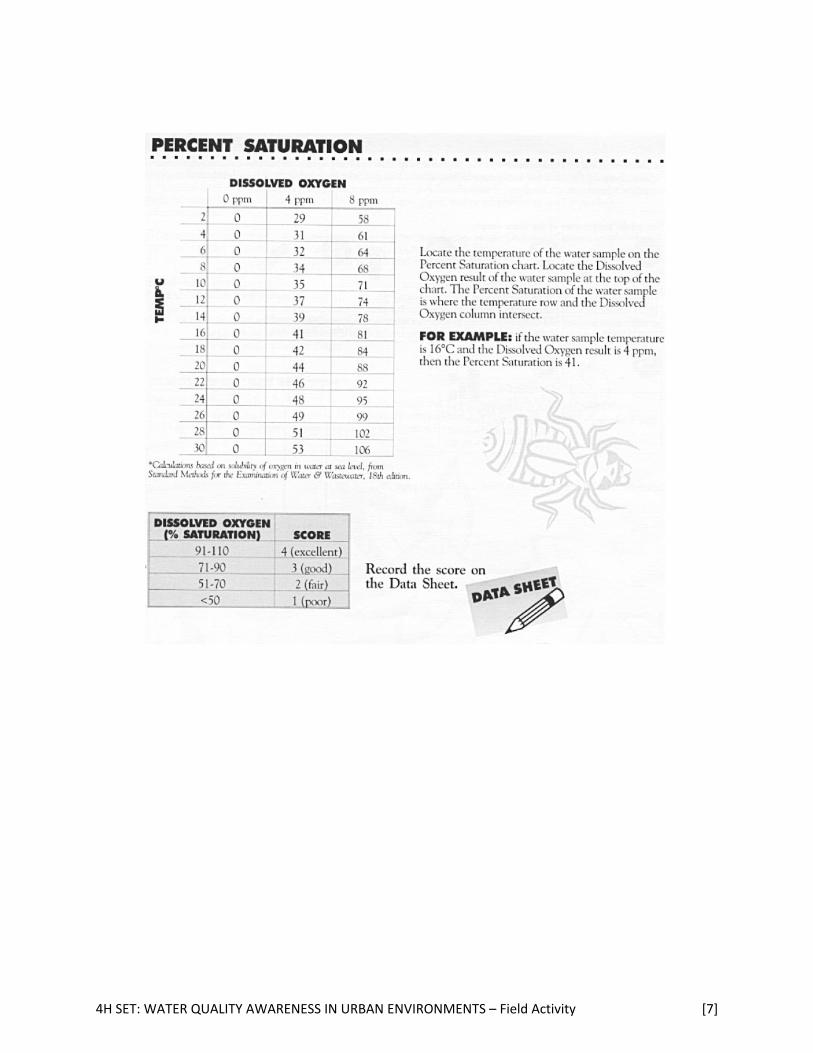
4H SET: WATER QUALITY AWARENESS IN URBAN ENVIRONMENTS – Field Activity [7]
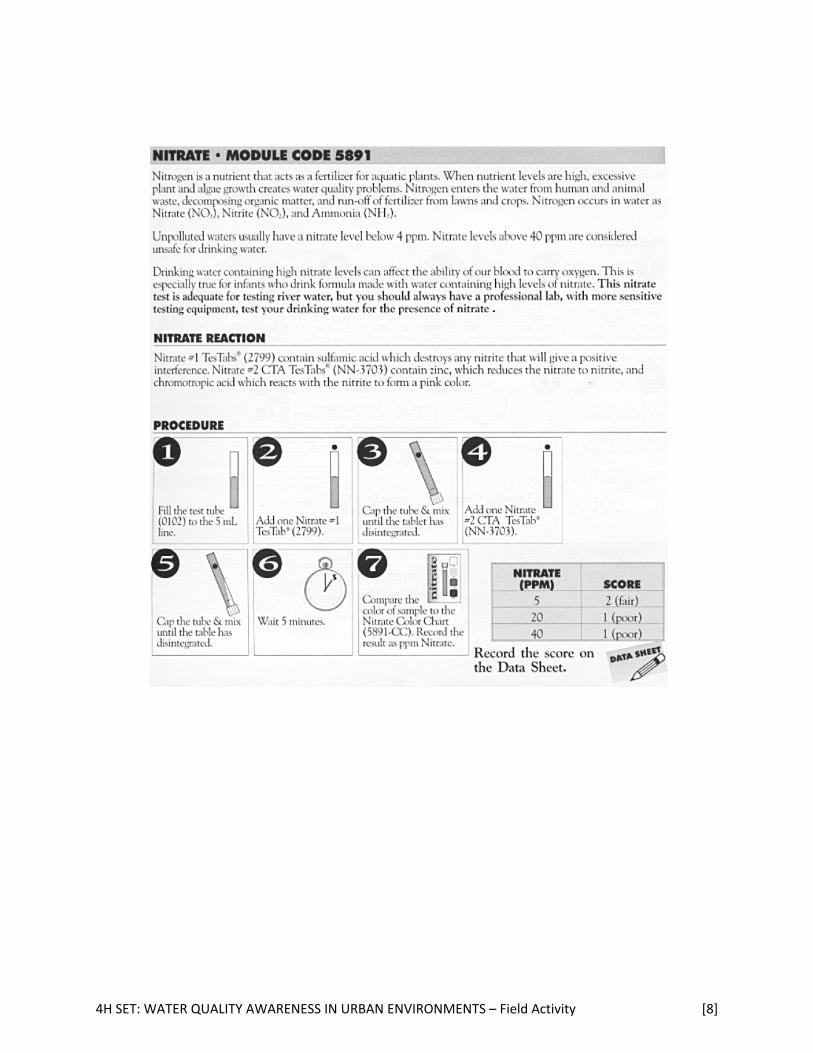
4H SET: WATER QUALITY AWARENESS IN URBAN ENVIRONMENTS – Field Activity [8]
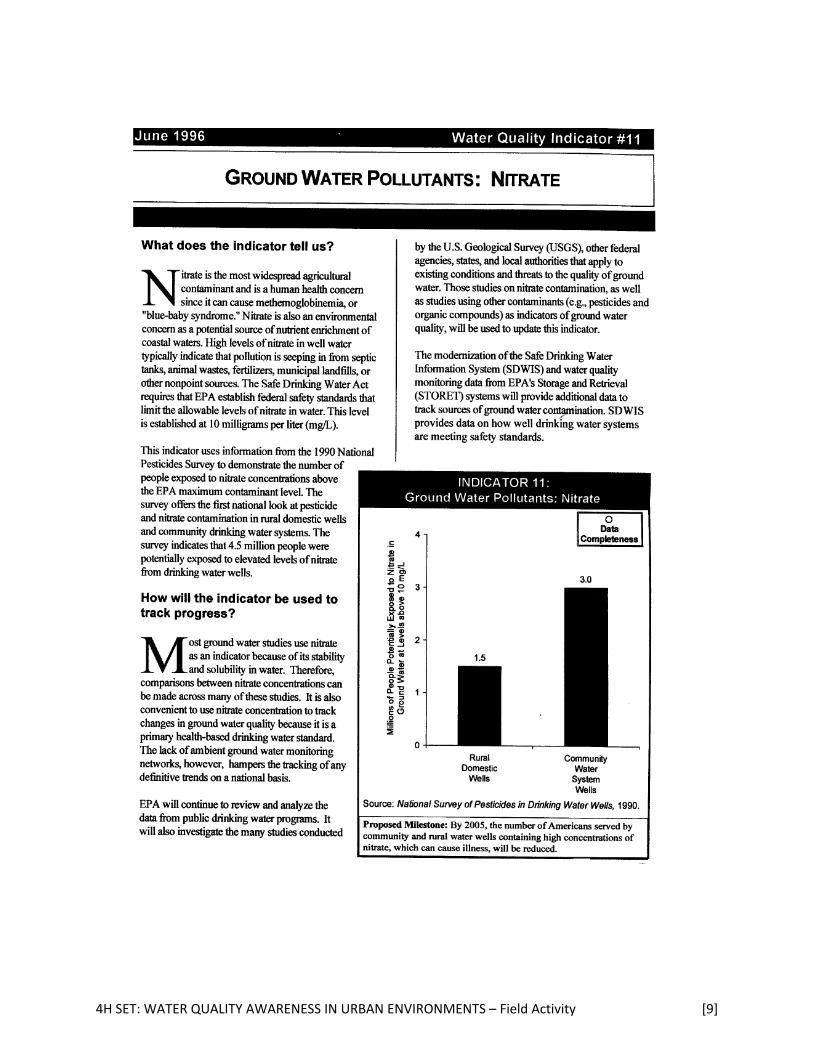
4H SET: WATER QUALITY AWARENESS IN URBAN ENVIRONMENTS – Field Activity [9]
4H SET: WATER QUALITY AWARENESS IN URBAN ENVIRONMENTS – Field Activity [10]
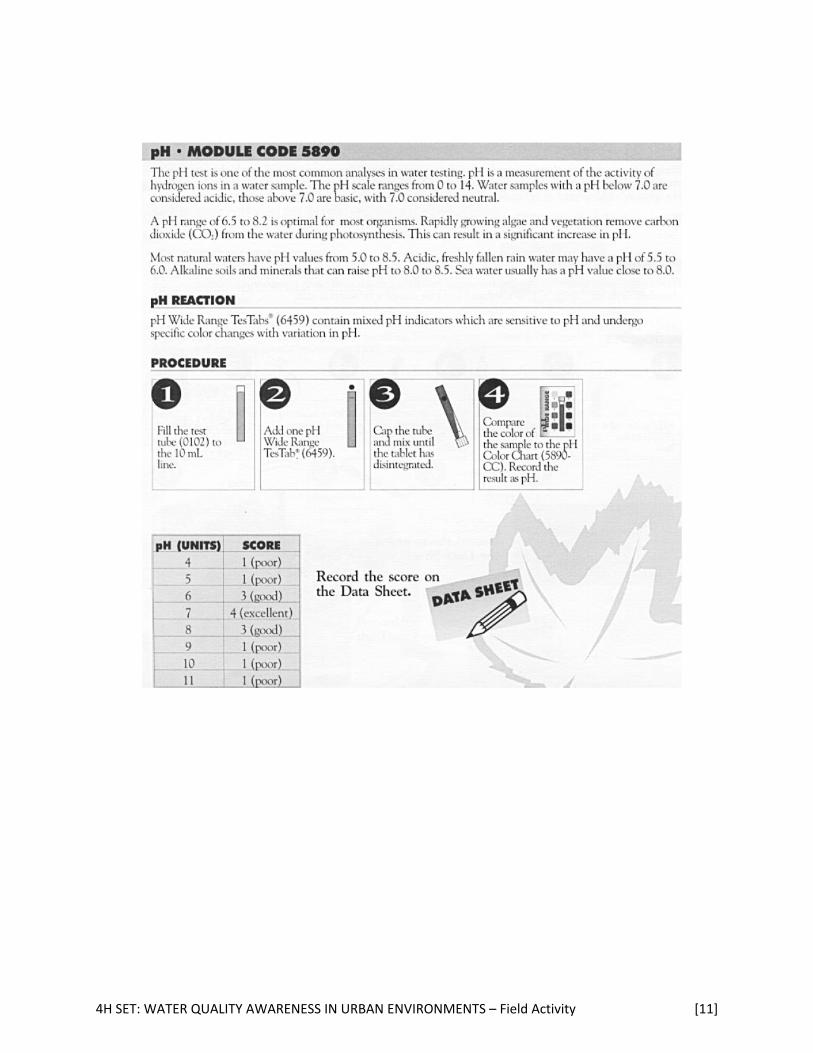
4H SET: WATER QUALITY AWARENESS IN URBAN ENVIRONMENTS – Field Activity [11]
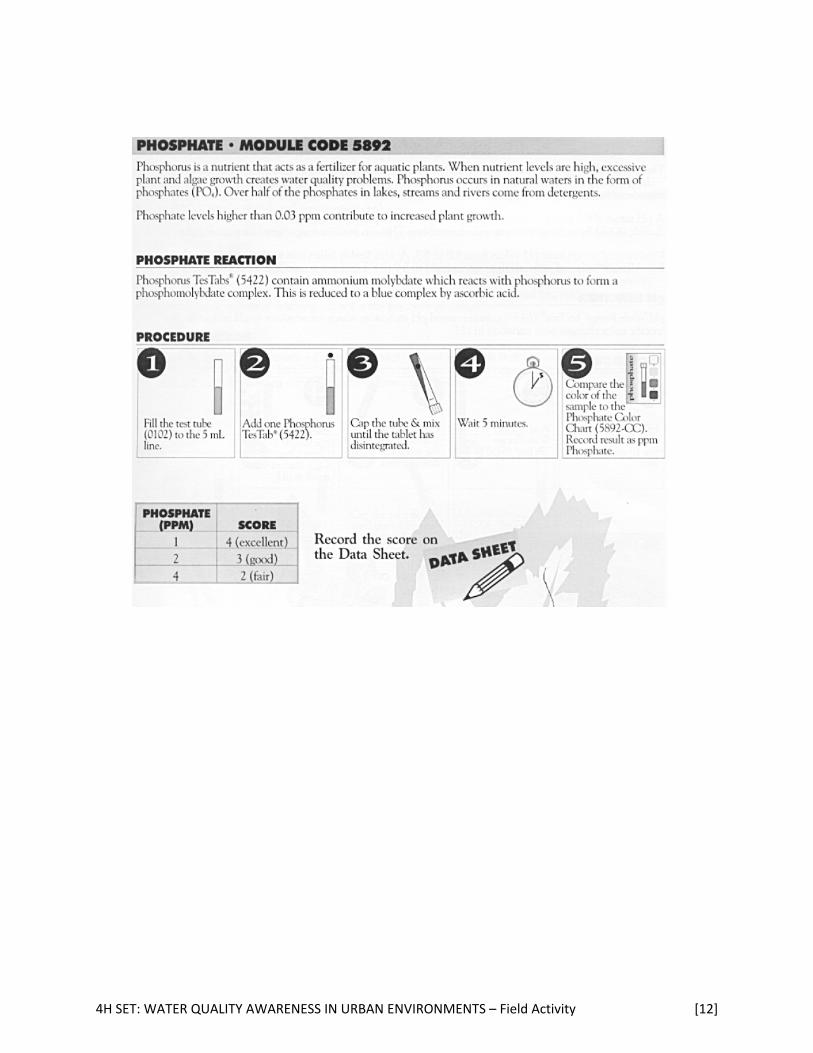
4H SET: WATER QUALITY AWARENESS IN URBAN ENVIRONMENTS – Field Activity [12]
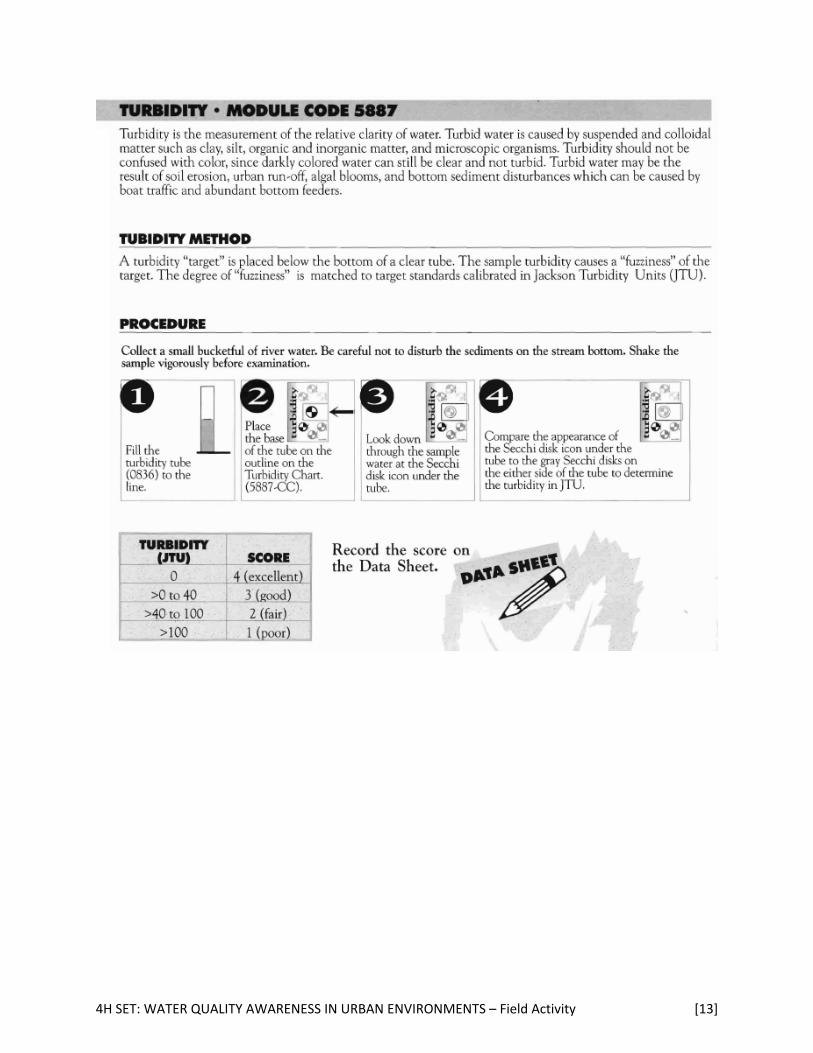
4H SET: WATER QUALITY AWARENESS IN URBAN ENVIRONMENTS – Field Activity [13]
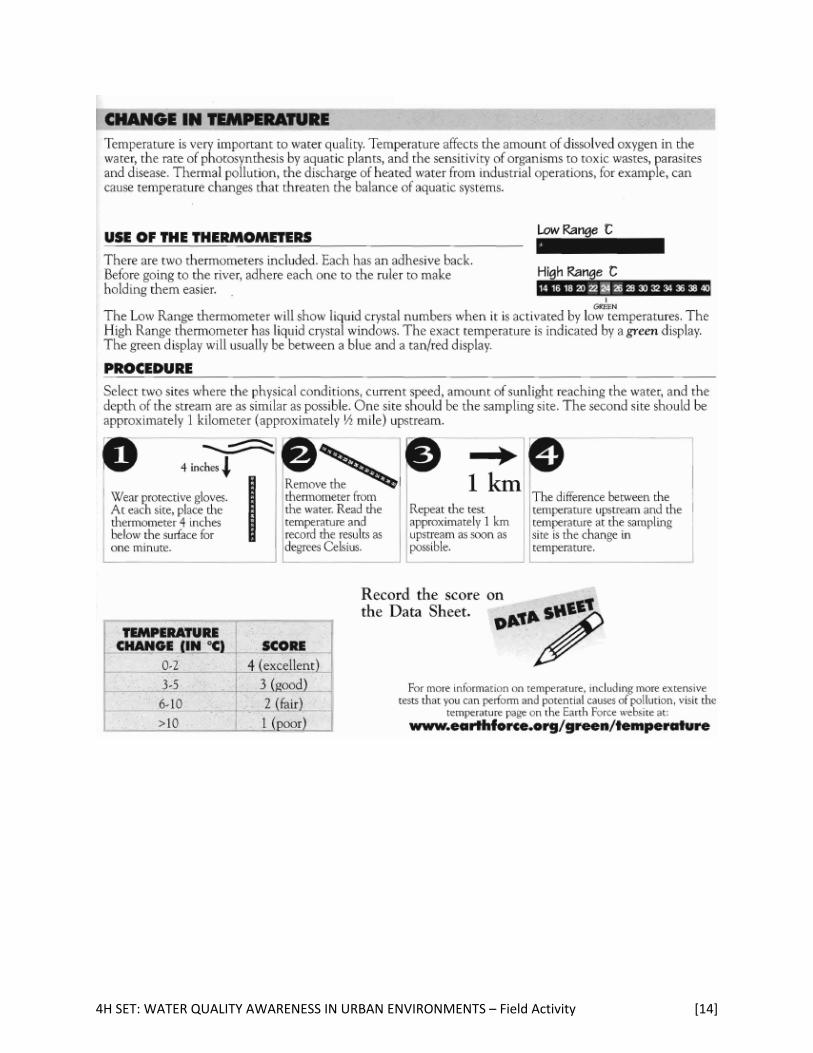
4H SET: WATER QUALITY AWARENESS IN URBAN ENVIRONMENTS – Field Activity [14]
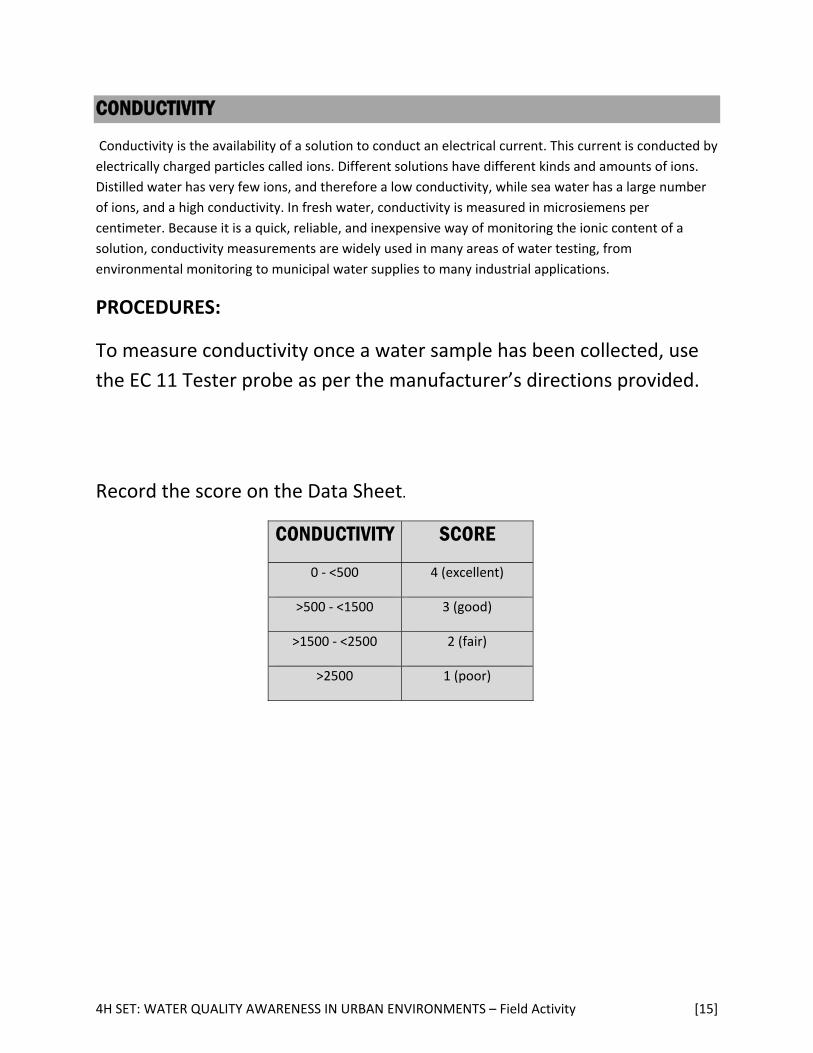
4H SET: WATER QUALITY AWARENESS IN URBAN ENVIRONMENTS – Field Activity [15]
CONDUCTIVITY
Conductivity is the availability of a solution to conduct an electrical current. This current is conducted by electrically charged particles called ions. Different solutions have different kinds and amounts of ions. Distilled water has very few ions, and therefore a low conductivity, while sea water has a large number of ions, and a high conductivity. In fresh water, conductivity is measured in microsiemens per centimeter. Because it is a quick, reliable, and inexpensive way of monitoring the ionic content of a solution, conductivity measurements are widely used in many areas of water testing, from environmental monitoring to municipal water supplies to many industrial applications.
PROCEDURES:
To measure conductivity once a water sample has been collected, use the EC 11 Tester probe as per the manufacturer’s directions provided.
Record the score on the Data Sheet.
CONDUCTIVITY SCORE
0 ‐ <500 4 (excellent)
>500 ‐ <1500 3 (good)
>1500 ‐ <2500 2 (fair)
>2500 1 (poor)
4H SET: WATER QUALITY AWARENESS IN URBAN ENVIRONMENTS – Field Activity [16]
STEP 4: ANALYZE DATA
SUMMARIZE DATA
Copy the individual results from each field data sheet into a single summary table.
DRAW CONCLUSIONS
Using the summary table and the site evaluation notes answer the following questions:
1. Was there any pattern to the differences in the test results? Explain.
2. Did the test results seem to correspond to land use? Explain.
3. Do the results indicate important water quality issues facing your community and the entire watershed? Explain.
4. What new questions are raised by your water quality study? Consider which of these questions you might want to investigate further.
STEP 5: TAKE ACTION
IDENTIFY THE PROBLEM
• From the data collected, create a list of water quality problems that have been identified. Choose the problem that you would like to help resolve.
Example: Elevated nitrate levels were detected at two water sampling sites in your neighborhood. This can indicate improper fertilizer use.
DEFINE THE PROBLEM
• Define the problem in terms of who or what it affects. This will direct your and should be developed carefully. Large problems can be complicated and you may have to concentrate on resolving only one part of the problem.
Example: Improper fertilizer use affects the water quality and health of the watershed, and availability of clean water for recreation and other uses.
CREATE A PLAN TO HELP SOLVE THE PROBLEM
• List Actions you can take. Actions can take multiple forms, so it is important to consider many possibilities. For each example consider a community partner.
4H SET: WATER QUALITY AWARENESS IN URBAN ENVIRONMENTS – Field Activity [17]
Examples include:
o Education Send letters to a local or regional newspaper. Educate others – give presentations on the problem. Make school announcements.
o Direct Action Clean debris around storm drains or watershed. Make personal changes in lifestyle
(Learn about responsible garden chemical use and disposal.) o Political Action
Speak at a public meeting (city council, Homeowners Association, etc.)
Write letters to public officials (or visit in person) Invite public officials to speak at your school or in your
neighborhood.
CREATE AN ACTION PLAN
Narrow the list of actions down to one or two that can help you solve the problem.
The actions should be:
• Practical • Simple • Inclusive of community • Completed within a designated time frame • Achievable with available information
IMPLEMENT THE ACTION PLAN
Keep an ongoing log to monitor progress.
4H SET: WATER QUALITY AWARENESS IN URBAN ENVIRONMENTS – Field Activity [18]
STEP 6: EVALUATE THE WATER SAMPLING STUDY
The evaluation of the study will help identify your successes, improve future studies, and share your accomplishments with your community. Refer to the goals in Step 1 to assist you with the evaluation process.
Answer the following questions:
1. What were the goals of your water quality study?
2. Did your study design enable you to meet all the goals of your study? Explain.
3. Was your action plan successful? How?
4. What did you accomplish that was not a goal?
4H SET: WATER QUALITY AWARENESS IN URBAN ENVIRONMENTS – Field Activity [19]
VOCABULARY
Dissolved oxygen (D.O.) - The amount of oxygen dissolved in water. Eutrophication - The enrichment of water with nutrients, usually
phosphorous and nitrogen, which stimulates the growth of algal blloms and rooted aquatic vegetation.
Impounded - A body of water that is confined, as if in a reservoir. Nitrate - One form of nitrogen that plants can take up through
their roots and use for growth. Nonpoint source Pollution - Pollution whose sources cannot be traced to a single
point and reach water bodies in runoff. Organic - A living plant or animal containing carbon compounds. pH - A measure of the acidity or alkalinity of a solution. Phosphate - An important nutrient for plants to grow and for the
metabolic reactions of plants and animals. Photosynthesis - A process by which chlorophyll-containing cells in
green plants converts light to chemical energy and synthesize organic compounds from inorganic compounds.
Phytoplankton - Microscopic, photosynthetic floating aquatic plants. Point Source Pollution - Pollution that has discrete discharges, usually from a
pipe or outfall. Turbidity - A measure of the clarity of water. Watershed - The catchment basin or drainage area (both below
and above ground) of an entire water system.
4H SET: WATER QUALITY AWARENESS IN URBAN ENVIRONMENTS – Field Activity [20]
References:
The University of California prohibits discrimination or harassment of any person on the basis of race, color, national origin, religion, sex, gender identity, pregnancy (including childbirth, and medical conditions related to pregnancy or childbirth), physical or mental disability, medical condition (cancer‐related or genetic characteristics), ancestry, marital status, age, sexual orientation, citizenship, or service in the uniformed services (as defined by the Uniformed Services Employment and Reemployment Rights Act of 1994: service in the uniformed services includes membership, application for membership, performance of service, application for service, or obligation for service in the uniformed services) in any of its programs or activities.
University policy also prohibits reprisal or retaliation against any person in any of its programs or activities for making a complaint of discrimination or sexual harassment or for using or participating in the investigation or resolution process of any such complaint.
University policy is intended to be consistent with the provisions of applicable State and Federal laws.
Inquiries regarding the University’s nondiscrimination policies may be directed to the Affirmative Action/Equal Opportunity Director, University of California, Agriculture and Natural Resources, 1111 Franklin Street, 6th Floor, Oakland, CA 94607, (510) 987‐0096.
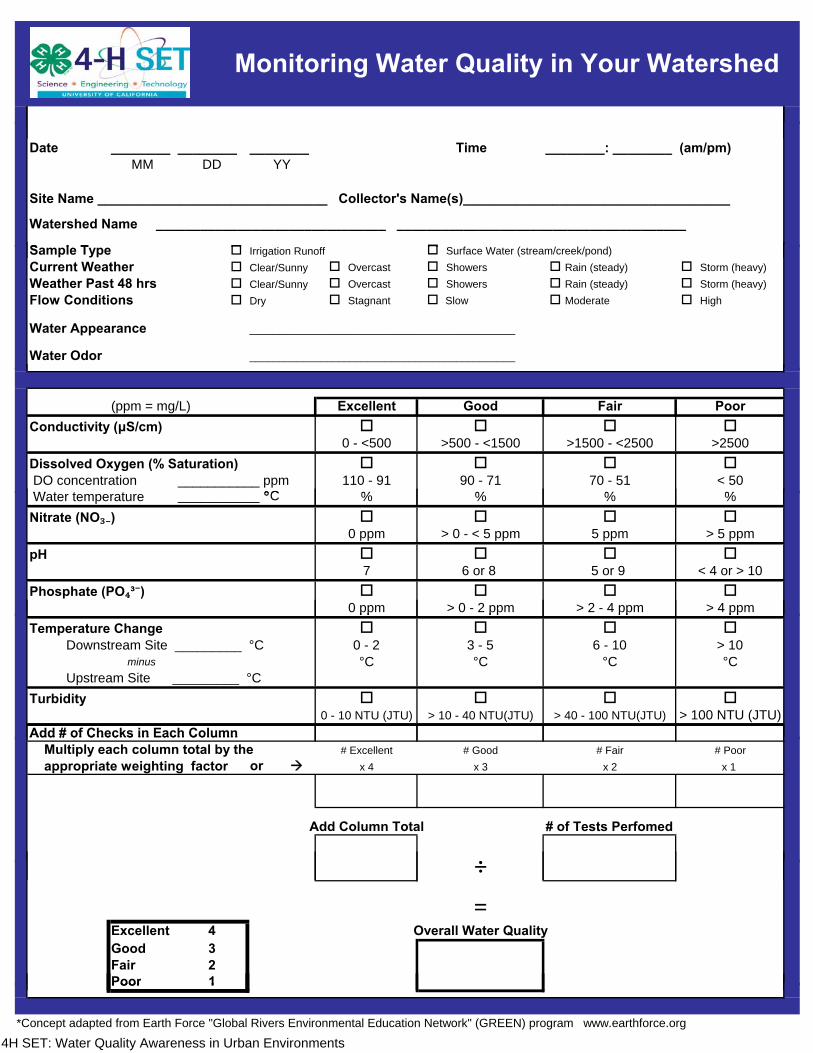
Monitoring Water Quality in Your Watershed
Date ________ ________ ________ Time ________: ________ (am/pm)MM DD YY
S l T ff S f W t ( t / k/ d)
Site Name _______________________________ Collector's Name(s)____________________________________
Watershed Name _______________________________ _______________________________________
Sample Type Irrigation Runoff Surface Water (stream/creek/pond)Current Weather Clear/Sunny Overcast Showers Rain (steady) Storm (heavy)Weather Past 48 hrs Clear/Sunny Overcast Showers Rain (steady) Storm (heavy)Flow Conditions Dry Stagnant Slow Moderate High
Water Appearance _____________________________________________
Water Odor _____________________________________________
(ppm = mg/L) Excellent Good Fair PoorConductivity (μS/cm)
0 - <500 >500 - <1500 >1500 - <2500 >2500Dissolved Oxygen (% Saturation) DO concentration ___________ ppm 110 - 91 90 - 71 70 - 51 < 50W t t t °C % % % % Water temperature ___________ °C % % % %Nitrate (NO₃₋)
0 ppm > 0 - < 5 ppm 5 ppm > 5 ppmpH
7 6 or 8 5 or 9 < 4 or > 10Phosphate (PO₄³⁻)
0 ppm > 0 - 2 ppm > 2 - 4 ppm > 4 ppmpp pp pp ppTemperature Change Downstream Site _________ °C 0 - 2 3 - 5 6 - 10 > 10
minus °C °C °C °C Upstream Site _________ °C Turbidity
0 - 10 NTU (JTU) > 10 - 40 NTU(JTU) > 40 - 100 NTU(JTU) > 100 NTU (JTU)Add # of Checks in Each ColumnAdd # of Checks in Each Column Multiply each column total by the # Excellent # Good # Fair # Poor appropriate weighting factor or x 4 x 3 x 2 x 1
Add Column Total # of Tests Perfomed
÷÷
=Excellent 4 Overall Water QualityGood 3Fair 2Poor 1Poor 1
*Concept adapted from Earth Force "Global Rivers Environmental Education Network" (GREEN) program www.earthforce.org
4H SET: Water Quality Awareness in Urban Environments
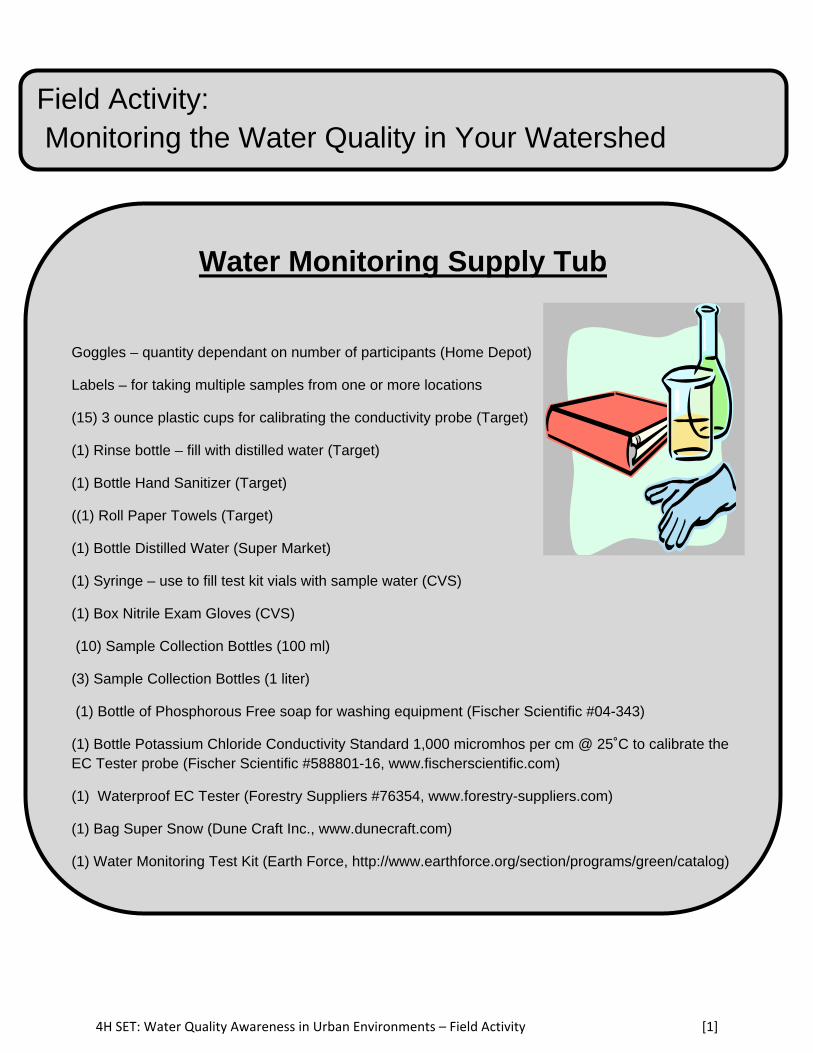
4H SET: Water Quality Awareness in Urban Environments – Field Activity [1]
Water Monitoring Supply Tub
Goggles – quantity dependant on number of participants (Home Depot)
Labels – for taking multiple samples from one or more locations
(15) 3 ounce plastic cups for calibrating the conductivity probe (Target)
(1) Rinse bottle – fill with distilled water (Target)
(1) Bottle Hand Sanitizer (Target)
((1) Roll Paper Towels (Target)
(1) Bottle Distilled Water (Super Market)
(1) Syringe – use to fill test kit vials with sample water (CVS)
(1) Box Nitrile Exam Gloves (CVS)
(10) Sample Collection Bottles (100 ml)
(3) Sample Collection Bottles (1 liter)
(1) Bottle of Phosphorous Free soap for washing equipment (Fischer Scientific #04-343)
(1) Bottle Potassium Chloride Conductivity Standard 1,000 micromhos per cm @ 25˚C to calibrate the EC Tester probe (Fischer Scientific #588801-16, www.fischerscientific.com)
(1) Waterproof EC Tester (Forestry Suppliers #76354, www.forestry-suppliers.com)
(1) Bag Super Snow (Dune Craft Inc., www.dunecraft.com)
(1) Water Monitoring Test Kit (Earth Force, http://www.earthforce.org/section/programs/green/catalog)
Field Activity: Monitoring the Water Quality in Your Watershed
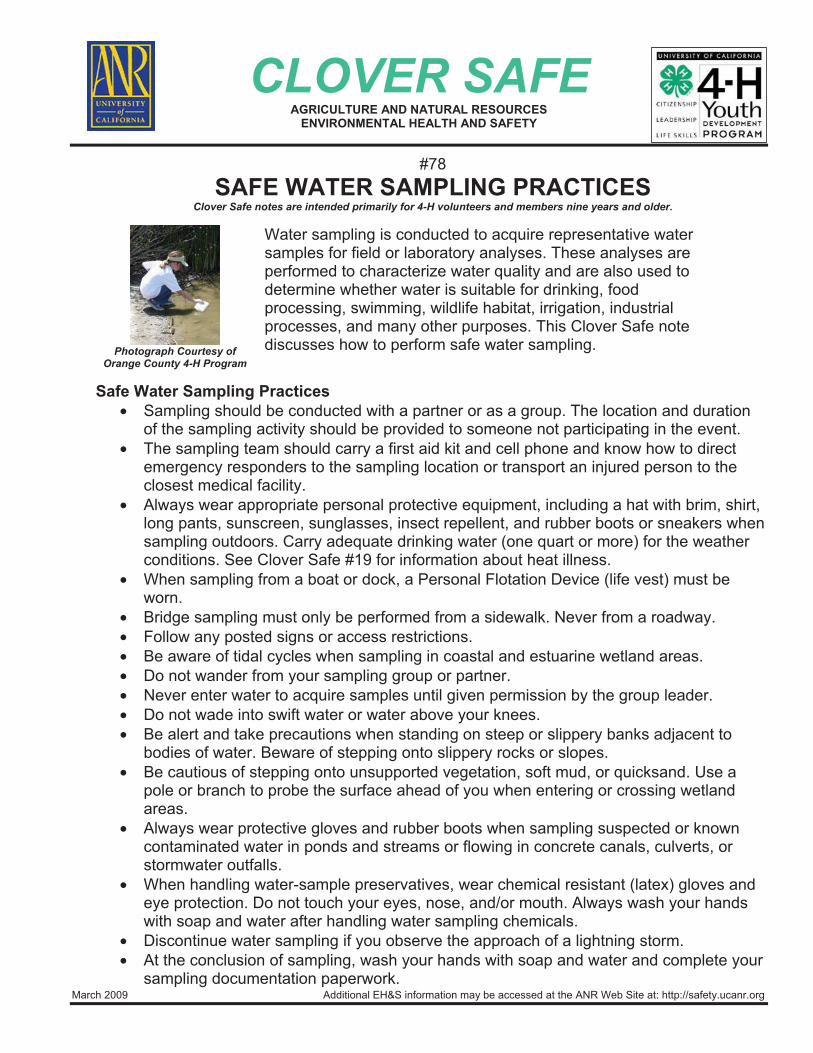
CLOVER SAFEAGRICULTURE AND NATURAL RESOURCES
ENVIRONMENTAL HEALTH AND SAFETY
March 2009 Additional EH&S information may be accessed at the ANR Web Site at: http://safety.ucanr.org
#78SAFE WATER SAMPLING PRACTICES
Clover Safe notes are intended primarily for 4-H volunteers and members nine years and older.
Photograph Courtesy of Orange County 4-H Program
Water sampling is conducted to acquire representative water samples for field or laboratory analyses. These analyses are performed to characterize water quality and are also used to determine whether water is suitable for drinking, food processing, swimming, wildlife habitat, irrigation, industrial processes, and many other purposes. This Clover Safe note discusses how to perform safe water sampling.
Safe Water Sampling Practices• Sampling should be conducted with a partner or as a group. The location and duration
of the sampling activity should be provided to someone not participating in the event. • The sampling team should carry a first aid kit and cell phone and know how to direct
emergency responders to the sampling location or transport an injured person to the closest medical facility.
• Always wear appropriate personal protective equipment, including a hat with brim, shirt, long pants, sunscreen, sunglasses, insect repellent, and rubber boots or sneakers when sampling outdoors. Carry adequate drinking water (one quart or more) for the weather conditions. See Clover Safe #19 for information about heat illness.
• When sampling from a boat or dock, a Personal Flotation Device (life vest) must be worn.
• Bridge sampling must only be performed from a sidewalk. Never from a roadway. • Follow any posted signs or access restrictions. • Be aware of tidal cycles when sampling in coastal and estuarine wetland areas. • Do not wander from your sampling group or partner. • Never enter water to acquire samples until given permission by the group leader. • Do not wade into swift water or water above your knees. • Be alert and take precautions when standing on steep or slippery banks adjacent to
bodies of water. Beware of stepping onto slippery rocks or slopes. • Be cautious of stepping onto unsupported vegetation, soft mud, or quicksand. Use a
pole or branch to probe the surface ahead of you when entering or crossing wetland areas.
• Always wear protective gloves and rubber boots when sampling suspected or known contaminated water in ponds and streams or flowing in concrete canals, culverts, or stormwater outfalls.
• When handling water-sample preservatives, wear chemical resistant (latex) gloves and eye protection. Do not touch your eyes, nose, and/or mouth. Always wash your hands with soap and water after handling water sampling chemicals.
• Discontinue water sampling if you observe the approach of a lightning storm. • At the conclusion of sampling, wash your hands with soap and water and complete your
sampling documentation paperwork.