leptin resistance and obesity in mice with deletion of methyl-cpg-binding protein 2 (mecp2) in...
TRANSCRIPT
ARTICLE
Leptin resistance and obesity in mice with deletionof methyl-CpG-binding protein 2 (MeCP2) in hypothalamicpro-opiomelanocortin (POMC) neurons
Xiaorui Wang & Zsombor Lacza & Yi E. Sun & Weiping Han
Received: 2 July 2013 /Accepted: 13 September 2013 /Published online: 28 September 2013# Springer-Verlag Berlin Heidelberg 2013
AbstractAims/hypothesis Pro-opiomelanocortin (POMC) neurons inthe arcuate nucleus (ARC) regulate energy homeostasis bysecreting α-melanocyte-stimulating hormone (α-MSH), de-rived from POMC precursor, in response to leptin signalling.Expression of Pomc is subject to multiple modes of regula-tion, including epigenetic regulation. Methyl-CpG-bindingprotein 2 (MeCP2), a nuclear protein essential for neuronalfunction, interacts with promoters to influence gene expression.We aim to address whether MeCP2 regulates hypothalamic
Pomc expression and to investigate the role of epigenetics,particularly DNA methylation, in this process.Methods We generated a mouse line with MeCP2 specificallydeleted in POMC neurons (Mecp2flox/y/Pomc -Cre [PKO])and characterised its metabolic phenotypes. We examinedthe DNA methylation pattern of the Pomc promoter and itsimpact on hypothalamic gene expression. We also studied therequirement of MeCP2 for, and the effects of, DNA methyl-ation on Pomc promoter activity using luciferase assays.Results PKO mice are overweight, with increased fat massresulting from increased food intake and respiratory exchangeratio. PKO mice also exhibit elevated plasma leptin. Deletionof MeCP2 in POMC neurons leads to increased DNA methyl-ation of the hypothalamic Pomc promoter and reduced Pomcexpression. Furthermore, in vitro studies show that hyperme-thylation of the Pomc promoter reduces its transcriptionalactivity and reveal a functional synergy between MeCP2 andcAMP responsive element binding protein 1 (CREB1) in pos-itively regulating the Pomc promoter.Conclusions/interpretation Our results demonstrate thatMeCP2 positively regulates Pomc expression in the hypothal-amus. Absence of MeCP2 in POMC neurons leads to in-creased DNA methylation of the Pomc promoter, which, inturn, downregulates Pomc expression, leading to obesity inmice with an accentuating degree of leptin resistance.
Keywords DNAmethylation . Energy homeostasis .
Epigenetic . Leptin resistance . Obesity . Rett syndrome
AbbreviationsAgRP Agouti-related peptideARC Arcuate nucleusA*STAR Agency for Science, Technology and ResearchBMR Basal metabolic rateCLAMS Oxymax/Comprehensive Lab Animal Monitoring
System
Electronic supplementary material The online version of this article(doi:10.1007/s00125-013-3072-0) contains peer-reviewed but uneditedsupplementary material, which is available to authorised users.
X. Wang :W. Han (*)Singapore Bioimaging Consortium, Agency for Science, Technologyand Research (A*STAR), No. 02-02 Helios, 11 Biopolis Way,Singapore 138667, Republic of Singaporee-mail: [email protected]
X. Wang :W. HanDepartment of Biochemistry, Yong Loo Lin School of Medicine,National University of Singapore, Singapore, Republic of Singapore
Z. LaczaDepartment of Human Physiology and Clinical ExperimentalResearch, Semmelweis University, Budapest, Hungary
Y. E. SunDepartment of Molecular and Medical Pharmacology, Universityof California Los Angeles (UCLA), Los Angeles, CA, USA
W. HanInstitute of Molecular and Cell Biology, Agency for Science,Technology and Research (A*STAR), Singapore,Republic of Singapore
W. HanCardiovascular and Metabolic Disorders Program, Duke-NationalUniversity of Singapore Graduate Medical School, Singapore,Republic of Singapore
Diabetologia (2014) 57:236–245DOI 10.1007/s00125-013-3072-0
Co-IP Co-immunoprecipitationCREB1 cAMP responsive element binding protein 15hmC 5-Hydroxymethylcytosine5mC 5-MethylcytosineMeCP2 Methyl-CpG-binding protein 2α-MSH α-Melanocyte-stimulating hormoneNPY Neuropeptide YPOMC Pro-opiomelanocortinPKO Mecp2flox/y/Pomc -CreRER Respiratory exchange ratioRTT Rett syndromeWT Wild type
Introduction
The fundamental cause of overweight and obesity is an energyimbalance, i.e. increased food intake and/or reduced energyexpenditure. The leptin–melanocortin pathway is a key intrin-sic regulator in the maintenance of energy homeostasis [1].Leptin is secreted from adipose tissue and acts on at least twogroups of neurons: POMC neurons, which are activated byleptin to produce anorexigenic POMC; and neuropeptide Y(NPY)/Agouti-related peptide (AgRP) neurons, which pro-duce orexigenic NPY and AgRP and are inhibited by leptinsignalling [2, 3]. Regulation of Pomc expression is critical forenergy homeostasis, as impaired Pomc regulation leads toleptin resistance and obesity [4–6]. Pomc transcription ismainly activated by leptin through the JAK2/STAT3 pathway[7–10]. Deficits in JAK2/STAT3 signalling in POMC neuronsare associated with reduced Pomc expression, leptin resis-tance and obesity [11, 12].
The expression of Pomc is subject to multiple levels ofcontrol. In addition to upstream signalling, such as leptinsignalling, epigenetic modification of the Pomc promotermay also play a significant role in the regulation of its expres-sion. The role and mechanism of leptin signalling in regulatingPomc expression is relatively well understood [13], while theevidence for epigenetic regulation in hypothalamic Pomc ex-pression has just begun to emerge. Embedded in a CpG island,the 5′ promoter of human POMC is methylated in normal non-expressing tissues, and is specifically unmethylated in express-ing tissues, tumours and some cell lines [14]. Changes in peri-conceptional or perinatal environment can change DNAmeth-ylation levels of the Pomc promoter, which is associated withobesity in adulthood. Pomc promoter was found to behypomethylated after peri-conceptional undernutrition insheep [15]. Early postnatal overfeeding predisposed the ratsto obesity, and hypothalamic Pomc promoter was found to behypermethylated and its expression was downregulated [16].These studies all indicate that the hypothalamic Pomc promot-er is a key target of perinatal epigenetic programming that leads
to permanent changes in gene expression and increased risk ofobesity.
Methylated DNA is able to recruit methyl-CpG-bindingprotein 2 (MeCP2), which regulates gene expression [17].Mutation of Mecp2 is associated with Rett syndrome (RTT),a neuropsychiatric disorder [18]. MeCP2 has long beenrecognised as a transcriptional repressor that acts by bindingto methylated DNA and recruiting a repressor complex [19,20]. Only recently has it been recognised that MeCP2 in thehypothalamus may function as a transcriptional activatorthrough its interaction with cAMP responsive element bindingprotein 1 (CREB1) in a DNA-methylation-independent man-ner [21]. Many mouse models with mutant or deleted MeCP2have been established to study RTT [18, 22–26]. BesidesRTT-like phenotypes, some of these mouse models share acommon obesity phenotype. Deletion ofMeCP2 in postmitoticneurons, in postnatal CNS, or in Sim1-expressing neurons allresult in an overweight or obese phenotype [22, 25, 26],indicating that MeCP2 in the CNS may play a role in regulat-ing energy homeostasis.
We investigated whether and howMeCP2 could play a rolein the epigenetic regulation of Pomc expression in the hypo-thalamus, and whether and how the epigenetic regulation,especially DNA methylation, could contribute to obesity andleptin resistance, based on knowledge that: (1) α-melanocyte-stimulating hormone (α-MSH), a POMC product, is a keyregulator of energy homeostasis; (2) the Pomc promoter is atarget of epigenetic modification and the changes in DNAmethylation on Pomc promoter are associated with obesity;and (3) MeCP2 is an important player in epigenetic regulationand plays an important role in the hypothalamus as a tran-scriptional regulator.
Methods
Animal welfare All experiments involving animals werereviewed and approved by the Institutional Animal Care andUse Committee of the Agency for Science, Technology andResearch (A*STAR). All mice in this study were housedand bred in the Biological Resource Center (A*STAR) on a12 h/12 h light/dark cycle with free access to food and water.
Generation of a mouse line with POMC-neuron-specificdeletion ofMeCP2 Twomouse lines B6.129P2-Mecp2tm1Bird/Jand Tg(Pomc1 -Cre )16Lowl/J were purchased from TheJackson Laboratory (Bar Harbor, ME, USA). The two lineswere crossed to generateMecp2flox/y (control) andMecp2flox/y/Pomc-Cre (PKO). Genotyping primer sequences are shown inelectronic supplementary material (ESM) Table 1.
Body weight and body composition Age-matched littermateswere weighed weekly or biweekly after weaning. Body
Diabetologia (2014) 57:236–245 237

composition was measured using EchoMRI-100 (Echo Med-ical Systems, Houston, TX, USA) as previously described[27].
Animal monitoring Oxymax/Comprehensive Lab AnimalMonitoring System (CLAMS; Columbus Instruments,Columbus, OH, USA) was used to measure oxygenconsumption (V
⋅O2 ), carbon dioxide production (V
⋅CO2 ),
food intake and activity [28]. Paired mice were individuallyhoused in the chambers that were maintained at 24±1°C, andprovided with free access to chow diet and water. All mea-surements were taken every 15 min for 3 consecutive daysafter the mice were acclimatised for 2 days. Respiratory ex-change ratio (RER) was calculated as the ratio of V
⋅CO2 to
V⋅O2 . Basal metabolic rate (BMR) was determined by aver-
aging the lowest plateau region of oxygen consumption curvecorresponding to resting periods. The X-total or Z-total move-ment was the total number of times the motion sensors detect-ed for horizontal or vertical movement, respectively. All datacollected from monitoring over 3 days were used in relevantanalyses.
Plasma leptin measurements Mice were fasted for 2 h beforeblood collection. Blood samples were collected intoMicrovette blood collection tubes (Kent Scientific Coopera-tion, Torrington, CT, USA) and cleared by centrifugation at10,000 g for 2 min at 4°C. Plasma was collected and used formouse leptin measurement (mouse leptin ELISA, Millipore,Billerica, MA, USA) according to the manufacturer’sinstructions.
Immunohistochemistry Immunohistochemistry was carriedout as previously described with slight modifications [29].Mice were perfused with 4% paraformaldehyde and brainswere dissected and post-fixed at 4°C overnight. After cryo-preservation in 30% sucrose, coronal cryosections (16 μm)containing hypothalamus were cut from the brain blocks andprobed with anti-MeCP2 antibody (1:500; Upstate; cataloguenumber ABE171, Billerica, MA, USA) and anti-POMC pre-cursor (1:500, Phoenix Pharmaceuticals, Burlingame, CA,USA) in blocking buffer (3% goat serum, 3% BSA and0.01% Triton X-100 in PBS) for 48 h at 4°C, followed byincubation with Alexa Fluor 488 goat anti-chicken antibody(1:1,000, Invitrogen, Carlsbad, CA, USA) and Alexa Fluor594 goat anti-rabbit (1:1,000, Invitrogen) for 1 h at roomtemperature. Samples were then subjected to confocal imag-ing using a Nikon A1R+si confocal microscope.
RNA extraction and quantitative PCR Mouse hypothalamuswas dissected into RNAlater (Invitrogen), kept overnight at4°C and then stored at −80°C until required. RNA wasextracted from the hypothalami with RNeasyMini Kit (Qiagen,Duesseldorf, Germany) according to the manufacturer’s
instructions, treated with DNase I (Invitrogen) and reverse-transcribed with RevertAid (Fermentas, Ottawa, ON, Canada).Quantitative PCR was performed using SYBR Green PCRmaster mix (Invitrogen) and primers (see ESM Table 1) onStepOnePlus real-time PCR system (Invitrogen). Samples wereanalysed in triplicate and normalised against Gapdh as aninternal control. Relative changes in gene expression werecalculated by the ΔΔCt method.
DNA extraction and bisulfite sequencing Mouse hypothala-mus was dissected and snap-frozen in liquid nitrogen. Geno-mic DNA was extracted from mouse hypothalami usingDNeasy Blood & Tissue Kit (Qiagen). Sodium bisulfite con-version was carried out using 1–2 μg genomic DNA withEpitect Bisulfite Kits (Qiagen). Sequences for the bisulfitesequencing PCR primers are shown in the ESM. The PCRproducts were purified by gel extraction kit (Qiagen) andligated into pGEM-T Easy vector (Promega, Madison, WI,USA). PCR products were sequenced for the Pomc promoterregion and at least 15 positive clones were analysed.
DNA plasmids The Pomc promoter–luciferase construct(pGL3-Pomc) was a generous gift from D. Accili (ColumbiaUniversity, New York, NY, USA). pCMV-SPORT6-CREB1was purchased from Open Biosystem (catalogue numberMMM1013-64862). Myc-tagged CREB1 was generated byPCR and subcloned into pCMV5-Myc at EcoRI and BamHIsites. The primer sequences are shown in ESM Table 1. Togenerate glutathione S-transferase (GST)-CREB1, pCMV-Myc-CREB1 was digested with EcoRI and BamHI, andsubcloned into the EcoRI and XhoI sites of pGEX-KG.
Methyltransferase treatment Plasmid pGL3-Pomc was treatedwith different methyltransferases targeting CpGs of vary-ing sequences, including MSssI (CG), HpaII (CCGG)and HhaI (GCGC) (New England BioLabs, Ipswich, MA,USA), according to the manufacturer’s instructions.Methyltransferase-treated DNA preparations were then puri-fied using a PCR purification kit (Qiagen) and used fortransfection.
Luciferase assay The luciferase assay was done as previouslydescribed [30]. Briefly, HEK293T cells were transfected withrelevant plasmids using FuGENE6 (Roche, Basel, Switzerland).After 2 days, transfected cells were washed with PBS, lysed in200μl passive lysis buffer (Promega) and subjected to luciferaseactivity measurement on a luminometer (Molecular Devices,SpectraMax L, Sunnyvale, CA, USA). The firefly luciferaseactivity was normalised against Renilla luciferase activity.
Co-immunoprecipitation HEK293T cells were transfectedwith MeCP2 (wild type [WT] or R106W) or Myc-CREB1using the calcium phosphate transfection method. At 2 days
238 Diabetologia (2014) 57:236–245

after transfection, whole-cell lysates were prepared as previ-ously described [30] and used for co-immunoprecipitation(Co-IP). From the mixture 1 mg was incubated with anti-Flag M2 affinity gel (Sigma-Aldrich, Munich, Germany),EZview Red c-Myc-Agarose (Sigma-Aldrich) or controlIgG, respectively, overnight at 4°C. The immunoprecipitateswere washed extensively, resuspended in ×2 sample bufferand subjected to SDS-PAGE followed by immunoblottingwith Flag (Sigma-Aldrich) or Myc (Santa Cruz, CA, USA)antibodies. From the total cell volume, 2% was used as input.
GST-CREB1 protein expression, purification and pulldown BL21 bacterial cells were transformed to expressGST-CREB1 or GST. Fusion proteins were purified usingglutathione–Sepharose-4B beads (Amersham, Buckingham-shire, UK) according to the manufacturer’s instructions. Asfor GST-pull-down assay, protein-coupled glutathione beadswere incubated with 500 μg respective total cell lysate ofFlag-MeCP2-transfected HEK293 cells for 1 h at 4°C inTNET buffer (50 mmol/l Tris-Cl, pH 7.4, 150 mmol/l NaCl,1 mmol/l EDTA, 1% TritonX-100). The beads were washedin TNET buffer, resolved by SDS-PAGE and immunoblottedwith Flag (Sigma-Aldrich) or CREB1 (Novus biological,Littleton, CO, USA) antibodies.
Statistical analysis Data were presented as means ± SEM.Statistics was performed by using two-tailed Student’s t testor one-way ANOVA followed by Tukey’s post hoc test. Thesignificance limit was set at p <0.05.
Results
Specific deletion of MeCP2 in POMC neurons MeCP2 wasdeleted specifically in POMC neurons by crossing the mice inwhich exons 3 and 4 ofMecp2 were flanked by two loxP sites[18] and mice with Cre driven by Pomc1 [31–34] (Fig. 1a).MaleMecp2flox/y (control) andMecp2flox/y/Pomc -Cre (PKO)mice were used for experiments (Fig. 1b). Selective deletionof MeCP2 in POMC neurons was validated by immunohis-tochemistry for both MeCP2 and POMC precursor. As shownin Fig. 1c, at the ARC region where POMC neurons wereconcentrated, POMC precursor was distributed in the cyto-plasm while MeCP2 was restricted to the nucleus. MeCP2was present in the nuclei of POMC neurons of the controlmouse but not in those of the PKO mouse, confirming thespecific deletion of MeCP2 in POMC neurons.
Increased body weight and fat mass and development of leptinresistance in PKO mice Given that POMC neurons regulatefood intake and energy expenditure, we first assessed the rolesof MeCP2 in these processes by monitoring the body weight
of the mice. The PKO mice had higher body weights startingfrom the age of 4months (Fig. 2a). Body composition analysisshowed that the PKOmice had higher fat mass compared withcontrols from the age of 4 months. At 8 months of age, thePKO mice continued to show increased fat mass; however,they exhibited decreased lean mass as a percentage of bodyweight (Fig. 2b, c), suggesting that body weight gain in thePKOmice was mainly due to increased adiposity. To examinethe relative contribution of increased food intake and de-creased energy expenditure to the observed body weight gain,we performed indirect calorimetry on the PKO and controlmice by using the CLAMS metabolic chambers. The PKOmice had higher food intake and RER when compared withcontrols (Fig. 2d, e), though no difference was observed inoxygen consumption, BMR or physical activities between
1 2 3 4
Pomc-Cre
fl/fl
PKO LoxP
fl/y +/y
Cre
Mec
p2+/
y
Mec
p2fl/
yPo
mc-
Cre
Mec
p2+/
yPo
mc-
Cre
Mec
p2fl/
y
Merged
Ctr
lP
KO
Ctr
lP
KO
a b
c
3V3V3V3V
3V3V3V3V
DAPIPOMCMeCP2
Fig. 1 Generation of PKO mice. (a) Homologous recombination andCre excision strategy for generating PKO mice. Control (fl/fl) showingtargeted exon 3 and 4 and flanking loxP sites, PKO showingMecp2 genestructure after Cre excision. (b) Representative genotyping patterns forMecp2+ /y, Mecp2 fl /y/Pomc -Cre (PKO), Mecp2+ /y/Pomc -Cre andMecp2fl/y (control). (c) Confocal images of double immunofluorescencefor the detection of MeCP2 (green) and POMC precursor (red) in coronalbrain sections of control and PKO mice. Arrows point to POMC neurons(red) with clear MeCP2 signal (green) in control (third row), but not inPKO (fourth row), indicating specific deletion of MeCP2 in POMCneurons of PKO mice. Scale bars: 100 μm (first and second rows) and20 μm (third and fourth rows). Ctrl, control
Diabetologia (2014) 57:236–245 239
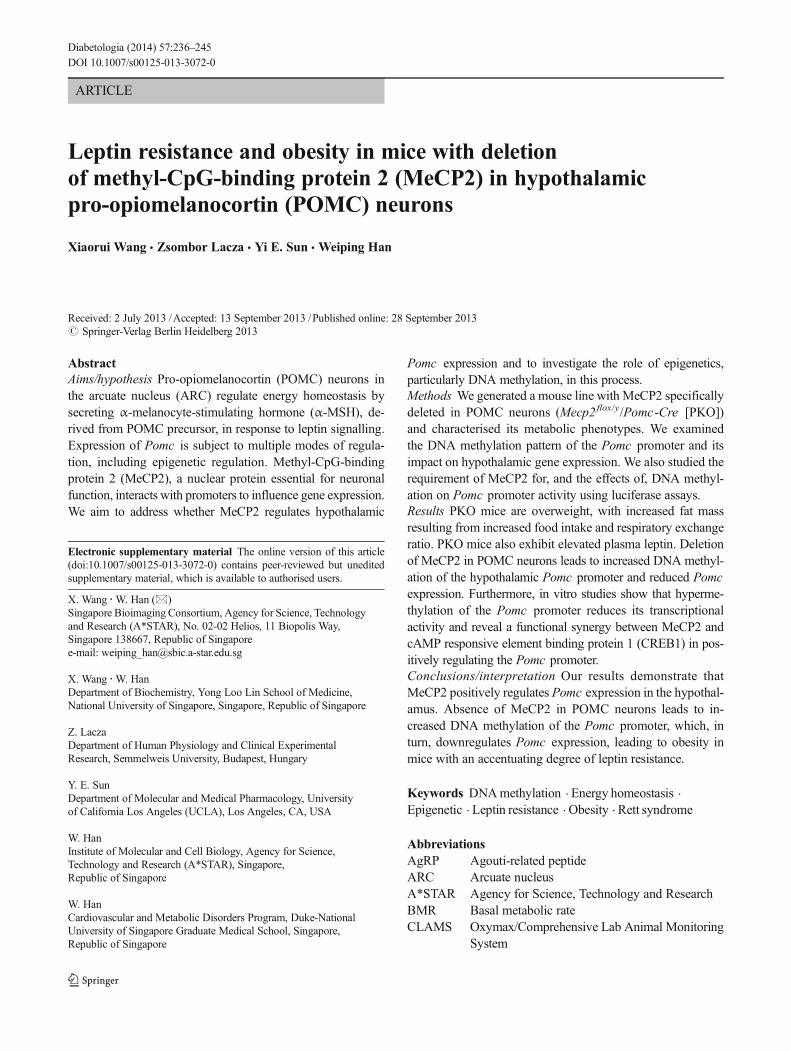
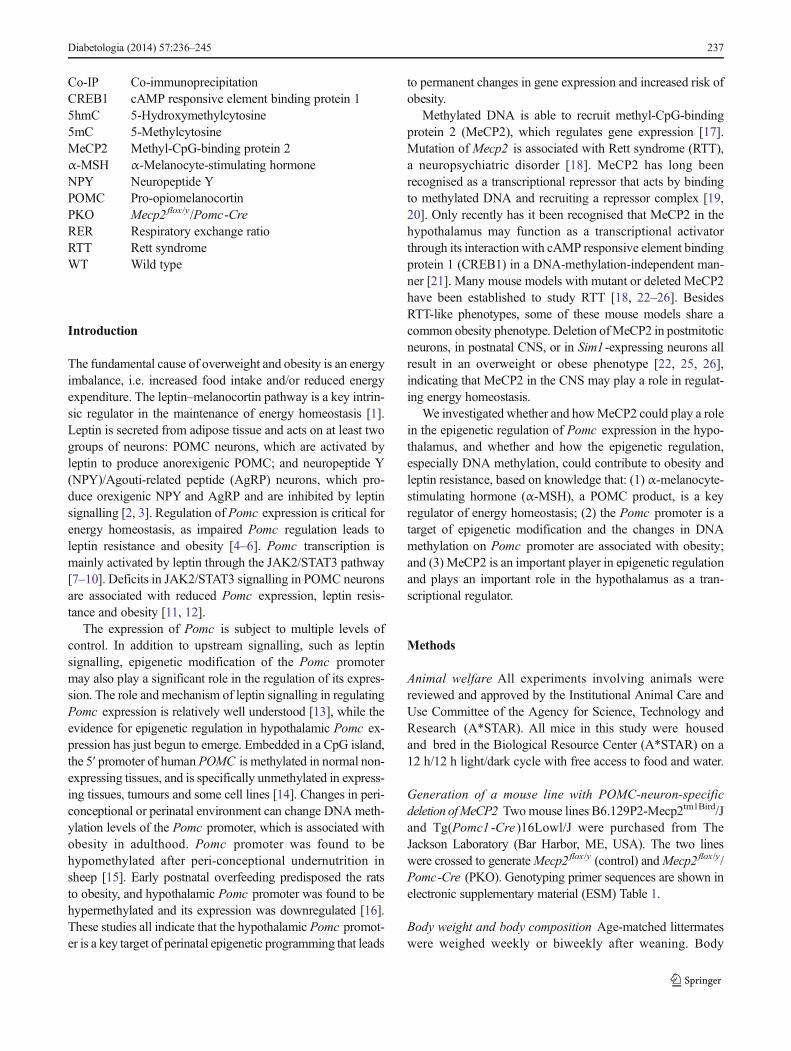
PKO mice and controls (Fig. 2f–i). Increased RER in PKOmice indicated lower usage of fat as an energy source, consis-tent with increased fat mass in these mice. Compared withcontrols, PKO mice had higher circulating leptin levels at theages of 4 and 8 months (Fig. 3a). Because leptin is secretedproportionally from adipose tissue, we normalised leptin levelto fat mass. After fat mass normalisation, the leptin level ofPKO mice was still higher than that of controls at the age of8 months (Fig. 3b). The findings of higher leptin levels andincreased food intake in the PKOmice suggest that these micedeveloped leptin resistance. Although the increases in foodintake and RER in PKOmice were marginal and did not reach
statistical significance at the age of 5 months, and becamesignificant only at the age of 9 months (Fig. 2d, e), the subtleenergy surplus contributed to significant body weight differ-ence over time (Fig. 2a). Collectively, these data indicate thatincreased food intake and reduced consumption of fat as anenergy source account for the increased body weight andadiposity in the PKO mice.
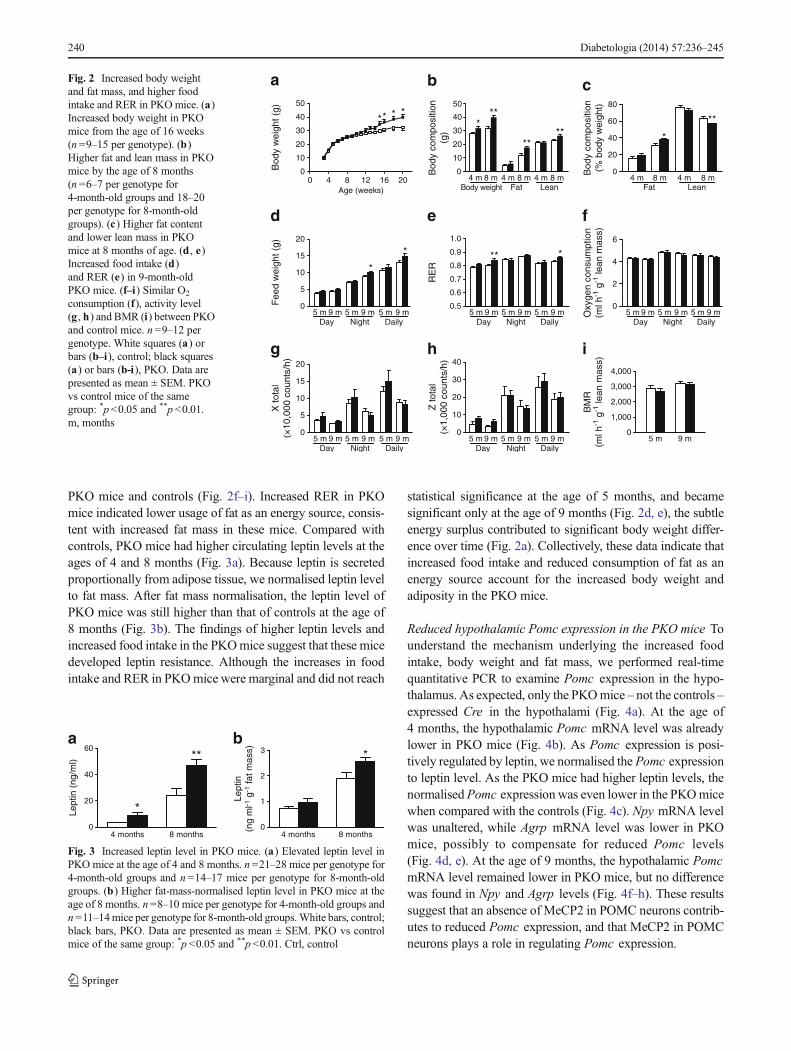
Reduced hypothalamic Pomc expression in the PKO mice Tounderstand the mechanism underlying the increased foodintake, body weight and fat mass, we performed real-timequantitative PCR to examine Pomc expression in the hypo-thalamus. As expected, only the PKOmice – not the controls –expressed Cre in the hypothalami (Fig. 4a). At the age of4 months, the hypothalamic Pomc mRNA level was alreadylower in PKO mice (Fig. 4b). As Pomc expression is posi-tively regulated by leptin, we normalised the Pomc expressionto leptin level. As the PKO mice had higher leptin levels, thenormalisedPomc expression was even lower in the PKOmicewhen compared with the controls (Fig. 4c). Npy mRNA levelwas unaltered, while Agrp mRNA level was lower in PKOmice, possibly to compensate for reduced Pomc levels(Fig. 4d, e). At the age of 9 months, the hypothalamic PomcmRNA level remained lower in PKO mice, but no differencewas found in Npy and Agrp levels (Fig. 4f–h). These resultssuggest that an absence of MeCP2 in POMC neurons contrib-utes to reduced Pomc expression, and that MeCP2 in POMCneurons plays a role in regulating Pomc expression.
0 4 8 12 16 200
10
20
30
40
50
Age (weeks)
Bod
y w
eigh
t (g)
4 m 8 m
*
0
20
40
60
80
0
5
10
15
20
0.5
0.6
0.7
0.8
0.9
1.0
0
2
4
6
0
1,000
2,000
3,000
4,000
0
5
10
15
20
X to
tal
(×10
,000
cou
nts/
h)
0
10
20
30
40
a b c
d e f
g h i
Fee
d w
eigh
t (g)
Bod
y co
mpo
sitio
n(g
)
4 m 8 m 4 m 8 mBody weight Fat Lean
Bod
y co
mpo
sitio
n(%
bod
y w
eigh
t)
4 m 8 m 4 m 8 mFat Lean
5 m 9 m 5 m 9 m 5 m 9 mDay Night Daily
RE
R
5 m 9 m 5 m 9 m 5 m 9 mDay Night Daily
Oxy
gen
cons
umpt
ion
(ml h
-1 g
-1 le
an m
ass)
5 m 9 m 5 m 9 m 5 m 9 mDay Night Daily
5 m 9 m 5 m 9 m 5 m 9 mDay Night Daily
5 m 9 m 5 m 9 m 5 m 9 mDay Night Daily
Z to
tal
(×1,
000
coun
ts/h
)
BM
R(m
l h-1
g-1
lean
mas
s)
5 m 9 m
0
10
20
30
40
50******
**** *
**
*
* ***
Fig. 2 Increased body weightand fat mass, and higher foodintake and RER in PKOmice. (a)Increased body weight in PKOmice from the age of 16 weeks(n =9–15 per genotype). (b)Higher fat and lean mass in PKOmice by the age of 8 months(n =6–7 per genotype for4-month-old groups and 18–20per genotype for 8-month-oldgroups). (c) Higher fat contentand lower lean mass in PKOmice at 8 months of age. (d , e)Increased food intake (d)and RER (e) in 9-month-oldPKO mice. (f–i) Similar O2
consumption (f), activity level(g , h) and BMR (i) between PKOand control mice. n=9–12 pergenotype. White squares (a) orbars (b–i), control; black squares(a) or bars (b-i), PKO. Data arepresented as mean ± SEM. PKOvs control mice of the samegroup: *p<0.05 and **p <0.01.m, months
*
4 months 8 months0
20
40
60**
Lept
in (
ng/m
l)
4 months 8 months0
1
2
3 *a b
Lept
in(n
g m
l-1 g
-1 fa
t mas
s)
Fig. 3 Increased leptin level in PKO mice. (a) Elevated leptin level inPKO mice at the age of 4 and 8 months. n =21–28 mice per genotype for4-month-old groups and n =14–17 mice per genotype for 8-month-oldgroups. (b) Higher fat-mass-normalised leptin level in PKO mice at theage of 8 months. n =8–10 mice per genotype for 4-month-old groups andn =11–14mice per genotype for 8-month-old groups.White bars, control;black bars, PKO. Data are presented as mean ± SEM. PKO vs controlmice of the same group: *p <0.05 and **p <0.01. Ctrl, control
240 Diabetologia (2014) 57:236–245
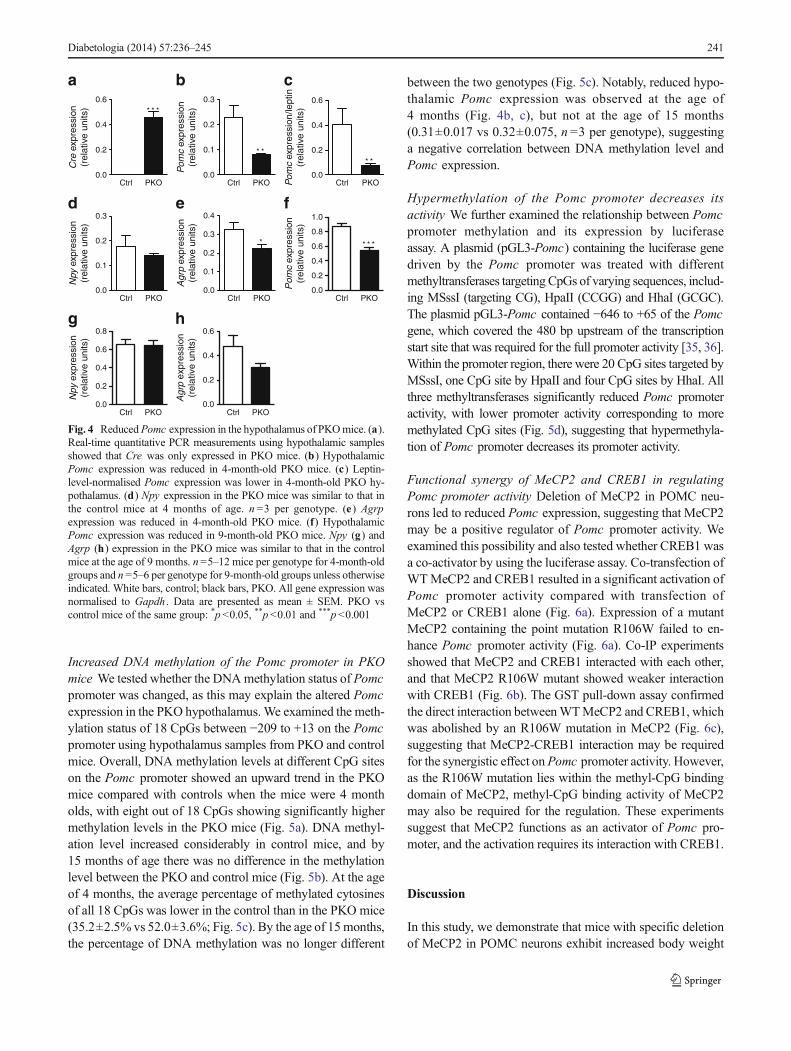
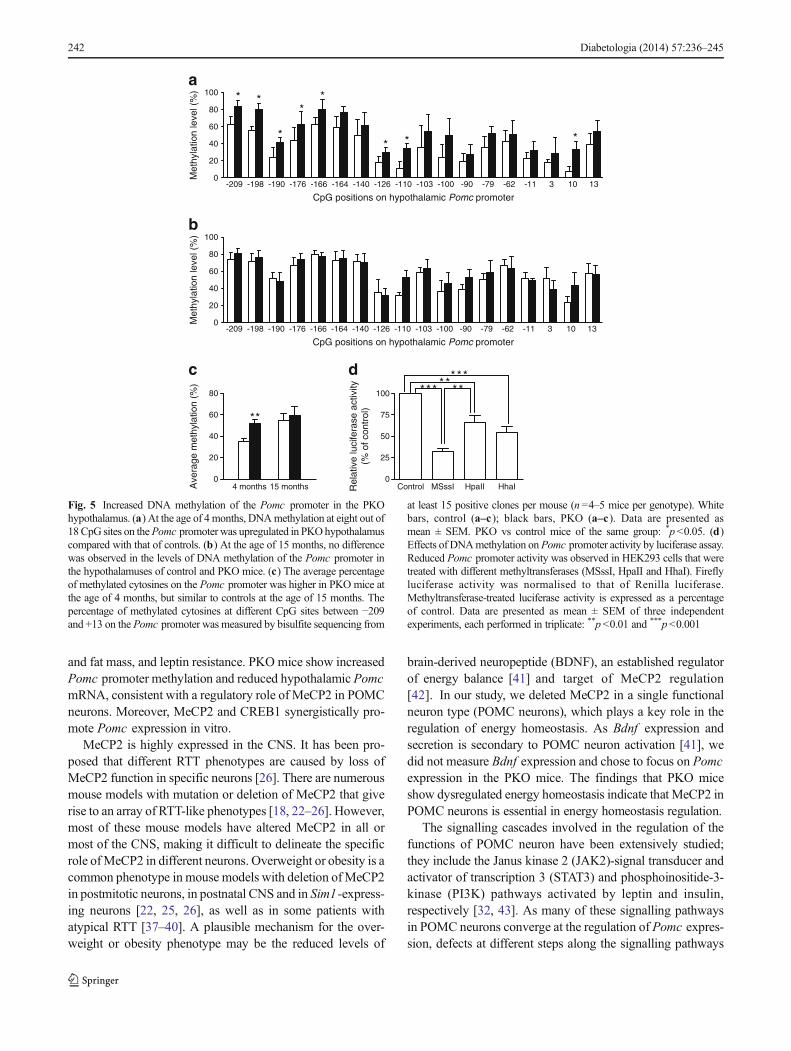
Increased DNA methylation of the Pomc promoter in PKOmice We tested whether the DNAmethylation status of Pomcpromoter was changed, as this may explain the altered Pomcexpression in the PKO hypothalamus.We examined the meth-ylation status of 18 CpGs between −209 to +13 on the Pomcpromoter using hypothalamus samples from PKO and controlmice. Overall, DNA methylation levels at different CpG siteson the Pomc promoter showed an upward trend in the PKOmice compared with controls when the mice were 4 montholds, with eight out of 18 CpGs showing significantly highermethylation levels in the PKO mice (Fig. 5a). DNA methyl-ation level increased considerably in control mice, and by15 months of age there was no difference in the methylationlevel between the PKO and control mice (Fig. 5b). At the ageof 4 months, the average percentage of methylated cytosinesof all 18 CpGs was lower in the control than in the PKO mice(35.2±2.5% vs 52.0±3.6%; Fig. 5c). By the age of 15months,the percentage of DNA methylation was no longer different
between the two genotypes (Fig. 5c). Notably, reduced hypo-thalamic Pomc expression was observed at the age of4 months (Fig. 4b, c), but not at the age of 15 months(0.31±0.017 vs 0.32±0.075, n =3 per genotype), suggestinga negative correlation between DNA methylation level andPomc expression.
Hypermethylation of the Pomc promoter decreases itsactivity We further examined the relationship between Pomcpromoter methylation and its expression by luciferaseassay. A plasmid (pGL3-Pomc) containing the luciferase genedriven by the Pomc promoter was treated with differentmethyltransferases targeting CpGs of varying sequences, includ-ing MSssI (targeting CG), HpaII (CCGG) and HhaI (GCGC).The plasmid pGL3-Pomc contained −646 to +65 of the Pomcgene, which covered the 480 bp upstream of the transcriptionstart site that was required for the full promoter activity [35, 36].Within the promoter region, there were 20 CpG sites targeted byMSssI, one CpG site by HpaII and four CpG sites by HhaI. Allthree methyltransferases significantly reduced Pomc promoteractivity, with lower promoter activity corresponding to moremethylated CpG sites (Fig. 5d), suggesting that hypermethyla-tion of Pomc promoter decreases its promoter activity.
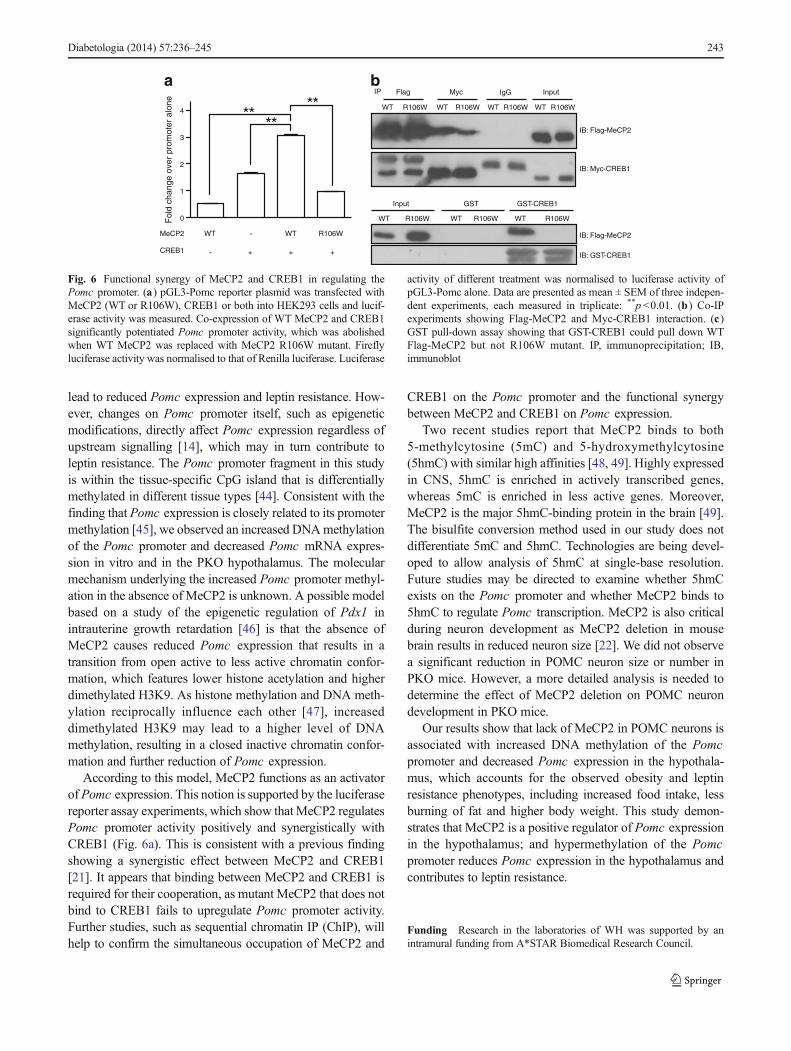
Functional synergy of MeCP2 and CREB1 in regulatingPomc promoter activity Deletion of MeCP2 in POMC neu-rons led to reduced Pomc expression, suggesting that MeCP2may be a positive regulator of Pomc promoter activity. Weexamined this possibility and also tested whether CREB1 wasa co-activator by using the luciferase assay. Co-transfection ofWTMeCP2 and CREB1 resulted in a significant activation ofPomc promoter activity compared with transfection ofMeCP2 or CREB1 alone (Fig. 6a). Expression of a mutantMeCP2 containing the point mutation R106W failed to en-hance Pomc promoter activity (Fig. 6a). Co-IP experimentsshowed that MeCP2 and CREB1 interacted with each other,and that MeCP2 R106W mutant showed weaker interactionwith CREB1 (Fig. 6b). The GST pull-down assay confirmedthe direct interaction betweenWTMeCP2 and CREB1, whichwas abolished by an R106W mutation in MeCP2 (Fig. 6c),suggesting that MeCP2-CREB1 interaction may be requiredfor the synergistic effect onPomc promoter activity. However,as the R106W mutation lies within the methyl-CpG bindingdomain of MeCP2, methyl-CpG binding activity of MeCP2may also be required for the regulation. These experimentssuggest that MeCP2 functions as an activator of Pomc pro-moter, and the activation requires its interaction with CREB1.
Discussion
In this study, we demonstrate that mice with specific deletionof MeCP2 in POMC neurons exhibit increased body weight
0.0
0.2
0.4
0.6* * *
0.0
0.2
0.4
0.6
* *
0.0
0.1
0.2
0.3
* *
a b c
Ctrl PKO Ctrl PKO Ctrl PKO
0.0
0.1
0.2
0.3
0.4d e
Ctrl PKO
Cre
exp
ress
ion
(rel
ativ
e un
its)
Pom
c ex
pres
sion
(rel
ativ
e un
its)
Pom
c ex
pres
sion
/lept
in(r
elat
ive
units
)
Agr
p ex
pres
sion
(rel
ativ
e un
its)
Npy
exp
ress
ion
(rel
ativ
e un
its)
0.0
0.1
0.2
0.3
Ctrl PKO
*
0.0
0.2
0.4
0.6
0.8
1.0
* * *
0.0
0.2
0.4
0.6
0.0
0.2
0.4
0.6
0.8
Pom
c ex
pres
sion
(rel
ativ
e un
its)
Agr
p ex
pres
sion
(rel
ativ
e un
its)
Npy
exp
ress
ion
(rel
ativ
e un
its)
f
g hCtrl PKO
Ctrl PKOCtrl PKO
Fig. 4 ReducedPomc expression in the hypothalamus of PKOmice. (a).Real-time quantitative PCR measurements using hypothalamic samplesshowed that Cre was only expressed in PKO mice. (b) HypothalamicPomc expression was reduced in 4-month-old PKO mice. (c) Leptin-level-normalised Pomc expression was lower in 4-month-old PKO hy-pothalamus. (d) Npy expression in the PKO mice was similar to that inthe control mice at 4 months of age. n =3 per genotype. (e ) Agrpexpression was reduced in 4-month-old PKO mice. (f) HypothalamicPomc expression was reduced in 9-month-old PKO mice. Npy (g) andAgrp (h) expression in the PKO mice was similar to that in the controlmice at the age of 9 months. n=5–12 mice per genotype for 4-month-oldgroups and n =5–6 per genotype for 9-month-old groups unless otherwiseindicated. White bars, control; black bars, PKO. All gene expression wasnormalised to Gapdh . Data are presented as mean ± SEM. PKO vscontrol mice of the same group: *p <0.05, **p <0.01 and ***p <0.001
Diabetologia (2014) 57:236–245 241
and fat mass, and leptin resistance. PKO mice show increasedPomc promoter methylation and reduced hypothalamic PomcmRNA, consistent with a regulatory role of MeCP2 in POMCneurons. Moreover, MeCP2 and CREB1 synergistically pro-mote Pomc expression in vitro.
MeCP2 is highly expressed in the CNS. It has been pro-posed that different RTT phenotypes are caused by loss ofMeCP2 function in specific neurons [26]. There are numerousmouse models with mutation or deletion of MeCP2 that giverise to an array of RTT-like phenotypes [18, 22–26]. However,most of these mouse models have altered MeCP2 in all ormost of the CNS, making it difficult to delineate the specificrole ofMeCP2 in different neurons. Overweight or obesity is acommon phenotype in mouse models with deletion ofMeCP2in postmitotic neurons, in postnatal CNS and in Sim1-express-ing neurons [22, 25, 26], as well as in some patients withatypical RTT [37–40]. A plausible mechanism for the over-weight or obesity phenotype may be the reduced levels of
brain-derived neuropeptide (BDNF), an established regulatorof energy balance [41] and target of MeCP2 regulation[42]. In our study, we deleted MeCP2 in a single functionalneuron type (POMC neurons), which plays a key role in theregulation of energy homeostasis. As Bdnf expression andsecretion is secondary to POMC neuron activation [41], wedid not measure Bdnf expression and chose to focus on Pomcexpression in the PKO mice. The findings that PKO miceshow dysregulated energy homeostasis indicate that MeCP2 inPOMC neurons is essential in energy homeostasis regulation.
The signalling cascades involved in the regulation of thefunctions of POMC neuron have been extensively studied;they include the Janus kinase 2 (JAK2)-signal transducer andactivator of transcription 3 (STAT3) and phosphoinositide-3-kinase (PI3K) pathways activated by leptin and insulin,respectively [32, 43]. As many of these signalling pathwaysin POMC neurons converge at the regulation of Pomc expres-sion, defects at different steps along the signalling pathways
4 months 15 months0
20
40
60
80
**
Ave
rage
met
hyla
tion
(%)
Control MSssI HpaII HhaI0
25
50
75
100 *** **
Rel
ativ
e lu
cife
rase
act
ivity
(% o
f con
trol
)c d
-209 -198 -190 -176 -166 -164 -140 -126 -110 -103 -100 -90 -79 -62 -11 3 10 130
20
40
60
80
100 * *
*
**
* * *
CpG positions on hypothalamic Pomc promoterM
ethy
latio
n le
vel (
%)
-209 -198 -190 -176 -166 -164 -140 -126 -110 -103 -100 -90 -79 -62 -11 3 10 130
20
40
60
80
100
Met
hyla
tion
leve
l (%
)
a
b
*****
CpG positions on hypothalamic Pomc promoter
Fig. 5 Increased DNA methylation of the Pomc promoter in the PKOhypothalamus. (a) At the age of 4months, DNAmethylation at eight out of18CpG sites on thePomc promoter was upregulated in PKOhypothalamuscompared with that of controls. (b) At the age of 15 months, no differencewas observed in the levels of DNA methylation of the Pomc promoter inthe hypothalamuses of control and PKO mice. (c) The average percentageof methylated cytosines on the Pomc promoter was higher in PKO mice atthe age of 4 months, but similar to controls at the age of 15 months. Thepercentage of methylated cytosines at different CpG sites between −209and +13 on the Pomc promoter was measured by bisulfite sequencing from
at least 15 positive clones per mouse (n=4–5 mice per genotype). Whitebars, control (a–c ); black bars, PKO (a–c ). Data are presented asmean ± SEM. PKO vs control mice of the same group: *p<0.05. (d)Effects of DNAmethylation onPomc promoter activity by luciferase assay.Reduced Pomc promoter activity was observed in HEK293 cells that weretreated with different methyltransferases (MSssI, HpaII and HhaI). Fireflyluciferase activity was normalised to that of Renilla luciferase.Methyltransferase-treated luciferase activity is expressed as a percentageof control. Data are presented as mean ± SEM of three independentexperiments, each performed in triplicate: **p<0.01 and ***p<0.001
242 Diabetologia (2014) 57:236–245
lead to reduced Pomc expression and leptin resistance. How-ever, changes on Pomc promoter itself, such as epigeneticmodifications, directly affect Pomc expression regardless ofupstream signalling [14], which may in turn contribute toleptin resistance. The Pomc promoter fragment in this studyis within the tissue-specific CpG island that is differentiallymethylated in different tissue types [44]. Consistent with thefinding that Pomc expression is closely related to its promotermethylation [45], we observed an increased DNAmethylationof the Pomc promoter and decreased Pomc mRNA expres-sion in vitro and in the PKO hypothalamus. The molecularmechanism underlying the increased Pomc promoter methyl-ation in the absence of MeCP2 is unknown. A possible modelbased on a study of the epigenetic regulation of Pdx1 inintrauterine growth retardation [46] is that the absence ofMeCP2 causes reduced Pomc expression that results in atransition from open active to less active chromatin confor-mation, which features lower histone acetylation and higherdimethylated H3K9. As histone methylation and DNA meth-ylation reciprocally influence each other [47], increaseddimethylated H3K9 may lead to a higher level of DNAmethylation, resulting in a closed inactive chromatin confor-mation and further reduction of Pomc expression.
According to this model, MeCP2 functions as an activatorofPomc expression. This notion is supported by the luciferasereporter assay experiments, which show thatMeCP2 regulatesPomc promoter activity positively and synergistically withCREB1 (Fig. 6a). This is consistent with a previous findingshowing a synergistic effect between MeCP2 and CREB1[21]. It appears that binding between MeCP2 and CREB1 isrequired for their cooperation, as mutant MeCP2 that does notbind to CREB1 fails to upregulate Pomc promoter activity.Further studies, such as sequential chromatin IP (ChIP), willhelp to confirm the simultaneous occupation of MeCP2 and
CREB1 on the Pomc promoter and the functional synergybetween MeCP2 and CREB1 on Pomc expression.
Two recent studies report that MeCP2 binds to both5-methylcytosine (5mC) and 5-hydroxymethylcytosine(5hmC) with similar high affinities [48, 49]. Highly expressedin CNS, 5hmC is enriched in actively transcribed genes,whereas 5mC is enriched in less active genes. Moreover,MeCP2 is the major 5hmC-binding protein in the brain [49].The bisulfite conversion method used in our study does notdifferentiate 5mC and 5hmC. Technologies are being devel-oped to allow analysis of 5hmC at single-base resolution.Future studies may be directed to examine whether 5hmCexists on the Pomc promoter and whether MeCP2 binds to5hmC to regulate Pomc transcription. MeCP2 is also criticalduring neuron development as MeCP2 deletion in mousebrain results in reduced neuron size [22]. We did not observea significant reduction in POMC neuron size or number inPKO mice. However, a more detailed analysis is needed todetermine the effect of MeCP2 deletion on POMC neurondevelopment in PKO mice.
Our results show that lack of MeCP2 in POMC neurons isassociated with increased DNA methylation of the Pomcpromoter and decreased Pomc expression in the hypothala-mus, which accounts for the observed obesity and leptinresistance phenotypes, including increased food intake, lessburning of fat and higher body weight. This study demon-strates that MeCP2 is a positive regulator of Pomc expressionin the hypothalamus; and hypermethylation of the Pomcpromoter reduces Pomc expression in the hypothalamus andcontributes to leptin resistance.
Funding Research in the laboratories of WH was supported by anintramural funding from A*STAR Biomedical Research Council.
Input
WT R106W
IgG
WT R106W
Myc
WT R106W
Flag
WT R106W
GST-CREB1
WT R106W
GST
WT R106W
Input
WT R106W
IB: Myc-CREB1
IB: Flag-MeCP2
IB: GST-CREB1
IP
IB: Flag-MeCP2
MeCP2
CREB1 - + + +
0
1
2
3
4
a b
Fol
d ch
ange
ove
r pr
omot
er a
lone
WT - WT R106W
Fig. 6 Functional synergy of MeCP2 and CREB1 in regulating thePomc promoter. (a) pGL3-Pomc reporter plasmid was transfected withMeCP2 (WT or R106W), CREB1 or both into HEK293 cells and lucif-erase activity was measured. Co-expression of WT MeCP2 and CREB1significantly potentiated Pomc promoter activity, which was abolishedwhen WT MeCP2 was replaced with MeCP2 R106W mutant. Fireflyluciferase activity was normalised to that of Renilla luciferase. Luciferase
activity of different treatment was normalised to luciferase activity ofpGL3-Pomc alone. Data are presented as mean ± SEM of three indepen-dent experiments, each measured in triplicate: **p <0.01. (b ) Co-IPexperiments showing Flag-MeCP2 and Myc-CREB1 interaction. (c )GST pull-down assay showing that GST-CREB1 could pull down WTFlag-MeCP2 but not R106W mutant. IP, immunoprecipitation; IB,immunoblot
Diabetologia (2014) 57:236–245 243
Declaration of interest The authors declare that there is no duality ofinterest associated with this manuscript.
Author contributions WH and YES designed the research. XWperformed the experiments. XW and WH wrote the manuscript; allauthors were involved in analysing and interpreting the data, and revisingthe article. All authors approved the final manuscript to be published.
References
1. Cone RD (1999) The central melanocortin system and energy ho-meostasis. Trends Endocrinol Metab 10:211–216
2. Cowley MA, Smart JL, Rubinstein M et al (2001) Leptin activatesanorexigenic POMC neurons through a neural network in the arcuatenucleus. Nature 411:480–484
3. Gong L, Yao F, Hockman K et al (2008) Signal transducer andactivator of transcription-3 is required in hypothalamic agouti-relatedprotein/neuropeptide Y neurons for normal energy homeostasis.Endocrinology 149:3346–3354
4. Leal-Cerro A, Considine RV, Peino R et al (1996) Serumimmunoreactive-leptin levels are increased in patients with Cushing'ssyndrome. Horm Metab Res 28:711–713
5. Farooqi IS, O'Rahilly S (2005) Monogenic obesity in humans.Annu Rev Med 56:443–458
6. Maffei M, Stoffel M, Barone M et al (1996) Absence of mutations inthe human OB gene in obese/diabetic subjects. Diabetes 45:679–682
7. Banks AS, Davis SM, Bates SH, Myers MG (2000) Activation ofdownstream signals by the long form of the leptin receptor. J Biol Chem275:14563–14572
8. White DW, Kuropatwinski KK, Devos R, Baumann H, Tartaglia LA(1997) Leptin receptor (OB-R) signaling. Cytoplasmic domain mu-tational analysis and evidence for receptor homo-oligomerization.J Biol Chem 272:4065–4071
9. Vaisse C, Halaas JL, Horvath CM,Darnell JE, StoffelM, Friedman JM(1996) Leptin activation of Stat3 in the hypothalamus of wild-type andob/ob mice but not db/db mice. Nat Genet 14:95–97
10. McCowen KC, Chow JC, Smith RJ (1998) Leptin signaling in thehypothalamus of normal rats in vivo. Endocrinology 139:4442–4447
11. Bates SH, Stearns WH, Dundon TA et al (2003) STAT3 signalling isrequired for leptin regulation of energy balance but not reproduction.Nature 421:856–859
12. Gao Q, Wolfgang MJ, Neschen S et al (2004) Disruption of neuralsignal transducer and activator of transcription 3 causes obesity, diabe-tes, infertility, and thermal dysregulation. Proc Natl Acad Sci U S A101:4661–4666
13. Morris DL, Rui L (2009) Recent advances in understanding leptinsignaling and leptin resistance. Am J Physiol Endocrinol Metab 297:E1247–E1259
14. Newell-Price J (2003) Proopiomelanocortin gene expression andDNAmethylation: implications for Cushing's syndrome and beyond.J Endocrinol 177:365–372
15. Stevens A, Begum G, White A (2011) Epigenetic changes in thehypothalamic pro-opiomelanocortin gene: a mechanism linking ma-ternal undernutrition to obesity in the offspring? Eur J Pharmacol660:194–201
16. Plagemann A, Harder T, Brunn M et al (2009) Hypothalamicproopiomelanocortin promoter methylation becomes altered by earlyoverfeeding: an epigenetic model of obesity and the metabolic syn-drome. J Physiol 587:4963–4976
17. Lewis JD, Meehan RR, Henzel WJ et al (1992) Purification, se-quence, and cellular localization of a novel chromosomal protein thatbinds to methylated DNA. Cell 69:905–914
18. Guy J, Hendrich B, Holmes M, Martin JE, Bird A (2001) A mouseMecp2-null mutation causes neurological symptoms that mimic Rettsyndrome. Nat Genet 27:322–326
19. Nan X, Ng HH, Johnson CA et al (1998) Transcriptional repressionby the methyl-CpG-binding protein MeCP2 involves a histonedeacetylase complex. Nature 393:386–389
20. Jones PL, Veenstra GJ, Wade PA et al (1998) Methylated DNA andMeCP2 recruit histone deacetylase to repress transcription. Nat Genet19:187–191
21. Chahrour M, Jung SY, Shaw C et al (2008)MeCP2, a key contributorto neurological disease, activates and represses transcription. Science320:1224–1229
22. Chen RZ, Akbarian S, Tudor M, Jaenisch R (2001) Deficiency ofmethyl-CpG binding protein-2 in CNS neurons results in a Rett-likephenotype in mice. Nat Genet 27:327–331
23. Samaco RC, Fryer JD, Ren J et al (2008) A partial loss of function alleleof methyl-CpG-binding protein 2 predicts a human neurodevelopmentalsyndrome. Hum Mol Genet 17:1718–1727
24. Shahbazian M, Young J, Yuva-Paylor L et al (2002) Mice withtruncated MeCP2 recapitulate many Rett syndrome features anddisplay hyperacetylation of histone H3. Neuron 35:243–254
25. Gemelli T, BertonO,Nelson ED, Perrotti LI, Jaenisch R,Monteggia LM(2006) Postnatal loss of methyl-CpG binding protein 2 in the forebrain issufficient to mediate behavioral aspects of Rett syndrome inmice.Biol Psychiatry 59:468–476
26. Fyffe SL, Neul JL, Samaco RC et al (2008) Deletion of Mecp2 inSim1-expressing neurons reveals a critical role for MeCP2 in feedingbehavior, aggression, and the response to stress. Neuron 59:947–958
27. Gustavsson N, Lao Y, Maximov A et al (2008) Impaired insulinsecretion and glucose intolerance in synaptotagmin-7 null mutantmice. Proc Natl Acad Sci U S A 105:3992–3997
28. Lou PH, Gustavsson N, Wang Y, Radda GK, Han W (2011) In-creased lipolysis and energy expenditure in a mouse model withseverely impaired glucagon secretion. PLoS One 6:e26671
29. Piper ML, Unger EK, Myers MG, Xu AW (2008) Specific physio-logical roles for signal transducer and activator of transcription3 in leptin receptor-expressing neurons. Mol Endocrinol 22:751–759
30. Yang G, Lim C, Li C et al (2009) FoxO1 inhibits leptin regulation ofpro-opiomelanocortin promoter activity by blocking STAT3 interac-tion with specificity protein 1. J Biol Chem 284:3719–3727
31. Balthasar N, Coppari R, McMinn J et al (2004) Leptin receptorsignaling in POMC neurons is required for normal body weighthomeostasis. Neuron 42:983–991
32. Xu AW, Ste-Marie L, Kaelin CB, Barsh GS (2007) Inactivation ofsignal transducer and activator of transcription 3 in proopiomelanocortin(Pomc) neurons causes decreased pomc expression, mild obesity, anddefects in compensatory refeeding. Endocrinology 148:72–80
33. van de Wall E, Leshan R, Xu AW et al (2008) Collective andindividual functions of leptin receptor modulated neurons controllingmetabolism and ingestion. Endocrinology 149:1773–1785
34. Vong L, Ye C, Yang Z, Choi B, Chua S, Lowell BB (2011) Leptinaction on GABAergic neurons prevents obesity and reduces inhibi-tory tone to POMC neurons. Neuron 71:142–154
35. Kitamura T, Feng Y, Kitamura YI et al (2006) Forkhead proteinFoxO1 mediates Agrp-dependent effects of leptin on food intake.Nat Med 12:534–540
36. Jeannotte L, Trifiro MA, Plante RK, Chamberland M, Drouin J(1987) Tissue-specific activity of the pro-opiomelanocortin genepromoter. Mol Cell Biol 7:4058–4064
37. Couvert P, Bienvenu T, Aquaviva C et al (2001) MECP2 is highlymutated in X-linked mental retardation. Hum Mol Genet 10:941–946
38. Zappella M,Meloni I, Longo I, Hayek G, Renieri A (2001) Preservedspeech variants of the Rett syndrome: molecular and clinical analysis.Am J Med Genet 104:14–22
244 Diabetologia (2014) 57:236–245
39. Kleefstra T, Yntema HG, Oudakker AR et al (2002) De novoMECP2frameshift mutation in a boy with moderate mental retardation,obesity and gynaecomastia. Clin Genet 61:359–362
40. Adegbola AA, Gonzales ML, Chess A, LaSalle JM, Cox GF (2009)A novel hypomorphic MECP2 point mutation is associated with aneuropsychiatric phenotype. Hum Genet 124:615–623
41. Xu B, Goulding EH, Zang K et al (2003) Brain-derived neurotrophicfactor regulates energy balance downstream of melanocortin-4receptor. Nat Neurosci 6:736–742
42. Zhou Z, Hong EJ, Cohen S et al (2006) Brain-specific phosphoryla-tion of MeCP2 regulates activity-dependent Bdnf transcription, den-dritic growth, and spine maturation. Neuron 52:255–269
43. KimMS, Pak YK, Jang PG et al (2006) Role of hypothalamic Foxo1in the regulation of food intake and energy homeostasis. Nat Neurosci9:901–906
44. Newell-Price J, King P, Clark AJ (2001) The CpG island promoter ofthe human proopiomelanocortin gene is methylated in nonexpressing
normal tissue and tumors and represses expression. Mol Endocrinol15:338–348
45. Plagemann A (2005) Perinatal programming and functionalteratogenesis: impact on body weight regulation and obesity.Physiol Behav 86:661–668
46. Pinney SE, Simmons RA (2010) Epigenetic mechanisms in thedevelopment of type 2 diabetes. Trends Endocrinol Metab 21:223–229
47. Cedar H, Bergman Y (2009) Linking DNA methylation and histonemodification: patterns and paradigms. Nat Rev Genet 10:295–304
48. Szulwach KE, Li X, Li Y et al (2011) 5-hmC-mediated epigeneticdynamics during postnatal neurodevelopment and aging. Nat Neurosci14:1607–1616
49. MellénM, Ayata P, Dewell S, Kriaucionis S, Heintz N (2012)MeCP2binds to 5hmC enrichedwithin active genes and accessible chromatinin the nervous system. Cell 151:1417–1430
Diabetologia (2014) 57:236–245 245