lemon effect
TRANSCRIPT
Explore the factor which influence the degree of Lemon effect in online
shopping market
Group 4 Hanxiang Xie Shiqian Wang
Preface With the developing of society and upgrading of
technology, the way we shop has changed. Online shopping has now become a trendy way, compared with the traditional method of shopping, shopping online has many advantages, but there are a number of problems. For instance, the Lemon effect. As we know, there are several disadvantages of the Lemon effect, such as reduce the trade efficiency, lower the social welfare and so on. In this paper, we will use statistic method to measure the degree of Lemon effect in online market, and figure out the factor which influence the level. In the end, we will provide several feasible suggestions which could contribute to eliminate Lemon effect in the online shopping market.
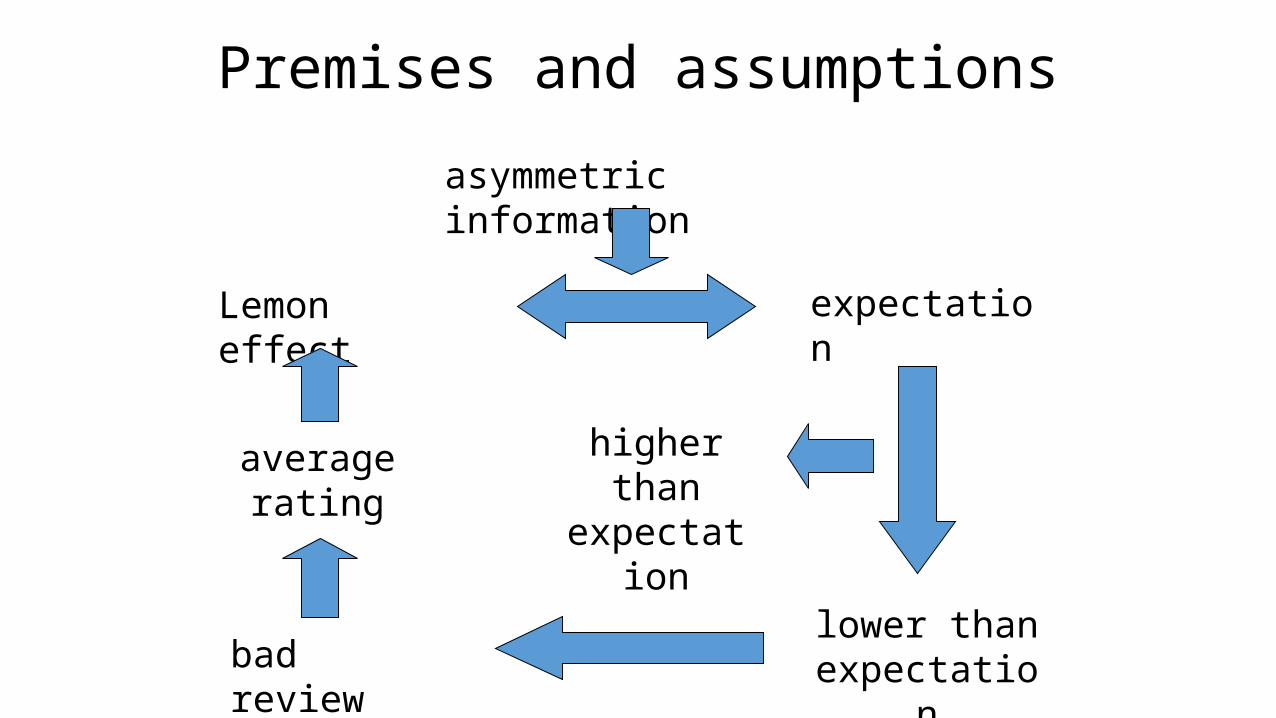
Premises and assumptions
asymmetric information
Lemon effect expectation
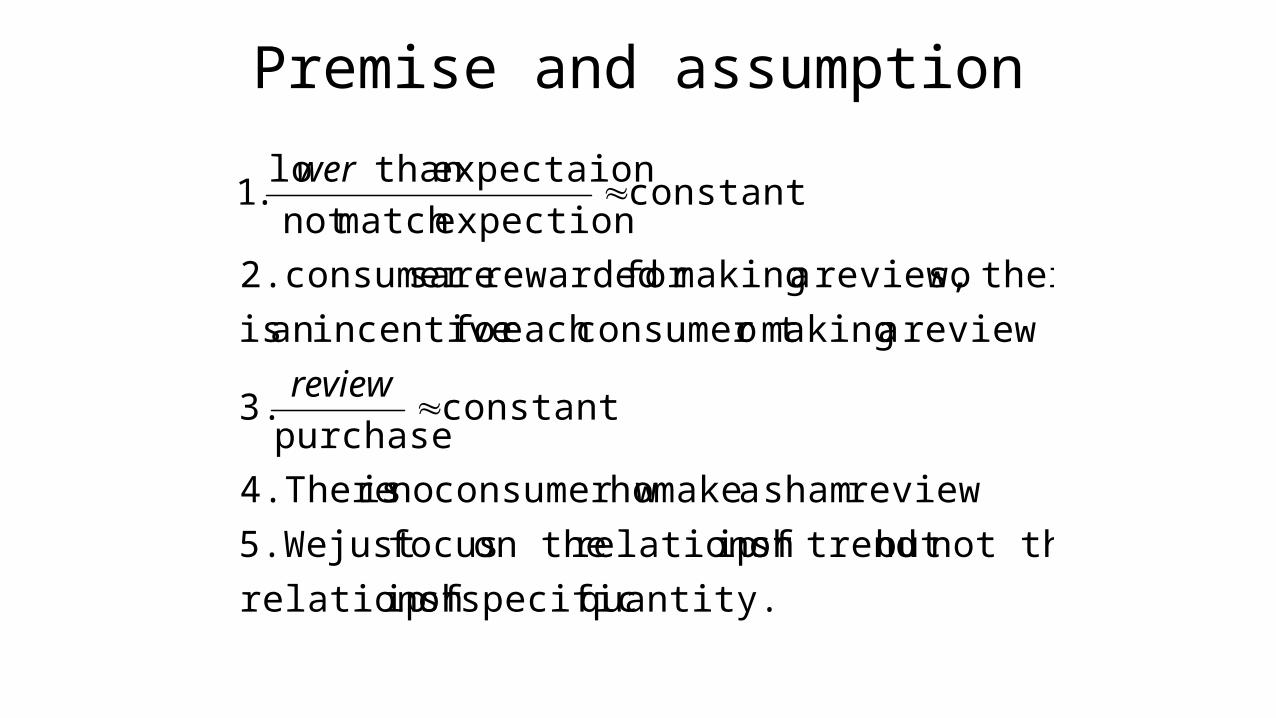
lower thanexpectation
higher thanexpectation
bad review
average rating
Premise and assumption
quantity. specific of iprelationsh
not thebut trendof iprelationsh on the focusjust 5.We
review sham a make hoconsumer w no is 4.There
constant purchase
3.
review a making oconsumer teach for incentivean is
thereso review, a makingfor rewarded are s2.consumer
constant expectionmatch not
expectaion than lo.1
review
wer
statistic method
) choosed randomwhich commodity theand on topcommodity theof
effect thebalance want to that weis not but log use wereason why (
.L is,that , score review average theof average weighted
clogarithmi the toequalsA commodity ofindex Effect Lemon thes,assumption
previous and precises on the Base ....,, isA commodity ofproduct
each of score review average ,,log define weand
, is quantity) review(or quantity sales total the,...,
isproduct each of quantity) review(or quantity sales tproducts,left in the
randomly products 20other choose weA,commodity of products 20 top
choose we,L isA commodity ofindex Effect Lemon that thedefine
AiAi
40
1iAiiA
402,1
40
1iAiAiAi
40
1iAiA40A2A1
A
the
the
so
he
and
We
A
A
.HHI isA commodity of HHI the,assumption previous and
premise on the Base A.commodity of products 20 each top of quantity) review(or
quantity sales theis ,...,,,100, define we
each. 10% of size equal of products 10 toequivalent is which concern, a is 1000 HHI
each. 5% i.e., size, equal of products 20 toequivalent is which ok, is 500= HHI
10,000<= HHI < 0Obviously, ights.greater we firms
larger giving means square takingsquared, sharemarket of sum = HHI
exactly.market wholetherepresent can used wesample that the
means this, taillong ofeffect theeliminatecan wedata, on the Based
220
1iAiA
A20A2A1,A
Ai,Ai
20
1iAiA
say
”“
statistic method
1 2 3 4 5 6 7 8 9 10 11 12 13 14 15 16 17 18 19 2082%
84%
86%
88%
90%
92%
94%
96%
15000
20000
25000
30000
35000
40000
45000
50000
Cell phones
Score
Quantity
Rank
Aver
age
ratin
g
Qua
ntity
of r
evie
w
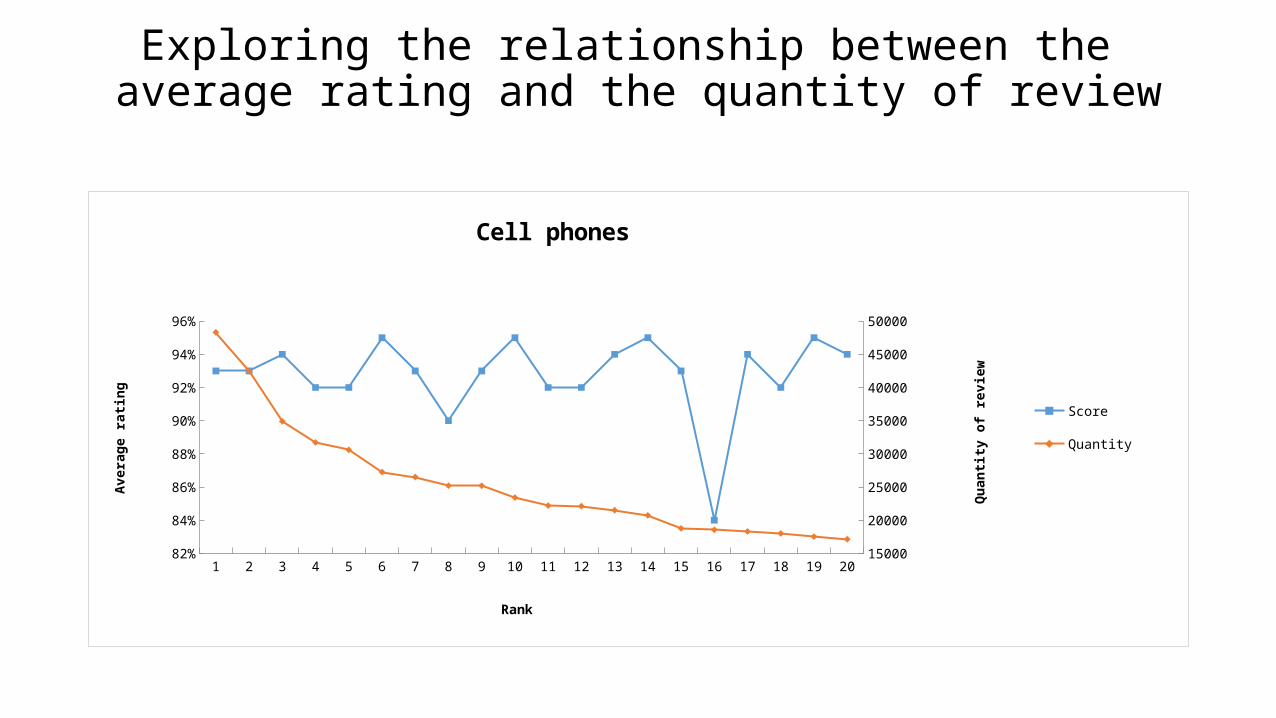
Exploring the relationship between the average rating and the quantity of review
1 2 3 4 5 6 7 8 9 10 11 12 13 14 15 16 17 18 19 2088%
90%
92%
94%
96%
98%
100%
800
1200
1600
2000
2400
2800
3200
3600
4000
Digital Cameras
Score
Quantity
Rank
Aver
age
ratin
g
Qua
ntity
of r
evie
w
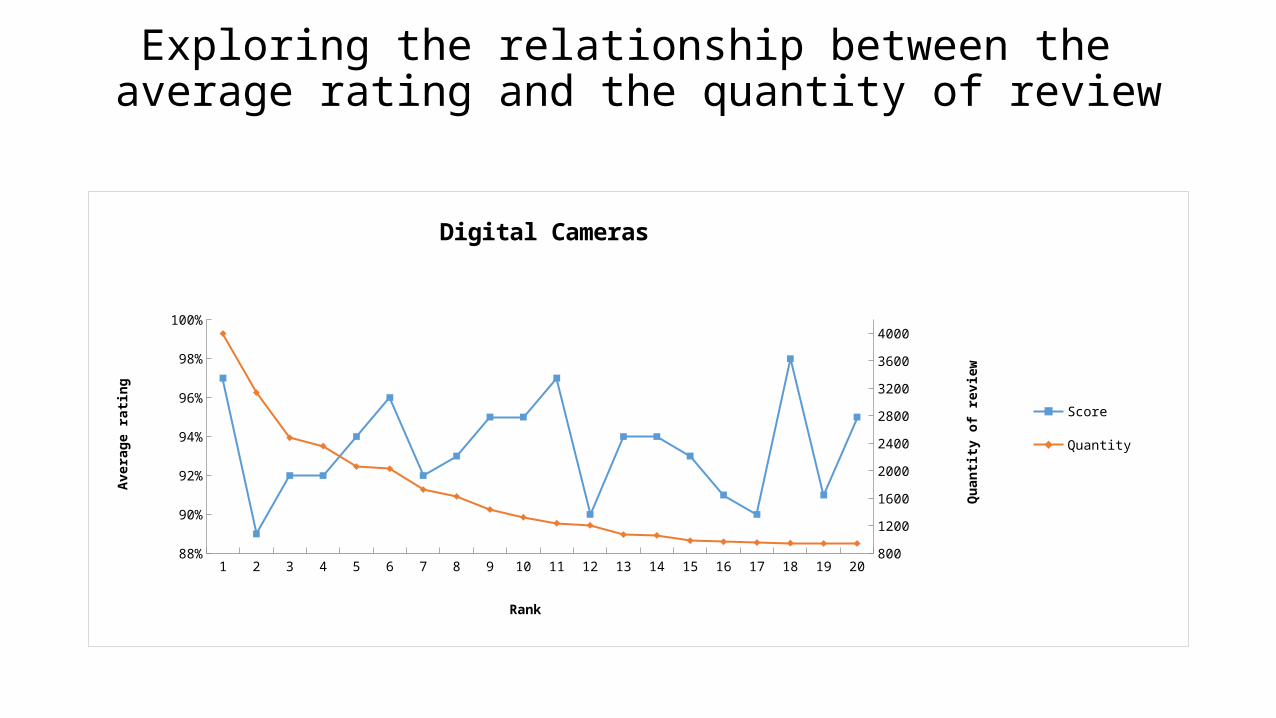
Exploring the relationship between the average rating and the quantity of review
1 2 3 4 5 6 7 8 9 10 11 12 13 14 15 16 17 18 19 2086%
88%
90%
92%
94%
96%
5000
15000
25000
35000
45000
55000
65000
75000
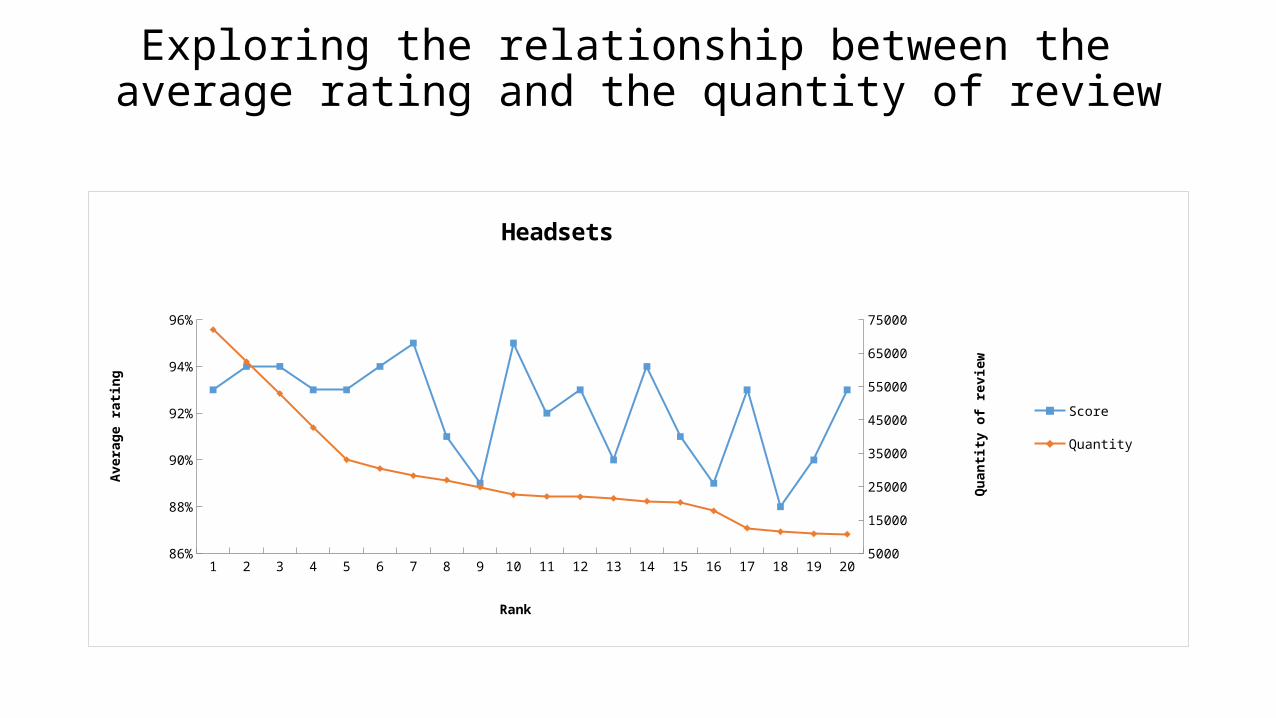
Headsets
Score
Quantity
Rank
Aver
age
ratin
g
Qua
ntity
of r
evie
w
Exploring the relationship between the average rating and the quantity of review
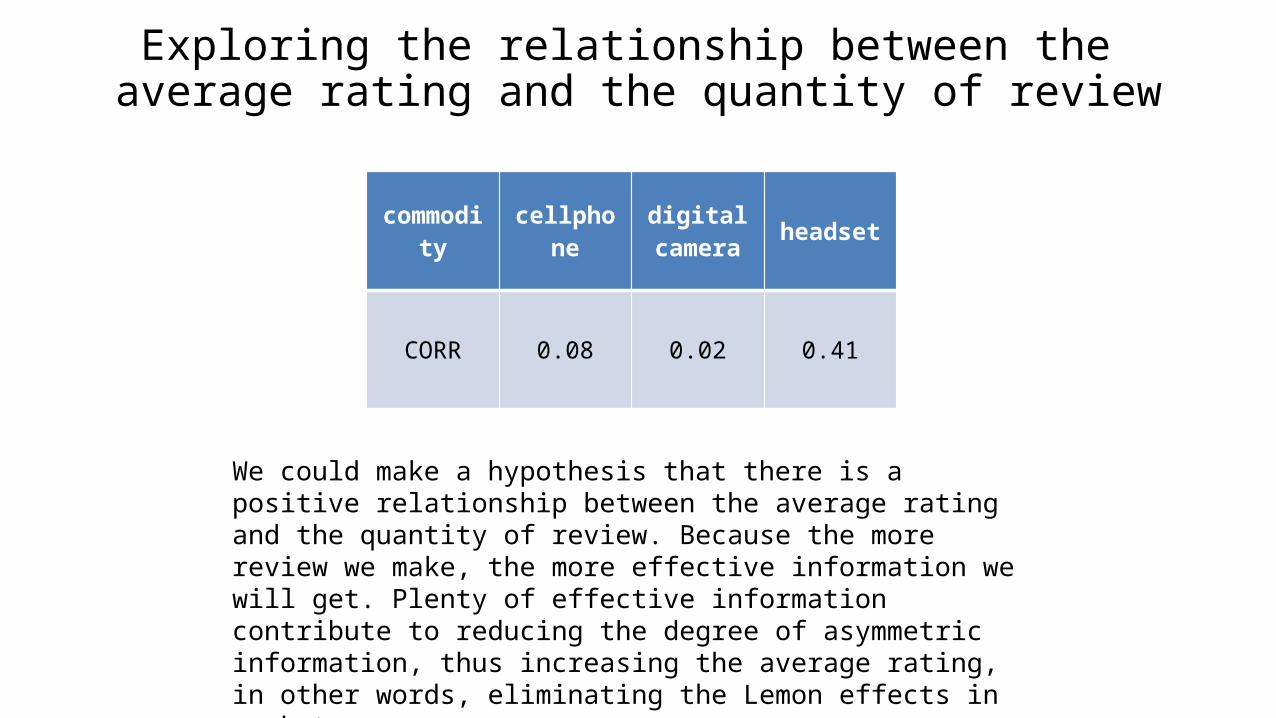
commodity cellphone digital camera headset
CORR 0.08 0.02 0.41
We could make a hypothesis that there is a positive relationship between the average rating and the quantity of review. Because the more review we make, the more effective information we will get. Plenty of effective information contribute to reducing the degree of asymmetric information, thus increasing the average rating, in other words, eliminating the Lemon effects in market.
Exploring the relationship between the average rating and the quantity of review
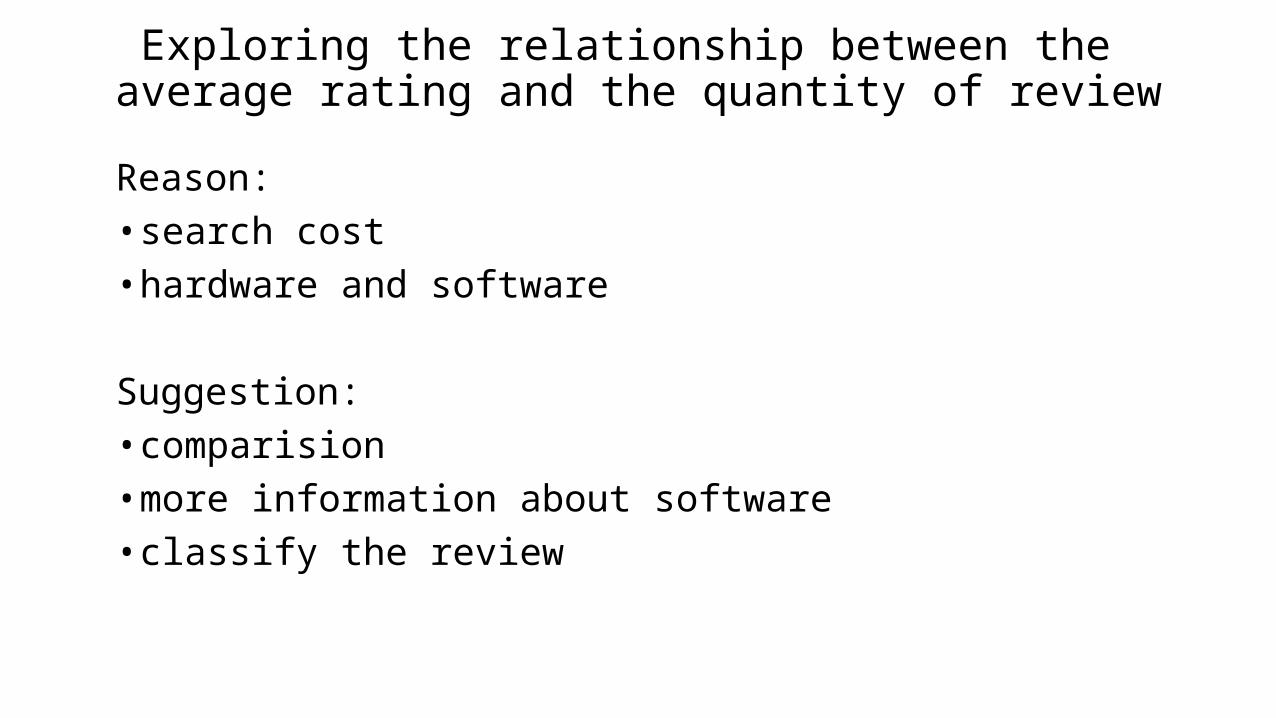
Reason:• search cost• hardware and software
Suggestion:• comparision• more information about software• classify the review
Exploring the relationship between the average rating and the quantity of review
Exploring the relationship between the average rating and the quantity of review
1 2 3 4 5 6 7 8 9 10 11 12 13 14 15 16 17 18 19 204.2
4.3
4.4
4.5
4.6
4.7
4.8
4.9
0
100000
200000
300000
400000
500000
600000
700000
800000
Men's ware
ratingLinear (rating)selling
Exploring the relationship between the average rating and the quantity of review
1 2 3 4 5 6 7 8 9 10 11 12 13 14 15 16 17 18 19 204.5
4.55
4.6
4.65
4.7
4.75
4.8
4.85
0
200000
400000
600000
800000
1000000
1200000
1400000
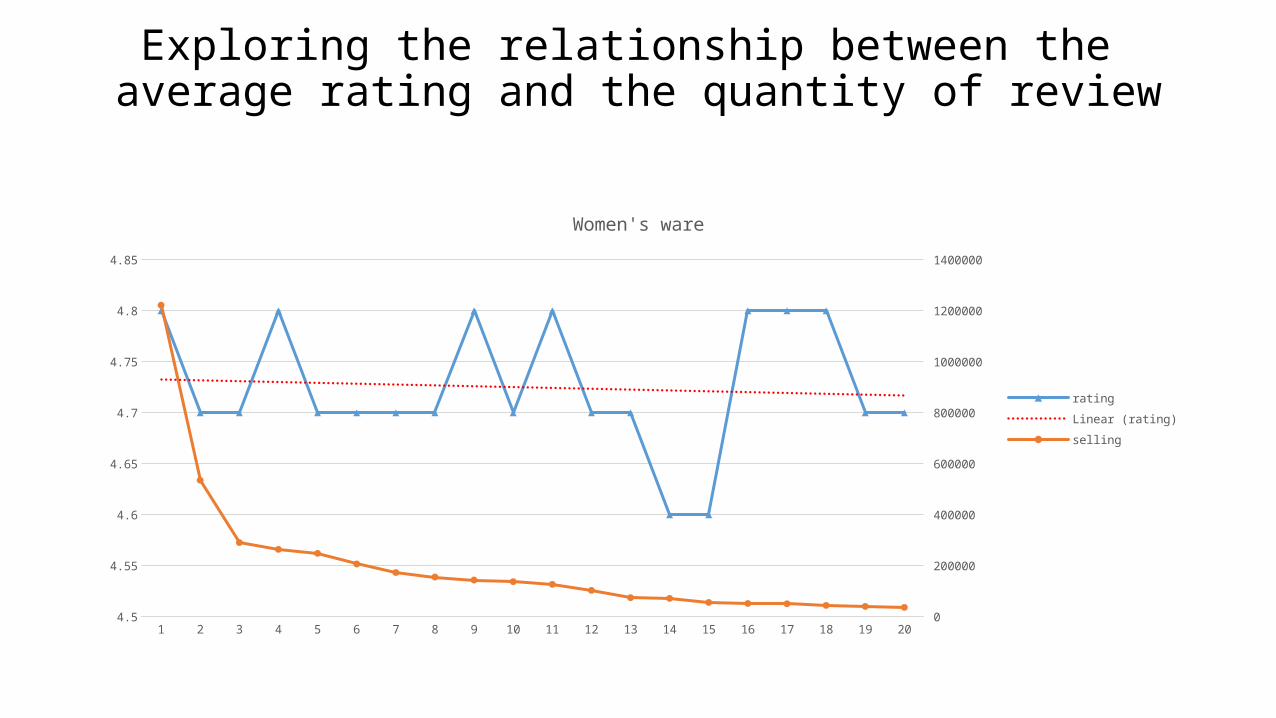
Women's ware
ratingLinear (rating)selling
Exploring the relationship between the average rating and the quantity of review
1 2 3 4 5 6 7 8 9 10 11 12 13 14 15 16 17 18 19 204.3
4.4
4.5
4.6
4.7
4.8
4.9
0
50000
100000
150000
200000
250000
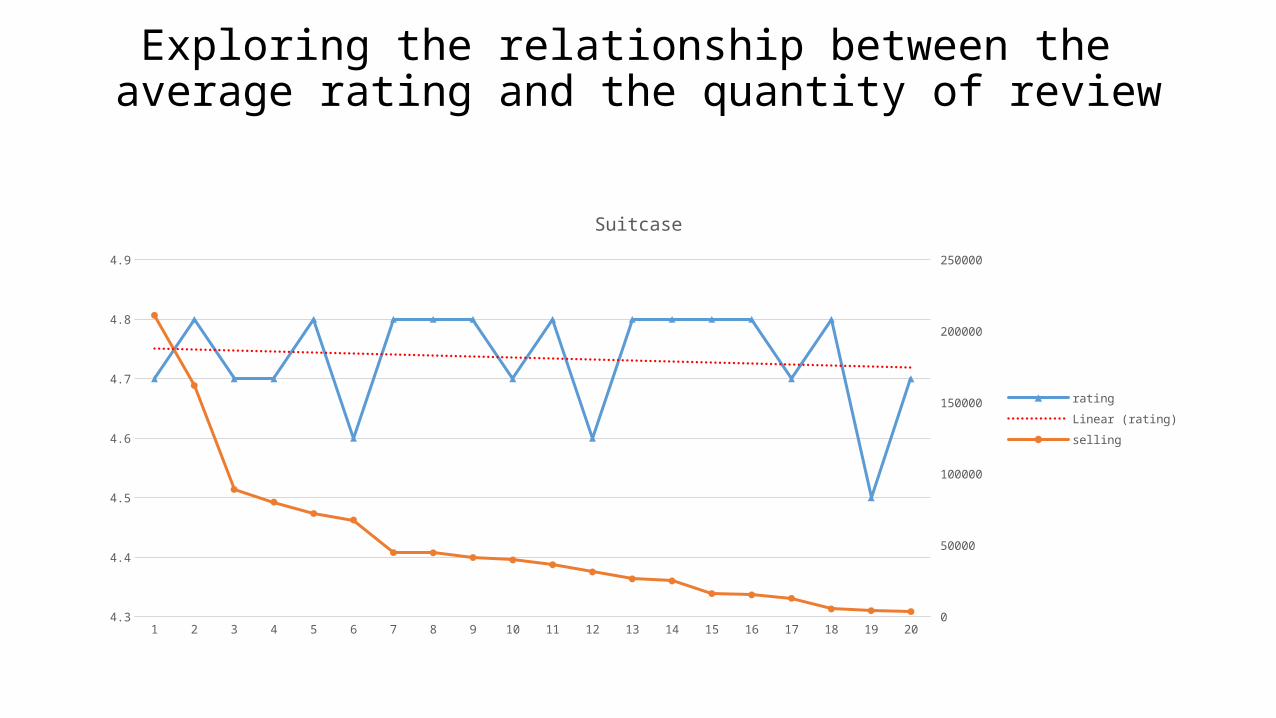
Suitcase
ratingLinear (rating)selling
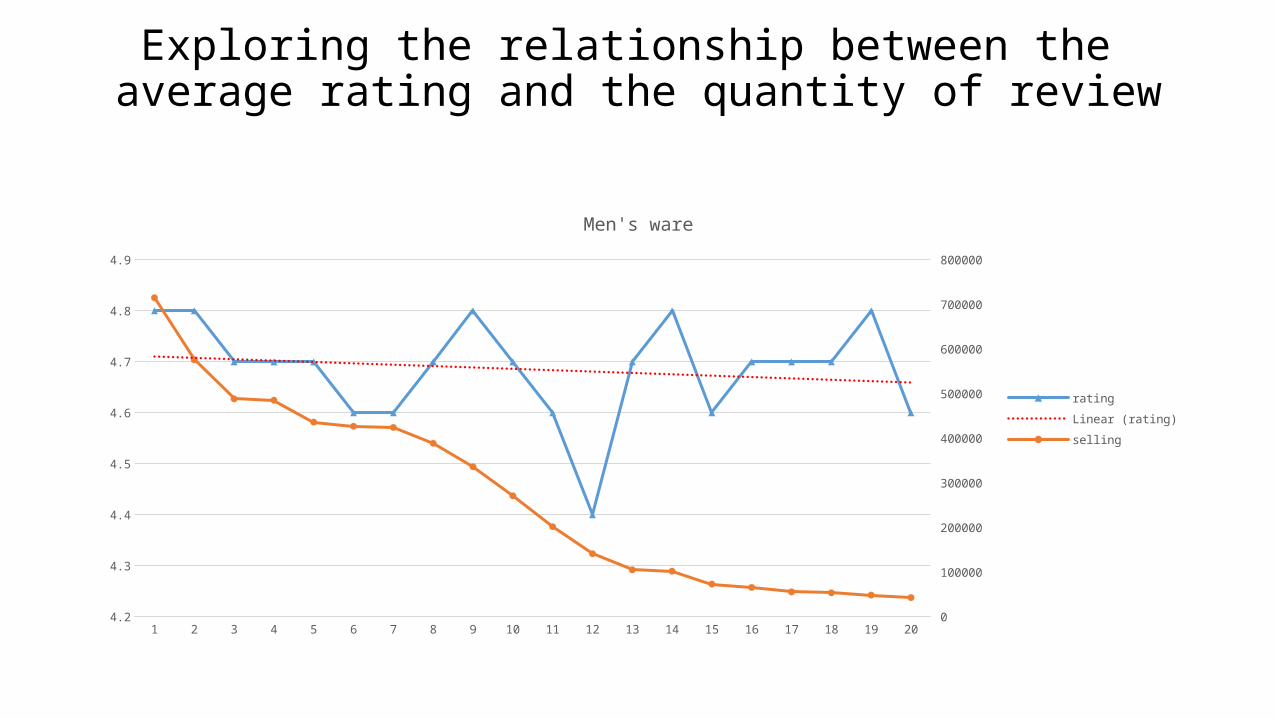
• These three pictures above are about clothing market.• The correlation coefficients of rating and selling are around 0.254,
0.249, and 0.02.• It kind of surprising that suitcases’ rating is independent from it’s
selling. Maybe people just don’t care much about the quality.
Exploring the relationship between the average rating and the quantity of review
• Reason of lemon effect : For the clothing market, consumers care more about looking, which is hard to show, than qualities. Plus, the search costs are even higher because there’re much more clothing products than electronics.
• Suggestion: Not only provide picture of the models, but also give some measurements of models, so that consumers are easier to evaluate their appearance.
Exploring the relationship between the average rating and the quantity of review
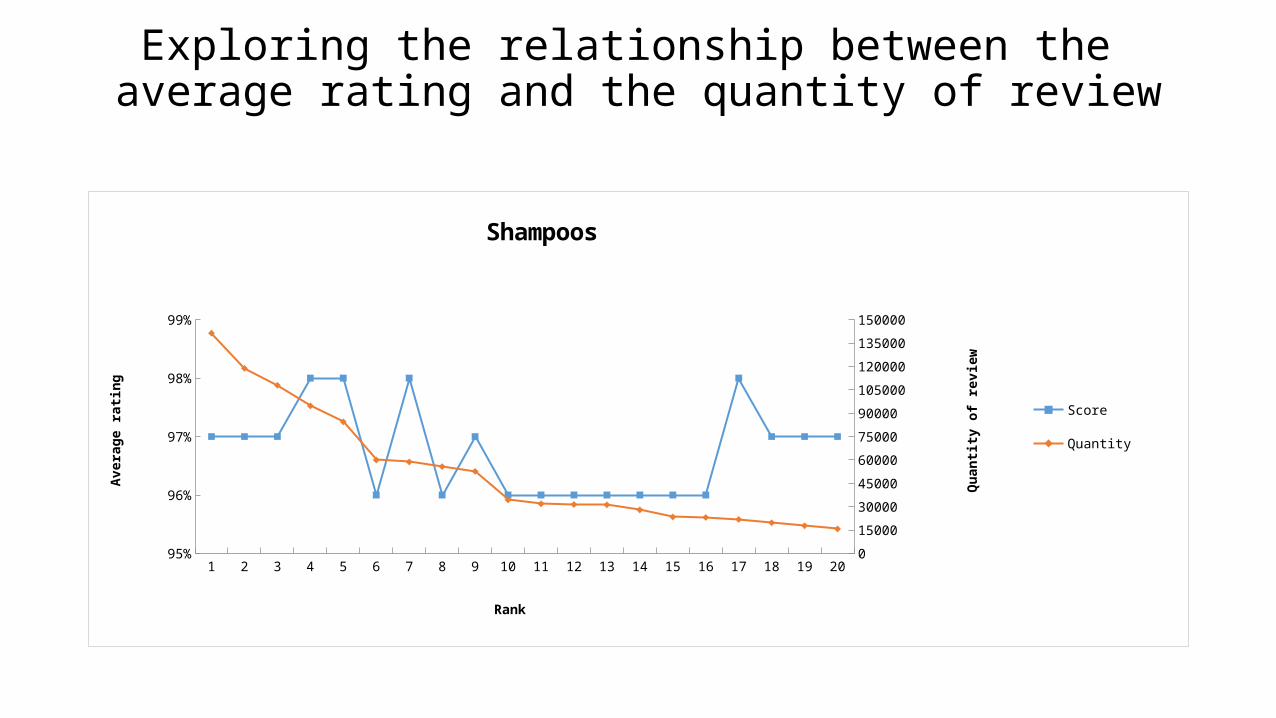
1 2 3 4 5 6 7 8 9 10 11 12 13 14 15 16 17 18 19 2095%
96%
97%
98%
99%
0
15000
30000
45000
60000
75000
90000
105000
120000
135000
150000
Shampoos
Score
Quantity
Rank
Aver
age
ratin
g
Qua
ntity
of r
evie
w
Exploring the relationship between the average rating and the quantity of review
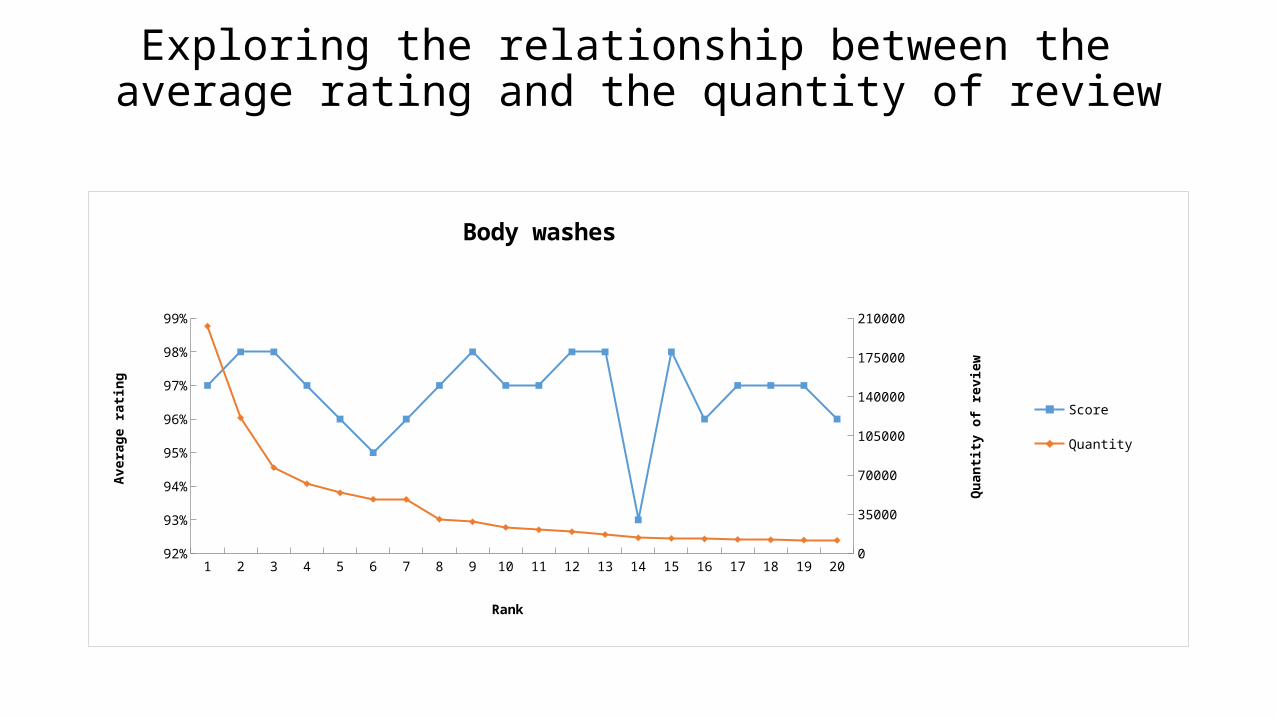
1 2 3 4 5 6 7 8 9 10 11 12 13 14 15 16 17 18 19 2092%
93%
94%
95%
96%
97%
98%
99%
0
35000
70000
105000
140000
175000
210000
Body washes
Score
Quantity
Rank
Aver
age
ratin
g
Qua
ntity
of r
evie
w
Exploring the relationship between the average rating and the quantity of review
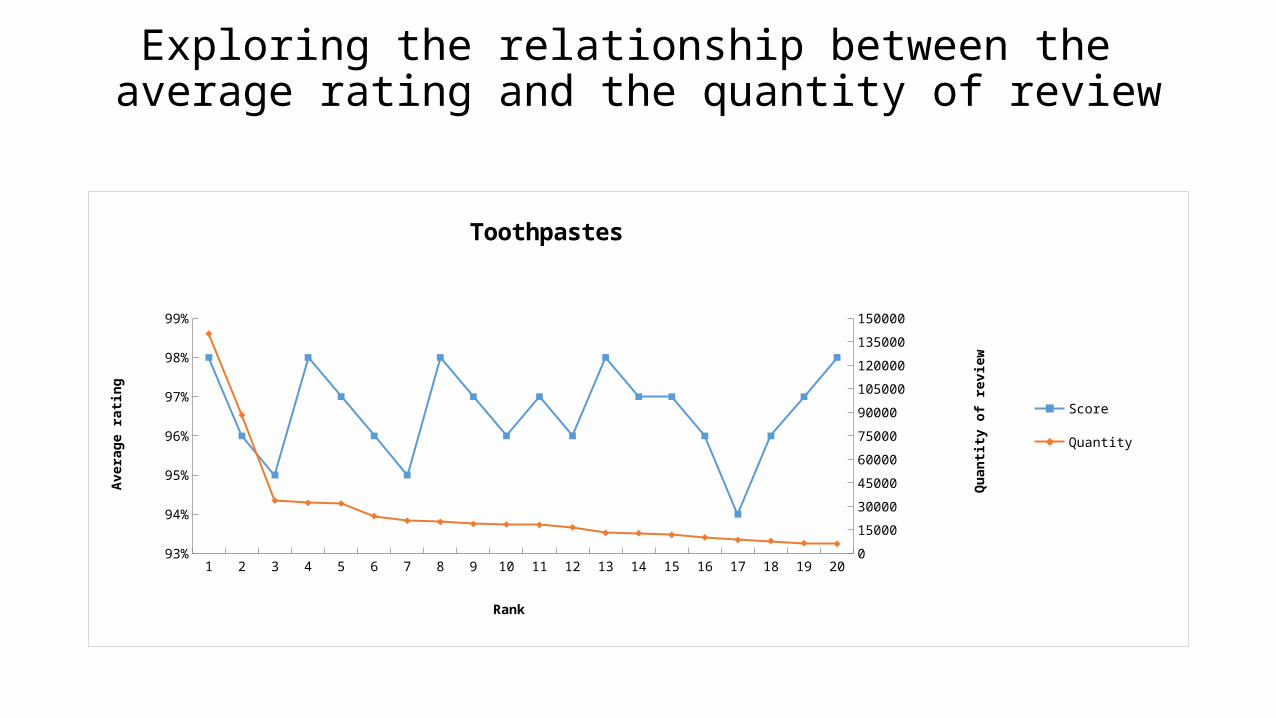
1 2 3 4 5 6 7 8 9 10 11 12 13 14 15 16 17 18 19 2093%
94%
95%
96%
97%
98%
99%
0
15000
30000
45000
60000
75000
90000
105000
120000
135000
150000
Toothpastes
Score
Quantity
Rank
Aver
age
ratin
g
Qua
ntity
of r
evie
w
Exploring the relationship between the average rating and the quantity of review
• These three pictures above are about personal care market.• The correlation coefficients of rating and selling are around 0.36,
0.15, and 0.18.• Since each of them matches our prediction, I won’t be chatty here.
Exploring the relationship between the average rating and the quantity of review
• Reason of lemon effect: The specific effect of personal care is hard to tell. But since the products do not change overtime, the lemon effect is quite low and the overall rating is relatively higher.
• Suggestion: Build brand names with high quality goods even though it takes time. Do not provide new products too often unless you got a very valuable brand name.
Exploring the relationship between the average rating and the quantity of review
Exploring the relationship between the average rating and HHI
cellphone digital camara
headphones man's ware women's ware
suitcase bodywash shampoo tooth paste4.6200
4.6400
4.6600
4.6800
4.7000
4.7200
4.7400
4.7600
4.7800
4.8000
4.8200
4.8400
0
200
400
600
800
1000
1200
1400
1600
1101.3
932.4
1361.3
780.7
1339.8
1004.8893.1
973.76 950.67
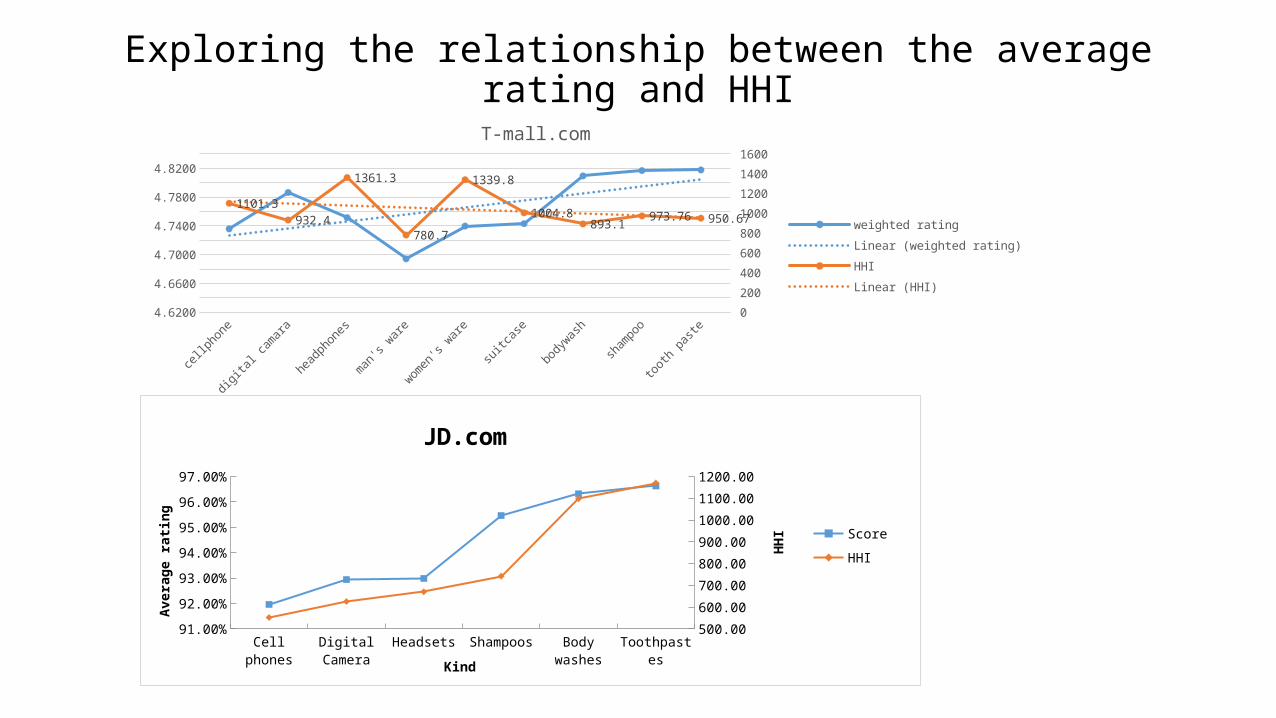
T-mall.com
weighted ratingLinear (weighted rating)HHILinear (HHI)
Cell phones Digital Camera
Headsets Shampoos Body washes Toothpastes91.00%
92.00%
93.00%
94.00%
95.00%
96.00%
97.00%
500.00
600.00
700.00
800.00
900.00
1000.00
1100.00
1200.00
JD.com
Score
HHI
Kind
Aver
age
ratin
g
HHI
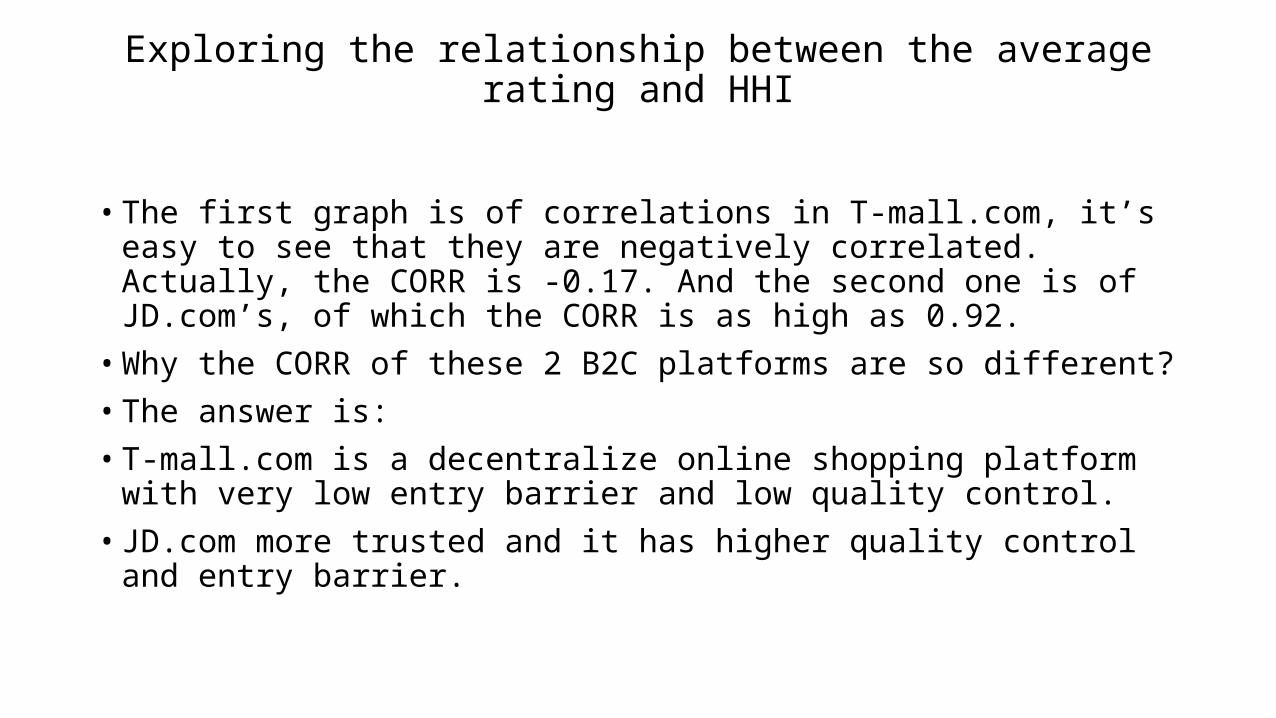
• The first graph is of correlations in T-mall.com, it’s easy to see that they are negatively correlated. Actually, the CORR is -0.17. And the second one is of JD.com’s, of which the CORR is as high as 0.92.
• Why the CORR of these 2 B2C platforms are so different?• The answer is:• T-mall.com is a decentralize online shopping platform with very low entry barrier
and low quality control.• JD.com more trusted and it has higher quality control and entry barrier.
Exploring the relationship between the average rating and HHI
• More specifically, T-mall is more like a perfect competitive market, so the higher HHI hurts consumers for the sake of monopoly power. And JD.com is a centralize platform which monitoring the best-seller and keep their quality in a relative high level. The more one kind is sold, the more JD concern about.
Exploring the relationship between the average rating and HHI
Comparing JD.com and T-mall.com
• Suggestions:• Decentralize platforms like T-mall should make the brands in it to
compete more severely.• Centralize platforms like JD.com should focus more on their best-
sellers. • These are ways to improve their own consumer satisfaction, and that
is to lessen the lemon effect in online shopping.• And that’s all for our presentation, and there’re more details in our
paper. Thanks for your time!