lecture 8 section 3.2 polynomial equations
TRANSCRIPT
MATH 107
Section 3.2
Polynomial Functions
2© 2010 Pearson Education, Inc. All rights reserved
Definitions
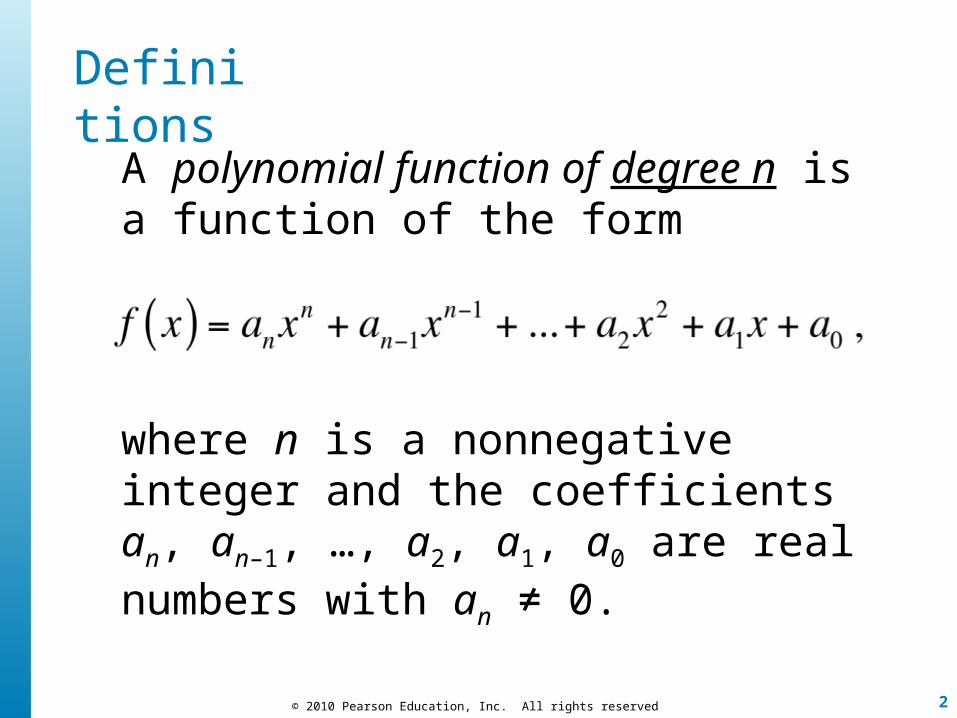
A polynomial function of degree n is a function of the form
where n is a nonnegative integer and the coefficients an, an–1, …, a2, a1, a0 are real numbers with an ≠ 0.
3© 2010 Pearson Education, Inc. All rights reserved
Definitions
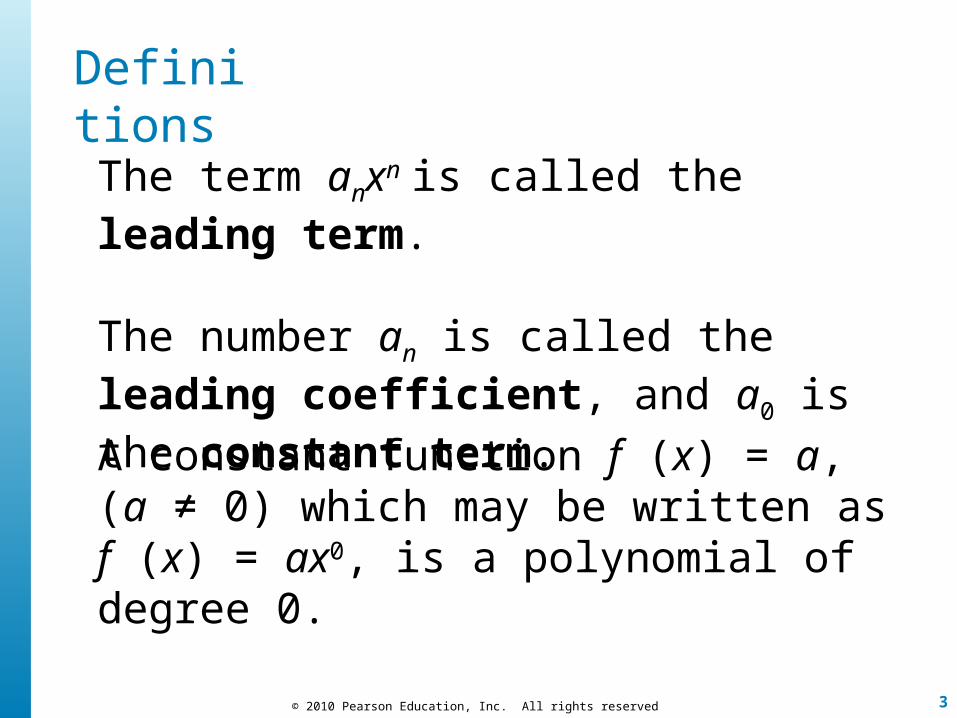
A constant function f (x) = a, (a ≠ 0) which may be written as f (x) = ax0, is a polynomial of degree 0.
The term anxn is called the leading term.
The number an is called the leading coefficient, and a0 is the constant term.
4© 2010 Pearson Education, Inc. All rights reserved
Definitions
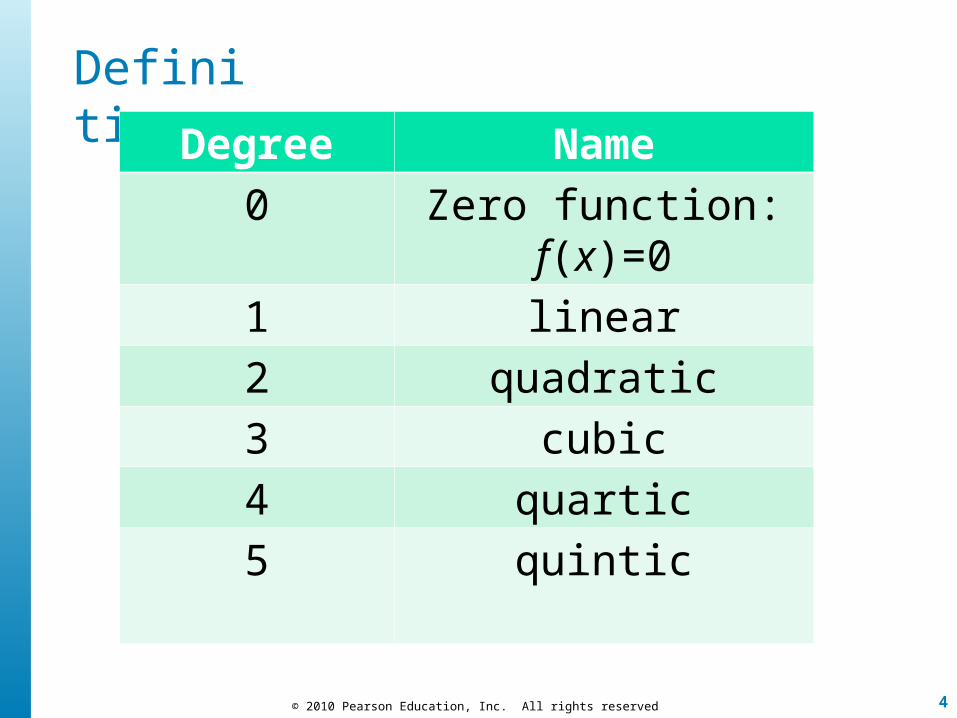
Degree Name
0 Zero function: f(x)=0
1 linear
2 quadratic
3 cubic
4 quartic
5 quintic

5© 2010 Pearson Education, Inc. All rights reserved
COMMON PROPERTIES OFPOLYNOMIAL FUNCTIONS
1. The domain of a polynomial function is the set of all real numbers.
6© 2010 Pearson Education, Inc. All rights reserved
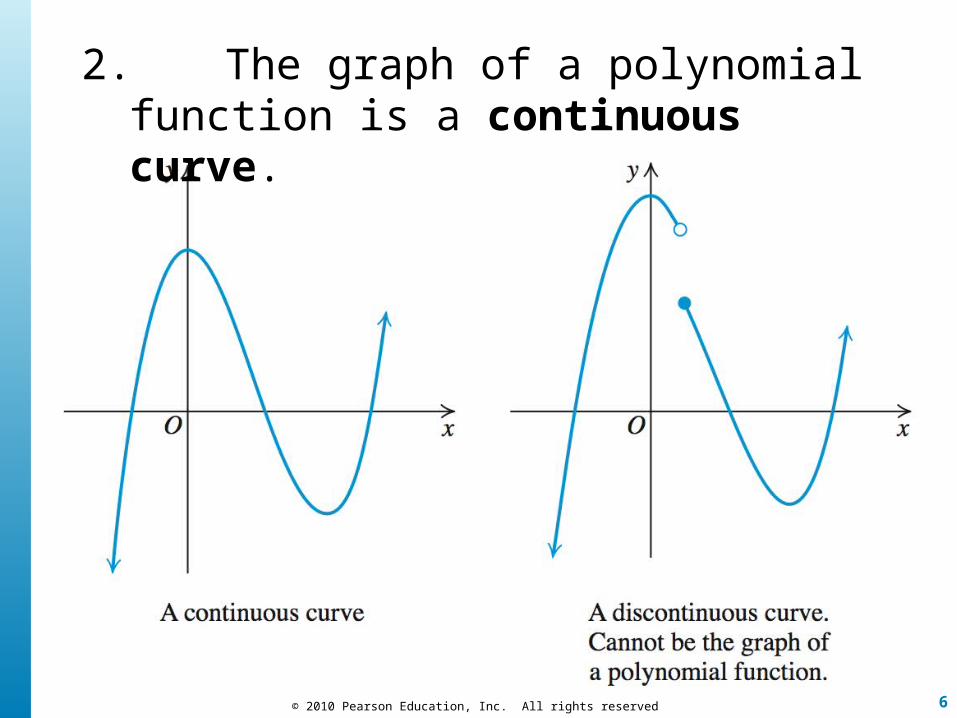
2. The graph of a polynomial function is a continuous curve.
7© 2010 Pearson Education, Inc. All rights reserved
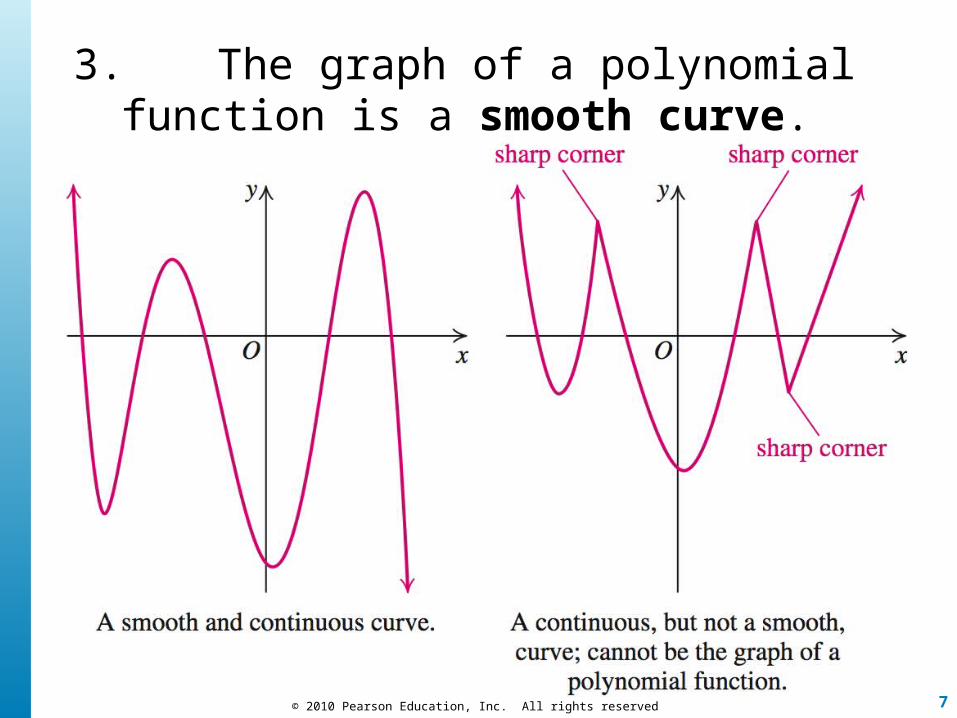
3. The graph of a polynomial function is a smooth curve.
8© 2010 Pearson Education, Inc. All rights reserved
EXAMPLE 1 Polynomial Functions
State which functions are polynomial functions. For each polynomial function, find its degree, the leading term, and the leading coefficient.
f (x) = 5x4 – 2x + 7
Solution

9© 2010 Pearson Education, Inc. All rights reserved
END BEHAVIOR OF POLYNOMIAL FUNCTIONS
Case 1
n Evena > 0
The graph rises to the left and right, similar to y = x2.
10© 2010 Pearson Education, Inc. All rights reserved
END BEHAVIOR OF POLYNOMIAL FUNCTIONS
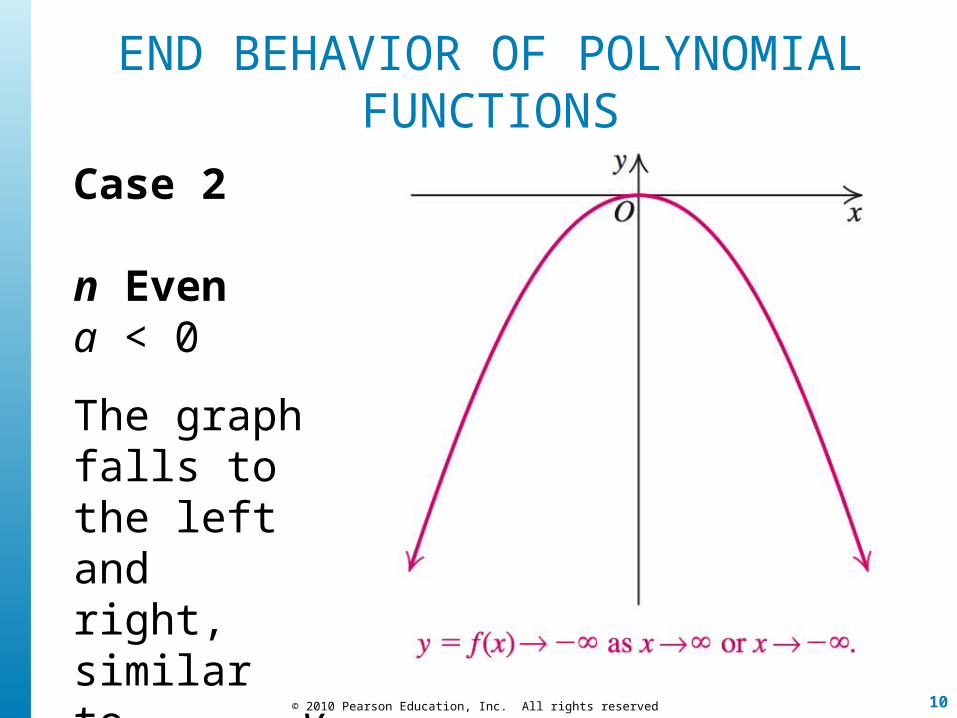
Case 2
n Evena < 0
The graph falls to the left and right, similar to y = –x2.
11© 2010 Pearson Education, Inc. All rights reserved
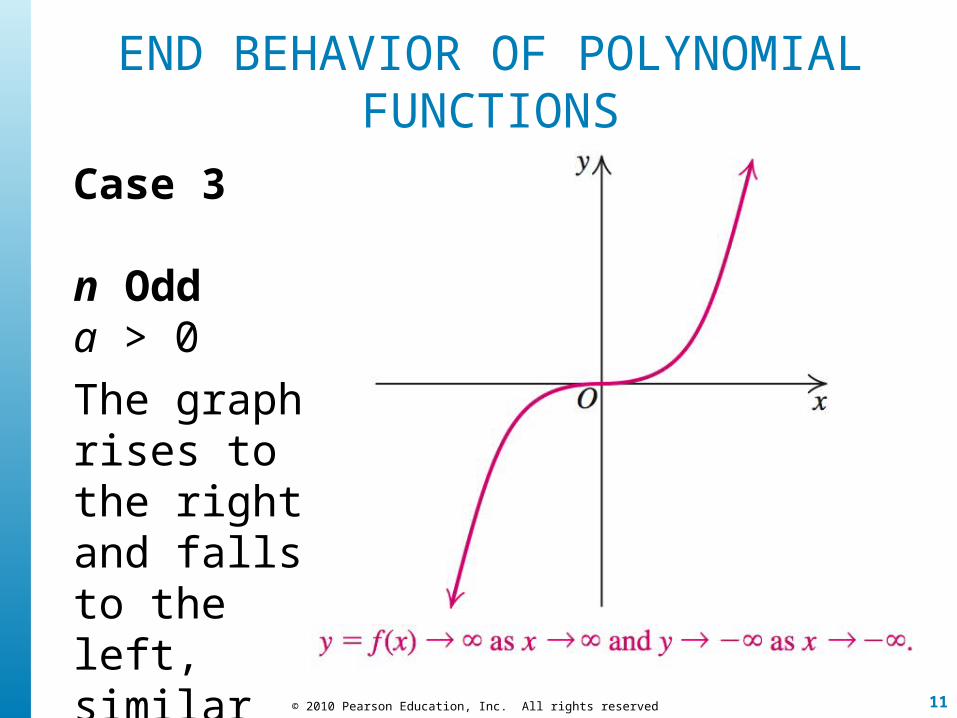
END BEHAVIOR OF POLYNOMIAL FUNCTIONS
Case 3
n Odda > 0
The graph rises to the right and falls to the left, similar to y = x3.
12© 2010 Pearson Education, Inc. All rights reserved
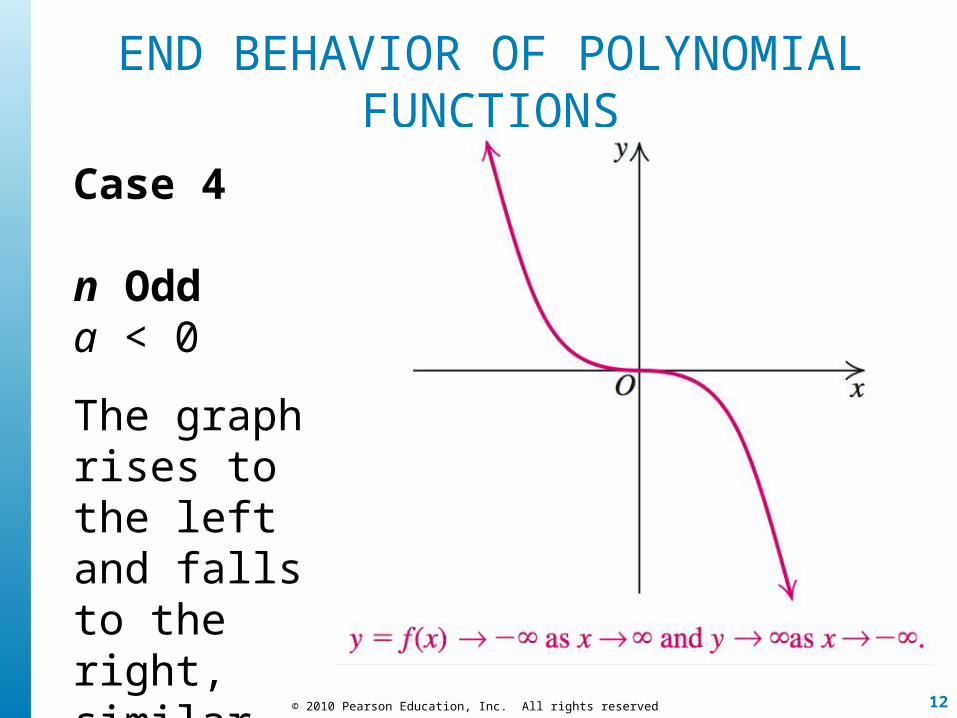
END BEHAVIOR OF POLYNOMIAL FUNCTIONS
Case 4
n Odda < 0
The graph rises to the left and falls to the right, similar to y = –x3.
13© 2010 Pearson Education, Inc. All rights reserved
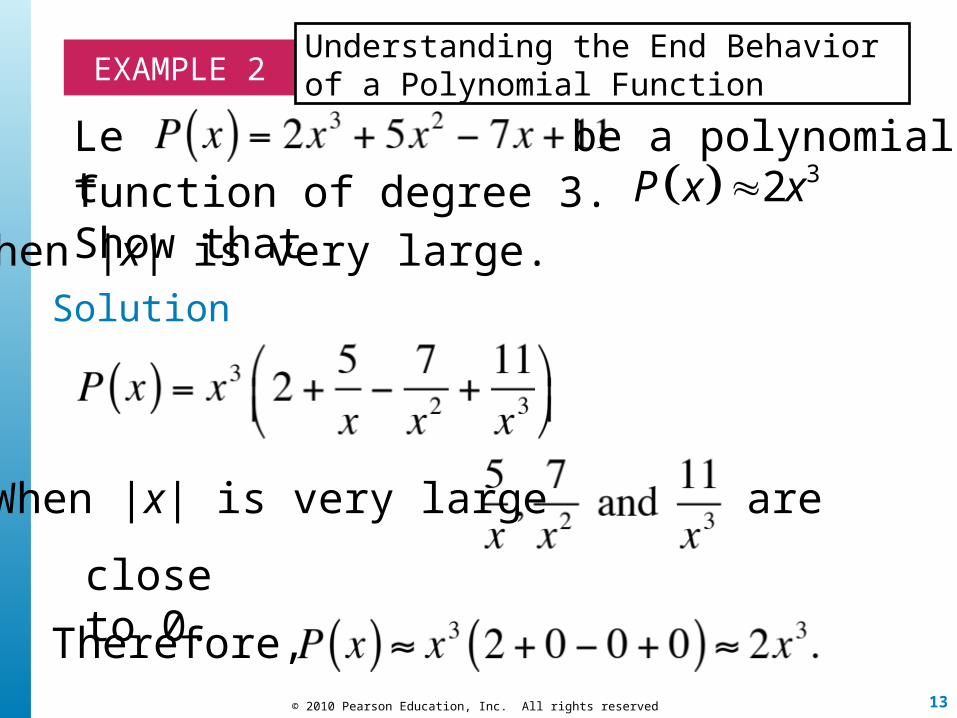
EXAMPLE 2Understanding the End Behavior of a Polynomial Function
Letfunction of degree 3. Show that
be a polynomial 32P x x
when |x| is very large.Solution
When |x| is very large are
close to 0.
Therefore,
14© 2010 Pearson Education, Inc. All rights reserved
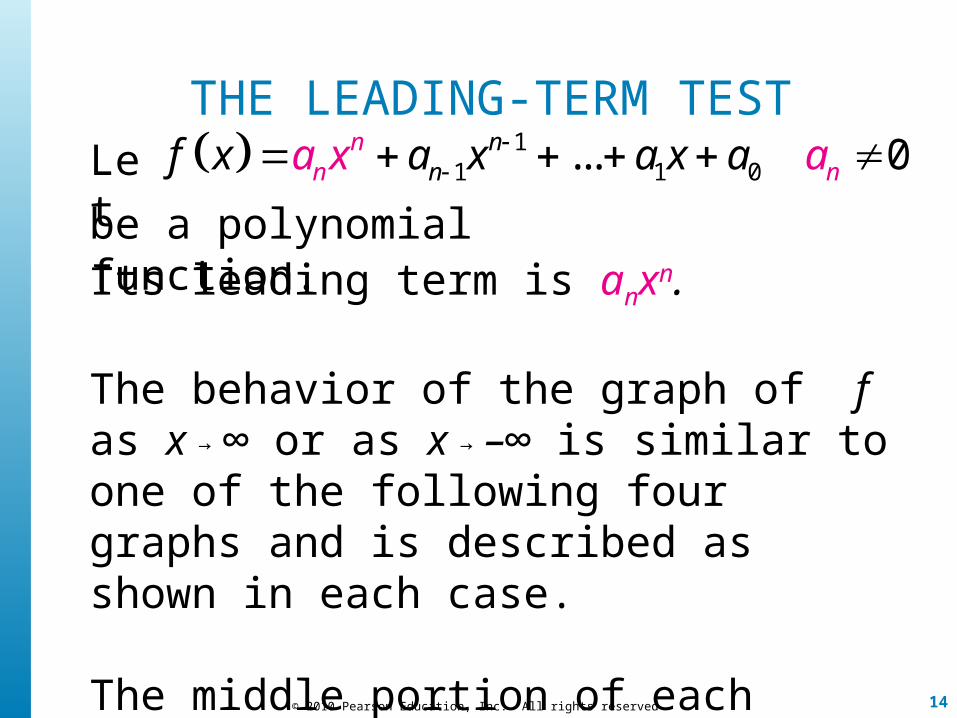
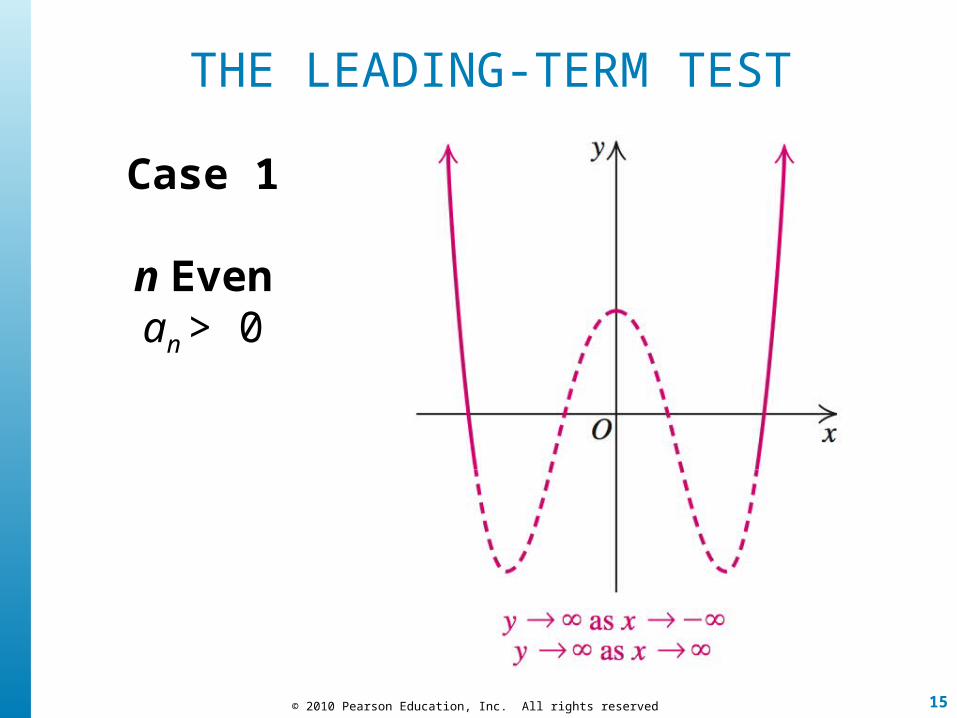
THE LEADING-TERM TEST
Its leading term is anxn.
The behavior of the graph of f as x → ∞ or as x → –∞ is similar to one of the following four graphs and is described as shown in each case.
The middle portion of each graph, indicated by the dashed lines, is not determined by this test.
Let 11 1 0... 0n n
nn nf x a x ax ax aa
be a polynomial function.
15© 2010 Pearson Education, Inc. All rights reserved
Case 1
n Evenan > 0
THE LEADING-TERM TEST
16© 2010 Pearson Education, Inc. All rights reserved
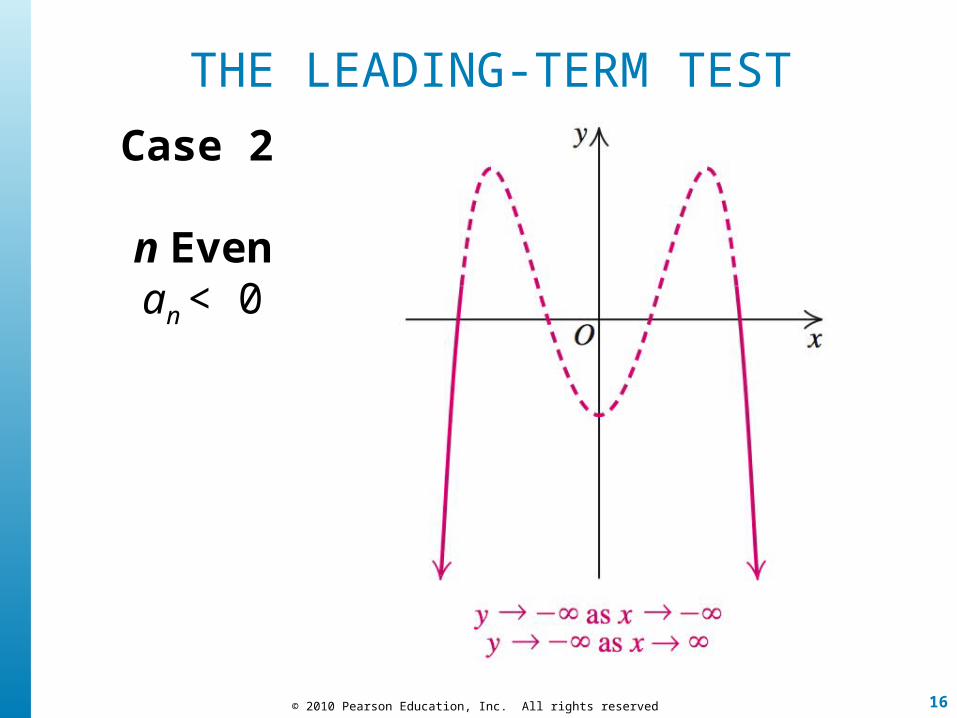
Case 2
n Evenan < 0
THE LEADING-TERM TEST
17© 2010 Pearson Education, Inc. All rights reserved
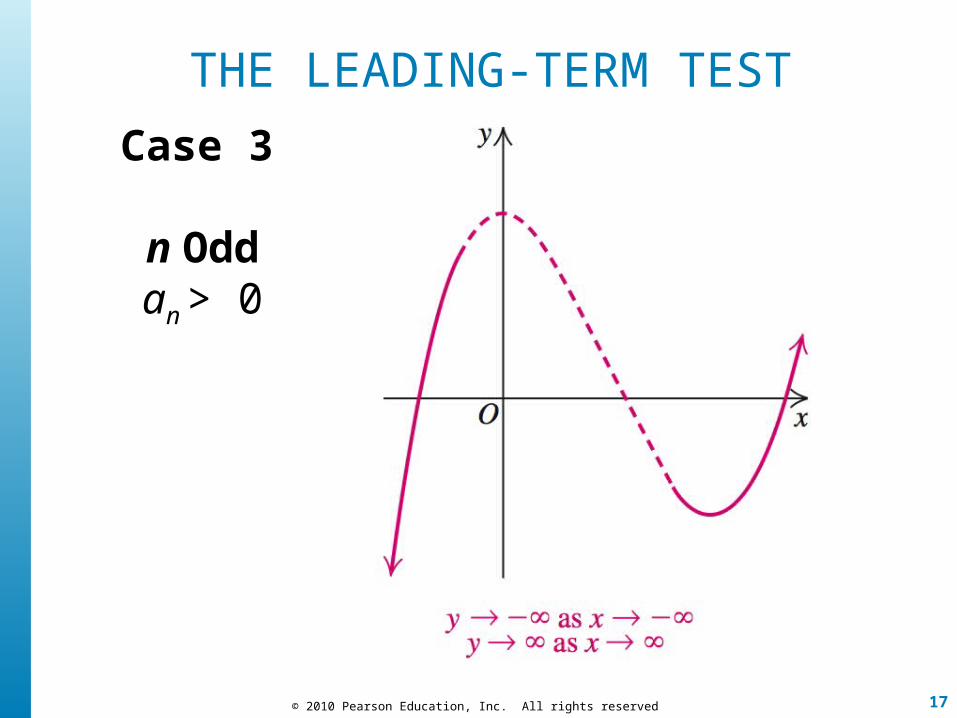
Case 3
n Oddan > 0
THE LEADING-TERM TEST

18© 2010 Pearson Education, Inc. All rights reserved
Case 4
n Oddan < 0
THE LEADING-TERM TEST
19© 2010 Pearson Education, Inc. All rights reserved
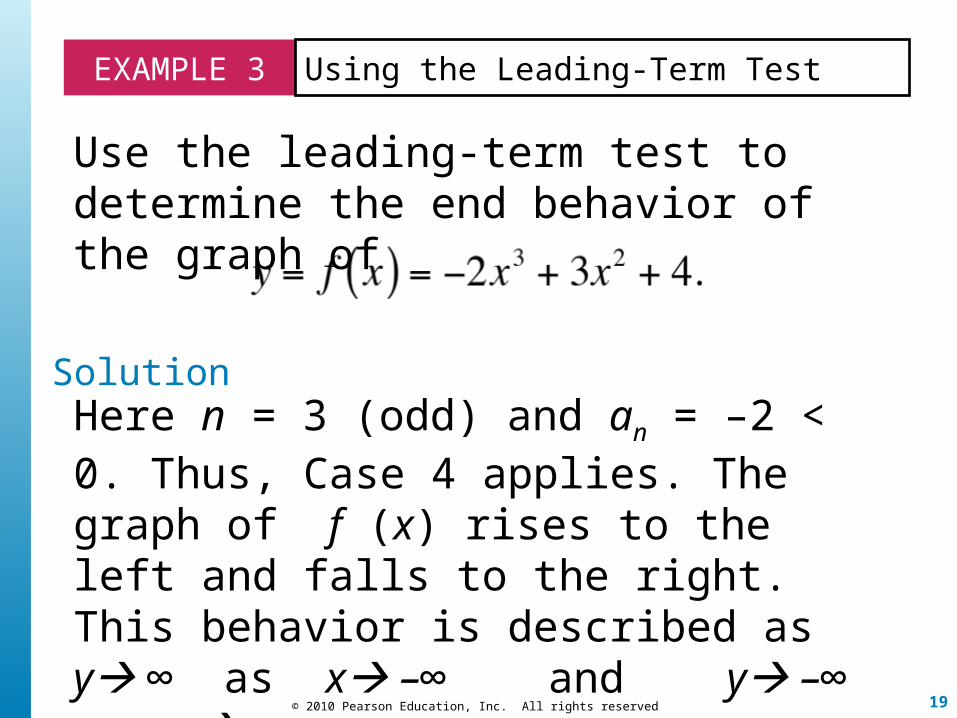
EXAMPLE 3 Using the Leading-Term Test
Use the leading-term test to determine the end behavior of the graph of
SolutionHere n = 3 (odd) and an = –2 < 0. Thus, Case 4 applies. The graph of f (x) rises to the left and falls to the right. This behavior is described as y ∞ as x –∞ and y –∞ as x ∞.
20© 2010 Pearson Education, Inc. All rights reserved
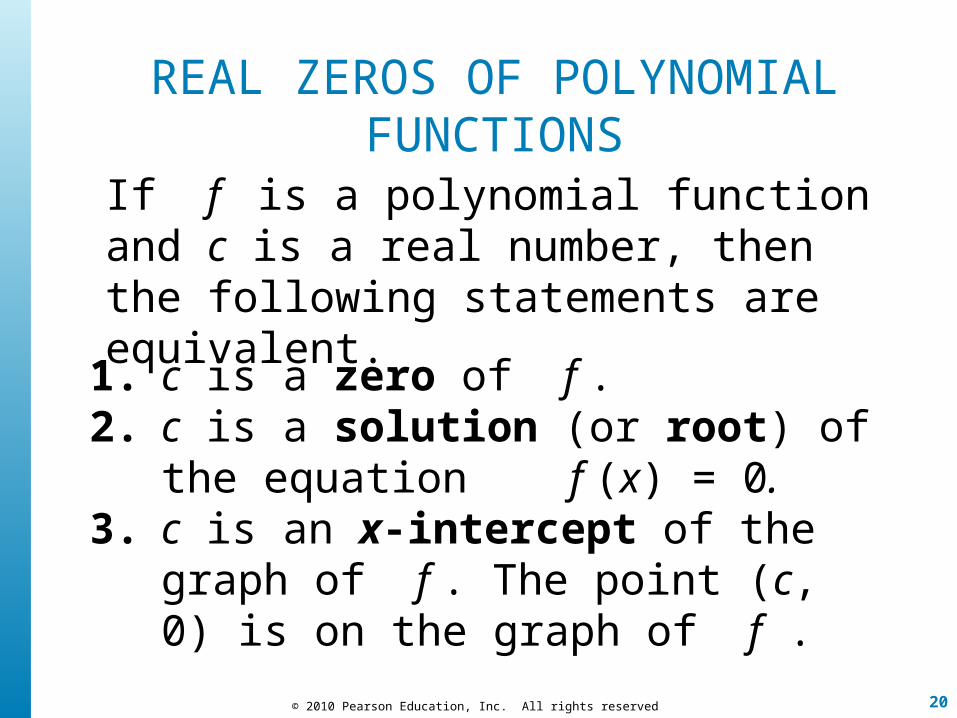
REAL ZEROS OF POLYNOMIAL FUNCTIONS
1. c is a zero of f .2. c is a solution (or root) of the equation
f (x) = 0.3. c is an x-intercept of the graph of f . The
point (c, 0) is on the graph of f .
If f is a polynomial function and c is a real number, then the following statements are equivalent.

21© 2010 Pearson Education, Inc. All rights reserved
EXAMPLE 4 Finding the Zeros of a Polynomial Function
Find all zeros of each polynomial function.
3 2
3 2
a. 2 2
b. 2 2
f x x x x
g x x x x
SolutionFactor f (x) and then solve f (x) = 0.
22© 2010 Pearson Education, Inc. All rights reserved
REAL ZEROS OF POLYNOMIAL FUNCTIONS
A polynomial function of degree n with real coefficients has, at most, n real zeros.
23© 2010 Pearson Education, Inc. All rights reserved
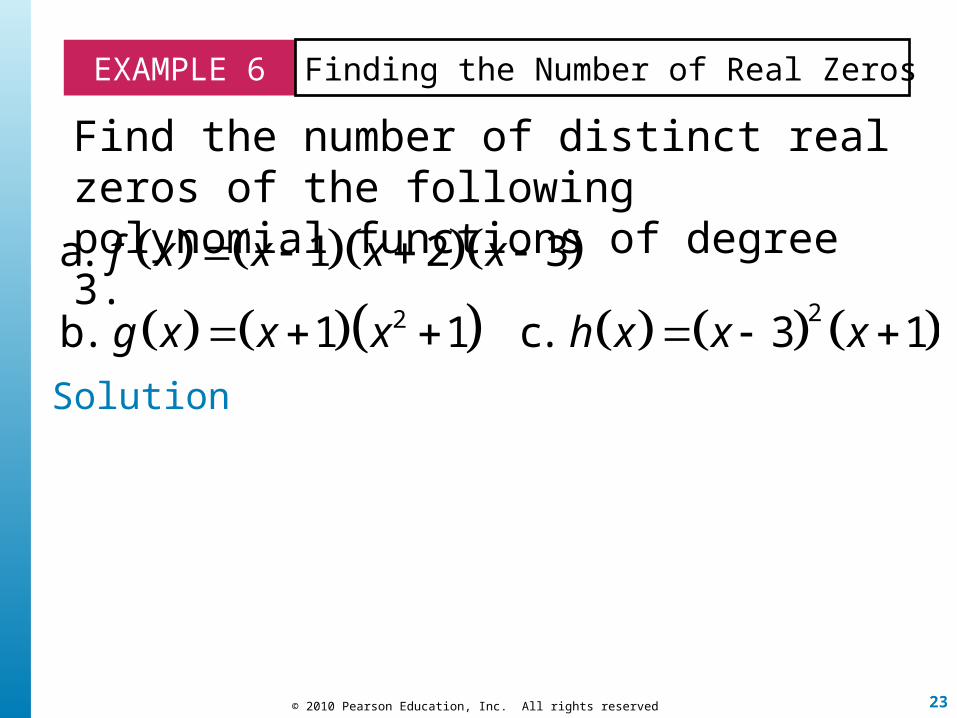
EXAMPLE 6 Finding the Number of Real Zeros
Find the number of distinct real zeros of the following polynomial functions of degree 3.
Solution
22
a. 1 2 3
b. 1 1 c. 3 1
f x x x x
g x x x h x x x
24© 2010 Pearson Education, Inc. All rights reserved
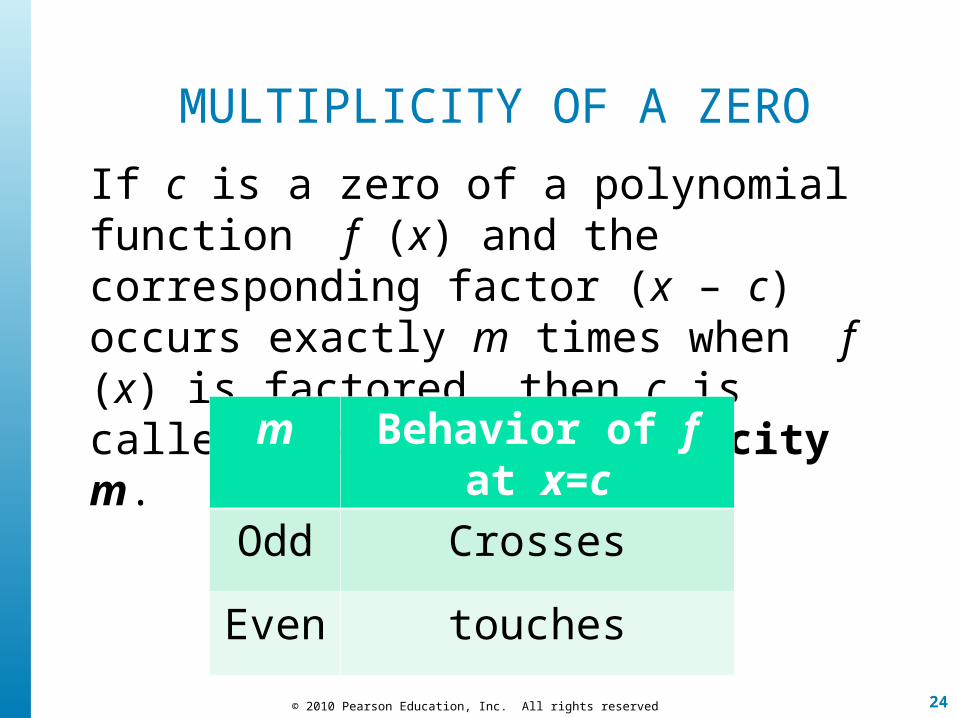
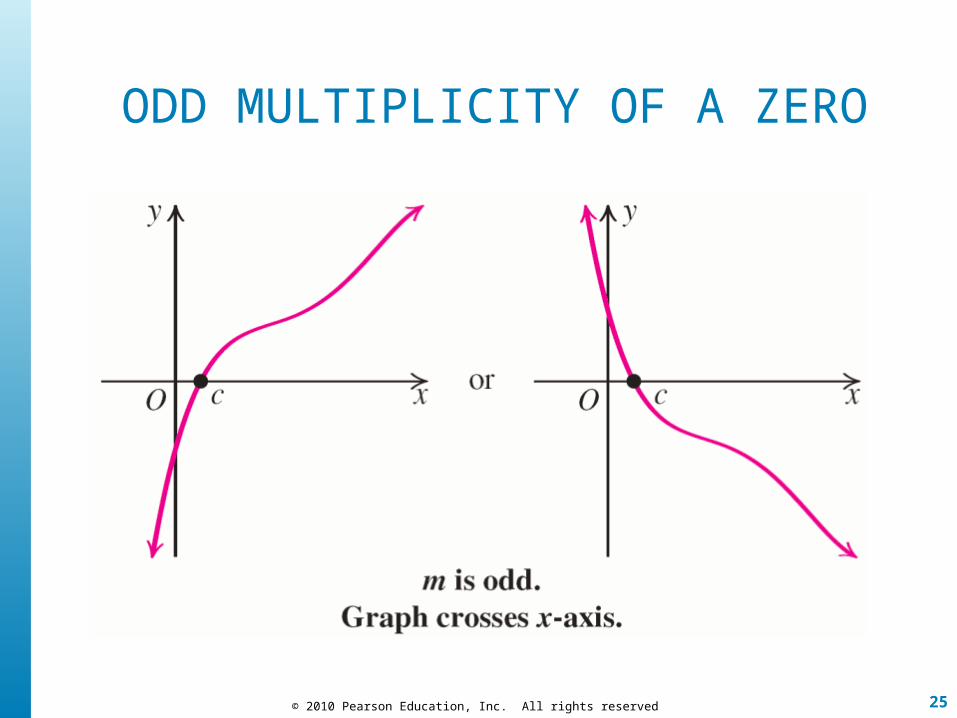
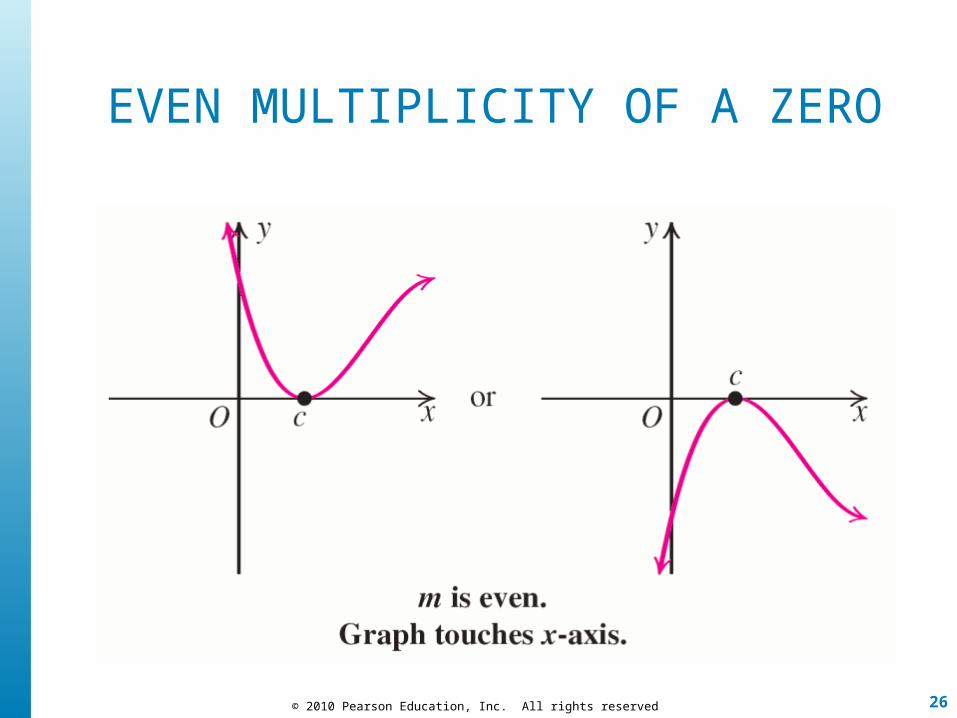
MULTIPLICITY OF A ZERO
If c is a zero of a polynomial function f (x) and the corresponding factor (x – c) occurs exactly m times when f (x) is factored, then c is called a zero of multiplicity m.
m Behavior of f at x=c
Odd Crosses
Even touches
25© 2010 Pearson Education, Inc. All rights reserved
ODD MULTIPLICITY OF A ZERO
26© 2010 Pearson Education, Inc. All rights reserved
EVEN MULTIPLICITY OF A ZERO
27© 2010 Pearson Education, Inc. All rights reserved
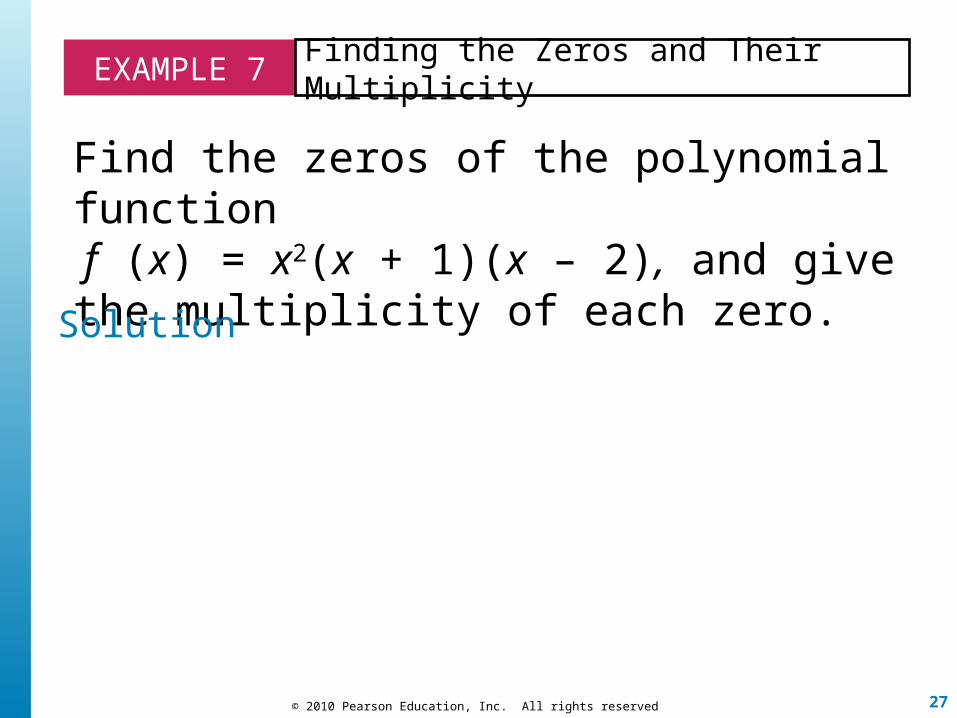
EXAMPLE 7 Finding the Zeros and Their Multiplicity
Find the zeros of the polynomial function f (x) = x2(x + 1)(x – 2), and give the multiplicity of each zero.
Solution
28© 2010 Pearson Education, Inc. All rights reserved
TURNING POINTS
A local (or relative) maximum value of f is higher than any nearby point on the graph.
A local (or relative) minimum value of f is lower than any nearby point on the graph.
The graph points corresponding to the local maximum and local minimum values are called turning points. At each turning point the graph changes from increasing to decreasing or vice versa.
29© 2010 Pearson Education, Inc. All rights reserved
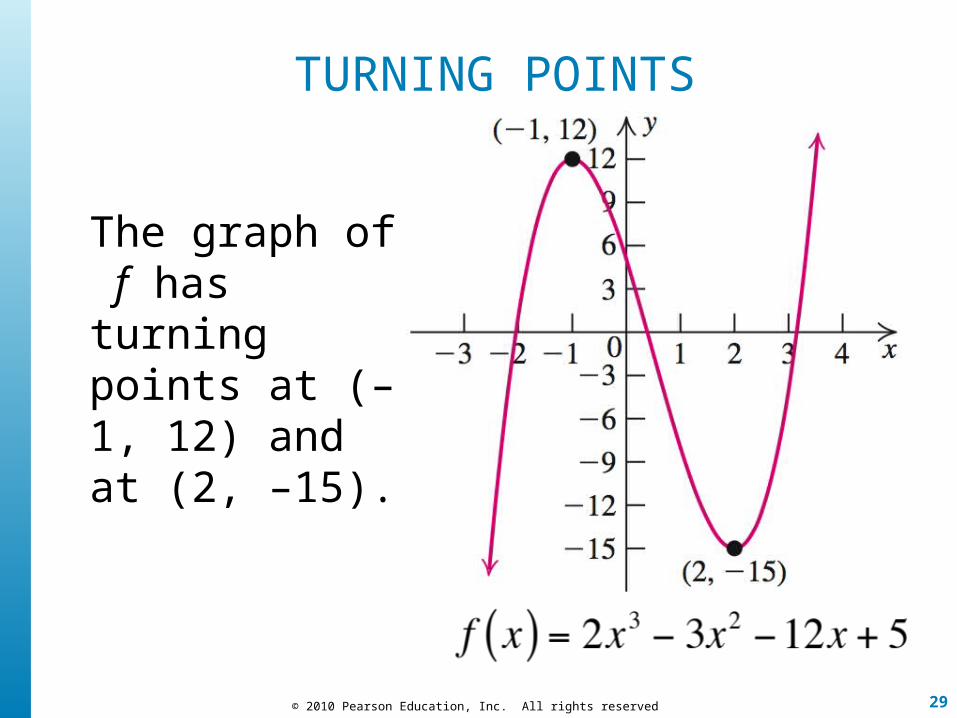
TURNING POINTS
The graph of f has turning points at (–1, 12) and at (2, –15).
30© 2010 Pearson Education, Inc. All rights reserved
NUMBER OF TURNING POINTS
If f (x) is a polynomial of degree n, then the graph of f has, at most, (n – 1) turning points.
31© 2010 Pearson Education, Inc. All rights reserved
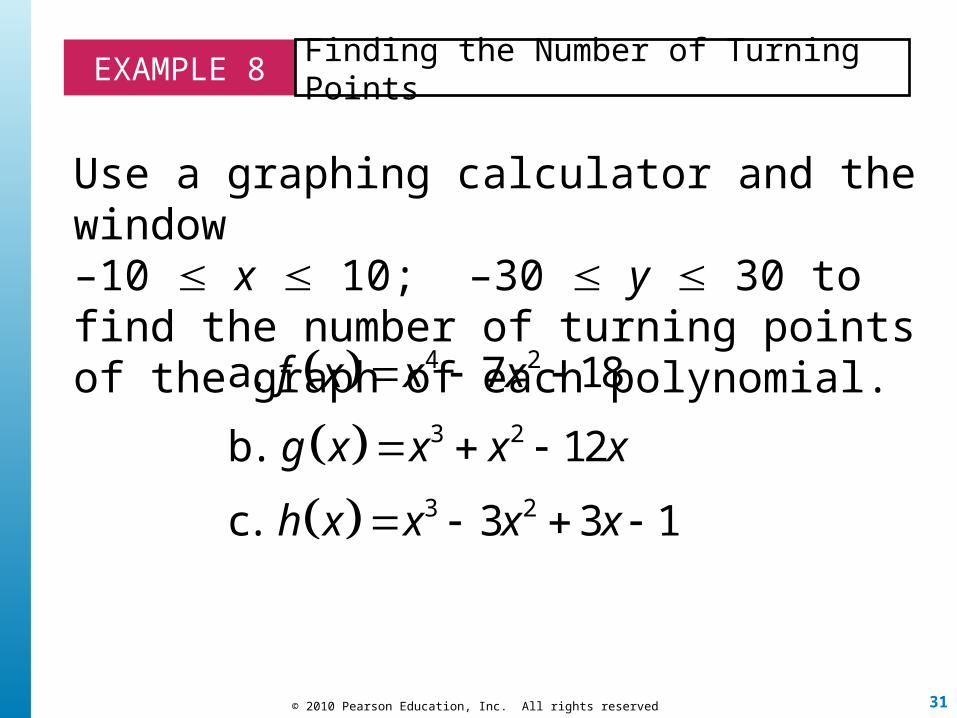
EXAMPLE 8 Finding the Number of Turning Points
Use a graphing calculator and the window –10 x 10; –30 y 30 to find the number of turning points of the graph of each polynomial.
4 2
3 2
3 2
a. 7 18
b. 12
c. 3 3 1
f x x x
g x x x x
h x x x x
32© 2010 Pearson Education, Inc. All rights reserved
EXAMPLE 8 Finding the Number of Turning Points
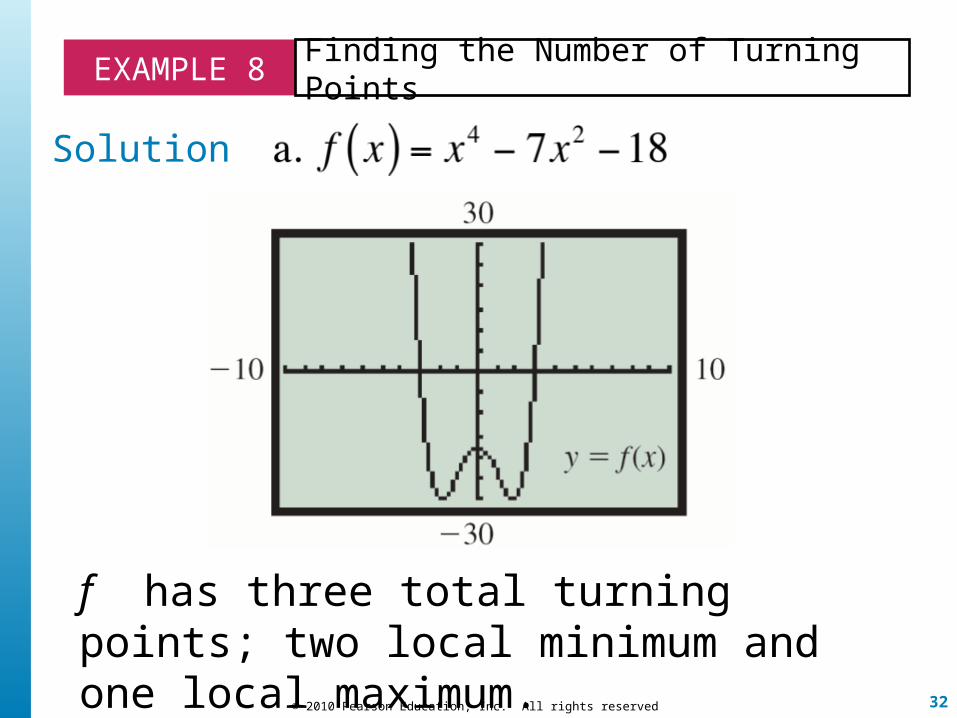
Solution
f has three total turning points; two local minimum and one local maximum.
33© 2010 Pearson Education, Inc. All rights reserved
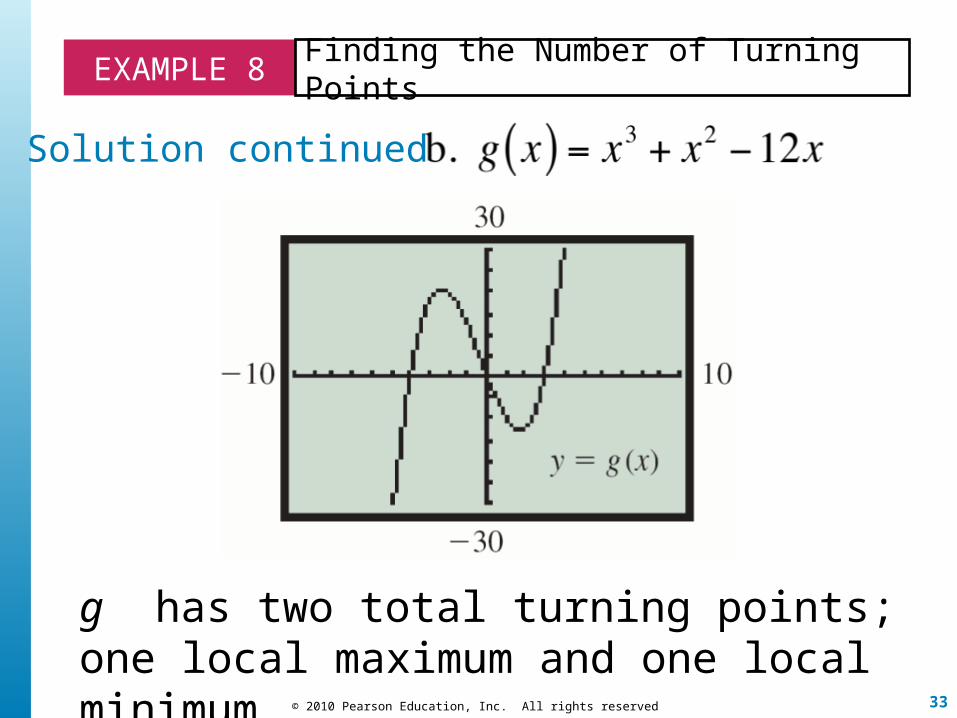
EXAMPLE 8 Finding the Number of Turning Points
Solution continued
g has two total turning points; one local maximum and one local minimum.
34© 2010 Pearson Education, Inc. All rights reserved
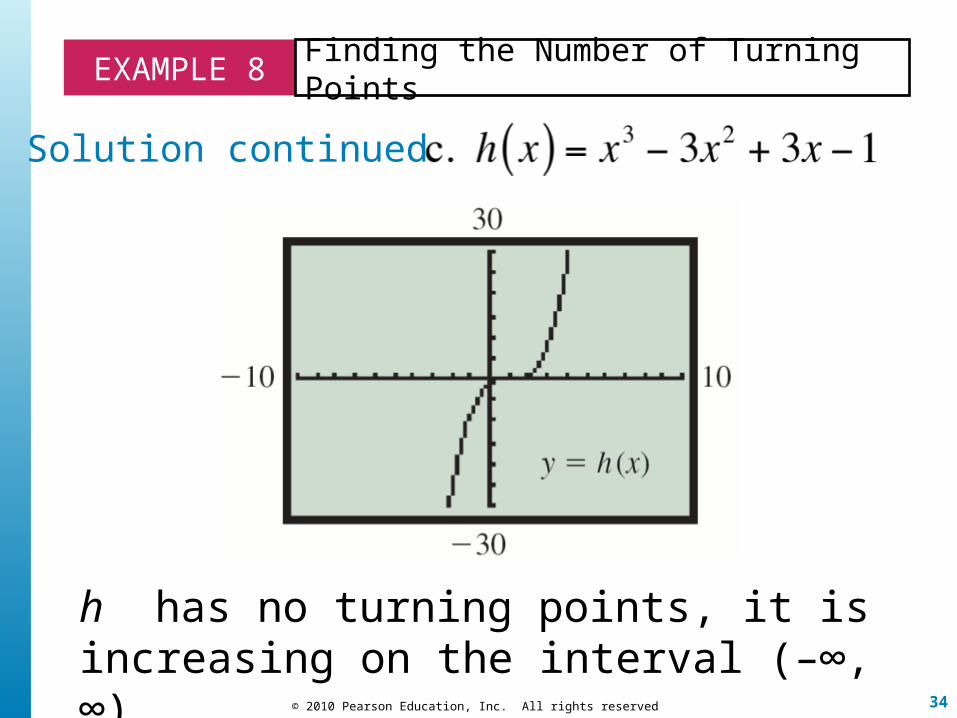
EXAMPLE 8 Finding the Number of Turning Points
Solution continued
h has no turning points, it is increasing on the interval (–∞, ∞).
35© 2010 Pearson Education, Inc. All rights reserved
GRAPHING A POLYNOMIAL FUNCTION
Step 1 Determine the end behavior. Apply the leading-term test.
Step 2 Find the zeros of the polynomial function. Set f (x) = 0 and solve. The zeros give the x-intercepts.
Step 3 Find the y-intercept by computing f (0).
36© 2010 Pearson Education, Inc. All rights reserved
Step 4 Draw the graph. Use the multiplicities of each zero to decide whether the graph crosses the x-axis.
Use the fact that the number of turning points is less than the degree of the polynomial to check whether the graph is drawn correctly.
37© 2010 Pearson Education, Inc. All rights reserved
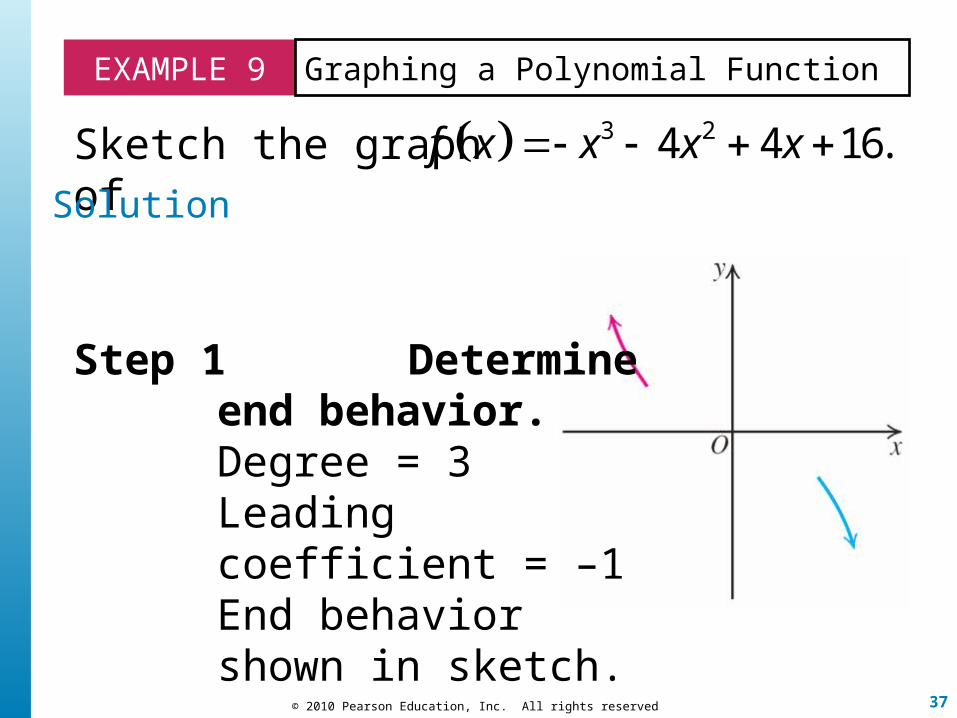
EXAMPLE 9 Graphing a Polynomial Function
Sketch the graph of 3 24 4 16.f x x x x Solution
Step 1 Determine end behavior. Degree = 3 Leading coefficient = –1End behavior shown in sketch.
38© 2010 Pearson Education, Inc. All rights reserved
EXAMPLE 9 Graphing a Polynomial Function
Solution continued
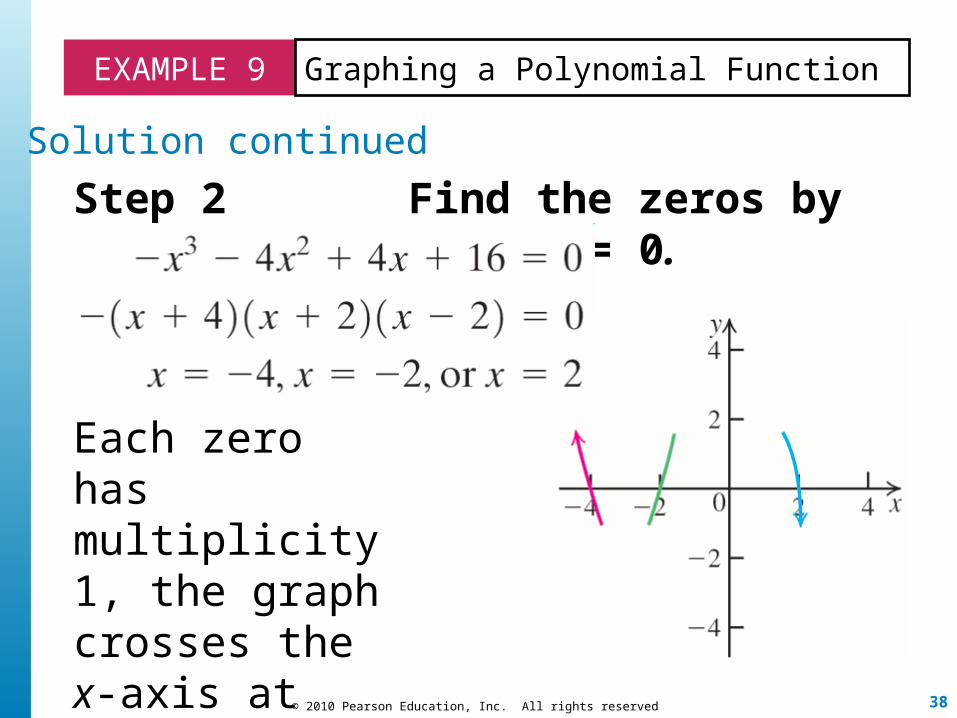
Step 2 Find the zeros by setting f (x) = 0.
Each zero has multiplicity 1, the graph crosses the x-axis at each zero.
39© 2010 Pearson Education, Inc. All rights reserved
EXAMPLE 9 Graphing a Polynomial Function
Solution continued
Step 3 Find the y-intercept by computing f (0).The y-intercept is f (0) = 16. The graph passes through (0, 16).

40© 2010 Pearson Education, Inc. All rights reserved
EXAMPLE 9 Graphing a Polynomial Function
Solution continued
Step 4 Draw the graph.
The number of turning points is 2, which is less than 3, the degree of f.