lecture 8 hypothesis testing and statistical significance msc (addictions) addictions department
TRANSCRIPT

LECTURE 8
HYPOTHESIS TESTING AND STATISTICAL SIGNIFICANCE
MSc (Addictions)
Addictions Department
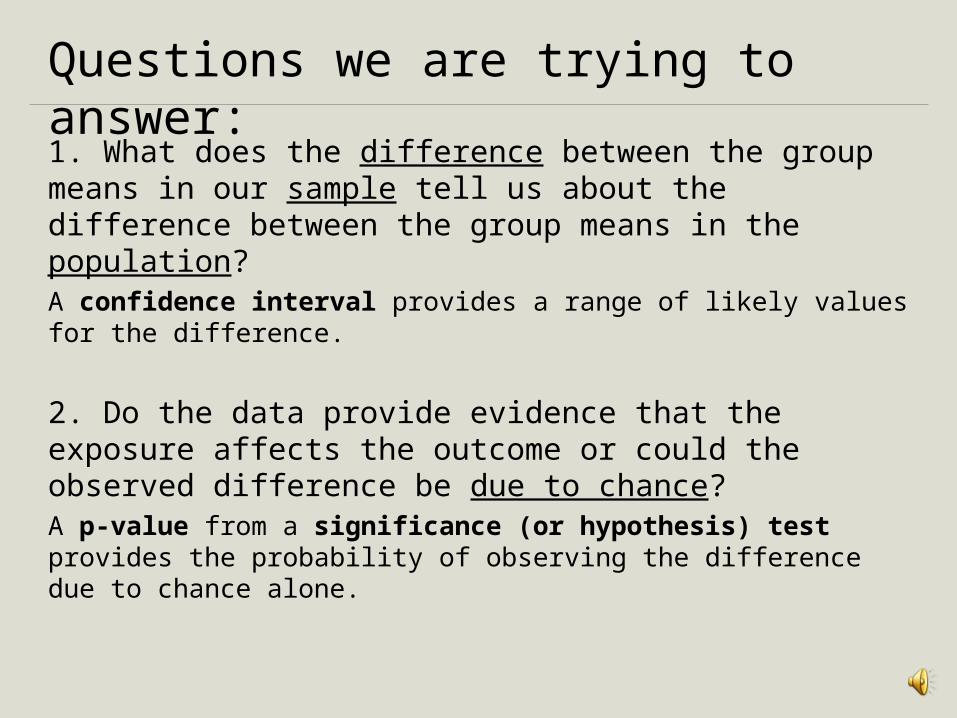
Questions we are trying to answer:
1. What does the difference between the group means in our sample tell us about the difference between the group means in the population?A confidence interval provides a range of likely values for the difference.
2. Do the data provide evidence that the exposure affects the outcome or could the observed difference be due to chance?A p-value from a significance (or hypothesis) test provides the probability of observing the difference due to chance alone.
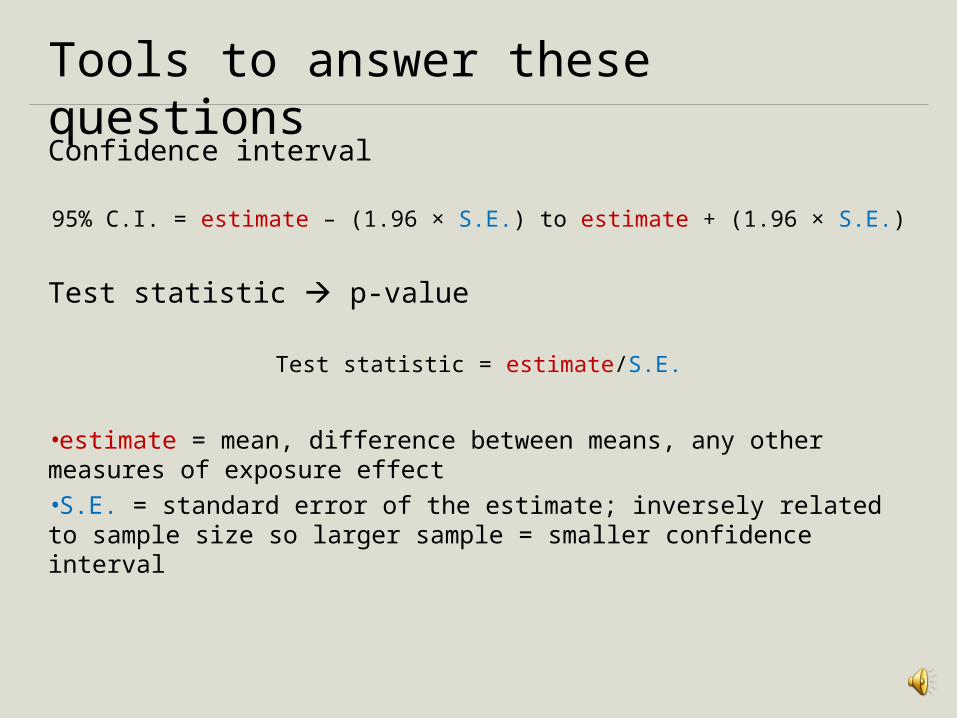
Tools to answer these questions
Confidence interval
95% C.I. = estimate – (1.96 × S.E.) to estimate + (1.96 × S.E.)
Test statistic p-value
Test statistic = estimate/S.E.
•estimate = mean, difference between means, any other measures of exposure effect•S.E. = standard error of the estimate; inversely related to sample size so larger sample = smaller confidence interval
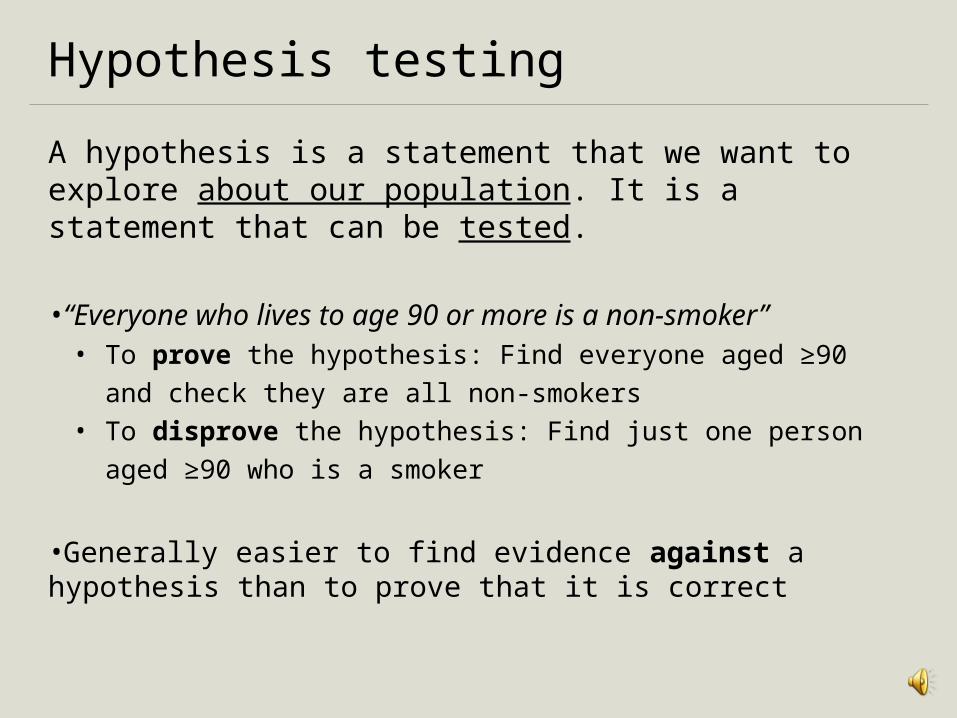
Hypothesis testing
A hypothesis is a statement that we want to explore about our population. It is a statement that can be tested.
•“Everyone who lives to age 90 or more is a non-smoker”• To prove the hypothesis: Find everyone aged ≥90 and
check they are all non-smokers• To disprove the hypothesis: Find just one person aged
≥90 who is a smoker
•Generally easier to find evidence against a hypothesis than to prove that it is correct
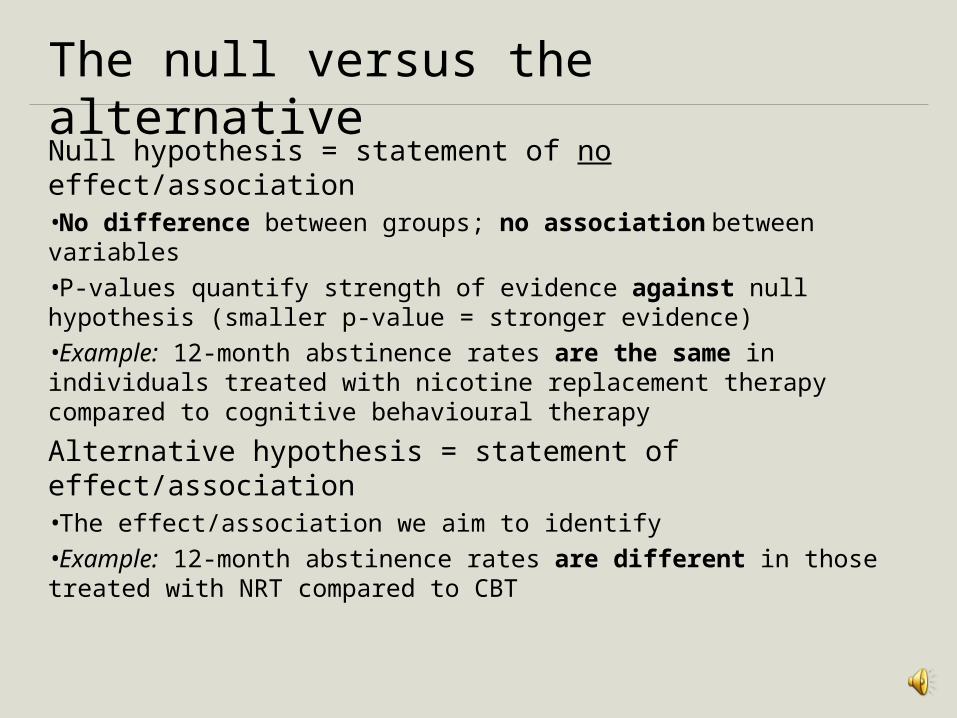
The null versus the alternative
Null hypothesis = statement of no effect/association•No difference between groups; no association between variables•P-values quantify strength of evidence against null hypothesis (smaller p-value = stronger evidence)•Example: 12-month abstinence rates are the same in individuals treated with nicotine replacement therapy compared to cognitive behavioural therapy
Alternative hypothesis = statement of effect/association•The effect/association we aim to identify•Example: 12-month abstinence rates are different in those treated with NRT compared to CBT
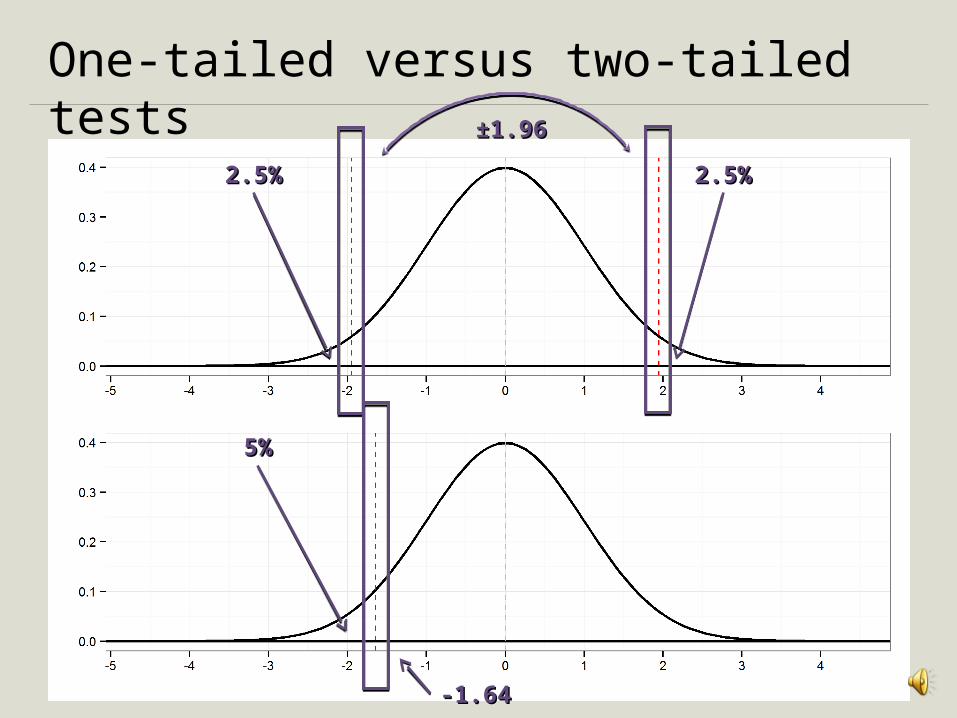
One-tailed versus two-tailed tests
2.5%2.5% 2.5%2.5%
±1.96±1.96
5%5%
-1.64-1.64
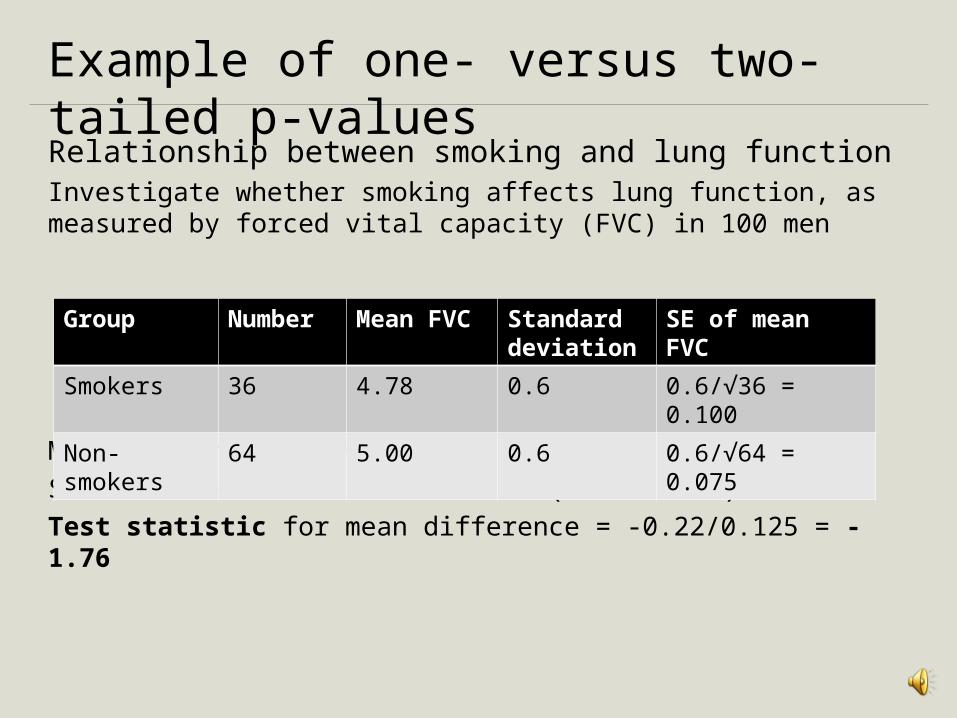
Example of one- versus two-tailed p-valuesRelationship between smoking and lung functionInvestigate whether smoking affects lung function, as measured by forced vital capacity (FVC) in 100 men
Mean difference = -0.22SE of difference in mean FVC = √(0.12+0.0752) = 0.125Test statistic for mean difference = -0.22/0.125 = -1.76
Group Number
Mean FVC
Standard deviation
SE of mean FVC
Smokers 36 4.78 0.6 0.6/√36 = 0.100
Non-smokers
64 5.00 0.6 0.6/√64 = 0.075
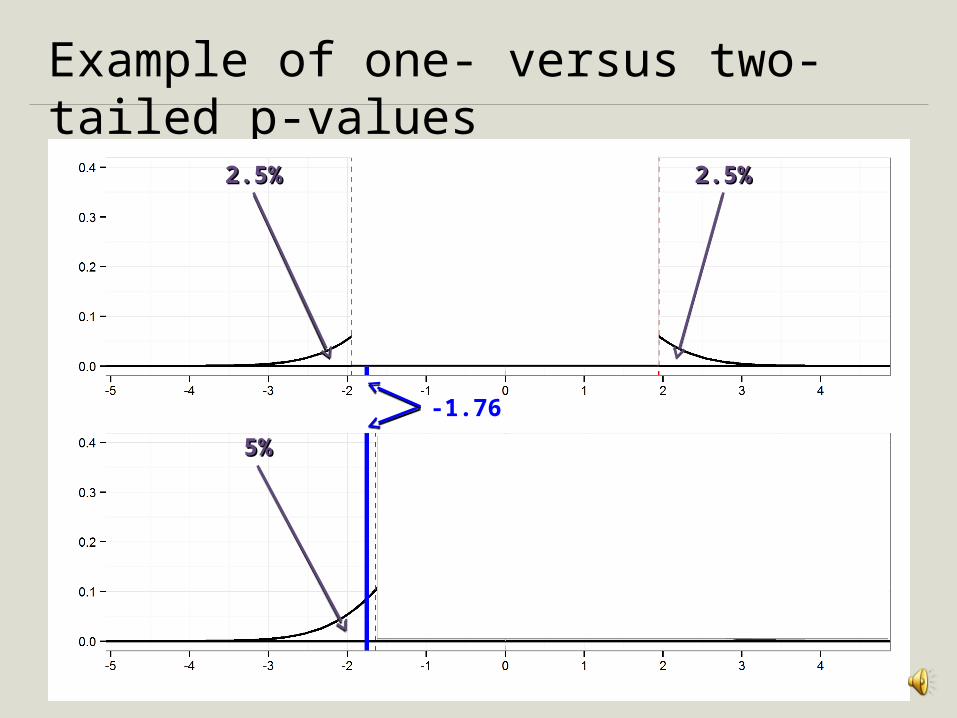
Example of one- versus two-tailed p-values
2.5%2.5% 2.5%2.5%
5%5%
-1.76
Should I use a one-tailed or two-tailed test?Wrong answer:“Use the one that gives you the most significant result!”
Right answer:“Use the one that reflects your alternative hypothesis.”•Probability that result due to chance usually based on distance from the null hypothesis not direction•From our previous example: FVC could have been greater in smokers than non-smokers•Using a one-tailed test requires careful specification of the alternative hypothesis
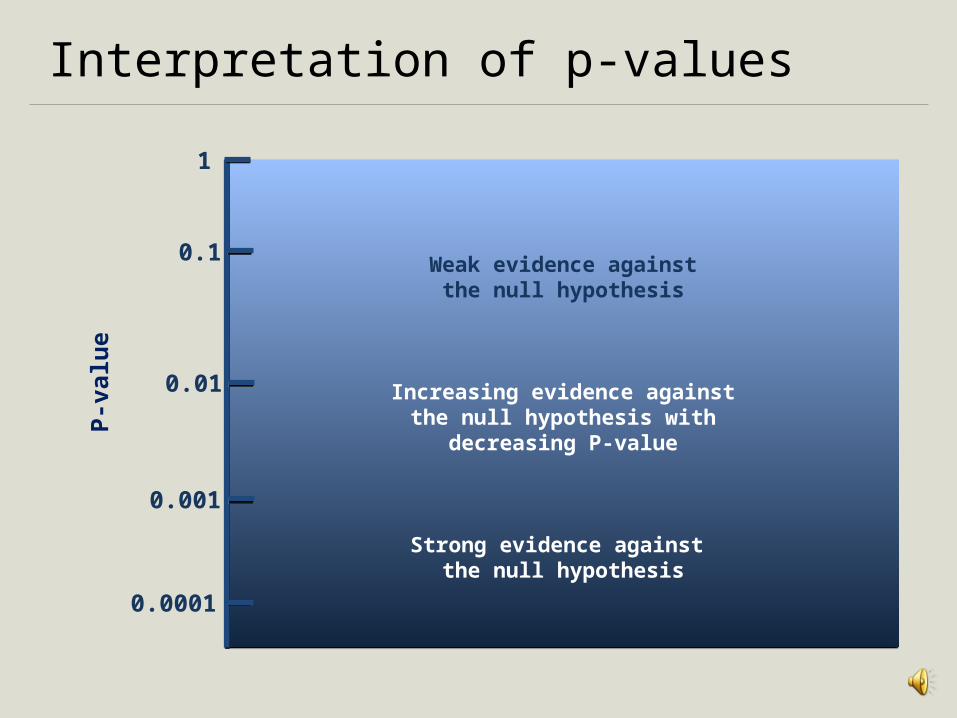
Interpretation of p-values
Weak evidence againstthe null hypothesis
Increasing evidence againstthe null hypothesis with
decreasing P-value
Strong evidence against the null hypothesis
Weak evidence againstthe null hypothesis
Increasing evidence againstthe null hypothesis with
decreasing P-value
Strong evidence against the null hypothesis
P-v
alu
e
1
0.1
0.01
0.001
0.0001
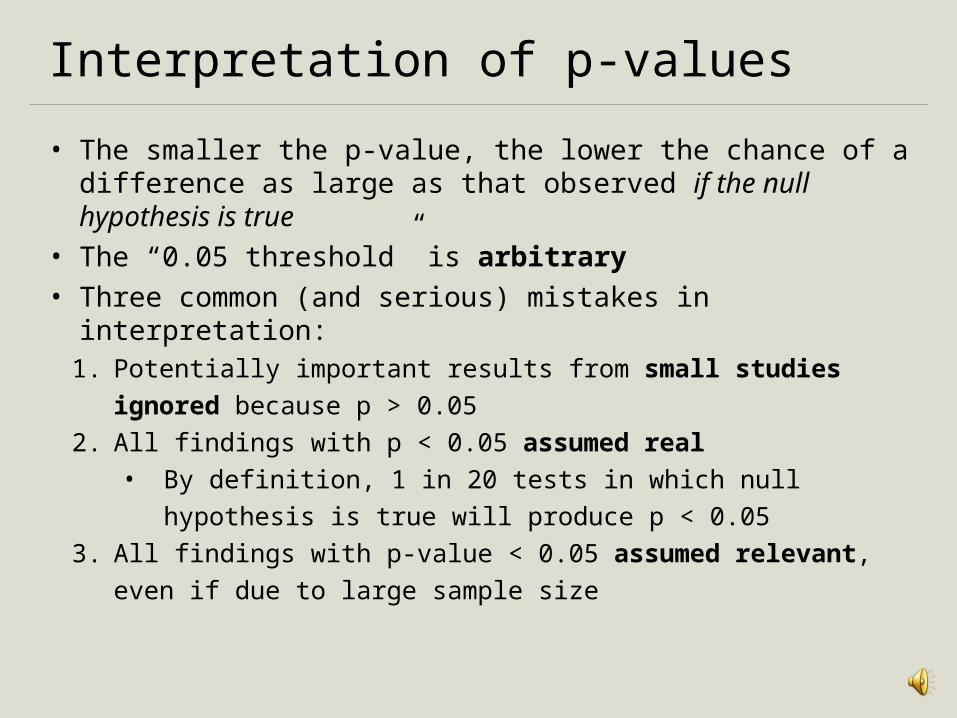
Interpretation of p-values
• The smaller the p-value, the lower the chance of a difference as large as that observed if the null hypothesis is true
• The “0.05 threshold” is arbitrary• Three common (and serious) mistakes in interpretation:
1. Potentially important results from small studies ignored because p > 0.05
2. All findings with p < 0.05 assumed real • By definition, 1 in 20 tests in which null hypothesis is
true will produce p < 0.05
3. All findings with p-value < 0.05 assumed relevant, even
if due to large sample size
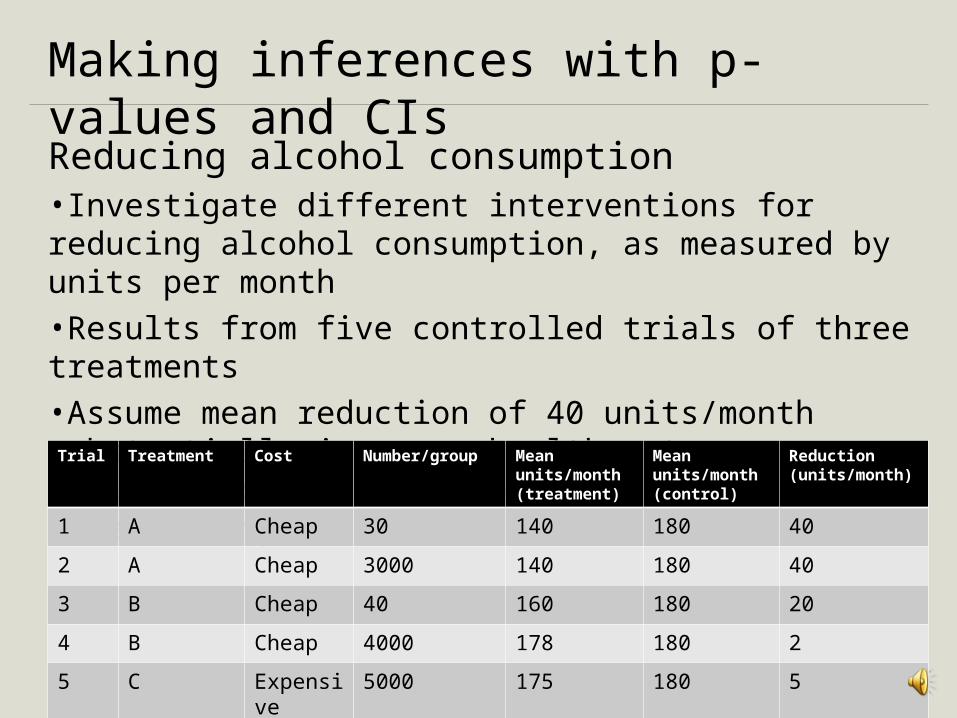
Making inferences with p-values and CIsReducing alcohol consumption•Investigate different interventions for reducing alcohol consumption, as measured by units per month•Results from five controlled trials of three treatments•Assume mean reduction of 40 units/month substantially improves health outcomes; reduction of 20 units/month results in moderate improvementsTrial Treatment Cost Number/group Mean
units/month (treatment)
Mean units/month (control)
Reduction (units/month)
1 A Cheap 30 140 180 40
2 A Cheap 3000 140 180 40
3 B Cheap 40 160 180 20
4 B Cheap 4000 178 180 2
5 C Expensive 5000 175 180 5
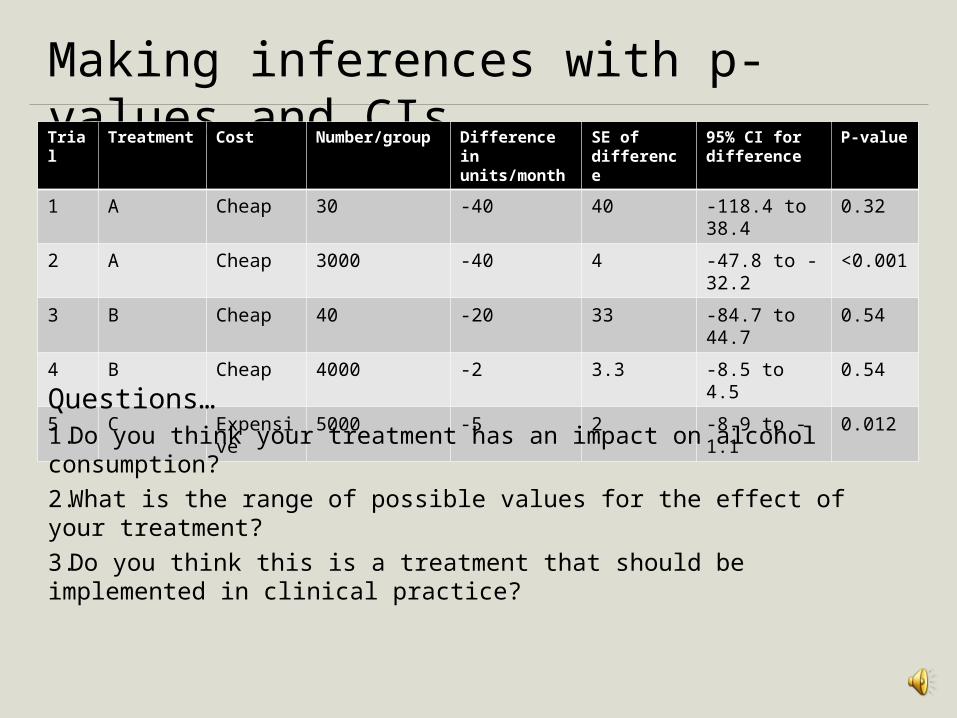
Making inferences with p-values and CIsTrial
Treatment
Cost Number/group
Difference in units/month
SE of difference
95% CI for difference
P-value
1 A Cheap 30 -40 40 -118.4 to 38.4 0.32
2 A Cheap 3000 -40 4 -47.8 to -32.2 <0.001
3 B Cheap 40 -20 33 -84.7 to 44.7 0.54
4 B Cheap 4000 -2 3.3 -8.5 to 4.5 0.54
5 C Expensive 5000 -5 2 -8.9 to -1.1 0.012
Questions…1.Do you think your treatment has an impact on alcohol consumption?2.What is the range of possible values for the effect of your treatment?3.Do you think this is a treatment that should be implemented in clinical practice?

ONLINE RESOURCESNORMAL DISTRIBUTION
www.khanacademy.org/math/probability/statistics-inferential/
normal_distribution/v/introduction-to-the-normal-distribution
SAMPLING DISTRIBUTION
www.khanacademy.org/math/probability/statistics-inferential/
sampling_distribution/v/central-limit-theorem
CONFIDENCE INTERVALS
www.khanacademy.org/math/probability/statistics-inferential/
confidence-intervals/v/confidence-interval-1
HYPOTHESIS TESTING
www.khanacademy.org/math/probability/statistics-inferential/
hypothesis-testing/v/hypothesis-testing-and-p-values
www.khanacademy.org/math/probability/statistics-inferential/
hypothesis-testing-two-samples/v/variance-of-differences-of-
random-variables