lecture 15: organizations and projects - mit … · organizations and projects . ......
TRANSCRIPT
+
-
1
Organizations and Projects
Prof. Dan Braha http://necsi.edu/affiliates/braha/dan_braha-description.htm
Lecture 15
November 13, 2012
ESD.36 SPM
+
-
2
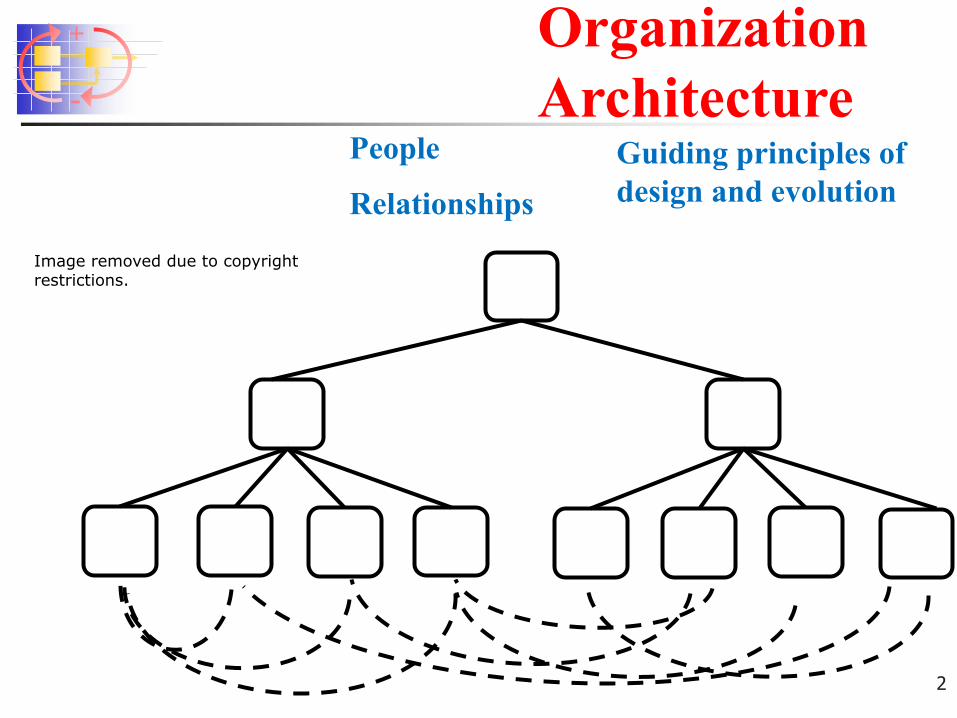
Organization Architecture
People
Relationships Guiding principles of design and evolution
Image removed due to copyright restrictions.
+
-
3
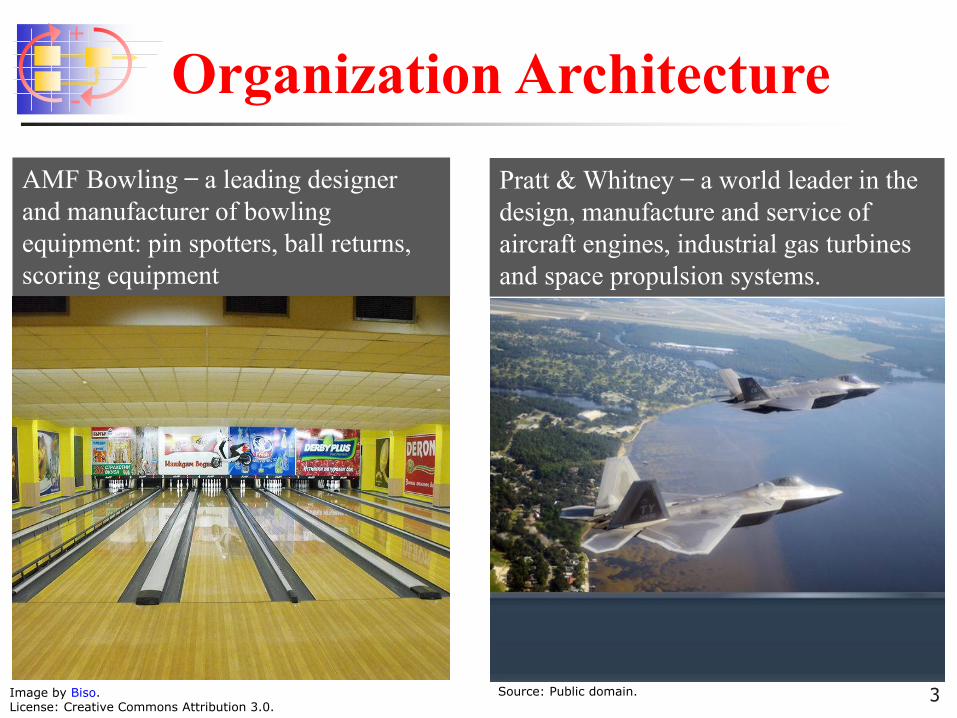
AMF Bowling ̶ a leading designer and manufacturer of bowling equipment: pin spotters, ball returns, scoring equipment
Pratt & Whitney ̶ a world leader in the design, manufacture and service of aircraft engines, industrial gas turbines and space propulsion systems.
Organization Architecture
Image by Biso.License: Creative Commons Attribution 3.0.
Source: Public domain.
+
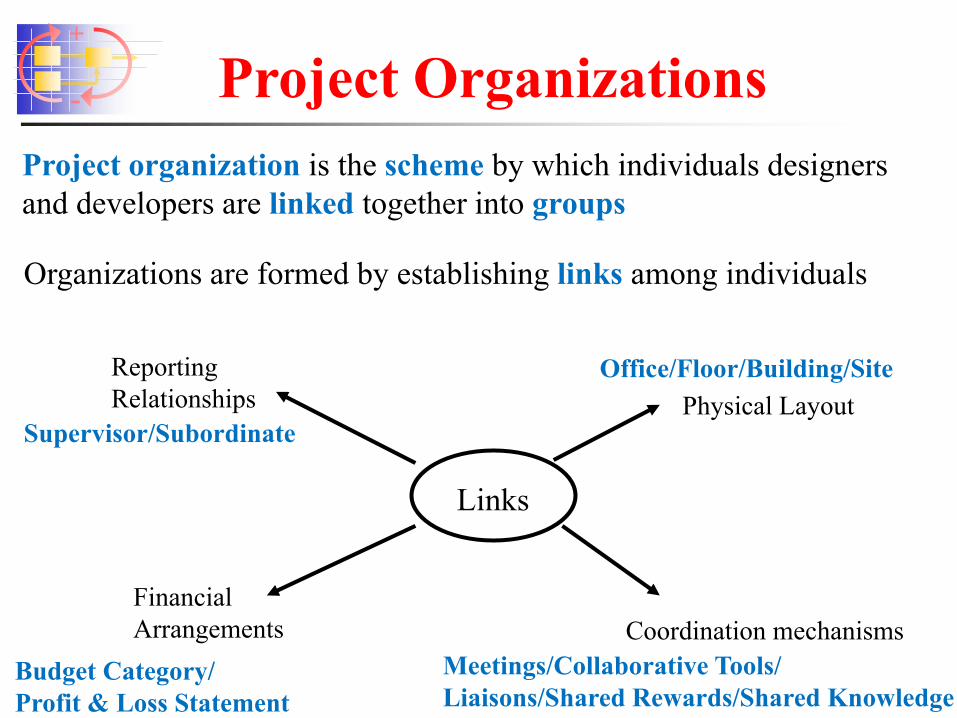
- Project Organizations Project organization is the scheme by which individuals designers and developers are linked together into groups
Links
Organizations are formed by establishing links among individuals
Reporting Relationships
Supervisor/Subordinate
Financial Arrangements
Budget Category/ Profit & Loss Statement
Physical Layout Office/Floor/Building/Site
Coordination mechanisms Meetings/Collaborative Tools/ Liaisons/Shared Rewards/Shared Knowledge
+
-
5
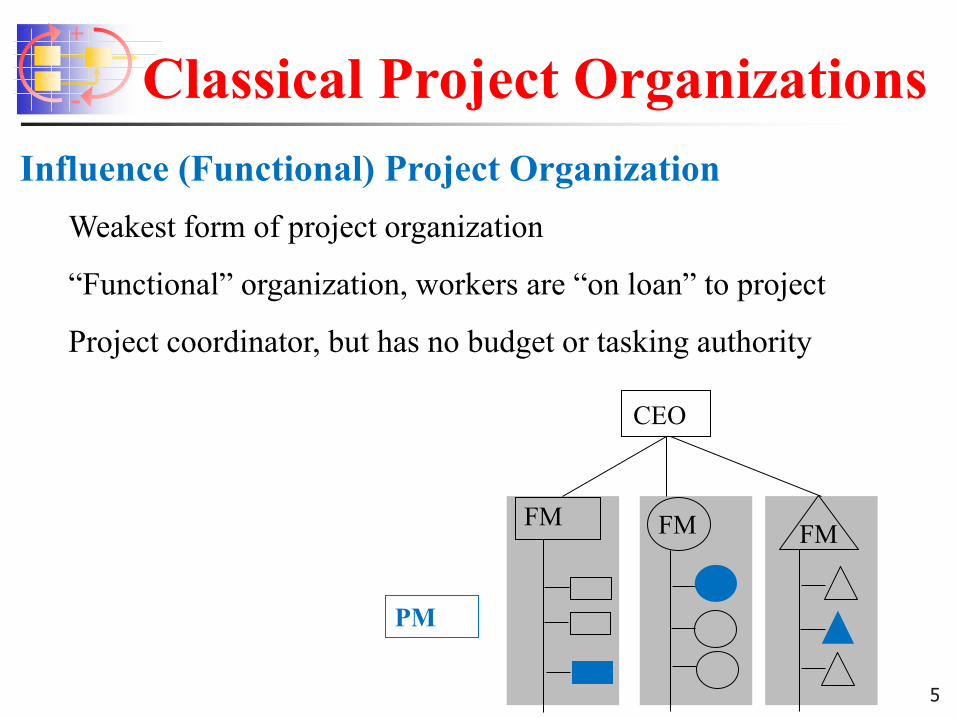
Influence (Functional) Project Organization Weakest form of project organization
“Functional” organization, workers are “on loan” to project
Project coordinator, but has no budget or tasking authority
Classical Project Organizations
CEO
PM
FM FM FM
+
-
6
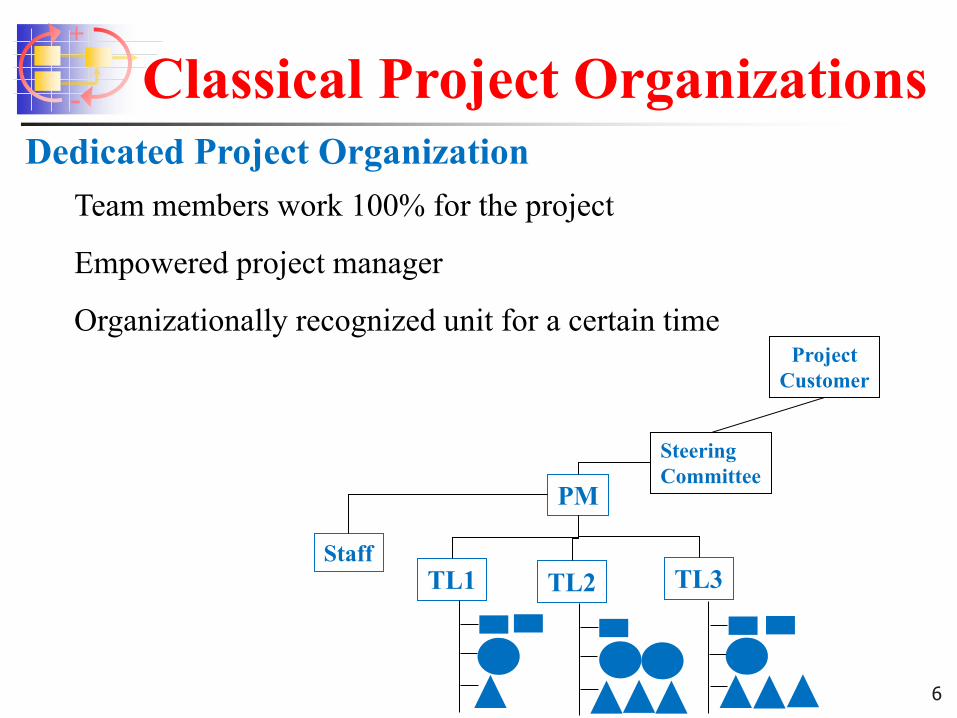
Classical Project Organizations
Team members work 100% for the project
Empowered project manager
Organizationally recognized unit for a certain time
Dedicated Project Organization
PM
TL1 TL2 TL3 Staff
Project Customer
Steering Committee
+
-
7
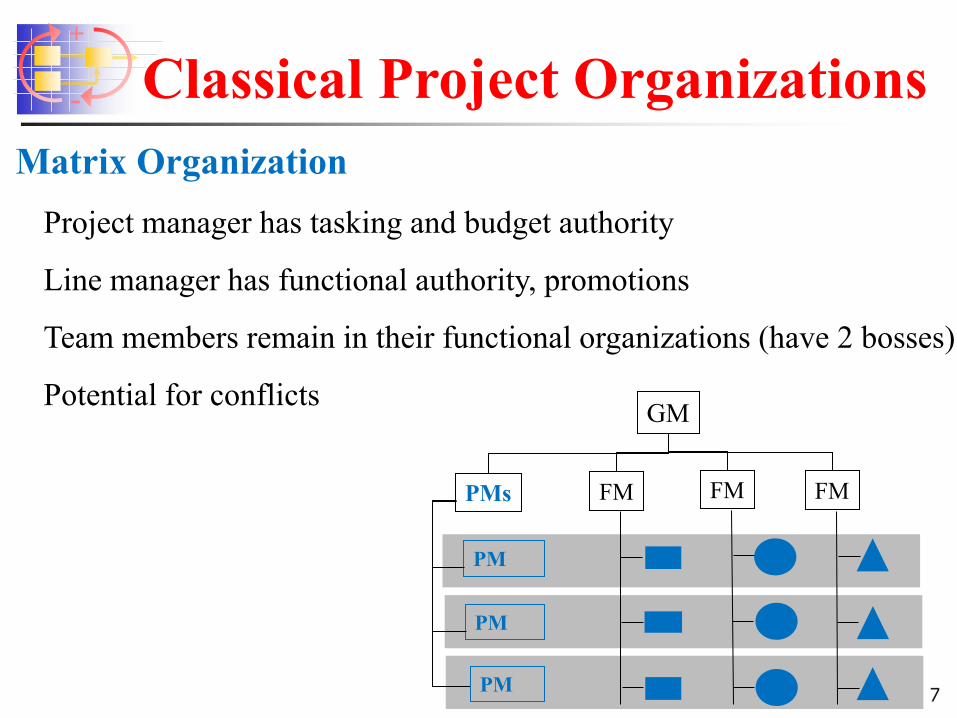
Classical Project Organizations
Project manager has tasking and budget authority
Line manager has functional authority, promotions
Team members remain in their functional organizations (have 2 bosses)
Potential for conflicts
Matrix Organization
GM
PMs
PM
PM
FM FM FM
PM
+
- Concept Question 1
Which type of project organization are you most familiar with or have you spent most of your career in?
Dedicated Project Organization Matrix Organization Influence (Functional) Organization None of the above
8
+
-
9
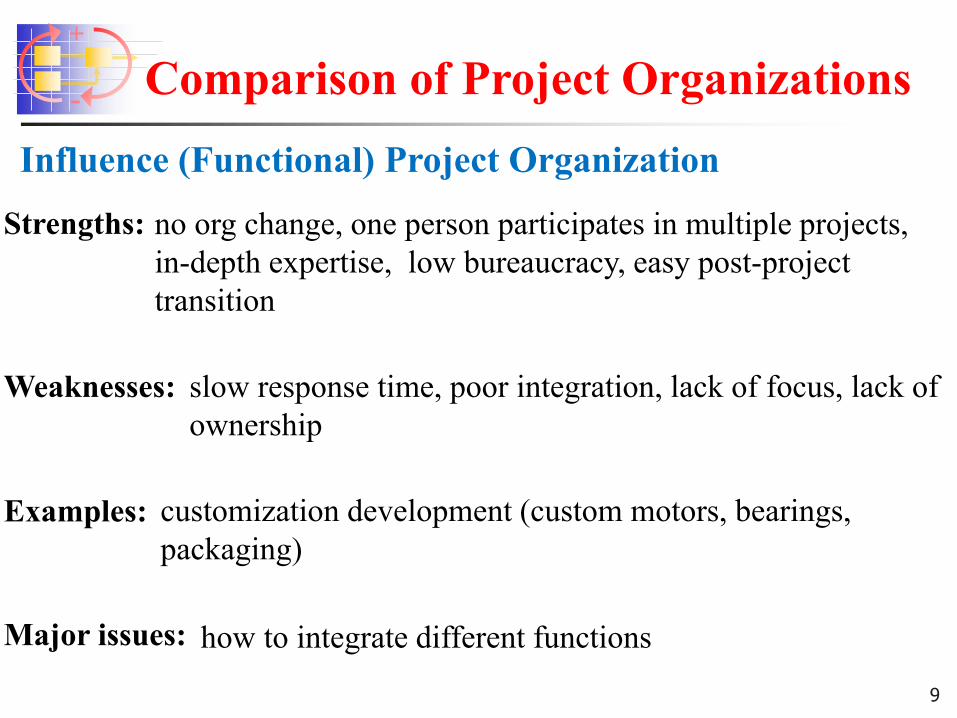
Comparison of Project Organizations Influence (Functional) Project Organization
Strengths: no org change, one person participates in multiple projects, in-depth expertise, low bureaucracy, easy post-project transition
Weaknesses: slow response time, poor integration, lack of focus, lack of ownership
Examples: customization development (custom motors, bearings, packaging)
Major issues: how to integrate different functions
+
-
10
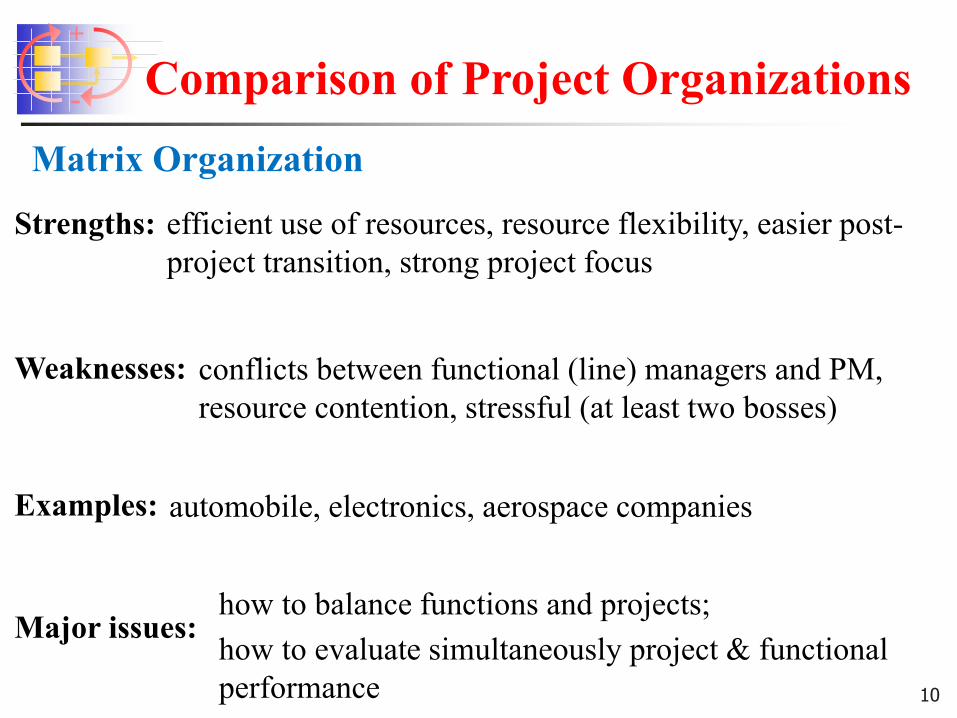
Comparison of Project Organizations Matrix Organization
Strengths: efficient use of resources, resource flexibility, easier post-project transition, strong project focus
conflicts between functional (line) managers and PM, resource contention, stressful (at least two bosses)
Weaknesses:
automobile, electronics, aerospace companies Examples:
how to balance functions and projects; how to evaluate simultaneously project & functional performance
Major issues:
+
-
11
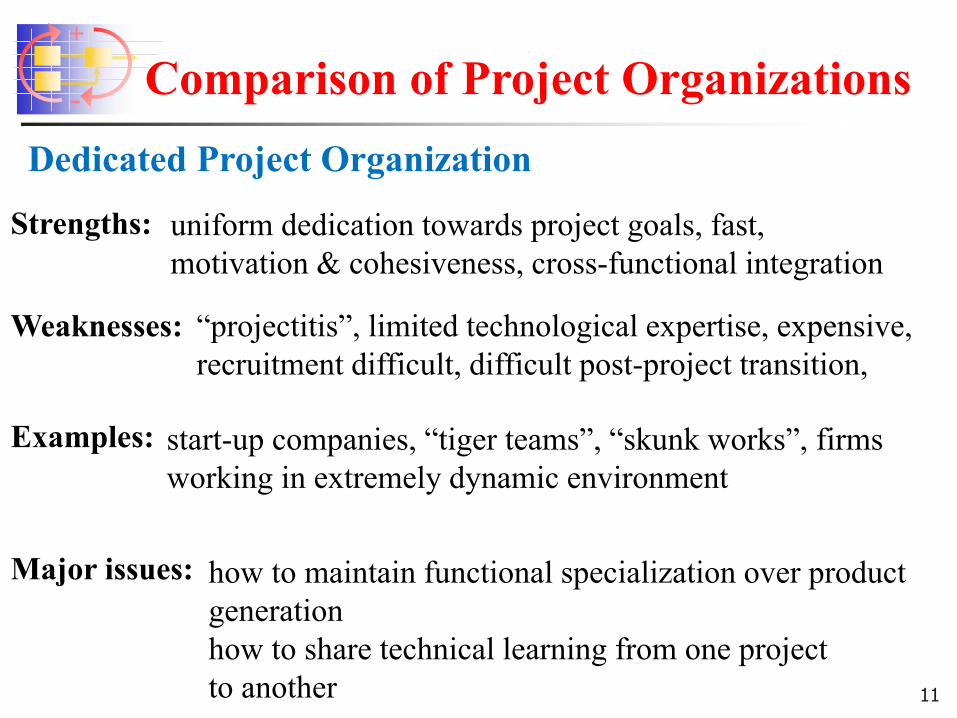
Comparison of Project Organizations
Strengths: uniform dedication towards project goals, fast, motivation & cohesiveness, cross-functional integration
Examples: start-up companies, “tiger teams”, “skunk works”, firms working in extremely dynamic environment
how to maintain functional specialization over product generation how to share technical learning from one project to another
Major issues:
Dedicated Project Organization
Weaknesses: “projectitis”, limited technological expertise, expensive, recruitment difficult, difficult post-project transition,
+
-
12
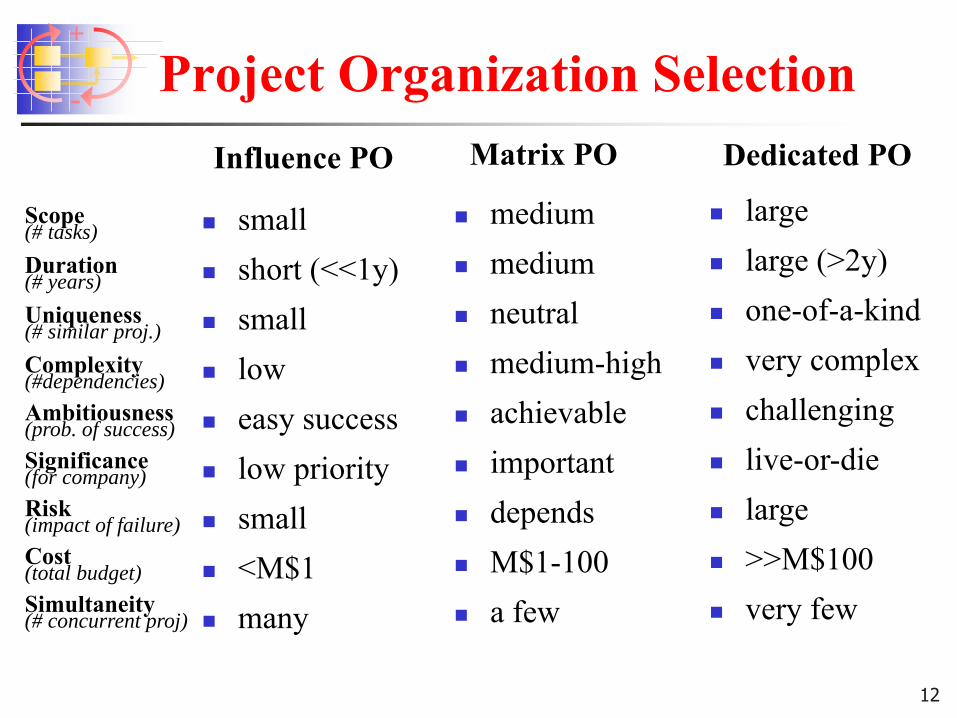
Project Organization Selection
small short (<<1y) small low easy success low priority small <M$1 many
medium medium neutral medium-high achievable important depends M$1-100 a few
large large (>2y) one-of-a-kind very complex challenging live-or-die large >>M$100 very few
Influence PO Matrix PO Dedicated PO
Scope (# tasks) Duration (# years) Uniqueness (# similar proj.) Complexity (#dependencies) Ambitiousness (prob. of success) Significance (for company) Risk (impact of failure) Cost (total budget) Simultaneity (# concurrent proj)
+
-
13
The second largest producer of structural steel beams in North America (acquired by Gerdau Ameristeel in 2007).
Project Organization Selection
Classifies projects into three categories: advanced development, platform, and incremental
Typically, Chaparral has 40-50 projects underway:
1 or 2 are advanced projects
3 to 5 are platform projects
remainder are small, incremental projects
An image of CHAPARRAL STEEL CO. Logo has been removed due to copyright restrictions.
+
-
14
Project Organization Selection
A leading designer and manufacturer of bowling equipment: pin spotters, ball returns, scoring equipment
AMF chose to organize its PD staff in a matrix structure
The functions involved in PD are: engineering, manufacturing, marketing, sales, purchasing, quality assurance
The AMF matrix organization is closest to the weak project organization
Project managers are not typically the most senior managers in the division; thus, do not have direct control of resources and staffing
An image of AMF Logo has been removed due to copyright restrictions.
+
-
15
Project Organization Selection
With weak project organization the assignment of staff to smaller projects and the balancing of workload within a function are more easily accomplished AMF is a very lean company. The Capital Equipment Division has fewer than 100 salaried employees generating and supporting sales of over $100 million per year
Members of project teams are motivated to look beyond their own functions, and work together to develop successful products
Everyone works in the same building;
Employees earn substantial financial rewards when the Division is highly profitable;
An image of AMF Logo has been removed due to copyright restrictions.
+
-
16
Project Organization Selection
The engineering manager works daily to ensure that the appropriate coordination occurs, for example, between marketing and engineering
The general manager devotes several days each month to monitoring the progress of projects
The senior management places emphasis on PD and encourages effective teamwork;
An image of AMF Logo has been removed due to copyright restrictions.
+
-
17 17
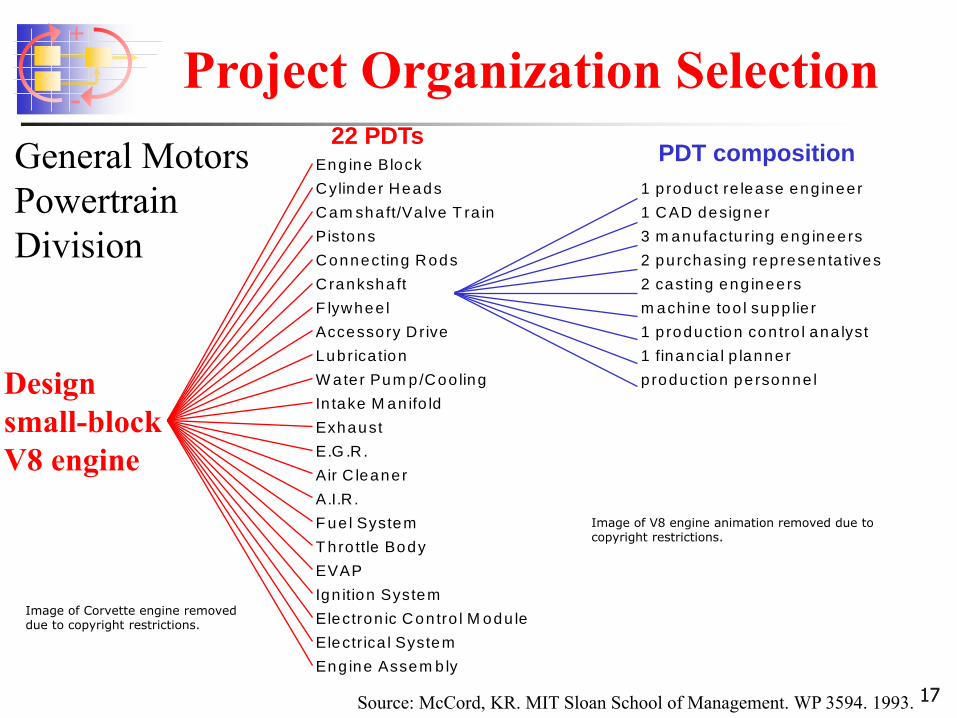
22 PDTs PDT composition
Eng ine Block
Cylinde r Heads 1 p roduct re lease eng ineer
Cam sha ft/Va lve T ra in 1 CAD designer
Pistons 3 m anu factu r ing eng ineers
Connecting Rods 2 pu rchasing rep resen ta tives
Cranksha ft 2 casting eng ineers
F lywhee l m ach ine too l supp lie r
Accessory D rive 1 p roduction con tro l ana lyst
Lubrica tion 1 financia l p lanner
W ate r Pum p/Coo ling p roduction pe rsonne l
In take M an ifo ld
Exhaust
E.G .R .
Air C leaner
A.I.R .
F ue l System
T hro ttle Body
EVAP
Ign ition System
Electron ic Con tro l M odu le
Electr ica l System
Eng ine Assem b ly
General Motors Powertrain Division
Project Organization Selection
Design small-block V8 engine
Source: McCord, KR. MIT Sloan School of Management. WP 3594. 1993.
Image of V8 engine animation removed due to copyright restrictions.
Image of Corvette engine removeddue to copyright restrictions.
+
-
18
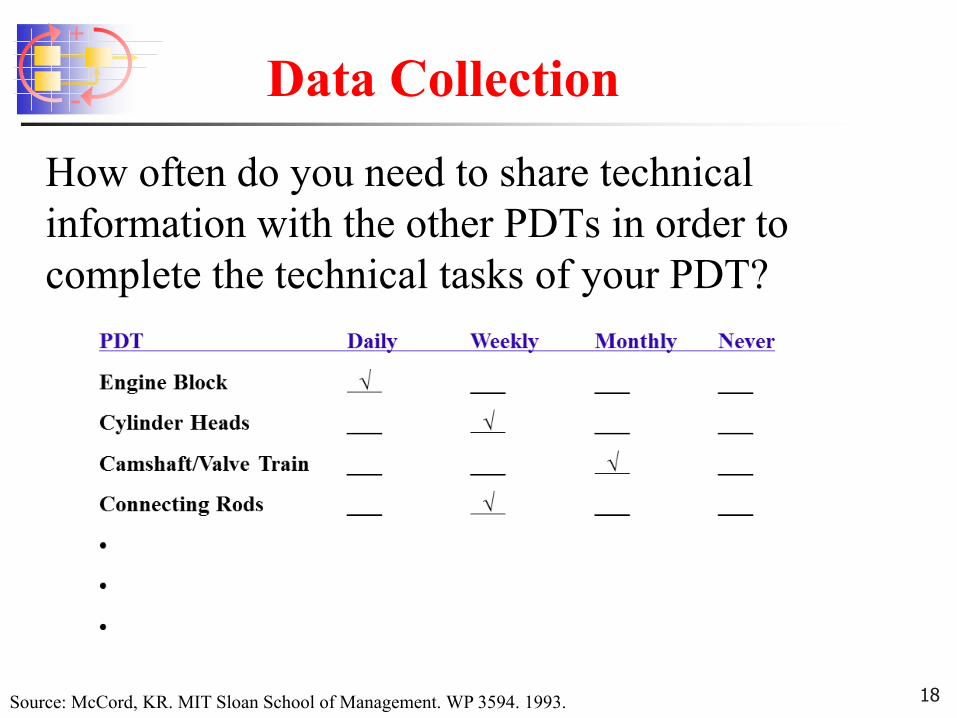
Data Collection
How often do you need to share technical information with the other PDTs in order to complete the technical tasks of your PDT?
Source: McCord, KR. MIT Sloan School of Management. WP 3594. 1993.
+
-
19
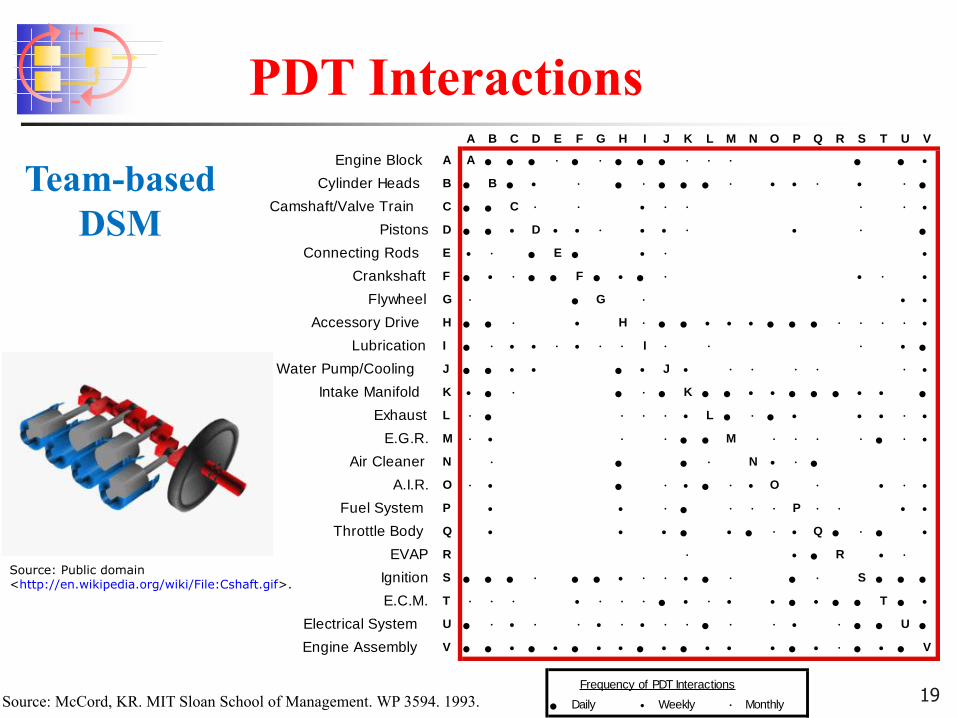
PDT Interactions A B C D E F G H I J K L M N O P Q R S T U V
Engine Block A A • • • • • • • • • • • • • • •Cylinder Heads B • B • • • • • • • • • • • • • • •
Camshaft/Valve Train C • • C • • • • • • • •Pistons D • • • D • • • • • • • • •
Connecting Rods E • • • E • • • •Crankshaft F • • • • • F • • • • • • •
Flywheel G • • G • • •Accessory Drive H • • • • H • • • • • • • • • • • • • •
Lubrication I • • • • • • • • I • • • • •Water Pump/Cooling J • • • • • • J • • • • • • •
Intake Manifold K • • • • • • K • • • • • • • • • •Exhaust L • • • • • • L • • • • • • • •
E.G.R. M • • • • • • M • • • • • • •Air Cleaner N • • • • N • • •
A.I.R. O • • • • • • • • O • • • •Fuel System P • • • • • • • P • • • •
Throttle Body Q • • • • • • • • Q • • • •EVAP R • • • R • •
Ignition S • • • • • • • • • • • • • • S • • •E.C.M. T • • • • • • • • • • • • • • • • T • •
Electrical System U • • • • • • • • • • • • • • • • • U •Engine Assembly V • • • • • • • • • • • • • • • • • • • • V
Frequency of PDT Interactions
• Daily • Weekly • Monthly
Team-based DSM
Source: McCord, KR. MIT Sloan School of Management. WP 3594. 1993.
Source: Public domain<http://en.wikipedia.org/wiki/File:Cshaft.gif>.
+
-
20
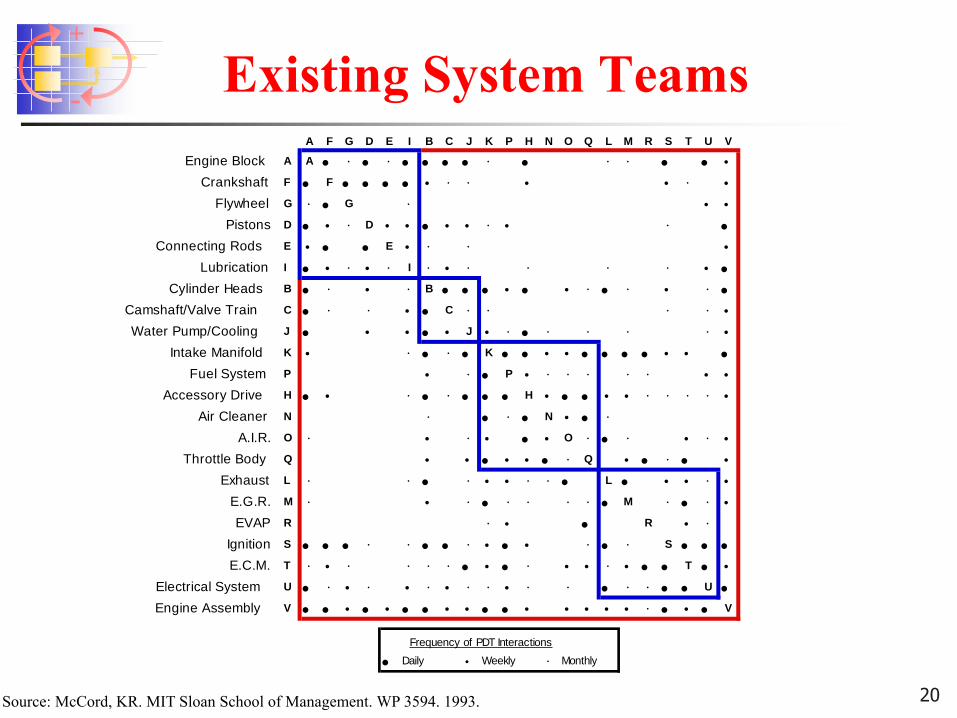
Existing System Teams A F G D E I B C J K P H N O Q L M R S T U V
Engine Block A A • • • • • • • • • • • • • • •Crankshaft F • F • • • • • • • • • • •
Flywheel G • • G • • •Pistons D • • • D • • • • • • • • •
Connecting Rods E • • • E • • • •Lubrication I • • • • • I • • • • • • • •
Cylinder Heads B • • • • B • • • • • • • • • • • •Camshaft/Valve Train C • • • • • C • • • • •Water Pump/Cooling J • • • • • J • • • • • • • •
Intake Manifold K • • • • • K • • • • • • • • • • •Fuel System P • • • P • • • • • • • •
Accessory Drive H • • • • • • • • H • • • • • • • • • •Air Cleaner N • • • • N • • •
A.I.R. O • • • • • • O • • • • • •Throttle Body Q • • • • • • • Q • • • • •
Exhaust L • • • • • • • • • L • • • • •E.G.R. M • • • • • • • • • M • • • •EVAP R • • • R • •
Ignition S • • • • • • • • • • • • • • S • • •E.C.M. T • • • • • • • • • • • • • • • • T • •
Electrical System U • • • • • • • • • • • • • • • • • U •Engine Assembly V • • • • • • • • • • • • • • • • • • • • V
Frequency of PDT Interactions
• Daily • Weekly • Monthly
Source: McCord, KR. MIT Sloan School of Management. WP 3594. 1993.
+
-
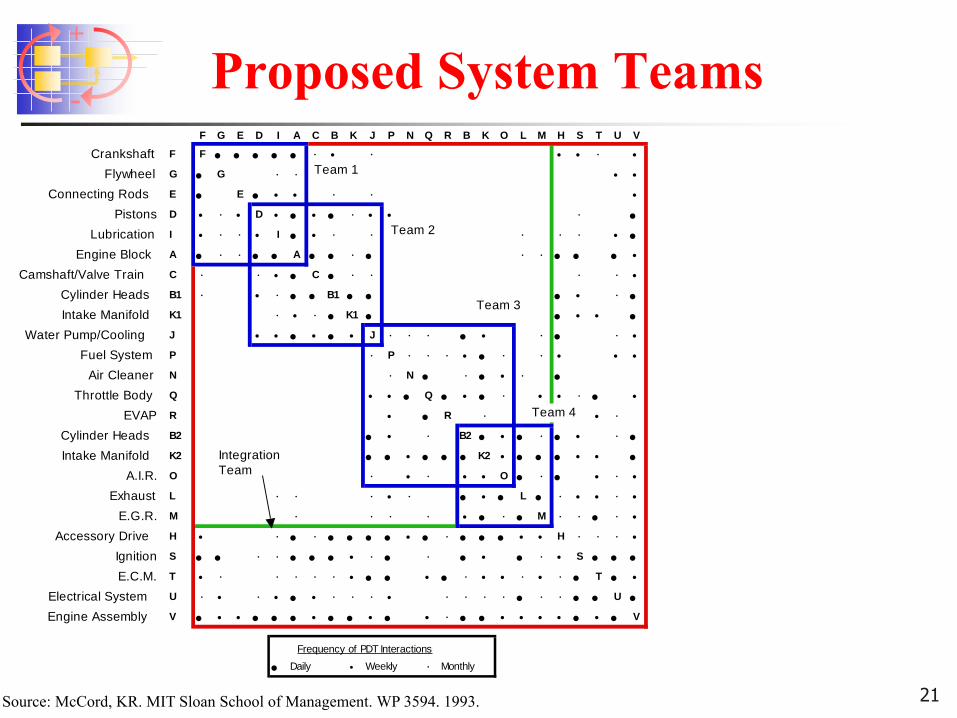
21
Proposed System Teams F G E D I A C B K J P N Q R B K O L M H S T U V
Crankshaft F F • • • • • • • • • • • •Flywheel G • G • • • •
Connecting Rods E • E • • • • • •Pistons D • • • D • • • • • • • • •
Lubrication I • • • • I • • • • • • • • •Engine Block A • • • • • A • • • • • • • • • •
Camshaft/Valve Train C • • • • C • • • • • •Cylinder Heads B1 • • • • • B1 • • • • • •Intake Manifold K1 • • • • K1 • • • • •
Water Pump/Cooling J • • • • • • J • • • • • • • • •Fuel System P • P • • • • • • • • • •
Air Cleaner N • N • • • • • •Throttle Body Q • • • Q • • • • • • • • •
EVAP R • • R • • •
Cylinder Heads B2 • • • B2 • • • • • • • •Intake Manifold K2 • • • • • • K2 • • • • • • •
A.I.R. O • • • • • • O • • • • • •Exhaust L • • • • • • • • L • • • • • •
E.G.R. M • • • • • • • • M • • • • •Accessory Drive H • • • • • • • • • • • • • • • • H • • • •
Ignition S • • • • • • • • • • • • • • • • S • • •E.C.M. T • • • • • • • • • • • • • • • • • • T • •
Electrical System U • • • • • • • • • • • • • • • • • • • U •Engine Assembly V • • • • • • • • • • • • • • • • • • • • • • V
Frequency of PDT Interactions
• Daily • Weekly • Monthly
Team 1
Team 2
Team 3
Team 4
Integration
Team
Source: McCord, KR. MIT Sloan School of Management. WP 3594. 1993.
+
-
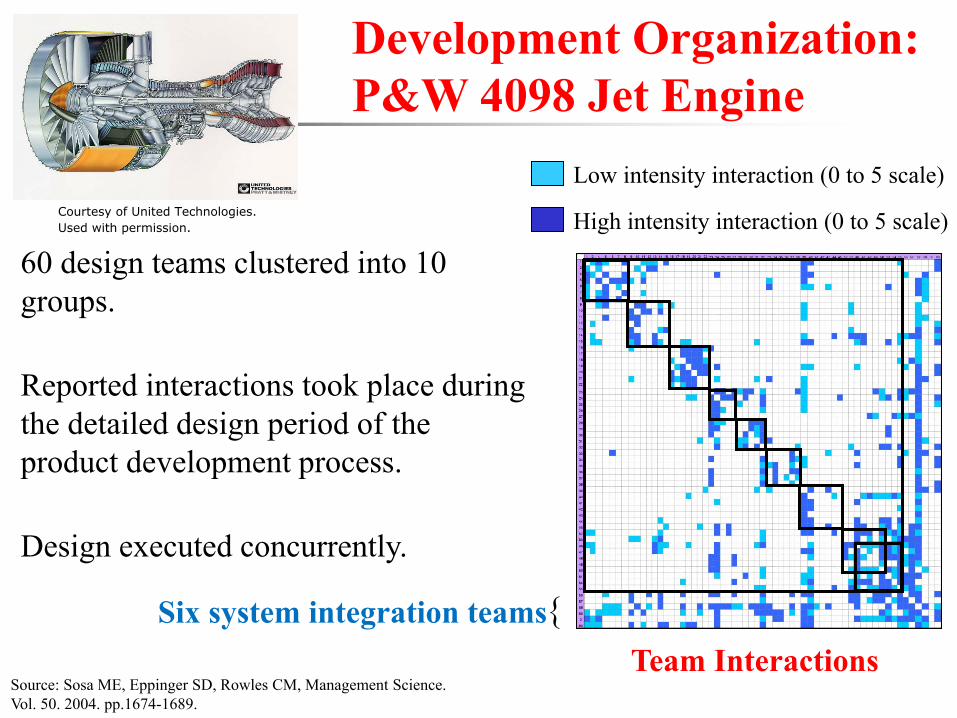
60 design teams clustered into 10 groups.
Reported interactions took place during the detailed design period of the product development process.
Design executed concurrently.
Low intensity interaction (0 to 5 scale)
High intensity interaction (0 to 5 scale)
Development Organization: P&W 4098 Jet Engine
Team Interactions Six system integration teams
Source: Sosa ME, Eppinger SD, Rowles CM, Management Science.Vol. 50. 2004. pp.1674-1689.
Courtesy of United Technologies.Used with permission.
+
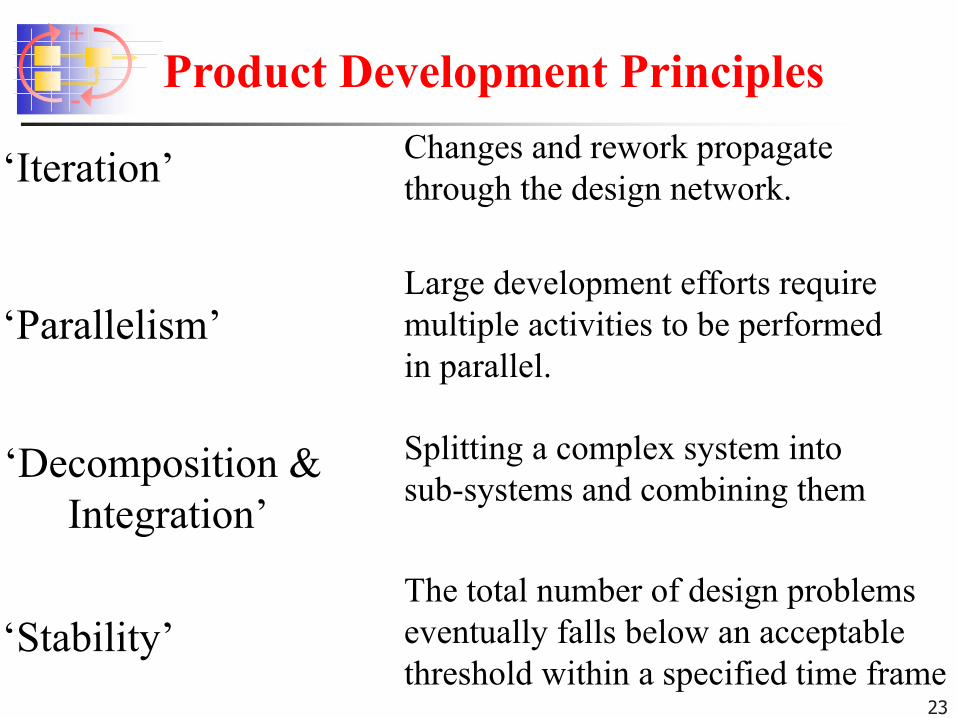
- Product Development Principles
‘Iteration’
‘Parallelism’
‘Decomposition & Integration’
‘Stability’ 23
Changes and rework propagate through the design network.
Large development efforts require multiple activities to be performed in parallel.
The total number of design problems eventually falls below an acceptable threshold within a specified time frame
Splitting a complex system into sub-systems and combining them
+
-
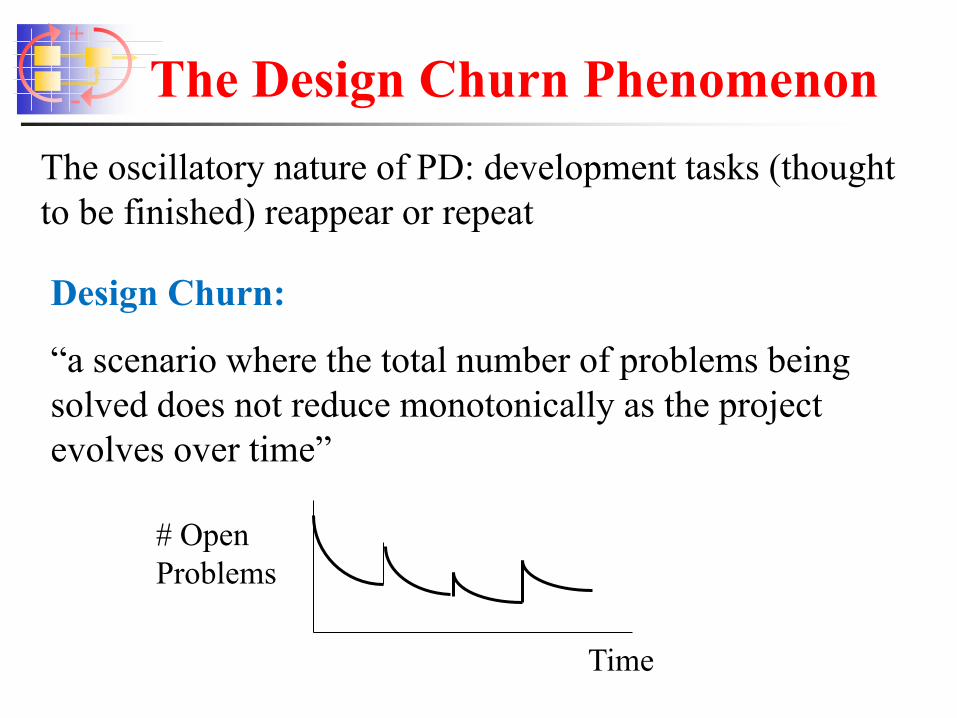
The oscillatory nature of PD: development tasks (thought to be finished) reappear or repeat
The Design Churn Phenomenon
Design Churn:
“a scenario where the total number of problems being solved does not reduce monotonically as the project evolves over time”
# Open Problems
Time
+
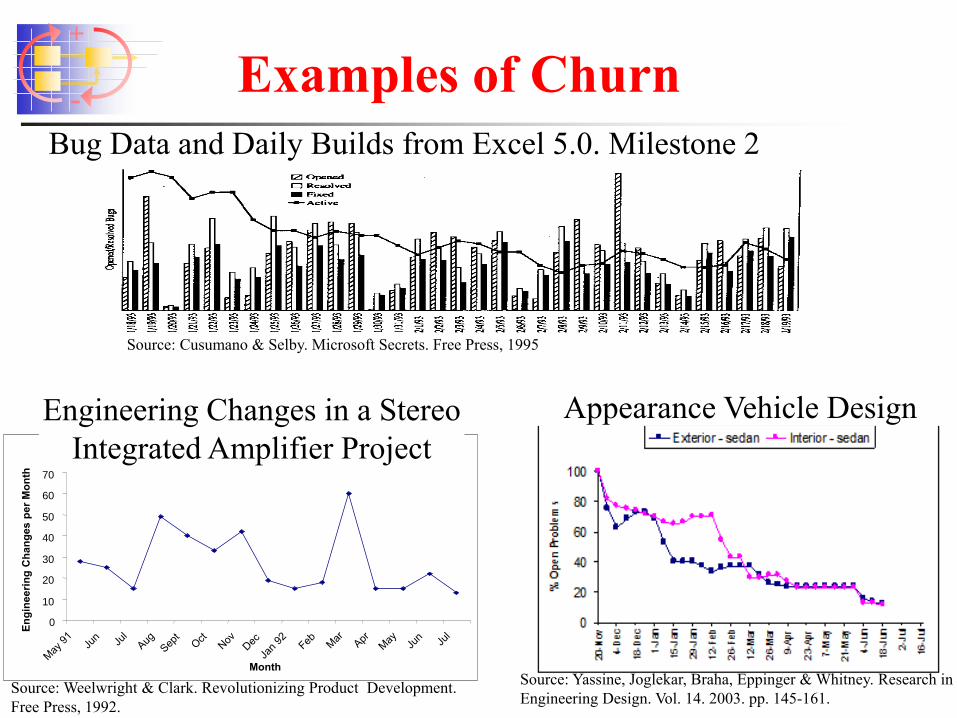
- Examples of Churn
0
10
20
30
40
50
60
70
Month
Engi
neer
ing
Cha
nges
per
Mon
th
Engineering Changes in a Stereo Integrated Amplifier Project
Source: Cusumano & Selby. Microsoft Secrets. Free Press, 1995
Source: Weelwright & Clark. Revolutionizing Product Development.Free Press, 1992.
Source: Yassine, Joglekar, Braha, Eppinger & Whitney. Research inEngineering Design. Vol. 14. 2003. pp. 145-161.
Bug Data and Daily Builds from Excel 5.0. Milestone 2
Appearance Vehicle Design
+
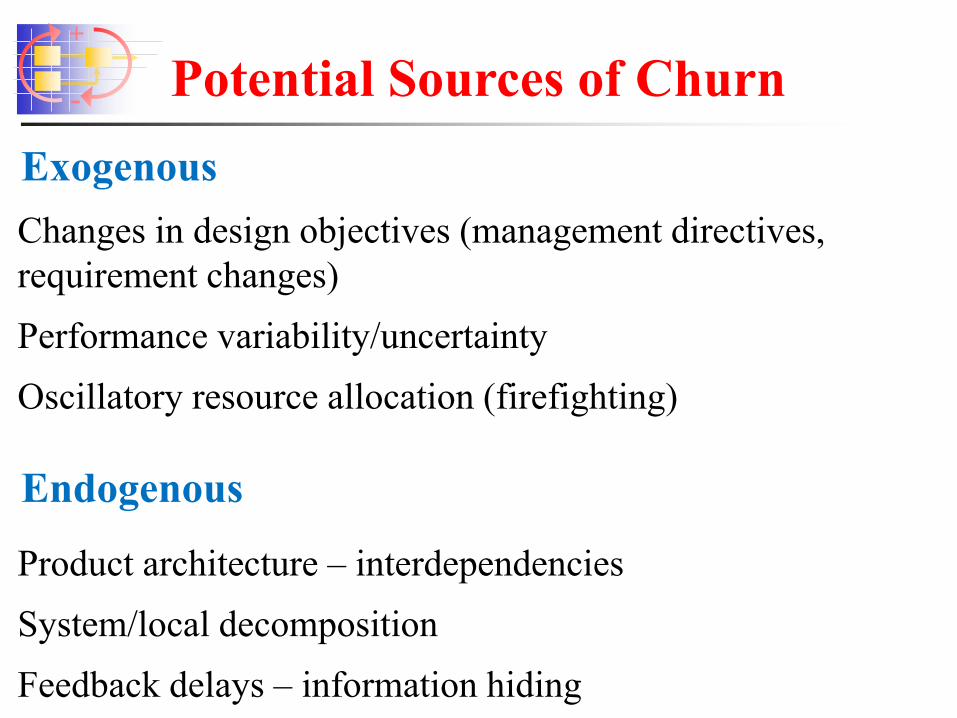
- Potential Sources of Churn
Endogenous
Product architecture – interdependencies System/local decomposition Feedback delays – information hiding
Changes in design objectives (management directives, requirement changes) Performance variability/uncertainty Oscillatory resource allocation (firefighting)
Exogenous
+
- Why is Churn Bad?
Frustration and deteriorated morale
Myopic resource allocation decisions
Elongated PD time
Organizational memory lapses
+
-
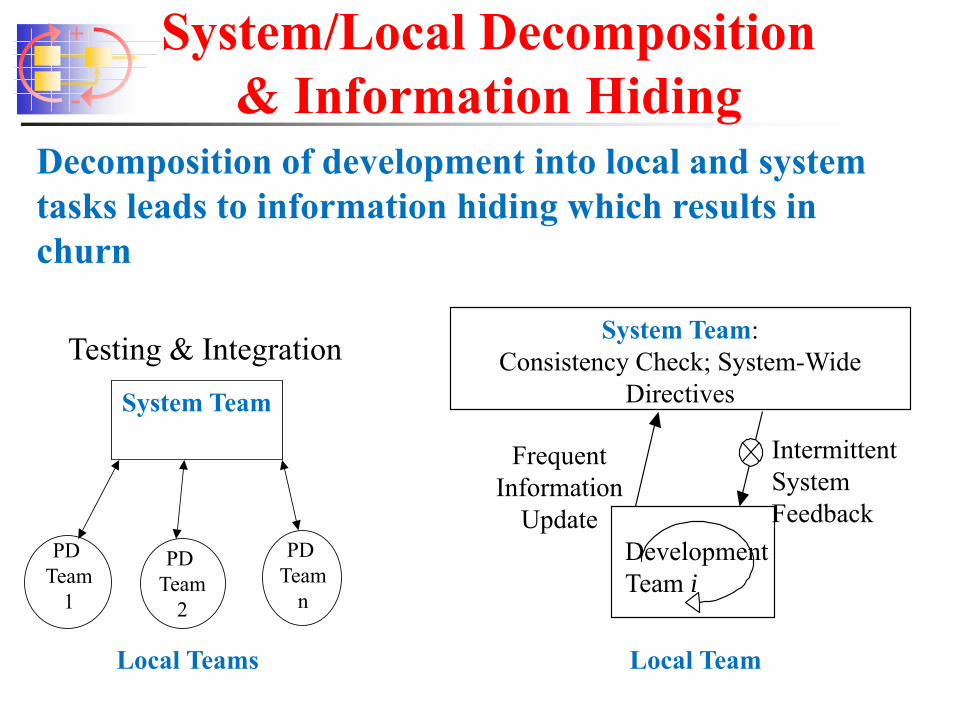
System/Local Decomposition & Information Hiding
System Team: Consistency Check; System-Wide
Directives
Development Team i
Frequent Information
Update
Intermittent System Feedback
Decomposition of development into local and system tasks leads to information hiding which results in churn
System Team
Testing & Integration
PD Team
1
PD Team
2
PD Team
n
Local Teams Local Team
+
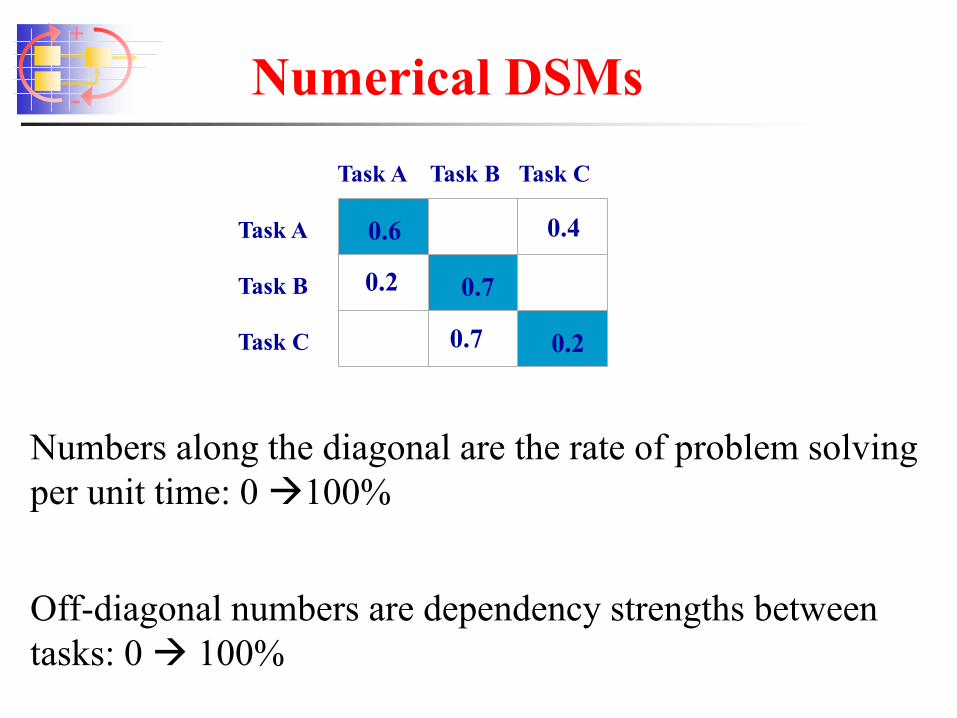
- Numerical DSMs
Numbers along the diagonal are the rate of problem solving per unit time: 0 100%
Off-diagonal numbers are dependency strengths between tasks: 0 100%
Task A
Task B
Task C
0.2
0.7
0.4 0.6
0.7
0.2
Task A Task B Task C
+
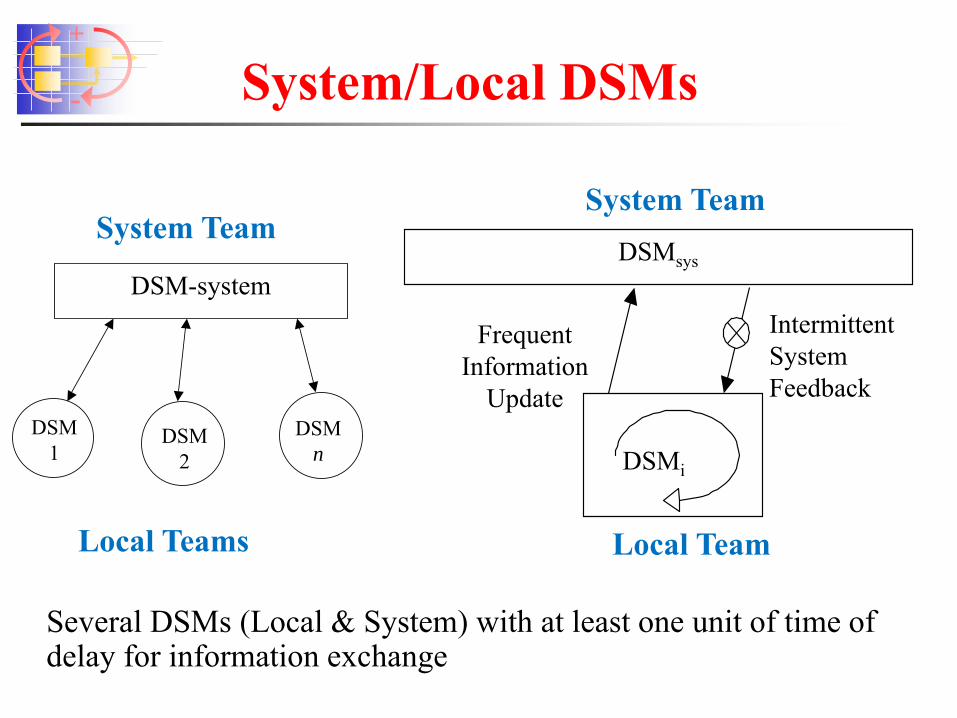
- System/Local DSMs
Several DSMs (Local & System) with at least one unit of time of delay for information exchange
DSMsys
DSMi
Frequent Information
Update
Intermittent System Feedback
DSM-system
System Team
DSM 1
DSM 2
DSM n
Local Teams
System Team
Local Team
+
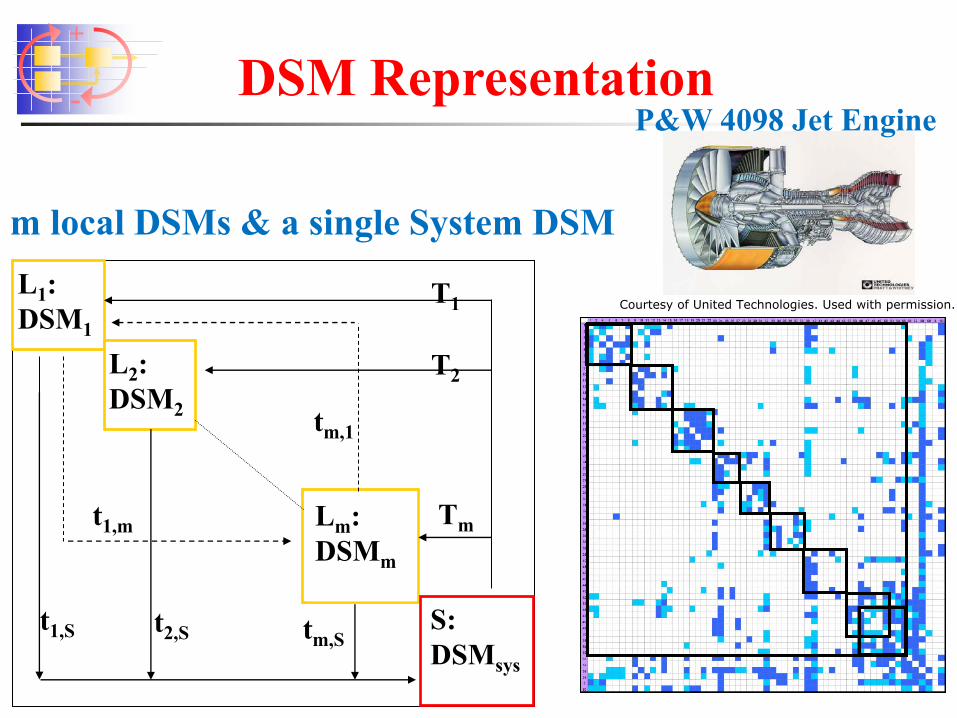
- DSM Representation
m local DSMs & a single System DSM L1: DSM1
L2: DSM2
Lm: DSMm
S: DSMsys
T1
T2
Tm t1,m
t2,S tm,S
tm,1
t1,S
P&W 4098 Jet Engine
Courtesy of United Technologies. Used with permission.
+
-
How Does Decomposition/Integration Affect Performance Dynamics?
Given a local DSM, system DSM, and a choice of information update frequency, what are the conditions under which:
Design churn occurs?
Convergence of development is guaranteed?
+
-
33
The process of designing all interior and exterior automobile surfaces for which appearance, surface quality and operational interface is important to the customer
Case Study: Automotive Appearance Design Process
Exterior sheet metal design Examples
Visible interior panels
Image removed due to copyright restrictions.
+
-
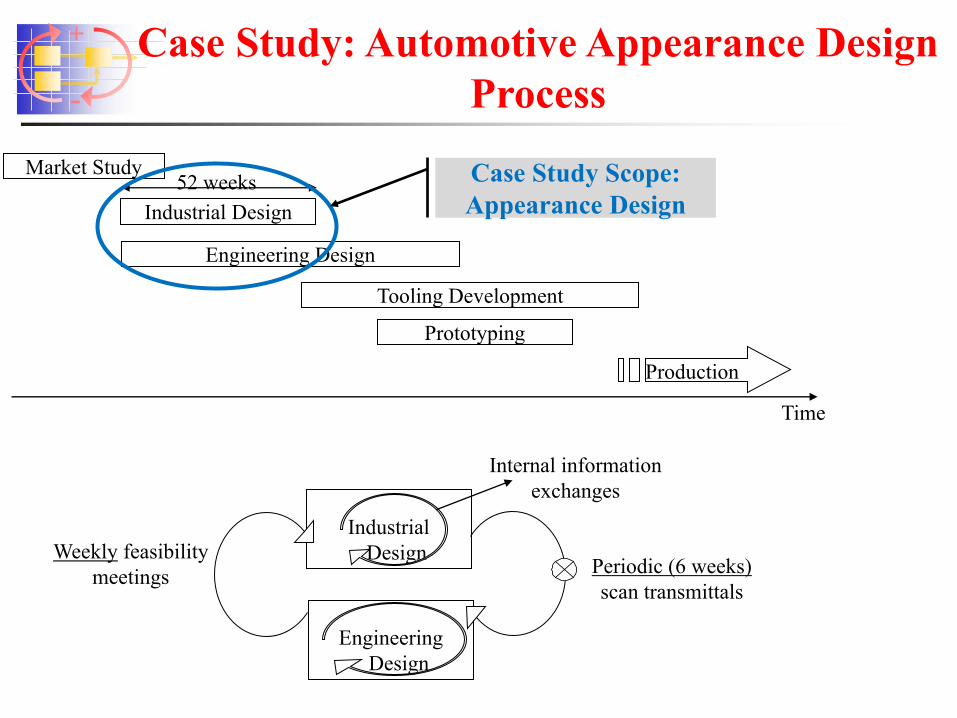
Tooling Development
Prototyping
Industrial Design
Engineering Design
52 weeks
Production
Time
Market Study
Industrial Design
Engineering
Design
Weekly feasibility meetings
Periodic (6 weeks) scan transmittals
Internal information exchanges
Case Study Scope: Appearance Design
Case Study: Automotive Appearance Design Process
+
-
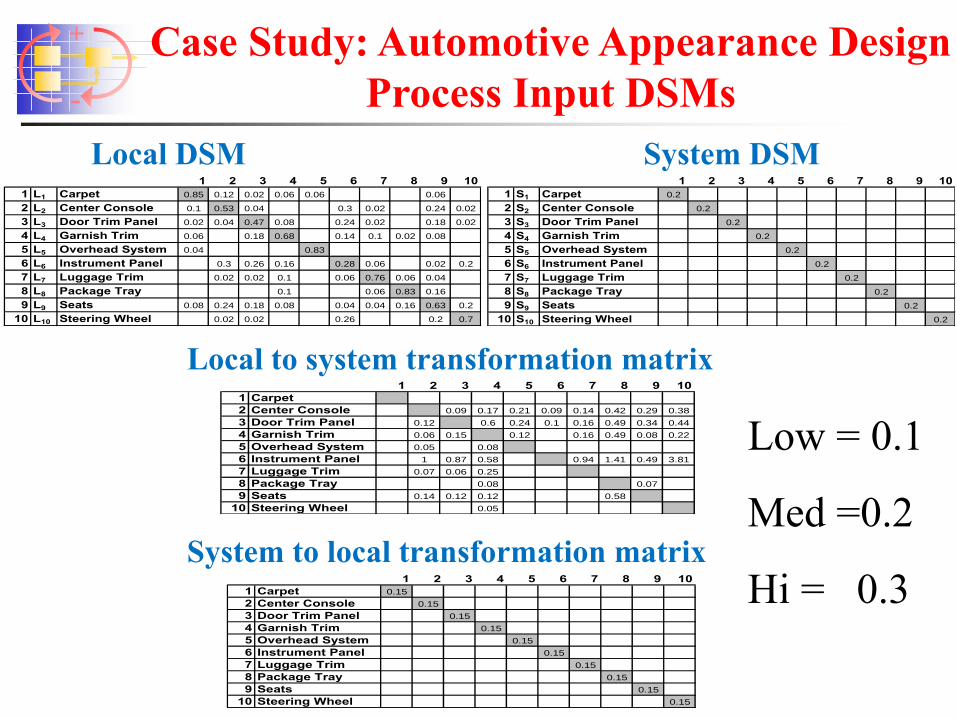
Case Study: Automotive Appearance Design Process Input DSMs
1 2 3 4 5 6 7 8 9 101 Carpet2 Center Console 0.09 0.17 0.21 0.09 0.14 0.42 0.29 0.38
3 Door Trim Panel 0.12 0.6 0.24 0.1 0.16 0.49 0.34 0.44
4 Garnish Trim 0.06 0.15 0.12 0.16 0.49 0.08 0.22
5 Overhead System 0.05 0.08
6 Instrument Panel 1 0.87 0.58 0.94 1.41 0.49 3.81
7 Luggage Trim 0.07 0.06 0.25
8 Package Tray 0.08 0.07
9 Seats 0.14 0.12 0.12 0.58
10 Steering Wheel 0.05
1 2 3 4 5 6 7 8 9 101 Carpet 0.15
2 Center Console 0.15
3 Door Trim Panel 0.15
4 Garnish Trim 0.15
5 Overhead System 0.15
6 Instrument Panel 0.15
7 Luggage Trim 0.15
8 Package Tray 0.15
9 Seats 0.15
10 Steering Wheel 0.15
1 2 3 4 5 6 7 8 9 101 L1 Carpet 0.85 0.12 0.02 0.06 0.06 0.06
2 L2 Center Console 0.1 0.53 0.04 0.3 0.02 0.24 0.02
3 L3 Door Trim Panel 0.02 0.04 0.47 0.08 0.24 0.02 0.18 0.02
4 L4 Garnish Trim 0.06 0.18 0.68 0.14 0.1 0.02 0.08
5 L5 Overhead System 0.04 0.83
6 L6 Instrument Panel 0.3 0.26 0.16 0.28 0.06 0.02 0.2
7 L7 Luggage Trim 0.02 0.02 0.1 0.06 0.76 0.06 0.04
8 L8 Package Tray 0.1 0.06 0.83 0.16
9 L9 Seats 0.08 0.24 0.18 0.08 0.04 0.04 0.16 0.63 0.2
10 L10 Steering Wheel 0.02 0.02 0.26 0.2 0.7
1 2 3 4 5 6 7 8 9 101 S1 Carpet 0.2
2 S2 Center Console 0.2
3 S3 Door Trim Panel 0.2
4 S4 Garnish Trim 0.2
5 S5 Overhead System 0.2
6 S6 Instrument Panel 0.2
7 S7 Luggage Trim 0.2
8 S8 Package Tray 0.2
9 S9 Seats 0.2
10 S10 Steering Wheel 0.2
Local DSM System DSM
Local to system transformation matrix
System to local transformation matrix
Low = 0.1
Med =0.2
Hi = 0.3
+
-
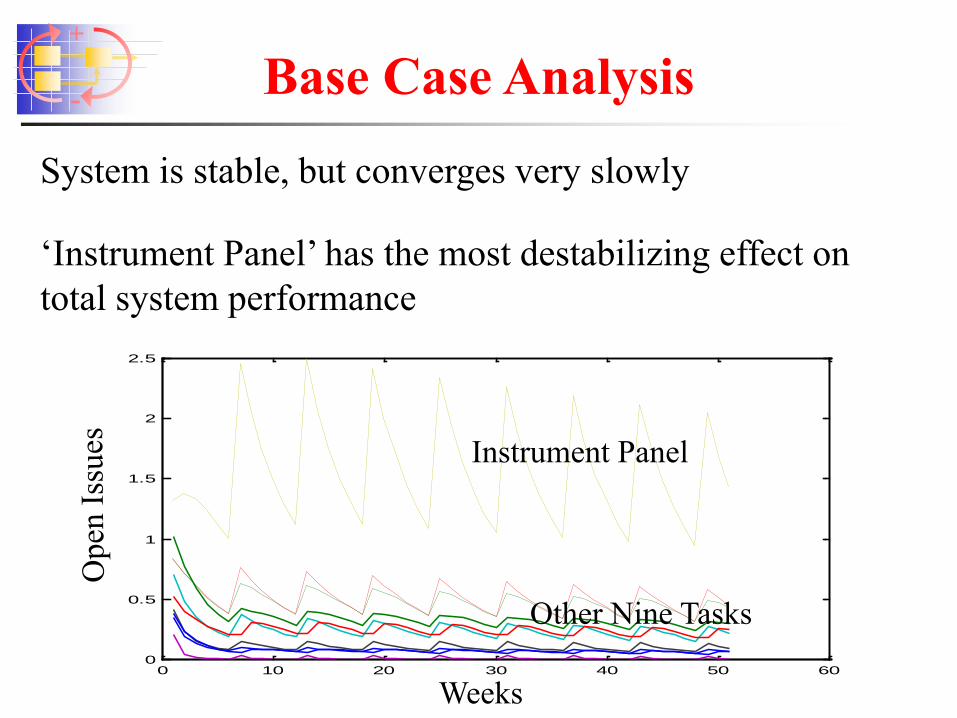
0 10 20 30 40 50 600
0.5
1
1.5
2
2.5
Weeks
Instrument Panel
Other Nine Tasks
System is stable, but converges very slowly
Base Case Analysis
‘Instrument Panel’ has the most destabilizing effect on total system performance
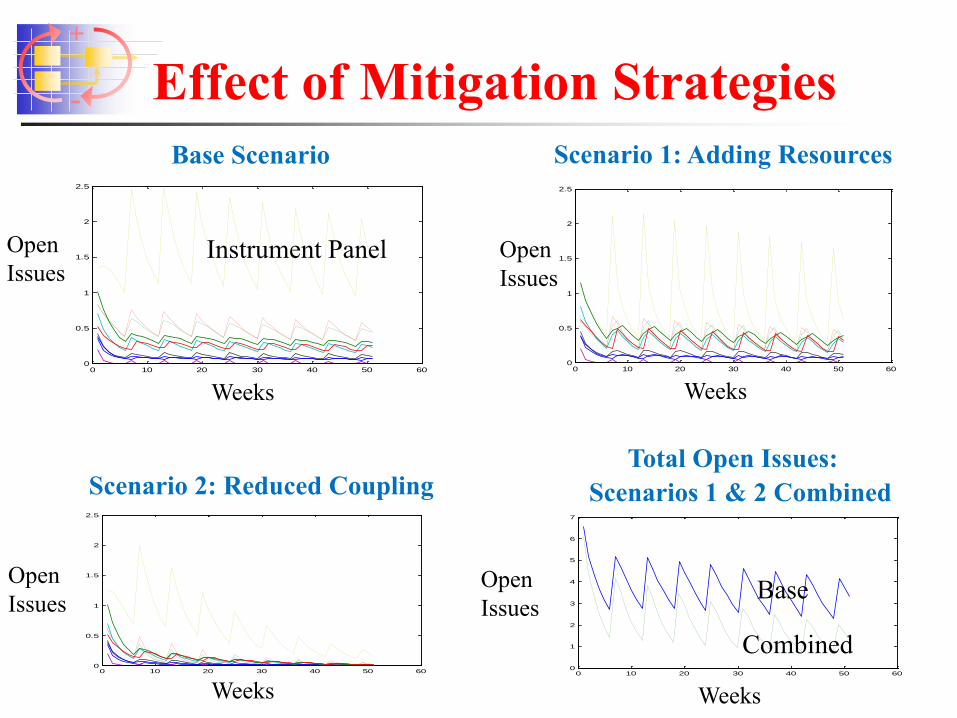
+
- Effect of Mitigation Strategies
0 10 20 30 40 50 600
0.5
1
1.5
2
2.5
0 10 20 30 40 50 600
0.5
1
1.5
2
2.5
0 10 20 30 40 50 600
1
2
3
4
5
6
7
0 10 20 30 40 50 600
0.5
1
1.5
2
2.5
Weeks
Open Issues
Instrument Panel
Base Scenario Scenario 1: Adding Resources
Scenario 2: Reduced Coupling Scenarios 1 & 2 Combined Total Open Issues:
Base
Combined
Weeks
Open Issues
Weeks
Open Issues
Weeks
Open Issues
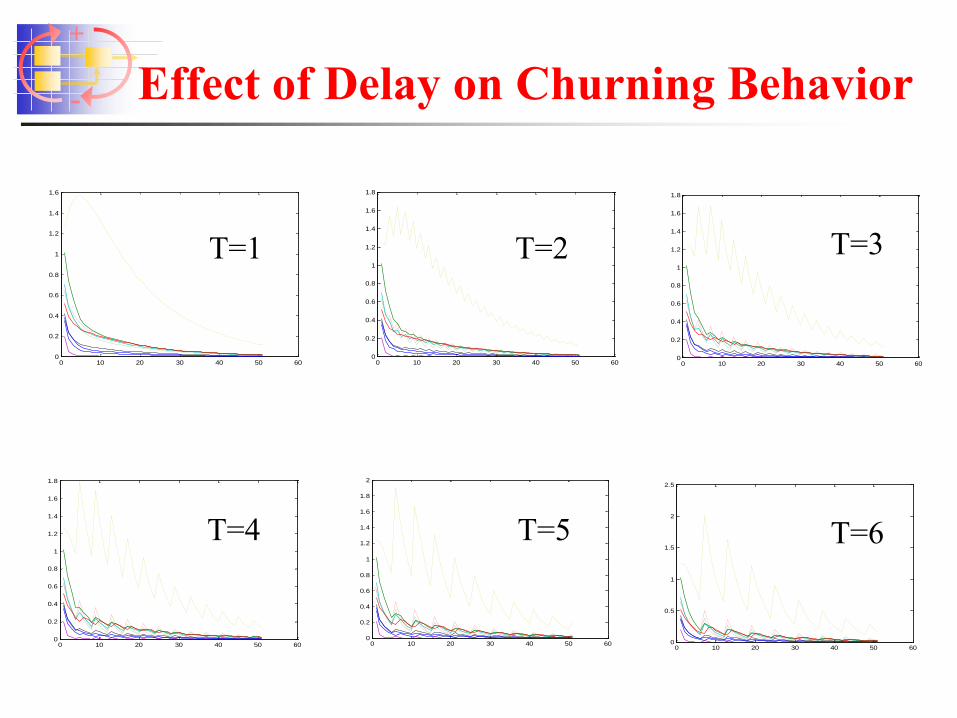
+
- Effect of Delay on Churning Behavior
0 10 20 30 40 50 600
0.2
0.4
0.6
0.8
1
1.2
1.4
1.6
1.8
T=4
0 10 20 30 40 50 600
0.2
0.4
0.6
0.8
1
1.2
1.4
1.6
1.8
2
T=5
0 10 20 30 40 50 600
0.5
1
1.5
2
2.5
T=6
0 10 20 30 40 50 600
0.2
0.4
0.6
0.8
1
1.2
1.4
1.6
1.8
T=3
0 10 20 30 40 50 600
0.2
0.4
0.6
0.8
1
1.2
1.4
1.6
1.8
T=2
0 10 20 30 40 50 600
0.2
0.4
0.6
0.8
1
1.2
1.4
1.6
T=1
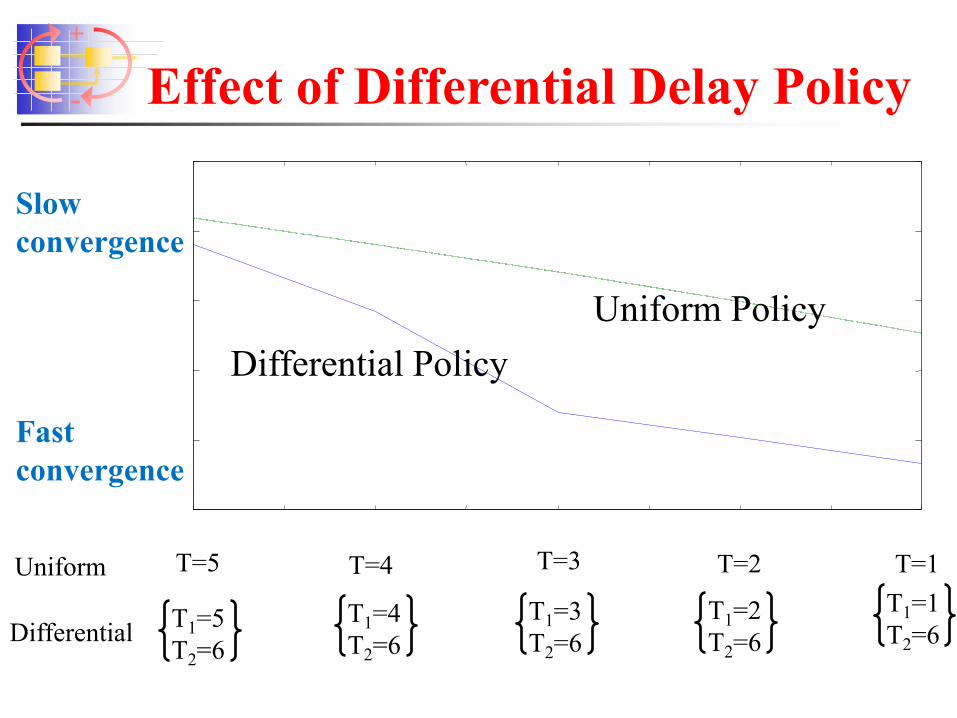
+
- Effect of Differential Delay Policy
Uniform Policy Differential Policy
Uniform
Differential
T=5 T=4 T=3 T=2 T=1
T1=5 T2=6
T1=4 T2=6
T1=3 T2=6
T1=2 T2=6
T1=1 T2=6
Slow convergence
Fast convergence
+
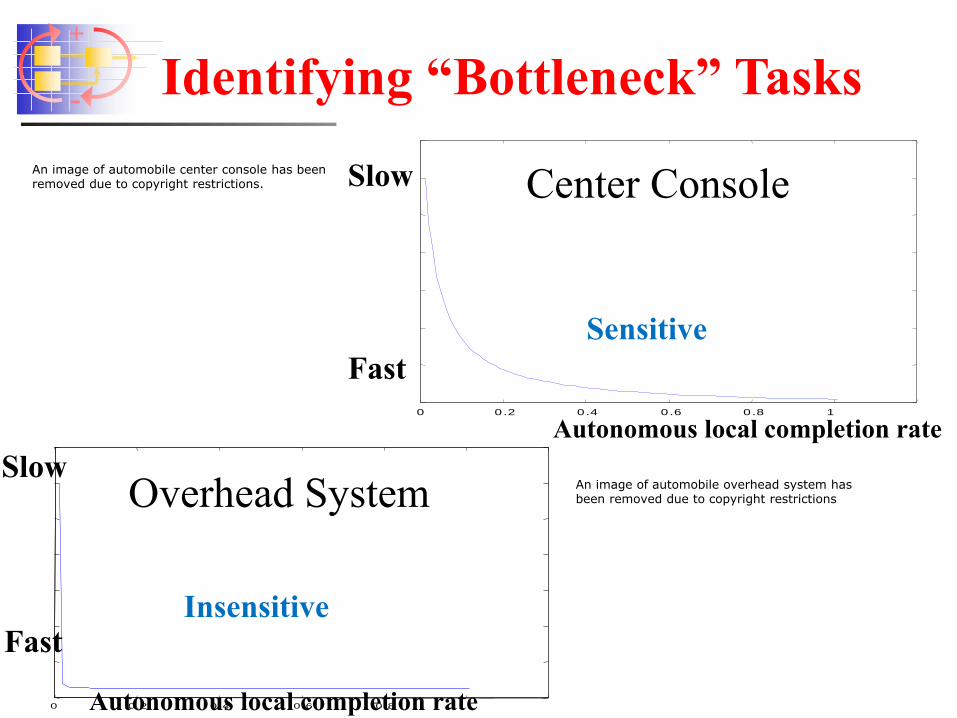
-
0 0.2 0.4 0.6 0.8 1
0 0.2 0.4 0.6 0.8 1
Center Console
Overhead System
Identifying “Bottleneck” Tasks
Autonomous local completion rate
Autonomous local completion rate
Slow
Fast
Slow
Fast
Sensitive
Insensitive
An image of automobile center console has beenremoved due to copyright restrictions.
An image of automobile overhead system hasbeen removed due to copyright restrictions
+
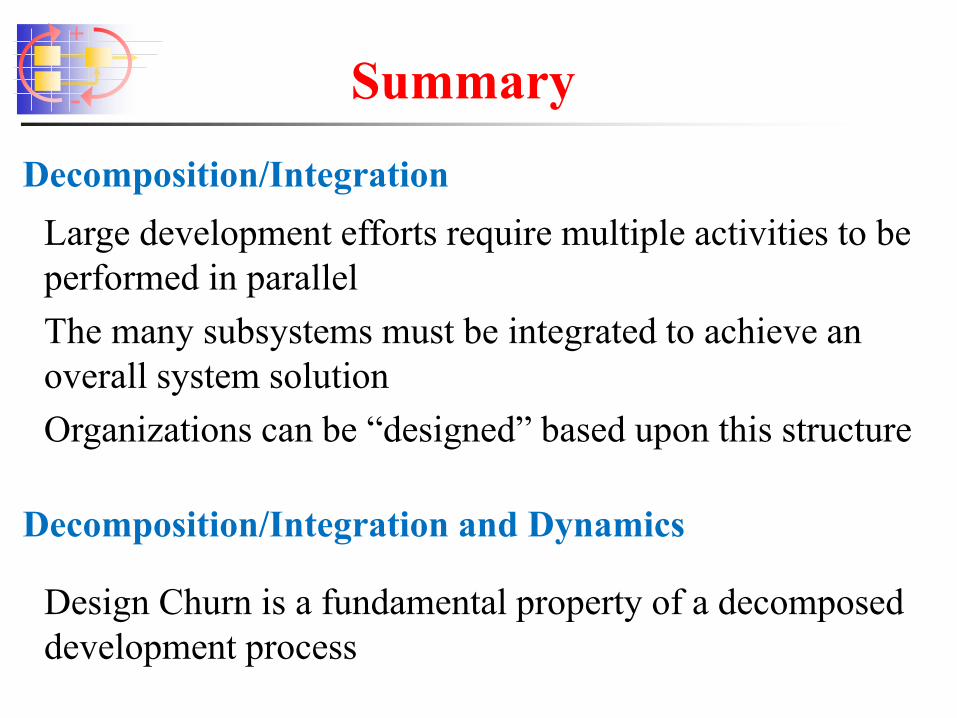
- Summary
Large development efforts require multiple activities to be performed in parallel The many subsystems must be integrated to achieve an overall system solution Organizations can be “designed” based upon this structure
Decomposition/Integration
Decomposition/Integration and Dynamics
Design Churn is a fundamental property of a decomposed development process
+
-
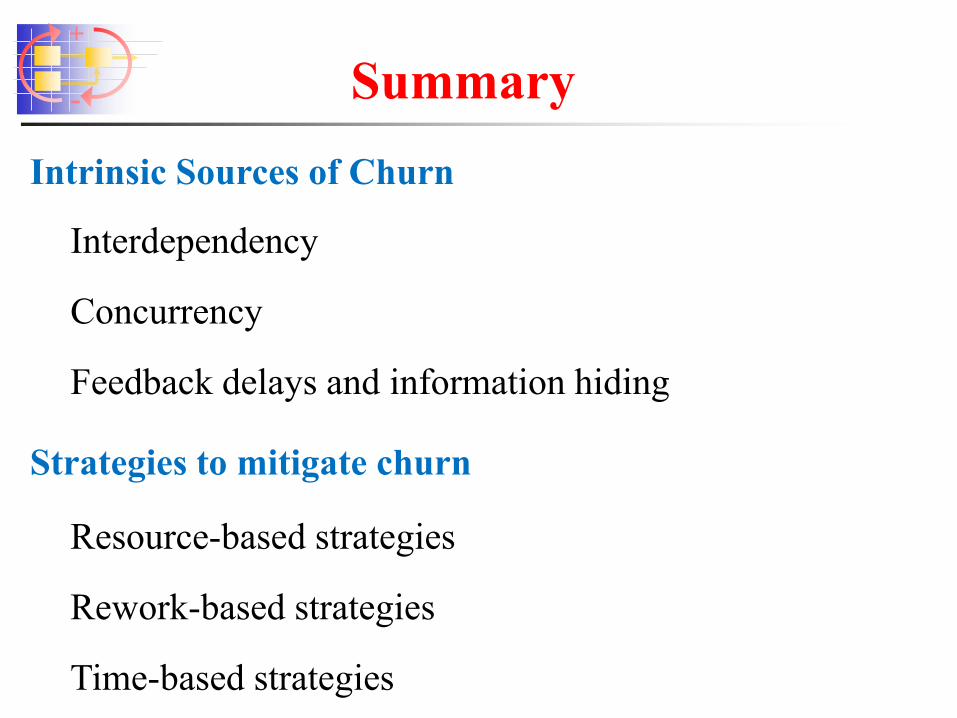
Time-based strategies
Summary Intrinsic Sources of Churn
Strategies to mitigate churn
Interdependency
Concurrency
Feedback delays and information hiding
Resource-based strategies
Rework-based strategies
+
-
43
Further Reading
Complex concurrent engineering Dan Braha and Ali Yassine. “Complex Concurrent Engineering and the Design Structure Matrix Approach.” Concurrent Engineering: Research and Applications. Vol. 11 (3). pp. 165-177. 2003. Read paper at http://necsi.edu/affiliates/braha/CERA.pdf
Ali Yassine, Nitin Joglekar, Dan Braha, Steven Eppinger, and Dan Whitney. “Information Hiding in Product Development: The Design Churn Effect.” Research in Engineering Design. Vol. 14 (3). pp. 131-144. 2003. Read paper at http://necsi.edu/affiliates/braha/RED03_Info.pdf
The design churn effect
MIT OpenCourseWarehttp://ocw.mit.edu
ESD.36 System Project ManagementFall 2012
For information about citing these materials or our Terms of Use, visit: http://ocw.mit.edu/terms.