lecture # 04a demand and supply (end) lecturer: martin paredes
DESCRIPTION
Lecture # 04a Demand and Supply (end) Lecturer: Martin Paredes. Other Elasticities. In general, for the elasticity of “Y” with respect to “X”: Y,X = ( % Y) = ( Y /Y) = d Y . X ( % X )( X /X) d X Y. Other Elasticities. - PowerPoint PPT PresentationTRANSCRIPT

Lecture # 04aLecture # 04a
Demand and Supply (end)Demand and Supply (end)
Lecturer: Martin ParedesLecturer: Martin Paredes
2
In general, for the elasticity of “Y” with respect to “X”:
Y,X= (% Y) = (Y/Y) = dY . X (% X) (X/X) dX Y
3
Price elasticity of supply: measures curvature of supply curve
(% QS) = (QS/QS) = dQS . P (% P) (P/P) dP QS
4
Income elasticity of demand measures degree of shift of demand curve as income changes…
(% QD) = (QD/QD) = dQD . I (% I) (I/I) dI QD
5
Cross price elasticity of demand measures degree of shift of demand curve when the price of another good changes
(% QD) = (QD/QD) = dQD . P0
(% P0) (P0/P0) dP0 QD
6
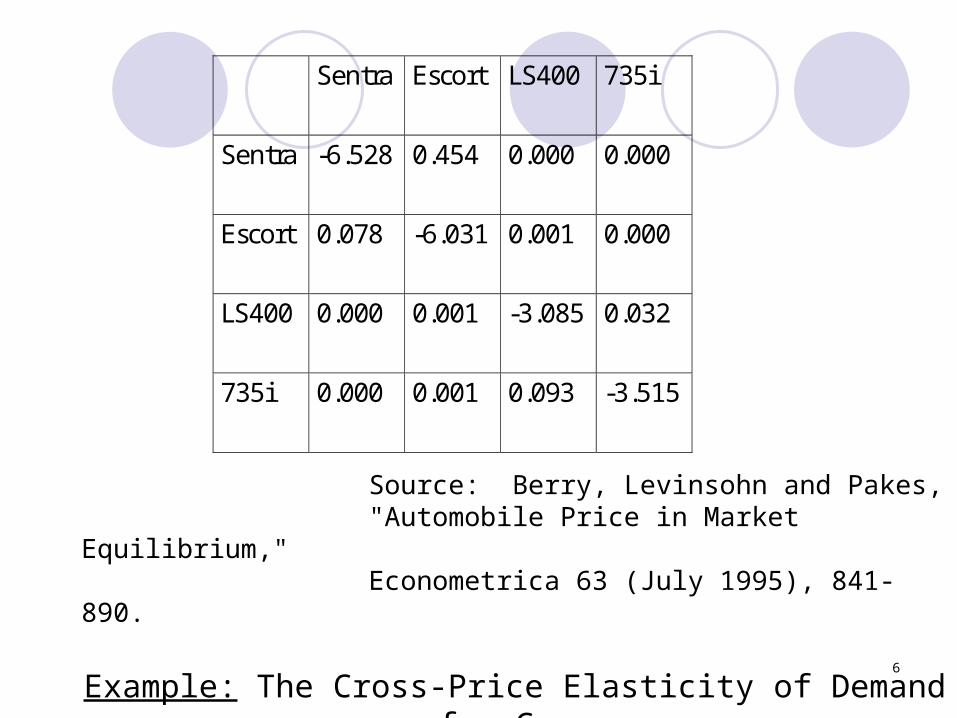
Sentra Escort LS400 735i
Sentra -6.528 0.454 0.000 0.000
Escort 0.078 -6.031 0.001 0.000
LS400 0.000 0.001 -3.085 0.032
735i 0.000 0.001 0.093 -3.515
Source: Berry, Levinsohn and Pakes,"Automobile Price in Market Equilibrium," Econometrica 63 (July 1995), 841-890.
Example: The Cross-Price Elasticity of Demand for Cars
7
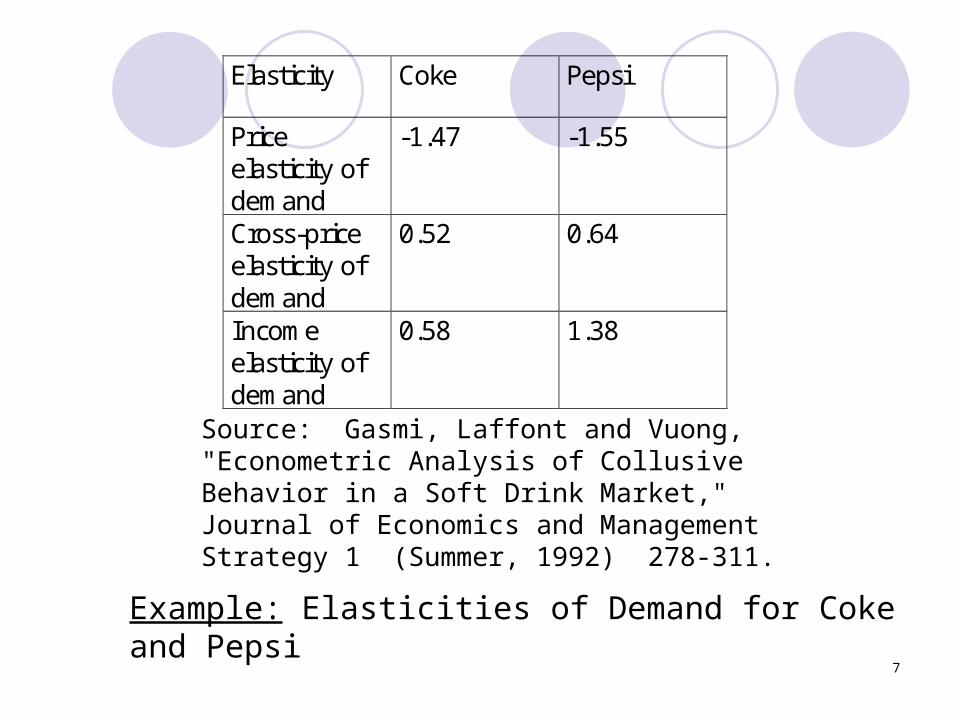
Elasticity Coke Pepsi
Priceelasticity ofdemand
-1.47 -1.55
Cross-priceelasticity ofdemand
0.52 0.64
Incomeelasticity ofdemand
0.58 1.38
Source: Gasmi, Laffont and Vuong, "Econometric Analysis of Collusive Behavior in a Soft Drink Market," Journal of Economics and Management Strategy 1 (Summer, 1992) 278-311.
Example: Elasticities of Demand for Coke and Pepsi
8
1. Use Own Price Elasticities and Equilibrium Price and Quantity
2. Use Information on Past Shifts of Demand and Supply
9
1. Choose a general shape for functions Linear Constant elasticity
2. Estimate parameters of demand and supply using elasticity and equilibrium information We need information on ε, P* and Q*
10
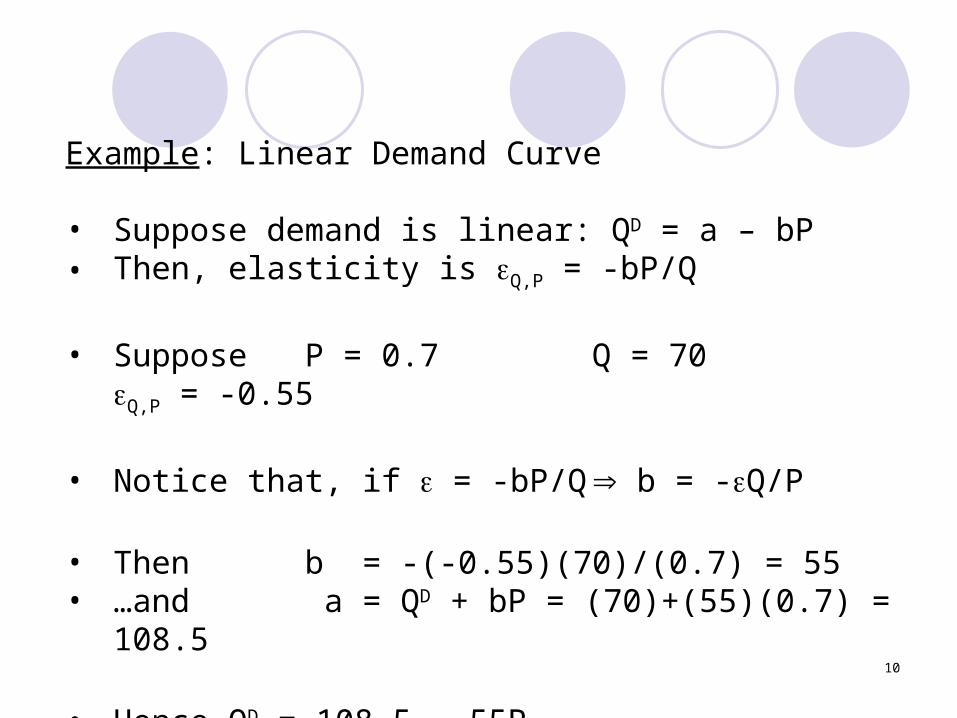
Example: Linear Demand Curve
• Suppose demand is linear: QD = a – bP• Then, elasticity is Q,P = -bP/Q
• Suppose P = 0.7 Q = 70 Q,P = -0.55
• Notice that, if = -bP/Q b = -Q/P
• Then b = -(-0.55)(70)/(0.7) = 55• …and a = QD + bP = (70)+(55)(0.7) = 108.5
• Hence QD = 108.5 – 55P
11
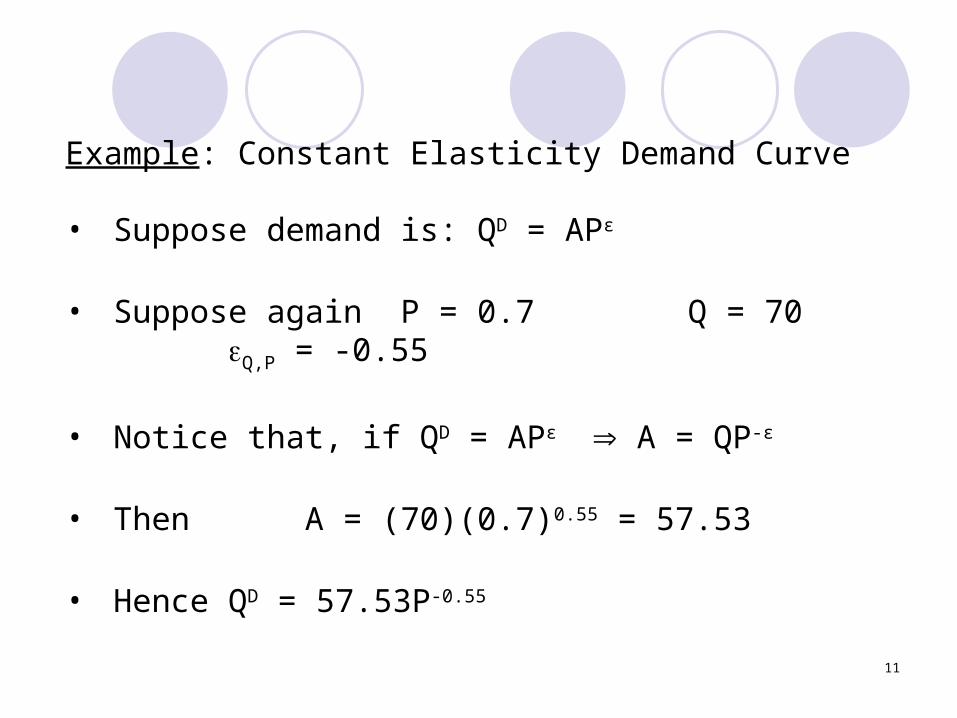
Example: Constant Elasticity Demand Curve
• Suppose demand is: QD = APε
• Suppose again P = 0.7 Q = 70 Q,P = -0.55
• Notice that, if QD = APε A = QP-ε
• Then A = (70)(0.7)0.55 = 57.53
• Hence QD = 57.53P-0.55

12
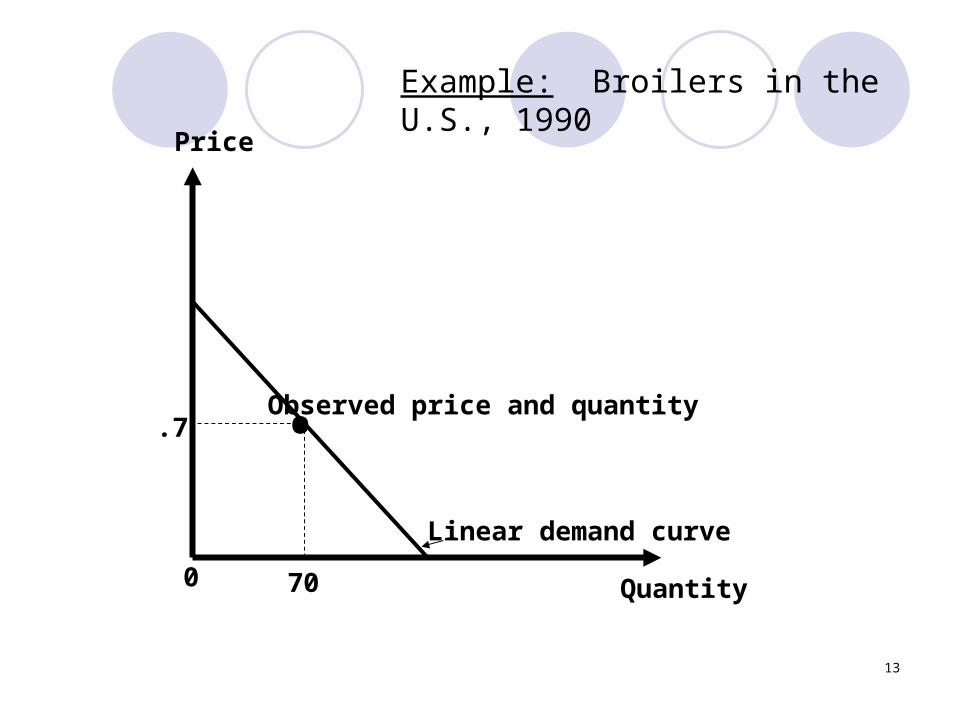
Quantity
Price
0 70
.7 • Observed price and quantity
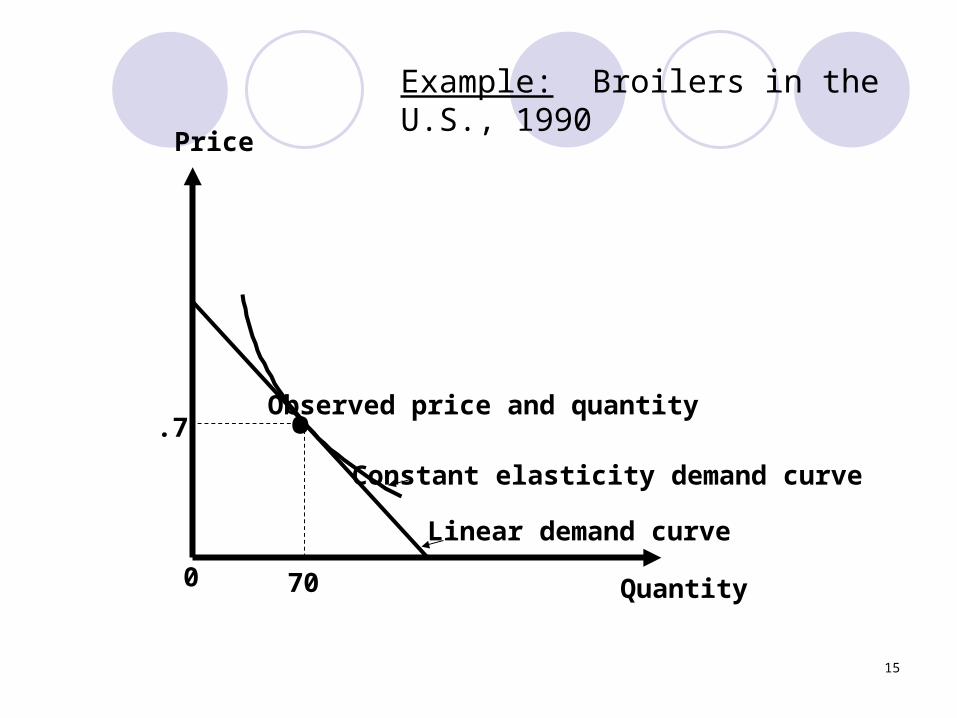
Example: Broilers in the U.S., 1990
13
Quantity
Price
0 70
.7 • Observed price and quantity
Linear demand curve
Example: Broilers in the U.S., 1990
14
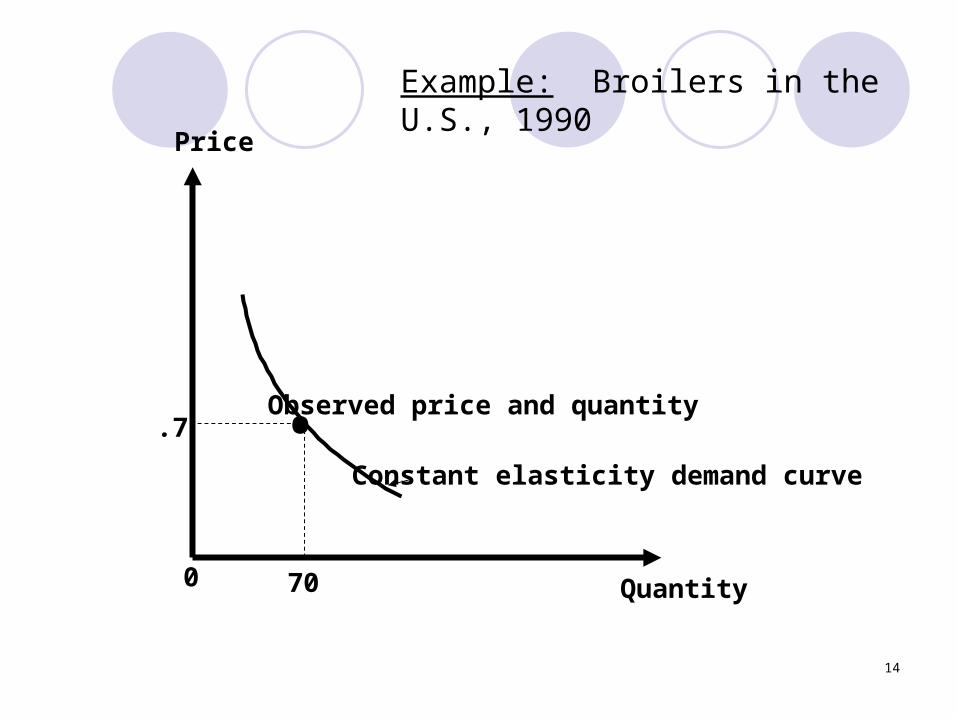
Quantity
Price
0 70
.7 • Observed price and quantity
Constant elasticity demand curve
Example: Broilers in the U.S., 1990
15
Quantity
Price
0 70
.7 • Observed price and quantity
Constant elasticity demand curve
Linear demand curve
Example: Broilers in the U.S., 1990
16
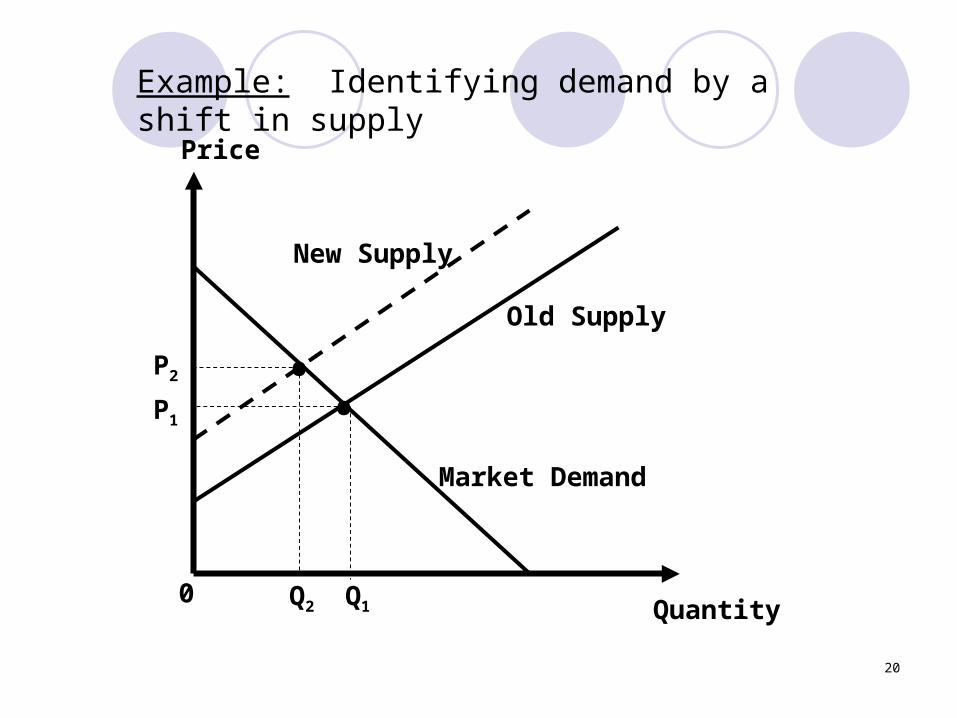
1. A shift in the supply curve reveals the slope of the demand curve
2. A shift in the demand curve reveals the slope of the supply curve.
17
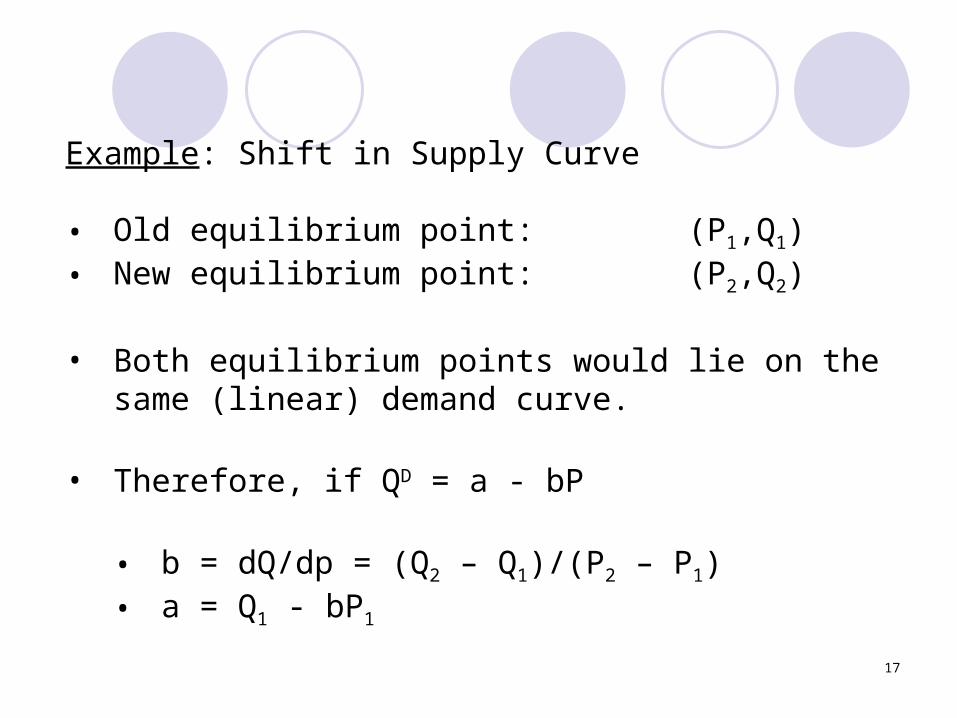
Example: Shift in Supply Curve
• Old equilibrium point: (P1,Q1)• New equilibrium point: (P2,Q2)
• Both equilibrium points would lie on the same (linear) demand curve.
• Therefore, if QD = a - bP
• b = dQ/dp = (Q2 – Q1)/(P2 – P1)• a = Q1 - bP1
18
Quantity
Price
0
Market Demand
Supply
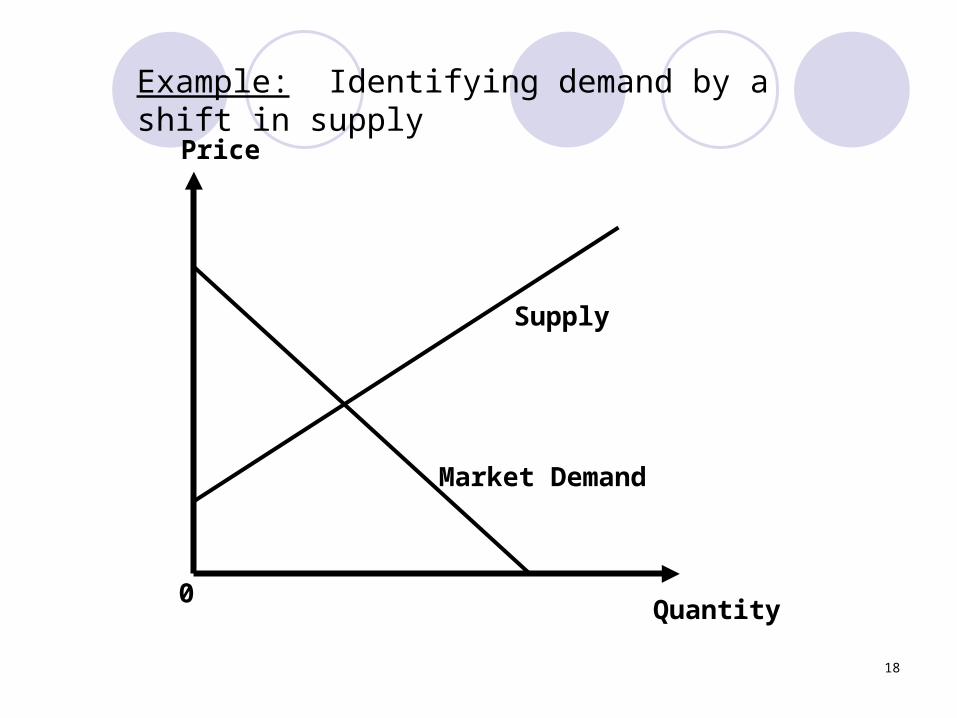
Example: Identifying demand by a shift in supply
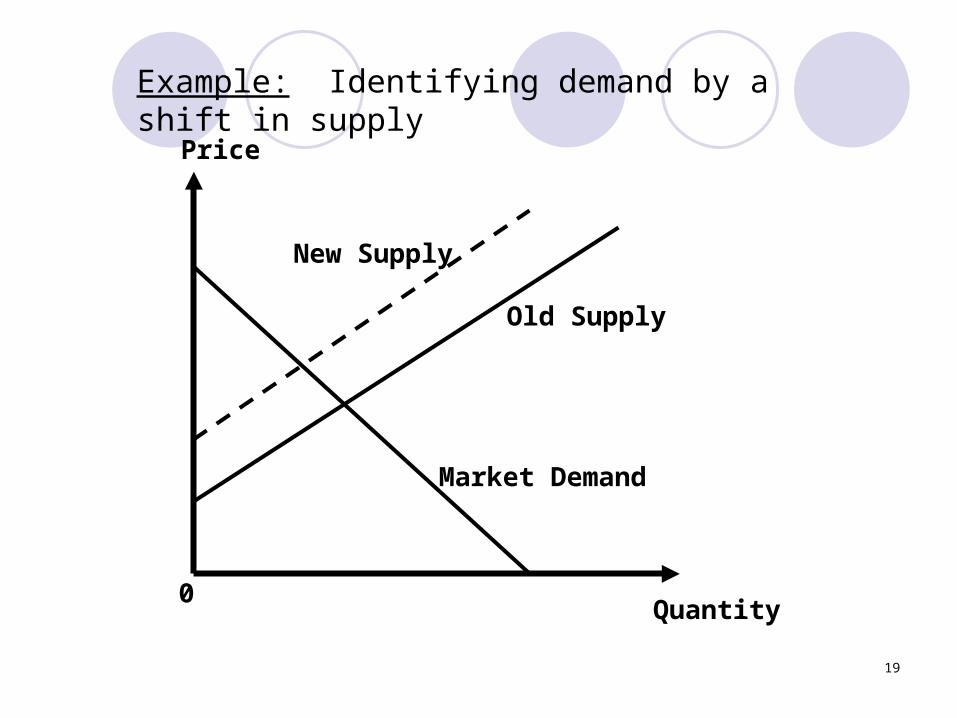
19
Quantity
Price
0
Market Demand
New Supply
Old Supply
Example: Identifying demand by a shift in supply
20
Quantity
Price
0
Market Demand
New Supply
Q2
••
Q1
Old Supply
P2
P1
Example: Identifying demand by a shift in supply
21
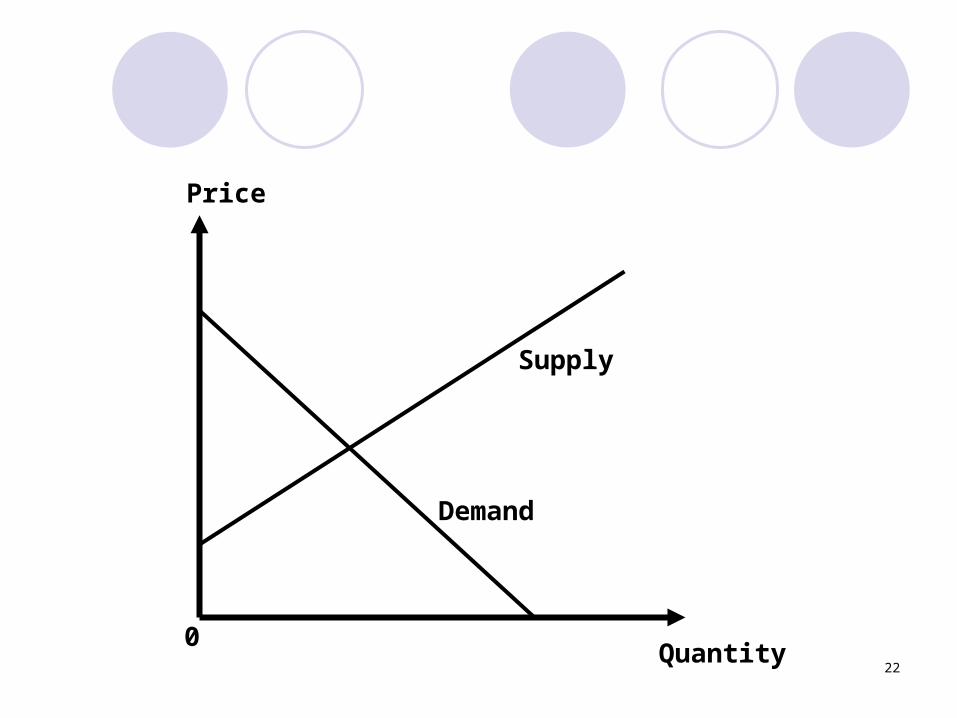
This technique only works if the curve we want to estimate stays constant.
Example: Shift in Supply Curve
• We require that the demand curve does not shift
22Quantity
Price
0
Demand
Supply
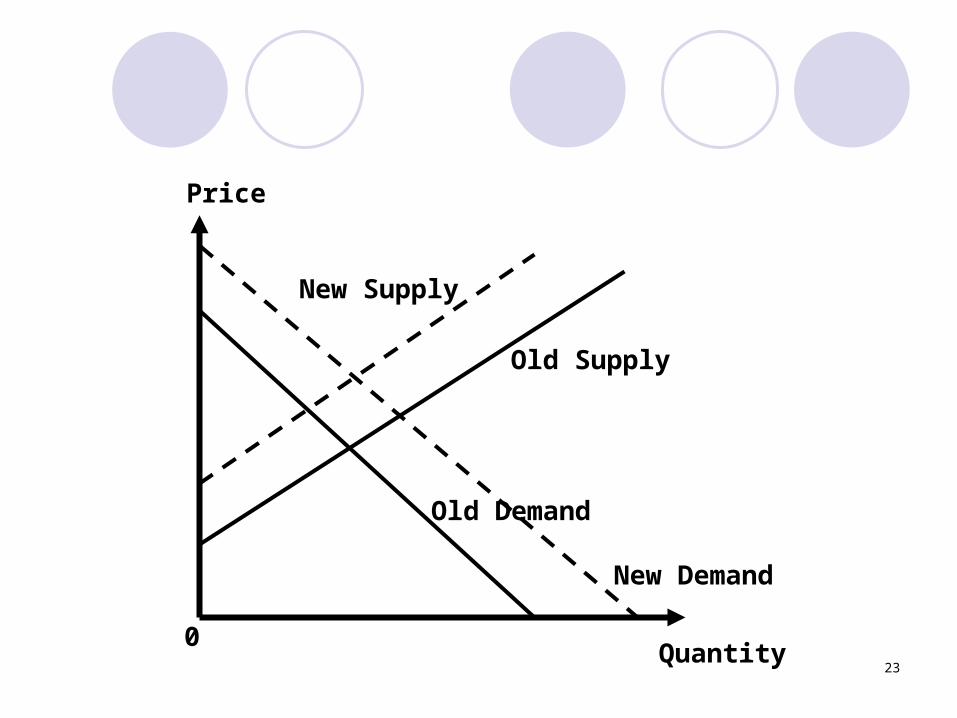
23Quantity
Price
0
Old Demand
New Supply
Old Supply
New Demand
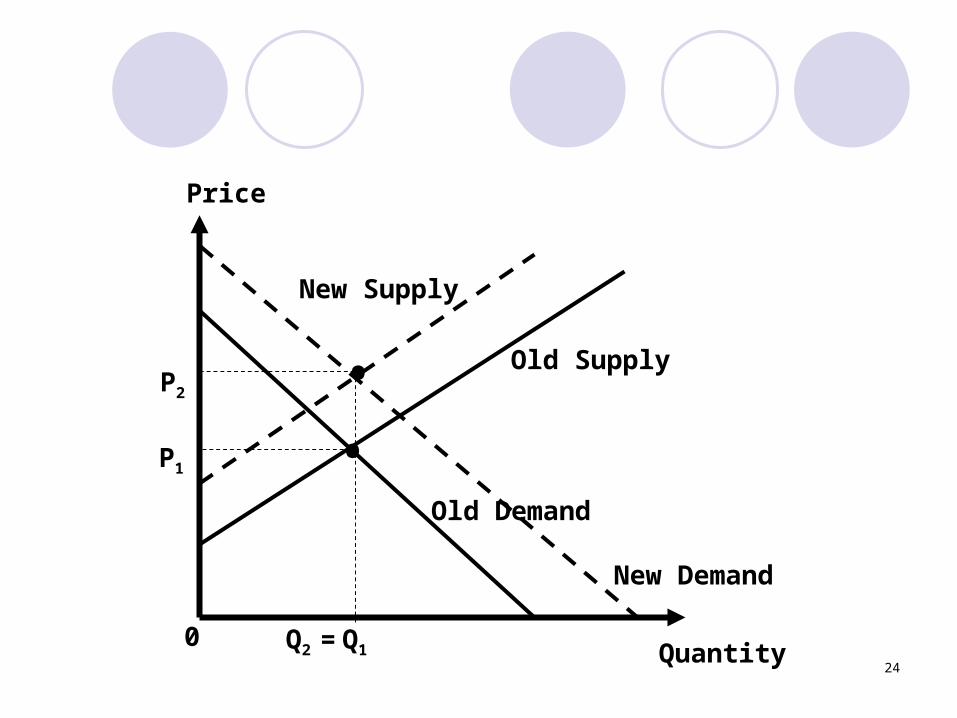
24Quantity
Price
0
Old Demand
New Supply
Q2 =
••
Q1
Old SupplyP2
P1
New Demand
25
1. Example of a simple micro model of supply and demand (two equations and an equilibrium condition)
2. Elasticity as a way of characterizing demand and supply
3. Factors that determined elasticity
4. Estimating demand and supply a. From own price elasticity and equilibrium price
and quantityb. From information on past shifts, assuming that
only a single curve shifts at a time.