learning from crowds in the presence of schools of...
TRANSCRIPT

Learning from Crowds in the Presence ofSchools of Thought
Yuandong TianSchool of Computer ScienceCarnegie Mellon UniversityPittsburgh, PA 15213, USA
Jun ZhuDepartment of Comp. Sci. & Tech.
Tsinghua UniversityBeijing, 10084, China
ABSTRACTCrowdsourcing has recently become popular among machinelearning researchers and social scientists as an effective wayto collect large-scale experimental data from distributed work-ers. To extract useful information from the cheap but poten-tially unreliable answers to tasks, a key problem is to identifyreliable workers as well as unambiguous tasks. Although forobjective tasks that have one correct answer per task, pre-vious works can estimate worker reliability and task claritybased on the single gold standard assumption, for tasks thatare subjective and accept multiple reasonable answers thatworkers may be grouped into, a phenomenon called schoolsof thought, existing models cannot be trivially applied. Inthis work, we present a statistical model to estimate workerreliability and task clarity without resorting to the singlegold standard assumption. This is instantiated by explicit-ly characterizing the grouping behavior to form schools ofthought with a rank-1 factorization of a worker-task group-size matrix. Instead of performing an intermediate infer-ence step, which can be expensive and unstable, we presentan algorithm to analytically compute the sizes of differentgroups. We perform extensive empirical studies on real datacollected from Amazon Mechanical Turk. Our method dis-covers the schools of thought, shows reasonable estimationof worker reliability and task clarity, and is robust to hy-perparameter changes. Furthermore, our estimated workerreliability can be used to improve the gold standard predic-tion for objective tasks.
Categories and Subject DescriptorsI.5.1 [Pattern Recognition]: Models - Statistical
General TermsAlgorithms, Experimentation
KeywordsCrowdsourcing, Schools of Thought, Pattern Analysis
Permission to make digital or hard copies of all or part of this work forpersonal or classroom use is granted without fee provided that copies arenot made or distributed for profit or commercial advantage and that copiesbear this notice and the full citation on the first page. To copy otherwise, torepublish, to post on servers or to redistribute to lists, requires prior specificpermission and/or a fee.KDD’12, August 12–16, 2012, Beijing, China.Copyright 2012 ACM 978-1-4503-1462-6 /12/08 ...$15.00.
1. INTRODUCTIONCrowdsourcing has emerged as an effective way to collect
large-scale data to help solve challenging scientific and engi-neering problems. In web services such as Amazon Mechan-ical Turk (M-Turk)1, human intelligence tasks (HITs) (e.g.,“Does the image contain a car?”) are distributed from the re-questor to an unknown set of workers, called crowds, who arepaid with a low cost to fulfill them. There are two kinds ofapplications for crowdsourcing. One application is to obtaincorrect labels of a dataset, used in computer vision [21], nat-ural language processing [19], etc. In such a scenario, taskis objective with one correct answer, called gold standard.The goal is to recover it from the noisy worker responses.The other application is to use crowdsourcing for qualita-tive user studies [11], demographic survey [16] or solving ahard problem [1]. In this case, each task may have multiplevalid answers, called schools of thought, since the tasks aresubjective or can be misinterpreted, and the workers comefrom a variety of cultural and educational background [16].
Due to the open and anonymous nature of crowdsourcing,the quality of the collected data is not guaranteed. In orderto use these data well, in both scenarios we need to addresstwo common key problems – “how to identify a small num-ber of unreliable workers whose answers may be random oreven adversary” and “how to identify tasks that may causeconfusion to workers”. Formally, we call these two factorsworker reliability and task clarity. In crowdsourcing appli-cations that aim to obtain ground truth labels of a dataset,only the labels from reliable workers should be trusted, andambiguous tasks should be redesigned to remove any mis-understanding in the future. In applications that aim foruser study or look for multiple opinions, one needs to dis-tinguish whether a worker has a reasonable opinion, or justputs random answers that may ruin the data distribution.
In the former case, many previous works [15, 23, 19, 14,10] have been presented and shown promising results com-pared to the “majority voting” heuristic. The worker relia-bility is defined either as the degree of concentration (pre-cision) [15, 23, 22] or confusion matrix [9, 18, 5] referencingthe estimated gold standard, whose existence is an essentialassumption in these works. Some works also model task d-ifficulty [22], again based on the existence of gold standard.Computationally, an iterative approach is usually adoptedto estimate the gold standard and worker reliability simul-taneously. The rationale is that knowing the gold standardhelps to identify reliable workers and workers’ reliability isuseful to weigh their answers to recover the gold standard.
1https://www.mturk.com

However, in the latter case where more than one answerscould be valid and reasonable, defining worker reliability ontop of a single gold standard is no longer a good idea. Forsome workers, their reliability can be underestimated onlybecause they support a reasonable idea that is not the es-timated single gold standard, yet in fact they may followa unique but reasonable thinking and should be respected.On the other hand, an unambiguous task that is supposed tohave alternative answers may also be estimated as confusing.
To deal with this problem, in this paper, we directly mod-el worker reliability and task clarity without the help of goldstandard. As a result, this model works in both scenariosof crowdsourcing applications. Our model is built on thefollowing two mild assumptions on the grouping behaviorthat happens in schools of thought: 1) reliable workers tendto agree with other workers in many tasks; and 2) the an-swers to a clear task tend to form tight clusters. Followingthis idea, we develop a low-rank computational model to ex-plicitly relate the grouping behavior of schools of thought,characterized by group sizes, to worker reliability and taskclarity. To bypass the hard model selection problem of de-termining the unknown number of clusters (i.e., schools), weapply nonparametric Bayesian clustering techniques, whichhave shown great promise in statistics and machine learn-ing [3, 6, 24]. Moreover, instead of performing a potentiallyexpensive and unstable intermediate inference step, which isnecessary for all the previous works [15, 23, 21, 22], we derivean analytical form to estimate the expected group sizes. Theanalytic form only depends on pairwise distances betweenanswers, making it generalizable to different answer types.Interestingly, our model could provide a generative interpre-tation of latent distance model for social networks [8]. Theworker reliability and task clarity are thus obtained via therank-1 factorization of the expected group size matrix.
Different from most previous works that focus on gold s-tandard estimation, recent work [21] also models the schoolsof thought for binary queries by assigning each worker a (d-ifferent) linear classifier on hidden multidimensional repre-sentations of tasks, with Gaussian priors on both represen-tations and classifiers. The worker reliability is thus definedas the precision of the linear model. However, it remains aquestion whether such linear representations and Gaussianpriors for both tasks and workers are faithful to the data,and whether heterogeneous tasks can be represented in thesame space. Our work avoids such representation issues byexplicitly modeling the grouping structure of the data. Thisleads to fewer assumptions and parameters. Moreover, ourmethod allows an analytic solution, while [21] uses a coor-dinate descent procedure to obtain a local optimum.
Finally, we apply our method to both simulation data andthe real data collected from M-Turk. In the real data, wediscover the group structure of schools of thought (Fig. 1),and show estimated worker reliability and task clarity, aswell as a comparison with several benchmarks and sensitivityanalysis. For objective tasks, we use the estimated workerreliability to select high quality workers for recovering goldstandard, which outperforms previous works [15, 21].
The paper is structured as follows. Section 2 introducesour statistical model for crowdsourcing data analysis in thepresence of schools of thought, together with a simple algo-rithm. Section 3 presents synthetic validation, and Section4 presents analytical results on M-Turk. Finally, Section 5concludes with future directions discussed.
2. A LOW-RANK SCHOOLS OF THOUGHTMODEL
In this section, we present a computational model to es-timate worker reliability and task clarity for crowdsourcingdata in the presence of schools of thought.
2.1 Basic AssumptionsIn crowdsourcing, let N be the number of workers and K
be the number of tasks. Each worker is required to finish allthe K tasks (See the experimental design for more details).We use a scalar λi > 0 to model the constant reliabilityof worker i among different tasks, and a scalar µk > 0 tomodel the constant degree of clarity of task k that holds forall workers2.
Like any useful statistical models, we need to make ap-propriate assumptions in order to perform meaningful es-timation and discover useful patterns. Specifically, for ourproblem of estimating worker reliability and task clarity inthe presence of schools of thought, it suffices to make thefollowing two mild assumptions on the behavior of workersand tasks:
1. A worker i who is consistent with many other workersin most of the tasks is reliable, i.e. λi is large.
2. A task k whose answers form a few tight clusters iseasy, well-addressed and objective (large µk); while atask whose answers form lots of small clusters is com-plicated, confusing and subjective (small µk).
We argue that the above two assumptions are reasonablefor characterizing crowdsourcing data. The first assumptionmay fail if all the workers collaborate to cheat, or the taskis too hard so that most of the workers are misled towardsthe same wrong answer. However, since the basic idea ofcrowdsourcing is to ask the crowds for useful information,it is not restrictive to trust the behavior of the majority ofworkers. Furthermore, most previous works (e.g., majorityvoting, [15] and [22]) in crowdsourcing assuming the exis-tence of gold standards implicitly make the first assumption,which is shown in both their initialization steps and theirmodel designs.
The second assumption can be interpreted as“sense-making”that people make efforts to find interpretations from “expe-rience” (their answers) [17]. Reliable workers are expectedto use more mental resource to obtain a reasonable answer,while unreliable workers may give random nonsense answer-s. A sensible task only contain a few reasonable answers butrandom answers could be many. Thus reliable workers willform large groups, while unreliable ones are discordant. Thisassumption may fail if only a few candidate choices are avail-able for a confusing task that has many potential answers.This can be avoided by concatenating multiple questions in-to one task, which expands the answer space to reveal thetrue clustering structure (See the experiment section).
Note that K tasks and N workers have to be consideredjointly. A single task cannot identify whether a worker isof high quality or not. Similarly, a single worker cannotidentify the ambiguity of tasks.
2A worker’s reliability can be possibly different in varioustasks and time-evolving; a task may be clear to a certainsubgroup of workers but not to others. A systematic studyof this more complicated phenomenon is beyond the scopeof this paper. We leave it for future work.
Sky Building Computer Beauty10.2
0.4
0.6
0.8
1
Sky
0
Building Computer Image Aesthetics
Beauty2
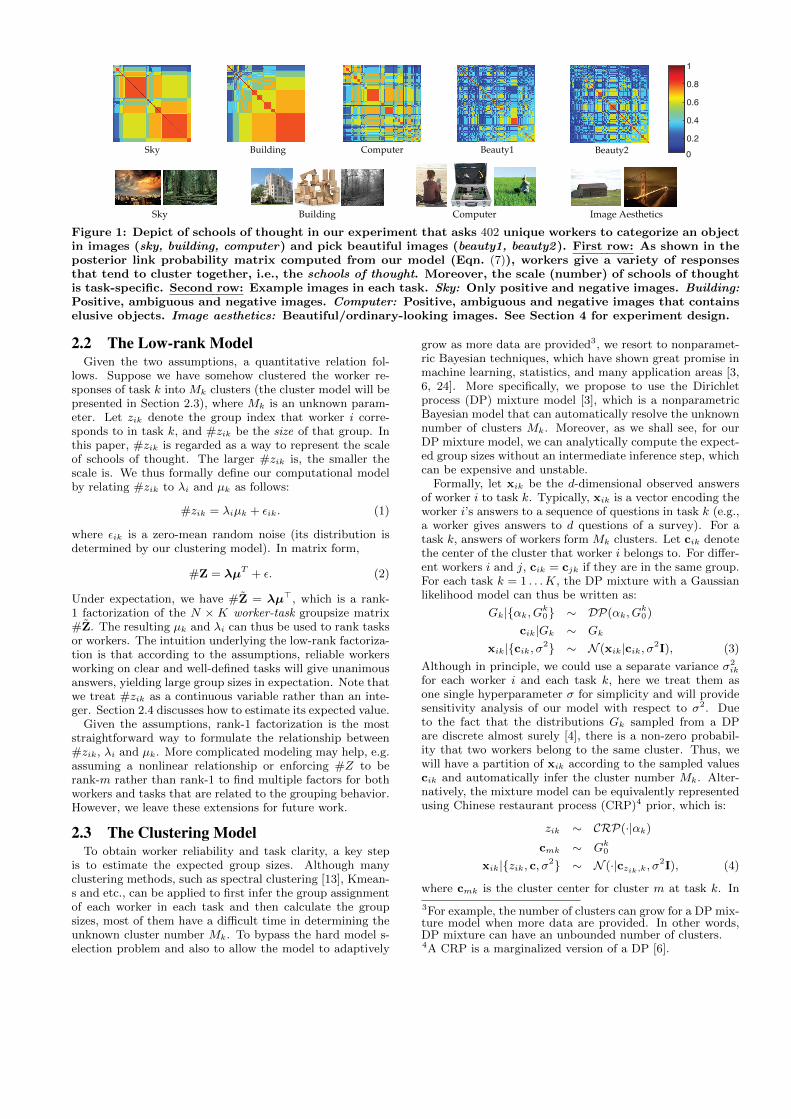
Figure 1: Depict of schools of thought in our experiment that asks 402 unique workers to categorize an objectin images (sky, building, computer) and pick beautiful images (beauty1, beauty2). First row: As shown in theposterior link probability matrix computed from our model (Eqn. (7)), workers give a variety of responsesthat tend to cluster together, i.e., the schools of thought. Moreover, the scale (number) of schools of thoughtis task-specific. Second row: Example images in each task. Sky: Only positive and negative images. Building:Positive, ambiguous and negative images. Computer: Positive, ambiguous and negative images that containselusive objects. Image aesthetics: Beautiful/ordinary-looking images. See Section 4 for experiment design.
2.2 The Low-rank ModelGiven the two assumptions, a quantitative relation fol-
lows. Suppose we have somehow clustered the worker re-sponses of task k into Mk clusters (the cluster model will bepresented in Section 2.3), where Mk is an unknown param-eter. Let zik denote the group index that worker i corre-sponds to in task k, and #zik be the size of that group. Inthis paper, #zik is regarded as a way to represent the scaleof schools of thought. The larger #zik is, the smaller thescale is. We thus formally define our computational modelby relating #zik to λi and µk as follows:
#zik = λiµk + εik. (1)
where εik is a zero-mean random noise (its distribution isdetermined by our clustering model). In matrix form,
#Z = λµT + ε. (2)
Under expectation, we have #Z = λµ>, which is a rank-1 factorization of the N × K worker-task groupsize matrix#Z. The resulting µk and λi can thus be used to rank tasksor workers. The intuition underlying the low-rank factoriza-tion is that according to the assumptions, reliable workersworking on clear and well-defined tasks will give unanimousanswers, yielding large group sizes in expectation. Note thatwe treat #zik as a continuous variable rather than an inte-ger. Section 2.4 discusses how to estimate its expected value.
Given the assumptions, rank-1 factorization is the moststraightforward way to formulate the relationship between#zik, λi and µk. More complicated modeling may help, e.g.assuming a nonlinear relationship or enforcing #Z to berank-m rather than rank-1 to find multiple factors for bothworkers and tasks that are related to the grouping behavior.However, we leave these extensions for future work.
2.3 The Clustering ModelTo obtain worker reliability and task clarity, a key step
is to estimate the expected group sizes. Although manyclustering methods, such as spectral clustering [13], Kmean-s and etc., can be applied to first infer the group assignmentof each worker in each task and then calculate the groupsizes, most of them have a difficult time in determining theunknown cluster number Mk. To bypass the hard model s-election problem and also to allow the model to adaptively
grow as more data are provided3, we resort to nonparamet-ric Bayesian techniques, which have shown great promise inmachine learning, statistics, and many application areas [3,6, 24]. More specifically, we propose to use the Dirichletprocess (DP) mixture model [3], which is a nonparametricBayesian model that can automatically resolve the unknownnumber of clusters Mk. Moreover, as we shall see, for ourDP mixture model, we can analytically compute the expect-ed group sizes without an intermediate inference step, whichcan be expensive and unstable.
Formally, let xik be the d-dimensional observed answersof worker i to task k. Typically, xik is a vector encoding theworker i’s answers to a sequence of questions in task k (e.g.,a worker gives answers to d questions of a survey). For atask k, answers of workers form Mk clusters. Let cik denotethe center of the cluster that worker i belongs to. For differ-ent workers i and j, cik = cjk if they are in the same group.For each task k = 1 . . .K, the DP mixture with a Gaussianlikelihood model can thus be written as:
Gk|{αk, Gk0} ∼ DP(αk, Gk0)
cik|Gk ∼ Gk
xik|{cik, σ2} ∼ N (xik|cik, σ2I), (3)
Although in principle, we could use a separate variance σ2ik
for each worker i and each task k, here we treat them asone single hyperparameter σ for simplicity and will providesensitivity analysis of our model with respect to σ2. Dueto the fact that the distributions Gk sampled from a DPare discrete almost surely [4], there is a non-zero probabil-ity that two workers belong to the same cluster. Thus, wewill have a partition of xik according to the sampled valuescik and automatically infer the cluster number Mk. Alter-natively, the mixture model can be equivalently representedusing Chinese restaurant process (CRP)4 prior, which is:
zik ∼ CRP(·|αk)
cmk ∼ Gk0
xik|{zik, c, σ2} ∼ N (·|czik,k, σ2I), (4)
where cmk is the cluster center for cluster m at task k. In
3For example, the number of clusters can grow for a DP mix-ture model when more data are provided. In other words,DP mixture can have an unbounded number of clusters.4A CRP is a marginalized version of a DP [6].

this work, we set the base distribution Gk0 as N (0, σ2k0I),
where σ2k0 are the task-specific variances that characterize
how much the means of clusters are scattered around the o-rigin. We will present a procedure to automatically estimatethem. On the other hand, the hyperparameter σ character-izes the variance within each cluster and need to be specified.A sensitivity analysis is shown in the experiment.
For the DP mixture, exact inference of the group assign-ment zik is intractable. Typical solutions resort to variation-al or sampling [12] methods. However, these approximate in-ference methods often lead to local optimum solutions andcan be expensive and sensitive to initialization. Thus, weneed to estimate the expected group sizes in a more efficientand robust way. Here we derive an analytic solution to theexpected group sizes for the clustering model, without in-termediate inference. Our approach can be expected to befaster and more stable compared to those using approximateinference, analogous to what people have popularly done incollapsed sampling [7] or collapsed variational inference [20]in probabilistic latent variable models.
2.4 Expected Group SizeFor each task k, we use Xk = {xik}Ni=1 to denote all its
worker responses. Let W kij be a binary random variable that
equals to 1 if workers i and j are in the same group of thoughtin task k (W k
ii = 1). From W kij , the group size #zik for
worker i can be computed as #zik =∑Nj=1W
kij . Thus, by
linearity of expectation, the expected group size conditionedon Xk is:
#zik ≡ E [#zik|Xk] = E
[N∑j=1
W kij
∣∣∣∣∣Xk
]
=
N∑j=1
E[W kij |Xk
]=
N∑j=1
P(W kij |Xk
), (5)
where the last equality holds because W kij is binary. Note
that the linearity of expectation still applies even if W kij are
not independent variables (e.g., for i 6= i′, W kij and W k
i′j maybe dependent because they share the same worker j).
To compute the posterior distribution of W kij , we make
the following approximation:
P(W kij |Xk
)≈ P
(W kij |Dk
ij
), (6)
where Dkij = ||xik−xjk||2 is the squared Euclidean distance5
between responses of workers i and j. The intuition is thattwo workers i and j being in the same group is largely dueto their affinity, but is almost independent of other work-ers’ responses. Our synthetic experiments verify that thisapproximation is very accurate (See Section 3 for details).In practice, this approximation is also reasonable in crowd-sourcing services like M-Turk, where the onsite communica-tion between workers is not allowed. After computing thelikelihood P
(Dkij |W k
ij
)and prior P
(W kij = 1
), with Bayes’
rule we obtain the posterior link probability:
P(W kij = 1|Dk
ij
)=
1
1 + exp(βkDk
ij + βk0) (7)
where βk ≡ σ2k0
4σ2(σ2k0
+σ2)and βk0 ≡ logαk + d
2log σ2
σ2k0
+σ2 .
5The same result follows when using Euclidean distance.
Please see Appendix for detailed derivation. In this work, wederive the prior from the exchangeability property of CRP.
Note that the posterior distribution in Eqn. (7) is notrestricted to the CRP-Gaussian cluster model proposed inEqn. (4). In general, we can apply other priors or explicitlydefine P
(W kij
). Besides Gaussian, each cluster’s noise model
can follow any other unimodal distribution and Eqn. (7) stillhold with Dk
ij with a different distance metric. The metriccould also be redefined and generalized to arbitrary type ofanswers (e.g. binary, categorical).
Interestingly, our link distribution model in Eqn. (7) fortwo workers being in the same group has the same logisticform as the latent distance model for social network analy-sis [8], where the link distribution model is directly defined.
2.5 Worker Reliability and Task ClarityOnce we have obtained the expected group size #zik for
each worker i and each task k, the worker reliability λ andtask clarity µ can be estimated as the first left and rightsingular vector corresponding to the largest singular valueof the expected group size matrix #Z ≡ {#zik} (Eqn. (1)).The entire algorithm is summarized in Alg. 1. Note we donot need to impose positive constraints for λ and µ, since thefirst left and right singular vector of a matrix with positiveentries is always positive by Perron-Frobenius theorem.
Algorithm 1 Estimation worker reliability and task clarityin the presence of schools of thought.
1: (Input) The worker responses {Xk}Kk=1 for K tasks.2: (Output) Worker reliability λ and task clarity µ.3: for k = 1:K do
4: Compute the posterior P(Wkij |Dk
ij
)that worker i and j
are in the same group (Eqn. (7)).5: Computer the expected group size #zik (Eqn. (5)).6: end for7: Run SVD on expected worker-task groupsize matrix #Z:
#Z = UΛV >
8: Set λ = U.1√
Λ11 and µ = V.1√
Λ11, where U.1 is the firstcolumn of U , alike for V.1.
2.6 HyperparametersBefore ending this section, we introduce a simple proce-
dure to estimate the hyperparameters αk and σk0, with theassumption that σ is given. As we shall see, our model isinsensitive to the only tunable hyperparameter σ. Thus,although the procedure does not estimate all hyperparame-ters, it is good enough for our use.
Specifically, after marginalizing cluster partition, we canobtain P
(Dkij
), a distribution of the observable pairwise
squared distances parameterized by the hyperparametersαk, σk0 and σ. Similarly we compute P
(||xik||2
). Given
σ, we can estimate αk and σk0 from the equations:
E[Dkij
]= 2d
(σ2 + σ2
k0αk
1 + αk
)(8)
E[||xik||2
]= d(σ2 + σ2
k0). (9)
The derivation is simple by noticing that E[Dkij
]=∑l=0,1
E[Dkij |W k
ij = l]P(W kij = l
). Similarly for P
(||xik||2
).
3. SYNTHETIC VALIDATIONBefore presenting the experiments on real data, we first
conduct synthetic experiments to show empirically that our
0 20 40 60 800
0.2
0.4
0.6
0.8
1EmpiricalTheory
0 10 20 30 40 500
10
20
30
40
50EmpiricalTheory
0 20 40 60 800
0.2
0.4
0.6
0.8
1EmpiricalTheory
0 10 20 30 40 500
10
20
30
40
50EmpiricalTheory
0 20 40 60 800
0.2
0.4
0.6
0.8
1EmpiricalTheory
0 10 20 30 40 500
10
20
30
40
50EmpiricalTheory
0 20 40 60 800
0.2
0.4
0.6
0.8
1EmpiricalTheory
0 10 20 30 40 500
10
20
30
40EmpiricalTheory
Group Size
Group Size
Squared Pairwise Distance
Squared Pairwise Distance Group Size
Group Size
Squared Pairwise Distance
Squared Pairwise Distance
Post
erio
r
Gro
up S
ize
Post
erio
r
Gro
up S
ize
Post
erio
r
Post
erio
r
Gro
up S
ize
Gro
up S
ize
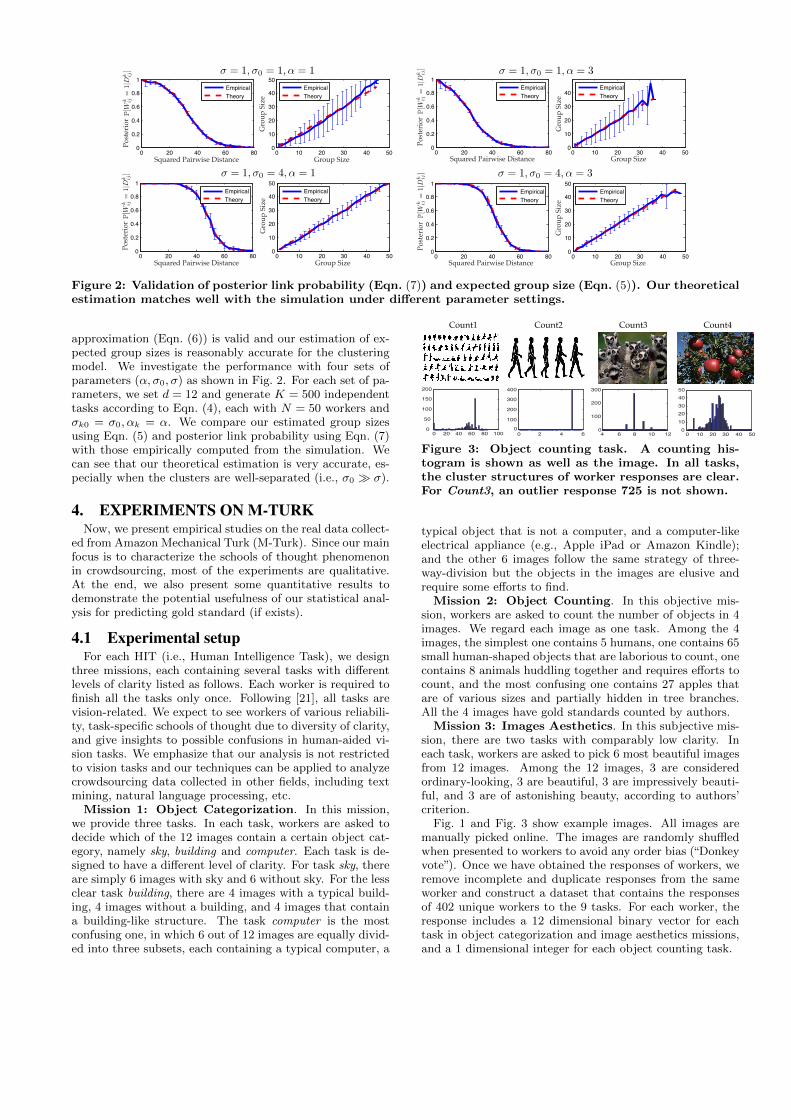
Figure 2: Validation of posterior link probability (Eqn. (7)) and expected group size (Eqn. (5)). Our theoreticalestimation matches well with the simulation under different parameter settings.
approximation (Eqn. (6)) is valid and our estimation of ex-pected group sizes is reasonably accurate for the clusteringmodel. We investigate the performance with four sets ofparameters (α, σ0, σ) as shown in Fig. 2. For each set of pa-rameters, we set d = 12 and generate K = 500 independenttasks according to Eqn. (4), each with N = 50 workers andσk0 = σ0, αk = α. We compare our estimated group sizesusing Eqn. (5) and posterior link probability using Eqn. (7)with those empirically computed from the simulation. Wecan see that our theoretical estimation is very accurate, es-pecially when the clusters are well-separated (i.e., σ0 � σ).
4. EXPERIMENTS ON M-TURKNow, we present empirical studies on the real data collect-
ed from Amazon Mechanical Turk (M-Turk). Since our mainfocus is to characterize the schools of thought phenomenonin crowdsourcing, most of the experiments are qualitative.At the end, we also present some quantitative results todemonstrate the potential usefulness of our statistical anal-ysis for predicting gold standard (if exists).
4.1 Experimental setupFor each HIT (i.e., Human Intelligence Task), we design
three missions, each containing several tasks with differentlevels of clarity listed as follows. Each worker is required tofinish all the tasks only once. Following [21], all tasks arevision-related. We expect to see workers of various reliabili-ty, task-specific schools of thought due to diversity of clarity,and give insights to possible confusions in human-aided vi-sion tasks. We emphasize that our analysis is not restrictedto vision tasks and our techniques can be applied to analyzecrowdsourcing data collected in other fields, including textmining, natural language processing, etc.
Mission 1: Object Categorization. In this mission,we provide three tasks. In each task, workers are asked todecide which of the 12 images contain a certain object cat-egory, namely sky, building and computer. Each task is de-signed to have a different level of clarity. For task sky, thereare simply 6 images with sky and 6 without sky. For the lessclear task building, there are 4 images with a typical build-ing, 4 images without a building, and 4 images that containa building-like structure. The task computer is the mostconfusing one, in which 6 out of 12 images are equally divid-ed into three subsets, each containing a typical computer, a
0 20 40 60 80 1000
50
100
150
200
0 2 4 60
100
200
300
400
4 6 8 10 120
100
200
300
0 10 20 30 40 500
1020304050
Count1 Count2 Count3 Count4
Figure 3: Object counting task. A counting his-togram is shown as well as the image. In all tasks,the cluster structures of worker responses are clear.For Count3, an outlier response 725 is not shown.
typical object that is not a computer, and a computer-likeelectrical appliance (e.g., Apple iPad or Amazon Kindle);and the other 6 images follow the same strategy of three-way-division but the objects in the images are elusive andrequire some efforts to find.
Mission 2: Object Counting. In this objective mis-sion, workers are asked to count the number of objects in 4images. We regard each image as one task. Among the 4images, the simplest one contains 5 humans, one contains 65small human-shaped objects that are laborious to count, onecontains 8 animals huddling together and requires efforts tocount, and the most confusing one contains 27 apples thatare of various sizes and partially hidden in tree branches.All the 4 images have gold standards counted by authors.
Mission 3: Images Aesthetics. In this subjective mis-sion, there are two tasks with comparably low clarity. Ineach task, workers are asked to pick 6 most beautiful imagesfrom 12 images. Among the 12 images, 3 are consideredordinary-looking, 3 are beautiful, 3 are impressively beauti-ful, and 3 are of astonishing beauty, according to authors’criterion.
Fig. 1 and Fig. 3 show example images. All images aremanually picked online. The images are randomly shuffledwhen presented to workers to avoid any order bias (“Donkeyvote”). Once we have obtained the responses of workers, weremove incomplete and duplicate responses from the sameworker and construct a dataset that contains the responsesof 402 unique workers to the 9 tasks. For each worker, theresponse includes a 12 dimensional binary vector for eachtask in object categorization and image aesthetics missions,and a 1 dimensional integer for each object counting task.

Count4Beauty2Beauty1Count1ComputerCount3BuildingSkyCount2Task:Task Clarity : 69.4 52.3 52.0 34.8 28.1 13.9 12.4 11.8 10.2
Small Group Size
Large Group Size
Clear/Easy task Confusing/Difficult task Worker reliability
1.52
6.62
2 4 6
Figure 4: Expected worker-task groupsize matrix with rows sorted by worker reliability λ and columns sortedby task clarity µ. The matrix shows a strong factorizable structure. Workers: Reliable workers (the bottompart of the matrix) show their consistency across different tasks. Coinciding with our assumption, they alwaysstay with large groups. In addition, from the distribution of reliability, a small portion of the workers canbe identified as low quality (the top part of the matrix). Tasks: Tasks in object categorization mission aregenerally clear while tasks in image aesthetics mission are in general ambiguous. Tasks in counting missionsshow mixed clarity. Count2 (Counting five humans) is the clearest task, while Count4 (Counting apples) isthe most confusing one. (This figure is best viewed in color.)
Unless explicitly mentioned, in all tasks we set the hyper-parameter σ = 0.2 and estimate α and σ0 from empiricalexpectation (Eqn. (8) and Eqn. (9)). We will also provide asensitivity analysis on the hyperparameter σ.
4.2 Characterization of Schools of ThoughtWe apply our low-rank model to all the 9 tasks. The
rank-1 residual error ||#Z − λµT ||F /||#Z||F is 0.27, which
means 73% of the energy in #Z has been explained awayby λ and µ. This shows that our model can fit the datawell. Although we do not jointly model the interaction be-tween clustering and factorization, the cluster size matrix#Z naturally follow the rank-1 factorization, which verifiesour low-rank assumption. It may be theoretically intriguingto formulate a joint model and design an iterative procedurefor model fitting. However, this may result in an improperbias on the data.
Below, we first examine the existence of schools of thoughtand its two major latent factors – worker reliability and taskclarity, and then provide detailed analysis on worker relia-bility.
Visualization of schools of thought. We show thepatterns of schools of thought for the tasks in object catego-rization and image aesthetics missions as the posterior linkprobability matrix (Fig. 1) computed from Eqn. (7). Forbetter visualization, we set α = 750, σ = 0.6 and σ0 = 1.Rather than posterior link probability matrix, histogramsare shown separately for each of the 4 counting tasks (Fig. 3).Different visualization is used because each counting task isdone separately, while for the other missions, workers’ re-sponses are based on 12 images at a time.
Task-specific schools of thought. From Fig. 1 andFig. 3 we can clearly see the task-dependent schools of thought.Even for the simplest task (e.g., sky) and tasks with groundtruth (e.g., object counting), there are still substantially di-verse answers. For task sky, a large group of people thinkthe outer space looking from the Moon is not sky, or a glow-ing bluish icy ceiling in a cave is sky. For counting, someworkers think the image with 65 human-like drawings doesnot contain humans and give zero answer. For more compli-cated and confusing tasks, the number of clusters goes up,and each cluster size goes down. In subjective tasks, almosteveryone has their own responses and the cluster structureis almost invisible.
Distribution of worker reliability. Fig. 4 shows thestructure of the expected worker-task groupsize matrix #Zas well as the estimated worker reliability λ and task clarityµ. From the worker reliability plot, most of the workers arecomparably reliable and they tend to stay consistently inlarger groups in different tasks. A small portion of workersdid a very poor job, consistent with the observation in [19].Among the three types of missions, object categorization isrelatively clear, image aesthetics is in general very subjectiveand vague. Counting mission shows mixed results. Nearlyall workers are correct in task Count2, making it the clearestone. One the other hand, counting apples of varied size withbackground clutters (task Count4 ) is extremely confusing.
4.3 Closer Examination of Worker ReliabilityIn this subsection, we present a closer examination of the
estimated worker reliability and compare it with baselines.Besides, we also show how to use it for improving predictionof gold standard for objective tasks.

Count1 Count1 (nonzero) Count2 Count3 Count4
D = 10
D = 30
D = 50
0 0.1 0.20
500
0 0.1 0.20
300
0 0.1 0.20
1
2
0 0.1 0.20
5
0 0.10
50
100
0 0.1 0.20
500
0 0.1 0.20
300
0 0.1 0.20
1
2
0 0.1 0.20
5
0 0.10
50
100
0 0.1 0.20
500
0 0.1 0.20
300
0 0.1 0.20
1
2
0 0.1 0.20
5
0 0.10
50
100
0.2
0.2
0.2
Figure 5: The variance σ2T of the responses of D most reliable workers (blue solid lines) versus the variance
σ2UT of D most unreliable workers (red dashed lines) averaged on the 4 counting tasks. Ideally σ2
T � σ2UT (i.e.,
blue solid lines are below red dashed lines). In all plots, x-axis shows hyperparameter σ ranging from 0.01 to0.2.
Ranking workers. To verify the computed worker re-liability λ, we first estimate λ on the 5 tasks (sky, build-ing, computer, beauty1, beauty2 ), then check if the estima-tion makes sense in the remaining four objective tasks. Forchecking, we rank the workers according to λ, compute theanswer variance σ2
T for reliable workers, and the answer vari-ance σ2
UT for unreliable workers, and then compare the twovariances. If σ2
UT � σ2T , which means workers labeled as
“unreliable” give inconsistent answers compared to those la-beled as “reliable”, then the ranking is meaningful and canbe generalized to other unseen tasks. Specifically, σ2
T is com-puted from D most reliable workers, and is averaged over 4remaining counting tasks. Similarly for σ2
UT . The result isshown in Fig. 5. We vary D from 10 to 50, and vary σ from0.01 to 0.2 for sensitivity analysis. A subset of workers givezero responses to task Count1, (presumably thinking thosedrawings are not humans). In the second column, we alsoshow the results after excluding zeros from ranking.
It is clear that in most of the cases, the reliable workersestimated on one set of tasks give answers that are muchmore consistent (i.e., with a lower variance) than the unre-liable ones in a different set of tasks. This suggests that theworker reliability is generalizable from one task to anoth-er task, which is consistent with what we have observed inFig. 4. From the results, we can also see that our approachis relatively insensitive to the change of hyperparameter σand parameter D.
Comparison with baseline clustering models. As wehave stated in Section 2.3, we can use alternative methods toperform the clustering on worker responses. Now, we com-pare the performance of our method (σ = 0.2) with spectralclustering [13], PCA-Kmeans and Gibbs sampling on the DPmixture model in Eqn. (3). Note that all these baselinesrequire inference on the cluster assignment of each work-er in order to compute the group sizes, while our methoddoes not. For spectral clustering, we take the L = 5 to70 smallest eigenvectors of normalized graph Laplacian andnormalize them to be unit vectors as the low-dimensionalembedding, on which Kmeans are performed with L cluster-s. For PCA-Kmeans, we first reduce the dimension of theworkers’ response to 5 using PCA, and run Kmeans withL = 5 to 70 clusters. For Gibbs sampling, we use the Al-gorithm 8 in [12] with the same set of hyperparameters asestimated in Eqn. (9) with σ = 0.2.
Table 1: Time cost comparison between the meth-ods using various baseline clustering algorithms andours.
Methods Time (sec)Ours 1.41± 0.05
Spectral Clustering 3.90± 0.36PCA-Kmeans 0.19± 0.06
Gibbs Sampling 53.63± 0.19
Fig. 6 shows the performances of different methods. Allthe baselines are repeated for 500 times with random ini-tialization. We present their best average performances andits associated standard deviations, achieved by tuning thehyperparameter (i.e., the number of clusters). We can seethat our approach is comparable with baselines but is muchmore stable because it does not require initialization. Tbl. 1shows the average time cost over 50 runs. Ours is fasterthan spectral clustering and Gibbs sampling. PCA-Kmeansis the fastest since it does not compute pairwise distance,but its performance is worse than ours.
Table 2: Performance comparison on predicting thegold standard counts for the four counting tasks.
Cnt1 Cnt2 Cnt3 Cnt4
Ours. D = 5 65 5 8 26Ours. D = 10 65 5 8 26Ours. D = 20 65 5 8 25.6
MV 53.7 5.0 9.9 22.9MV(median) 60 5 8 24
LFC [15] 56 5 8 24MDW [21] (c = 1)
63.7 5 8 25.96(top-10 pred., 50 init.)
MDW [21] (c = 3)65.01 5 8 25.48
(top-10 pred., 50 init.)
Gold Standard 65 5 8 27
Prediction of gold standard. As a specific case ofschools of thought, our approach can also be applied forthose tasks having one unanimous answer (e.g., the count-ing tasks) and predict the gold standard. Here, we provideone example that uses selective “majority voting”, namely,we first select D most reliable workers based on the estimat-ed worker reliability λ, and then apply majority voting for

−200
−1000
100
200
−200
−100
0
100
200
−1.5−1
−0.50
0.51
1.5
−5
0
5
−100
−50
0
50
100
−200
−1000
100
200
−200
−100
0
100
200
−1.5−1
−0.50
0.51
1.5
−5
0
5
−100
−50
0
50
100
(a) (b) (c) (d) (a) (b) (c) (d) (a) (b) (c) (d) (a) (b) (c) (d) (a) (b) (c) (d)
(a) (b) (c) (d)(a) (b) (c) (d)(a) (b) (c) (d)(a) (b) (c) (d)(a) (b) (c) (d)
Count1 Count1 (Nonzero) Count2 Count3 Count4
D = 10
D = 50
Figure 6: Comparison between (a) our method (with σ = 0.2), (b) spectral clustering, (c) PCA+Kmeans, and(d) Gibbs sampling, on the difference σ2
UT − σ2T , where σ2
UT is the variance of the answers of D most unreliableworkers and σ2
T is the variance of D most reliable workers averaged on 4 counting tasks. Ideally σ2UT � σ2
T ,and thus the bar should be a large positive number. The first row shows D = 10, and the second shows D = 50.
prediction. An alternative method would be weighing theresponses of workers with their reliability. Yet we obtainthe same performance.
Tbl. 2 shows the comparison of our method to three verycompetitive baseline methods on predicting the count num-bers for 4 counting tasks. The baselines include the classicinclusive “majority voting” (MV) heuristic, which performsover all the 402 workers, the “learning from crowds” (LFC)method [15], which iteratively estimates workers’ precisionsand tasks’ gold standard using an EM procedure, and the“multidimensional wisdom of crowds” (MDW) method [21]as we have discussed in the introduction. For LFC, we followEqn.(10)-(11) in [15] and use MV as the initial guess of goldstandard as suggested in the paper. For MDW, since it doesnot handle the case that the gold standard is in the contin-uous domain, we first find maximum a posteriori estimationof the workers’ precisions, treat them as workers’ reliability,and estimate the gold standard by averaging the answers oftop-10 reliable workers. In MDW, each task k is a hiddenc-dimensional vector vk and each worker is represented as aset of weights in the same dimension. Both need to be es-timated from the data. In the experiment, we choose c = 1and c = 3.
We can see that our selective MV outperforms all the threebaselines, especially on Count1 and Count4, and our pre-diction matches the gold standard very well. MDW hascomparable performance yet it is quite sensitive to the ini-tialization. When d = 1, MDW gives the same predictionas ours (i.e. (65, 5, 8, 26)) in most random initializations,however, it also gives (0, 5, 8, 24.05) if not initialized prop-erly. The reason is that, although most workers vote for 65(called “65-voters”), there is a small group voting for 0s (“0-voters”) on Count1. If MDW falls into this small cluster andregards 0-voters as more reliable than 65-voters, the gold s-tandard estimation of Count4 will also change. In contrast,ours always rate 65-voters over 0-voters since 65-voters forma larger cluster than 0-voters. Thus, ours gives a deter-ministic answer to worker reliability. Besides, on the fourcounting tasks, using the stopping criterion√∑
k
||vt+1k − vtk||2/
√∑k
||vtk||2 ≤ 10−4
(where vk is the hidden representation of task k in itera-tion t), MDW spends 3.25 ± 3.34 seconds for c = 1, and
4.26± 3.70 seconds for c = 3, averaged over 50 random ini-tializations. The large variation in the rate of convergenceis due to different initialization. In comparison, our methodruns for 0.68 seconds, is insensitive to the parameter D andthe value of the hyperparameter σ, and has no initialization.
5. CONCLUSIONS AND FUTURE WORKThis paper formally analyzes the schools of thought phe-
nomenon and its two key underlying factors, worker reliabil-ity and task clarity, in crowdsourcing by presenting a com-putational model based on a low-rank assumption, whichcharacterizes the relationships between the group sizes ofworker responses and the two key factors. Furthermore, theexpected group sizes can be estimated analytically insteadof performing an expensive and unstable inference step. Wereport real experiments on Amazon Mechanical Turk.
In terms of time cost, the major bottleneck of our work isto compute the groupsize matrix #Z, which has time com-plexity of O(KN2) (K is the number of tasks and N is thenumber of workers). However, if N is large, given worker i,we can sample a few other workers to obtain an unbiasedestimate of #zik, yielding approximately O(KN) complexi-ty. Another interesting future direction is to handle the caseof missing data that some workers may not give answer tosome tasks. In such a case, how to estimate the group sizefor observed answers and how to factorize the group sizematrix #Z in the presence of missing entries deserve moreexploration.
From a learning point of view, our analysis could pro-vide insights for developing better predictive tools in severalways. For example, we have shown that high quality labelscan be selected from the answers of workers who enjoy topranking in worker reliability for building better predictivemodels. For future work, we can acquire new labels fromthose workers that have higher reliability in the context ofactive learning [14]. Finally, our analysis could help themarket price “high-reputation” workers [2].
Acknowledgements Yuandong Tian is supported by Mi-crosoft Research PhD Fellowship (2011-2013) and an ONRgrant N00014-11-1-0295.
6. REFERENCES[1] J. Abernethy and R.M. Frongillo. A collaborative
mechanism for crowdsourcing prediction problems. InNIPS, 2011.

[2] E. Adar. Why I hate Mechanical Turk research (andworkshops). In CHI, 2011.
[3] C.E. Antoniak. Mixtures of Dirichlet processes withapplications to Bayesian nonparametric problems.Annals of statistics, 2(6):1152–1174, 1974.
[4] D. Blackwell and J.B. MacQueen. Fergusondistributions via Polya urn schemes. Annals ofstatistics, 1(2):353–355, 1973.
[5] AP Dawid and AM Skene. Maximum likelihoodestimation of observer error-rates using the EMalgorithm. Journal of the Royal Statistical Society.Series C (Applied Statistics), 28(1):20–28, 1979.
[6] S.J. Gershman and D. Blei. A tutorial on bayesiannonparametric models. Journal of MathematicalPsychology (in press), 2011.
[7] T.L. Griffiths and M. Steyvers. Finding scientifictopics. National Academy of Sciences of the UnitedStates of America, 101(Suppl 1):5228, 2004.
[8] P.D. Hoff, A.E. Raftery, and M.S. Handcock. Latentspace approaches to social network analysis. Journalof the American Statistical Association,97(460):1090–1098, 2002.
[9] P.G. Ipeirotis, F. Provost, and J. Wang. Qualitymanagement on Amazon Mechanical Turk. In ACMSIGKDD workshop on human computation, 2010.
[10] D.R. Karger, S. Oh, and D. Shah. Iterative learningfor reliable crowdsourcing systems. In NIPS, 2011.
[11] A. Kittur, E. Chi, and B. Suh. Crowdsourcing userstudies with Mechanical Turk. In CHI, 2008.
[12] R.M. Neal. Markov chain sampling methods forDirichlet process mixture models. Journal ofcomputational and graphical statistics, 9(2):249–265,2000.
[13] A. Ng, M. Jordan, and Y. Weiss. On spectralclustering: Analysis and an algorithm. In NIPS, 2001.
[14] D. Pinar, J. Carbonell, and J. Schneider. Efficientlylearning the accuracy of labeling sources for selectivesampling. In SIGKDD, 2009.
[15] V.C. Raykar, S. Yu, L.H. Zhao, G.H. Valadez,C. Florin, L. Bogoni, and L. Moy. Learning fromcrowds. Journal of Machine Learning Research,99:1297–1322, 2010.
[16] J. Ross, L. Irani, M. Silberman, A. Zaldivar, andB. Tomlinson. Who are the crowdworkers? Shiftingdemographics in Mechanical Turk. In CHI, 2010.
[17] D.M. Russell, M.J. Stefik, P. Pirolli, and S.K. Card.The cost structure of sensemaking. In CHI, 1993.
[18] P. Smyth, U. Fayyad, M. Burl, P. Perona, andP. Baldi. Inferring ground truth from subjectivelabelling of venus images. In NIPS, 1995.
[19] R. Snow, B. O’Connor, D. Jurafsky, and A. Ng. Cheapand fast – but is it good? evaluating non-expertannotations for natural language tasks. In EMNLP,2008.
[20] Y.W. Teh, D. Newman, and M. Welling. A collapsedvariational Bayesian inference algorithm for latentDirichlet allocation. In NIPS, 2006.
[21] P. Welinder, S. Branson, S. Belongie, and P. Perona.The multidimensional wisdom of crowds. In NIPS,2010.
[22] J. Whitehill, P. Ruvolo, T. Wu, J. Bergsma, and
J. Movellan. Whose vote should count more: Optimalintegration of labels from labelers of unknownexpertise. In NIPS, 2009.
[23] Y. Yan, R. Rosales, G. Fung, M. Schmidt,G. Hermosillo, L. Bogoni, L. Moy, J.G. Dy, andPA Malvern. Modeling annotator expertise: Learningwhen everybody knows a bit of something. InAISTATS, 2010.
[24] J. Zhu, N. Chen, and E. Xing. Infinite Latent SVM forClassification and Multi-task Learning. In NIPS, 2011.
Appendix: Derivation of posterior distributionP(W kij = 1|Dk
ij
)By the Bayes’ rule, we have
P(W kij = 1|Dk
ij
)=
P(Dkij |W k
ij = 1)P(W kij = 1
)P(Dkij |W k
ij = 0)P(W kij = 0
)+ P
(Dkij |W k
ij = 1)P(W kij = 1
) ,where the likelihood term P
(Dkij |W k
ij
)and the prior term
P(W kij = 1
)are computed as follows.
The likelihood term P(Dkij |W k
ij
). For W k
ij = 1, bothxik and xjk are generated independently from the samecluster center with variance σ2, thus we have xik − xjk ∼N (·|0, 2σ2). Therefore, Dk
ij = ||xik − xjk||2 satisfies χ2 dis-tribution with the following pdf:
P(Dkij |W k
ij = 1)
= φ(Dkij ; d, σ
2)
=1
2d/2Γ(d/2)
1
(σ2)d/2(Dk
ij)d/2−1 exp
(−Dkij
4σ2
)where d is the dimension of the workers’ responses. Simi-larly, for W k
ij = 0, by integrating their cluster centers out, we
can show xik,xik are independently generated fromN (·|0, σ20+
σ2). Thus we have P(Dkij |W k
ij = 0)
= φ(Dkij ; d, σ
2 + σ20).
The prior term P(W kij = 1
). By the exchangeability
property of Chinese restaurant process, all workers are equal.Thus
P(W kij = 1
)= P (W12 = 1)
= P (z1 = 1)P (z2 = 1|z1 = 1)
=1
1 + α
Combining the two parts, we thus obtain the posteriordistribution P
(W kij = 1|Dk
ij
):
P(W kij = 1|Dk
ij
)=
1
1 + exp(βkDk
ij + βk0)
where βk ≡ σ2k0
4σ2(σ2k0
+σ2)and βk0 ≡ logαk + d
2log σ2
σ2k0
+σ2 .
Note the same derivation follows if we use Euclidean dis-tance lij,k = ||xij − xik|| and
P(W kij = 1|lij,k
)= P
(W kij = 1|Dk
ij
)=
1
1 + exp(βkl2ij,k + βk0
) ,where is exactly the same as the one using squared Euclideandistance.