lean process improvements in warehousing and distributionlean process improvements in warehousing...
TRANSCRIPT
Lean Process Improvements in Warehousing and Distribution
Leigh Henderson, Lean Six Sigma Leader
Scott Jagger, Operations Distribution Manager
IDEXX Laboratories
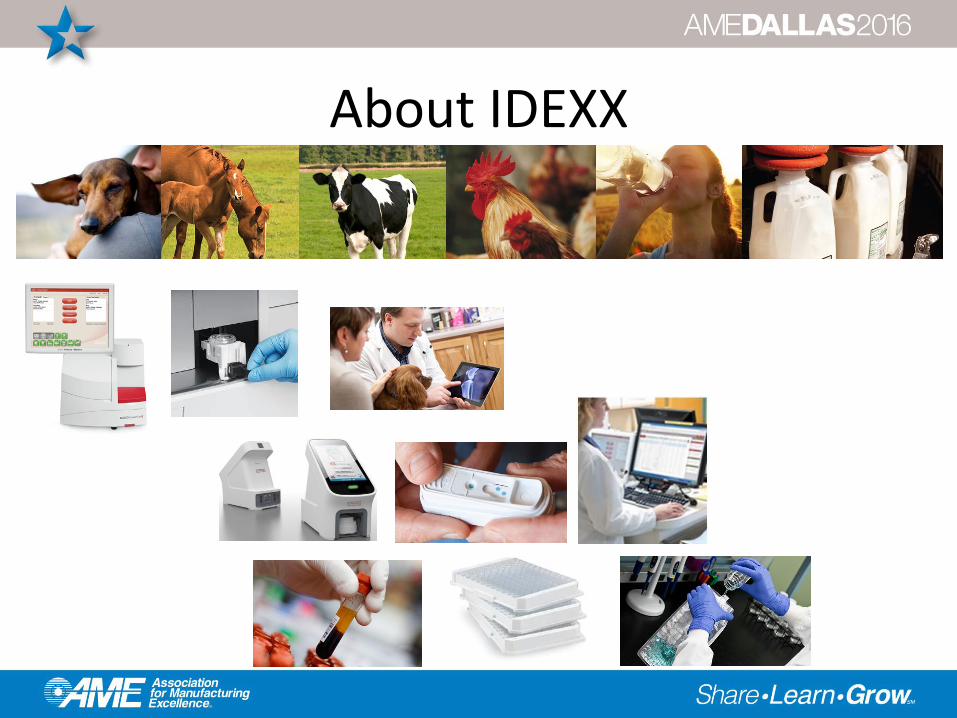
About IDEXX
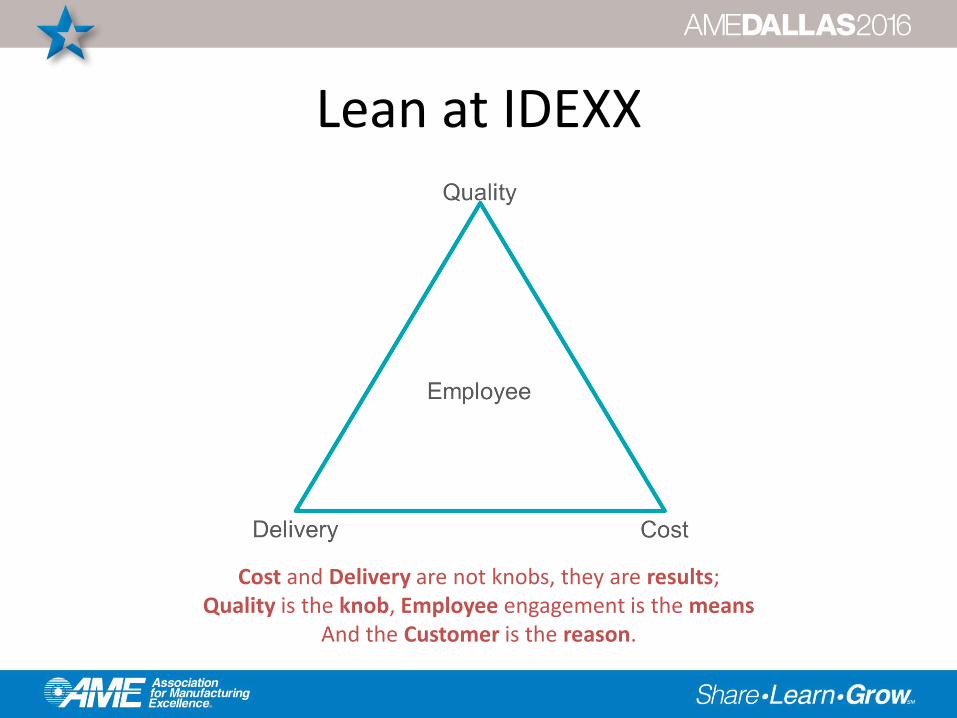
Lean at IDEXX
Cost and Delivery are not knobs, they are results; Quality is the knob, Employee engagement is the means
And the Customer is the reason.

Increase velocity and
capacity
Reduce Waste
Lean at IDEXX
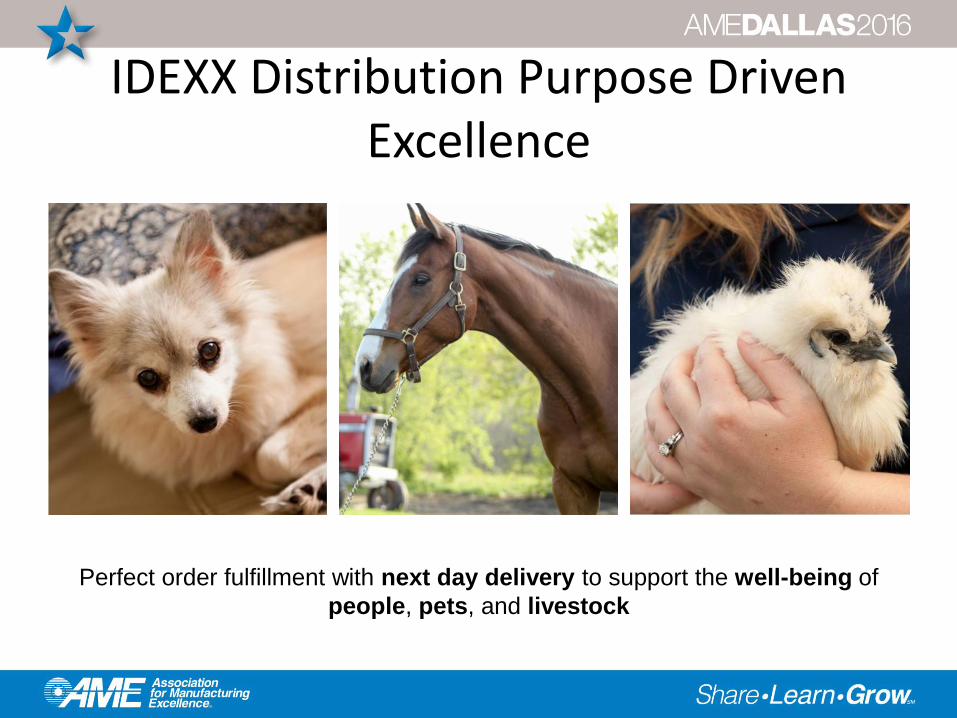
IDEXX Distribution Purpose Driven Excellence
Perfect order fulfillment with next day delivery to support the well-being of
people, pets, and livestock
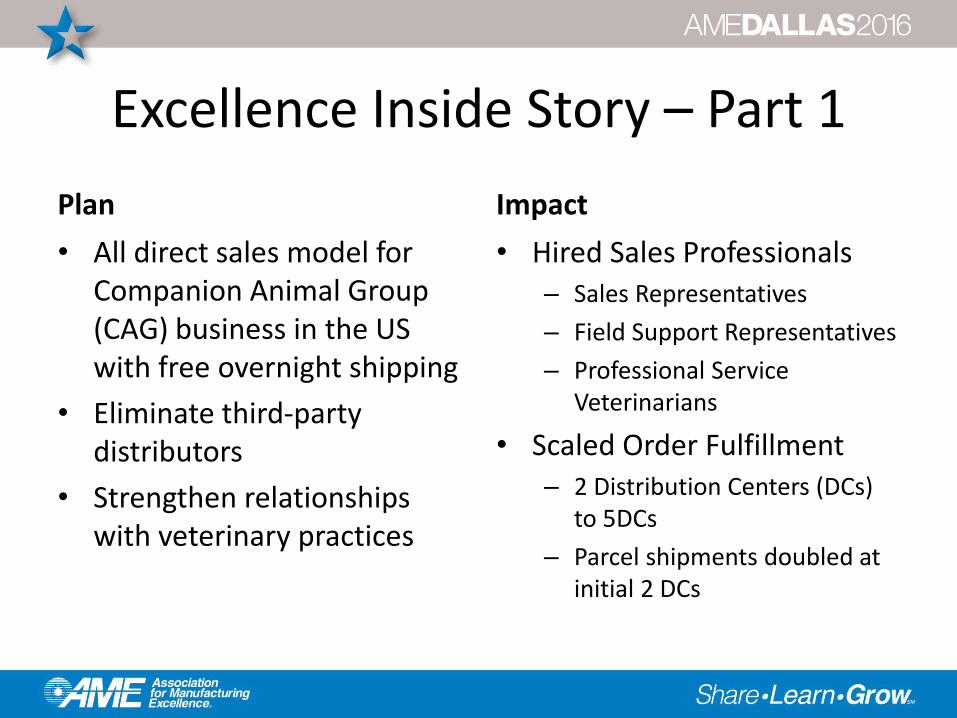
Excellence Inside Story – Part 1
Plan
• All direct sales model for Companion Animal Group (CAG) business in the US with free overnight shipping
• Eliminate third-party distributors
• Strengthen relationships with veterinary practices
Impact
• Hired Sales Professionals– Sales Representatives
– Field Support Representatives
– Professional Service Veterinarians
• Scaled Order Fulfillment– 2 Distribution Centers (DCs)
to 5DCs
– Parcel shipments doubled at initial 2 DCs
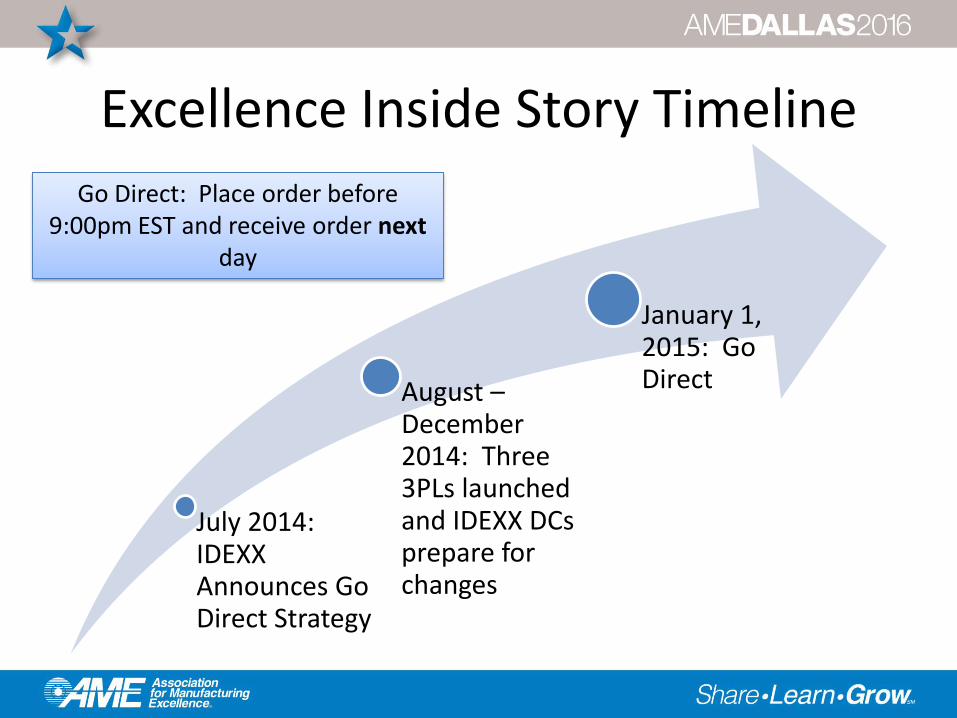
Excellence Inside Story Timeline
July 2014: IDEXX Announces Go Direct Strategy
August –December 2014: Three 3PLs launched and IDEXX DCs prepare for changes
January 1, 2015: Go Direct
Go Direct: Place order before 9:00pm EST and receive order next
day
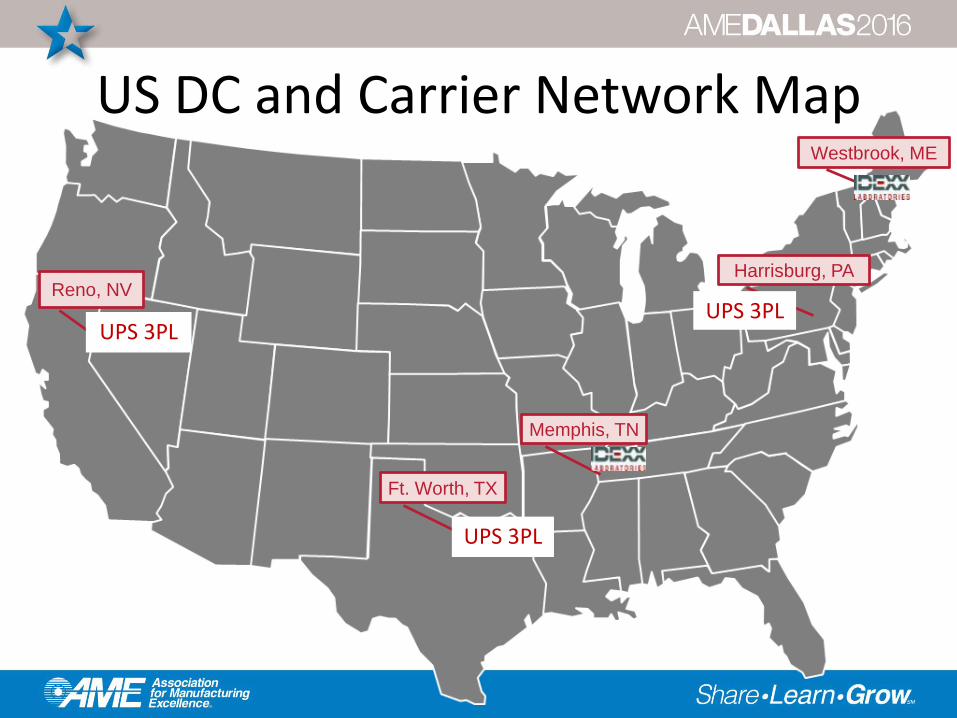
US DC and Carrier Network Map
Reno, NV
Ft. Worth, TX
Memphis, TN
Harrisburg, PA
Westbrook, ME
UPS 3PLUPS 3PL
UPS 3PL
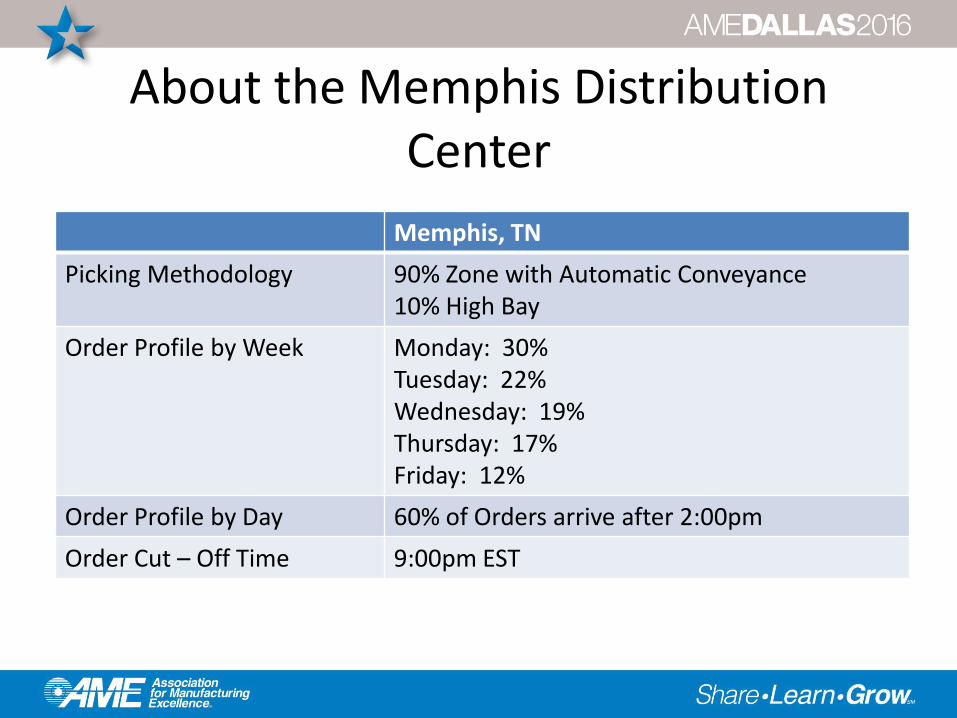
About the Memphis Distribution Center
Memphis, TN
Picking Methodology 90% Zone with Automatic Conveyance10% High Bay
Order Profile by Week Monday: 30%Tuesday: 22%Wednesday: 19%Thursday: 17%Friday: 12%
Order Profile by Day 60% of Orders arrive after 2:00pm
Order Cut – Off Time 9:00pm EST
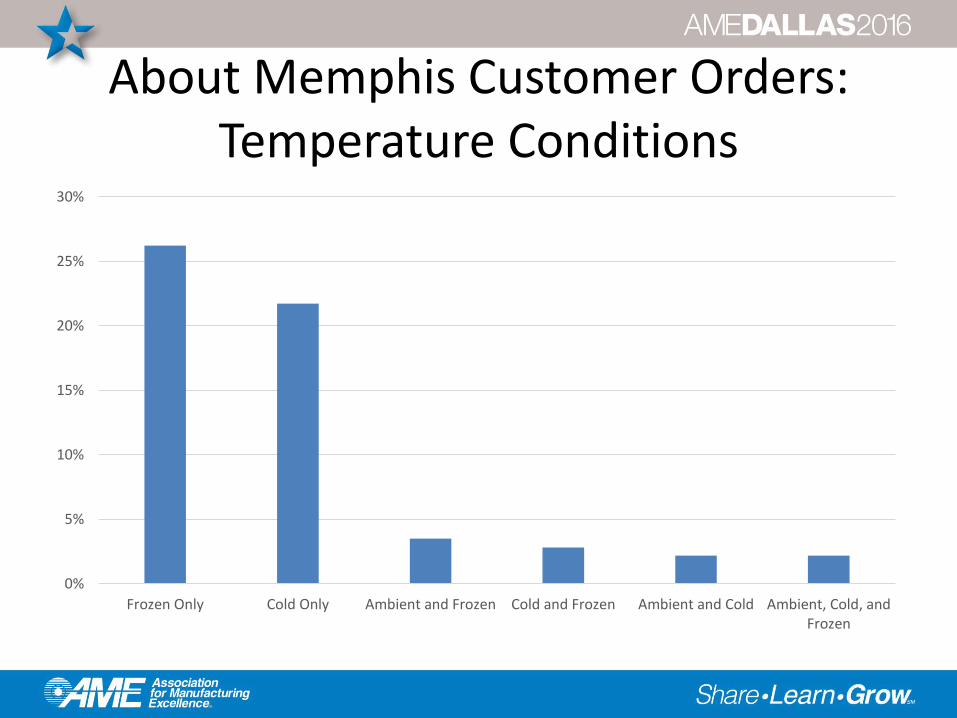
About Memphis Customer Orders:Temperature Conditions
0%
5%
10%
15%
20%
25%
30%
Frozen Only Cold Only Ambient and Frozen Cold and Frozen Ambient and Cold Ambient, Cold, andFrozen
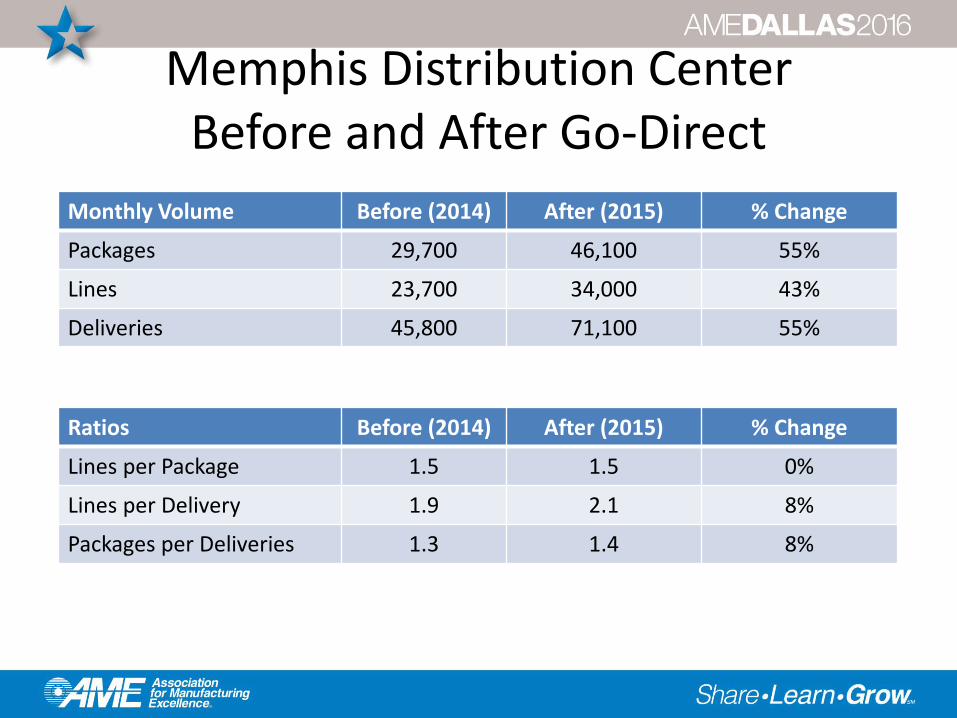
Memphis Distribution CenterBefore and After Go-Direct
Monthly Volume Before (2014) After (2015) % Change
Packages 29,700 46,100 55%
Lines 23,700 34,000 43%
Deliveries 45,800 71,100 55%
Ratios Before (2014) After (2015) % Change
Lines per Package 1.5 1.5 0%
Lines per Delivery 1.9 2.1 8%
Packages per Deliveries 1.3 1.4 8%
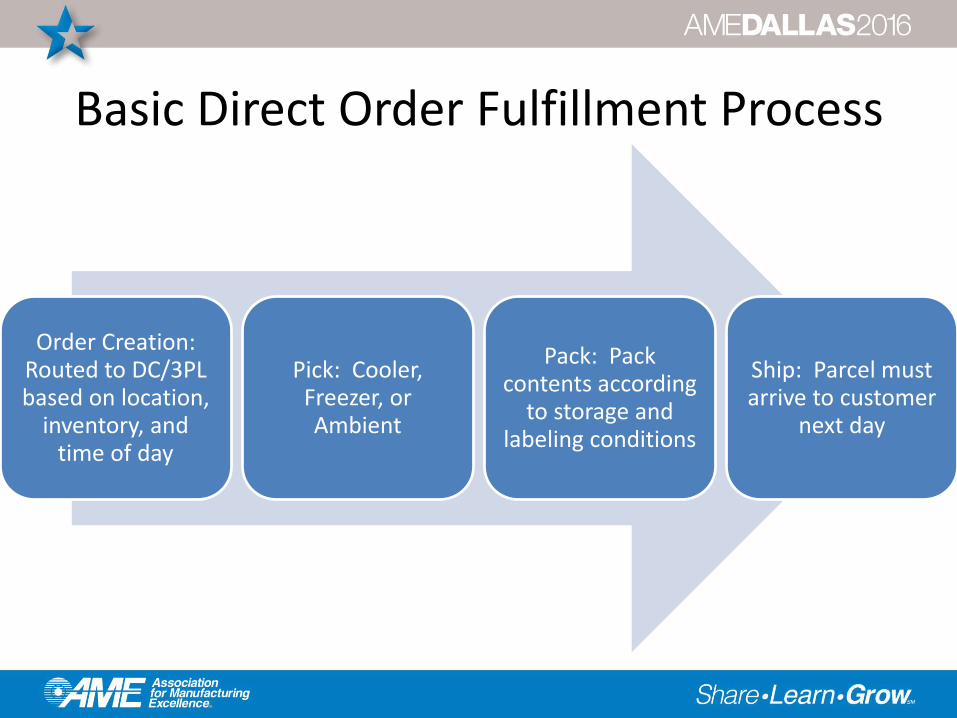
Basic Direct Order Fulfillment Process
Order Creation: Routed to DC/3PL based on location,
inventory, and time of day
Pick: Cooler, Freezer, or Ambient
Pack: Pack contents according
to storage and labeling conditions
Ship: Parcel must arrive to customer
next day
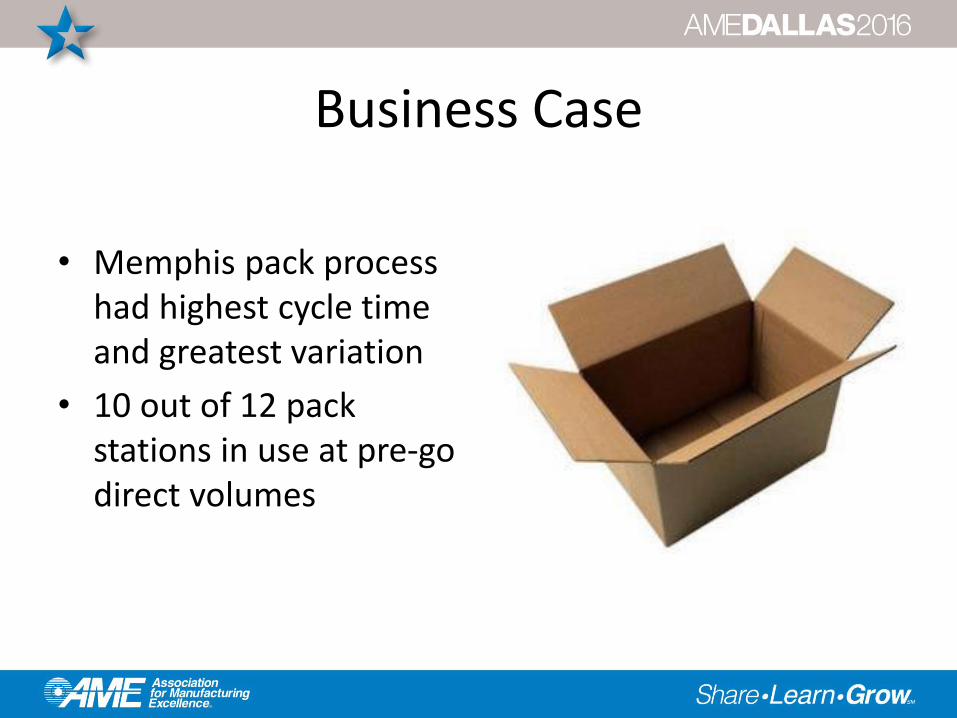
Business Case
• Memphis pack process had highest cycle time and greatest variation
• 10 out of 12 pack stations in use at pre-go direct volumes
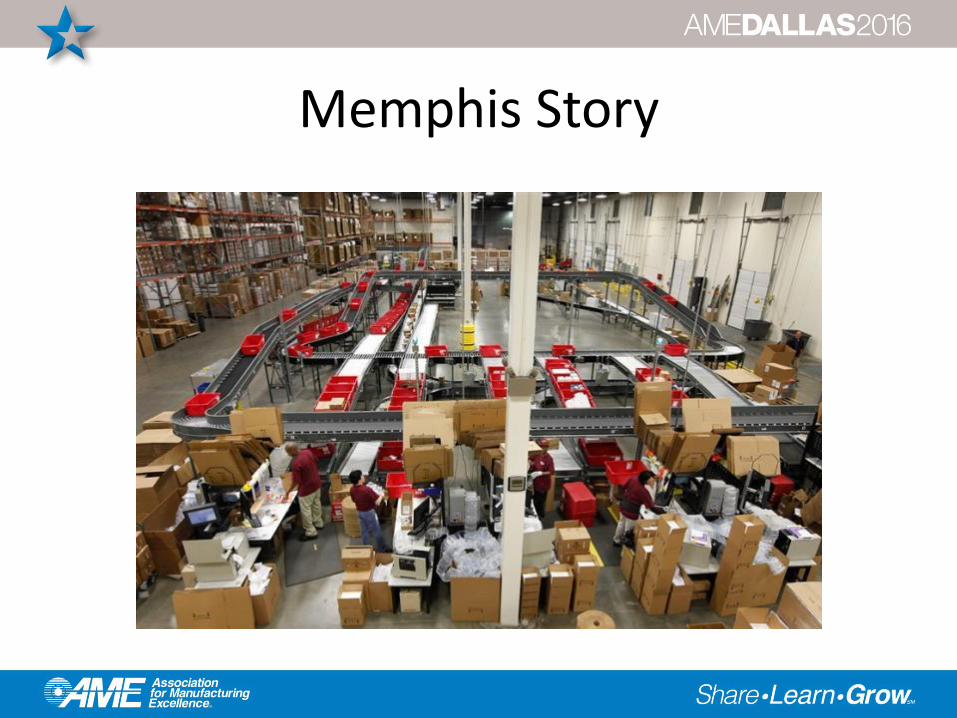
Memphis Story
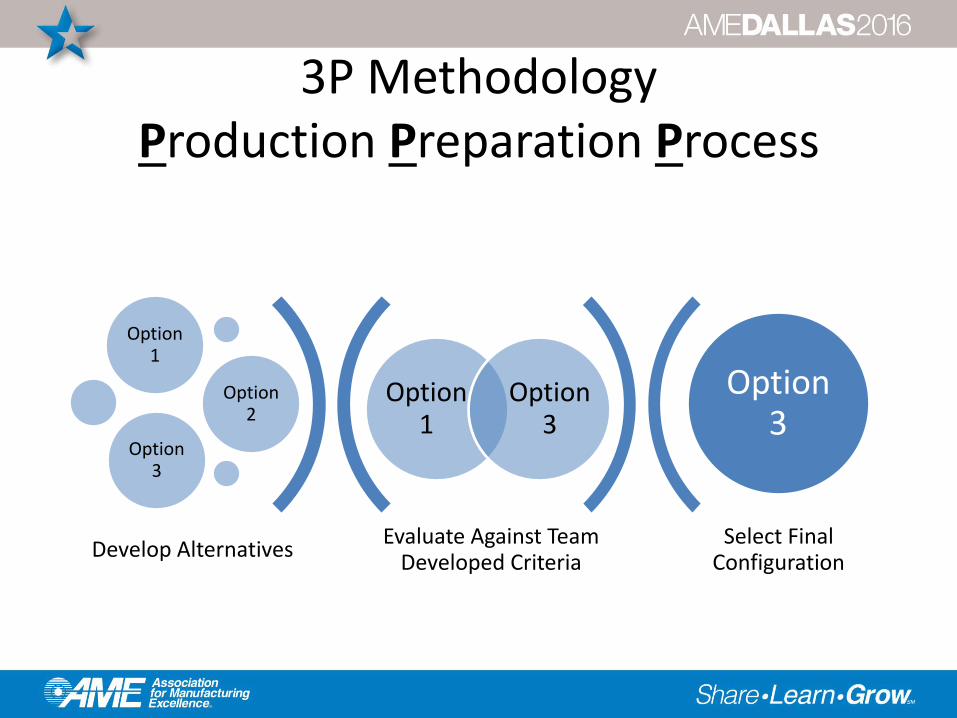
3P MethodologyProduction Preparation Process
Evaluate Against Team Developed Criteria
Select Final Configuration
Option 1
Option 3
Option 1
Option 2
Option 3
Option 3
Develop Alternatives
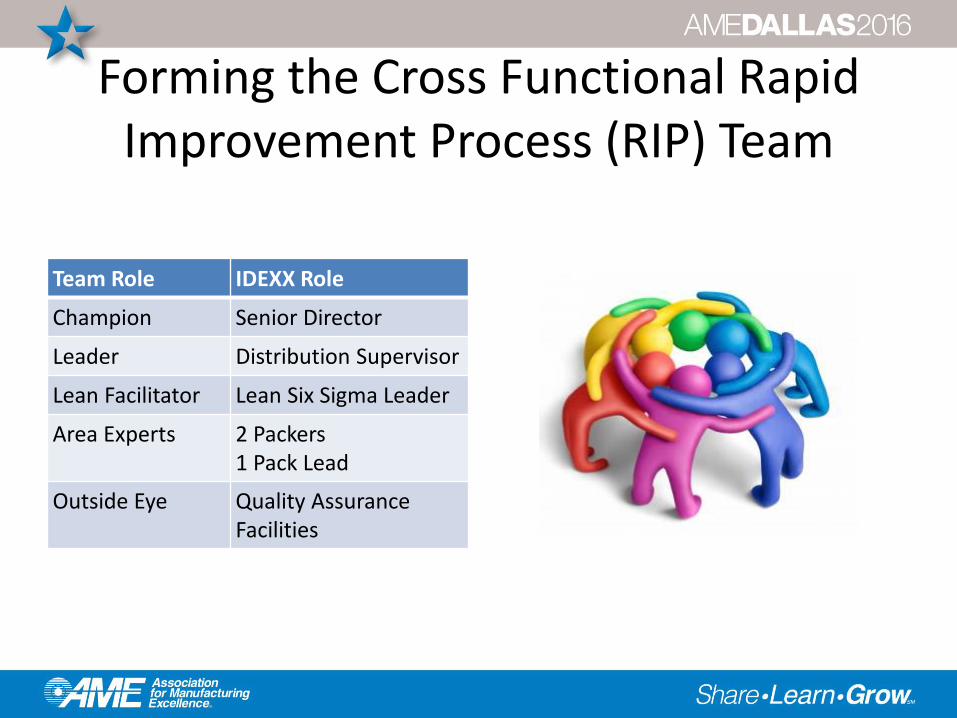
Forming the Cross Functional Rapid Improvement Process (RIP) Team
Team Role IDEXX Role
Champion Senior Director
Leader Distribution Supervisor
Lean Facilitator Lean Six Sigma Leader
Area Experts 2 Packers1 Pack Lead
Outside Eye Quality AssuranceFacilities
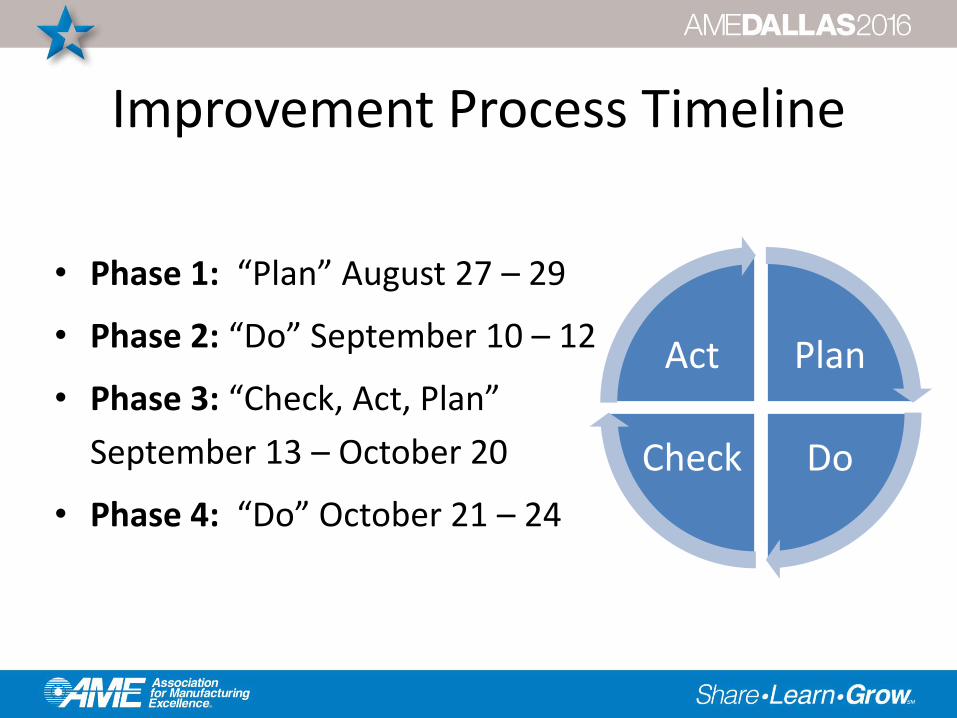
Improvement Process Timeline
• Phase 1: “Plan” August 27 – 29
• Phase 2: “Do” September 10 – 12
• Phase 3: “Check, Act, Plan”
September 13 – October 20
• Phase 4: “Do” October 21 – 24
Plan
DoCheck
Act
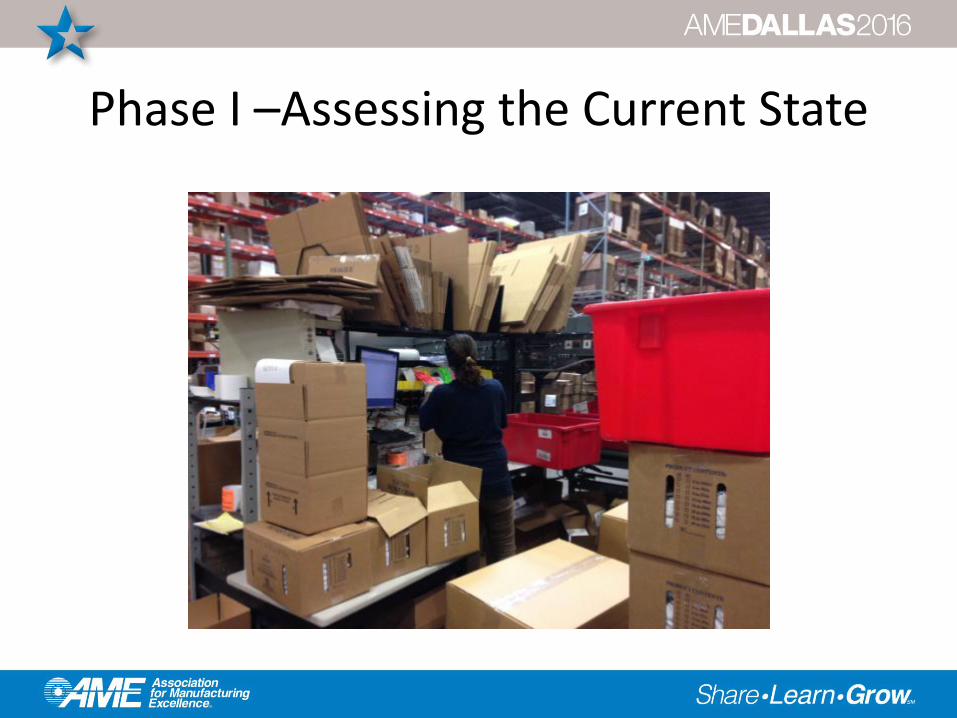
Phase I –Assessing the Current State
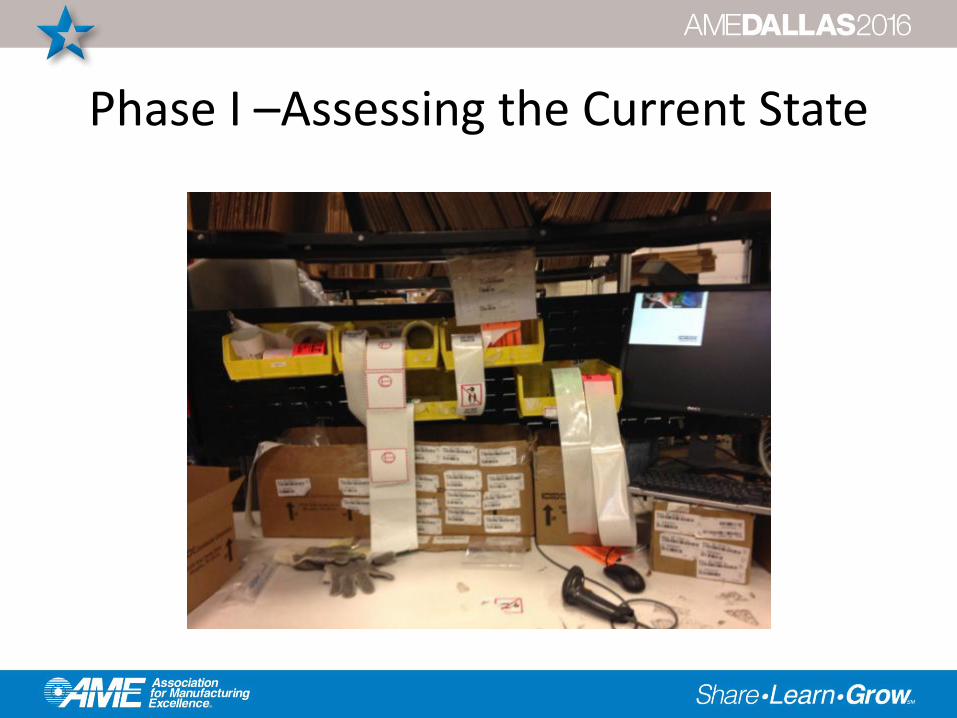
Phase I –Assessing the Current State
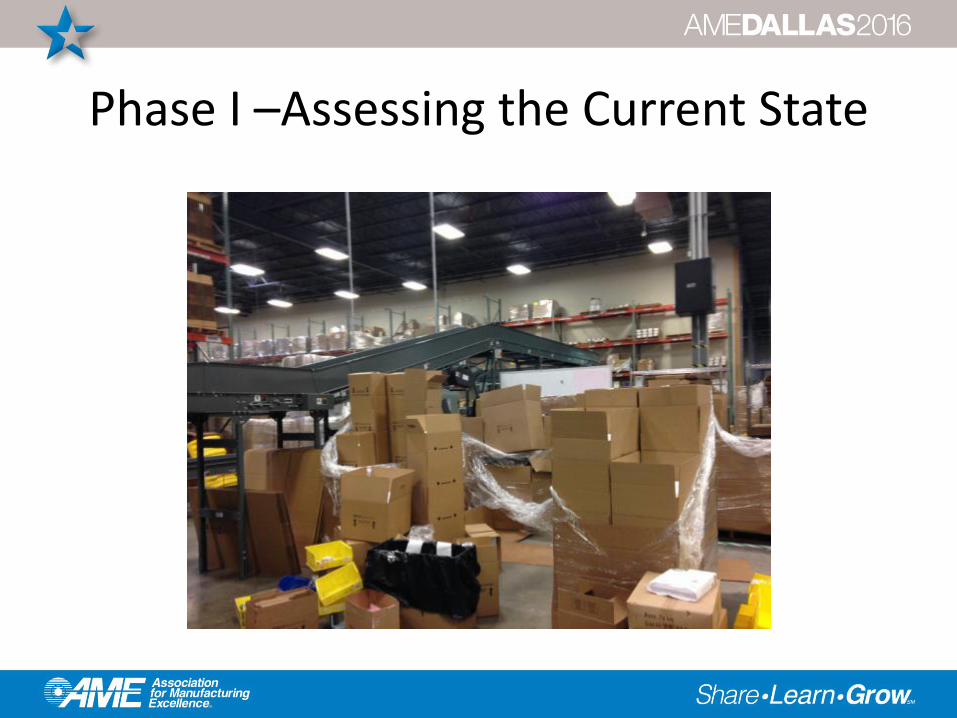
Phase I –Assessing the Current State
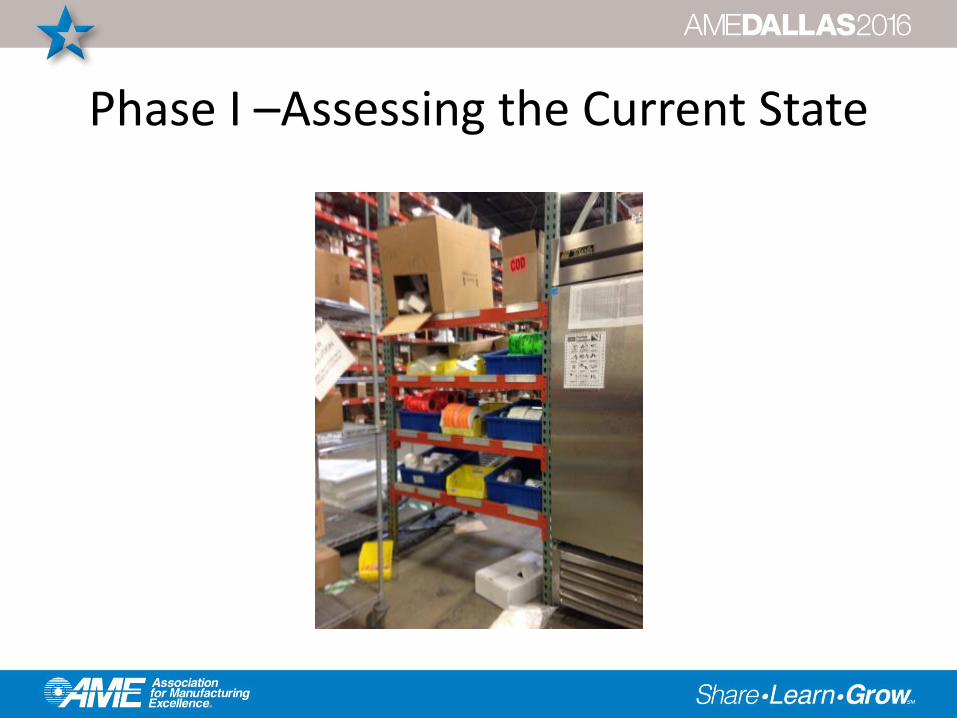
Phase I –Assessing the Current State
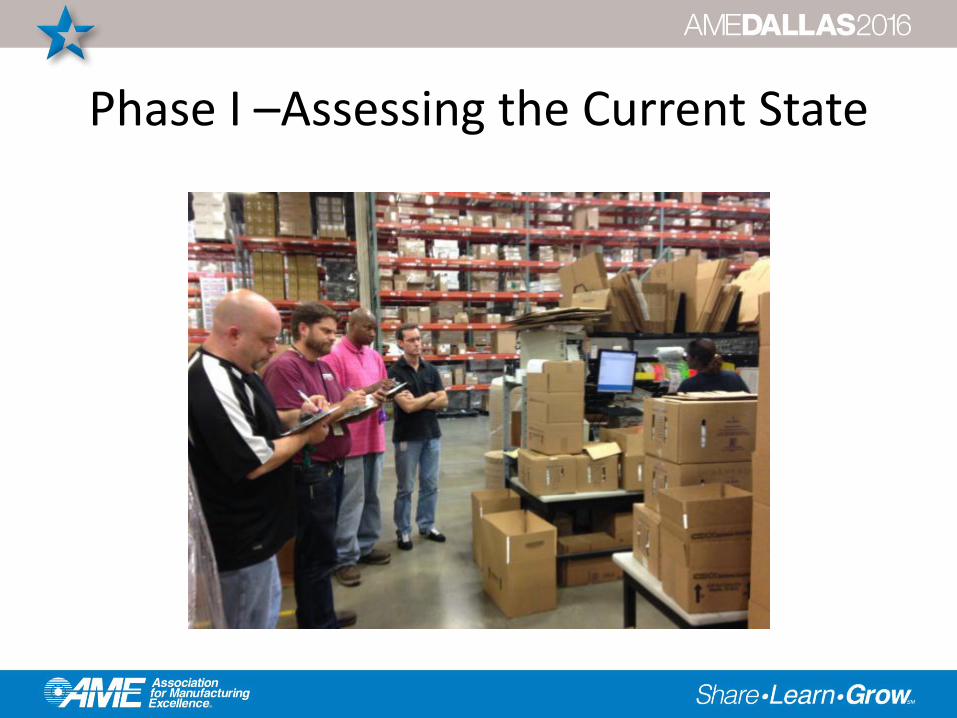
Phase I –Assessing the Current State
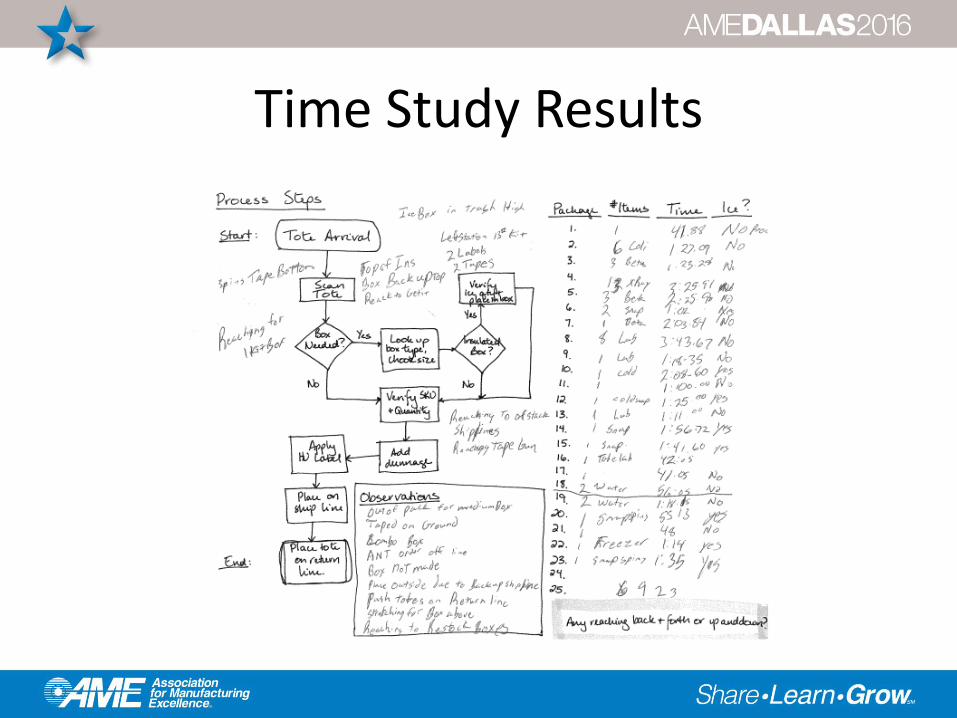
Time Study Results

Phase I – Future State Planning
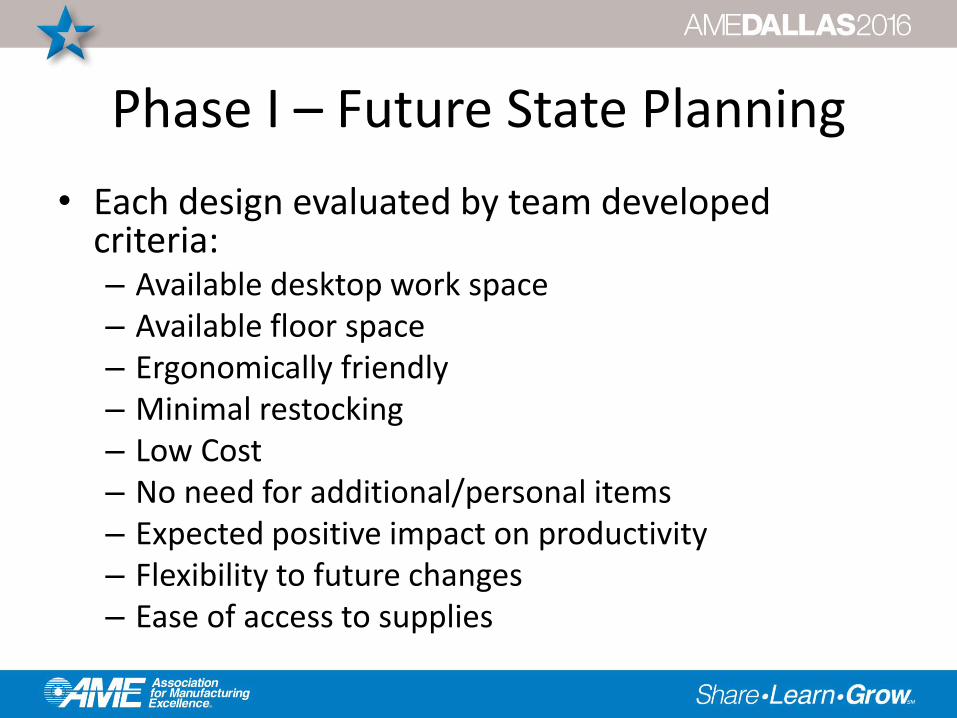
Phase I – Future State Planning
• Each design evaluated by team developed criteria:– Available desktop work space– Available floor space– Ergonomically friendly– Minimal restocking– Low Cost– No need for additional/personal items– Expected positive impact on productivity– Flexibility to future changes– Ease of access to supplies
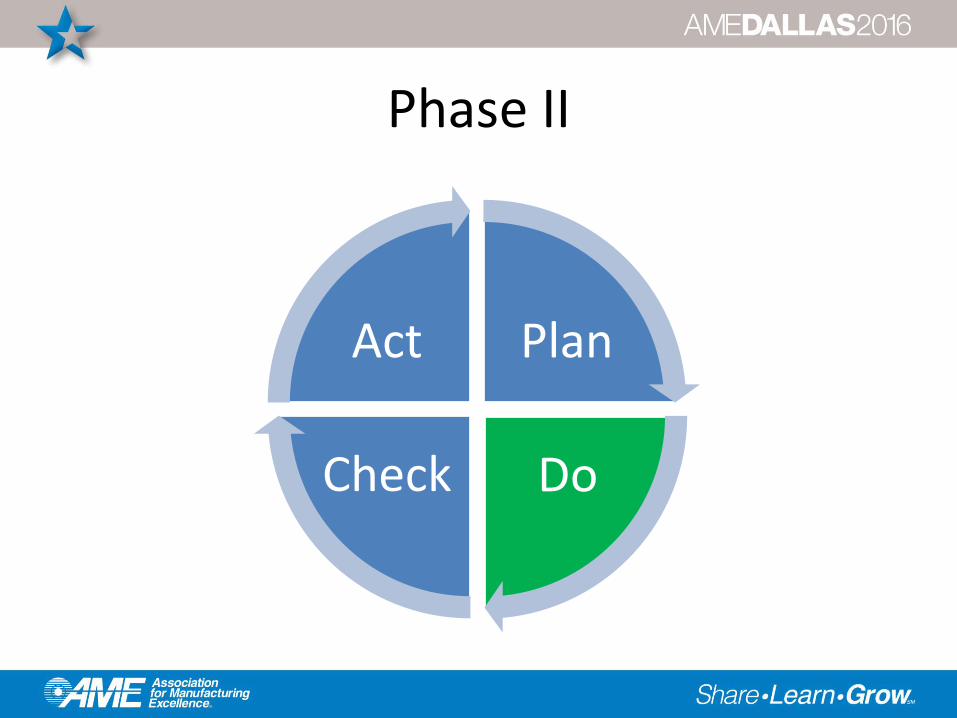
Phase II
Plan
DoCheck
Act
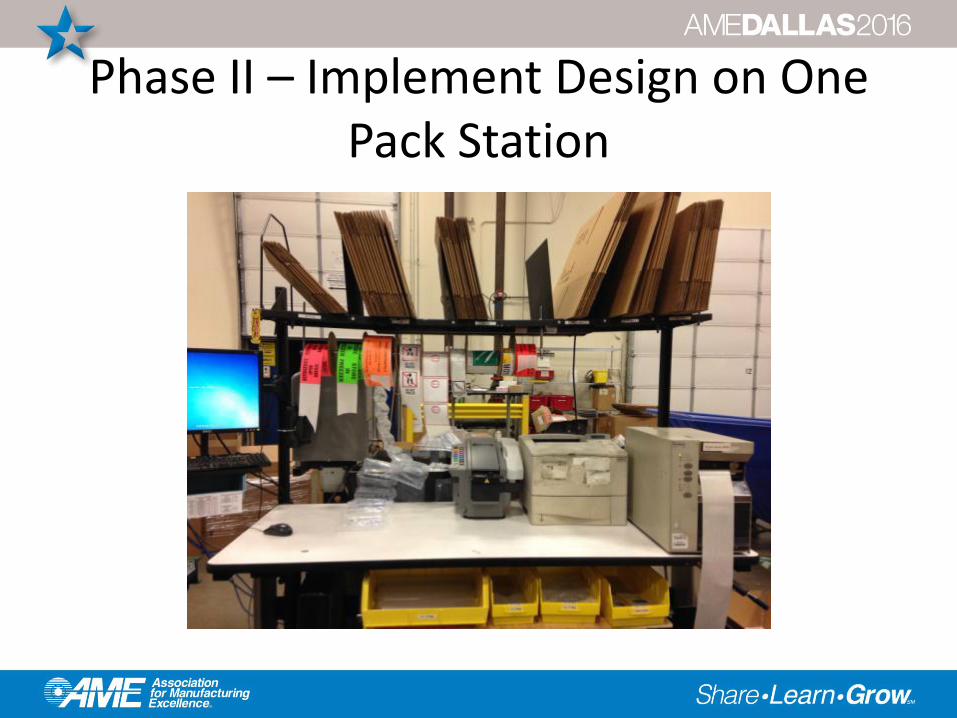
Phase II – Implement Design on One Pack Station
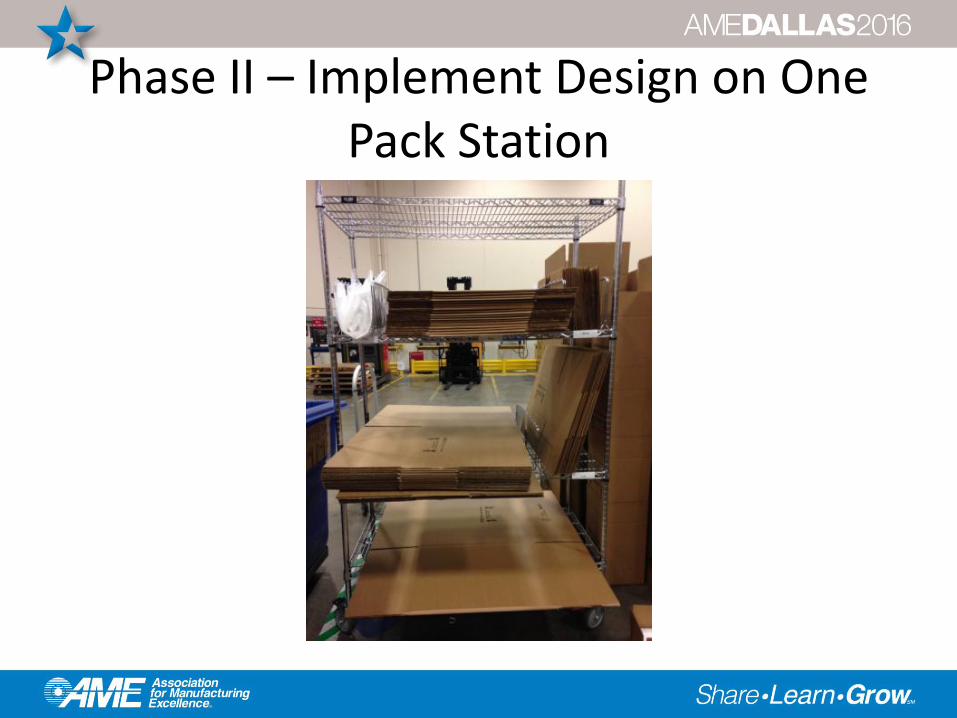
Phase II – Implement Design on One Pack Station
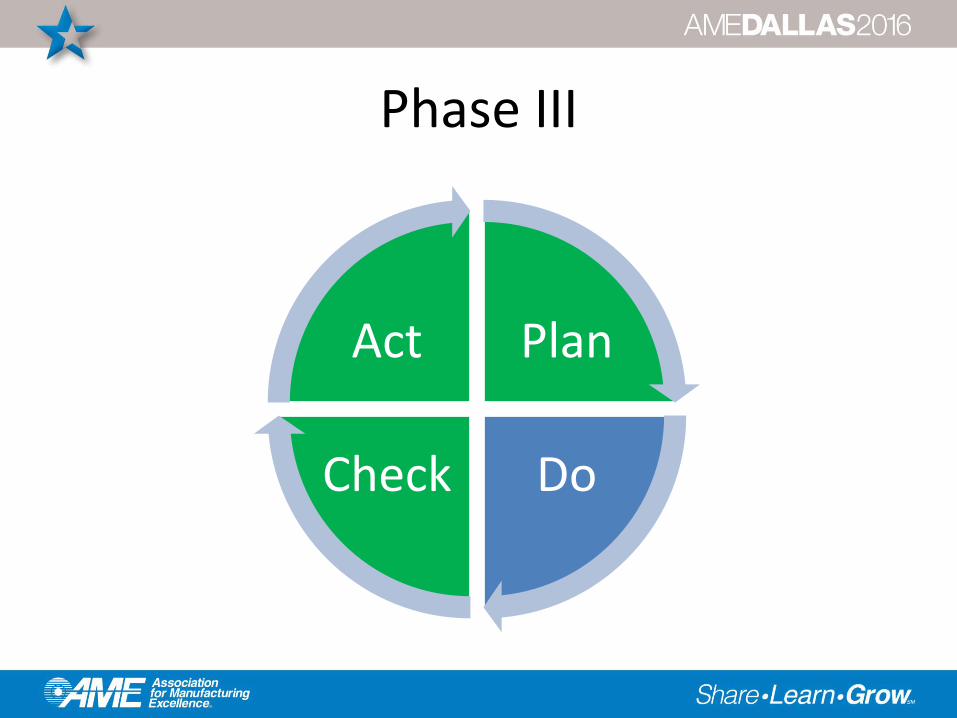
Phase III
Plan
DoCheck
Act
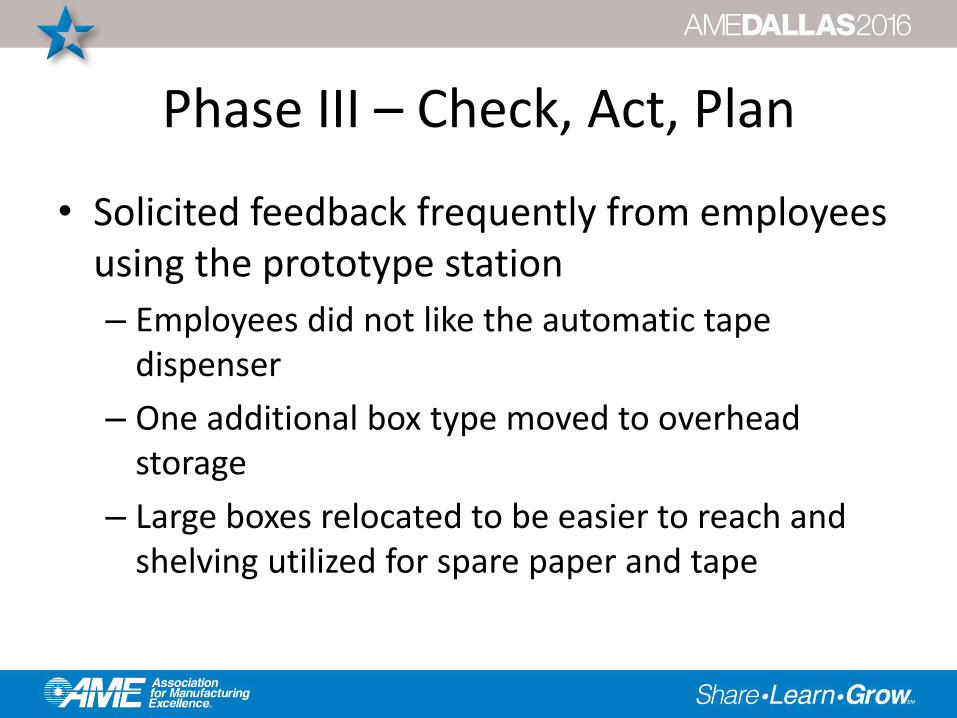
Phase III – Check, Act, Plan
• Solicited feedback frequently from employees using the prototype station
– Employees did not like the automatic tape dispenser
– One additional box type moved to overhead storage
– Large boxes relocated to be easier to reach and shelving utilized for spare paper and tape
Phase IV: Final Implementation
Plan
DoCheck
Act
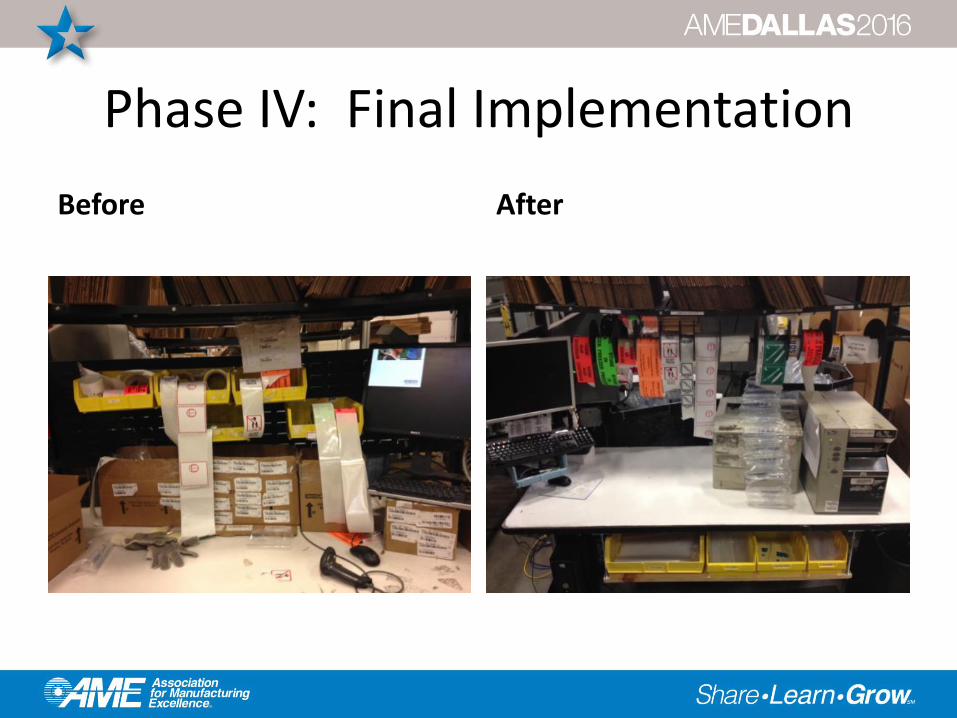
Phase IV: Final Implementation
Before After
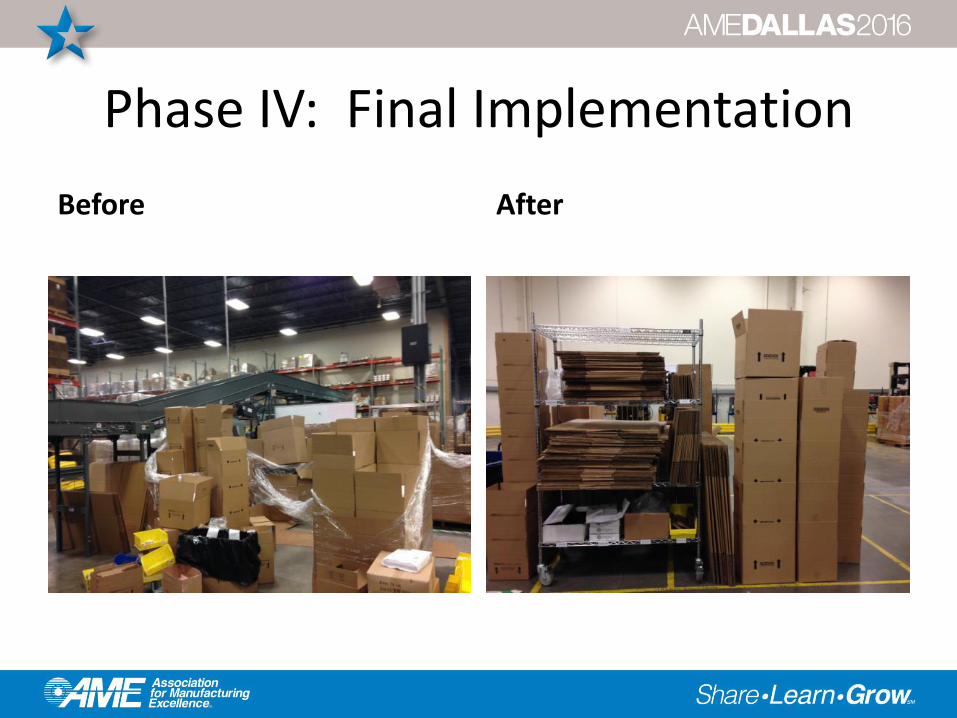
Phase IV: Final Implementation
Before After
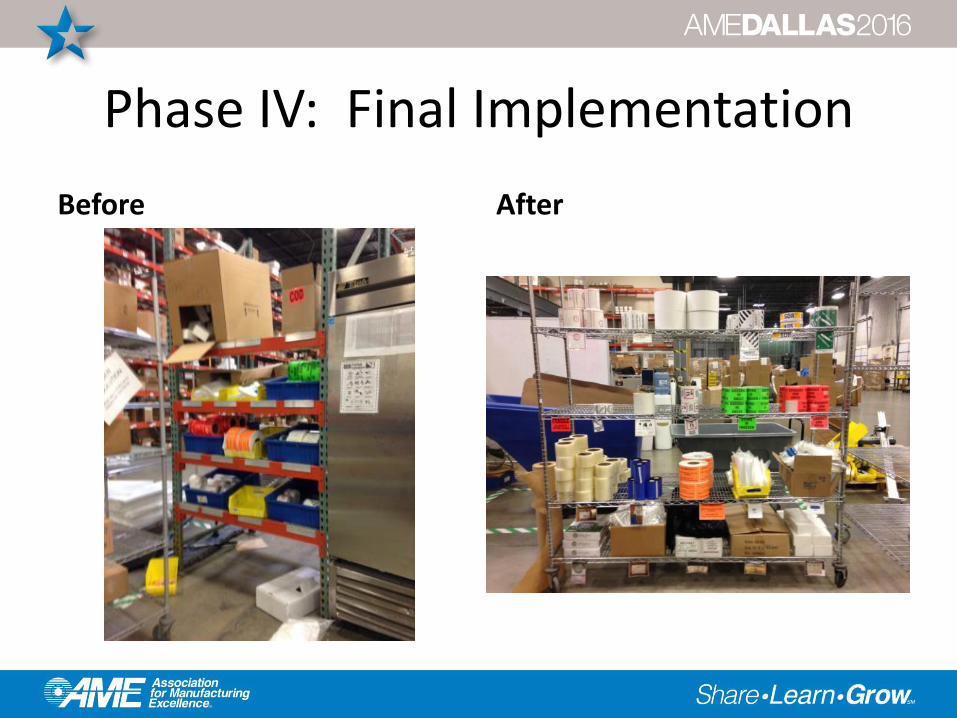
Phase IV: Final Implementation
Before After
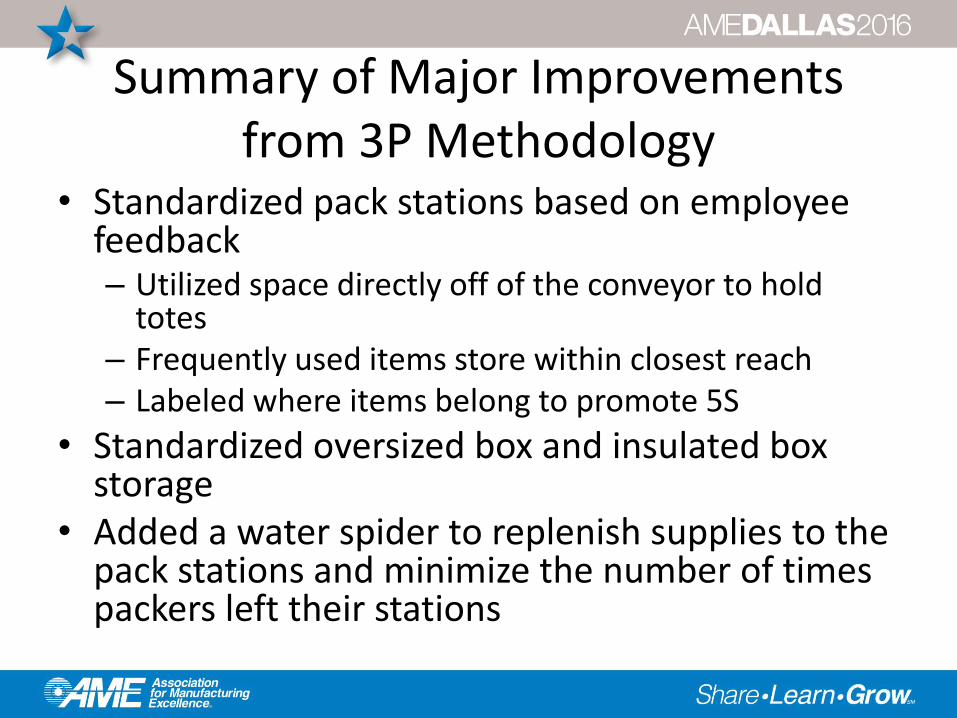
Summary of Major Improvementsfrom 3P Methodology
• Standardized pack stations based on employee feedback– Utilized space directly off of the conveyor to hold
totes– Frequently used items store within closest reach– Labeled where items belong to promote 5S
• Standardized oversized box and insulated box storage
• Added a water spider to replenish supplies to the pack stations and minimize the number of times packers left their stations
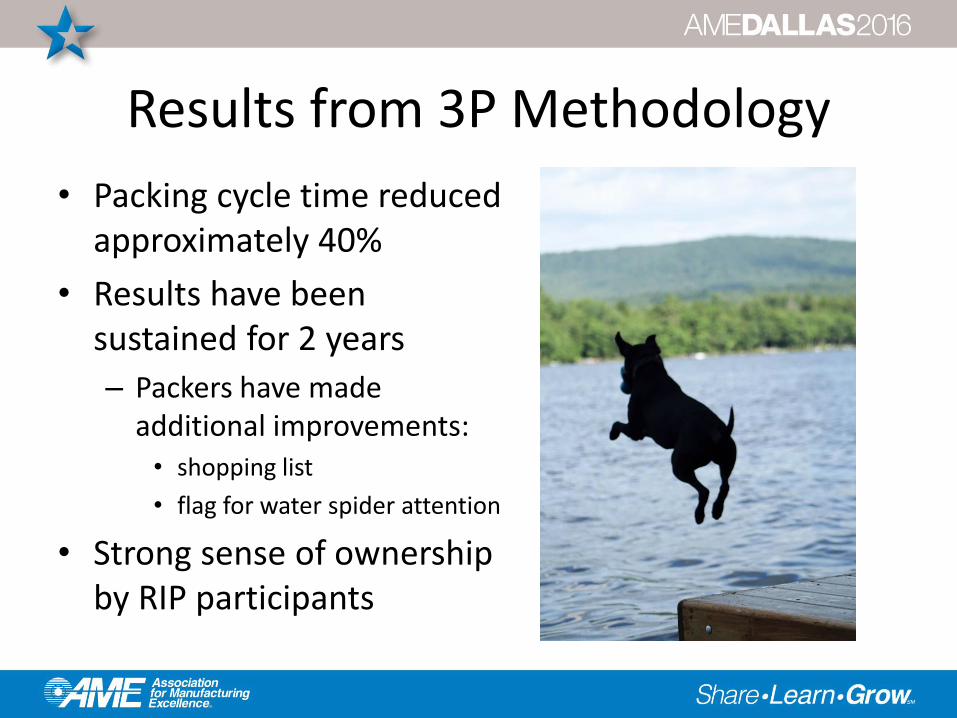
Results from 3P Methodology
• Packing cycle time reduced approximately 40%
• Results have been sustained for 2 years
– Packers have made additional improvements: • shopping list
• flag for water spider attention
• Strong sense of ownership by RIP participants
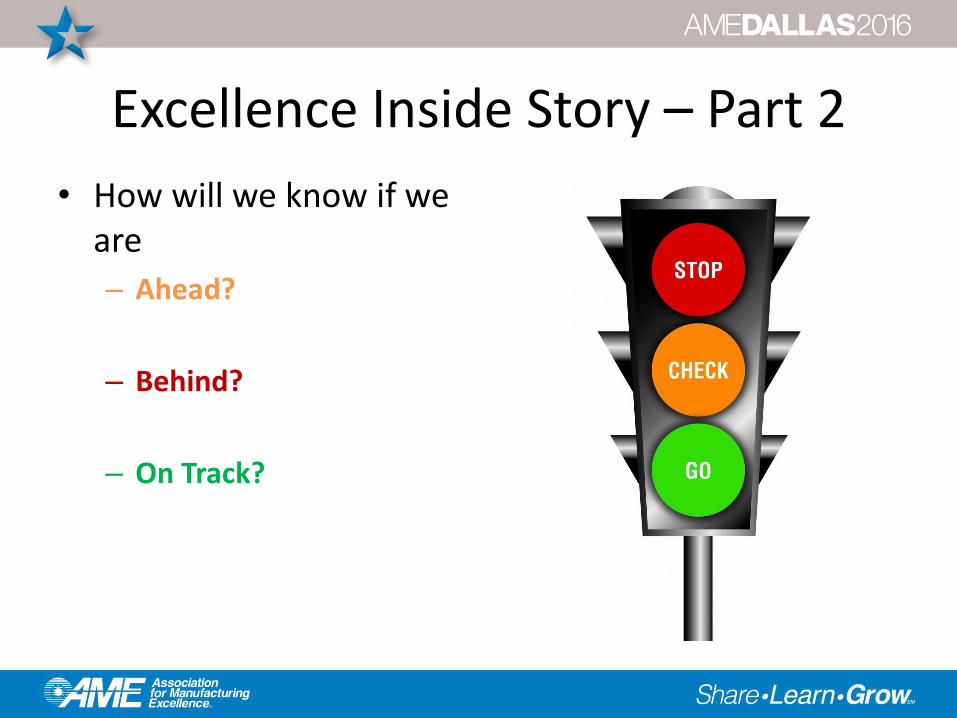
Excellence Inside Story – Part 2
• How will we know if we are
– Ahead?
– Behind?
– On Track?
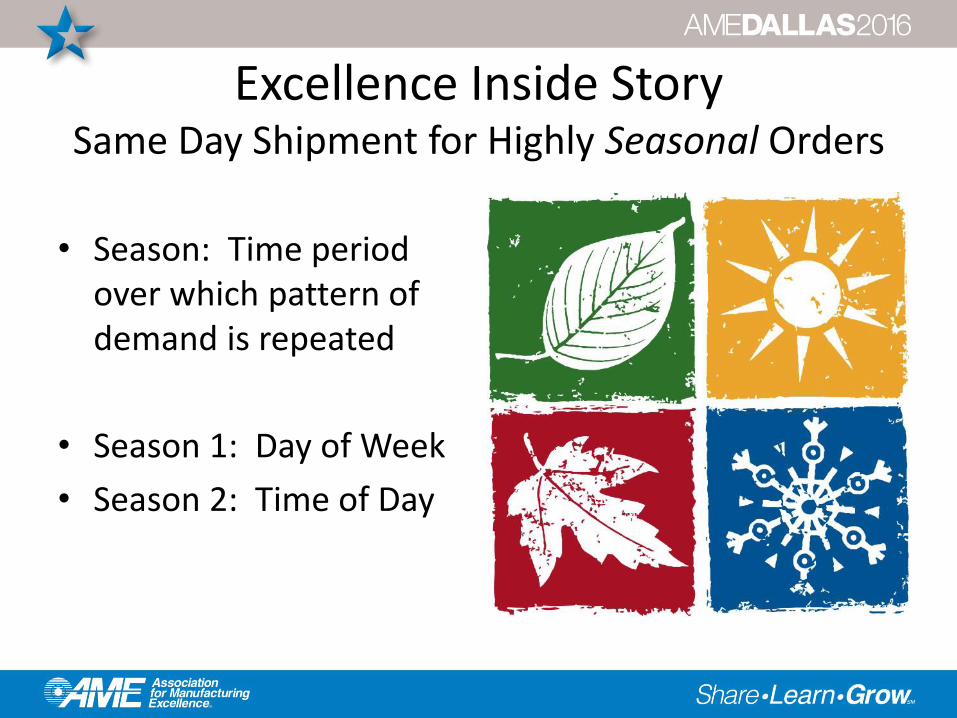
Excellence Inside StorySame Day Shipment for Highly Seasonal Orders
• Season: Time period over which pattern of demand is repeated
• Season 1: Day of Week
• Season 2: Time of Day
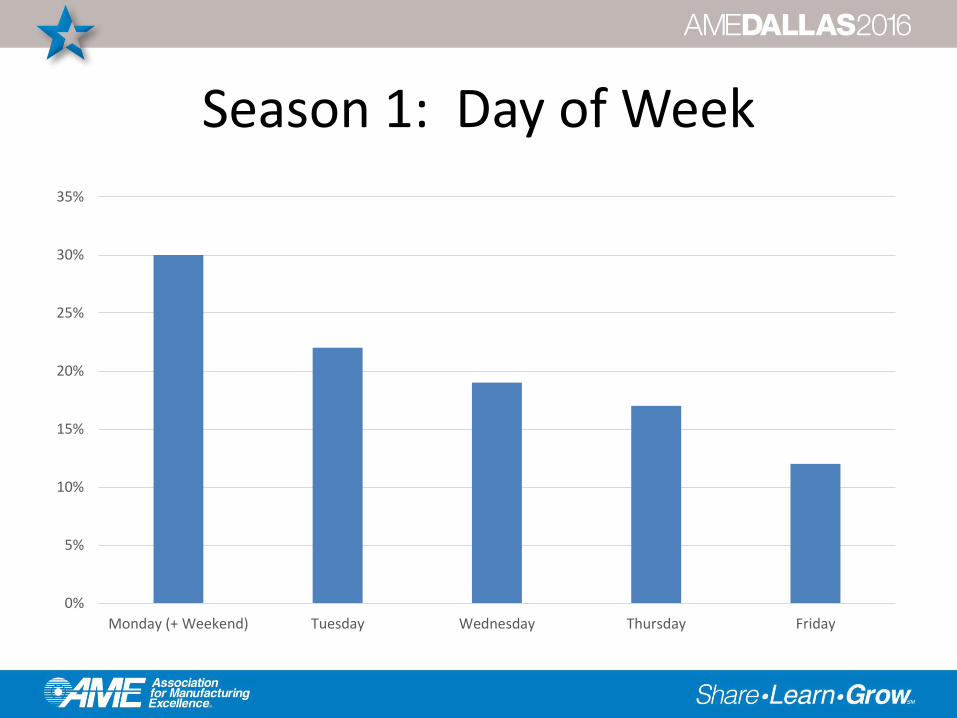
Season 1: Day of Week
0%
5%
10%
15%
20%
25%
30%
35%
Monday (+ Weekend) Tuesday Wednesday Thursday Friday
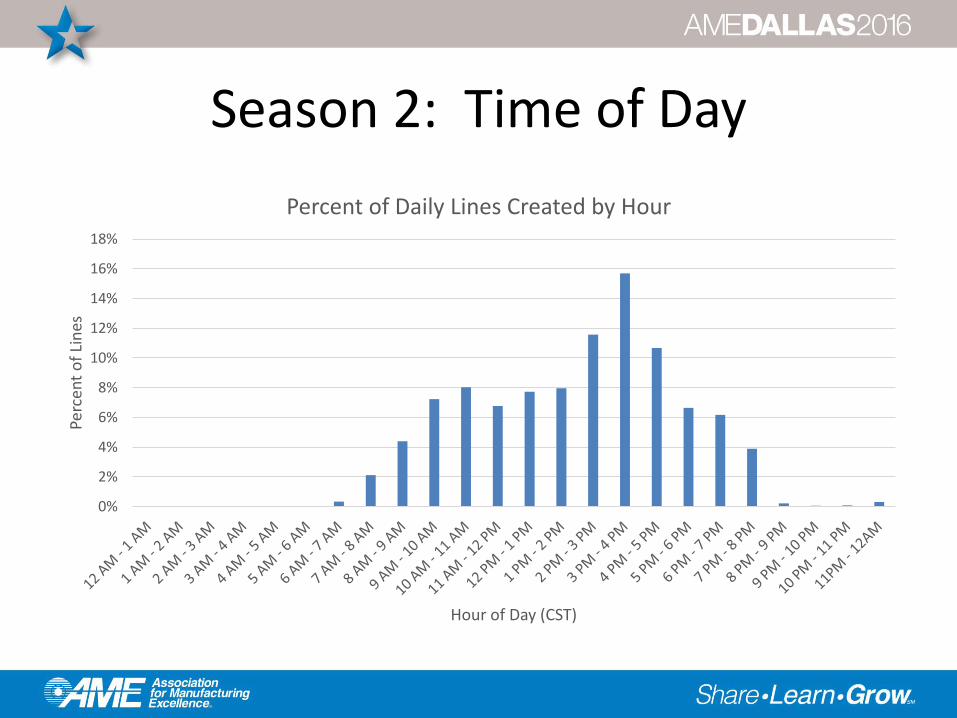
Season 2: Time of Day
0%
2%
4%
6%
8%
10%
12%
14%
16%
18%
Perc
ent
of
Lin
es
Hour of Day (CST)
Percent of Daily Lines Created by Hour
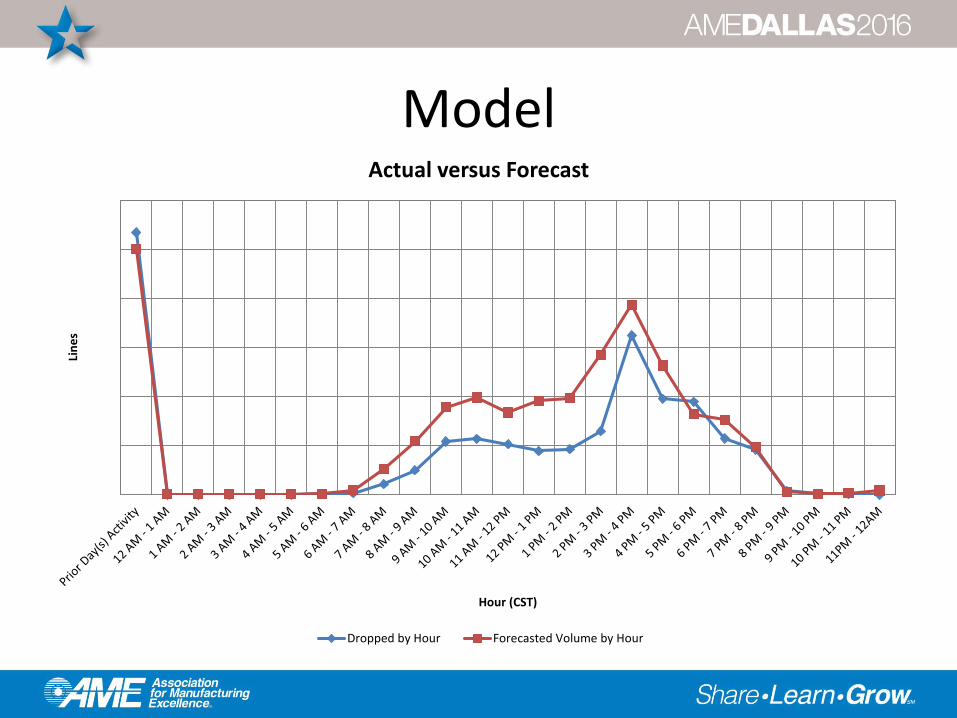
ModelLi
ne
s
Hour (CST)
Actual versus Forecast
Dropped by Hour Forecasted Volume by Hour
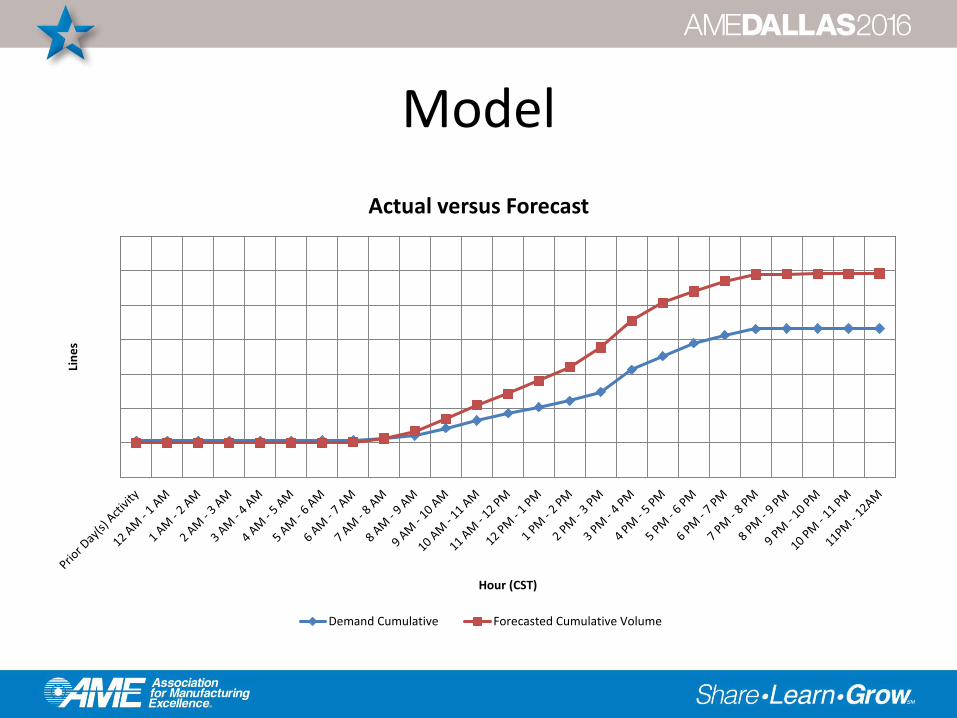
ModelLi
ne
s
Hour (CST)
Actual versus Forecast
Demand Cumulative Forecasted Cumulative Volume
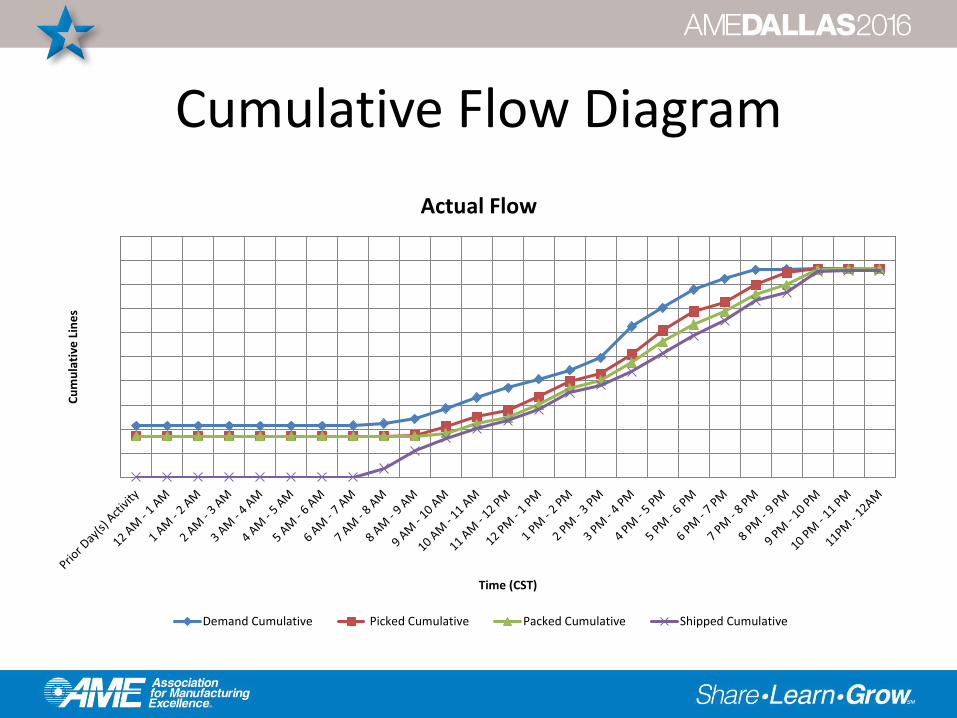
Cumulative Flow DiagramC
um
ula
tive
Lin
es
Time (CST)
Actual Flow
Demand Cumulative Picked Cumulative Packed Cumulative Shipped Cumulative
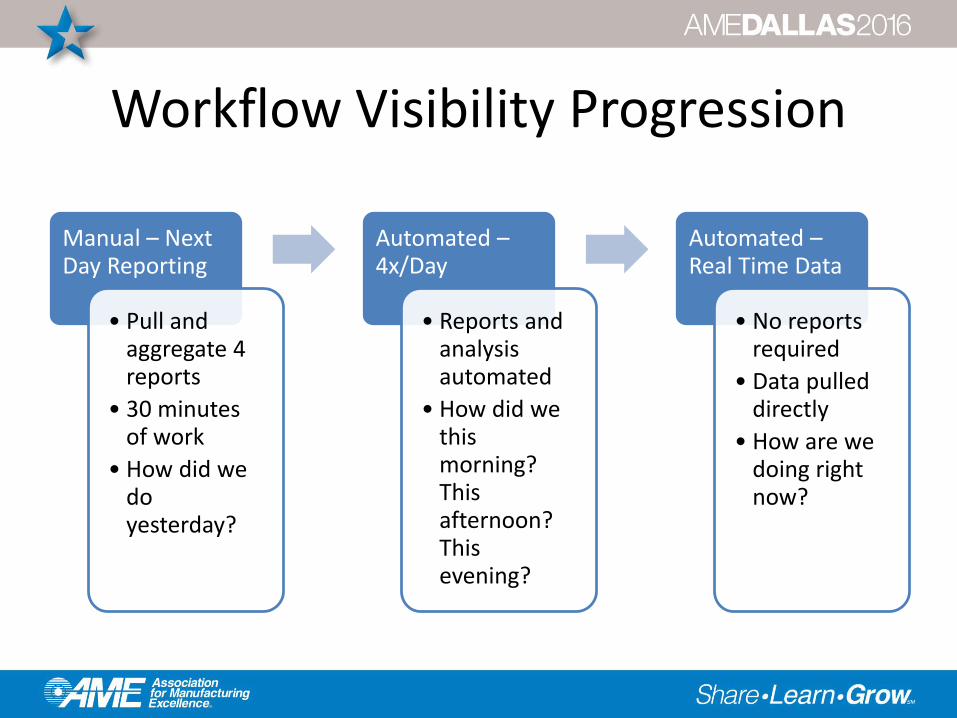
Workflow Visibility Progression
Manual – Next Day Reporting
• Pull and aggregate 4 reports
• 30 minutes of work
• How did we do yesterday?
Automated –4x/Day
• Reports and analysis automated
• How did we this morning? This afternoon? This evening?
Automated –Real Time Data
• No reports required
• Data pulled directly
• How are we doing right now?
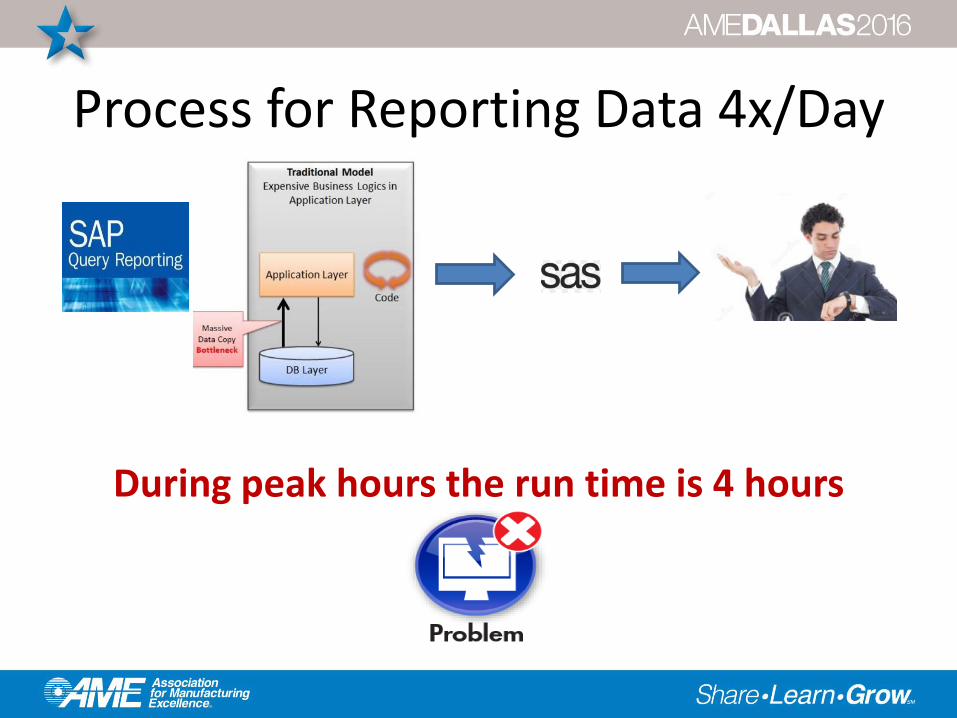
During peak hours the run time is 4 hours
Process for Reporting Data 4x/Day
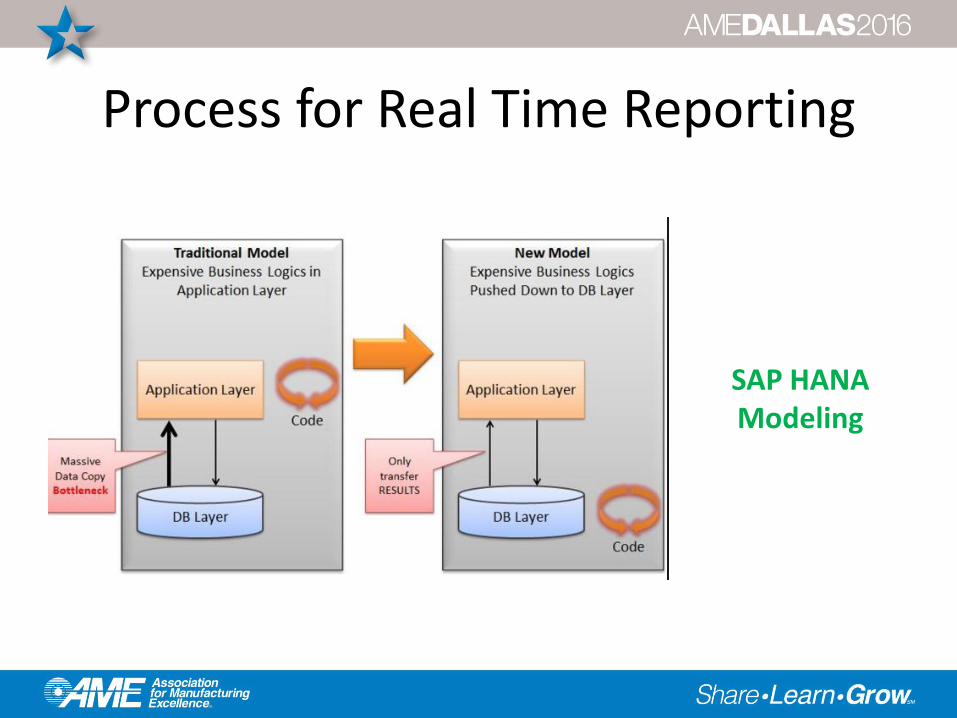
Process for Real Time Reporting
SAP HANA Modeling
Purpose Driven Excellence: Perfect order
fulfillment with next day delivery to support the
well-being of people, pets, and livestock
• Reduced packing cycle time by 40% through 3P improvement methodology
• Enabled workforce to be highly prepared, flexible, and reactive by understanding delivery arrival and fulfillment patterns in innate detail
Thank You!
Your opinion is important to us!Please take a moment to complete the survey using the conference mobile app.
Session: WP/27
Lean Process Improvements in Warehousing and Distribution
Leigh Henderson & Scott Jagger
IDEXX Laboratories