lead human exposure and health risk assessments for ... · lead human exposure and health risk...
TRANSCRIPT
Lead Human Exposure and Health Risk Assessments for Selected Case Studies (Draft Report)
Volume I. Human Exposure and Health Risk Assessments - Full-scale

EPA-452/D-07-001a July 2007
Lead Human Exposure and Health Risk Assessments for Selected Case Studies (Draft Report)
Volume I. Human Exposure and Health Risk Assessments - Full-scale
U.S. Environmental Protection Agency Office of Air Quality Planning and Standards
Research Triangle Park, North Carolina

DISCLAIMER
This document has been reviewed by the Office of Air Quality Planning and Standards, U.S. Environmental Protection Agency (EPA), and approved for publication. This draft document has been prepared by staff from the Office of Air Quality Planning and Standards, U.S. Environmental Protection Agency. Any opinions, findings, conclusions, or recommendations are those of the authors and do not necessarily reflect the views of the EPA Mention of trade names or commercial products is not intended to constitute endorsement or recommendation for use. This document is being provided to the Clean Air Scientific Advisory Committee for their review, and made available to the public for comment. Any questions or comments concerning this document should be addressed to Zachary Pekar, U.S. Environmental Protection Agency, Office of Air Quality Planning and Standards, C504-06, Research Triangle Park, North Carolina 27711 (email: [email protected]).
PREFACE
This document is part of the Environmental Protections Agency’s (EPA’s) review of the National Ambient Air Quality Standards (NAAQS) for lead (Pb). As part of that review, the Agency has prepared the Air Quality Criteria Document for Lead (the “CD”, October, 2006; available at http://www.epa.gov/ttn/naaqs/standards/pb/s_pb_cr_cd.html), a draft Staff Paper (Review of the National Ambient Air Quality Standards for Lead: Policy Assessment of Scientific and Technical Information, OAQPS Staff Paper – First Draft, December, 2006; available at http://www.epa.gov/ttn/naaqs/standards/pb/s_pb_cr_sp.html), and a draft technical report of pilot phase risk assessments (Lead Human Exposure and Health Risk Assessments and Ecological Risk Assessment for Selected Areas, December, 2006; available at http://www.epa.gov/ttn/naaqs/standards/pb/s_pb_cr_td.html). These documents were developed under our historic approach for reviewing NAAQS, which has included the completion of a policy assessment, in the form of a Staff Paper, and of any related risk and exposure assessments (risk/exposure reports) prior to development of notices of proposed and final rulemakings. The policy assessment, considering the adequacy of the current standard and policy alternatives, is intended to help “bridge the gap” between the scientific assessment contained in the CD and the judgments required of the EPA Administrator in determining whether it is appropriate to retain or revise the NAAQS.
The Agency is now moving forward to implement a new, improved process for conducting NAAQS reviews (http://www.epa.gov/ttn/naaqs/) and is transitioning to that new process during the course of the Pb NAAQS review, beginning with this document (the risk/exposure report). Under the new process, the risk/exposure report precedes the policy assessment (rather than accompanying it), and the policy assessment is included in an Advance Notice of Proposed Rulemaking (ANPR) rather than a Staff Paper. Accordingly, it is the Agency’s intention that the results of the assessments described in the final risk/exposure assessment report for Pb will be considered, in combination with an evaluation of the policy implications of the key studies and scientific information contained in the CD and ambient Pb analyses, in the development of the policy assessment to be published in the Federal Register in an ANPR this fall.1
Volume I of this document has been drafted by EPA staff, and the appendices (contained in Volume II) have been drafted by EPA staff, in conjunction with ICF International (through Contract No. EP-D-06-115). This draft document is being provided to the Clean Air Scientific Advisory Committee (CASAC) for their review, and is being made available to the public for
1 EPA’s preference is to issue the policy assessment as part of an ANPR and not in the form of a final Staff Paper. EPA is currently, however, under a court order to issue a final Staff Paper and has moved for modification of that order to allow EPA to issue an ANPR in place of a final Staff Paper. In the event EPA’s motion is not granted, EPA intends to fully comply with the existing order.
comment. A final version of this document will be prepared taking into consideration CASAC and public comments.
This document is limited in focus to the human exposure and risk assessments. As stated in the December draft Staff Paper, a full-scale ecological risk assessment is not being performed for this review. The pilot phase ecological risk assessment is presented in the December 2006 draft technical report of pilot phase risk assessments and discussed in the December 2006 draft Staff Paper. Accordingly, the focus for this review with regard to the policy assessment for the secondary standard will be on what we have learned from the pilot phase risk assessment, in addition to the science assessment in the CD.
Table of Contents
List of Tables ......................................................................................................................iv
List of Figures .....................................................................................................................iv
1 INTRODUCTION.................................................................................................. 1-1
1.1 MULTIMEDIA ASPECT OF THE RISK ASSESSMENT ............................ 1-1 1.2 RISK ASSESSMENT FROM LAST REVIEW.............................................. 1-3 1.3 PILOT PHASE ASSESSMENT FOR THE CURRENT REVIEW ................ 1-5 1.4 CASAC ADVICE ............................................................................................ 1-5
1.5 ORGANIZATION OF THE DOCUMENT..................................................... 1-7 REFERENCES .......................................................................................................... 1-8
2 DESIGN OF EXPOSURE AND RISK ASSESSMENTS................................... 2-1
2.1 BACKGROUND INFORMATION ON LEAD EXPOSURE AND RISK .... 2-1 2.1.1 Sources, Pathways and Routes................................................................. 2-3 2.1.2 At-risk Populations .................................................................................. 2-4
2.1.3 Internal Disposition.................................................................................. 2-6
2.1.4 Health Endpoints...................................................................................... 2-7
2.1.4.1 Developing Nervous System........................................................... 2-8
2.1.4.2 Adult Nervous System .................................................................. 2-10 2.1.4.3 Cardiovascular System.................................................................. 2-10
2.1.4.4 Renal System ................................................................................ 2-11
2.1.4.5 Heme Synthesis............................................................................. 2-12
2.1.4.6 Immune System ............................................................................ 2-12
2.1.5 Risk Metric and Model for Risk Quantitation ....................................... 2-13
2.2 USE OF CASE STUDIES AND LOCATION SELECTIONS ..................... 2-15 2.2.1 Urban Case Study .................................................................................. 2-15 2.2.2 Point Source Case Studies ..................................................................... 2-16
2.2.2.1 Primary Pb Smelter Case Study.................................................... 2-17 2.2.2.2 Secondary Pb Smelter Case Study................................................ 2-19
2.3 ASSESSMENT SCENARIOS....................................................................... 2-20 2.3.1 Air Concentrations ................................................................................. 2-20
2.3.2 Policy-relevant Background................................................................... 2-22
2.3.3 Outdoor Soil/Dust .................................................................................. 2-23
July 2007 i Draft – Do Not Quote or Cite
2.4 ANALYTICAL APPROACH ....................................................................... 2-25 2.4.1 Temporal Aspects .................................................................................. 2-25
2.4.2 Spatial Scale and Resolution.................................................................. 2-25 2.4.3 Categorization of Policy-relevant Exposure Pathways.......................... 2-26 2.4.4 Overview of Analytical Steps ................................................................ 2-28
2.4.4.1 Exposure Assessment.................................................................... 2-30
2.4.4.2 Risk Characterization.................................................................... 2-32
2.4.5 Variability Characterization................................................................... 2-32
2.4.6 Uncertainty Characterization ................................................................. 2-33
2.4.6.1 Performance Evaluations .............................................................. 2-34
2.4.6.2 Generating Multiple Sets of Results ............................................. 2-34 2.4.6.3 Sensitivity Analysis ...................................................................... 2-35
2.4.6.4 Qualitative Discussion of Sources of Uncertainty ........................ 2-36
REFERENCES ........................................................................................................ 2-37
3 EXPOSURE ASSESSMENT ................................................................................ 3-1
3.1 METHODS FOR ESTIMATING MEDIA CONCENTRATIONS................. 3-1 3.1.1 Ambient Air Concentrations .................................................................... 3-3
3.1.1.1 General Urban Case Study.............................................................. 3-3 3.1.1.2 Primary Pb Smelter Case Study...................................................... 3-4 3.1.1.3 Secondary Pb Smelter Case Study.................................................. 3-5
3.1.2 Inhalation Exposure Concentrations ........................................................ 3-5 3.1.3 Outdoor Surface Soil/Dust Concentrations.............................................. 3-6
3.1.3.1 General Urban Case Study.............................................................. 3-6 3.1.3.2 Primary Pb Smelter Case Study...................................................... 3-6 3.1.3.3 Secondary Pb Smelter Case Study.................................................. 3-7
3.1.4 Indoor Dust Concentrations ..................................................................... 3-8
3.1.4.1 General Urban Case Study............................................................ 3-10 3.1.4.2 Primary Pb Smelter Case Study.................................................... 3-12 3.1.4.3 Secondary Pb Smelter Case Study................................................ 3-13
3.2 METHODS FOR ESTIMATING BLOOD PB LEVELS ............................. 3-14 3.2.1 Blood Pb Modeling................................................................................ 3-14
3.2.1.1 Primary Analysis........................................................................... 3-16
3.2.1.2 Sensitivity Analysis ...................................................................... 3-16
3.2.2 Exposure Pathway Apportionment and Probabilistic Population Modeling................................................................................................ 3-17
3.2.2.1 General Urban Case Study............................................................ 3-18
July 2007 ii Draft – Do Not Quote or Cite
3.2.2.2 Point Source Case Studies ............................................................ 3-19 3.2.3 GSD for Population Blood Pb Modeling Procedure.............................. 3-22
3.2.3.1 General Urban Case Study............................................................ 3-24 3.2.3.2 Point-Source Case Studies ............................................................ 3-25
3.3 ESTIMATED MEDIA CONCENTRATIONS.............................................. 3-25
3.4 ESTIMATED BLOOD PB LEVELS ............................................................ 3-28 3.5 UNCERTAINTY CHARACTERIZATION.................................................. 3-42
3.5.1 Performance Evaluation Related to Exposure Media Modeling............ 3-42 3.5.1.1 Evaluation of Modeled Ambient Air Pb Concentrations.............. 3-42 3.5.1.2 Evaluation of Modeled Outdoor Soil/Dust Pb Concentrations..... 3-43 3.5.1.3 Evaluation of Modeled Indoor Dust Pb Concentrations ............... 3-44
3.5.2 Performance Evaluation Related to Blood Pb Modeling....................... 3-47 3.5.2.1 Evaluation of Candidate Blood Pb Models................................... 3-47 3.5.2.2 Evaluation of model-derived outdoor air Pb-to-blood Pb ratios... 3-48 3.5.2.3 Comparison of modeled blood Pb levels to nationally representative data ........................................................................ 3-50
REFERENCES ........................................................................................................ 3-55
4 RISK ASSESSMENT ............................................................................................ 4-1
4.1 METHODS FOR DERIVING RISK ESTIMATES........................................ 4-1 4.1.1 Concentration-Response Functions ......................................................... 4-1
4.1.1.1 Log-Linear Function with Cutpoint ................................................ 4-3 4.1.1.2 Log-Linear Function with Low-Exposure Linearization................ 4-3 4.1.1.3 Two-piece Linear Function............................................................. 4-4
4.1.2 Projection of Population Risk .................................................................. 4-5
4.2 RISK ESTIMATES ......................................................................................... 4-6 4.2.1 General Urban Case Study....................................................................... 4-8 4.2.2 Primary Pb Smelter Case Study............................................................. 4-18 4.2.3 Secondary Pb Smelter Case Study......................................................... 4-26
4.3 UNCERTAINTY CHARACTERIZATION.................................................. 4-32 4.3.1 Qualitative Discussion of Key Sources of Uncertainty ......................... 4-32 4.3.2 Sensitivity Analysis ............................................................................... 4-35
4.3.3 Performance Analyses ........................................................................... 4-37
4.3.4 Uncertainty in Modeling Approaches – Multiple Sets of Results ......... 4-40
REFERENCES ........................................................................................................ 4-42
July 2007 iii Draft – Do Not Quote or Cite
List of Figures
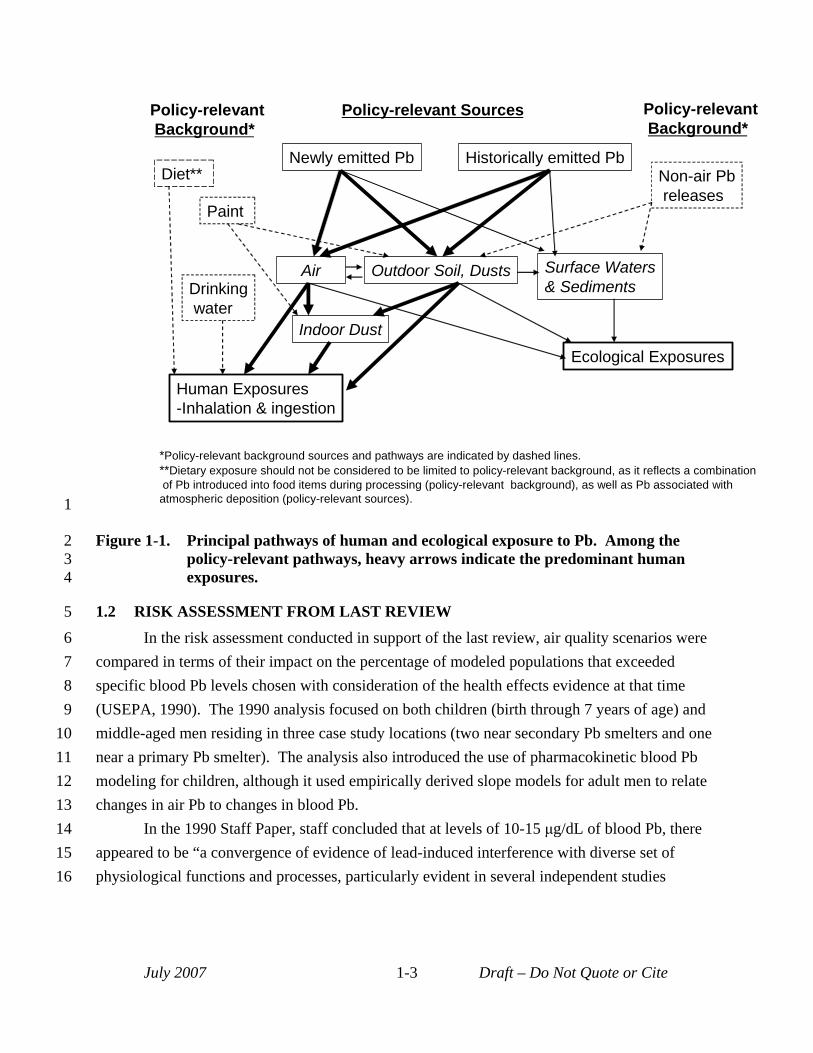
Figure 1-1. Principal pathways of human and ecological exposure to Pb. Among the policy-relevant pathways, heavy arrows indicate the predominant human exposures. ........ 1-3
Figure 2-1. Conceptual model for Pb human health risk assessment. ......................................... 2-2 Figure 2-2. Overview of analysis approach. .............................................................................. 2-29 Figure 2-3. Modeling approaches for each case study. .............................................................. 2-35
Figure 3-1. Procedure for generating population blood Pb distributions for point source case studies. ............................................................................................................. 3-21 Figure 3-2. Comparison of NHANES-IV blood Pb levels with modeled estimates. ................. 3-52
Figure 4-1. Comparison of three concentration-response functions for concurrent blood Pb levels < 10 µg/dL...................................................................................................... 4-2
List of Tables
Table 2-1. Key aspects of primary Pb smelter case study. ....................................................... 2-18 Table 2-2. Key aspects of secondary Pb smelter case study..................................................... 2-19 Table 2-3. Air quality scenarios assessed for the general urban case study. ............................ 2-22
Table 3-1. Case study approaches for estimating media Pb concentrations. .............................. 3-2 Table 3-2. Hybrid model for indoor dust Pb in general urban case study. ............................... 3-11 Table 3-3. Estimated annual ambient air concentrations. ......................................................... 3-26 Table 3-4. Estimated inhalation exposure concentrations. ....................................................... 3-27 Table 3-5. Estimated outdoor soil/dust concentrations............................................................. 3-27 Table 3-6. Estimated indoor dust concentrations...................................................................... 3-28 Table 3-7. General urban case study: current conditions - estimated blood Pb levels. ............ 3-31 Table 3-8. General urban case study: current NAAQS (1.5 µg/m3, maximum quarterly
average) - estimated blood Pb levels. ...................................................................... 3-32 Table 3-9. General urban case study: alternative NAAQS (0.2 µg/m3, maximum quarterly
average) - estimated blood Pb levels. ...................................................................... 3-33 Table 3-10. General urban case study: alternative NAAQS (0.5 µg/m3, maximum monthly
average) - estimated blood Pb levels. ...................................................................... 3-34 Table 3-11. General urban case study: alternative NAAQS (0.2 µg/m3, maximum monthly
average) - estimated blood Pb levels. ...................................................................... 3-35 Table 3-12. General urban case study: alternative NAAQS (0.05 µg/m3, maximum monthly
average) - estimated blood Pb levels. ...................................................................... 3-36 Table 3-13. Primary Pb smelter case study: current NAAQS (1.5 µg/m3, maximum quarterly
average) - estimated blood Pb levels. ...................................................................... 3-37 Table 3-14. Primary Pb smelter case study: current NAAQS attainment (0.2 µg/m3, maximum
quarterly average) estimated blood Pb levels.......................................................... 3-37 Table 3-15. Primary Pb smelter case study: alternate NAAQS (0.5 µg/m3, maximum monthly
average) - estimated blood Pb levels. ...................................................................... 3-38
July 2007 iv Draft – Do Not Quote or Cite
Table 3-16. Primary Pb smelter case study: alternate NAAQS (0.2 µg/m3, maximum monthly average) - estimated blood Pb levels. ...................................................................... 3-38
Table 3-17. Primary Pb smelter case study: alternate NAAQS (0.05 µg/m3, maximum monthly
Table 3-19. Secondary Pb smelter case study: alternative NAAQS (0.2 µg/m3, maximum
Table 3-20. Secondary Pb smelter case study: alternative NAAQS (0.5 µg/m3, maximum monthly
Table 3-21. Secondary Pb smelter case study: alternative NAAQS (0.2 µg/m3, maximum
Table 3-22. Secondary Pb smelter case study: alternative NAAQS (0.05 µg/m3, maximum
Table 3-23. Evaluation of model-predicted indoor dust Pb levels against empirical data
average) - estimated blood Pb levels. ...................................................................... 3-39 Table 3-18. Secondary Pb smelter case study: current conditions - estimated blood Pb levels. 3-39
quarterly average) - estimated blood Pb levels. ...................................................... 3-40
average) - estimated blood Pb levels. ...................................................................... 3-40
monthly average) - estimated blood Pb levels......................................................... 3-41
monthly average) - estimated blood Pb levels......................................................... 3-41
obtained from the literature. .................................................................................... 3-46 Table 3-24. Air-to-Blood Pb ratios for “recent air” contribution to concurrent blood Pb level. 3-49 Table 3-25. Blood Pb Levels for 7 year olds in the U.S. (interpolated from NHANES IV,
1999-2002). ............................................................................................................. 3-52
Table 4-1. Comparison of total and incremental IQ loss estimates below 10 µg/dL for the three concentration-response functions. ............................................................................. 4-2
Table 4-6. General urban case study: alternative NAAQS (0.5 µg/m3, maximum monthly
Table 4-7. General urban case study: alternative NAAQS (0.2 µg/m3, maximum quarterly
Table 4-8. General urban case study: alternative NAAQS (0.2 µg/m3, maximum monthly
Table 4-9. General urban case study: alternative NAAQS (0.05 µg/m3, maximum monthly
Table 4-11. Primary Pb smelter study: alternative NAAQS (0.5 µg/m3, maximum monthly
Table 4-12. Primary Pb smelter study: alternative NAAQS (0.2 µg/m3, maximum quarterly
Table 4-13. Primary Pb smelter case study: alternative NAAQS (0.2 µg/m3, maximum monthly
Table 4-14. Primary Pb smelter case study: alternative NAAQS (0.05 µg/m3, maximum monthly
Table 4-16. Secondary Pb smelter case study: alternative NAAQS (0.5 µg/m3, maximum monthly
Table 4-2. Summary of risk estimates for recent air................................................................... 4-9 Table 4-3. Summary of risk estimates for recent plus past air. ................................................ 4-11 Table 4-4. General urban case study: current conditions - estimated IQ loss. ......................... 4-12 Table 4-5. General urban case study: current NAAQS - estimated IQ loss. ............................ 4-13
average) - estimated IQ loss. ................................................................................... 4-14
average) - estimated IQ loss. ................................................................................... 4-15
average) estimated IQ loss. ..................................................................................... 4-16
average) estimated IQ loss. ..................................................................................... 4-17 Table 4-10. Primary Pb smelter case study: current NAAQS - estimated IQ loss. .................... 4-21
average) – estimated IQ loss. .................................................................................. 4-22
average) - estimated IQ loss. ................................................................................... 4-23
average) - estimated IQ loss. ................................................................................... 4-24
average) - estimated IQ loss. ................................................................................... 4-25 Table 4-15. Secondary Pb smelter case study: current conditions - estimated IQ loss. ............. 4-27
average) estimated IQ loss. ..................................................................................... 4-28
July 2007 v Draft – Do Not Quote or Cite
Table 4-17. Secondary Pb smelter case study: alternative NAAQS (0.2 µg/m3, maximum quarterly average) estimated IQ loss. ...................................................................... 4-29
Table 4-18. Secondary Pb smelter case study: alternative NAAQS (0.2 µg/m3, maximum monthly
Table 4-19. Secondary Pb smelter case study: alternative NAAQS (0.05 µg/m3, maximum average) estimated IQ loss. ..................................................................................... 4-30
monthly average) estimated IQ loss. ....................................................................... 4-31 Table 4-20.Impact of multiple sources of uncertainty on risk results. ...................................... 4-40
July 2007 vi Draft – Do Not Quote or Cite
1 1 INTRODUCTION
2 This document is the first volume of the draft report Lead Human Exposure and Health 3 Risk Assessments for Selected Areas. This volume describes the quantitative human exposure 4 and health risk assessments1 being conducted to inform the U.S. Environmental Protection 5 Agency’s (EPA’s) current review of the National Ambient Air Quality Standards (NAAQS) for 6 lead (Pb). The draft risk assessment report is being provided to CASAC and the public for 7 review in advance of a public meeting of the CASAC Pb panel planned for August 28-29, 2007. 8 Following that meeting, we will take CASAC and public comments into account in preparing the 9 final document. We plan to complete the final risk assessment report in October, 2007.
10 As with the last review of the Pb NAAQS (see Section 1.1), the human exposure and 11 health risk assessments (the risk assessment)2 for this review reflect multimedia exposure 12 pathways, and their influence on blood Pb levels as an internal index of exposure or dose. The 13 assessment for this review, as with that for the last review, utilizes a case-study approach 14 wherein a set of specific locations or case studies associated with policy-relevant Pb exposures 15 are evaluated in detail. The case studies have been selected to provide a perspective on the 16 nature and magnitude of air-sourced Pb exposures and risk in the United States. There are two 17 phases to the risk assessment for the current review: pilot and full-scale. The first phase (i.e., 18 the pilot assessment, described in Section 1.2) was presented in the first draft Staff Paper and 19 accompanying technical report (USEPA, 2006b; ICF, 2006), and was the subject of a CASAC 20 review on February 6 and 7, 2007 described in Section 1.3 (Henderson, 2007). The full-scale 21 assessment is described in this draft document.
22 1.1 MULTIMEDIA ASPECT OF THE RISK ASSESSMENT 23 The focus for this Pb NAAQS risk assessment is on Pb derived from those sources 24 emitting Pb to ambient air. The multimedia and persistent nature of Pb, however, contributes 25 several complexities to the assessment. 26 First, exposures to Pb emitted into the air occur via multiple pathways. As described in 27 the Air Quality Criteria for Lead (USEPA, 2006a; henceforth referred to as the CD), “The 28 multimedia aspects of Pb exposure can be seen in that Pb emissions to the air contribute to Pb
1 As described in the Preface to this document, the ecological risk analysis performed for this review, which will be considered in the policy assessment for the secondary standard, is presented in the draft technical report of the pilot phase risk assessments (ICF, 2006) and described in the draft Staff Paper (USEPA, 2006b).
2 Throughout the remainder of this document, the term "risk assessment" will be used to refer to both the human exposure and health risk assessments collectively, unless specific reference to either the human exposure or health risk assessment is required.
July 2007 1-1 Draft – Do Not Quote or Cite
1 concentrations in water, soil and dusts; Pb in soil and dust also can make important contributions 2 to Pb concentrations in ambient air” (CD, p. 3-1). 3 That is, inhalation exposures can result from Pb emitted to the ambient air recently from 4 Pb emitted in the past that has deposited from air to soil or dust and then become resuspended in 5 the ambient air. Further, Pb emitted into the ambient air can contribute to ingestion exposures 6 (associated with indoor dust, outdoor soil/dust, agricultural products and surface water) of 7 recently deposited Pb and of Pb that was deposited in the past. Consequently, this is a multi8 pathway risk assessment in which we are considering both airborne Pb, as it contributes to 9 human exposures through direct inhalation of particles containing Pb, and also Pb that has
10 deposited from air to dusts, soil and other environmental media and that contributes to human 11 exposures through ingestion. Further, we are considering that Pb, once deposited, may be 12 resuspended in the air, contributing to human inhalation exposures or, upon re-deposition, to 13 human ingestion exposures. Thus, as illustrated in Figure 1-1, pathways that are directly relevant 14 to a review of the NAAQS include both newly emitted Pb from currently operating sources, and 15 Pb emitted in the past, either from currently operating sources or historic sources, which are 16 collectively referred to as “policy-relevant sources”. 17 Due to limited data, models, and time available, however, we are not able to fully and 18 completely characterize in our risk assessment all of the various complexities associated with Pb. 19 Consequently, in our efforts to focus on and characterize risk associated with the ambient air20 related3 sources and exposures, we have made simplifying assumptions in a number of areas. 21 For example, Figure 1-1 illustrates that people are also exposed to Pb that originates from non-air 22 sources, including leaded paint or drinking water distribution systems. For purposes of this 23 assessment, the Pb from these non-air sources is collectively referred to as “policy-relevant 24 background”. Although Pb in diet and drinking water sources may derive from Pb emitted into 25 the ambient air, the contribution from air pathways to these exposure pathways is not explicitly 26 recognized, such that these exposures are treated as policy-relevant background. 4
3 Ambient-air related sources are those emitting Pb into the ambient air (including resuspension of previously emitted Pb), and ambient air related exposures include inhalation of ambient air Pb as well as ingestion of Pb deposited out of the air (e.g., onto outdoor soil/dust or indoor dust).
4 This categorization of policy-relevant sources and background exposures is not intended to convey any particular policy decision at this stage regarding the Pb standard. Rather, it is simply intended to convey an area of interest to this review.
July 2007 1-2 Draft – Do Not Quote or Cite
Policy-relevant Policy-relevant Sources Policy-relevant Background* Background*
Newly emitted Pb Historically emitted Pb
Air Outdoor Soil, Dusts
Indoor Dust
Paint
Surface Waters & Sediments
Non-air Pb releases
Human Exposures -Inhalation & ingestion
Diet**
Ecological Exposures
Drinking water
*Policy-relevant background sources and pathways are indicated by dashed lines. **Dietary exposure should not be considered to be limited to policy-relevant background, as it reflects a combination of Pb introduced into food items during processing (policy-relevant background), as well as Pb associated with atmospheric deposition (policy-relevant sources). 1
2 Figure 1-1. Principal pathways of human and ecological exposure to Pb. Among the 3 policy-relevant pathways, heavy arrows indicate the predominant human 4 exposures.
5 1.2 RISK ASSESSMENT FROM LAST REVIEW 6 In the risk assessment conducted in support of the last review, air quality scenarios were 7 compared in terms of their impact on the percentage of modeled populations that exceeded 8 specific blood Pb levels chosen with consideration of the health effects evidence at that time
9 (USEPA, 1990). The 1990 analysis focused on both children (birth through 7 years of age) and 10 middle-aged men residing in three case study locations (two near secondary Pb smelters and one 11 near a primary Pb smelter). The analysis also introduced the use of pharmacokinetic blood Pb 12 modeling for children, although it used empirically derived slope models for adult men to relate 13 changes in air Pb to changes in blood Pb. 14 In the 1990 Staff Paper, staff concluded that at levels of 10-15 μg/dL of blood Pb, there 15 appeared to be “a convergence of evidence of lead-induced interference with diverse set of 16 physiological functions and processes, particularly evident in several independent studies
July 2007 1-3 Draft – Do Not Quote or Cite
1 showing impaired neurobehavioral function and development” (USEPA, 1990).5 Accordingly, 2 the staff used blood Pb levels of 10 and 15 μg/dL to evaluate effects of alternate NAAQS on 3 children in the 1990 analysis (USEPA, 1990). These values were chosen with consideration of 4 the full body of health effects evidence at that time. Staff then used dispersion modeling (the 5 Industrial Source Complex (ISC) model) combined with source characterization data to generate 6 Pb air concentrations for each case study area. Statistically derived relationships based on data 7 from other industrial locations, including Pb smelters, that linked concentrations of Pb in air to 8 Pb in indoor dust and outdoor soil were then used to predict Pb in these media for the three case 9 study locations, based on the modeled air Pb concentrations. An uptake/biokinetic model was
10 also developed to predict child blood Pb levels. This model was used in place of a statistically11 based regression slope model to allow consideration of the dynamic nature of Pb exposure in 12 children. EPA combined model-derived central tendency blood Pb levels with an estimated 13 geometric standard deviation (GSD) reflecting inter-individual variability in blood Pb levels, to 14 generate population distributions of blood Pb levels. These distributions were then used to 15 estimate the percentage of children at each case study location that exceeded the blood Pb levels 16 10 and of 15 μg/dL, respectively. 17 For adult men, the 1990 assessment used blood Pb levels of 10 and 12 μg/dL to compare 18 relative effects of alternate NAAQS (USEPA, 1990). The same approach was used for 19 generating media concentrations for the adult analysis as was used for the child assessment. 20 However, rather than via a biokinetic model, as was used for the children’s assessment, the 1990 21 analysis for adults used statistically derived slope models to relate air Pb to blood Pb levels with 22 two versions of the slope models being employed: (a) the aggregate model which predicts blood 23 Pb in adults based solely on air Pb levels (here a single slope factor captures both the direct 24 inhalation pathway as well as the more complex pathway of Pb deposition to soil and dust 25 followed by incidental ingestion) and (b) the disaggregate model which uses media-specific 26 slopes to predict blood Pb based on Pb concentrations in soil, dust and air. Since the projected 27 blood Pb levels were mean population levels, a GSD term was included to develop population28 level blood Pb distributions. The GSD estimates for adults and children were derived from 29 information on observed blood Pb levels in these subgroups. These population-level 30 distributions were then queried to identify the percentage of adult men at each case study 31 location with modeled blood Pb levels exceeding the levels of interest for adults (10 and 12 32 μg/dL).
5 As a result of a parallel activity, the U.S. Centers for Disease Control and Prevention in 1991 reduced the children’s blood Pb level warranting individual intervention to 15 μg/dL and identified a level of 10 μg/dL for implementing community-wide prevention activities (CDC, 1991; CDC, 2005).
July 2007 1-4 Draft – Do Not Quote or Cite
5
10
15
20
25
30
1 The primary difference between the risk assessment approach used in the current pilot 2 analysis and the assessment completed in 1990 involves the risk metric employed, which reflects 3 the quantitative and qualitative health effects evidence available today that was not available in 4 1990 (CD). Rather than estimating the percentage of study populations with exposures above
blood Pb levels of interest as was done in the last review (i.e., 10, 12 and 15 μg/dL), the current 6 pilot analysis estimates the degree of health decrement in study populations exposed to Pb. 7 Specifically, the pilot analysis estimates the distribution of IQ loss associated with Pb exposure 8 for child populations at each of the case study locations with that IQ loss further differentiated 9 between background Pb exposure and policy-relevant exposures.
1.3 PILOT PHASE ASSESSMENT FOR THE CURRENT REVIEW 11 The pilot phase of the risk assessment for the current review is described in the first draft 12 Staff Paper and accompanying technical report (USEPA 2006b, ICF 2006). The pilot assessment 13 was intended primarily as a demonstration of the risk assessment methodology being developed 14 for the current review. Consequently, exposure and risk results from the pilot assessment are
considered preliminary. Additionally, the pilot assessment presented exposure and risk 16 assessments for only two air quality scenarios (current conditions and attainment of the current 17 NAAQS). 18 The pilot assessment included three case studies: (a) a primary Pb smelter (in 19 Herculaneum, Missouri), (b) a secondary Pb smelter (in Troy, Alabama), and, (c) a near roadway
(urban) location in Houston, Texas.6 The case studies modeled for the pilot were selected to 21 provide a preliminary perspective on the nature and magnitude of air-sourced Pb exposures and 22 risk. In addition, they provided a range of exposure scenarios in which to test the risk 23 assessment methodology developed for the current review. Because of differences in the 24 exposure scenarios and available data at each of the case study locations, the approach used for
modeling exposure and risk differed among the case studies. Results from the pilot assessment, 26 as well as comments received from the public and CASAC (see Section 1.4) have informed 27 decisions on the design for the full-scale assessment, including the types of case studies included.
28 1.4 CASAC ADVICE 29 The staff consulted with the CASAC on the draft analysis plan for the risk assessment
(USEPA, 2006c) in June, 2006 (Henderson, 2006), and subsequently developed the pilot
6 Note, that the near roadway (urban) case study comprised a 1.5 mile road segment and the residents living within 200m of that road segment. Consequently, this case study was intended to provide perspective on the near roadway exposure scenario but was not intended to estimate total population risk for a full urban or metropolitan area.
July 2007 1-5 Draft – Do Not Quote or Cite
1 assessment, summarized in Section 1.3, and described in the first draft Staff Paper and 2 accompanying technical report (USEPA, 2006b; ICF 2006). On February 6-7, 2007, the CASAC 3 Pb panel met to discuss these documents and CASAC’s written comments and recommendations 4 were provided in March 2007 (Henderson, 2007). 5 Consistent with their mandate under the Clean Air Act, CASAC provided comments on 6 both scientific aspects of the risk assessment and aspects related to the standards themselves 7 (Henderson, 2007).7 With regard to the risk assessment, they recommended that the case study 8 approach implemented for the pilot risk assessment be supplemented with a “population-based” 9 analysis, and, in discussion at the public meeting, the panel raised the general occurrence of
10 lower Pb levels in urban areas beyond more point source impacted areas as being an important 11 focus for the risk assessment. As described below, consideration of comments in this area led to 12 a significant difference in the design of the full-scale assessment as compared to the pilot 13 assessment. 14 CASAC also recommended that uncertainty be characterized with regard to the 15 relationship between a change in the NAAQS and the distribution of population blood Pb 16 concentrations, and with regard to the relationship between blood Pb concentrations and the risk 17 of adverse health effects (Henderson, 2007). With respect to alternate NAAQS for consideration 18 by EPA, CASAC recommended consideration of levels less than or about 0.2 µg/m3
19 (micrograms per cubic meter) and of a monthly averaging time. Additionally, they indicated that 20 they consider a loss of 1-2 points in intelligence quotient (IQ) at the 99.5th percentile of the 21 population to be highly significant from a public health perspective. CASAC also recommended 22 conducting future Pb monitoring with samplers for particulate matter less than ten microns in 23 size (PM10) rather than with samplers for total suspended particulate matter (TSP) (Henderson, 24 2007). 25 In consideration of CASAC’s comments on the pilot-scale assessment (Henderson, 26 2007), we considered a number of alternate approaches for the full-scale assessment. As a result, 27 several additions and modifications to the assessment design were implemented for the full-scale 28 assessment. The most significant of these modifications is the replacement of the near-roadway 29 case study with a general urban case study. This case study was designed to provide estimates of 30 risk in urban areas associated with broad population level exposures to different ambient air 31 levels of Pb. The general urban case study is assessed in addition to the two point source case 32 studies, and differs from those case studies in basing the estimate of air quality on monitoring 33 data (rather than on results from air quality modeling). The alternate NAAQS levels were
7 Consistent with the focus of this document on the human exposure and health risk assessment, CASAC comments regarding the ecological risk assessment and secondary standard considerations are not discussed here.
July 2007 1-6 Draft – Do Not Quote or Cite
1 selected to overlap with the range of levels suggested by CASAC. The target population and 2 endpoint for the assessment remains young children and risk of IQ decrements associated with 3 Pb exposure. To address CASAC comments on the cut-point employed in the pilot assessment 4 (Henderson, 2007), the blood Pb concentration response function was re-examined, and three 5 alternatives were included in the assessment. Additionally, in consideration of CASAC 6 recommendations regarding consideration of the geometric standard deviation used in the blood 7 Pb modeling, a range of values were included in the assessment for the general urban case study.
8 1.5 ORGANIZATION OF THE DOCUMENT 9 The remainder of this document is organized as follows. Chapter 2 describes the design
10 of the exposure and risk assessments, covering such topics as the conceptual model used in 11 designing the analysis (Section 2.1), the case studies included in the assessment (Section 2.2), the 12 air quality scenarios simulated in the assessment (Section 2.3), and an overview of the analytical 13 approach (Section 2.4). Chapter 3 describes the methods and results for the exposure 14 assessment, as well as the performance evaluation. Chapter 4 describes the methods for deriving 15 risk estimates, the resultant estimates, sensitivity analyses and a characterization of uncertainty.
July 2007 1-7 Draft – Do Not Quote or Cite
1 2
3 4
5 6
7
8 9
10 11
12 13
14
15 16
17
18 19
20
21 22
23 24
25
26 27
28 29
30
31 32
33 34
REFERENCES Centers for Disease Control (1991) Preventing lead poisoning in young children: a statement by the Centres for
Disease Control. Atlanta, GA: U.S. Department of health and Human Services, Public Health Service; October 1. http://wonder.cdc.gov/wonder/prevguid/p0000029/p0000029.asp
Centers for Disease Control and Prevention (2005) Preventing lead poisoning in young children: a statement by the Centers for Disease Control and Prevention. Atlanta, GA: U.S. Department of Health and Human Services, Public Health Service. August.
Henderson, R. (2006) Letter from Dr. Rogene Henderson, Chair, Clean Air Scientific Advisory Committee, to Administrator Stephen L. Johnson. Re: Clean Air Scientific Advisory Committee (CASAC) Lead Review Panel’s Consultation on EPA’s draft Analysis Plan for Human Health and Ecological Risk Assessment for the Review of the Lead National Ambient Air Quality Standards. July 26, 2006.
Henderson, R. (2007) Letter from Dr. Rogene Henderson, Chair, Clean Air Scientific Advisory Committee, to Administrator Stephen L. Johnson. Re: Clean Air Scientific Advisory Committee’s (CASAC) Review of the 1st Draft Lead Staff Paper and Draft Lead Exposure and Risk Assessments. March 27, 2007.
ICF International. (2006) Lead Human Exposure and Health Risk Assessments and Ecological Risk Assessment for Selected Areas. Pilot Phase. Draft Technical Report. Prepared for the U.S. EPA's Office of Air Quality Planning and Standards, Research Triangle Park, NC. December.
U.S. Environmental Protection Agency. (1990) Air Quality Criteria for Lead: Supplement to the 1986 Addendum. Research Triangle Park, NC: Office of Health and Environmental Assessment, Environmental Criteria and Assessment Office; report no. EPA/600/8-89/049F. Available from: NTIS, Springfield, VA; PB91-138420.
U.S. Environmental Protection Agency. (1990) Review of the National Ambient Air Quality Standards for Lead: Assessment of Scientific and Technical Information: OAQPS Staff Paper. Research Triangle Park, NC: Office of Air Quality Planning and Standards; report no. EPA-450/2-89/022. Available from: NTIS, Springfield, VA; PB91-206185. Available on the web: http://www.epa.gov/ttn/naaqs/standards/pb/data/rnaaqsl_asti.pdf
U.S. Environmental Protection Agency. (2006a) Air Quality Criteria for Lead. Washington, DC, EPA/600/R5/144aF. Available online at: www.epa.gov/ncea/
U.S. Environmental Protection Agency. (2006b). Review of the National Ambient Air Quality Standards for Lead: Policy Assessment of Scientific and Technical Information, OAQPS Staff Paper – First Draft. Office of Air Quality Planning and Standards, Research Triangle Park, NC.
U.S. Environmental Protection Agency. (2006c) Analysis Plan for Human Health and Ecological Risk Assessment for the Review of the Lead National Ambient Air Quality Standards. Office of Air Quality Planning and Standards, Research Triangle Park, NC. Available online at: http://www.epa.gov/ttn/naaqs/standards/pb/s_pb_cr_pd.html
July 2007 1-8 Draft – Do Not Quote or Cite
5
10
15
20
25
30
1 2 DESIGN OF EXPOSURE AND RISK ASSESSMENTS
2 The risk assessment design relies on the use of case studies. The types of case studies 3 included, as well as the analytical aspects of the assessment of each, reflect consideration of the 4 evidence presented in the CD, air quality analyses, and findings of the pilot assessment (Section
1.3), as well as comments received from CASAC (Section 1.4) and the public. 6 Drawing primarily from the CD, Section 2.1 provides background for the risk 7 assessment, with regard to key elements of Pb exposure and effects. The assessment scenarios 8 evaluated in the assessment are described in Section 2.2. Background information on the three 9 case studies is described in Section 2.3. Section 2.4 describes the analytical approach, with
attention to key analytical steps, and discussion of temporal and spatial aspects of the 11 assessment, as well as the categorization of policy-relevant exposure pathways, and the 12 uncertainty characterization.
13 2.1 BACKGROUND INFORMATION ON LEAD EXPOSURE AND RISK 14 As recognized in Section 1.1, there are a variety of complexities associated with the
assessment of air-related Pb exposure and risk. In this risk assessment, we have attempted to 16 focus effort on those aspects that are most important and feasible to address within our scope and 17 given the constraints of time, pertinent data, models, etc. With regard to some aspects, 18 simplifying assumptions have been implemented. The following subsections describe elements 19 of Pb exposure and effects pertinent to evaluating public health risks associated with Pb from
ambient air, and specify those that are explicitly addressed in this quantitative risk assessment. 21 This is summarized in Figure 2-1, with boxes outlined in bold indicating items included in the 22 quantitative risk assessment and sources and pathways for which ambient air has played a role 23 identified in bold text. 24
26 27 28 29
31 32 33 34
July 2007 2-1 Draft – Do Not Quote or Cite
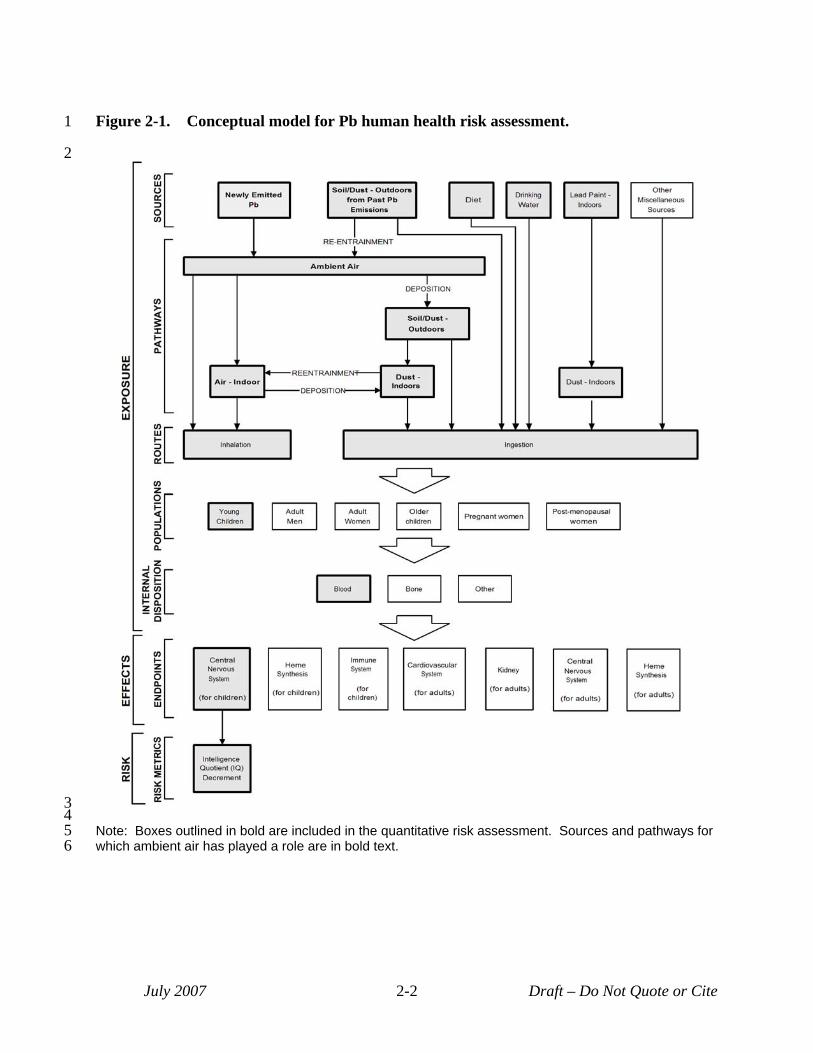
1 Figure 2-1. Conceptual model for Pb human health risk assessment.
2
34 5 Note: Boxes outlined in bold are included in the quantitative risk assessment. Sources and pathways for 6 which ambient air has played a role are in bold text.
July 2007 2-2 Draft – Do Not Quote or Cite
1 2 3 4 5 6 7 8 9
10 11 12 13 14 15 16 17 18 19 20 21 22 23 24 25 26 27 28 29 30 31 32 33 34 35
2.1.1 Sources, Pathways and Routes As described in Section 1.1, policy-relevant sources (in Figure 2-1 in bold type) – for the
purposes of this assessment - include both sources of new Pb emissions (e.g., from active stationary and mobile sources) and re-emission or resuspension of historically deposited Pb (e.g., near roadways or associated with now inactive, or now lower emitting stationary sources, as discussed in Appendix A, Section A.1.1.3).
There are more than 13,000 individual sources in the U.S. for which we have estimated Pb emissions to the air (Appendix A, Section A.1.2). Cumulatively, those sources, in addition to mobile sources and other sources not individually quantified, emit some 1600 tons per year (tpy) of Pb in the U.S. (Appendix A). The largest categories (in terms of aggregate national emissions) include mobile sources (specifically combustion of leaded general aviation fuel), boilers and process heaters, and metals processes, such as primary and secondary Pb smelting. Of these, metals processing industries are among the largest emitters of Pb, in terms of emissions from individual facilities (Appendix A, Section A.1). Another large category of Pb emissions, for which we do not have quantitative estimates in our national emissions inventory, is resuspension of recent and historically deposited Pb (Appendix A, Section A.1.1.3; CD, Section 2.3.3). Studies of emissions in southern California indicate that Pb in resuspended road dust may represent between 40% and 90% of Pb emissions in some areas (Appendix A, Section A.1.1.3). Resuspension is represented to differing degrees in the three case studies included in the risk assessment (Sections 2.2.1 and 2.2.2)
Lead in outdoor dust and soil may be derived from a range of sources including current and historical air emissions sources, as well as miscellaneous non-air sources (e.g., land disposal of wastes and subsequent weathering). These media may play a substantial role in human exposures, particularly for children (CD, Section 3.2). Additionally, Pb in house dust, which may be derived from Pb in outdoor dust and soil as well as from ambient air Pb (including previously deposited Pb resuspended into ambient air), is another source of children’s exposure (CD, Sections 3.2 and 4.4). For example, blood Pb levels in children have been shown to be particularly influenced by exposures to Pb in dust (e.g., Lanphear and Roghmann 1997; Lanphear et al., 1998). As described in the CD, such findings “and other studies of populations near active sources of air emissions (e.g., smelters), substantiate the effect of airborne Pb and resuspended soil Pb on interior dust and blood Pb” (CD, p. 8-22).
In addition to airborne emissions (recent or those in the past), sources of Pb to the environment or to human exposure included old leaded paint, Pb in drinking water and Pb in the diet (Figure 1-1). As mentioned in Section 1.1, Pb in the diet and that from drinking water may have air pathway-related (i.e., policy-relevant) contributions as well as contributions from
July 2007 2-3 Draft – Do Not Quote or Cite

1 2 3 4 5 6 7 8 9
10 11 12 13 14
15 16 17 18 19 20 21 22 23 24 25 26 27 28 29 30 31 32 33 34 35
policy-relevant background (e.g., Pb-solder on water distribution pipes and Pb in materials used in food processing). Limitations in our data and modeling tools have handicapped our ability to separate these contributions in the risk assessment, such that we have labeled diet and drinking water policy-relevant background. Consequently, these sources of Pb exposure are depicted in Figure 2-1 as policy-relevant background (in non-bold type), although this is not intended to convey any particular policy decision at this stage regarding the Pb standard. Policy-relevant pathways (bold text in Figure 2-1) include inhalation of newly or previously emitted Pb, ingestion of outdoor soil/dust containing previously deposited Pb, and ingestion of indoor dust containing newly or previously emitted Pb.
Human exposure to environmental Pb occurs predominantly via ingestion and inhalation routes, with ingestion (including incidental ingestion of dust and soil) recognized as generally playing a larger role for the general human population (CD, Section 4.5). The dermal route is relatively less well characterized but is not considered to play a large role in total Pb exposure (CD, Section 4.5), and is not included in this assessment (Figure 2-1).
2.1.2 At-risk Populations In considering populations for inclusion in the risk assessment, we considered evidence
regarding those with increased susceptibility (i.e., physiological factors contributing to a greater response for the same exposure), and those with increased exposure (including that resulting from behavior leading to increased contact with contaminated media). A behavioral factor of great impact on Pb exposure is the incidence of hand-to-mouth activity that is prevalent in very young children (CD, Section 4.4.3). Physiological factors include both conditions contributing to a subgroup’s increased risk of effects at a given blood Pb level, and those that contribute to blood Pb levels higher than those otherwise associated with a given Pb exposure (CD, Section 8.5.3). An additional population characterization for which evidence was considered was vulnerability to pollution-related effects which additionally encompasses situations of elevated exposure, such as residing in old housing with Pb-containing paint or near sources of ambient Pb, as well as socioeconomic factors, such as reduced access to health care or low socioeconomic status (SES) (USEPA, 2003, 2005) that can contribute to increased risk of adverse health effects from Pb.
Three particular physiological factors contributing to increased risk of Pb effects at a given blood Pb level are recognized in the CD (e.g., CD, Section 8.5.3): age, health status, and genetic composition. With regard to age, the susceptibility of young children to the neurodevelopmental effects of Pb is well recognized (e.g., CD, Sections 5.3, 6.2, 8.4, 8.5, 8.6.2), although the specific ages of vulnerability have not been established (CD, pp 6-60 to 6-64). Additionally, early childhood may also be a time of increased susceptibility for Pb
July 2007 2-4 Draft – Do Not Quote or Cite
1 2 3 4 5 6 7 8 9
10 11 12 13 14 15 16 17 18 19 20 21 22 23 24 25 26 27 28 29 30 31 32 33 34 35
immunotoxicity (CD, Sections 5.9.10, 6.8.3 and 8.4.6), and childhood exposures have been associated with increased risk of cardiovascular and neurodegenerative effects in adulthood (CD, p. 8-74). Health status is another physiological factor in that subpopulations with pre-existing health conditions may be more susceptible (as compared to the general population) for particular Pb-associated effects, with this being most clear for renal and cardiovascular outcomes. For example, African Americans, who, as a group, have a higher frequency of hypertension than the general population or other ethnic groups (NCHS, 2005) may face a greater risk of adverse health impact from Pb-associated cardiovascular effects. A third physiological factor relates to genetic polymorphisms. That is, subpopulations defined by particular genetic polymorphisms (e.g., presence of the δ-aminolevulinic acid dehydratase-2 [ALAD-2] allele) have also been recognized with regard to susceptibility to Pb toxicity, which may be due to increased susceptibility to the same internal dose and/or to increased internal dose associated with same exposure (CD, p. 8-71, Sections 6.3.5, 6.4.7.3 and 6.3.6).
Several physiological factors pertain to susceptibility by contributing to increased blood Pb levels (i.e., increased internal dose levels) over those otherwise associated with a given Pb exposure (CD, Section 8.5.3). These include nutritional status, which plays a role in Pb absorption from the GI tract (CD, Section 5.10.2.5); polymorphism for the vitamin D receptor, which studies suggest may contribute to increased Pb absorption from the GI tract (CD, Section 8.4.2.7); presence of the ALAD-2 allele, which studies suggest contribute to increased blood Pb levels (Section 8.5.3); and bone demineralization, such as occurs during pregnancy, lactation, and aging, which appears to influence Pb release from bone into the blood (CD, Section 4.3.2).
Further, differences in blood Pb levels among subpopulations living in the same area have also been identified that indicate an increased vulnerability to Pb exposure among some subgroups, perhaps related to SES (CD, pp. 3-26 and 8-13).
In summary, there are a variety of ways in which Pb exposed populations might be characterized and stratified for the purposes of health risk assessment. In recognition of the role of age or lifestage on exposure and susceptibility, this is used in identifying potential groups in Figure 2-1. In consideration of the health effects evidence regarding endpoints of greatest public health concern (see Section 2.1.4), young children have been selected as the priority population for this risk assessment (see Figure 2-1). As currently available data do not generally support quantitative modeling that differentiates blood Pb levels and associated health risk within a particular population group such as young children on the basis of enhanced or reduced susceptibility to Pb effects (e.g., concentration response functions for IQ loss that differentiate between populations that are calcium deficient and those that are not), the assessment does not develop separate risk estimates for such subpopulations of young children.
July 2007 2-5 Draft – Do Not Quote or Cite
1 2 3 4 5 6 7 8 9
10 11 12 13 14 15 16 17 18 19 20 21 22 23 24 25 26 27 28 29 30 31 32 33 34 35 36
2.1.3 Internal Disposition Once inhaled or ingested and absorbed into the blood stream, Pb is distributed throughout
the body via the blood, with bone being the predominant site of Pb accumulation and storage in the body. During childhood development, bone represents approximately 70% of a child’s body burden, and this accumulation continues through adulthood, when more than 90% of the total Pb body burden is stored in the bone (CD, Section 4.2.2). Accordingly, levels of Pb in bone are indicative of a person’s long-term, cumulative exposure to Pb. In contrast, blood Pb levels are usually indicative of recent exposures. Depending on exposure dynamics, however, blood Pb may – through its interaction with bone - be indicative of past exposure or of cumulative body burden (CD, Section 4.3.1.5).
Throughout life, Pb in the body is exchanged between blood and bone, and between blood and soft tissues (CD, Section 4.3.2), with variation in these exchanges reflecting “duration and intensity of the exposure, age and various physiological variables” (CD, p. 4-1). For example, resorption of bone (e.g., in pregnant or nursing women, or associated with osteoporosis in postmenopausal women), results in a mobilization of Pb from bone into circulation (CD, Sections 4.3.2.4 and 4.3.2.5). Past exposures that contribute Pb to the bone, consequently, may influence current levels of Pb in blood. Where past exposures were elevated in comparison to recent exposures, this influence may complicate interpretations with regard to recent exposure (CD, Sections 4.3.1.4 to 4.3.1.6). That is, higher blood Pb concentrations are not always indicative of higher body burdens or cumulative exposure, but they are generally indicative of higher exposures or Pb uptake over a somewhat recent past (CD, pp. 4-34 and 4-133). For example, response of the blood to reduction of a relatively brief Pb exposure appears to be faster than for an exposure of several years, with estimated half-lives of approximately 9 months as compared to 30 months for the longer exposure response (CD, pp. 4-25 to 4-26).
Bone measurements, as a result of the generally slower Pb turnover in bone, are recognized as providing a better measure of cumulative Pb exposure (CD, Section 8.3.2). The bone pool of Pb in children, however, is thought to be much more labile than that in adults due to the more rapid turnover of bone mineral as a result of growth (CD, p. 4-27). As a result, “changes in blood Pb concentration in children are thought to more closely parallel changes in total body burden” (CD, p. 4-27). This is in contrast to adults, whose bone has accumulated decades of Pb exposures (with past exposures often greater than current ones), and for whom the bone may be a significant source long after exposure has ended (CD, Section 4.3.2.5).
Given the association with recent exposure and the relative ease of collection, blood Pb levels are extensively used as an index or biomarker of exposure by national and international health agencies (CD, Section 4.3.1.5). Although recent methods are making bone Pb measurements easier to collect (CD, Section 4.3.2.2), epidemiological and toxicological studies
July 2007 2-6 Draft – Do Not Quote or Cite
1 2 3 4 5 6 7 8 9
10 11 12 13 14 15
16 17 18 19 20
21
22
23
24
25
26
27 28 29 30 31 32 33 34
of Pb health effects and dose-response relationships tend to be dominated by blood Pb as the exposure metric (CD, Sections 4.3.1.3, 8.3.2 and Chapter 5).
Accordingly, blood Pb level is the index of exposure or exposure metric in this risk assessment. The use of concentration-response functions that rely on blood Pb (e.g., rather than ambient Pb concentration) as the exposure metric reduces uncertainty in the causality aspects of Pb risk estimates, however the relationship between specific sources and pathways of exposure and blood Pb level is needed in order to identify the specific risk contributions associated with those sources and pathways of greatest interest to this assessment (i.e., those related to Pb emitted into the air). For example, the blood Pb-response relationships developed in epidemiological (or toxicological) studies do not distinguish among different sources of Pb (e.g., inhalation, ingestion of dust, ingestion of dust containing leaded paint). In this assessment, models that estimate blood Pb levels associated with Pb exposure are used to inform estimates of contributions to blood Pb arising from ambient air related Pb versus contributions from other sources. We have employed two such models from the peer reviewed literature in the risk assessment (Sections 3.2, 3.5 and 4.3.2, and Appendices H and J).
2.1.4 Health Endpoints Lead has been demonstrated to exert “a broad array of deleterious effects on multiple
organ systems via widely diverse mechanisms of action” (CD, p. 8-24). This array of health effects and the evidence associated with each effect is comprehensively described in the CD, and includes
• Heme biosynthesis and related functions;
• Neurological development and function;
• Reproduction and physical development;
• Kidney function;
• Cardiovascular function; and,
• Immune function.
There is also some evidence of Pb carcinogenicity, primarily from animal studies, with limited human evidence of suggestive associations (CD, Sections 5.6.2, 6.7, and 8.4.10).
This review is focused on those effects most pertinent to ambient exposures. Given the reductions in ambient Pb levels over the past 30 years, these effects are generally those associated with the lowest Pb levels of exposure. These are neurological, hematological and immune effects for children, and neurological, hematological, cardiovascular and renal effects for adults (CD, Tables 8-5 and 8-6), with neurological effects in children and cardiovascular effects in adults appearing to be of greatest public health concern (CD, p. 8-60). The
July 2007 2-7 Draft – Do Not Quote or Cite
1 2 3 4 5 6 7 8 9
10 11 12 13 14 15 16 17 18 19 20 21 22 23 24 25 26 27
28 29 30 31 32 33 34 35
toxicological and epidemiological information available since the time of the last review “includes assessment of new evidence substantiating risks of deleterious effects on certain health endpoints being induced by distinctly lower than previously demonstrated Pb exposures indexed by blood Pb levels extending well below 10 μg/dL in children and/or adults” (CD, p. 8-25). The CD indicates some health effects associated with blood Pb levels that extend below 5 µg/dL, with some studies observing these effects at the lowest blood levels considered (i.e., threshold levels for these effects cannot be discerned from the currently available studies).
While the other endpoints identified above are important for this review and are discussed briefly in sections below, the health endpoint included for quantitative health risk assessment in this review is developmental neurotoxicity in children, with IQ decrement as the risk metric (Figure 2-1). Among the wide variety of health endpoints associated with Pb exposures, there is consensus that the developing nervous system in young children is the most sensitive and that neurobehavioral deficits, including IQ decrements, appear to occur at lower levels than previously believed (i.e., at levels <10 μg/dL and possibly <5 μg/dL). For example, the overall weight of the available evidence, described in the CD, provides clear substantiation of neurocognitive decrements being associated in young children with blood Pb levels in the range of 5 to 10 μg/dL, and some analyses appear to show Pb effects on intellectual attainment of young children ranging from 2 to 8 μg/dL (CD, Sections 6.2, 8.4.2 and 8.4.2.6). That is, while blood Pb levels in U.S. children ages one to five years have decreased notably since the late 1970s, newer studies have investigated and reported associations of effects on the neurodevelopment of children with these more recent blood Pb levels (CD, Chapter 6).
The evidence for neurotoxic effects in children is a combination of epidemiological and toxicological evidence (CD, Sections 5.3, 6.2 and 8.5). The epidemiological evidence is strongly supported by animal studies that substantiate the biological plausibility of the associations, and provides an understanding of mechanisms of action for the effects (CD, Section 8.4.2). The selection of children’s IQ for this risk assessment, thus, reflects consideration for evidence presented in the CD as well as advice received from CASAC (Henderson, 2006, 2007).
2.1.4.1 Developing Nervous System The nervous system has long been recognized as a target of Pb toxicity, with the
developing nervous system affected at lower exposures than the mature system (CD, Sections 5.3, 6.2.1, 6.2.2, and 8.4). Functional manifestations of Pb neurotoxicity during childhood include sensory, motor, cognitive and behavioral impacts. Numerous epidemiological studies have reported neurocognitive, neurobehavioral, sensory, and motor function effects in children at blood Pb levels below 10 μg/dL (CD, Section 6.2). Studies with laboratory animals (discussed in Section 5.3 of the CD) provide strong evidence for the role of Pb in producing these effects.
July 2007 2-8 Draft – Do Not Quote or Cite
1 2 3 4 5 6 7 8 9
10 11 12 13 14 15 16 17 18 19 20 21 22 23 24 25 26 27 28 29 30 31 32 33
Cognitive effects associated with Pb exposures that have been observed in epidemiological studies have included decrements in intelligence test results, such as the widely used IQ score, and in academic achievement as assessed by various standardardized tests as well as by class ranking and graduation rates (CD, Section 6.2.16 and pp 8-29 to 8-30). Other cognitive effects observed in studies of children have included effects on attention, executive functions, language, memory, learning and visuospatial processing (CD, Sections 5.3.5, 6.2.5 and 8.4.2.1). Further, Pb-induced deficits observed in animal and epidemiological studies, for the most part, have been found to be persistent in the absence of markedly reduced environmental exposures (CD, Sections 5.3.5, 6.2.11, and 8.5.2). Limited animal evidence indicates that environmental enrichment during development may potentially reverse these deficits.
Other neurological effects associated with Pb exposures (e.g., blood Pb levels near or below 10 µg/dL) include behavioral effects, such as delinquent behavior (CD, Sections 6.2.6 and 8.4.2.2), sensory effects, such as those related to hearing and vision (CD, Sections 6.2.7, 7.4.2.3 and 8.4.2.3), and deficits in neuromotor function (CD, p. 8-36).
Neurocognitive impact, specifically decrement in IQ in young children, is a focus of this quantitative risk assessment due to the strength of evidence for association with blood Pb levels below 10 μg/dL, and the strength of the dose-response information at these exposure levels.
As discussed in the CD (Section 8.4.2) and by Rice (1996), while there is no direct animal test parallel to human IQ tests, “in animals a wide variety of tests that assess attention, learning, and memory suggest that Pb exposure {of animals} results in a global deficit in functioning, just as it is indicated by decrements in IQ scores in children” (CD, p. 8-27). The animal and epidemiological evidence for this endpoint are consistent and complementary (CD, p. 8-44). Further, “epidemiologic studies of Pb and child development have demonstrated inverse associations between blood Pb concentrations and children’s IQ and other outcomes at successively lower Pb exposure levels” over the past 30 years (CD, p. 6-64). This is supported by multiple studies performed over the past 15 years (see CD, Section 6.2.13), with particularly compelling evidence for decrements in IQ at blood Pb levels below 10 μg/dL provided by a recent international pooled analysis of seven prospective studies (Lanphear et al., 2005; CD, Section 6.2.13). For example, this pooled analysis estimated a decline of 6.2 points (with a 95% confidence interval bounded by 3.8 and 8.6) in full scale IQ occurring between approximately 1 and 10 μg/dL blood Pb level, measured concurrent with the IQ test (CD, p. 6-76). This analysis (Lanphear et al., 2005) is relied upon in the quantitative risk assessment for this endpoint discussed in Chapter 4.
July 2007 2-9 Draft – Do Not Quote or Cite
1 2 3 4 5 6 7 8 9
10 11 12 13 14 15 16 17 18 19 20 21 22 23 24
25 26 27 28 29 30 31 32 33 34 35
2.1.4.2 Adult Nervous System The nervous system has long been recognized as a target of Pb toxicity (CD Sections
5.3.1, 8.4.2). For example, those chronically exposed in the workplace are at risk for various neurological effects including peripheral sensory nerve impairment, visuomotor and memory impairment, and postural sway abnormalities, with a blood Pb concentration >14 μg/dL being a possible threshold (CD, p. 6-87). Past occupational exposure also increases the risk of developing amyotrophic lateral sclerosis (ALS) and motor neuron disease (CD, Section 6.3.5 and p. 6-87). Essential tremor is also associated with Pb exposures, particularly for those with genetic susceptibility (CD, Sections 6.3.5 and 6.3.6 and p. 6-86).
In elderly populations, significant associations have been reported between bone Pb levels and impaired cognitive performance or dysfunction (CD, Section 6.3.3 and 6.3.3.1), but not with blood Pb levels, perhaps indicating a role of cumulative and/or past Pb exposures (CD, p. 6-83). During demineralization of bone in the elderly, Pb may be released into the blood, thus augmenting blood Pb associated with current ambient exposures (CD, Section 4.3.2.4). An increased susceptibility among the elderly to Pb effects on cognitive function is supported by animal evidence (Section 5.3.7). With lifetime exposure, senescent animals have exhibited an increased susceptibility to Pb, due to the increased exposure from bone resorption, and an apparently greater sensitivity to the biochemical effects of Pb (CD, Section 5.3.7). Laboratory animal research in rats and monkeys also indicates a potential for cognitive function effects in the elderly to be related to physiological effects (regulation of protein thought to play a role in Alzheimer’s disease) of Pb exposures in early childhood (CD, p. 5-67; Basha et al., 2006). Thus, early life exposure to Pb may contribute to neurocognitive effects later in life due to the redistribution of Pb body burden from bone to brain and by enhanced susceptibility caused by age-related degenerative changes in various organs, including brain (CD, p. 8-40).
2.1.4.3 Cardiovascular System Epidemiologic and experimental toxicology studies support the relationship between Pb
exposure and increased adverse cardiovascular outcome, including increased blood pressure, increased incidence of hypertension, and cardiovascular morbidity and mortality (CD, Sections 5.5, 6.5 and 8.4.3). The cardiovascular effect most frequently examined in epidemiological studies is increased systolic blood pressure in adults, which has been repeatedly associated with Pb exposure (CD, Sections 8.4.3, 8.6.3, 6.5.2.3, and 6.5.7). The association has been observed with Pb levels in bone and also, in some cohorts, with Pb in blood (including blood Pb levels below 10 μg/dL). This epidemiological evidence is supported by evidence in numerous animal studies of arterial hypertension with low Pb exposures, an effect that persists in animals long after cessation of exposure (CD, Sections 5.5 and 8.4.3).
July 2007 2-10 Draft – Do Not Quote or Cite
1 2 3 4 5 6 7 8 9
10 11 12 13 14 15 16
17 18 19 20 21 22 23 24 25 26 27 28 29 30 31 32 33 34
Multiple studies reporting positive associations of blood pressure and hypertension with bone Pb levels highlight the important role of cumulative past Pb exposure in development of cardiovascular health effects (Sections 6.5.2.3 and 6.5.7). A study of young adults who lived as children in an area of high Pb exposures also indicates the potential role of childhood exposure. In this study, higher bone Pb levels were associated with higher systolic and diastolic blood pressure (CD, p. 6-138), while current blood Pb levels (mean of 2.2 μg/dL) were not (CD, p. 6124).
Systolic blood pressure exerts a strong influence on more serious cardiovascular events by its role in hypertension and its adverse cardiovascular sequelae (CD, p. 8-83). Several analyses of National Health and Nutrition Examination Survey (NHANES) cohorts, including some recently released, have collectively suggested a “significant effect of Pb on cardiovascular mortality in the general U.S. population” (CD, p. 8-88, Sections 6.5.3.2 and 8.6.3). For example recent analyses of NHANES blood Pb data from 1976 to 1980 and 1988 to 1994 provide supportive evidence for an increased risk of cardiovascular mortality, consistent with projected likely increases in serious cardiovascular events (stroke, heart attack) resulting from Pb-induced increases in blood pressure (CD, Section 8.6.3).
2.1.4.4 Renal System Lead nephrotoxicity is mediated by alterations in the glomerular filtration rate (CD,
Sections 5.7.3 and 8.4.5). The interaction of Pb with the kidney, including occurrences and mechanisms of Pb uptake by and accumulation in the kidney, and associated cellular alterations, is well described in animal research (CD, Section 5.7). A set of screening tests involving markers of nephrotoxic effects have been established for screening individuals exposed to Pb occupationally or environmentally (CD, Section 5.7.1). In the epidemiological literature, associations between blood Pb and indicators of renal function impairment (e.g., measures of glomerular integrity, such as creatinine levels in urine) have been found at blood Pb levels extending below 10 μg/dL, to as low as ~2 to 4 μg/dL (CD, Sections 6.4.4.1.5 and 8.4.5). Associations are also observed with cumulative Pb dose, assessed via bone Pb, and longitudinal renal function decline (CD, p. 6-94), indicating the potential role of earlier exposures.
The findings regarding Pb exposures and renal effects are of particular concern with regard to certain susceptible subpopulations. At levels of exposure in the general U.S. population overall, Pb combined with other risk factors, such as diabetes, hypertension, or chronic renal insufficiency from non-Pb related causes, can result in clinically relevant effects. Notably, the size of such susceptible populations is increasing in the United States due to obesity (CD, p. 6-113). That is, Pb is recognized as acting cumulatively with other renal risk factors to
July 2007 2-11 Draft – Do Not Quote or Cite
1 2
3 4 5 6 7 8 9
10 11 12 13 14 15 16 17
18 19 20 21 22 23 24 25 26 27 28 29 30 31 32 33 34
cause early onset of renal insufficiency and/or a steeper rate of renal function decline in individuals already at risk for renal disease (CD, p. 6-107).
2.1.4.5 Heme Synthesis It has long been recognized that Pb exposure is associated with disruption of heme
synthesis in both children and adults. At blood Pb levels above 30 μg/dL, such disruption leads to notable reductions in hemoglobin synthesis, and, at blood Pb levels above 40 μg/dL, to frank anemia, a clinical sign of severe Pb poisoning (CD, p. 8-47). The evidence regarding effects on heme synthesis and other hematological parameters in animal and humans is strong, and includes documented quantitative relationships between exposure and effects in children and adults. Interference with heme synthesis was identified as one of the targets of low-level Pb toxicity in children during the time of the last NAAQS review (USEPA, 1990), and was the primary basis for the initial setting of the Pb NAAQS in 1978 (USEPA, 1978).
Mechanisms associated with Pb interference with heme synthesis include inhibition of the enzymes ALAD and ferrochelatase (CD Sections 5.2.1, 6.9.1, 6.9.2). Inhibition of ALAD has been associated with increased blood Pb concentrations across the range of 5 to 150 μg/dL. The evidence, including that on associated mechanisms, is presented and discussed in detail in the CD (Sections 8.4.4, 5.2.1, 6.9.1 and 6.9.2).
2.1.4.6 Immune System Since the time of the last review, there has been substantial research on the
immunotoxicity of Pb. As summarized in the CD, “studies across humans and a variety of animal models are in general agreement concerning both the nature of the immunotoxicity induced by Pb as well as the exposure conditions that are required to produce immunomodulation” (CD, p. 5-244, Section 5.9). Lead is distinguished from other immunotoxicants, however, by the fact that the most sensitive biomarkers of its immunotoxicity are associated with specific functional capacities that influence risk of disease, as opposed to being associated with changes in immune cell numbers or pathological changes of lymphatic system organs (CD, Section 5.9.1). The main immune system targets of Pb are macrophages and T lymphocytes, leading to a potential for increased tissue inflammation, reduced cell-mediated immunity, and increased risk of autoimmunity (See CD, Figure 5-18, Section 5.9.11). Additionally, Pb exposures in both animal and human studies are associated with increased production of IgE, an immunoglobulin involved in allergic responses and asthma (CD, Section 5.9.3.2). These effects have been reported in epidemiologic studies of children, and supported by evidence in neonatal/juvenile animals, at blood Pb levels extending below 10 μg/dL (CD, p. 6-197 and Sections 5.9.10 and 8.4.6).
July 2007 2-12 Draft – Do Not Quote or Cite
1 2.1.5 Risk Metric and Model for Risk Quantitation 2 The epidemiological studies that have investigated blood Pb effects on IQ (see CD, 3 Section 6.2.3) have considered a variety of specific blood Pb metrics, including: 1) blood 4 concentration “concurrent” with the response assessment (e.g., at the time of IQ testing), 2) 5 average blood concentration over the “lifetime” of the child at the time of response assessment 6 (e.g., average of measurements taken over child’s first 6 or 7 years), 3) peak blood concentration 7 during a particular age range and 4) early childhood blood concentration (e.g., the mean of 8 measurements between 6 and 24 months age). All four specific blood Pb metrics have been 9 correlated with IQ (see CD, p. 6-62; Lanphear et al., 2005). In the international pooled analysis
10 by Lanphear and others (2005), however, the concurrent and lifetime averaged measurements 11 were considered “stronger predictors of lead-associated intellectual deficits than was maximal 12 measured (peak) or early childhood blood lead concentrations,” with the concurrent blood Pb 13 level exhibiting the strongest relationship (CD, p. 6-29). 14 Using concurrent blood Pb level as the exposure metric and IQ as the response from the 15 pooled dataset of seven international studies, Lanphear and others (2005) employed 16 mathematical models of various forms, including linear, cubic spline, the log-linear, and piece17 wise linear, in their investigation of the blood Pb concentration-response relationship (CD, p. 618 29; Lanphear et al., 2005). They observed that the shape of the concentration-response 19 relationship is nonlinear and the log-linear model provides a better fit for the data than a linear 20 one (CD, p. 6-29 and pp. 6-67 to 6-70; Lanphear et al., 2005). In addition, they found that no 21 individual study among the seven drove the results (CD p. 6-30). Others have also analyzed the 22 same dataset and similarly concluded that, within the ranges of the dataset’s blood Pb levels, a 23 log-linear relationship was a significantly better fit than the linear relationship (p=0.009) with 24 little evidence of residual confounding from included model variables (CD, Section 6.2.13; 25 Rothenberg and Rothenberg, 2005). 26 A nonlinear blood Pb concentration-response relationship is also suggested by several 27 other studies that have observed that each μg/dL increase in blood Pb may have a greater effect 28 on IQ at blood Pb levels below 10 μg/dL than at higher levels (CD, pp. 8-63 to 8-64). While this 29 may at first seem at odds with certain fundamental toxicological concepts, a number of examples 30 of non- or supra-linear dose-response relationships exist in toxicology (CD, pp. 6-76 and 8-83 to 31 8-39). 1 With regard to the effects of Pb on neurodevelopmental outcome such as IQ, the CD 32 suggests that initial neurodevelopmental effects at lower Pb levels may be disrupting very 33 different biological mechanisms (e.g., early developmental processes in the central nervous
1 Similarly, a nonlinear concentration-response relationship was observed for the relationship between blood Pb levels and blood pressure in adults (CD, pp. 8-83 to 8-89).
July 2007 2-13 Draft – Do Not Quote or Cite
1 2 3 4 5 6 7 8 9
10 11 12 13 14 15 16 17 18 19 20 21 22 23 24 25 26 27 28 29 30 31 32 33 34 35 36
system) than more severe effects of high exposures that result in symptomatic Pb poisoning and frank mental retardation (CD, p. 6-76). In comparing across the individual studies and the pooled analysis, it is observed that at higher blood Pb levels, the slopes derived for log-linear and linear models are almost identical, and for studies with lower blood Pb levels, the slopes appear to be steeper than those observed in studies involving higher blood Pb levels (CD, p. 8-78, Figure 8-7).
Given the evidence summarized here and described in detail in the CD (Chapters 6 and 8), and consistent with CASAC recommendations (Henderson, 2006, 2007), the risk assessment relies on the log-linear functions presented by Lanphear and others (2005) that relate absolute IQ as a function of the log of concurrent blood Pb, and lifetime average blood Pb, respectively. As discussed above, the slope of the concentration-response relationship described by these functions is greater at the lower blood Pb levels (e.g., less than 10 μg/dL). The impact of the nonlinear slope is illustrated by the estimated IQ decrements associated with increases in blood IQ for different ranges of blood Pb level. The IQ changes were 3.9 (with 95% confidence interval, CI, of 2.4-5.3), 1.9 (95% CI, 1.2-2.6) and 1.1 (95% CI, 0.7-1.5), for increases in concurrent blood Pb from 2.4 to 10 μg/dL, 10 to 20 μg/dL, and 20 to 30 μg/dL, respectively (Lanphear et al., 2005). On a change in IQ per μg/dL basis, estimates of IQ decrement associated with blood Pb levels below 10 μg/dL (using the concurrent, 24-month, peak, lifetime average or lifetime cumulative blood Pb metric) range from -0.4 to -1.8 (CD, Table 8.7). The pooled analysis by Lanphear and others (2005) also estimated the slope for a linear function of IQ change associated with concurrent blood Pb for the subset of the children in the pooled data set for which maximal or peak blood Pb levels were below 7.5 μg/dL (103 of 1333 children). The slope for this subset (primarily composed of children from the Rochester cohort) was -2.94, compared to a slope of -0.16 for the remainder of the children with maximal blood Pb levels at or above 7.6 μg/dL.
As discussed in the CD, threshold blood Pb levels for these effects cannot be discerned from the currently available epidemiological studies, and the evidence in the animal Pb neurotoxicity literature does not define a threshold for any of the toxic mechanisms of Pb (CD, Sections 5.3.7 and 6.2). In applying the relationship observed with the pooled analysis (Lanphear et al., 2005) to this risk assessment, which includes blood Pb levels below the range represented by the pooled analysis, three alternative blood Pb concentration-response models were employed for each of the two blood metrics used (see Section 4.1.1). The first model (loglinear function with low-exposure linearization) applies the nonlinear relationship down to the blood Pb concentration representing the lower bound of blood Pb levels for that blood metric in the pooled analysis and applies the slope of the tangent at that point to blood Pb concentrations estimated in the risk assessment to fall below that level. The second model (log-linear function
July 2007 2-14 Draft – Do Not Quote or Cite
1 with cutpoint) also applies the nonlinear relationship at blood Pb concentrations above the lower 2 bound of blood Pb concentrations in the pooled analysis dataset for that blood metric, but then 3 applies zero risk to all lower blood Pb concentrations estimated in the risk assessment. The third 4 model (two-piece linear function) applies a two-piece linear model derived from the log-linear 5 function to all blood Pb concentrations estimated in the risk assessment. All three of these 6 alternate models are used in the risk assessment in recognition of the reduced confidence in our 7 ability to characterize the quantitative blood Pb concentration-response relationship at the lowest 8 blood Pb levels represented in the recent epidemiological studies, as well as the possibility of a 9 threshold at or below these levels.
10 2.2 USE OF CASE STUDIES AND LOCATION SELECTIONS 11 Consistent with risk assessment performed during the prior Pb NAAQS review and for 12 the pilot phase assessment, this risk assessment relies on a case study approach. This approach is 13 intended to provide a framework for considering the nature and magnitude of air-sourced Pb 14 exposures and associated risk to human health, and for comparing the impact of alternate 15 NAAQS on them. 16 With consideration of CASAC comments on the pilot phase assessment (see Section 1.4), 17 the design for the full-scale assessment expanded from the pilot assessment by replacing the 18 urban near-roadway case study with a general, non-location-specific, case study focused on 19 population exposures in urban areas (Section 2.2.1), while retaining the two stationary source 20 case studies (Sections 2.2.2.1 and 2.2.2.2). The point source case studies are intended to 21 illustrate risks associated with Pb near point sources of significant impact on an individual basis, 22 while the general urban case study is intended to illustrate the potential for more widespread 23 risks, due to the large populations in urban areas. Background information for all three case 24 studies is presented in appendices A and B, and briefly summarized in Sections 2.2.1 and 2.2.2, 25 below.
26 2.2.1 Urban Case Study 27 In consideration of CASAC comments on the pilot assessment (Henderson, 2007), a 28 general urban case study is included in the assessment. This case study is designed to provide 29 estimates of risk associated with the current and alternate NAAQS in urban areas, as well as with 30 current conditions. This case study differs from the point source case studies in several ways. 31 First it is not based on a specific location. Rather, it is designed to generally represent large 32 urban areas in the U.S.2 Second, as discussed further in subsequent sections (e.g., Sections 2.4.2
2 While the air monitoring data used to characterize the current conditions scenario for this case study area are from large urban areas, other empirical datasets used in developing this case study, such as those for outdoor
July 2007 2-15 Draft – Do Not Quote or Cite
1 and 3.1.1), the media concentrations are assumed to be spatially uniform throughout the case 2 study area (i.e., spatial variation within the area is not considered). Third, the ambient air quality 3 for this case study is specified, based on analyses of Pb levels in large urban areas of the U.S. 4 (Appendix A and Section 2.3.1), rather than derived from air quality modeling of particular air 5 Pb sources. As a result of this third difference, this case study includes different types of 6 uncertainties as compared to the case studies employing air quality models, and it does not 7 distinguish among the different air Pb sources influencing the air concentrations, be they 8 currently active stationary or mobile sources, or resuspension of previously deposited Pb. 9 Fourth, the case study does not rely on any specific demographic values; that is, a theoretical
10 population of unspecified size is assumed to be uniformly distributed across the study area. All 11 of these distinctions of this case study from the others have produced a platform that is a 12 simplified representation of urban areas, intended to inform our assessment of the impact of 13 changes in ambient Pb concentrations on risk.
14 2.2.2 Point Source Case Studies 15 Based on the Analysis Plan (USEPA, 2006a) and conclusions from the pilot phase risk 16 assessment (USEPA, 2006; ICF, 2006b), the point source case studies for this full-scale 17 assessment include a study area near a primary Pb smelter, and a second near another, smaller 18 but still significant, stationary Pb source. The locations for these two case studies were chosen 19 with consideration of factors described in the Analysis Plan: (a) availability of site-specific 20 monitoring data for ambient air Pb, (b) availability of measurement data for other environmental 21 media (soil and indoor dust) and for Pb exposure (i.e., blood Pb levels), and (c) demographic and 22 socioeconomic factors related to Pb exposure and risk (USEPA 2006a). 23 Both of these case studies rely on air quality modeling to estimate air Pb concentrations 24 used in the risk assessment and as a result they include different types of uncertainties as 25 compared to those associated with the air concentrations for the general urban case study. One 26 of these is related to the representation of resuspension of previously deposited Pb as a source of 27 Pb to ambient air. To the extent that emissions estimates are available for this source, this is 28 represented in these case studies. However, as recognized in Section 2.1.1 and Appendix A, 29 Section A.1.1.3, such emissions estimates are often uncertain or unavailable. Some resuspension
residential soil Pb and indoor dust Pb, are generally representative of U.S. residential properties (see Sections 3.1.1.1, 3.1.3.1 and 3.1.4.1). As most U.S. residential properties are in large urban areas because that is where a significant share of the U.S. population resides, these datasets will include greater representation by urban areas, particularly large ones, than non-urban areas. However,these datasets are not limited to urban locations.
July 2007 2-16 Draft – Do Not Quote or Cite
1 sources are included in the primary Pb smelter case study, however no such sources are explicitly 2 modeled in the secondary Pb smelter case study. 3 Background information for these case studies is briefly summarized below with regard 4 to: (a) population characteristics, (b) reported emissions, (c) ambient air Pb levels, and (d) the 5 availability of site-specific data characterizing levels of Pb in key media and Pb exposures (e.g., 6 soil, blood Pb level data).
7 2.2.2.1 Primary Pb Smelter Case Study 8 The primary Pb smelter case study is focused on the currently operating facility in the 9 U.S., which is located in Herculaneum, Missouri. At primary Pb smelters, Pb-bearing ore
10 concentrates are smelted to produce Pb metal. This smelter is one of the largest individual 11 sources of Pb metal in the U.S., has been active for over a century and there exist a large amount 12 of site-specific data in the surrounding area characterizing both media concentrations (soil, 13 indoor dust, outdoor air) and population blood Pb levels (Appendix B, Section B.1). 14 The facility’s century of operation has contributed to Pb contamination of the area 15 surrounding the facility3, which has triggered various remediation activities (e.g., removal of Pb16 contaminated residential soil) as well as enlargement of the facility property to encompass many 17 of the most heavily impacted private properties. The remediation activity introduces a 18 complication to the risk modeling, especially aspects involving characterization of the 19 relationship of ambient air Pb and residential soil Pb to indoor dust Pb (see Section 3.1.4). 20 Some key aspects of the background information for this case study (Appendix B) are 21 summarized briefly in Table 2-1.
3 Portions of this study area comprise an active Superfund site and are subject to ongoing evaluation under the Superfund program administered by the Office of Solid Waste and Emergency Response. Methods used in conducting the human health exposure and risk assessment for the pilot analysis have been selected to address policy questions relevant to the Pb NAAQS review and consequently may differ from those used by the Superfund program.
July 2007 2-17 Draft – Do Not Quote or Cite
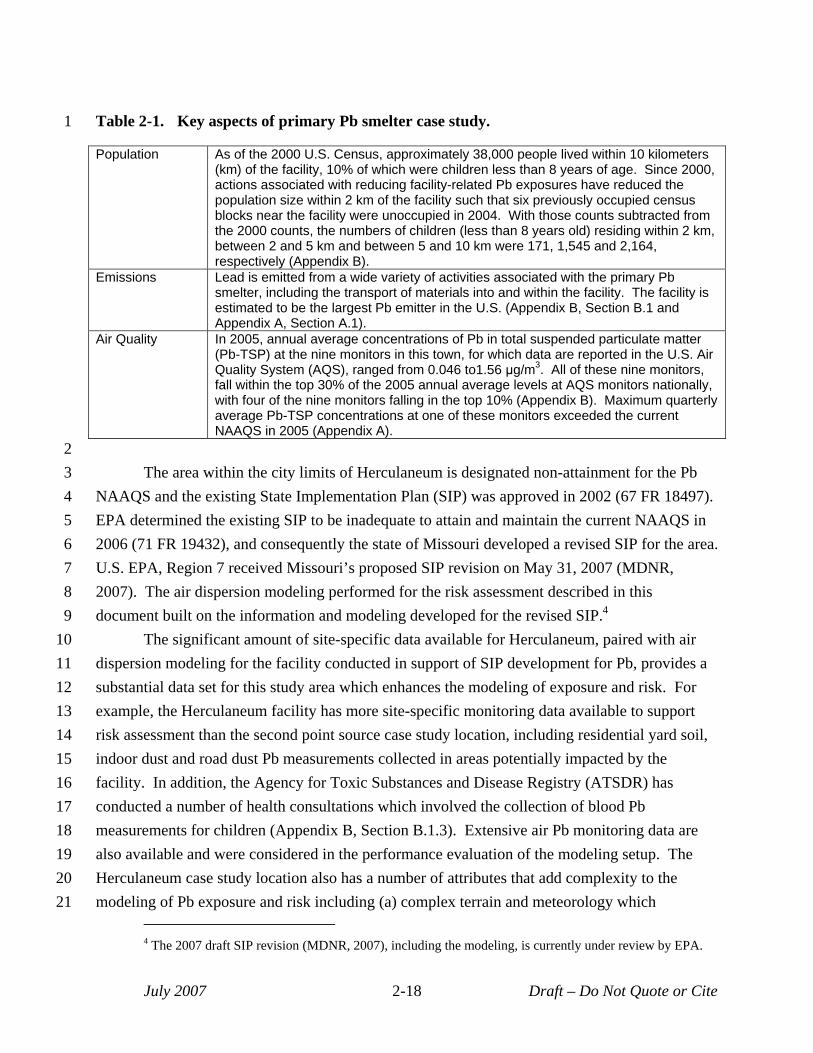
1 Table 2-1. Key aspects of primary Pb smelter case study.
Population As of the 2000 U.S. Census, approximately 38,000 people lived within 10 kilometers (km) of the facility, 10% of which were children less than 8 years of age. Since 2000, actions associated with reducing facility-related Pb exposures have reduced the population size within 2 km of the facility such that six previously occupied census blocks near the facility were unoccupied in 2004. With those counts subtracted from the 2000 counts, the numbers of children (less than 8 years old) residing within 2 km, between 2 and 5 km and between 5 and 10 km were 171, 1,545 and 2,164, respectively (Appendix B).
Emissions Lead is emitted from a wide variety of activities associated with the primary Pb smelter, including the transport of materials into and within the facility. The facility is estimated to be the largest Pb emitter in the U.S. (Appendix B, Section B.1 and Appendix A, Section A.1).
Air Quality In 2005, annual average concentrations of Pb in total suspended particulate matter (Pb-TSP) at the nine monitors in this town, for which data are reported in the U.S. Air Quality System (AQS), ranged from 0.046 to1.56 μg/m3 . All of these nine monitors, fall within the top 30% of the 2005 annual average levels at AQS monitors nationally, with four of the nine monitors falling in the top 10% (Appendix B). Maximum quarterly average Pb-TSP concentrations at one of these monitors exceeded the current NAAQS in 2005 (Appendix A).
2 3 The area within the city limits of Herculaneum is designated non-attainment for the Pb 4 NAAQS and the existing State Implementation Plan (SIP) was approved in 2002 (67 FR 18497). 5 EPA determined the existing SIP to be inadequate to attain and maintain the current NAAQS in 6 2006 (71 FR 19432), and consequently the state of Missouri developed a revised SIP for the area. 7 U.S. EPA, Region 7 received Missouri’s proposed SIP revision on May 31, 2007 (MDNR, 8 2007). The air dispersion modeling performed for the risk assessment described in this 9 document built on the information and modeling developed for the revised SIP.4
10 The significant amount of site-specific data available for Herculaneum, paired with air 11 dispersion modeling for the facility conducted in support of SIP development for Pb, provides a 12 substantial data set for this study area which enhances the modeling of exposure and risk. For 13 example, the Herculaneum facility has more site-specific monitoring data available to support 14 risk assessment than the second point source case study location, including residential yard soil, 15 indoor dust and road dust Pb measurements collected in areas potentially impacted by the 16 facility. In addition, the Agency for Toxic Substances and Disease Registry (ATSDR) has 17 conducted a number of health consultations which involved the collection of blood Pb 18 measurements for children (Appendix B, Section B.1.3). Extensive air Pb monitoring data are 19 also available and were considered in the performance evaluation of the modeling setup. The 20 Herculaneum case study location also has a number of attributes that add complexity to the 21 modeling of Pb exposure and risk including (a) complex terrain and meteorology which
4 The 2007 draft SIP revision (MDNR, 2007), including the modeling, is currently under review by EPA.
July 2007 2-18 Draft – Do Not Quote or Cite
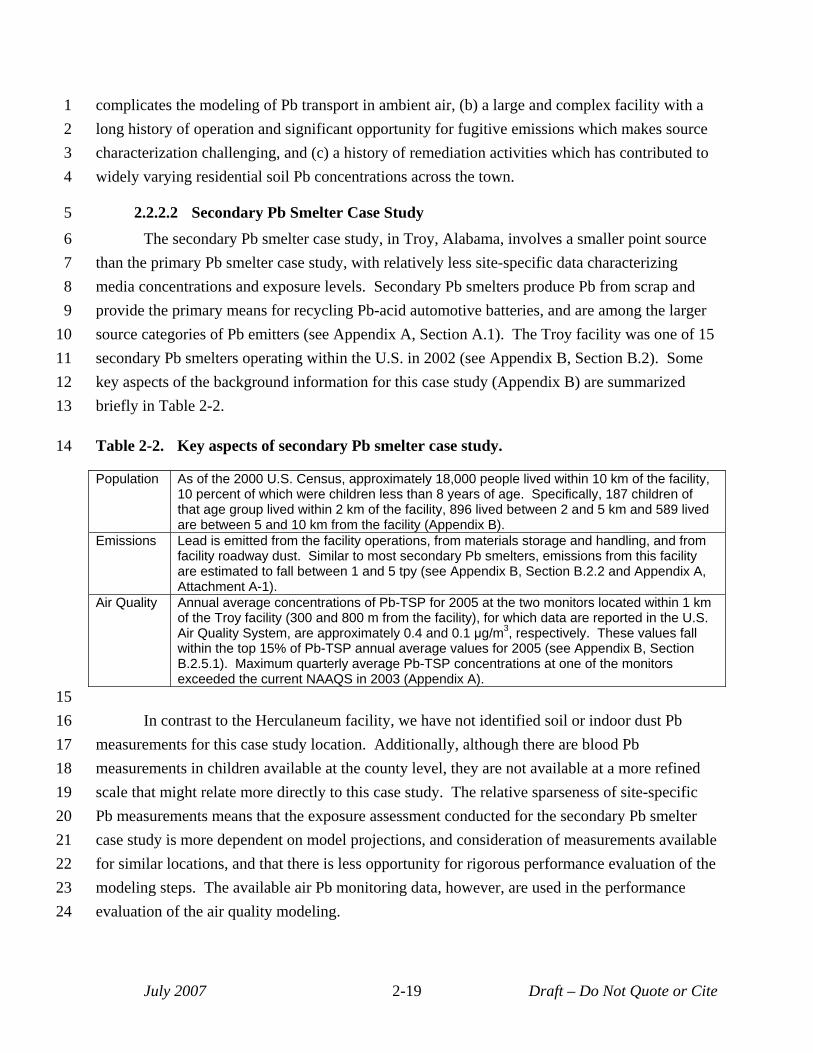
1 complicates the modeling of Pb transport in ambient air, (b) a large and complex facility with a 2 long history of operation and significant opportunity for fugitive emissions which makes source 3 characterization challenging, and (c) a history of remediation activities which has contributed to 4 widely varying residential soil Pb concentrations across the town.
5 2.2.2.2 Secondary Pb Smelter Case Study 6 The secondary Pb smelter case study, in Troy, Alabama, involves a smaller point source 7 than the primary Pb smelter case study, with relatively less site-specific data characterizing 8 media concentrations and exposure levels. Secondary Pb smelters produce Pb from scrap and 9 provide the primary means for recycling Pb-acid automotive batteries, and are among the larger
10 source categories of Pb emitters (see Appendix A, Section A.1). The Troy facility was one of 15 11 secondary Pb smelters operating within the U.S. in 2002 (see Appendix B, Section B.2). Some 12 key aspects of the background information for this case study (Appendix B) are summarized 13 briefly in Table 2-2.
14 Table 2-2. Key aspects of secondary Pb smelter case study.
Population As of the 2000 U.S. Census, approximately 18,000 people lived within 10 km of the facility, 10 percent of which were children less than 8 years of age. Specifically, 187 children of that age group lived within 2 km of the facility, 896 lived between 2 and 5 km and 589 lived are between 5 and 10 km from the facility (Appendix B).
Emissions Lead is emitted from the facility operations, from materials storage and handling, and from facility roadway dust. Similar to most secondary Pb smelters, emissions from this facility are estimated to fall between 1 and 5 tpy (see Appendix B, Section B.2.2 and Appendix A, Attachment A-1).
Air Quality Annual average concentrations of Pb-TSP for 2005 at the two monitors located within 1 km of the Troy facility (300 and 800 m from the facility), for which data are reported in the U.S. Air Quality System, are approximately 0.4 and 0.1 μg/m3, respectively. These values fall within the top 15% of Pb-TSP annual average values for 2005 (see Appendix B, Section B.2.5.1). Maximum quarterly average Pb-TSP concentrations at one of the monitors exceeded the current NAAQS in 2003 (Appendix A).
15 16 In contrast to the Herculaneum facility, we have not identified soil or indoor dust Pb 17 measurements for this case study location. Additionally, although there are blood Pb 18 measurements in children available at the county level, they are not available at a more refined 19 scale that might relate more directly to this case study. The relative sparseness of site-specific 20 Pb measurements means that the exposure assessment conducted for the secondary Pb smelter 21 case study is more dependent on model projections, and consideration of measurements available 22 for similar locations, and that there is less opportunity for rigorous performance evaluation of the 23 modeling steps. The available air Pb monitoring data, however, are used in the performance 24 evaluation of the air quality modeling.
July 2007 2-19 Draft – Do Not Quote or Cite
1 2.3 ASSESSMENT SCENARIOS 2 The design of the scenarios assessed for each case study include considerations with 3 regard to air concentrations of Pb (Section 2.3.1), surface soil/dust concentrations of Pb (Section 4 2.3.3) and background (Section 2.3.2). As the scenarios are primarily distinguished by the 5 differences in air concentrations, we generally refer to the different assessment scenarios as air 6 quality scenarios in this document (including the appendices). The different air quality scenarios 7 include current conditions, meeting the current NAAQS of 1.5 µg/m3 (maximum quarterly 8 average) and meeting several alternate, lower NAAQS.
9 2.3.1 Air Concentrations 10 The air concentrations assessed in the different air quality scenarios include current 11 conditions, meeting the current NAAQS of 1.5 µg/m3 (maximum quarterly average) and meeting 12 several alternate, lower NAAQS. In consideration of the range of levels suggested by CASAC 13 (Henderson, 2007), the alternate NAAQS scenarios included in the assessment are: 0.5 µg/m3, 14 0.2 µg/m3 and 0.05 µg/m3 as monthly averages, and 0.2 µg/m3 as a quarterly average. While the 15 current and alternate NAAQS scenarios are characterized by quarterly or monthly averaging 16 times, it is the associated annual average ambient air concentrations that are then used in the risk 17 assessment5. 18 The current conditions scenario, performed for the general urban and secondary Pb 19 smelter case studies, is intended to generally reflect recent conditions for these case studies based 20 on data available for the characterization. For example, for the urban case study, air Pb levels for 21 current conditions are based on 2003-2005 air quality data (Appendix A). For the secondary Pb 22 smelter case study, for which we used air quality modeling, air Pb levels for current conditions 23 are based on emissions characterizations drawn from currently available emissions information 24 and recent meteorological data (see Appendix E). 25 The current NAAQS attainment air quality scenario was performed for the primary Pb 26 smelter case study because monitoring data for that study area indicate exceedance of the current 27 Pb NAAQS (Appendix B, Section B.1.5.1).6 But this scenario is not included for the secondary 28 Pb smelter case study as the current conditions for that case study meet the current NAAQS. In 29 developing the reduced air concentrations for the alternate NAAQS scenarios for the point
5 Use of the annual average concentration is consistent with the temporal period of this input to the primary blood Pb model (Appendix H) and also the generally longer term resolution of the blood Pb metrics associated with the concentration-response functions (“concurrent” and “lifetime average”) (Lanphear et al., 2005).
6 Given the status of this area with regard to non-attainment and SIP revision, as well as the use of the modeling set-up developed for the SIP attainment demonstration, a current conditions scenario was not developed for the primary Pb smelter case study.
July 2007 2-20 Draft – Do Not Quote or Cite
1 2 3 4 5 6 7 8 9
10 11 12 13 14 15 16 17 18 19 20 21 22 23 24 25 26 27 28 29 30 31
source case studies (for which air quality models are employed), the maximum monthly or quarterly average (depending on averaging time for the alternate NAAQS) for each modeled receptor point is compared to the NAAQS level to identify the factor by which the highest average exceeds the NAAQS level. All monthly or quarterly averages are then reduced by this factor (i.e., a proportional roll back is implemented) and the associated annual average recalculated for each receptor point.
Two different current conditions scenarios are assessed for the general urban case study based on air Pb concentrations for the period 2003-2005 at monitors in U.S. urban areas with population greater than one million (Appendix A). One of these two scenarios is based on the mean maximum calendar quarter average for these monitors, and the second is based on the 95th
percentile of maximum calendar quarter averages for these monitors. Additionally, although the mean and 95th percentile maximum quarterly average of the large urban area monitors nationally do not exceed the current NAAQS level, an increased air concentration scenario (i.e., to the level of the current standard) has been included for this case study.
As the air Pb concentrations for this case study do not vary spatially (see Section 3.1.1.1), the air Pb concentration is simply set to the level specified for each scenario as either a monthly or quarterly average. The annual average air concentration (the metric used in the dust and blood Pb modeling) is derived from the current conditions or NAAQS level (and averaging time) using relationships based on current Pb-TSP monitoring data for monitors in large U.S. urban areas (Appendix A). Lead in TSP monitoring data for the time period 2003-2005 from monitors in U.S. urban areas of population size greater than one million were analyzed to derive estimates of maximum quarterly average, maximum monthly average and annual average for each monitor. From these estimates, the ratios of the maximum quarterly and maximum monthly averages to the annual average were derived for each monitor and the arithmetic mean and 95th percentile value of the monitor-specific ratios were derived. To derive the annual average air concentration used in the dust and blood Pb modeling for each scenario, one of these ratios was applied to the air quality scenario level. For example, the alternate NAAQS level of 0.5 (for a maximum monthly averaging time) was divided by the mean monitor ratio of maximum monthly average to annual average to derive the annual average air concentration estimate for that alternate NAAQS scenario. The air quality values associated with the different scenarios assessed for the urban case study are summarized in Table 2-3.
July 2007 2-21 Draft – Do Not Quote or Cite
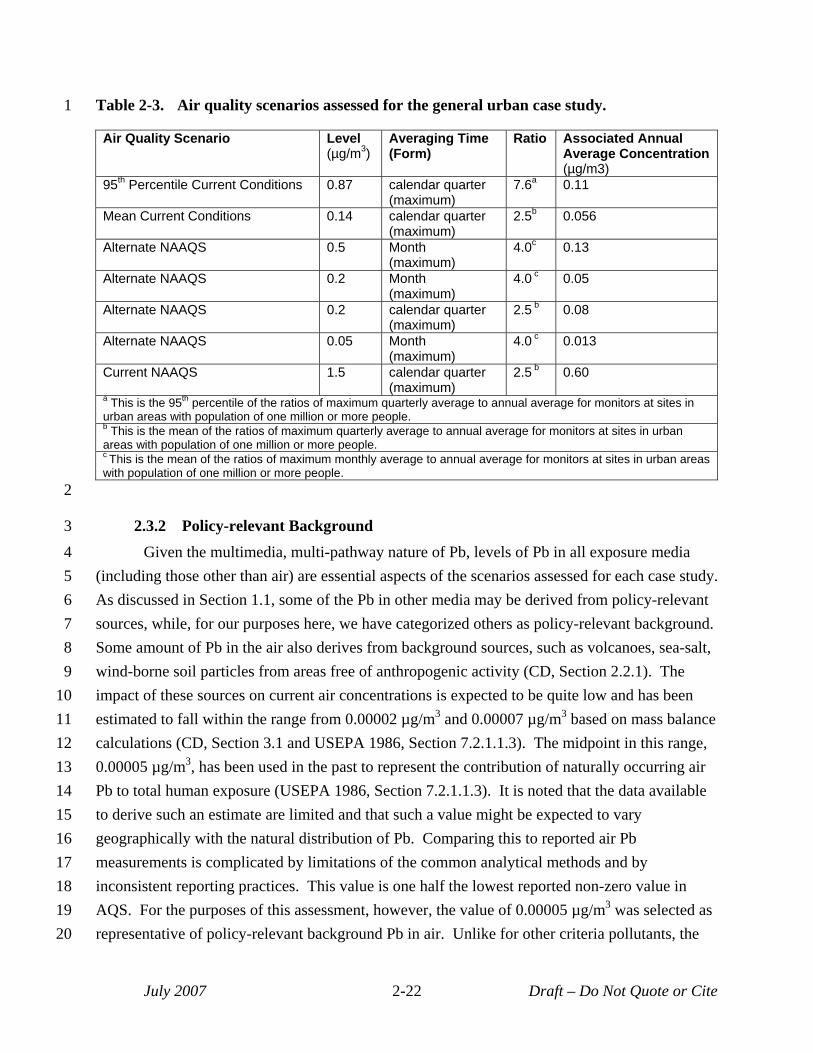
1 Table 2-3. Air quality scenarios assessed for the general urban case study.
Air Quality Scenario Level (µg/m3)
Averaging Time (Form)
Ratio Associated Annual Average Concentration (µg/m3)
95th Percentile Current Conditions 0.87 calendar quarter (maximum)
7.6a 0.11
Mean Current Conditions 0.14 calendar quarter (maximum)
2.5b 0.056
Alternate NAAQS 0.5 Month (maximum)
4.0c 0.13
Alternate NAAQS 0.2 Month (maximum)
4.0 c 0.05
Alternate NAAQS 0.2 calendar quarter (maximum)
2.5 b 0.08
Alternate NAAQS 0.05 Month (maximum)
4.0 c 0.013
Current NAAQS 1.5 calendar quarter (maximum)
2.5 b 0.60
a This is the 95th percentile of the ratios of maximum quarterly average to annual average for monitors at sites in urban areas with population of one million or more people. b This is the mean of the ratios of maximum quarterly average to annual average for monitors at sites in urban areas with population of one million or more people. c This is the mean of the ratios of maximum monthly average to annual average for monitors at sites in urban areas with population of one million or more people.
2
3 2.3.2 Policy-relevant Background 4 Given the multimedia, multi-pathway nature of Pb, levels of Pb in all exposure media 5 (including those other than air) are essential aspects of the scenarios assessed for each case study. 6 As discussed in Section 1.1, some of the Pb in other media may be derived from policy-relevant 7 sources, while, for our purposes here, we have categorized others as policy-relevant background. 8 Some amount of Pb in the air also derives from background sources, such as volcanoes, sea-salt, 9 wind-borne soil particles from areas free of anthropogenic activity (CD, Section 2.2.1). The
10 impact of these sources on current air concentrations is expected to be quite low and has been 11 estimated to fall within the range from 0.00002 µg/m3 and 0.00007 µg/m3 based on mass balance 12 calculations (CD, Section 3.1 and USEPA 1986, Section 7.2.1.1.3). The midpoint in this range, 13 0.00005 µg/m3, has been used in the past to represent the contribution of naturally occurring air 14 Pb to total human exposure (USEPA 1986, Section 7.2.1.1.3). It is noted that the data available 15 to derive such an estimate are limited and that such a value might be expected to vary 16 geographically with the natural distribution of Pb. Comparing this to reported air Pb 17 measurements is complicated by limitations of the common analytical methods and by 18 inconsistent reporting practices. This value is one half the lowest reported non-zero value in 19 AQS. For the purposes of this assessment, however, the value of 0.00005 µg/m3 was selected as 20 representative of policy-relevant background Pb in air. Unlike for other criteria pollutants, the
July 2007 2-22 Draft – Do Not Quote or Cite
1 role of this value for Pb is limited. In considering risk contributions from policy-relevant 2 background, the contributions from exposures to non-air media are such that any credible 3 estimate of policy-relevant background in air is likely insignificant in comparison. In developing 4 the air Pb concentrations associated with the alternate NAAQS scenarios, the estimate of policy5 relevant background in air was the floor below which concentrations were not lowered.
6 2.3.3 Outdoor Soil/Dust 7 With regard to surface soil7 Pb concentrations for the alternate NAAQS scenarios, the 8 presence of historically deposited Pb, associated with past periods of higher air concentrations 9 and associated atmospheric deposition, affects the soil Pb dynamics. That is, under the alternate
10 NAAQS scenarios atmospheric deposition of Pb will continue to occur, albeit it will be reduced 11 from the current rate which is reduced from historic rates. The type of response of the surface 12 soil concentrations to the changed deposition rate will depend on the relationship of current 13 surface soil concentrations at these locations to their levels associated with a steady state 14 condition (i.e., when the rate of Pb addition to the surface soil equals the rate of Pb loss from the 15 surface soil). If current surface soil concentrations are below their steady state levels for the 16 current conditions (i.e., the rate of Pb addition is greater than the rate of Pb loss) and air 17 concentrations are reduced (i.e., the rate of Pb addition via deposition is reduced), surface soil 18 concentrations might be expected to continue an increasing trend, although at a reduced rate 19 from the current rate. Alternatively, if current surface soil concentrations are above their steady 20 state levels (i.e., the rate of Pb loss is greater than the rate of Pb addition) and air concentrations 21 and associated deposition are reduced, surface soil concentrations might be expected to continue 22 a decreasing trend and do so at a greater rate than the current one. 23 Information regarding the current dynamics of Pb concentrations in surface soils is 24 limited with the predominant focus for such studies being somewhat remote forested areas (e.g., 25 CD, Section 3.2 and 3.2.2 and pp. AX7-33 to AX7-34). Findings to date indicate that systems 26 with little influence from local point sources are still responding to reduced Pb deposition rates 27 associated with reduced atmospheric emissions of Pb, including those associated with the phase28 out of leaded gasoline. Studies of forest soils have concluded that surface concentrations of Pb 29 are decreasing in response to the reduced Pb deposition rates since the phase-out of leaded 30 gasoline (Miller and Friedland, 1994; Kaste and Friedland, 2003). Studies in urban areas of
7 In the risk assessment, outdoor surface soil or dust is an important exposure pathway. Use of the term surface soil here is intended to include the terms outdoor soil and outdoor dust, with there being some overlap between those two terms in that the surface layer of outdoor soil might be referred to as outdoor dust. Specifically, the phrase “outdoor dust” refers to particles deposited on any outdoor surface, including, for example, soil, sidewalks, roadways, etc.
July 2007 2-23 Draft – Do Not Quote or Cite
1 southern California, where Pb has accumulated from past sources, suggest an environment in 2 which Pb may remain at the soil surface (and other surfaces), contributing to air concentrations 3 via resuspension in the near-term (CD, pp. 2-65 to 2-67 and 3-18 to 3-19). Accordingly, the 4 temporal trend in surface soil concentrations in this environment is considered to be influenced 5 by the rate of resuspension, such that little to no reduction in soil Pb concentration in southern 6 California is expected over the next few hundred years (CD, pp. 2-65 to 2-67 and 3-18 to 3-20; 7 Harris and Davidson, 2005). Temporal trends in surface soils near established point sources are 8 not well characterized. Available information for a few areas surrounding smelters after 9 implementation of pollution controls shows a decline in Pb concentrations in outdoor dustfall,
10 street dust and indoor dustfall, but has not indicated a noticeable decline in soil Pb concentrations 11 (CD, pp. 3-23 to 3-24). 12 The above discussion suggests that a reduced air concentration in the three case studies 13 would not be expected to yield a changed surface soil concentration over the near term, yet may 14 yield a reduced surface concentration over a much longer term. An exception to this may be 15 some areas of the primary Pb smelter case study where contaminated soil has been removed and 16 replaced with “clean” soil. Measurements taken of Pb concentrations in such “clean” soil placed 17 within ¾ mile of the facility exhibit small increasing temporal trends over a few year period8
18 (USEPA, 2006c). In lieu of additional data or a multimedia modeling analysis, however, the 19 surface soil concentrations for the current and alternate NAAQS scenarios in all case studies 20 have been set equal to those used for the current conditions scenarios. This is generally believed 21 to be a reasonable representation of soil Pb response to alternate NAAQS for at least six years, 22 and likely much longer, after a new standard might be implemented.9 A potential exception is 23 the area of the primary Pb smelter case study within ¾ mile of the facility, where it may be that 24 surface Pb concentrations in remediated soil may increase to higher levels under the current and 25 some of the alternate NAAQS. This remains an area of uncertainty with potential implications 26 for areas in which a Pb source may locate where one of comparable size had not been previously. 27 Additionally, we recognize that implementation of some alternate NAAQS could in some 28 areas (e.g., areas of substantial past atmospheric deposition) involve control of surface soil/dust 29 to reduce surface soil/dust Pb levels. That is, in places where surface soil/dust Pb concentrations 30 contribute substantially to air concentrations, controls implemented to attain various alternate 31 lower NAAQS might include reducing soil Pb concentrations. Such specific control actions have
8 An increasing trend was not seen with soil at the two locations just beyond ¾ miles away. 9 This was also the approach used in the risk assessment performed in the last Pb NAAQS review (USEPA,
1990).
July 2007 2-24 Draft – Do Not Quote or Cite
5
10
15
20
25
30
1 not been addressed in this assessment, and as stated above, outdoor soil/dust concentrations in all 2 air quality scenarios have been set equal to the values for the current conditions scenarios.
3 2.4 ANALYTICAL APPROACH 4 This section provides an overview of the analytical approach, describing key elements
including: (a) temporal aspects, (b) spatial scale of the analysis and the type of spatial template 6 used in modeling, (c) overview of the analytical steps of predicting media concentrations, 7 modeling exposure, and modeling risk, (d) performance evaluation completed in support of the 8 analysis and (e) the approach used to characterize uncertainty.
9 2.4.1 Temporal Aspects The risk assessment conducted for each case study uses a simulated child population for
11 which exposure begins at birth and continues for 7 years. That is, the study population is 12 assumed to be a single group, for which exposure begins at birth and continues until the group 13 reaches 7 years of age.10 Furthermore, it is assumed that no migration or immigration of these 14 children occurs during this simulation period; that is, none of the children move out of the study
area and no children move in. 16 For the point source case studies, the use of modeling (with a constant emissions rate and 17 temporally varying meteorology) provides temporally varying air concentrations. However, the 18 primary blood Pb model for this assessment is limited in the temporal resolution of its inputs (see 19 Section 3.2), because the finest temporal resolution of inputs to the blood Pb model is a year.
Consequently, in characterizing exposure media concentrations, annual averages are used. 21 With regard to temporal variation across the seven year exposure period, several 22 exposure factors and physiological parameters are varied on an annual basis within the blood Pb 23 modeling step (see Section 3.2). Once set for the air quality scenario, however, the media 24 concentrations of Pb are held constant throughout the seven year period (see Section 3.1).
2.4.2 Spatial Scale and Resolution
26 The size and resolution of the study area differed among the three case studies. The 27 urban case study is not set in a specific location, and involves non-spatially-varying media 28 concentrations and population density. That is, there is no spatially-differentiated template per 29 se and instead, a single generic urban study area is assumed with uniform population density and
exposure concentrations. For the exposure modeling for the point source case studies, however, 31 spatial templates were developed. The templates subdivide the study area into sub-units,
10 Modeling of blood Pb levels for the child population includes contributions representative of prenatal Pb exposure.
July 2007 2-25 Draft – Do Not Quote or Cite
1 composed of U.S. Census blocks or block groups, across which media concentrations differ.11
2 Media concentration estimates (e.g., for outdoor air, soil and indoor dust) are developed for each 3 block or block group, and from these a central tendency estimate is developed of concurrent and 4 lifetime average blood Pb levels for the resident children. Inter-individual variability of blood 5 Pb levels for children within a block or block group is considered through the use of a 6 statistically derived GSD. The specific spatial templates used for each of the point source case 7 studies are presented in Appendices D (Section D.1) and E (Section E.1).
8 2.4.3 Categorization of Policy-relevant Exposure Pathways 9 To inform policy aspects of the Pb NAAQS review, we have attempted to parse the
10 assessment estimates for indoor dust Pb, blood Pb and IQ loss into the fraction associated with 11 policy-relevant background (e.g., diet and drinking water) versus that associated with policy12 relevant pathways, which include inhalation, outdoor soil/dust ingestion and indoor dust 13 ingestion (Section 2.1.1). We have further categorized the policy-relevant pathways into one of 14 two categories, “recent air” or “past air”. Conceptually, the recent air category includes those 15 pathways involving Pb that is or has recently been in the air, whether or not it was also in the air 16 in the past, and the past air category includes those pathways involving Pb that was in the air in 17 the past and was not in the air recently. 18 Recent air refers to exposure contributions associated with inhalation of ambient air Pb 19 and ingestion of the fraction of indoor dust Pb derived from recent ambient air Pb. To the extent 20 that ambient air Pb includes contributions from resuspension of previously deposited Pb, that 21 source is represented in the recent air category. Thus, a “recent air” exposure may involve 22 previously deposited Pb that is (1) resuspended into the air and inhaled or (2) resuspended into 23 the air, transported into a building, deposited into the dust, contacted and ingested. 24 Past air includes exposure contributions from ingestion of outdoor soil/dust that is 25 contacted on surfaces outdoors, and ingestion of indoor dust Pb that is derived from past air 26 sources. Although Pb that is currently in outdoor soil/dust may have been in the air recently or 27 some time ago, we have assigned ingestion of outdoor soil/dust Pb contacted outdoors to the past 28 air category in recognition of our inability to maintain a dynamically changing categorization of
11 US Census block groups vary in size from several city blocks in densely populated urban areas to many square miles in less populated rural areas. Their population count varies from 600 to 3000 people per block group with the typical block group in the U.S. containing 1,500 people. US Census blocks are more refined than block groups and typically contain several hundred people or less. Their size can vary from a single city block in urban areas to multiple square miles in less populated rural locations.
July 2007 2-26 Draft – Do Not Quote or Cite
1 recent versus past air.12 The past air category also includes the ingestion of indoor dust Pb that 2 was in the ambient air in the past but not recently. These sources to indoor dust Pb include any 3 residual legacy of historical air Pb in the indoor dust of older homes, as well as Pb occurring in 4 indoor dust that is derived from outdoor soil/dust Pb that was not transported indoors by an air 5 pathway. This latter pathway includes outdoor soil/dust Pb that is carried indoors by human 6 contact (e.g., “tracking in”). 7 To implement this categorization in the assessment, we developed estimates of the recent 8 air portion of indoor dust Pb (i.e., contributions associated with recent ambient air Pb levels), and 9 assigned the remainder of indoor dust Pb to other sources, which include those relevant to past
10 air. That is, the other sources component of indoor dust Pb refers to contributions from indoor 11 paint, outdoor soil/dust and additional sources. Among the additional sources is any residual 12 legacy of historical Pb in the indoor dust of older homes. 13 The indoor dust Pb subdivision reflects and is limited by the models and inputs used to 14 estimate indoor dust Pb levels for the different scenarios. All of them predict dust Pb 15 concentration as a function of, among other factors, ambient air Pb concentration, and all of the 16 models include a constant (e.g., the intercept in the regression-based models) that captures 17 “other” sources. One of the models (used in the secondary Pb smelter case study and in part of 18 the primary Pb smelter case study) also includes a dependency on outdoor soil/dust Pb 19 concentration. This difference among the models leads to an inconsistency across the case 20 studies in the ability to separate the contribution to indoor dust Pb from outdoor soil/dust. 21 Consequently, we have limited to two categories the subdivision of indoor dust contributions, 22 with that from outdoor soil/dust included in “other” whether it is estimated by a model that 23 includes a soil concentration coefficient or is accommodated by the constant or intercept term. 24 In presenting risk estimates associated with policy-relevant pathways (Chapter 4), we have 25 included risk associated with the “other” component of indoor dust in the past air category. We 26 recognize that the potential for this “other” component to include ambient Pb unrelated to air 27 emissions contributes to a potential for the risk estimates associated with past air to be 28 overestimates. Additionally, as the recent air portion of indoor dust Pb, which derives from 29 transport of airborne Pb into a house, depends on the estimate of ambient air Pb concentration, 30 selection of an ambient air Pb estimate that is not appropriate to this relationship (e.g., one that 31 does not represent ambient air Pb levels immediately outside the house) may contribute to an 32 under or over estimate of recent air indoor dust Pb.
12 In concept, this assignment appears to inherently contribute to an underestimate of the recent air category. However, the reality of much higher air emissions in the past that have contributed to Pb concentrations in other media that are higher than those that would be associated with more recent lower emissions, complicates this assumption (see Section 2.3.3).
July 2007 2-27 Draft – Do Not Quote or Cite
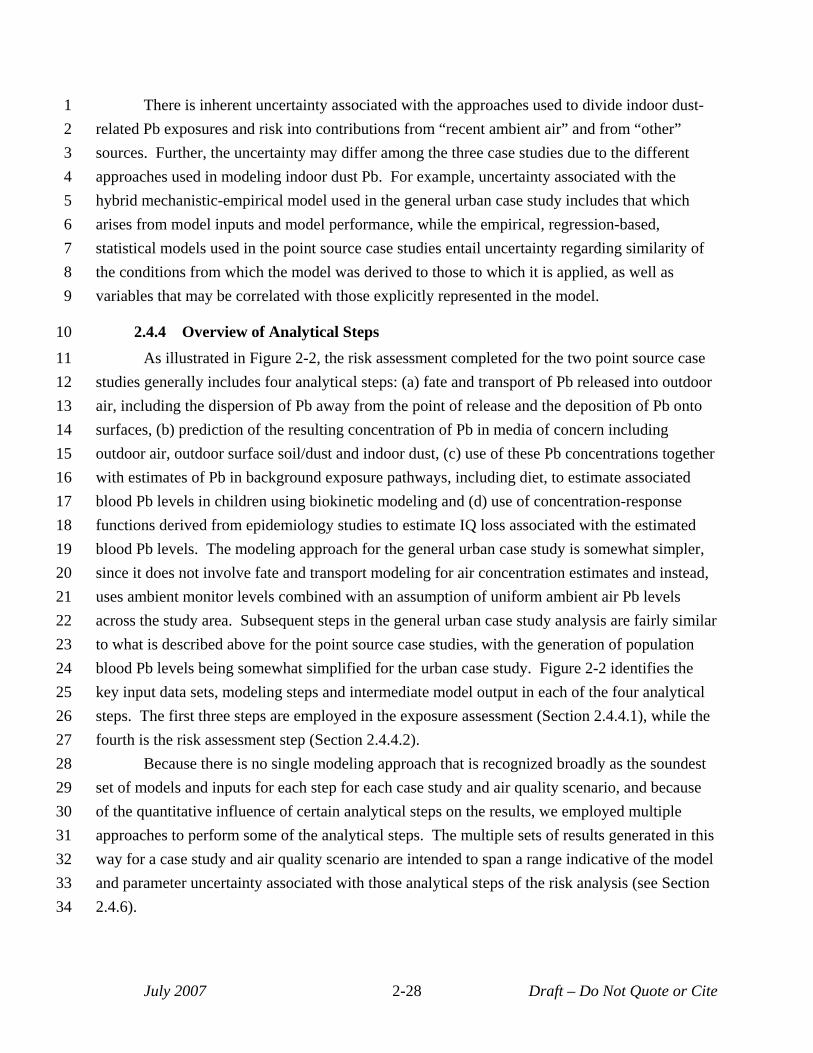
1 2 3 4 5 6 7 8 9
10 11 12 13 14 15 16 17 18 19 20 21 22 23 24 25 26 27 28 29 30 31 32 33 34
There is inherent uncertainty associated with the approaches used to divide indoor dust-related Pb exposures and risk into contributions from “recent ambient air” and from “other” sources. Further, the uncertainty may differ among the three case studies due to the different approaches used in modeling indoor dust Pb. For example, uncertainty associated with the hybrid mechanistic-empirical model used in the general urban case study includes that which arises from model inputs and model performance, while the empirical, regression-based, statistical models used in the point source case studies entail uncertainty regarding similarity of the conditions from which the model was derived to those to which it is applied, as well as variables that may be correlated with those explicitly represented in the model.
2.4.4 Overview of Analytical Steps As illustrated in Figure 2-2, the risk assessment completed for the two point source case
studies generally includes four analytical steps: (a) fate and transport of Pb released into outdoor air, including the dispersion of Pb away from the point of release and the deposition of Pb onto surfaces, (b) prediction of the resulting concentration of Pb in media of concern including outdoor air, outdoor surface soil/dust and indoor dust, (c) use of these Pb concentrations together with estimates of Pb in background exposure pathways, including diet, to estimate associated blood Pb levels in children using biokinetic modeling and (d) use of concentration-response functions derived from epidemiology studies to estimate IQ loss associated with the estimated blood Pb levels. The modeling approach for the general urban case study is somewhat simpler, since it does not involve fate and transport modeling for air concentration estimates and instead, uses ambient monitor levels combined with an assumption of uniform ambient air Pb levels across the study area. Subsequent steps in the general urban case study analysis are fairly similar to what is described above for the point source case studies, with the generation of population blood Pb levels being somewhat simplified for the urban case study. Figure 2-2 identifies the key input data sets, modeling steps and intermediate model output in each of the four analytical steps. The first three steps are employed in the exposure assessment (Section 2.4.4.1), while the fourth is the risk assessment step (Section 2.4.4.2).
Because there is no single modeling approach that is recognized broadly as the soundest set of models and inputs for each step for each case study and air quality scenario, and because of the quantitative influence of certain analytical steps on the results, we employed multiple approaches to perform some of the analytical steps. The multiple sets of results generated in this way for a case study and air quality scenario are intended to span a range indicative of the model and parameter uncertainty associated with those analytical steps of the risk analysis (see Section 2.4.6).
July 2007 2-28 Draft – Do Not Quote or Cite
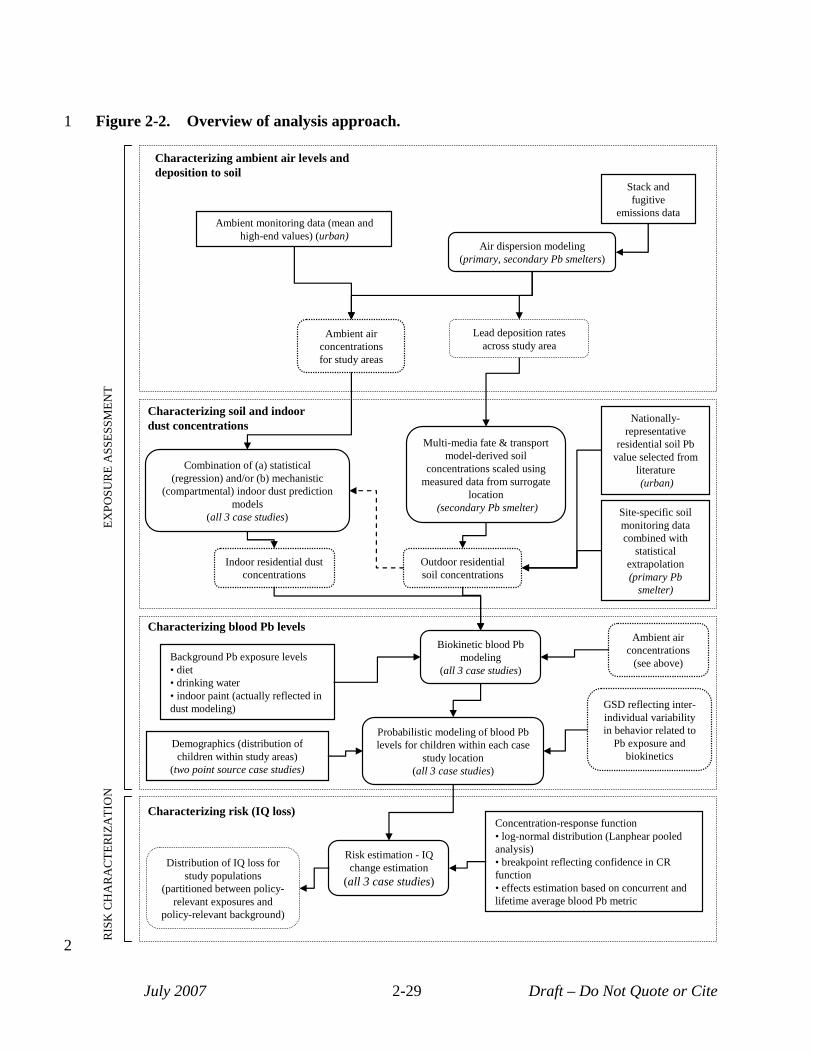
Figure 2-2. Overview of analysis approach. 1
Characterizing ambient air levels and deposition to soil
Air dispersion modeling (primary, secondary Pb smelters)
Ambient monitoring data (mean and high-end values) (urban)
Stack and fugitive
emissions data
Ambient air concentrations for study areas
Lead deposition rates across study area
Characterizing soil and indoor dust concentrations
Outdoor residential soil concentrations
Multi-media fate & transport model-derived soil
concentrations scaled using measured data from surrogate
location (secondary Pb smelter) Site-specific soil
monitoring data combined with
statistical extrapolation (primary Pb
smelter)
Nationally-representative
residential soil Pb value selected from
literature (urban)
Combination of (a) statistical (regression) and/or (b) mechanistic
(compartmental) indoor dust prediction models
(all 3 case studies)
Indoor residential dust concentrations
Biokinetic blood Pb modeling
(all 3 case studies) Background Pb exposure levels • diet • drinking water • indoor paint (actually reflected in dust modeling)
Probabilistic modeling of blood Pb levels for children within each case
study location (all 3 case studies)
GSD reflecting inter-individual variability in behavior related to
Pb exposure and biokinetics
Characterizing blood Pb levels
Demographics (distribution of children within study areas)
(two point source case studies)
Ambient air concentrations
(see above)
EXPO
SUR
E A
SSES
SMEN
TR
ISK
CH
AR
AC
TER
IZA
TIO
N
2
Characterizing risk (IQ loss)
Risk estimation - IQ Distribution of IQ loss for change estimation
study populations (all 3 case studies)(partitioned between policy-relevant exposures and
policy-relevant background)
July 2007 2-29
Concentration-response function • log-normal distribution (Lanphear pooled analysis) • breakpoint reflecting confidence in CR function • effects estimation based on concurrent and lifetime average blood Pb metric
Draft – Do Not Quote or Cite
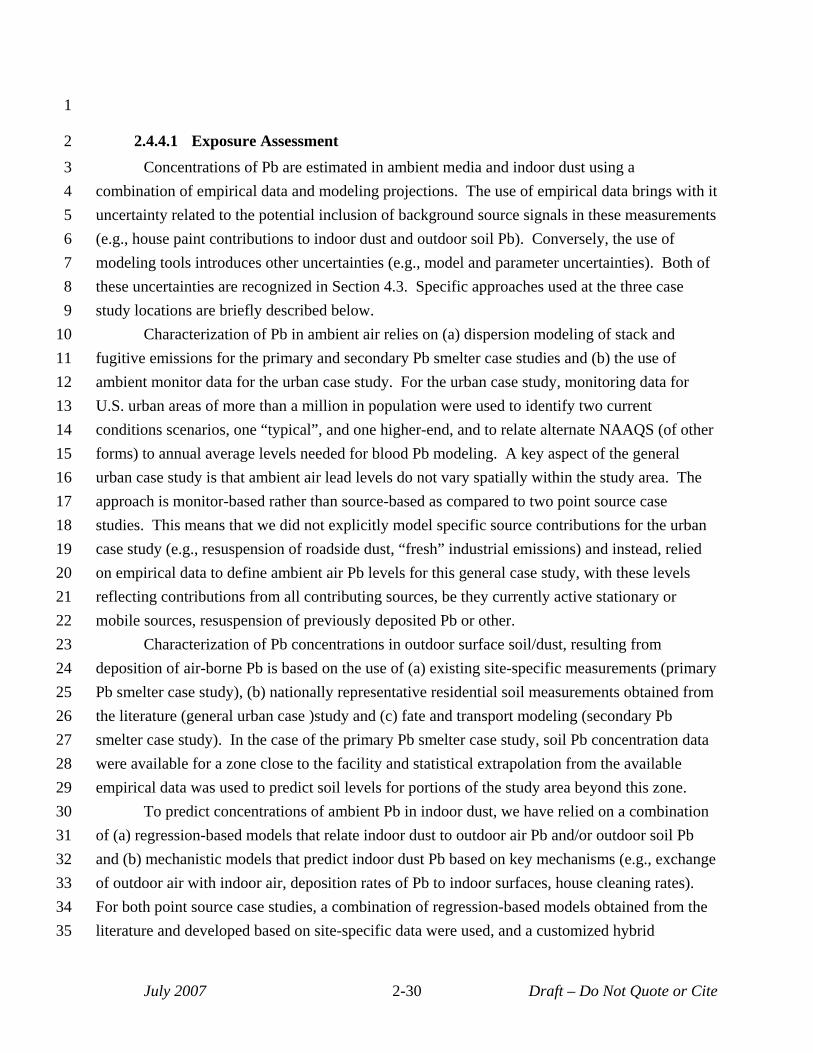
1
2 3 4 5 6 7 8 9
10 11 12 13 14 15 16 17 18 19 20 21 22 23 24 25 26 27 28 29 30 31 32 33 34 35
2.4.4.1 Exposure Assessment Concentrations of Pb are estimated in ambient media and indoor dust using a
combination of empirical data and modeling projections. The use of empirical data brings with it uncertainty related to the potential inclusion of background source signals in these measurements (e.g., house paint contributions to indoor dust and outdoor soil Pb). Conversely, the use of modeling tools introduces other uncertainties (e.g., model and parameter uncertainties). Both of these uncertainties are recognized in Section 4.3. Specific approaches used at the three case study locations are briefly described below.
Characterization of Pb in ambient air relies on (a) dispersion modeling of stack and fugitive emissions for the primary and secondary Pb smelter case studies and (b) the use of ambient monitor data for the urban case study. For the urban case study, monitoring data for U.S. urban areas of more than a million in population were used to identify two current conditions scenarios, one “typical”, and one higher-end, and to relate alternate NAAQS (of other forms) to annual average levels needed for blood Pb modeling. A key aspect of the general urban case study is that ambient air lead levels do not vary spatially within the study area. The approach is monitor-based rather than source-based as compared to two point source case studies. This means that we did not explicitly model specific source contributions for the urban case study (e.g., resuspension of roadside dust, “fresh” industrial emissions) and instead, relied on empirical data to define ambient air Pb levels for this general case study, with these levels reflecting contributions from all contributing sources, be they currently active stationary or mobile sources, resuspension of previously deposited Pb or other.
Characterization of Pb concentrations in outdoor surface soil/dust, resulting from deposition of air-borne Pb is based on the use of (a) existing site-specific measurements (primary Pb smelter case study), (b) nationally representative residential soil measurements obtained from the literature (general urban case )study and (c) fate and transport modeling (secondary Pb smelter case study). In the case of the primary Pb smelter case study, soil Pb concentration data were available for a zone close to the facility and statistical extrapolation from the available empirical data was used to predict soil levels for portions of the study area beyond this zone.
To predict concentrations of ambient Pb in indoor dust, we have relied on a combination of (a) regression-based models that relate indoor dust to outdoor air Pb and/or outdoor soil Pb and (b) mechanistic models that predict indoor dust Pb based on key mechanisms (e.g., exchange of outdoor air with indoor air, deposition rates of Pb to indoor surfaces, house cleaning rates). For both point source case studies, a combination of regression-based models obtained from the literature and developed based on site-specific data were used, and a customized hybrid
July 2007 2-30 Draft – Do Not Quote or Cite
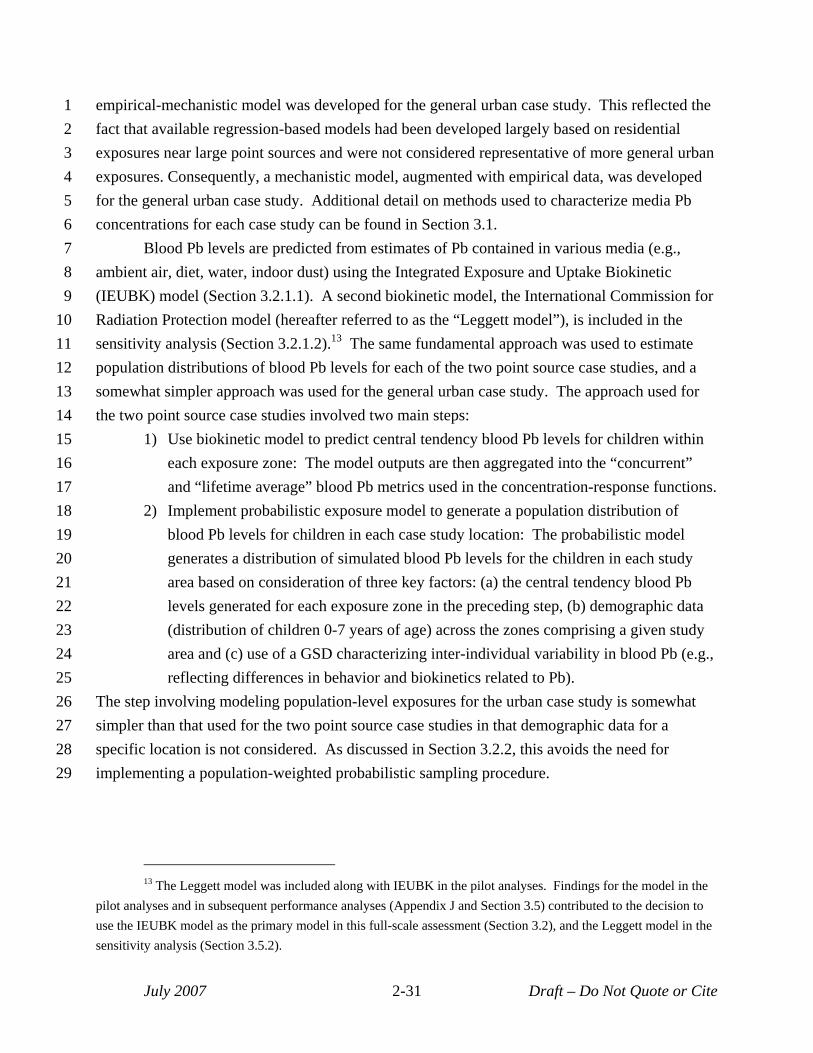
1 empirical-mechanistic model was developed for the general urban case study. This reflected the 2 fact that available regression-based models had been developed largely based on residential 3 exposures near large point sources and were not considered representative of more general urban 4 exposures. Consequently, a mechanistic model, augmented with empirical data, was developed 5 for the general urban case study. Additional detail on methods used to characterize media Pb 6 concentrations for each case study can be found in Section 3.1. 7 Blood Pb levels are predicted from estimates of Pb contained in various media (e.g., 8 ambient air, diet, water, indoor dust) using the Integrated Exposure and Uptake Biokinetic 9 (IEUBK) model (Section 3.2.1.1). A second biokinetic model, the International Commission for
10 Radiation Protection model (hereafter referred to as the “Leggett model”), is included in the 11 sensitivity analysis (Section 3.2.1.2).13 The same fundamental approach was used to estimate 12 population distributions of blood Pb levels for each of the two point source case studies, and a 13 somewhat simpler approach was used for the general urban case study. The approach used for 14 the two point source case studies involved two main steps: 15 1) Use biokinetic model to predict central tendency blood Pb levels for children within 16 each exposure zone: The model outputs are then aggregated into the “concurrent” 17 and “lifetime average” blood Pb metrics used in the concentration-response functions. 18 2) Implement probabilistic exposure model to generate a population distribution of 19 blood Pb levels for children in each case study location: The probabilistic model 20 generates a distribution of simulated blood Pb levels for the children in each study 21 area based on consideration of three key factors: (a) the central tendency blood Pb 22 levels generated for each exposure zone in the preceding step, (b) demographic data 23 (distribution of children 0-7 years of age) across the zones comprising a given study 24 area and (c) use of a GSD characterizing inter-individual variability in blood Pb (e.g., 25 reflecting differences in behavior and biokinetics related to Pb). 26 The step involving modeling population-level exposures for the urban case study is somewhat 27 simpler than that used for the two point source case studies in that demographic data for a 28 specific location is not considered. As discussed in Section 3.2.2, this avoids the need for 29 implementing a population-weighted probabilistic sampling procedure.
13 The Leggett model was included along with IEUBK in the pilot analyses. Findings for the model in the pilot analyses and in subsequent performance analyses (Appendix J and Section 3.5) contributed to the decision to use the IEUBK model as the primary model in this full-scale assessment (Section 3.2), and the Leggett model in the sensitivity analysis (Section 3.5.2).
July 2007 2-31 Draft – Do Not Quote or Cite
1 2 3 4 5 6 7 8 9
10 11 12 13 14 15 16 17 18 19 20 21 22 23 24 25 26 27 28 29 30 31
32 33 34
2.4.4.2 Risk Characterization The risk characterization step involves generating a distribution of IQ loss estimates for
the set of children simulated in the exposure assessment. Specifically, estimated blood Pb levels (for the two blood Pb metrics) are combined with three blood Pb concentration-response functions for IQ loss (see Section 4.1). Three differing concentration-response functions (described in Section 4.1.1) have been selected to provide three different characterizations of behavior at low exposures. The decision to use three different functions is in recognition of uncertainty related to modeling this endpoint, particularly at lower exposure levels (e.g., blood Pb levels < 5 µg/dL). These three functions are all based on the log-normal concentration-response function described in the Lanphear et al, (2005) pooled analysis of epidemiology studies focusing on IQ loss in children. As these three functions were developed for each of the blood Pb metrics included in the analysis, concurrent and lifetime average, six separate functions were used in the analysis.
For each of the two point source case studies, we have produced two categories of risk metrics:
• Population risk percentiles: The IQ loss associated with policy-relevant exposure pathways for specific percentiles of the child population (e.g., the 50th, 90th, 95th, 99th percentile modeled child). This category of metric provides perspective on the distribution of IQ loss resulting from policy-relevant exposure pathways, ranging from the typical or average child (50th percentile, mean) to children experiencing higher exposures (90th, 99th percentiles).
• Child frequency counts associated with specific risk percentiles: Number of children associated with each of the population percentiles (e.g., the number of children predicted to have risk levels at or above the 99th percentile). This risk metrics provides a perspective on the number of children associated with various levels of IQ loss for a particular case study.
For the urban case study, because it is not location-specific, only the first type of risk metric, population risk percentiles, was developed because this case study is not location-specific. Child frequency counts are not applicable, since a specific location with associated demographic data was not modeled.
Additional detail on the risk characterization is presented in Sections 4.1 and 4.2.
2.4.5 Variability Characterization There are a variety of sources of variability associated with the results of this assessment
which are presented in terms of risk estimates for specific population percentiles:
July 2007 2-32 Draft – Do Not Quote or Cite
5
10
15
20
25
30
35
1 • variability in the concentration of lead in key media (e.g., diet, drinking water, ambient 2 air, indoor dust),
3 • variability in behaviors which effect Pb exposure (e.g., dust ingestion, soil ingestion),
4 • variability in physiological response to Pb exposure leading to variations in blood Pb levels, and
6 • variability in the toxic response to Pb, resulting in differing degrees of IQ loss for the 7 same degree of Pb exposure.
8 9 A variety of methods have been used to incorporate, to a limited extent, the above
sources of variability in the risk assessment such that they are reflected in the results for the three 11 case studies. 12 • Use of GIS-based spatial templates (for the two point source case studies) to reflect 13 the distribution of children across a study area (in relation to ambient air Pb and 14 related media concentrations) in projecting population exposures.
• For the general urban case study, inclusion of two current conditions scenarios (mean 16 and 99.5th percentile scenarios) which together, provide a degree of coverage for 17 variation in ambient air Pb levels seen across urban areas in the U.S. 18 • Use of empirically derived GSDs reflecting inter-individual variability in blood Pb 19 levels, to provide coverage for multiple sources of variability associated with Pb
exposure and biokinetics. Note, that the application of these GSDs provides the 21 primary means of reflecting inter-individual variability in blood Pb levels in this 22 analysis. These GSDs also reflect uncertainty associated with measuring blood Pb 23 levels and characterizing population-level distributions of those levels. 24
There is significant uncertainty associated with reflecting the sources of variability 26 identified above in population-level exposure and risk. For example there is uncertainty 27 associated with the GSD selected to reflect inter-individual variability in blood Pb levels for a 28 particular case study. This is considered in the uncertainty characterization (Section 2.4.6).
29 2.4.6 Uncertainty Characterization Several methods have been used to examine uncertainty in our modeling approach and its
31 potential impact on exposure and risk estimates (Section 4.3). These include: (a) development of 32 multiple sets of exposure and risk estimates for each case study and air quality scenario that 33 illustrate the combined impact of different key models and parameters on risk results and the 34 associated uncertainty, (b) completion of a sensitivity analysis, intended to characterize the
potential impact of individual modeling elements on risk results, (c) evaluation of model
July 2007 2-33 Draft – Do Not Quote or Cite
1 2 3 4
5 6 7 8 9
10 11 12 13 14 15 16 17 18 19 20 21 22 23 24 25 26 27 28 29 30 31 32 33
performance (e.g., by comparison with empirical data) to provide confidence in individual modeling steps and (d) qualitative discussion of key sources of uncertainty and their potential impact on exposure and risk estimates. Each of these elements of the uncertainty characterization is briefly summarized below.
2.4.6.1 Performance Evaluations Performance evaluation for the exposure assessment (Section 3.5) focused on evaluation
of estimates of Pb in ambient air, outdoor soil, and indoor dust (discussed in Section 3.5.1) and estimates of Pb in blood (covered in Section 3.5.2). This evaluation focused on those estimates based on modeling.
2.4.6.2 Generating Multiple Sets of Results There are multiple models or inputs that could be implemented for each of the analytical
steps of the assessment. For those more highly influential analytical steps for which it is not clear which model or input would generate “best estimate” results, we have implemented multiple modeling approaches. Risk results considered across these multiple modeling approaches provide perspective on the range of potential risk, given key sources of uncertainty in the analysis. The multiple modeling approaches for each case study were developed by the following stepwise strategy:
• Identification of those modeling elements believed to contribute significant uncertainty to risk results,
• Identification of a set of plausible options for each of these key modeling elements (e.g., alternative models or input parameters), and
• Development of alternative modeling approaches by combining individual options from the previous step.
Identification of the modeling elements believed to contribute significant uncertainty (step 1) involved consideration of a number of factors including the results of the sensitivity analysis completed for the pilot analysis, and comments provided by CASAC and the public on the pilot analysis and analysis plan.
Because each of the case studies uses different modeling approaches for some of the analytical steps, e.g., different indoor dust models are used for each case study, and these are associated with differing uncertainty, the identify and size of the areas of uncertainty associated with each case study differs. The specific modeling approaches for each case study and their elements are presented in Figure 2-3. For the general urban case study, two different dust models and two GSDs were used, compared to one model and GSD for these analytical steps in
July 2007 2-34 Draft – Do Not Quote or Cite
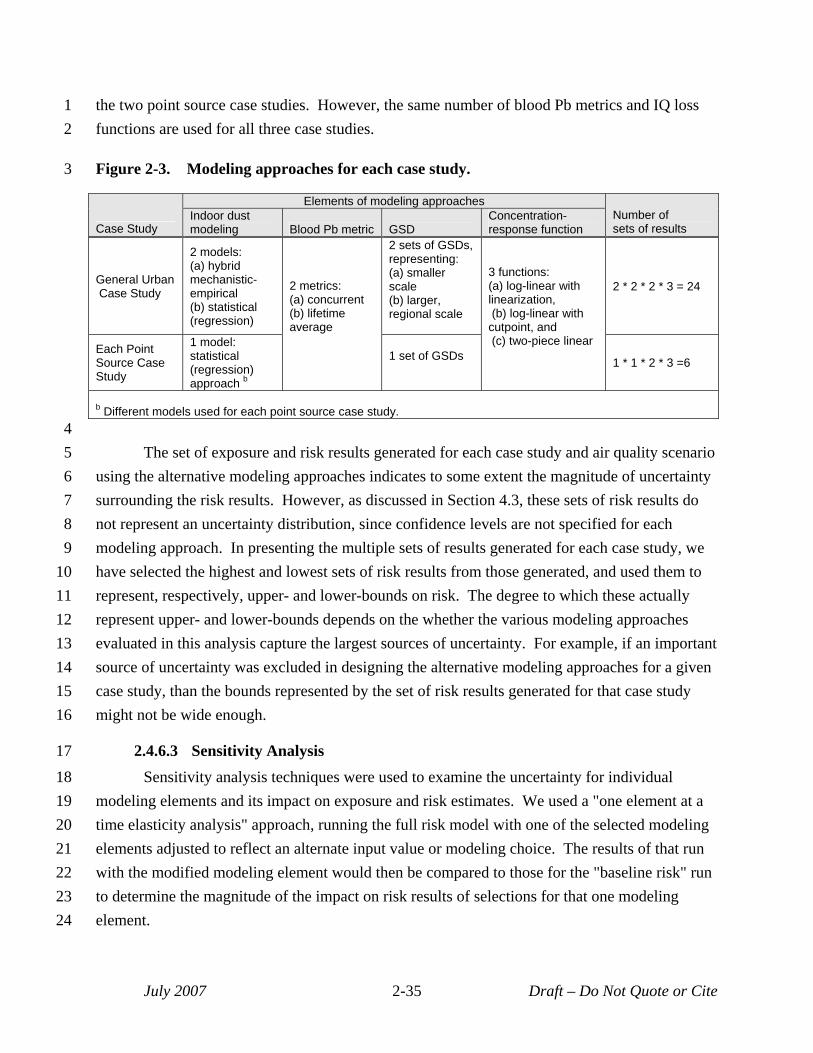
1 the two point source case studies. However, the same number of blood Pb metrics and IQ loss 2 functions are used for all three case studies.
3 Figure 2-3. Modeling approaches for each case study.
Case Study
Elements of modeling approaches Number of sets of results
Indoor dust modeling Blood Pb metric GSD
Concentration-response function
General Urban Case Study
2 models: (a) hybrid mechanistic-empirical (b) statistical (regression)
2 metrics: (a) concurrent (b) lifetime average
2 sets of GSDs, representing: (a) smaller scale (b) larger, regional scale
3 functions: (a) log-linear with linearization, (b) log-linear with cutpoint, and (c) two-piece linear
2 * 2 * 2 * 3 = 24
Each Point Source Case Study
1 model: statistical (regression) approach b
1 set of GSDs 1 * 1 * 2 * 3 =6
b Different models used for each point source case study. 4 5 The set of exposure and risk results generated for each case study and air quality scenario 6 using the alternative modeling approaches indicates to some extent the magnitude of uncertainty 7 surrounding the risk results. However, as discussed in Section 4.3, these sets of risk results do 8 not represent an uncertainty distribution, since confidence levels are not specified for each 9 modeling approach. In presenting the multiple sets of results generated for each case study, we
10 have selected the highest and lowest sets of risk results from those generated, and used them to 11 represent, respectively, upper- and lower-bounds on risk. The degree to which these actually 12 represent upper- and lower-bounds depends on the whether the various modeling approaches 13 evaluated in this analysis capture the largest sources of uncertainty. For example, if an important 14 source of uncertainty was excluded in designing the alternative modeling approaches for a given 15 case study, than the bounds represented by the set of risk results generated for that case study 16 might not be wide enough.
17 2.4.6.3 Sensitivity Analysis
18 Sensitivity analysis techniques were used to examine the uncertainty for individual 19 modeling elements and its impact on exposure and risk estimates. We used a "one element at a 20 time elasticity analysis" approach, running the full risk model with one of the selected modeling 21 elements adjusted to reflect an alternate input value or modeling choice. The results of that run 22 with the modified modeling element would then be compared to those for the "baseline risk" run 23 to determine the magnitude of the impact on risk results of selections for that one modeling 24 element.
July 2007 2-35 Draft – Do Not Quote or Cite
1 2 3 4 5 6 7 8 9
10 11 12
13 14 15 16 17 18 19 20
While the sensitivity analysis for the pilot was based on the primary Pb smelter case study, for the full-scale analysis we have focused the sensitivity analysis on the general urban case study. This reflects a desire to more fully understand the sensitivity of the modeling approach used for the urban case study to key sources of uncertainty, recognizing that the results of the pilot sensitivity analysis are informative with regard to the point source case studies. The sensitivity analysis completed for the full-scale analysis focused on those modeling elements (including input datasets and modeling steps) believed to have a significant potential for impacting exposure and risk results. Those modeling elements include oral uptake factor, inter-individual blood Pb variability GSD, biokinetic model, concentration-response function for IQ loss. This type of sensitivity analysis indicates which of the modeling elements included in the sensitivity analysis has the greatest impact on risk results, and can be used to guide future efforts to refine the overall risk model.
2.4.6.4 Qualitative Discussion of Sources of Uncertainty In addition to the quantitative analyses described above, we have also included a
qualitative discussion of key sources of uncertainty in the analysis. This includes sources not explicitly included in any of the above quantitative analyses due to a lack of necessary data (Section 4.3.1). This discussion also attempts to describe the nature of the impact of these sources of uncertainty on risk results, e.g., would a particular source of uncertainty likely result in an over- or under-estimation of risk. To the extent possible, the likely magnitude in qualitative terms of a particular source of uncertainty is also discussed.
July 2007 2-36 Draft – Do Not Quote or Cite
5
10
15
20
25
30
35
40
1 REFERENCES 2 3 Basha, M.R., Wei, W., Bakheet, S.A., Benitez, N., Sidiqi, H.K., Ge, Y.-W., Lahiri, D.K., Zawia, N.H. (2005) The 4 fetal basis of amyloidogenesis: exposure to lead and latent overexpression of amyloid precursor protein and
β-amyloid in the aging brain. J Neurosci. 25: 823-829.
6 Henderson, R. (2006) Clean Air Scientific Advisory Committee (CASAC) Lead Review Panel's Consultation on 7 EPA's Draft Analysis Plan for Human Health and Ecological Risk Assessment for the Review of the Lead 8 National Ambient Air Quality Standards. Memorandum to Stephan Johnson, EPA Administrator, from Dr. 9 Rogene Henderson. July. Available at http://www.epa.gov/sab/pdf/casac-con-06-006.pdf
Henderson, R. (2007) Clean Air Scientific Advisory Committee (CASAC) Review of the 1st Draft lead Staff Paper 11 and Draft Lead Exposure and Risk assessments. Memorandum to Stephan Johnson, EPA Administrator, 12 from Dr. Rogene Henderson. July. Available at http://www.epa.gov/sab/pdf/casac-07-003.pdf
13 ICF International. (2006). Lead Human Exposure and Health Risk Assessments and Ecological Risk Assessment for 14 Selected Areas. Pilot Phase. Draft Technical Report. Prepared for the U.S. EPA's Office of Air Quality
Planning and Standards, Research Triangle Park, NC. December. Available at: 16 http://www.epa.gov/ttn/naaqs/standards/pb/s_pb_cr_td.html
17 Lanphear, B. P.; Roghmann, K. J. (1997) Pathways of lead exposure in urban children. Environ. Res. 74: 67-73.
18 Lanphear, B. P.; Burgoon, D. A.; Rust, S. W.; Eberly, S.; Galke, W. (1998) Environmental exposures to lead and 19 urban children's blood lead levels. Environ. Res. 76: 120-130.
Lanphear, B.P., Hornung, R., Khoury, J., Yolton, K., Baghurst, P., Bellinger, D.C., Canfield, R.L., Dietrich, K.N., 21 Bornschein, R., Greene, T., Rothenberg, S.J., Needleman, H.L., Schnaas, L., Wasserman, G., Graziano, J., 22 and Robe, R. (2005) Low-level environmental Pb exposure and children's intellectual function: An 23 international pooled analysis. Environmental Health Perspectives. 113(7):894-899.
24 Missouri Department of Natural Resources (MDNR). (2007) 2007 Revision of the State Implementation Plan for the Herculaneum Lead Nonattainment Area, as adopted by the Missouri Air Conservation Commission April
26 26, 2007.
27 National Center for Health Statistics. (2005) Health, United States, 2005. With Chartbook on Trends in the Health 28 of Americans. Hyattsville, Maryland.
29 Rothenberg, S.J.; Rothenberg, J.C. (2005) Testing the dose-response specification in epidemiology: public health aand policy consequences for lead. Environ. Health Perspect. 113: 1190-1195.
31 U.S. Environmental Protection Agency. (1978) National Primary and Secondary Ambient Air Quality Standards for 32 Lead. Federal Register 43(194): 46246-46263. Oct 5, 1978. Available at: 33 http://www.epa.gov/ttn/naaqs/standards/pb/s_pb_pr_fr.html
34 U.S. Environmental Protection Agency. (1986) Air quality criteria for lead. Research Triangle Park, NC: Office of Health and Environmental Assessment, Environmental Criteria and Assessment Office; EPA report no.
36 EPA-600/8-83/028aF-dF. 4v. Available from: NTIS, Springfield, VA; PB87-142378.
37 U.S. Environmental Protection Agency. (1989) Review of National Ambient Air Quality Standard for Pb: Exposure 38 Analysis Methodology and Validation. Research Triangle Park, NC: Office of Air Quality Planning and 39 Standards. EPA-450/2-89-011. June. Available at:
http://www.epa.gov/ttn/naaqs/standards/pb/s_pb_pr_td.html
41 U.S. Environmental Protection Agency. (1990) Review of the National Ambient Air Quality Standards for Lead: 42 Assessment of Scientific And Technical Information: OAQPS Staff Paper. Research Triangle Park, NC:
July 2007 2-37 Draft – Do Not Quote or Cite
1 Office Of Air Quality Planning and Standards; report no. EPA-450/2-89/022. Available from: NTIS, 2 Springfield, VA; PB91-206185. http://www.epa.gov/ttn/naaqs/standards/pb/s_pb_pr_sp.html.
3 U.S. Environmental Protection Agency. (2003) Framework for Cumulative Risk Assessment. Risk Assessment 4 Forum, Washington, DC, EPA/630/P-02/001F. May
5 U.S. Environmental Protection Agency. (2005) Review of the National Ambient Air Quality Standards for 6 Particulate Matter: Policy Assessment of Scientific And Technical Information: OAQPS Staff Paper. 7 Research Triangle Park, NC: Office Of Air Quality Planning and Standards. EPA-452/R-05-005a. 8 December.
9 U.S. Environmental Protection Agency. (2006a). Draft Analysis Plan for Human Health and Ecological Risk 10 Assessment for the Review of the Pb National Ambient Air Quality Standards. Office of Air Quality 11 Planning and Standards, Research Triangle Park, NC. May 31, 2006. Available at: 12 http://www.epa.gov/ttn/naaqs/standards/pb/s_pb_cr_pd.html
13 U.S. Environmental Protection Agency. (2006b). Review of the National Ambient Air Quality Standards for Lead: 14 Policy Assessment of Scientific and Technical Information. OAQPS Staff Paper – First Draft. Office of Air 15 Quality Planning and Standards. Research Triangle Park, NC. December 2006. Available at: 16 http://www.epa.gov/ttn/naaqs/standards/pb/s_pb_cr_sp.html
17 U.S. Environmental Protection Agency. (2006c) Lead soil trend analysis through May, 2006. Evaluation by 18 individual quadrant. Herculaneum lead smelter site, Herculaneum, Missouri. Prepared by TetraTech for 19 U.S. EPA, Region 7. Available on the web, at: 20 http://www.epa.gov/region7/cleanup/superfund/herculaneum_pbtrend_thru_may2006.pdf
July 2007 2-38 Draft – Do Not Quote or Cite
1 3 EXPOSURE ASSESSMENT
2 This chapter describes the methods and results of the exposure assessment and 3 performance evaluation.
4 3.1 METHODS FOR ESTIMATING MEDIA CONCENTRATIONS 5 To estimate media Pb concentrations for the three case studies, we used a combination of 6 empirical data and fate and transport modeling, reflecting the different availability of Pb 7 measurements for the two point source case studies and the non-location specific nature of the 8 general urban case study (Table 3-1). For all three case studies, media concentrations were 9 estimated for multiple air quality scenarios including a range of alternative NAAQS (see Section
10 2.3). However, outdoor dust/soil concentrations for each of the three case studies were 11 established for current conditions or the current NAAQS scenarios and those values were used 12 for the current NAAQS and each of the alternate NAAQS scenarios evaluated (see Sections 2.3.3 13 and 3.1.3). Further, as described in Section 2.4.1, media concentrations, once defined, are held 14 constant for the full exposure period simulated with the blood Pb modeling. For ambient air, 15 outdoor soil/dust and indoor dust, estimates of annual average concentration were used for this 16 purpose for all three case studies. Additionally, from the ambient air concentrations, annual 17 average inhalation exposure concentrations were estimated with consideration for daily activity 18 patterns by children and differences in outdoor (ambient) versus indoor air Pb levels (see Section 19 3.1.2).
July 2007 3-1 Draft – Do Not Quote or Cite
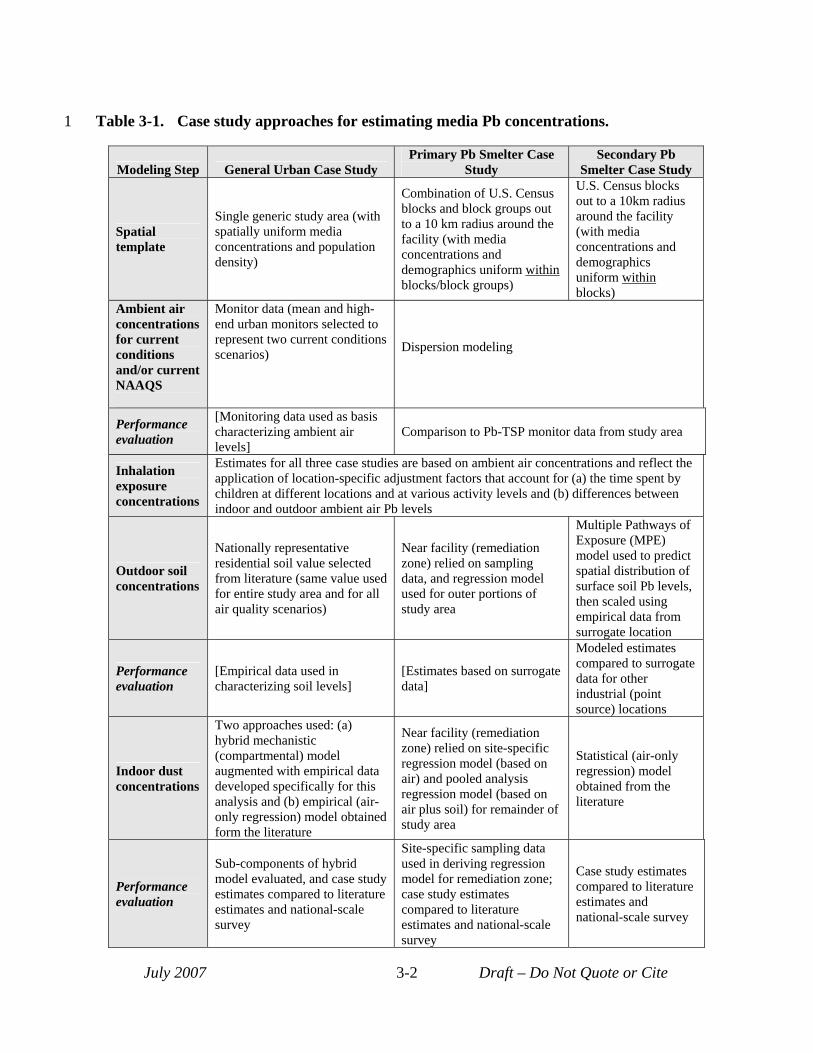
1 Table 3-1. Case study approaches for estimating media Pb concentrations.
Modeling Step General Urban Case Study Primary Pb Smelter Case
Study Secondary Pb
Smelter Case Study
Spatial template
Single generic study area (with spatially uniform media concentrations and population density)
Combination of U.S. Census blocks and block groups out to a 10 km radius around the facility (with media concentrations and demographics uniform within blocks/block groups)
U.S. Census blocks out to a 10km radius around the facility (with media concentrations and demographics uniform within blocks)
Ambient air concentrations for current conditions and/or current NAAQS
Monitor data (mean and high-end urban monitors selected to represent two current conditions scenarios) Dispersion modeling
Performance evaluation
[Monitoring data used as basis characterizing ambient air levels]
Comparison to Pb-TSP monitor data from study area
Inhalation exposure concentrations
Estimates for all three case studies are based on ambient air concentrations and reflect the application of location-specific adjustment factors that account for (a) the time spent by children at different locations and at various activity levels and (b) differences between indoor and outdoor ambient air Pb levels
Outdoor soil concentrations
Nationally representative residential soil value selected from literature (same value used for entire study area and for all air quality scenarios)
Near facility (remediation zone) relied on sampling data, and regression model used for outer portions of study area
Multiple Pathways of Exposure (MPE) model used to predict spatial distribution of surface soil Pb levels, then scaled using empirical data from surrogate location
Performance evaluation
[Empirical data used in characterizing soil levels]
[Estimates based on surrogate data]
Modeled estimates compared to surrogate data for other industrial (point source) locations
Indoor dust concentrations
Two approaches used: (a) hybrid mechanistic (compartmental) model augmented with empirical data developed specifically for this analysis and (b) empirical (aironly regression) model obtained form the literature
Near facility (remediation zone) relied on site-specific regression model (based on air) and pooled analysis regression model (based on air plus soil) for remainder of study area
Statistical (air-only regression) model obtained from the literature
Performance evaluation
Sub-components of hybrid model evaluated, and case study estimates compared to literature estimates and national-scale survey
Site-specific sampling data used in deriving regression model for remediation zone; case study estimates compared to literature estimates and national-scale survey
Case study estimates compared to literature estimates and national-scale survey
July 2007 3-2 Draft – Do Not Quote or Cite
1 2 3 4
5 6
7 8 9
10 11 12 13 14 15 16 17 18 19 20 21 22 23 24 25 26 27 28 29 30 31 32 33 34 35
3.1.1 Ambient Air Concentrations Different methods were used for estimating annual average ambient air concentrations for
the three case studies. For the primary and secondary Pb smelter case studies, air dispersion modeling of Pb emissions was performed, while Pb-TSP measurement data from the years 20032005 for urban areas with greater than one million residents were used for the general urban case study.
3.1.1.1 General Urban Case Study The general urban case study is not site-specific and has been designed to represent
general Pb exposures experienced by children residing in urban areas within the United States. The case study involves spatially uniform Pb concentrations in ambient air, outdoor soil/dust and indoor dust with a matching uniformly distributed child resident population. This is in contrast to the point source case studies which each have a relatively large number of exposure zones to track potentially significant spatial gradients in their concentrations of Pb in environmental media and the spatial distribution of children.
Two current conditions scenarios are included in the general urban case study based on Pb-TSP monitoring data from urban areas in the United States. Specifically, these two scenarios include: (a) a central tendency current conditions scenario based on the mean maximum quarterly average Pb measurement (0.14 µg/m3) seen, in 2003-05 time period, at Pb-TSP monitors in urban areas with greater than a million people, and (b) a high-end current conditions scenario based on the 95th percentile maximum quarterly average Pb measurement (0.87 µg/m3) obtained from the same urban Pb-TSP dataset. The data analysis associated with these values is described in Appendix A, Section A.2.2.2.
In addition to these current conditions scenarios, the current NAAQS scenario (1.5 µg/m3, as a maximum quarterly average) and four alternate NAAQS scenarios have also been evaluated (see Section 2.3 for additional details on the NAAQS scenarios). In each of these instances, the specific NAAQS of interest has been evaluated by assuming that air Pb concentrations in the entire study area are reduced to meet that specific ambient air Pb level and form.
Because the blood Pb modeling (Section 3.2) is based on annual average media concentrations, the maximum quarterly and maximum monthly average values used in defining the air quality scenarios were translated into equivalent annual average ambient air concentrations for the blood Pb modeling (Section 2.4.1). This is accomplished using ratios obtained from the 2003-2005 Pb-TSP monitoring dataset that relates maximum quarterly or maximum monthly averages to associated annual average values for each monitor located in an urban area of population more than a million (Appendix A, Section A.2.2). Ratios were selected
July 2007 3-3 Draft – Do Not Quote or Cite
1 2 3 4 5 6 7 8 9
10 11 12 13
14 15 16 17 18 19 20 21 22 23 24 25 26 27 28 29 30 31 32 33
for each of the air quality scenarios according to the averaging time (calendar quarter versus month) and the percentile represented by the air quality scenario (e.g., mean versus high-end for current conditions). Consequently, the annual average Pb concentration for the central tendency current conditions scenario was derived from the mean of monitor-specific maximum quarterly average concentrations using the mean of the monitor-specific maximum quarterly-to-annual average ratios, while the high-end current conditions scenario was derived from the 95th
percentile of monitor-specific maximum quarterly average concentrations using the 95th
percentile of the monitor-specific maximum quarterly-to-annual average ratios. The mean of the maximum quarterly-to-annual average ratios was also used to derive the annual average concentration estimates for the alternative NAAQS air quality scenario with a quarterly averaging time. The mean of the maximum monthly-to-annual average ratios was used to derive the annual average concentration estimates for the alternative NAAQS scenarios with monthly averaging times. The derivation of these ratios is described in Appendix A, Section A.2.2.
3.1.1.2 Primary Pb Smelter Case Study The air quality scenarios included for the primary Pb smelter case study were attainment
of the current NAAQS and four alternate NAAQS (see Section 2.3.1). As the study area of the primary Pb smelter is currently in non-attainment for the current NAAQS, ambient air Pb concentrations for the current NAAQS scenario were estimated using the model, emissions and source parameters used in developing the 2007 proposed revision to the State Implementation Plan for the area (MDNR, 2007). Annual average Pb concentration estimates for the current NAAQS scenario were derived for each census block or block group from model outputs. Additionally, for the purposes of developing the alternative NAAQS attainment scenarios, hourly estimates from the model were used to generate quarterly average and monthly average concentrations for each census block or block group. A proportional rollback procedure was then used to adjust the set of maximum monthly or quarterly averages to represent attainment of a particular NAAQS scenario. That is, the block or block group with the greatest exceedance was reduced to meet the particular NAAQS and all locations were then reduced by that same fraction. After the proportional rollback procedure had been applied to the set of location-specific monthly or quarterly averages to attain a particular NAAQS, these adjusted quarterly- or monthly-average values were then used to derive annual averages which, in turn, were used in the exposure analysis.
The development of air Pb concentration estimates for this case study is described more fully in Appendix D, Section D.2.
July 2007 3-4 Draft – Do Not Quote or Cite
1 3.1.1.3 Secondary Pb Smelter Case Study 2 Outdoor air concentration and deposition rates for Pb were estimated for the secondary 3 Pb smelter case study current conditions scenario using the AERMOD dispersion model1 and 4 source characterization and emissions information for the facility (See Appendix E, Section E.2 5 for details). The Pb emissions modeled reflected processes at the facility (e.g., stack emissions) 6 and fugitive dust emissions from materials storage and handling and roadway dust. 7 Annual average Pb concentrations for the current conditions scenario (in which the 8 current NAAQS is attained) were derived for each census block from model outputs. As with 9 the primary Pb smelter case study, alternative NAAQS scenarios were modeled using the
10 proportional rollback procedure (see Section 3.1.1.2). 11 The development of air Pb concentration estimates for this case study is described more 12 fully in Appendix E, Section E.2.
13 3.1.2 Inhalation Exposure Concentrations 14 Inhalation exposure concentrations for Pb were estimated for young children, the 15 population of interest, from the estimated ambient air concentrations using age group- and 16 location-specific relationships for Pb developed using the exposure modeling component of 17 EPA’s 1999 national-scale air toxics assessment (USEPA 2006a), one of the U.S. EPA’s 18 National Air Toxics Assessment (NATA) activities. These relationships account for air 19 concentration differences indoors and outdoors and mobility or time spent in different locations 20 (e.g., outdoors at home, inside at home etc.) for the population of interest. 21 The exposure modeling component of the NATA national-scale assessment generated 22 inhalation exposure concentrations for sets of modeled children for each U.S. Census tract 23 (USEPA, 2006a). For the two point source case studies, we used the ratio of these NATA-based 24 inhalation exposure concentrations to the NATA national-scale assessment’s corresponding 25 estimates of ambient air Pb concentration matched by U.S. Census tract to develop adjustment 26 factors that could be used to derive inhalation exposure concentrations from our estimates of 27 ambient air Pb concentration (see Attachment D, Section D.2.3, and Attachment E, Section E.2.3 28 for additional detail on this procedure). For the general urban case study, we used the median 29 adjustment factor from the full NATA national-scale assessment. The 0-4 years old age group is 30 the closest age group to the age group of interest for this assessment for which outputs are 31 available. For this age group, the adjustment factors or ratios between NATA national-scale 32 assessment Pb inhalation exposure concentrations and ambient air concentrations ranged from
1 AERMOD is the current preferred Gaussian plume dispersion model for assessing stationary sources under the Clean Air Act (70FR(216): 68217-68261).
July 2007 3-5 Draft – Do Not Quote or Cite
5
10
15
20
25
30
1 0.37 to 0.46 for the Census tracts within the two point source case study areas. A value of 0.43 2 was used for the general urban case study (see Appendix C, Section C.1.2). Use of these ratios 3 for the 0 to 4 year old age group to represent the 0 to 7 year old age group modeled in the full4 scale analysis contributes some uncertainty in the estimate of inhalation exposure concentrations.
3.1.3 Outdoor Surface Soil/Dust Concentrations 6 Pb concentrations in outdoor surface soil/dust were characterized for the current 7 conditions or current NAAQS attainment scenarios for the three case studies using a combination 8 of modeling and empirical data. These estimates were also used for the alternate NAAQS 9 scenarios. That is, it was assumed that reductions in ambient air concentrations associated with
the alternate NAAQS scenarios did not have a significant impact on soil concentrations2.
11 3.1.3.1 General Urban Case Study 12 The outdoor surface soil concentration for the general urban case study was derived after 13 considering empirical data collected both at urban and other residential areas across the United 14 States (Appendix C, Section C.2). A single outdoor soil Pb level representative of general
residential yards in the U.S. was then selected for use with this case study. Specifically, a 16 nationally representative arithmetic mean of yard-wide soil Pb levels (198 µg/g) was obtained 17 from the National Study of Lead and Allergen in Housing (NSLAH) (USEPA, 2000). The 18 NSLAH survey, which was conducted by the Department of Housing and Urban Development 19 (HUD) between 1998 and 1999, was intended to generate a nationally representative sample of
residential housing, including both private and public residences constructed between 1940 and 21 1998 (but excluding institutional and group housing).
22 3.1.3.2 Primary Pb Smelter Case Study 23 In the primary Pb smelter case study, a different approach was used to estimate outdoor 24 surface soil/dust Pb concentrations near the facility than that used for more distant locations.
This difference is in recognition of the remediation activities that have included the removal of 26 contaminated soil at many of the residential yards closest to the facility, and replacement with 27 "clean" soil. Consequently, soil Pb concentrations are estimated using a combination of 28 measurement data for blocks within the remediation zone and statistically-based predictions 29 beyond the remediation zone (see Appendix D, Section D.3 for more detail).
Surface soil/dust Pb levels near the facility (within the remediation zone) are based on the 31 most recent post-remediation measurements available for a given block. Pre-remediation soil
2 As mentioned in Section 2.3.3, this also presumes that implementation methods for any of the alternate NAAQS do not involve taking action to separately change soil Pb concentrations.
July 2007 3-6 Draft – Do Not Quote or Cite
1 2 3 4 5 6 7 8 9
10 11 12 13 14 15 16 17 18 19 20 21 22 23 24 25
26 27 28 29 30 31 32 33 34 35
levels are not used in estimating soil levels within the remediation zone. Although analyses of sequential (over time) post-remediation measurements have indicated recontamination of remediated yards (USEPA, 2006b), the post-remediation measurement based estimates were used for the current NAAQS scenario, and for the alternate NAAQS scenarios. It is recognized that this approach may produce an underestimate of Pb exposure for the ingestion of surface soil/dust for the current NAAQS scenario, and perhaps some alternate NAAQS scenarios. However, an analysis of the impact of a reduced NAAQS on the remediation zone temporal trend in surface soil/dust Pb levels was not available to inform an alternate approach. Further, the impact of such a potential bias is limited to the surface soil/dust pathway and does not affect the indoor dust pathway because the indoor dust Pb concentrations for this region of the primary Pb smelter case study were derived using an approach that did not rely on outdoor soil/dust Pb concentrations.
Characterization of soil levels for blocks and block groups beyond the remediation zone are based on a regression model predicting soil Pb as a function of distance from the facility, which was fitted to pre-remediation soil measurement data (available closer to the facility). The use of pre-remediation soil data in deriving the regression equation reflects the fact that little remediation has occurred in these more distant locations and consequently, spatial trends seen in the pre-remediation soil levels are more likely to be representative for these outer portions of the study area. The regression model used in these estimates has an r2 of 0.92 which suggests a good fit and increases overall confidence in these statistical estimates. However, it should be noted that this increased confidence holds for areas of interpolation (areas with sampling data used to fit the model – out to about 2.3 km from the facility) more than for areas of extrapolation (areas without sampling data – beyond 2.3 km from the facility).
The development of surface soil/dust Pb concentration estimates for this case study is described more fully in Appendix D, Section D.3.
3.1.3.3 Secondary Pb Smelter Case Study
As noted in Section 2.2.2.2, soil sampling data for Pb were not identified for this case study. Consequently, a hybrid model-empirical approach was used to characterize soil Pb levels for this case study, with fate and transport modeling employed to derive a soil Pb concentration surface for the study area and sampling data obtained from a surrogate secondary Pb smelter study area employed to adjust (calibrate) that surface.
In lieu of historical estimates of emissions, the fate and transport modeling was performed using current emissions estimates over a period consistent with the operating period of the facility. As the emissions estimates used did not reflect levels of historical emissions, generally believed to have been much higher than current estimates, the resultant Pb
July 2007 3-7 Draft – Do Not Quote or Cite
1 2 3 4 5 6 7 8 9
10 11 12
13 14 15 16 17 18 19 20 21 22 23 24 25 26 27 28 29 30 31 32 33 34 35
concentrations did not reflect current conditions for the location, and, as expected, were lower than concentrations reported for areas near other secondary smelters (see comparisons in Appendix E, Section E.3). Accordingly, the soil concentration surface was scaled up based on a factor derived from empirical data from a surrogate secondary Pb smelter location. Specifically, Pb concentrations across the entire modeled surface were increased by a factor of three to obtain surface soil/dust Pb concentrations consistent with those reported in the literature for areas near secondary Pb smelters. These estimates for the current conditions scenario were also used for the alternate NAAQS scenarios. That is, it was assumed that reductions in ambient air concentrations associated with the alternate NAAQS scenarios did not have a significant impact on soil concentrations.
The development of surface soil/dust Pb concentration estimates for this case study is described more fully in Appendix E, Section E.3.
3.1.4 Indoor Dust Concentrations Pb in indoor dust can originate from a variety of sources including (a) outdoor soil which
is tracked into the house, (b) Pb in outdoor soil which is resuspended into the air and subsequently transported indoors (c) Pb released directly into outdoor air through ongoing anthropogenic activity (e.g., industrial point emissions) which is transported indoors and (d) interior sources of Pb (e.g., paint, hobbies) (Adgate et al., 1998, Von Lindern, 2003). In the exposure assessment conducted for the 1990 Staff Paper, indoor dust Pb concentrations were predicted based on Pb concentrations in outdoor soil and ambient air (USEPA, 1989). This is also the case for the default approach in the exposure component of the IEUBK model (USEPA, 1994a).
The importance of outdoor soil relative to outdoor air in influencing indoor dust Pb levels appears to depend on the nature of the Pb sources involved. Investigations in urban areas and near contaminated waste sites with elevated soil Pb levels without a currently active industrial point source emitter of Pb have indicated a greater association of measurements of dust Pb concentration with measurements of soil Pb concentration than with measurements of ambient air concentration (e.g., Adgate, 1998 and Von Lindern, 2003). By contrast, investigations in areas with currently operating large point sources of Pb (e.g., active Pb smelters) have implicated ambient air Pb as an important source of Pb to indoor dust (Hilts, 2003). Contributions of ambient air Pb to indoor dust Pb levels have also been illustrated by a deposition study conducted in New York City (Caravanos et al., 2006). Caravanos and others described Pb deposition indoors resulting primarily from exterior environmental sources and not from interior Pb sources. For additional discussion of the relationship between indoor dust Pb, outdoor ambient air Pb and other related factors, refer to Appendix G, Section G.2
July 2007 3-8 Draft – Do Not Quote or Cite
1 2 3 4 5 6 7 8 9
10 11 12 13 14 15 16 17 18 19 20 21 22 23 24 25 26 27 28 29 30 31 32 33
The prediction of indoor dust Pb based on Pb concentrations in outdoor ambient air and other media (e.g., outdoor soil/dust Pb, indoor paint) can be conducted using empirically-based statistical models, physically-based mechanistic models, or by a combination of both techniques. Empirically-based statistical models (typically implemented as regression models) have the advantage of being able to specify a relationship between indoor dust Pb and predictor variables (e.g., outdoor soil/dust, outdoor air) even when these relationships are complex and highly uncertain. However, statistical models have the disadvantage of requiring a significant amount of site-specific data for their derivation and not being well-suited to extrapolation to scenarios with conditions different from those underlying their development. Mechanistic models, by contrast, can be developed in the absence of extensive site-specific data and are not as limited in the types of scenarios to which they can be applied as long as those scenarios are conceptually consistent with the scenario underlying their development. However, the development of mechanistic models can be quite challenging and subject to significant uncertainty if the system or process being predicted is complex and highly uncertain.
To date, efforts to predict indoor dust Pb have focused primarily on the development of empirically-based statistical (regression) models (EPA, 1989). Furthermore, most of these regression models have been based on data associated with large industrial point sources (smelters) and their impacts on surrounding residential populations. Little progress has been made in developing comparable models for areas where ambient Pb levels are not so greatly influenced by a large industrial point source, such as in more general urban residential areas, including either regression models specific to these more general urban scenarios, or physically-based mechanistic models which could be applied more readily to different exposure scenarios including urban residential populations.
In this assessment, a combination of (a) statistical (regression) models obtained from the literature, (b) statistical regression model developed specifically for individual case studies and (c) physically-based mechanistic models (developed specifically for the general urban case study) was used in predicting indoor dust Pb. This reflects the fact that varying amounts of site-specific data were available across the three case studies for characterizing indoor dust Pb and related factors. In addition, the absence of statistical regression models in the literature specifically focused on urban residential locations necessitated the development of a hybrid empirical-mechanistic model for the general urban case study (see below). The approaches used to predict indoor dust Pb for each of the case studies are presented below and described in greater detail in Appendix G.
July 2007 3-9 Draft – Do Not Quote or Cite
1 2 3 4 5 6 7 8 9
10 11 12 13 14 15 16 17 18 19 20 21 22 23 24 25 26 27 28 29 30 31 32 33 34 35 36
3.1.4.1 General Urban Case Study Two models are used to estimate indoor dust Pb in the general urban case study: a hybrid
mechanistic-empirical model (the hybrid model), and a regression-based model. Application of these models with the ambient air Pb concentrations for this case study produced two sets of indoor dust Pb estimates for each air quality scenario (see Appendix C, Section C.3).
The hybrid model uses a mechanistic model to predict indoor dust Pb resulting from the infiltration of outdoor air containing Pb into indoor residential air with subsequent contribution to indoor dust Pb. This portion of indoor dust Pb derived with this model is subsequently referred to in this document as the recent air or recent ambient air related component or contribution to indoor dust Pb. To the extent that outdoor air Pb includes contributions from resuspension of historically deposited Pb, it is represented here. Other contributions to indoor dust Pb (e.g., tracking of outdoor soil/dust indoors, indoor paint flaking, etc.) are addressed using an empirically based estimate derived from a national-scale dataset characterizing indoor dust Pb loadings in U.S. residences (the U.S. Housing and Urban Development [HUD] National Survey of Lead-Based Paint in Housing - USEPA, 1995). When combined, the recent air component (derived using the mechanistic model) and the other contributions component (derived using the HUD dataset) provide an estimate of total indoor dust Pb for the general urban case study (Appendix C, Exhibit C-7). Note that while the indoor dust Pb concentration contributed by the hybrid model's recent air Pb component will vary, depending on the ambient air Pb level, the concentration contributed from other sources will remain constant across the different air quality scenarios. The two components of the hybrid model (the mechanistic and empirical) are described in greater detail below.
The mechanistic model linking ambient air Pb to indoor dust Pb was developed by obtaining the steady-state solution to a dynamic mass-balance equation that predicts Pb in both indoor air and indoor floor dust as a function of outdoor air Pb. This dynamic mass-balance equation was developed specifically for this assessment. In recognition of the complexity of the larger task of simulating contributions to indoor dust Pb from all sources, the mechanistic model development activity was limited to the area considered most essential to the needs of this assessment, i.e., the contribution to indoor dust Pb from recent ambient air. See Appendix G, Section G.3.2 for additional detail on the derivation of the mechanistic ambient air-to-indoor dust Pb model.
As noted above, contributions of other sources to Pb in indoor dust were addressed in the hybrid model using empirical data (rather than trying to model them mechanistically). The HUD dataset, described above, that characterized the national distribution of residential indoor dust Pb (USEPA, 1995) was selected as the basis for this other sources component of indoor dust Pb. Specifically, a median value from the HUD dataset characterizing residential indoor dust Pb
July 2007 3-10 Draft – Do Not Quote or Cite
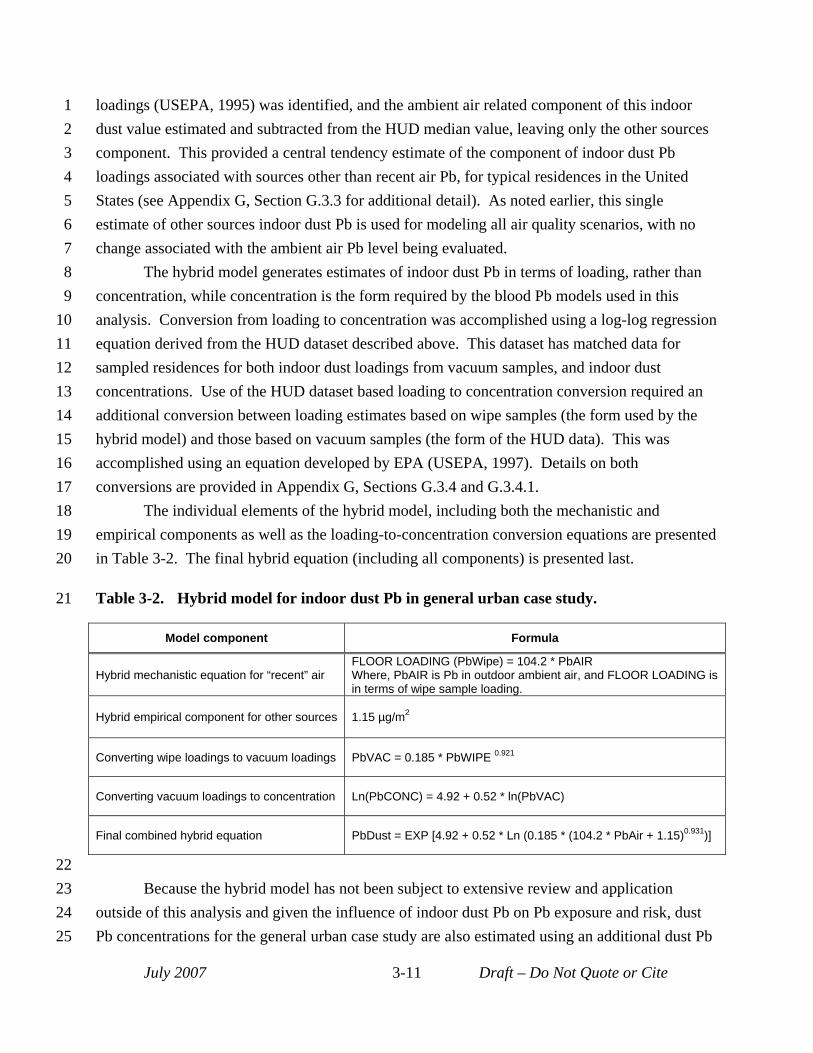
1 loadings (USEPA, 1995) was identified, and the ambient air related component of this indoor 2 dust value estimated and subtracted from the HUD median value, leaving only the other sources 3 component. This provided a central tendency estimate of the component of indoor dust Pb 4 loadings associated with sources other than recent air Pb, for typical residences in the United 5 States (see Appendix G, Section G.3.3 for additional detail). As noted earlier, this single 6 estimate of other sources indoor dust Pb is used for modeling all air quality scenarios, with no 7 change associated with the ambient air Pb level being evaluated. 8 The hybrid model generates estimates of indoor dust Pb in terms of loading, rather than 9 concentration, while concentration is the form required by the blood Pb models used in this
10 analysis. Conversion from loading to concentration was accomplished using a log-log regression 11 equation derived from the HUD dataset described above. This dataset has matched data for 12 sampled residences for both indoor dust loadings from vacuum samples, and indoor dust 13 concentrations. Use of the HUD dataset based loading to concentration conversion required an 14 additional conversion between loading estimates based on wipe samples (the form used by the 15 hybrid model) and those based on vacuum samples (the form of the HUD data). This was 16 accomplished using an equation developed by EPA (USEPA, 1997). Details on both 17 conversions are provided in Appendix G, Sections G.3.4 and G.3.4.1. 18 The individual elements of the hybrid model, including both the mechanistic and 19 empirical components as well as the loading-to-concentration conversion equations are presented 20 in Table 3-2. The final hybrid equation (including all components) is presented last.
21 Table 3-2. Hybrid model for indoor dust Pb in general urban case study.
Model component Formula
Hybrid mechanistic equation for “recent” air FLOOR LOADING (PbWipe) = 104.2 * PbAIR Where, PbAIR is Pb in outdoor ambient air, and FLOOR LOADING is in terms of wipe sample loading.
Hybrid empirical component for other sources 1.15 µg/m2
Converting wipe loadings to vacuum loadings PbVAC = 0.185 * PbWIPE 0.921
Converting vacuum loadings to concentration Ln(PbCONC) = 4.92 + 0.52 * ln(PbVAC)
Final combined hybrid equation PbDust = EXP [4.92 + 0.52 * Ln (0.185 * (104.2 * PbAir + 1.15)0.931)]
22 23 Because the hybrid model has not been subject to extensive review and application 24 outside of this analysis and given the influence of indoor dust Pb on Pb exposure and risk, dust 25 Pb concentrations for the general urban case study are also estimated using an additional dust Pb
July 2007 3-11 Draft – Do Not Quote or Cite
1 2 3 4 5 6 7 8 9
10
11 12 13 14 15 16 17 18 19 20 21 22 23 24 25 26 27 28 29 30 31 32 33 34 35
model (see Appendix G, Section G.3.5). The use of two models is intended to inform our characterization of model uncertainty in this key portion of the analysis. Specifically, we have included the air-only regression model (EPA, 1989) as a second, parallel approach in predicting indoor dust Pb. That model estimates indoor dust Pb based on (a) outdoor ambient air Pb (multiplied by an air-related factor) and (b) an intercept which captures other impacts besides air (e.g., indoor paint). The air-factor used in this equation is expected to capture longer-term impacts of outdoor air Pb on indoor dust, including the indirect effect of air Pb on outdoor soil/dust Pb with subsequent impacts of that outdoor soil/dust Pb on indoor dust Pb through other mechanisms (EPA, 1989). The air-only regression model is presented below:
PbDUST(mg/kg or ppm) = 60 + 844 * PbAIR(μg/m3)
3.1.4.2 Primary Pb Smelter Case Study We used different regression models for predicting Pb concentrations in indoor dust in
areas near the primary Pb smelter facility where soil has been remediated and more distant areas. For the remediation zone near the facility, a regression equation was developed using dust Pb measurements which had been collected from some of the houses within this area. These data, while adequate for development of a site-specific regression model, did not have sufficient spatial coverage to be used alone to represent indoor dust Pb levels for that portion of the study area. For the remainder of the study area, we employed a regression equation developed for the last review (USEPA, 1989). Because of the presumed impact of the remediation activity on dust Pb, the site-specific dust Pb model developed for the remediation zone was not considered appropriate for use in areas beyond that area.
The dataset used to develop the model for the remediation zone was based on indoor dust samples collected in 17 houses within the remediation zone. Independent variables included in the analysis were: (a) estimated annual average Pb concentrations in air at census block centroids located within 200 meters of each of the 17 houses, (b) road dust Pb measurements for locations within 300 meters of each house and (c) post-remediation residential soil Pb measurements for the yard of each house. Pre-remediation soil Pb concentrations were not included in the regression analysis since they were not expected to represent current conditions at the site. Multiple samples for each medium associated with a specific house within the dataset (e.g., reflecting multiple samples collected over time) were averaged to produce a "temporallyaveraged" value. A number of regression models were evaluated, (see Appendix G, Section G.4), and the “H6” model was ultimately selected based on goodness of fit and other considerations. This model relates the natural log of indoor house dust to the natural log of ambient air Pb (r2=0.701):
ln(house dust, mg/kg or ppm) = 8.3884 + 0.73639*ln(air Pb, μg/m3)
July 2007 3-12 Draft – Do Not Quote or Cite
1 2 3 4 5 6 7 8 9
10 11 12 13 14 15 16 17 18 19 20 21 22 23 24
25 26 27 28 29 30 31 32 33 34 35
Several points regarding the other variables considered for the remediation zone regression are noted here. For example, road dust Pb concentration was not found to have significant predictive power for indoor dust Pb. This may reflect the fact that the road dust Pb dataset does not provide significant coverage for homes located near to the truck haul routes. Additionally, yard soil Pb concentration was found to be slightly, and statistically significantly, negatively correlated with indoor dust Pb levels. This counter-intuitive finding may be a result of the existence within the remediation zone of a patchwork of remediated yards, such that the remediation activity may have interfered with any correlation between yard soil Pb levels, ambient air Pb levels and indoor dust Pb levels that might have existed previously. The resulting slight negative correlation of dust Pb levels with soil Pb levels led us to exclude soil Pb from the model. The y-intercept for the selected model may reflect a number of factors not correlated with ambient air or distance from the facility, such as a general level of soil Pb contamination in the area and indoor Pb paint.
For areas beyond the remediation zone, we used a regression equation developed during the last review from data collected at a number of operational primary Pb smelters, including this case study location (USEPA, 1989, Appendix B). This model, the "AGG" or "aggregate" model, predicts indoor dust Pb concentration from both outdoor soil and ambient air Pb concentrations. We have selected the AGG model for the non-remediation portion of the primary Pb smelter case study area since this area has not been subjected to extensive remediation and is therefore likely to resemble the locations included in the pooled dataset used in deriving this model in terms of relationships among air, outdoor surface soil/dust and indoor dust. The AGG air and soil regression model (USEPA, 1989), selected for areas beyond the remediation zone is the following:
House dust (mg/kg or ppm) = 31.3 + 638*air Pb (μg/m3) + 0.364*soil Pb (mg/kg)
3.1.4.3 Secondary Pb Smelter Case Study A version of the empirical regression model used for the primary Pb smelter (USEPA,
1989) was also used for the secondary Pb smelter case study. In this case study, an air-only version of the model (USEPA, 1989) was employed reflecting the reduced overall confidence associated with soil characterization at this case study (see Section 3.1.3.3). The AGG model for estimating indoor dust (USEPA, 1989) was derived in two forms including an air-only model that based indoor dust concentrations on outdoor ambient air Pb (without explicitly considering outdoor soil Pb levels) and an air+soil model which based estimates on both outdoor soil and ambient air Pb data. It is important to note, however, that the air-only model implicitly reflects some consideration for the air-to-soil-to-indoor dust mechanism in the air signal. Specifically, the larger air factor for the air-only model relative to the air+plus dust model's air factor, reflects
July 2007 3-13 Draft – Do Not Quote or Cite
5
10
15
20
25
30
1 contribution of air Pb both directly to dust through penetration indoors and subsequent 2 deposition to surfaces and indirectly to dust through deposition to outdoor soil which impacts 3 indoor dust (USEPA, 1989). This air-only regression model (USEPA, 1989) is as follows: 4 House dust (mg/kg or ppm) = 60 + 844*air Pb (μg/m3)
The model used for this case study was based on a number of studies focusing mainly on 6 primary Pb smelters (a number of primary Pb smelters were operational at the time of model 7 development). This may introduce uncertainty into indoor dust Pb predictions generated for this 8 case study to the extent that factors related to the dependency of indoor dust Pb on ambient air 9 Pb, such as particle size profiles and the nature of the airborne Pb compounds, differ for primary
versus secondary Pb smelters.
11 3.2 METHODS FOR ESTIMATING BLOOD PB LEVELS 12 This section presents the methodology used to estimate blood Pb levels in the child study 13 populations. The section begins with an overview of the primary biokinetic model used in the 14 full-scale risk analysis, the Integrated Exposure and Uptake Biokinetic model (USEPA, 1994a).
Findings associated with the use of both the IEUBK and Leggett models in the pilot analysis, in 16 addition to subsequent performance evaluation analyses (see Appendix J) contributed to the 17 decision to use IEUBK as the primary blood Pb model and reserve the Leggett model for use in 18 the sensitivity analyses. In addition, we have considered an empirical slope model (the Lanphear 19 model) in conducting our performance evaluation (Appendix J, Section J.2). However, this
model could not be used in generating an alternate set of risk estimates for this risk assessment 21 because it predicts blood Pb levels for children 18 months of age and consequently, can not 22 support the two blood Pb metrics selected for the analysis (concurrent and lifetime average). 23 Following the overview of the IEUBK biokinetic model, the probabilistic approach used 24 to generate population-level distributions of blood Pb levels for each study population is
described. The section ends with a discussion of the GSDs used within each case study to reflect 26 inter-individual variability in behavior related to Pb exposure and Pb biokinetics (a key 27 component in modeling population-level blood Pb).
28 3.2.1 Blood Pb Modeling 29 Blood Pb models are used in the assessment in order to (a) apportion exposure, the metric
for which is blood Pb, between policy-relevant Pb exposures and policy-relevant background, 31 and (b) estimate potential changes in blood Pb level distributions that would result from alternate 32 ambient air Pb levels. 33 As discussed in Section 4.4.1 of the CD, there are two broad categories of blood Pb 34 models available to support exposure and risk assessment:
July 2007 3-14 Draft – Do Not Quote or Cite
1 • Statistical (regression) models, which attempt to apportion variance in measured blood Pb 2 levels for a study population to a range of determinants or control variables (e.g., surface 3 dust Pb concentrations, air Pb concentrations). The development of these models 4 requires paired predictor-outcome data which restricts these empirical models to the 5 domain of their observations (i.e., to applications involving the study population(s) and 6 exposure scenarios used in their derivation or at least to scenarios very similar to the 7 original study conditions). 8 • Mechanistic models, which attempt to model the process of transfer of Pb from the 9 environment to human tissues. While these models are considerably more complex
10 compared with the regression models (in terms of both the number of variables and their 11 computational structure), by incorporating variables that vary temporally and spatially, or 12 across individuals or populations, mechanistic models can be extrapolated to a wide 13 range of scenarios, including those outside of the original populations and exposure 14 scenarios used to develop/parameterize the models. 15 16 Given concerns over applying regression models to populations and exposure scenarios 17 other than those used in their derivation, and consistent with recommendations from CASAC 18 (see Section 1.4), we have relied primarily on mechanistic models in conducting the exposure 19 analysis for this assessment. Additionally, a regression model developed by Lanphear et al. 20 (1998) and described in Appendix H, Section H.2.3.was included in the blood Pb modeling 21 performance evaluation (Appendix J, Section J.3.2). The CD (Section 4.4) describes three 22 mechanistic (biokinetic) models developed over the past several decades including IEUBK for 23 modeling child Pb exposure (CD, Section 4.4.5 and Appendix H, Section H.2.1) and two models 24 designed to simulate Pb biokinetics and blood Pb levels from birth through adulthood, the 25 Leggett model (CD, Section 4.4.6) and the model developed by O’Flaherty (CD, Sections 4.4.7). 26 All three models have the potential for application in Pb risk assessment and have been evaluated 27 to varying degrees using empirical datasets (CD, Section 8.3.4). Based on results of the pilot 28 analysis, subsequent performance evaluations, and advice from CASAC, we selected the IEUBK 29 model as the primary blood Pb model for the full-scale analysis. The Leggett model has been 30 included as part of the sensitivity analysis intended to assess the potential impact of uncertainty 31 in blood Pb modeling on the overall analysis (See Section 4.3.2).3 A brief overview of the 32 IEUBK and Leggett models is presented below.
3 The Lanphear empirical model was considered for use in the sensitivity analysis, but was ultimately not used, since it generate blood Pb metrics which do not match the metrics used in this risk assessment (i.e., concurrent and lifetime average) (see Appendix J, Section J.2.1).
July 2007 3-15 Draft – Do Not Quote or Cite
1 3.2.1.1 Primary Analysis 2 The IEUBK model was selected for use in generating the primary set of exposure and 3 risk results. IEUBK is a multi-compartmental pharmacokinetics model for children 0-7 years of 4 age, which predicts average quasi-steady state blood Pb concentrations corresponding to daily 5 average exposures, averaged over periods of a year of more. The exposure module provides 6 average daily intakes of Pb (averaged over a 1 year time increment) for inhalation (air, including 7 consideration for both outdoor and indoor) and ingestion (soil, indoor dust, diet and water) 8 (Section 4.4.5.1 of the CD). The model is intended to be applied to groups of children 9 experiencing similar levels of Pb exposure and to generate a central tendency blood Pb estimate
10 for that group (USEPA, 1994a). In applications of IEUBK, inter-individual variability in 11 biokinetics and behavior (e.g., varying rates of dietary Pb ingestion) of the study population is 12 typically characterized through the incorporation of a GSD which, together with the IEUBK13 generated blood Pb level, provides a distribution of blood Pb levels for a group of modeled 14 children. 15 For each exposure zone in each case study air quality scenario, estimates of the 16 concurrent and lifetime average blood Pb level are derived from the outputs of the IEUBK model 17 as described in Appendix H. Briefly, the concurrent metric is derived as the average over ages 18 73 to 84 months (approximately 6 to 7 years of age)4, and the lifetime average metric is the 19 average of blood Pb levels between ages 6 and 84 months. 20 Additional detail on the IEUBK model is described in Appendix H (Section H.2.1) and in 21 Section 4.4.5 of the CD. Application of the IEUBK model is described in Appendix H, Section 22 H.3.1, and input parameter values, and their basis, are described in Appendix H, Section H.4.
23 3.2.1.2 Sensitivity Analysis 24 The Leggett model has been included as part of the sensitivity analysis (Appendix L) and 25 in model performance evaluations (Appendix J), but has not been used in generating primary 26 exposure and risk results for this assessment. Originally developed from a model designed to 27 simulate radiation doses for bone-seeking radionuclides, the Leggett biokinetic model has a 28 temporal resolution of one day and can model exposure from infancy through adulthood (CD, 29 Section 4.4.6). The day-level resolution in Leggett allows more comprehensive treatment of the 30 temporal pattern of exposure and its shorter-term impact on blood Pb levels than IEUBK,
4 As described in Appendix I (Section I.2.1), the concurrent metric is calculated by averaging blood Pb estimates generated for ages 75 and 81 months with these estimates representing the first and second halves of the 7th year of life, respectively. Use of the 7th year of life is consistent with or similar to the average age of the IQ testing in the Lanphear et al. (2005) study on which the concentration-response function is based (Sections 2.1.5 and 4.1).
July 2007 3-16 Draft – Do Not Quote or Cite
1 2 3 4 5 6 7 8 9
10 11
12 13
14 15 16 17 18 19 20 21 22 23 24
25 26
27 28 29 30 31
32 33
34 35
36
although for this assessment, which focuses on longer-term trends in Pb exposure, this functionality is less relevant. The Leggett model does not include a detailed pathway-level exposure module as does IEUBK. Rather the Leggett model takes total ingestion and inhalation exposure estimates as inputs. However, it is possible to link the Leggett model to a more detailed pathway-level exposure model, thereby allowing a more detailed treatment of Pb exposure pathways and their impact on blood Pb. The use of this type of external exposure model including pathway-specific modeling of exposure levels was implemented for the pilot analysis. As with IEUBK, Leggett is used to derive central tendency blood Pb levels for groups of similarly exposed children. The same GSD used for IEUBK is then used to produce estimates of the distribution of blood Pb levels within study populations. For additional details on the Leggett model see Section 4.4.6 of the CD and Appendix H.
3.2.2 Exposure Pathway Apportionment and Probabilistic Population Modeling This section describes the method used to estimate contributions to blood Pb and IQ from
exposure pathways of interest (see Section 2.4.3), and the method used for probabilistic population modeling. Both are applied to the central tendency estimates of blood Pb developed for the two blood Pb metrics (concurrent and lifetime average) from the IEUBK model outputs.
To the extent feasible with the modeling tools and assessment design, estimates of the contribution to blood Pb (central tendency estimate) are developed for policy-relevant background versus policy-relevant exposures (Section 2.4.3). This is done by considering blood Pb model estimates for an exposure zone derived using only the pathways of interest (Appendix I, Section I.1). As discussed in Section 2.4.3, there are limitations on the resolution to which policy-relevant exposures can be distinguished which results in some simplifying assumptions. We developed estimates of contribution to blood Pb estimates (and IQ estimates) for the following pathways (or pathway combinations):
• Inhalation of ambient air Pb (i.e., “recent air” Pb): This is derived using the blood Pb estimate resulting from Pb exposure limited to the inhalation pathway.
• Ingestion of “recent air” indoor dust Pb: This is derived using the blood Pb estimate resulting from Pb exposure limited to ingestion of the Pb in indoor dust that is predicted to be associated with ambient air concentrations (i.e., via the air concentration coefficient in the regression-based dust models or via the mechanistic component of the hybrid blood Pb model (Section 3.1.4).
• Ingestion of “other” indoor dust Pb: This is derived using the blood Pb estimate resulting from Pb exposure limited to ingestion of the Pb in indoor dust that is not predicted to be associated with ambient air concentrations (i.e., that predicted by the intercept in the dust models plus that predicted by the outdoor soil concentration coefficient, for models that include one (Section 3.1.4)). This is interpreted to
July 2007 3-17 Draft – Do Not Quote or Cite
5
10
15
20
25
30
35
1 represent indoor paint, outdoor soil/dust, and additional sources of Pb to indoor dust 2 including historical air (see Section 2.4.3).
3 • Ingestion of outdoor soil/dust Pb: This is derived using the blood Pb estimate resulting 4 from Pb exposure limited to ingestion of outdoor soil/dust Pb.
• Ingestion of drinking water Pb: This is derived using the blood Pb estimate resulting 6 from Pb exposure limited to ingestion of drinking water Pb.
7 • Ingestion of dietary Pb: This is derived using the blood Pb estimate resulting from Pb 8 exposure limited to ingestion of dietary Pb.
9 The goal of this probabilistic exposure modeling is to generate population-level
11 distributions of blood Pb levels that allow (a) specific percentiles of exposure (e.g., 50th, 90th, 12 99th and mean) within a study population to be identified. These are presented along with the 13 differentiation by exposure pathway (e.g., policy-relevant background versus policy-relevant 14 exposures, with the latter further differentiated as to ambient air inhalation, indoor dust ingestion
and outdoor surface soil/dust ingestion, as indicated above). Therefore, for example, we may 16 have an estimate of exposure for the 99th percentile child in the primary Pb smelter case study, 17 with that blood Pb level differentiated as to the fraction coming from (a) diet and drinking water, 18 (b) recent air Pb, including ambient air inhalation and ingestion of the recent air component of 19 indoor dust Pb, with this fraction potentially including resuspended, previously deposited Pb (see
Section 2.4.3), and (c) other sources including outdoor soil/dust and historical air Pb, as well as 21 indoor paint. The effort to differentiate the recent air and other sources of Pb to indoor dust is 22 subject to different degrees of uncertainty for the various case studies, reflecting the different 23 approaches used in modeling indoor dust (see Sections 2.4.3 and 3.1.4). 24 Probabilistic exposure modeling differs for the two point source case studies and the
general urban case study. Because the two point source case studies are location-specific, 26 demographic data for each study area are used to evaluate the interaction between child 27 populations in those study areas and the distribution of Pb concentrations in each media (e.g., 28 outdoor ambient air, outdoor soil/dust and indoor dust). By contrast, because the general urban 29 case study is not location-specific, probabilistic exposure modeling does not involve location-
specific demographic data and instead, is based on the assumption of a uniformly distributed 31 child receptor population contacting media with uniformly distributed Pb.
32 3.2.2.1 General Urban Case Study 33 The approach used to generate exposure distributions for the general urban case study is 34 simpler than that used for the two point source case studies (Section 3.2.2.2), due to the use of a
uniformly distributed population and spatially uniform media concentrations of Pb in the design 36 of this case study. This design negates the need for population-weighted sampling in generating
July 2007 3-18 Draft – Do Not Quote or Cite
1 the exposure distribution. Instead, the central tendency blood Pb level generated for a specific 2 air quality scenario using IEUBK, is combined deterministically with the GSD reflecting inter3 individual variability in Pb exposure and biokinetics to produce a population-level distribution of 4 blood Pb levels.5 Specific percentile exposure levels are then identified from that distribution, 5 with these levels interpreted as representing modeled individual children for the general urban 6 case study (i.e., estimates conceptually equivalent to those generated for the two point source 7 case studies). However, because the analysis is not location-specific, population incidence 8 estimates are not generated. 9 The study area for the general urban case study can be considered a single exposure zone
10 with a single IEUBK-derived central tendency blood Pb level that is combined with the GSD to 11 produce the population-level exposure distribution for that study area. As is the case with 12 individual exposure zones modeled for the point source case studies, the entire child population 13 in the single exposure zone modeled here is given the same pathway apportionment. As with the 14 point source case studies, this approach introduces uncertainty into the analysis, especially for 15 simulated individuals with high-end blood Pb levels, since pathway apportionment would likely 16 not be the same for all individuals in an exposure zone, even if all were exposed to the same Pb 17 concentrations in each medium.
18 3.2.2.2 Point Source Case Studies 19 Probabilistic exposure modeling for the two point source case studies relied on 20 information in three areas as summarized below: 21 22 • Central tendency blood Pb levels for each exposure zone: Outputs from the biokinetic 23 blood Pb modeling (considered to be central tendency estimates) are used to produce 24 central tendency estimates of concurrent and lifetime average blood Pb levels for each 25 exposure zone (i.e., census block or block group) in each case study area. 26 • Demographics (child distribution within study areas): The distribution of 0-7 year old 27 children within each case study area is used to insure that the generation of population28 level blood Pb level distributions for each case study reflects where children are located.
5 Note that as discussed in Section 3.2.3.1, the range of GSDs used in the general urban case study to reflect inter-individual variability in lead exposure and biokinetics has been selected to include some degree of coverage for small-scale variation in media concentrations. Therefore, while the overall scenario modeled in the general urban case study is based on the assumption of generally uniform media concentrations (e.g., an ambient air concentration level which is generally constant across the study area), the use of larger GSDs provides some coverage for residence-to-residence variation in these media concentrations.
July 2007 3-19 Draft – Do Not Quote or Cite
1 • GSD reflecting inter-individual variability in blood Pb levels: A GSD is used to reflect 2 inter-individual variability for blood Pb levels in groups of similarly-exposed children 3 (i.e., within each exposure zone of a case study area). The GSD is combined with the 4 central tendency blood Pb level estimates to generate a distribution of blood Pb levels for 5 the group of children located in each exposure zone. 6 7 The step-wise procedure used to generate population-level blood Pb distributions for each 8 of the point source case studies is illustrated in Figure 3-1, with the information described in the 9 bullets above recognized as input data.
10 Several points related to implementation of this procedure are noted. For this assessment, 11 50,000 simulated individuals were generated for each point source case study in order to insure 12 that the population-level blood Pb distributions generated met target stability goals (see 13 Appendix M, Section M.2.2).6 This simulation count represents a higher total child count than 14 actually is associated with either study area. Using a higher number of simulated individuals was 15 necessary, however, to generate blood Pb distributions with "stable" higher-end exposure 16 estimates. If simulations matching the actual population count at each case study had been 17 conducted, the distributions that would have resulted would have been "unstable" at higher 18 percentiles. It is important to note, however, that child population count estimates for individual 19 percentiles (Section 3.4) have been scaled to reflect the actual child count associated with each 20 study area. 21
6 The analysis of simulation stability focused on the general urban case study and demonstrated that even the highest population percentiles generated for this analysis (99.9th percentile) were relatively stable with coefficients of variation of less than 3% for total IQ loss estimates.
July 2007 3-20 Draft – Do Not Quote or Cite
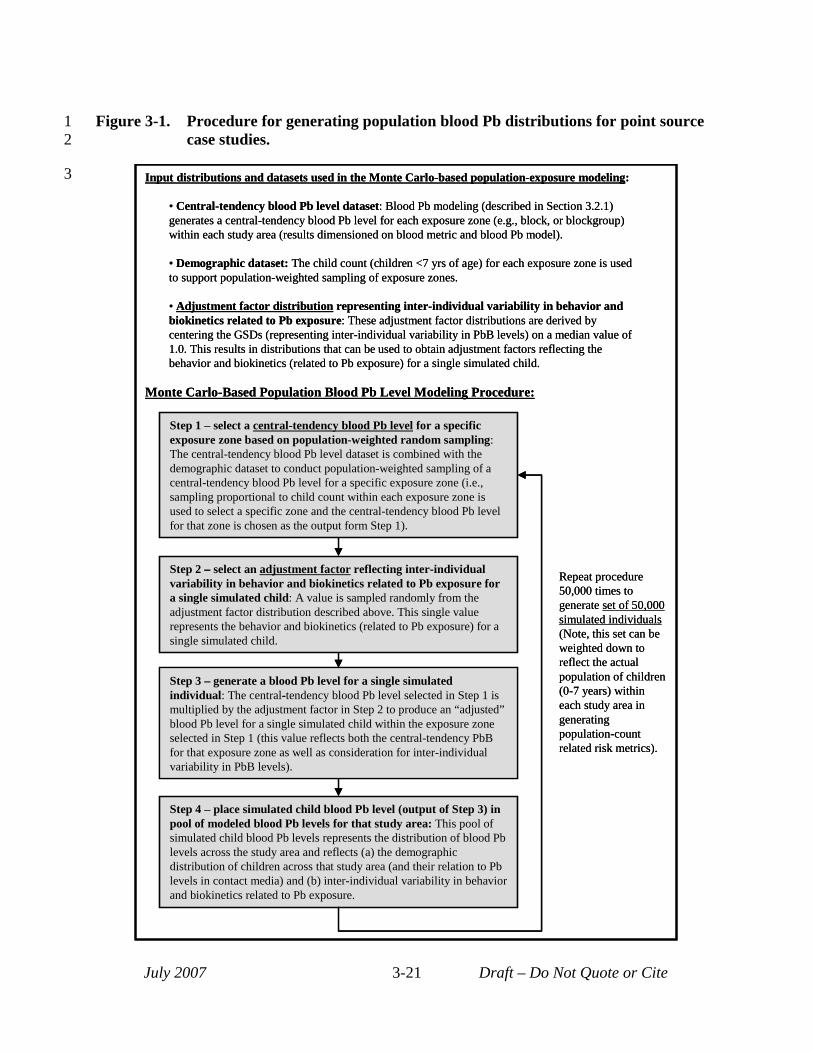
Step 1 select a central tendency blood Pb level for a specific exposure zone based on population-weighted random sampling: The central-tendency blood Pb level dataset is combined with the demographic dataset to conduct population-weighted sampling of a central-tendency blood Pb level for a specific exposure zone (i.e., sampling proportional to child count within each exposure zone is used to select a specific zone and the central-tendency blood Pb level for that zone is chosen as the output form Step 1).
Step 2 select an adjustment factor reflecting inter-individual variability in behavior and biokinetics related to Pb exposure for a single simulated child: A value is sampled randomly from the adjustment factor distribution described above. This single value represents the behavior and biokinetics (related to Pb exposure) for a single simulated child.
Step 3 generate a blood Pb level for a single simulated individual: The central tendency blood Pb level selected in Step 1 is multiplied by the adjustment factor in Step 2 to produce an “adjusted”blood Pb level for a single simulated child within the exposure zone selected in Step 1 (this value reflects both the central-tendency PbBfor that exposure zone as well as consideration for inter-individual variability in PbB levels).
Step 4 place simulated child blood Pb level (output of Step 3) in pool of modeled blood Pb levels for that study area: This pool of simulated child blood Pb levels represents the distribution of blood Pblevels across the study area and reflects (a) the demographic distribution of children across that study area (and their relation to Pblevels in contact media) and (b) inter-individual variability in behavior and biokinetics related to Pb exposure.
3
1 Figure 3-1. Procedure for generating population blood Pb distributions for point source 2 case studies.
July 2007 Draft – Do Not Quote or Cite3-21
– -
–
–-
Repeat procedure 50,000 times togenerate set of 50,000 simulated individuals(Note, this set can beweighted down toreflect the actual population of children(0-7 years) withineach study area ingeneratingpopulation-count related risk metrics).
Input distributions and datasets used in the Monte Carlo-based population-exposure modeling:
• Central-tendency blood Pb level dataset: Blood Pb modeling (described in Section 3.2.1)generates a central-tendency blood Pb level for each exposure zone (e.g., block, or blockgroup)within each study area (results dimensioned on blood metric and blood Pb model).
• Demographic dataset: The child count (children <7 yrs of age) for each exposure zone is usedto support population-weighted sampling of exposure zones.
• Adjustment factor distribution representing inter-individual variability in behavior andbiokinetics related to Pb exposure: These adjustment factor distributions are derived bycentering the GSDs (representing inter-individual variability in PbB levels) on a median value of1.0. This results in distributions that can be used to obtain adjustment factors reflecting thebehavior and biokinetics (related to Pb exposure) for a single simulated child.
–
Monte Carlo-Based Population Blood Pb Level Modeling Procedure:
Step 1 – select a central-tendency blood Pb level for a specific exposure zone based on population-weighted random sampling: The central-tendency blood Pb level dataset is combined with the demographic dataset to conduct population-weighted sampling of a central-tendency blood Pb level for a specific exposure zone (i.e., sampling proportional to child count within each exposure zone is used to select a specific zone and the central-tendency blood Pb level for that zone is chosen as the output form Step 1).
Step 2 – select an adjustment factor reflecting inter-individual variability in behavior and biokinetics related to Pb exposure for a single simulated child: A value is sampled randomly from the adjustment factor distribution described above. This single value represents the behavior and biokinetics (related to Pb exposure) for a single simulated child.
Step 3 – generate a blood Pb level for a single simulated individual: The central-tendency blood Pb level selected in Step 1 is multiplied by the adjustment factor in Step 2 to produce an “adjusted” blood Pb level for a single simulated child within the exposure zone selected in Step 1 (this value reflects both the central-tendency PbB for that exposure zone as well as consideration for inter-individual variability in PbB levels).
Repeat procedure 50,000 times to generate set of 50,000 simulated individuals (Note, this set can be weighted down to reflect the actual population of children (0-7 years) within each study area in generating population-count related risk metrics).
Input distributions and datasets used in the Monte Carlo-based population-exposure modeling:
• Central-tendency blood Pb level dataset: Blood Pb modeling (described in Section 3.2.1) generates a central-tendency blood Pb level for each exposure zone (e.g., block, or blockgroup) within each study area (results dimensioned on blood metric and blood Pb model).
• Demographic dataset: The child count (children <7 yrs of age) for each exposure zone is used to support population-weighted sampling of exposure zones.
• Adjustment factor distribution representing inter-individual variability in behavior and biokinetics related to Pb exposure: These adjustment factor distributions are derived by centering the GSDs (representing inter-individual variability in PbB levels) on a median value of 1.0. This results in distributions that can be used to obtain adjustment factors reflecting the behavior and biokinetics (related to Pb exposure) for a single simulated child.
Step 4 – place simulated child blood Pb level (output of Step 3) in pool of modeled blood Pb levels for that study area: This pool of simulated child blood Pb levels represents the distribution of blood Pb levels across the study area and reflects (a) the demographic distribution of children across that study area (and their relation to Pb levels in contact media) and (b) inter-individual variability in behavior and biokinetics related to Pb exposure.
Monte Carlo-Based Population Blood Pb Level Modeling Procedure:
1 2 3 4 5 6 7 8 9
10 11 12 13 14 15 16 17 18 19 20 21 22
23 24 25 26 27 28 29 30 31 32 33 34 35
An additional point of clarification relates to the process used in differentiating specific percentile total blood Pb levels into pathway-specific fractions for the two point source case studies. All simulated individuals associated with a given exposure zone (i.e., U.S. Census block or block group), were assigned the same pathway-specific apportionment, which was derived from the blood Pb modeling performed for the exposure zone. The set of simulated individuals with a range of total blood Pb levels, produced subsequently via application of the GSD, are assumed to all have the same pathway-specific apportionment of those blood Pb levels (i.e., the same apportionment as that generated for the central tendency blood Pb level modeled for that exposure zone). In reality, it is likely that pathway apportionment would vary across children with different blood Pb levels located in the same exposure zone (e.g., the contribution of indoor dust exposure to total blood Pb might differ for kids living near each other who demonstrate different total blood Pb levels). The modeling approach used, however, does not provide pathway apportionment within an exposure zone, only across exposure zones (i.e., each exposure zone has a different pattern of pathway apportionment for its simulated children).
The modeling approach presented in Figure 3-1 and described above, generates a population-level distribution of total blood Pb levels with pathway apportionment as described above. These distributions are used to generate several types of exposure metrics including: • Population-weighted exposure percentiles: total blood Pb levels (with pathway
apportionment) for simulated individuals representing specific points along the population blood Pb distribution (e.g., 50, 90, 95, 99 and 99.5th percentile).
• Incidence counts: number of children within a given study area projected to experience a specific degree of Pb exposure (total blood Pb level).
3.2.3 GSD for Population Blood Pb Modeling Procedure A key aspect of the population-level blood Pb modeling for all three case studies is the
application of the GSD reflecting inter-individual variability in blood Pb levels. This GSD reflects a number of factors which operate together to produce inter-individual variability in blood Pb levels, including: (a) biokinetic variability (differences in the uptake, distribution or clearance of Pb), (b) differences in behavior related to Pb exposure (e.g., varying hand-to-mouth activity, tap water ingestion rates, and time spent playing indoors) and (c) differences in environmental Pb exposure concentrations (e.g., spatial gradients in ambient Pb levels of a resolution beyond that simulated in each case study, differences in cleaning/vacuuming rates and air exchange rates).
GSDs will tend to be larger for more diverse populations and/or larger study areas, reflecting the potential for greater variability in the factors listed above. Specifically, more diverse populations will tend to demonstrate greater diversity in behavioral and biokinetic factors
July 2007 3-22 Draft – Do Not Quote or Cite
1 2 3 4 5 6 7 8 9
10 11 12 13 14 15 16 17 18 19 20 21 22 23 24 25 26 27 28 29 30 31 32 33 34 35
related to Pb exposure, thereby producing greater variation in blood Pb levels. Larger study area will tend to produce greater GSDs due both to more diverse populations, with their greater behavioral and biokinetic variability, as well as greater variation in Pb media concentrations across the study area.
The dramatic reduction in blood Pb levels among children in the United States that was observed between the NHANES surveys of the late 1970s and those of the 1980s and later was accompanied by an increase in GSD (see Appendix H, Exhibit H-7). Possible reasons for this include the likelihood that, as blood Pb levels decrease, a wider variety of exposure pathways begin to play a role in determining overall blood Pb levels (at higher blood Pb levels, it likely that one, or a few related pathways dominate exposure). As more pathways come into play, the potential for inter-individual variability in behavior and biokinetics related to these pathways increase, thereby producing greater variability in blood Pb levels (see Section 4.2.2 of EPA, 1994b,). Another possible explanation for the increase in GSDs is that, while overall Pb exposure levels have decreased, some fraction of children nationwide continue to be exposed to Pb paint and Pb in drinking water (associated with Pb-solder used in older plumbing). These higher non-air related exposures can produce elevated blood Pb level, especially when compared to average blood Pb levels in the current general population. Therefore, while the geometric mean blood Pb level may have decreased, the tail of the distribution may have remained anchored (for these paint and drinking water exposed children) resulting in a larger GSD.
A number of studies have been conducted over the past three decades which provide insights into inter-individual variability in Pb levels under various exposure conditions. Many of the studies from the 1970’s and 1980’s focused on populations living near smelters with fairly elevated blood Pb levels compared with levels modeled for our three case studies. For example, as seen in Appendix H, Exhibit H-7, geometric mean blood Pb levels for populations near active smelters in the past tended to exceed 8 µg/dL with GSDs on the order of 1.7. Note, that these earlier studies do not have readily available summaries of blood Pb levels for the metrics of interest in this analysis (concurrent and lifetime average metrics) and instead, provide more generalized summaries based on the individual measurements collected.
Beginning in the 1980’s and extending through the 1990’s, a number of studies were conducted focusing on urban populations in specific U.S. cities (e.g., Lanphear et al 2005). These studies, which were intended to examine the link between Pb exposure and neurological effects in children, have readily available blood Pb summary data for both concurrent and lifetime average blood metrics. As can be seen in Appendix H, Exhibit H-9, geometric mean blood Pb levels vary significantly across these studies, with concurrent values ranging from 5.5 µg/dL to 14.5 µg/dL and lifetime average values ranging from 4 µg/dL to 14.2 µg/dL. GSDs also vary
July 2007 3-23 Draft – Do Not Quote or Cite
1 2 3 4 5 6 7 8 9
10 11 12 13 14 15 16 17 18 19 20 21 22 23
24 25 26 27 28 29 30 31 32 33 34 35
across the studies with GSDs of 1.4 to 1.7 reported for the lifetime average metric and 1.5 to 1.9 for the concurrent metric.
In addition to these smelter-related and city-specific studies, the CDC has also conducted several iterations of its NHANES national-scale survey over the past three decades which track changes in the national distribution of blood Pb levels among children in the U.S. (see CD, Section 4.3.1.3 and Appendix H). As mentioned above, between the earliest NHANES surveys and the later (post 1980) surveys average blood Pb levels in children in the U.S. decreased dramatically (following initiatives to remove Pb from gasoline and other products in the late 1970’s and 1980’s), and the GSD increased significantly. This is most pronounced in the geometric mean blood Pb levels and associated GSDs reported for the first NHANES survey (1967-1980) (CDC, 2005) and the second NHANES survey (1988-1991) (CDC, 2005) with blood Pb levels decreasing from 14.9 to 3.6 and GSDs increasing from 1.4 to 2.1.
GSDs were selected for each case study based on consideration for the study data summarized above. The selection of these GSDs reflected consideration for a number of factors including: (a) the type of study area and underlying population involved (e.g., point-source versus more generalized urban area), (b) the fact that all three study areas use exposure zones with fairly uniform media concentrations and that the GSD selected will be used to represent blood Pb variability within each of those zones (c) age of the underlying survey population (the goal was to match the survey population to our study population to the extent possible), and (d) date of the survey (generally there is a desire, when possible, to use studies that are more contemporary to capture any underlying downward trends in blood Pb levels which have occurred). The GSDs for each of the case studies, as well as the rationale for their selection, is presented below.
3.2.3.1 General Urban Case Study For this case study, two sets of population blood Pb estimates are developed for each
blood Pb metric. This was done using GSDs intended to reflect: (a) a more uniform population living in a smaller urban area (represented by a smaller GSD for each metric) and (b) a more diverse urban population living in a larger urban area (represented by a larger GSD for each metric). Together, these two sets of estimates provide a range of results for each blood Pb metric intended to reflect uncertainty associated with this key component of the analysis (i.e., inter-individual variability in blood Pb levels). The lower-bound GSDs (representing the more uniform, smaller urban population) were obtained from the Boston study (Bellinger, 1992) (i.e., concurrent GSD of 1.7 and a lifetime average value of 1.6). This study represents one of the more contemporary of the urban studies focusing on a smaller population. By contrast, the upper-bound GSDs (representing the larger, more diverse population) were obtained using
July 2007 3-24 Draft – Do Not Quote or Cite
5
10
15
20
25
30
1 NHANES IV (CDC, 2005). Here, the GSD from NHANES IV for 1-5 yr olds (2.1) is used for 2 the concurrent metric, and the GSD for the lifetime average metric (2.0) was derived by scaling 3 the value for the concurrent metric using the relationship between concurrent and lifetime seen in 4 the smaller urban-scale Boston study (Bellinger, 1992).
3.2.3.2 Point-Source Case Studies 6 A critical consideration in identifying the GSD for use in the point source case studies, is 7 the fact that each is modeled using a spatial template that divides the study area into exposure 8 zones with relatively uniform media concentrations. As noted earlier, the GSDs are used to 9 reflect inter-individual variability in blood Pb levels for the group of modeled children located
within each of those zones. Therefore, the GSD does not need to provide full coverage for media 11 concentration variability and its impact on exposure, since this is covered to some extent by the 12 spatial template. Therefore, a larger GSD such as that suggested by NHANES would likely 13 over-state variability and a smaller GSD, possibly in-line with values from smaller-scale studies 14 such as the smelter or city-specific studies would seem to be more appropriate. Following this
logic, a GSD of 1.7 was selected for the concurrent blood metric, based on consideration for the 16 range of values from these smaller-scale studies. A matching lifetime average metric GSD value 17 of 1.6 was selected, also based on the city-specific studies.
18 3.3 ESTIMATED MEDIA CONCENTRATIONS 19 This section summarizes the media concentration estimates for all air quality scenarios at
all three case studies (Tables 3-3 to 3-6). The complete set of media concentration estimates for 21 each air quality scenario are presented in Appendix C for the general urban case study, in 22 Appendix D (Attachments D-7 through D-11) for the primary Pb smelter case study, and in 23 Appendix E (Attachments E-3 through E-7) for the secondary Pb smelter case study. Estimates 24 presented in this section are presented to three (for air) or zero (for dust and soil) decimal places,
which results in various numbers of implied significant figures. This is not intended to convey 26 greater precision for some estimates than others; it is simply an expedient and initial result of the 27 software used for the calculation. The number of significant figures associated with most 28 estimates presented in this section is considered to be generally no more than two or three. 29 For each air quality scenario for the two point source case studies, a range of percentile
estimates are presented for each exposure medium. For the general urban case study, however, 31 only a single value is presented for each exposure medium. This reflects the fact that, while the 32 point source case studies are modeled using spatial templates that include a large number of US 33 Census blocks and/or block groups (allowing percentile media concentrations to be identified), 34 the general urban case study is modeled using a single study area with uniform media
July 2007 3-25 Draft – Do Not Quote or Cite
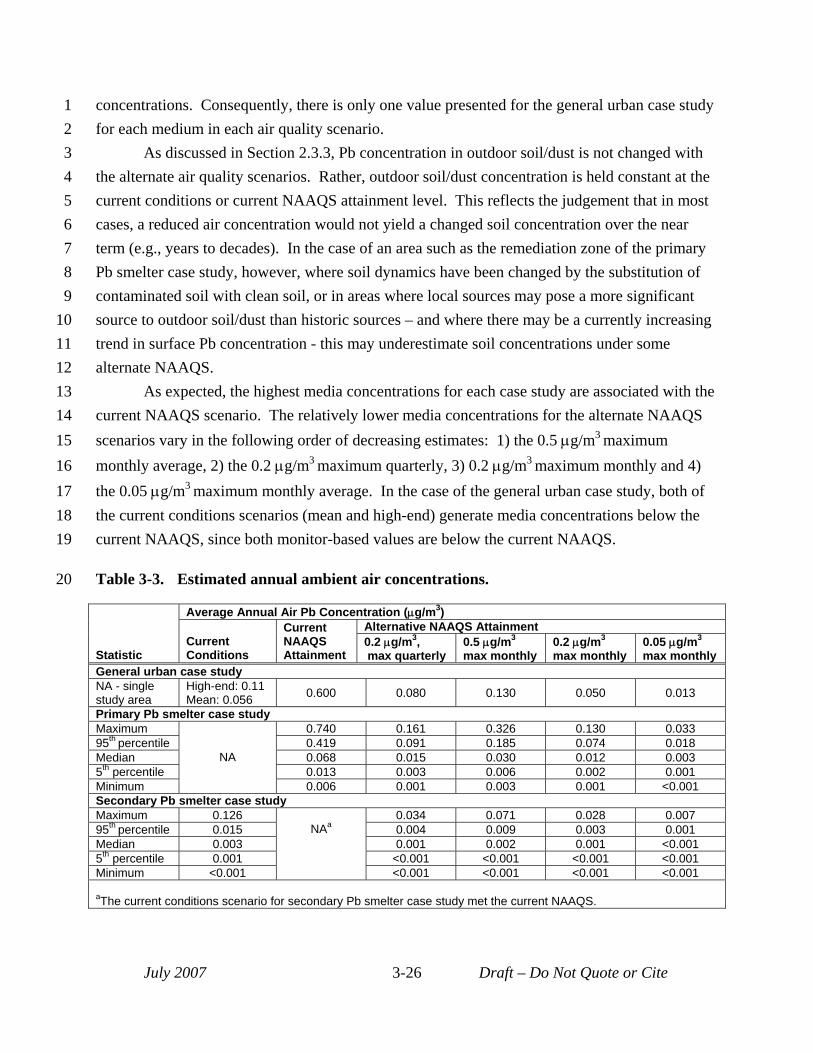
1 concentrations. Consequently, there is only one value presented for the general urban case study 2 for each medium in each air quality scenario. 3 As discussed in Section 2.3.3, Pb concentration in outdoor soil/dust is not changed with 4 the alternate air quality scenarios. Rather, outdoor soil/dust concentration is held constant at the 5 current conditions or current NAAQS attainment level. This reflects the judgement that in most 6 cases, a reduced air concentration would not yield a changed soil concentration over the near 7 term (e.g., years to decades). In the case of an area such as the remediation zone of the primary 8 Pb smelter case study, however, where soil dynamics have been changed by the substitution of 9 contaminated soil with clean soil, or in areas where local sources may pose a more significant
10 source to outdoor soil/dust than historic sources – and where there may be a currently increasing 11 trend in surface Pb concentration - this may underestimate soil concentrations under some 12 alternate NAAQS. 13 As expected, the highest media concentrations for each case study are associated with the 14 current NAAQS scenario. The relatively lower media concentrations for the alternate NAAQS 15 scenarios vary in the following order of decreasing estimates: 1) the 0.5 μg/m3 maximum 16 monthly average, 2) the 0.2 μg/m3 maximum quarterly, 3) 0.2 μg/m3 maximum monthly and 4) 17 the 0.05 μg/m3 maximum monthly average. In the case of the general urban case study, both of 18 the current conditions scenarios (mean and high-end) generate media concentrations below the 19 current NAAQS, since both monitor-based values are below the current NAAQS.
20 Table 3-3. Estimated annual ambient air concentrations.
Statistic
Average Annual Air Pb Concentration (μg/m3)
Current Conditions
Current NAAQS Attainment
Alternative NAAQS Attainment 0.2 μg/m3 , max quarterly
0.5 μg/m3
max monthly 0.2 μg/m3
max monthly 0.05 μg/m3
max monthly General urban case study NA - single study area
High-end: 0.11 Mean: 0.056 0.600 0.080 0.130 0.050 0.013
Primary Pb smelter case study Maximum
NA
0.740 0.161 0.326 0.130 0.033 95th percentile 0.419 0.091 0.185 0.074 0.018 Median 0.068 0.015 0.030 0.012 0.003 5th percentile 0.013 0.003 0.006 0.002 0.001 Minimum 0.006 0.001 0.003 0.001 <0.001 Secondary Pb smelter case study Maximum 0.126
NAa 0.034 0.071 0.028 0.007
95th percentile 0.015 0.004 0.009 0.003 0.001 Median 0.003 0.001 0.002 0.001 <0.001 5th percentile 0.001 <0.001 <0.001 <0.001 <0.001 Minimum <0.001 <0.001 <0.001 <0.001 <0.001
aThe current conditions scenario for secondary Pb smelter case study met the current NAAQS.
July 2007 3-26 Draft – Do Not Quote or Cite
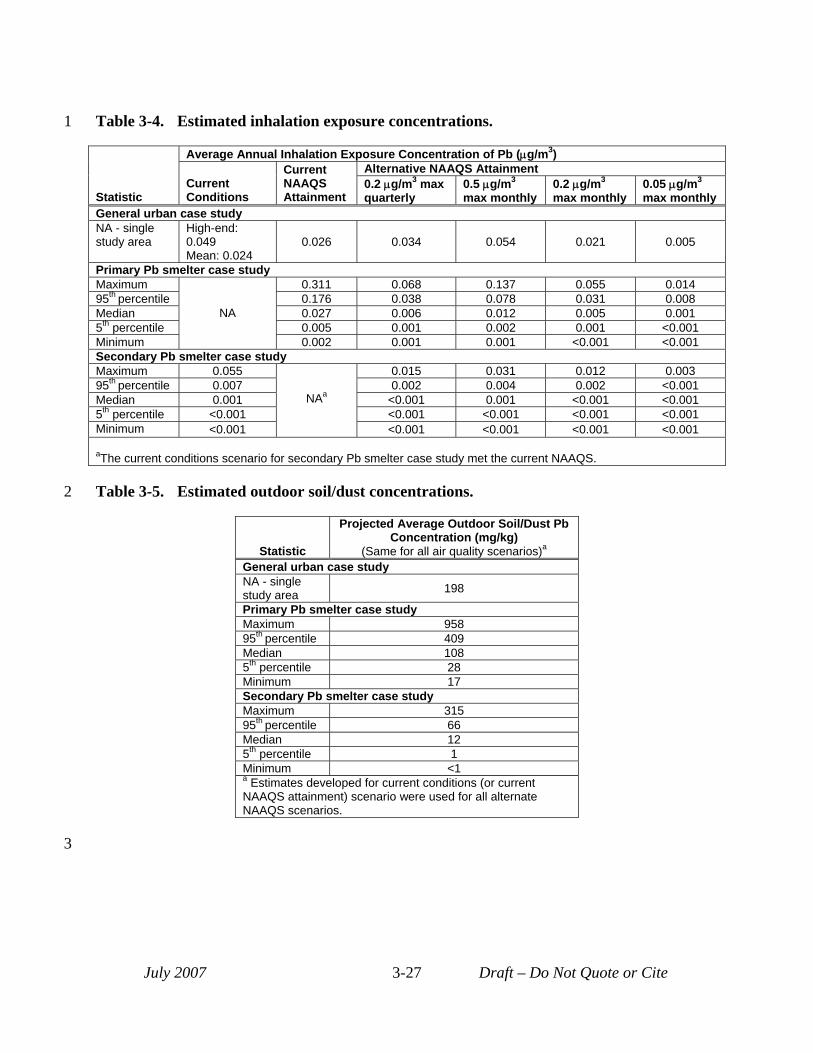
1
2
Table 3-4. Estimated inhalation exposure concentrations.
Statistic
Average Annual Inhalation Exposure Concentration of Pb (μg/m3)
Current Conditions
Current NAAQS Attainment
Alternative NAAQS Attainment 0.2 μg/m3 max quarterly
0.5 μg/m3
max monthly 0.2 μg/m3
max monthly 0.05 μg/m3
max monthly General urban case study NA - single study area
High-end: 0.049 Mean: 0.024
0.026 0.034 0.054 0.021 0.005
Primary Pb smelter case study Maximum
NA
0.311 0.068 0.137 0.055 0.014 95th percentile 0.176 0.038 0.078 0.031 0.008 Median 0.027 0.006 0.012 0.005 0.001 5th percentile 0.005 0.001 0.002 0.001 <0.001 Minimum 0.002 0.001 0.001 <0.001 <0.001 Secondary Pb smelter case study Maximum 0.055
NAa
0.015 0.031 0.012 0.003 95th percentile 0.007 0.002 0.004 0.002 <0.001 Median 0.001 <0.001 0.001 <0.001 <0.001 5th percentile <0.001 <0.001 <0.001 <0.001 <0.001 Minimum <0.001 <0.001 <0.001 <0.001 <0.001
aThe current conditions scenario for secondary Pb smelter case study met the current NAAQS.
Table 3-5. Estimated outdoor soil/dust concentrations.
Statistic
Projected Average Outdoor Soil/Dust Pb Concentration (mg/kg)
(Same for all air quality scenarios)a
General urban case study NA - single study area 198
Primary Pb smelter case study Maximum 958 95th percentile 409 Median 108 5th percentile 28 Minimum 17 Secondary Pb smelter case study Maximum 315 95th percentile 66 Median 12 5th percentile 1 Minimum <1 a Estimates developed for current conditions (or current NAAQS attainment) scenario were used for all alternate NAAQS scenarios.
July 2007 3-27 Draft – Do Not Quote or Cite
3
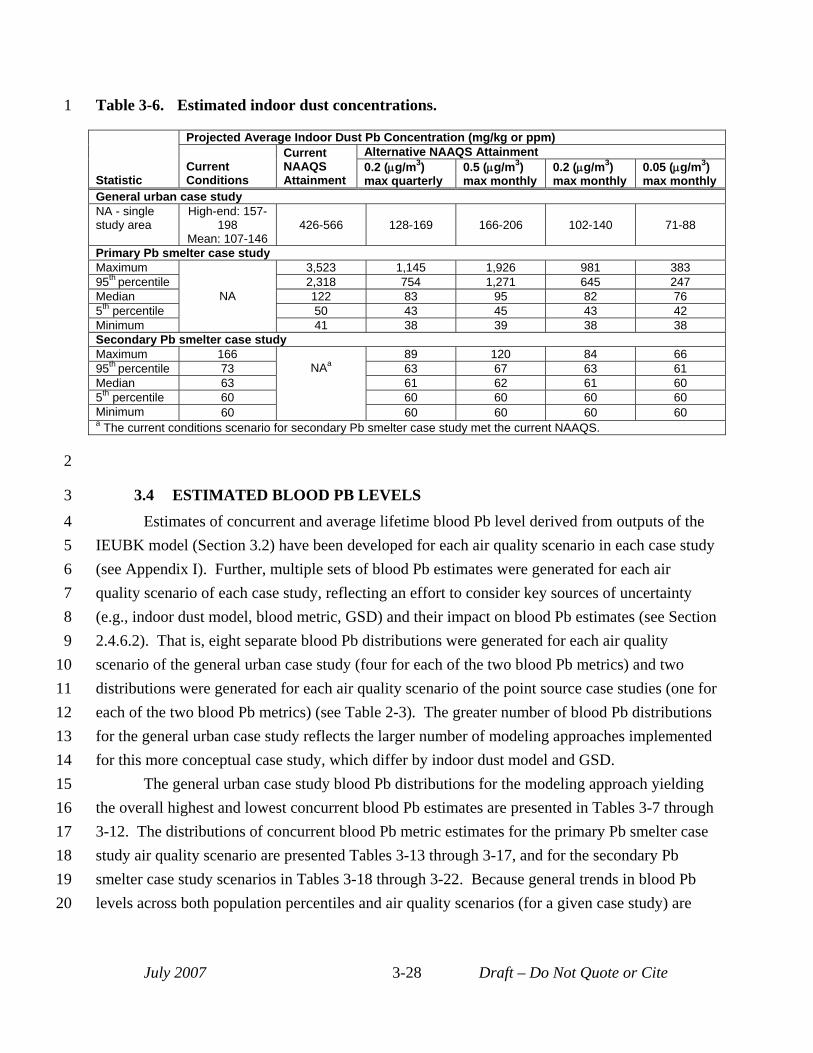
1 Table 3-6. Estimated indoor dust concentrations.
Statistic
Projected Average Indoor Dust Pb Concentration (mg/kg or ppm)
Current Conditions
Current NAAQS Attainment
Alternative NAAQS Attainment 0.2 (μg/m3) max quarterly
0.5 (μg/m3) max monthly
0.2 (μg/m3) max monthly
0.05 (μg/m3) max monthly
General urban case study NA - single study area
High-end: 157198
Mean: 107-146 426-566 128-169 166-206 102-140 71-88
Primary Pb smelter case study Maximum
NA
3,523 1,145 1,926 981 383 95th percentile 2,318 754 1,271 645 247 Median 122 83 95 82 76 5th percentile 50 43 45 43 42 Minimum 41 38 39 38 38 Secondary Pb smelter case study Maximum 166
NAa 89 120 84 66
95th percentile 73 63 67 63 61 Median 63 61 62 61 60 5th percentile 60 60 60 60 60 Minimum 60 60 60 60 60 a The current conditions scenario for secondary Pb smelter case study met the current NAAQS.
2
3 3.4 ESTIMATED BLOOD PB LEVELS 4 Estimates of concurrent and average lifetime blood Pb level derived from outputs of the 5 IEUBK model (Section 3.2) have been developed for each air quality scenario in each case study 6 (see Appendix I). Further, multiple sets of blood Pb estimates were generated for each air 7 quality scenario of each case study, reflecting an effort to consider key sources of uncertainty 8 (e.g., indoor dust model, blood metric, GSD) and their impact on blood Pb estimates (see Section 9 2.4.6.2). That is, eight separate blood Pb distributions were generated for each air quality
10 scenario of the general urban case study (four for each of the two blood Pb metrics) and two 11 distributions were generated for each air quality scenario of the point source case studies (one for 12 each of the two blood Pb metrics) (see Table 2-3). The greater number of blood Pb distributions 13 for the general urban case study reflects the larger number of modeling approaches implemented 14 for this more conceptual case study, which differ by indoor dust model and GSD. 15 The general urban case study blood Pb distributions for the modeling approach yielding 16 the overall highest and lowest concurrent blood Pb estimates are presented in Tables 3-7 through 17 3-12. The distributions of concurrent blood Pb metric estimates for the primary Pb smelter case 18 study air quality scenario are presented Tables 3-13 through 3-17, and for the secondary Pb 19 smelter case study scenarios in Tables 3-18 through 3-22. Because general trends in blood Pb 20 levels across both population percentiles and air quality scenarios (for a given case study) are
July 2007 3-28 Draft – Do Not Quote or Cite
1 similar for both the concurrent and lifetime average blood metrics, we have only presented 2 results for the concurrent metric here. 3 For the general urban case study, the blood Pb distributions for the two current conditions 4 scenarios (95th percentile and mean) are quite similar. However, there is a difference of about a 5 factor of two between levels generated by the different modeling approaches (i.e., different dust 6 model and GSD value)7. For example, the 99.9th percentile concurrent blood Pb estimate for the 7 air-only regression based model and GSD of 1.7 was approximately 10 µg/dL, compared to the 8 corresponding value of 20 µg/dL for the hybrid dust model and GSD of 2.1. Additionally, 9 although the 99.9th percentile blood Pb estimates for the current NAAQS scenario were 1.5 to 2
10 times higher (18-29 µg/dL) than those for the current conditions scenarios, the 99.9th percentile 11 blood Pb estimates for the alternate NAAQS scenarios (e.g., 8-16 µg/dL for the lowest alternate) 12 were quite similar to those for the current conditions scenarios (10-20 µg/dL). At the 50th
13 percentile, with the exception of the slightly higher values for the current NAAQS scenario (3-4 14 µg/dL), little difference was seen among results generated for the different scenarios by the 15 different modeling approaches (all ~2 µg/dL blood Pb). 16 The 99.9th and 50th percentile concurrent estimates for the primary Pb smelter case study 17 scenarios were similar to the lower estimates for the corresponding scenarios of the general 18 urban case study (i.e., those generated using the air-only regression-based dust model and GSD 19 value of 1.7). The blood Pb estimates for the secondary Pb smelter case study did not vary 20 among the air quality scenarios; the 99.5th and 50th percentile estimates for the concurrent metric 21 are 5 µg/dL and 1 µg/dL, respectively. 22 With the percentile estimates for each case study scenario, we also present estimates of 23 contributions from each pathway to blood Pb, expressed as percentages. The indoor dust 24 ingestion pathway is separated into contribution derived from recent ambient air and that from 25 other sources (e.g., indoor paint, outdoor soil/dust, and additional sources including historical 26 air), as described in Section 2.4.3 and Appendix G. For the point source case studies, these 27 contribution estimates were derived for the geometric mean (GM) blood Pb estimates for each 28 U.S. Census block or block group before the GSD is applied to generate the blood Pb 29 distributions. The blood Pb percentile estimates, however, are those resulting from application 30 of the GSD. Thus, as some of the high percentile blood Pb values are actually associated with 31 U.S. Census blocks (or block groups) with low blood Pb GMs (and vice versa), the differences in 32 pathway contribution across different percentiles may seem odd. Because there is only one GM
7 The lowest overall blood Pb distribution is generated when the air-only regression indoor dust model and lower inter-individual GSD are used. Conversely, the highest overall blood Pb distribution is generated when the hybrid indoor dust model and largest inter-individual GSD are used.
July 2007 3-29 Draft – Do Not Quote or Cite
1 blood Pb per air quality scenario of the general urban case study, there is only one pathway 2 contribution estimate for all percentiles of the general urban case study. 3 For the general urban case study, we estimate that recent air Pb (including both direct 4 inhalation and ingestion of the Pb in indoor dust that is predicted to be associated with ambient 5 air Pb levels) contributes 23 to 38% of total blood Pb in the current conditions (95th percentile) 6 scenario. As would be expected, recent air contributes less to total blood Pb in the current 7 conditions (mean) scenario (12 to 28%) since ambient air Pb levels are less, compared with the 8 high-end scenario. This trend or reduced recent air contribution with reduced ambient air Pb 9 concentration continues with recent air only contributing 3 to 13% of total blood Pb in the lowest
10 alternate NAAQS scenario evaluated. 11 For both the primary and secondary Pb smelter case studies, the contribution of recent air 12 Pb generally increases for higher population percentiles (as would be expected, since individuals 13 with relatively higher blood Pb levels are likely to live near the facility and experience 14 significantly elevated ambient air Pb level).8 As would be expected, recent air generally 15 contributes less to total blood Pb for alternative NAAQS scenarios. Specifically, we project that 16 recent air will contribute from <1% to 14% of total blood Pb for the lowest alternative NAAQS 17 scenario. The relatively small influence of recent air Pb on total blood Pb levels can also be seen 18 in the pathway contribution estimates for the secondary Pb smelter case study (in which the 19 current air concentrations are lowest), which tend to be less than 10% across all population 20 percentiles (for all air quality scenarios).
8 Note, that this tracking of ambient air Pb contribution and percentile blood Pb level is not consistent, likely reflecting the fact that the GSD is also a key factor influencing blood Pb level in our modeling. Consequently, you can have the situation where a simulated child with a relatively elevated blood Pb level comes from a US Census block that is towards the outside of the study area (and therefore has a relatively lower ambient air lead level and consequently air-related uptake), but for which a high value from the extreme high-end tail of the GSD has been selected. In this case, a high blood Pb level would have a relatively low ambient air-related signal.
July 2007 3-30 Draft – Do Not Quote or Cite
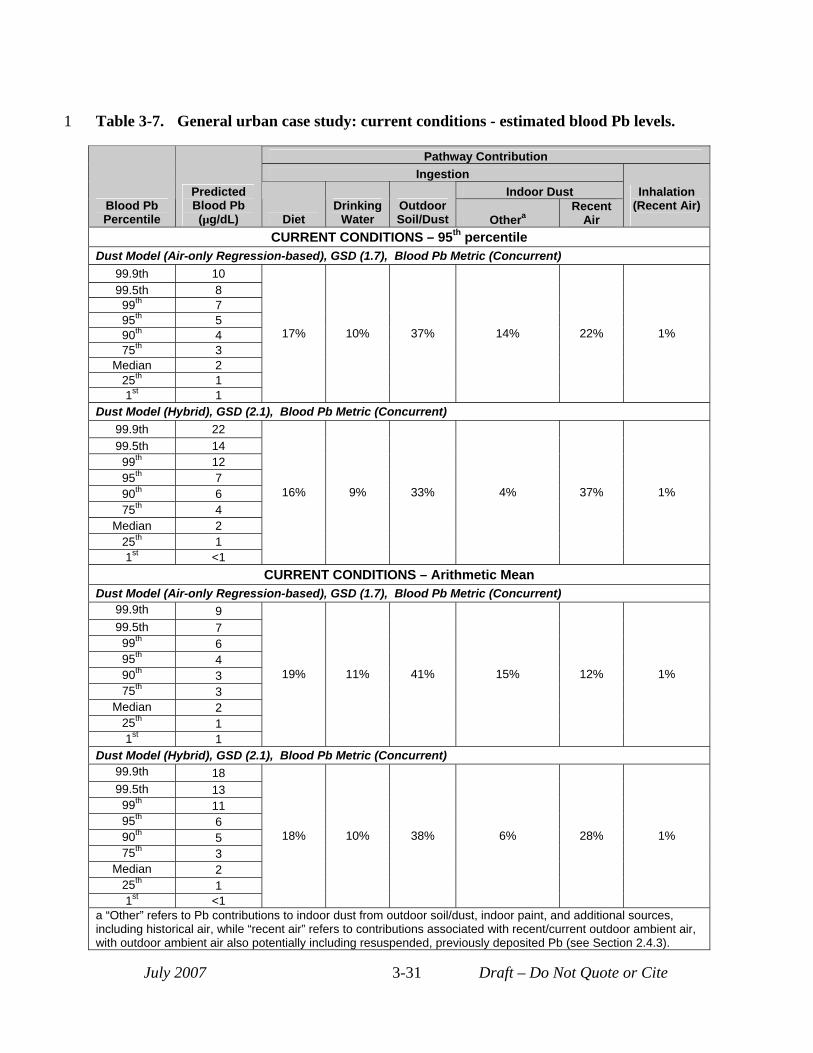
1 Table 3-7. General urban case study: current conditions - estimated blood Pb levels.
July 2007 Draft – Do Not Quote or Cite3-31
Pathway Contribution Ingestion
Indoor Dust Blood Pb Percentile
Predicted Blood Pb (µg/dL) Diet
Drinking Water
Outdoor Soil/Dust Othera
Recent Air
Inhalation (Recent Air)
CURRENT CONDITIONS – 95th percentile Dust Model (Air-only Regression-based), GSD (1.7), Blood Pb Metric (Concurrent)
99.9th 10 99.5th 8 99th 7 95th 5 90th 4 75th 3
Median 2 25th 1 1st 1
17% 10% 37% 14% 22% 1%
Dust Model (Hybrid), GSD (2.1), Blood Pb Metric (Concurrent) 99.9th 22 99.5th 14 99th 12 95th 7 90th 6 75th 4
Median 2 25th 1 1st <1
16% 9% 33% 4% 37% 1%
CURRENT CONDITIONS – Arithmetic Mean Dust Model (Air-only Regression-based), GSD (1.7), Blood Pb Metric (Concurrent)
99.9th 9 99.5th 7 99th 6 95th 4 90th 3 75th 3
Median 2 25th 1 1st 1
19% 11% 41% 15% 12% 1%
Dust Model (Hybrid), GSD (2.1), Blood Pb Metric (Concurrent) 99.9th 18 99.5th 13 99th 11 95th 6 90th 5 75th 3
Median 2 25th 1 1st <1
18% 10% 38% 6% 28% 1%
a “Other” refers to Pb contributions to indoor dust from outdoor soil/dust, indoor paint, and additional sources, including historical air, while “recent air” refers to contributions associated with recent/current outdoor ambient air, with outdoor ambient air also potentially including resuspended, previously deposited Pb (see Section 2.4.3).
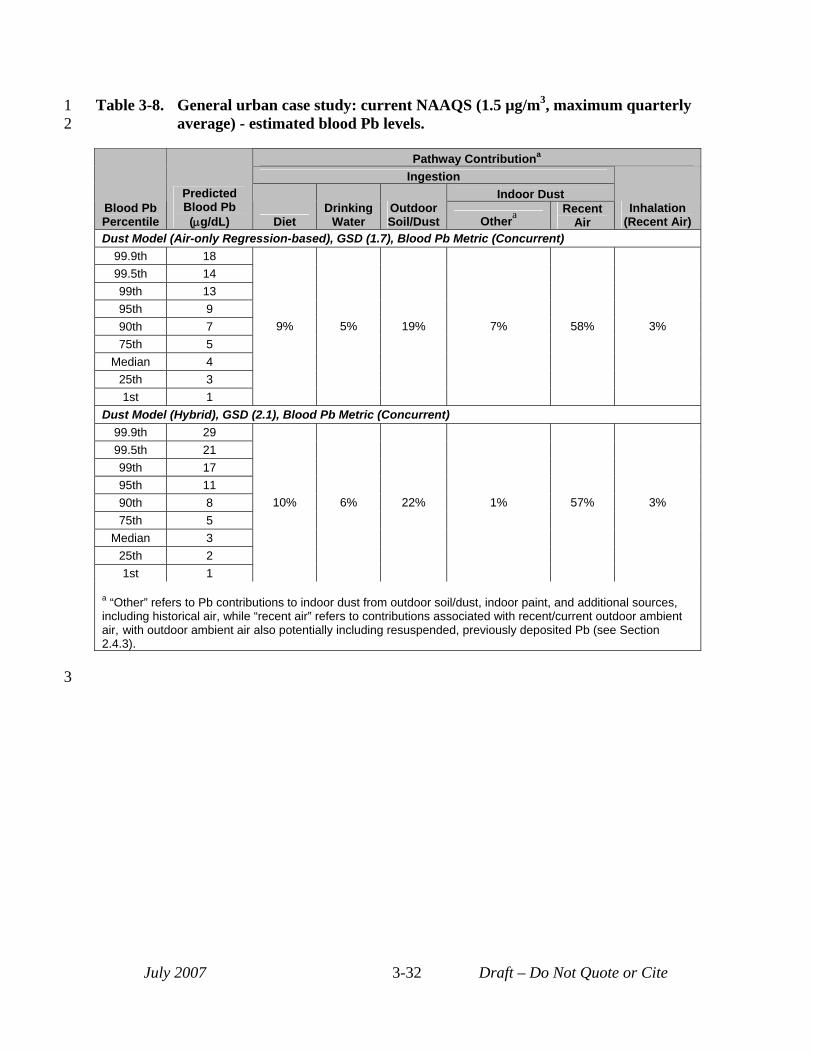
3
1 Table 3-8. General urban case study: current NAAQS (1.5 µg/m3, maximum quarterly 2 average) - estimated blood Pb levels.
Pathway Contributiona
Ingestion Indoor Dust
Blood Pb Percentile
Predicted Blood Pb (μg/dL) Diet
Drinking Water
Outdoor Soil/Dust Othera Recent
Air Inhalation
(Recent Air) Dust Model (Air-only Regression-based), GSD (1.7), Blood Pb Metric (Concurrent)
99.9th 18 99.5th 14 99th 13 95th 9 90th 7 75th 5
Median 4 25th 3 1st 1
9% 5% 19% 7% 58% 3%
Dust Model (Hybrid), GSD (2.1), Blood Pb Metric (Concurrent) 99.9th 29 99.5th 21 99th 17 95th 11 90th 8 75th 5
Median 3 25th 2 1st 1
10% 6% 22% 1% 57% 3%
a “Other” refers to Pb contributions to indoor dust from outdoor soil/dust, indoor paint, and additional sources, including historical air, while “recent air” refers to contributions associated with recent/current outdoor ambient air, with outdoor ambient air also potentially including resuspended, previously deposited Pb (see Section 2.4.3).
July 2007 3-32 Draft – Do Not Quote or Cite
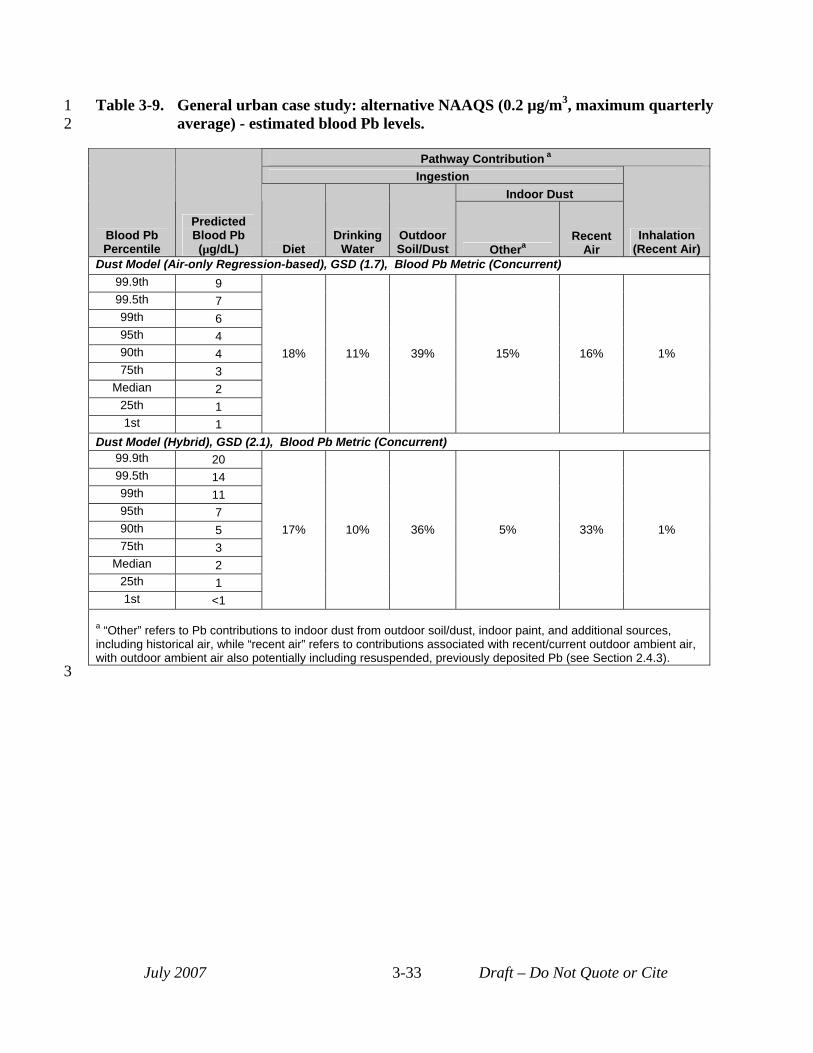
3
1 Table 3-9. General urban case study: alternative NAAQS (0.2 µg/m3, maximum quarterly 2 average) - estimated blood Pb levels.
Blood Pb Percentile
Predicted Blood Pb (µg/dL)
Pathway Contribution a
Ingestion
Inhalation (Recent Air) Diet
Drinking Water
Outdoor Soil/Dust
Indoor Dust
Othera Recent
Air Dust Model (Air-only Regression-based), GSD (1.7), Blood Pb Metric (Concurrent)
99.9th 9
18% 11% 39% 15% 16% 1%
99.5th 7 99th 6 95th 4 90th 4 75th 3
Median 2 25th 1 1st 1
Dust Model (Hybrid), GSD (2.1), Blood Pb Metric (Concurrent) 99.9th 20
17% 10% 36% 5% 33% 1%
99.5th 14 99th 11 95th 7 90th 5 75th 3
Median 2 25th 1 1st <1
a “Other” refers to Pb contributions to indoor dust from outdoor soil/dust, indoor paint, and additional sources, including historical air, while “recent air” refers to contributions associated with recent/current outdoor ambient air, with outdoor ambient air also potentially including resuspended, previously deposited Pb (see Section 2.4.3).
July 2007 3-33 Draft – Do Not Quote or Cite

3
1 Table 3-10. General urban case study: alternative NAAQS (0.5 µg/m3, maximum monthly 2 average) - estimated blood Pb levels.
Pathway Contributions Ingestion
Indoor Dust
Blood Pb Percentile
Predicted Blood Pb (mg/dL) Diet
Drinking Water
Outdoor Soil/Dust Othera
Recent Air
Inhalation (Recent Air)
Dust Model (Air-only Regression-based), GSD (1.7), Blood Pb Metric (Concurrent) 99.9th 10 99.5th 8 99th 7 95th 5 90th 4 75th 3
Median 2 25th 1 1st 1
17% 10% 36% 13% 23% 1%
Dust Model (Hybrid), GSD (2.1), Blood Pb Metric (Concurrent) 99.9th 19 99.5th 13 99th 11 95th 7 90th 5 75th 3
Median 2 25th 1 1st <1
15% 9% 33% 3% 38% 1%
a “Other” refers to Pb contributions to indoor dust from outdoor soil/dust, indoor paint, and additional sources, including historical air, while “recent air” refers to contributions associated with recent/current outdoor ambient air, with outdoor ambient air also potentially including resuspended, previously deposited Pb (see Section 2.4.3).
July 2007 3-34 Draft – Do Not Quote or Cite
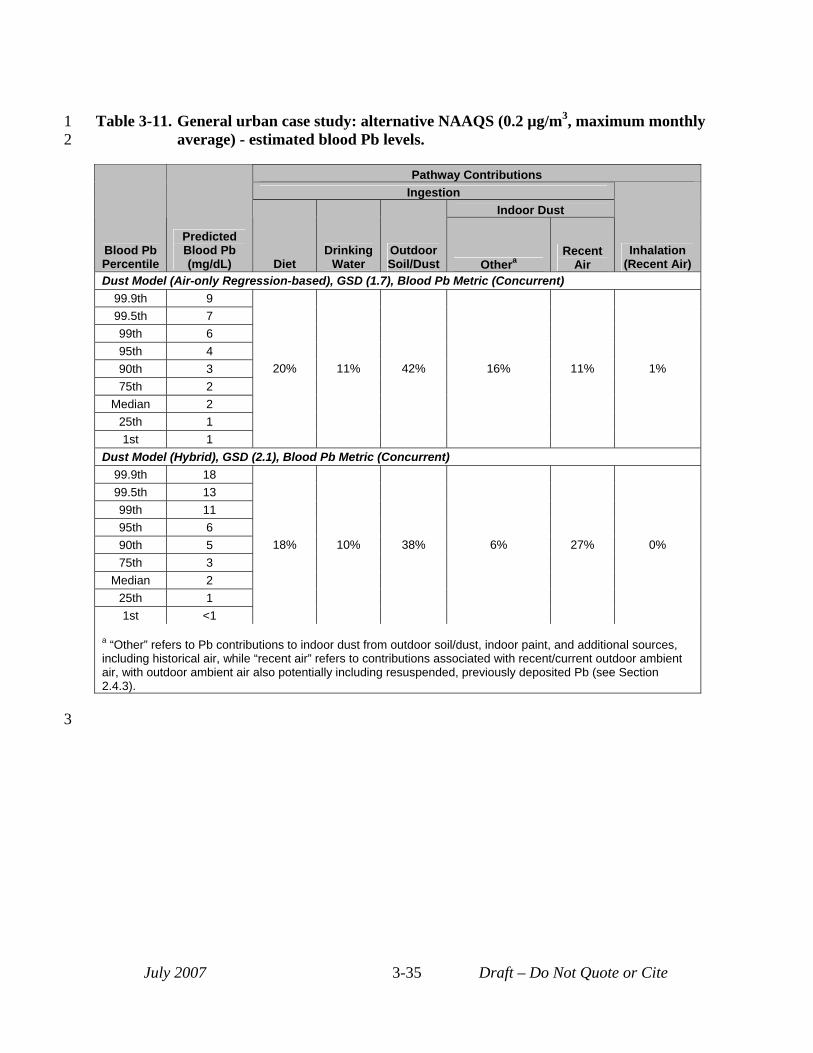
3
1 Table 3-11. General urban case study: alternative NAAQS (0.2 µg/m3, maximum monthly 2 average) - estimated blood Pb levels.
Pathway Contributions Ingestion
Indoor Dust
Blood Pb Percentile
Predicted Blood Pb (mg/dL) Diet
Drinking Water
Outdoor Soil/Dust Othera
Recent Air
Inhalation (Recent Air)
Dust Model (Air-only Regression-based), GSD (1.7), Blood Pb Metric (Concurrent) 99.9th 9 99.5th 7 99th 6 95th 4 90th 3 75th 2
Median 2 25th 1 1st 1
20% 11% 42% 16% 11% 1%
Dust Model (Hybrid), GSD (2.1), Blood Pb Metric (Concurrent) 99.9th 18 99.5th 13 99th 11 95th 6 90th 5 75th 3
Median 2 25th 1 1st <1
18% 10% 38% 6% 27% 0%
a “Other” refers to Pb contributions to indoor dust from outdoor soil/dust, indoor paint, and additional sources, including historical air, while “recent air” refers to contributions associated with recent/current outdoor ambient air, with outdoor ambient air also potentially including resuspended, previously deposited Pb (see Section 2.4.3).
July 2007 3-35 Draft – Do Not Quote or Cite

3
1 Table 3-12. General urban case study: alternative NAAQS (0.05 µg/m3, maximum monthly 2 average) - estimated blood Pb levels.
Pathway Contributiona
Ingestion Indoor Dust
Blood Pb Percentile
Predicted Blood Pb (mg/dL) Diet
Drinking Water
Outdoor Soil/Dust Othera
Recent Air
Inhalation (Recent Air)
Dust Model (Air-only Regression-based), GSD (1.7), Blood Pb Metric (Concurrent) 99.9th 8 99.5th 6 99th 6 95th 4 90th 3 75th 2
Median 2 25th 1 1st <1
22% 13% 46% 17% 3% 0%
Dust Model (Hybrid), GSD (2.1), Blood Pb Metric (Concurrent) 99.9th 16 99.5th 11 99th 10 95th 6 90th 4 75th 3
Median 2 25th 1 1st <1
21% 12% 44% 11% 13% 0%
a “Other” refers to Pb contributions to indoor dust from outdoor soil/dust, indoor paint, and additional sources, including historical air, while “recent air” refers to contributions associated with recent/current outdoor ambient air, with outdoor ambient air also potentially including resuspended, previously deposited Pb (see Section 2.4.3).
July 2007 3-36 Draft – Do Not Quote or Cite
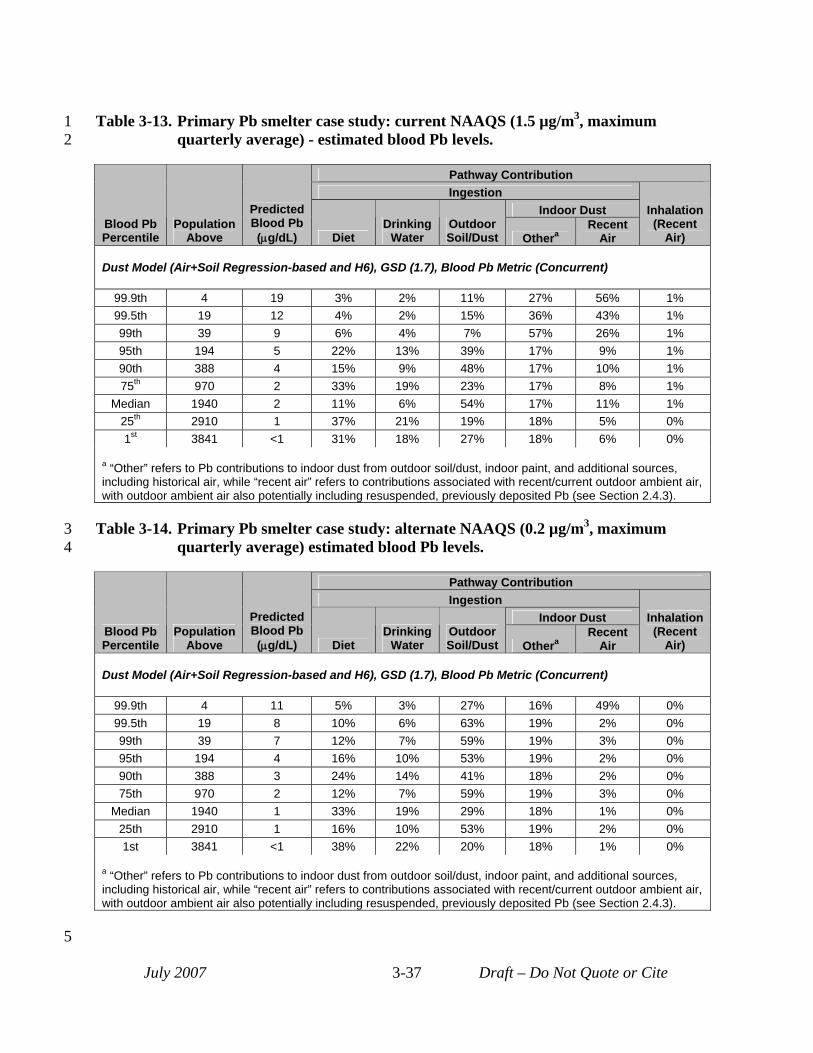
1 Table 3-13. Primary Pb smelter case study: current NAAQS (1.5 µg/m3, maximum 2 quarterly average) - estimated blood Pb levels.
Pathway Contribution Ingestion
Indoor Dust Blood Pb Percentile
Population Above
Predicted Blood Pb (μg/dL) Diet
Drinking Water
Outdoor Soil/Dust Othera
Recent Air
Inhalation (Recent
Air)
Dust Model (Air+Soil Regression-based and H6), GSD (1.7), Blood Pb Metric (Concurrent)
99.9th 4 19 3% 2% 11% 27% 56% 1% 99.5th 19 12 4% 2% 15% 36% 43% 1% 99th 39 9 6% 4% 7% 57% 26% 1% 95th 194 5 22% 13% 39% 17% 9% 1% 90th 388 4 15% 9% 48% 17% 10% 1% 75th 970 2 33% 19% 23% 17% 8% 1%
Median 1940 2 11% 6% 54% 17% 11% 1% 25th 2910 1 37% 21% 19% 18% 5% 0% 1st 3841 <1 31% 18% 27% 18% 6% 0%
a “Other” refers to Pb contributions to indoor dust from outdoor soil/dust, indoor paint, and additional sources, including historical air, while “recent air” refers to contributions associated with recent/current outdoor ambient air, with outdoor ambient air also potentially including resuspended, previously deposited Pb (see Section 2.4.3).
3 Table 3-14. Primary Pb smelter case study: alternate NAAQS (0.2 µg/m3, maximum 4 quarterly average) estimated blood Pb levels.
Pathway Contribution Ingestion
Indoor Dust Blood Pb Percentile
Population Above
Predicted Blood Pb (μg/dL) Diet
Drinking Water
Outdoor Soil/Dust Othera
Recent Air
Inhalation (Recent
Air)
Dust Model (Air+Soil Regression-based and H6), GSD (1.7), Blood Pb Metric (Concurrent)
99.9th 4 11 5% 3% 27% 16% 49% 0% 99.5th 19 8 10% 6% 63% 19% 2% 0% 99th 39 7 12% 7% 59% 19% 3% 0% 95th 194 4 16% 10% 53% 19% 2% 0% 90th 388 3 24% 14% 41% 18% 2% 0% 75th 970 2 12% 7% 59% 19% 3% 0%
Median 1940 1 33% 19% 29% 18% 1% 0% 25th 2910 1 16% 10% 53% 19% 2% 0% 1st 3841 <1 38% 22% 20% 18% 1% 0%
a “Other” refers to Pb contributions to indoor dust from outdoor soil/dust, indoor paint, and additional sources, including historical air, while “recent air” refers to contributions associated with recent/current outdoor ambient air, with outdoor ambient air also potentially including resuspended, previously deposited Pb (see Section 2.4.3).
July 2007 3-37 Draft – Do Not Quote or Cite
5
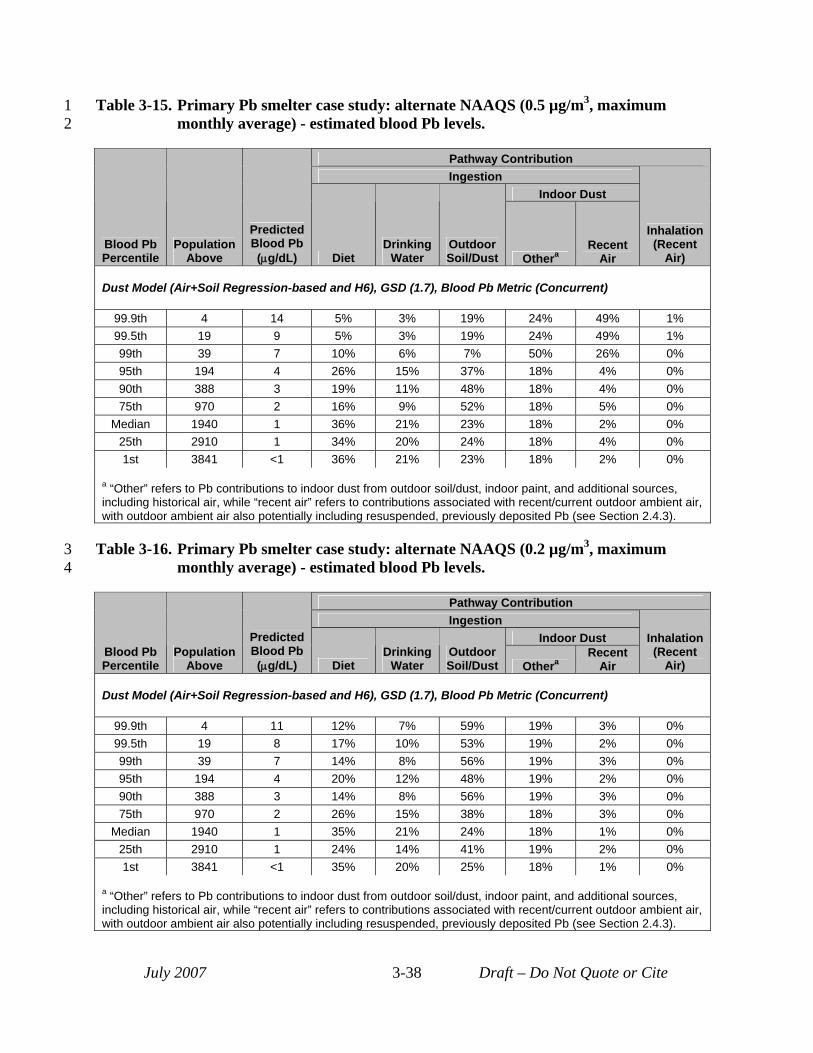
1 Table 3-15. Primary Pb smelter case study: alternate NAAQS (0.5 µg/m3, maximum 2 monthly average) - estimated blood Pb levels.
Pathway Contribution Ingestion
Indoor Dust
Blood Pb Percentile
Population Above
Predicted Blood Pb (μg/dL) Diet
Drinking Water
Outdoor Soil/Dust Othera
Recent Air
Inhalation (Recent
Air)
Dust Model (Air+Soil Regression-based and H6), GSD (1.7), Blood Pb Metric (Concurrent)
99.9th 4 14 5% 3% 19% 24% 49% 1% 99.5th 19 9 5% 3% 19% 24% 49% 1% 99th 39 7 10% 6% 7% 50% 26% 0% 95th 194 4 26% 15% 37% 18% 4% 0% 90th 388 3 19% 11% 48% 18% 4% 0% 75th 970 2 16% 9% 52% 18% 5% 0%
Median 1940 1 36% 21% 23% 18% 2% 0% 25th 2910 1 34% 20% 24% 18% 4% 0% 1st 3841 <1 36% 21% 23% 18% 2% 0%
a “Other” refers to Pb contributions to indoor dust from outdoor soil/dust, indoor paint, and additional sources, including historical air, while “recent air” refers to contributions associated with recent/current outdoor ambient air, with outdoor ambient air also potentially including resuspended, previously deposited Pb (see Section 2.4.3).
3 Table 3-16. Primary Pb smelter case study: alternate NAAQS (0.2 µg/m3, maximum 4 monthly average) - estimated blood Pb levels.
Pathway Contribution Ingestion
Indoor Dust Blood Pb Percentile
Population Above
Predicted Blood Pb (μg/dL) Diet
Drinking Water
Outdoor Soil/Dust Othera
Recent Air
Inhalation (Recent
Air)
Dust Model (Air+Soil Regression-based and H6), GSD (1.7), Blood Pb Metric (Concurrent)
99.9th 4 11 12% 7% 59% 19% 3% 0% 99.5th 19 8 17% 10% 53% 19% 2% 0% 99th 39 7 14% 8% 56% 19% 3% 0% 95th 194 4 20% 12% 48% 19% 2% 0% 90th 388 3 14% 8% 56% 19% 3% 0% 75th 970 2 26% 15% 38% 18% 3% 0%
Median 1940 1 35% 21% 24% 18% 1% 0% 25th 2910 1 24% 14% 41% 19% 2% 0% 1st 3841 <1 35% 20% 25% 18% 1% 0%
a “Other” refers to Pb contributions to indoor dust from outdoor soil/dust, indoor paint, and additional sources, including historical air, while “recent air” refers to contributions associated with recent/current outdoor ambient air, with outdoor ambient air also potentially including resuspended, previously deposited Pb (see Section 2.4.3).
July 2007 3-38 Draft – Do Not Quote or Cite
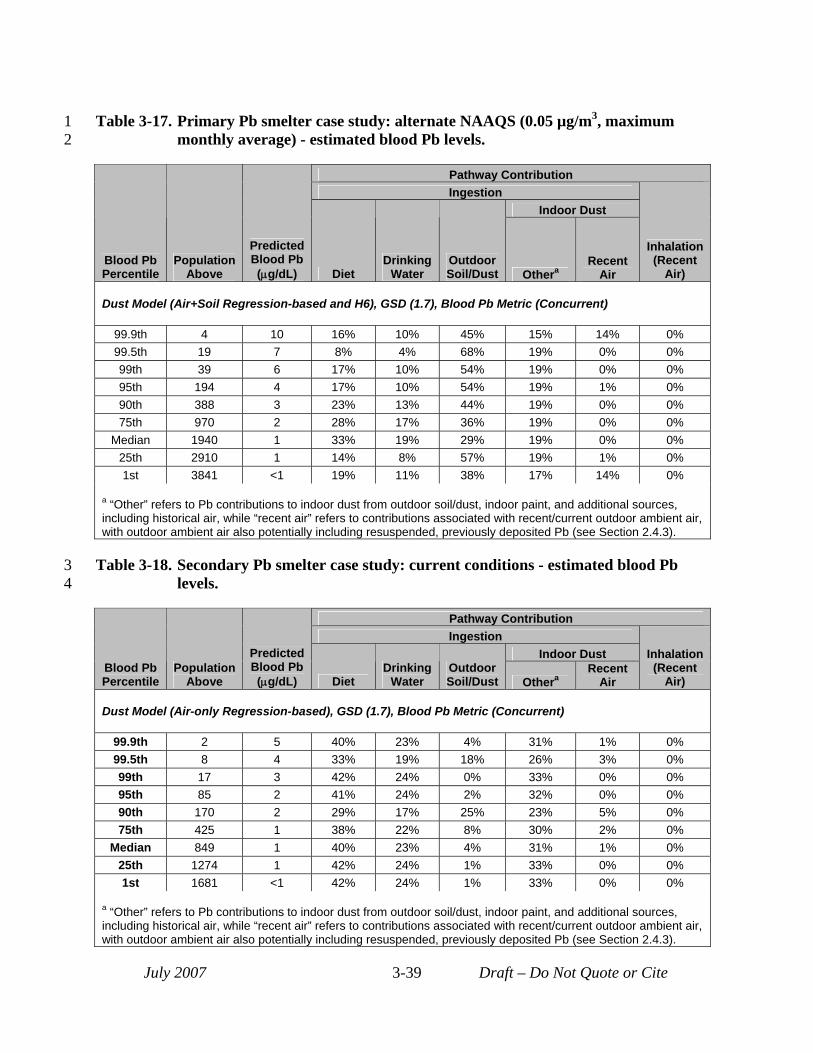
1 Table 3-17. Primary Pb smelter case study: alternate NAAQS (0.05 µg/m3, maximum 2 monthly average) - estimated blood Pb levels.
Pathway Contribution Ingestion
Indoor Dust
Blood Pb Percentile
Population Above
Predicted Blood Pb (μg/dL) Diet
Drinking Water
Outdoor Soil/Dust Othera
Recent Air
Inhalation (Recent
Air)
Dust Model (Air+Soil Regression-based and H6), GSD (1.7), Blood Pb Metric (Concurrent)
99.9th 4 10 16% 10% 45% 15% 14% 0% 99.5th 19 7 8% 4% 68% 19% 0% 0% 99th 39 6 17% 10% 54% 19% 0% 0% 95th 194 4 17% 10% 54% 19% 1% 0% 90th 388 3 23% 13% 44% 19% 0% 0% 75th 970 2 28% 17% 36% 19% 0% 0%
Median 1940 1 33% 19% 29% 19% 0% 0% 25th 2910 1 14% 8% 57% 19% 1% 0% 1st 3841 <1 19% 11% 38% 17% 14% 0%
a “Other” refers to Pb contributions to indoor dust from outdoor soil/dust, indoor paint, and additional sources, including historical air, while “recent air” refers to contributions associated with recent/current outdoor ambient air, with outdoor ambient air also potentially including resuspended, previously deposited Pb (see Section 2.4.3).
3 Table 3-18. Secondary Pb smelter case study: current conditions - estimated blood Pb 4 levels.
Pathway Contribution Ingestion
Indoor Dust Blood Pb Percentile
Population Above
Predicted Blood Pb (μg/dL) Diet
Drinking Water
Outdoor Soil/Dust Othera
Recent Air
Inhalation (Recent
Air)
Dust Model (Air-only Regression-based), GSD (1.7), Blood Pb Metric (Concurrent)
99.9th 2 5 40% 23% 4% 31% 1% 0% 99.5th 8 4 33% 19% 18% 26% 3% 0% 99th 17 3 42% 24% 0% 33% 0% 0% 95th 85 2 41% 24% 2% 32% 0% 0% 90th 170 2 29% 17% 25% 23% 5% 0% 75th 425 1 38% 22% 8% 30% 2% 0%
Median 849 1 40% 23% 4% 31% 1% 0% 25th 1274 1 42% 24% 1% 33% 0% 0% 1st 1681 <1 42% 24% 1% 33% 0% 0%
a “Other” refers to Pb contributions to indoor dust from outdoor soil/dust, indoor paint, and additional sources, including historical air, while “recent air” refers to contributions associated with recent/current outdoor ambient air, with outdoor ambient air also potentially including resuspended, previously deposited Pb (see Section 2.4.3).
July 2007 3-39 Draft – Do Not Quote or Cite
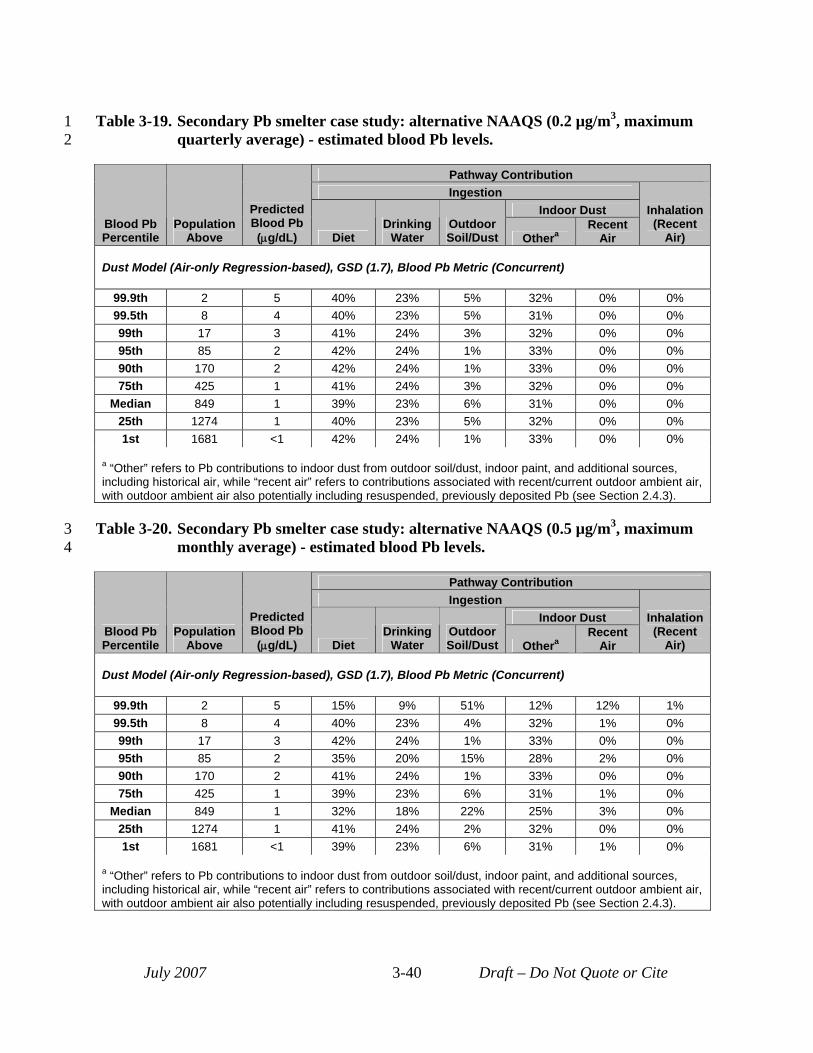
1 Table 3-19. Secondary Pb smelter case study: alternative NAAQS (0.2 µg/m3, maximum 2 quarterly average) - estimated blood Pb levels.
Pathway Contribution Ingestion
Indoor Dust Blood Pb Percentile
Population Above
Predicted Blood Pb (μg/dL) Diet
Drinking Water
Outdoor Soil/Dust Othera
Recent Air
Inhalation (Recent
Air)
Dust Model (Air-only Regression-based), GSD (1.7), Blood Pb Metric (Concurrent)
99.9th 2 5 40% 23% 5% 32% 0% 0% 99.5th 8 4 40% 23% 5% 31% 0% 0% 99th 17 3 41% 24% 3% 32% 0% 0% 95th 85 2 42% 24% 1% 33% 0% 0% 90th 170 2 42% 24% 1% 33% 0% 0% 75th 425 1 41% 24% 3% 32% 0% 0%
Median 849 1 39% 23% 6% 31% 0% 0% 25th 1274 1 40% 23% 5% 32% 0% 0% 1st 1681 <1 42% 24% 1% 33% 0% 0%
a “Other” refers to Pb contributions to indoor dust from outdoor soil/dust, indoor paint, and additional sources, including historical air, while “recent air” refers to contributions associated with recent/current outdoor ambient air, with outdoor ambient air also potentially including resuspended, previously deposited Pb (see Section 2.4.3).
3 Table 3-20. Secondary Pb smelter case study: alternative NAAQS (0.5 µg/m3, maximum 4 monthly average) - estimated blood Pb levels.
Pathway Contribution Ingestion
Indoor Dust Blood Pb Percentile
Population Above
Predicted Blood Pb (μg/dL) Diet
Drinking Water
Outdoor Soil/Dust Othera
Recent Air
Inhalation (Recent
Air)
Dust Model (Air-only Regression-based), GSD (1.7), Blood Pb Metric (Concurrent)
99.9th 2 5 15% 9% 51% 12% 12% 1% 99.5th 8 4 40% 23% 4% 32% 1% 0% 99th 17 3 42% 24% 1% 33% 0% 0% 95th 85 2 35% 20% 15% 28% 2% 0% 90th 170 2 41% 24% 1% 33% 0% 0% 75th 425 1 39% 23% 6% 31% 1% 0%
Median 849 1 32% 18% 22% 25% 3% 0% 25th 1274 1 41% 24% 2% 32% 0% 0% 1st 1681 <1 39% 23% 6% 31% 1% 0%
a “Other” refers to Pb contributions to indoor dust from outdoor soil/dust, indoor paint, and additional sources, including historical air, while “recent air” refers to contributions associated with recent/current outdoor ambient air, with outdoor ambient air also potentially including resuspended, previously deposited Pb (see Section 2.4.3).
July 2007 3-40 Draft – Do Not Quote or Cite
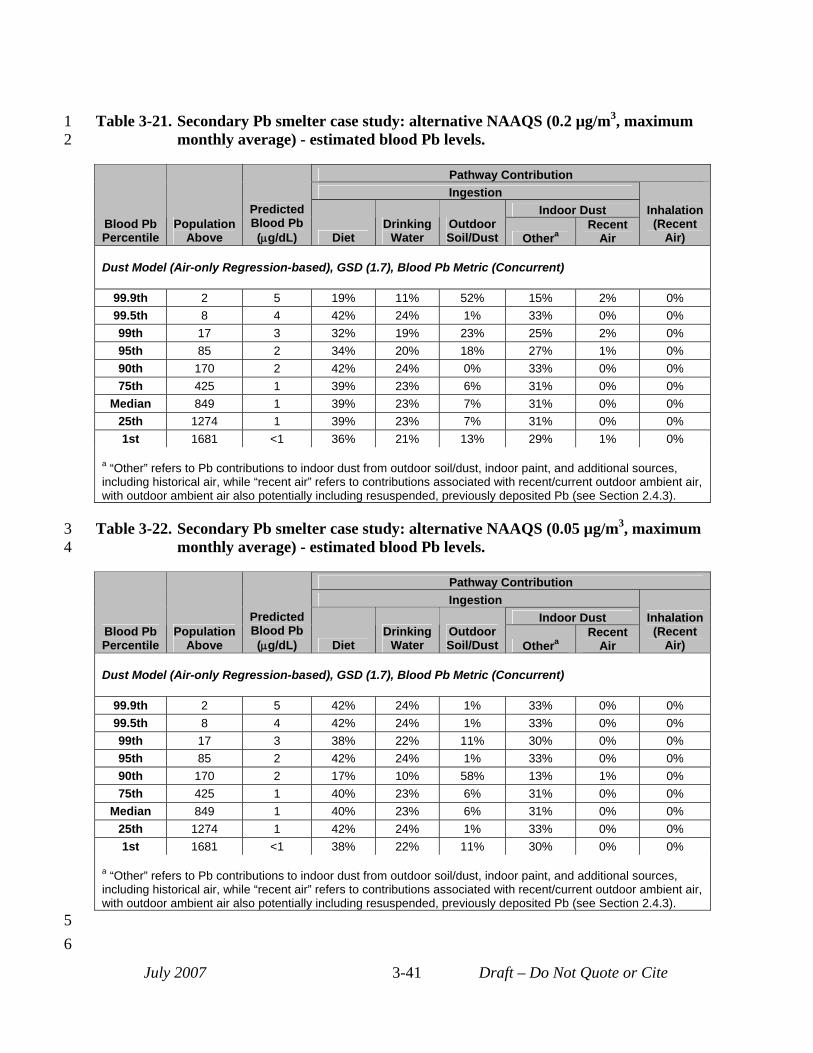
1 Table 3-21. Secondary Pb smelter case study: alternative NAAQS (0.2 µg/m3, maximum 2 monthly average) - estimated blood Pb levels.
Pathway Contribution Ingestion
Indoor Dust Blood Pb Percentile
Population Above
Predicted Blood Pb (μg/dL) Diet
Drinking Water
Outdoor Soil/Dust Othera
Recent Air
Inhalation (Recent
Air)
Dust Model (Air-only Regression-based), GSD (1.7), Blood Pb Metric (Concurrent)
99.9th 2 5 19% 11% 52% 15% 2% 0% 99.5th 8 4 42% 24% 1% 33% 0% 0% 99th 17 3 32% 19% 23% 25% 2% 0% 95th 85 2 34% 20% 18% 27% 1% 0% 90th 170 2 42% 24% 0% 33% 0% 0% 75th 425 1 39% 23% 6% 31% 0% 0%
Median 849 1 39% 23% 7% 31% 0% 0% 25th 1274 1 39% 23% 7% 31% 0% 0% 1st 1681 <1 36% 21% 13% 29% 1% 0%
a “Other” refers to Pb contributions to indoor dust from outdoor soil/dust, indoor paint, and additional sources, including historical air, while “recent air” refers to contributions associated with recent/current outdoor ambient air, with outdoor ambient air also potentially including resuspended, previously deposited Pb (see Section 2.4.3).
3 Table 3-22. Secondary Pb smelter case study: alternative NAAQS (0.05 µg/m3, maximum 4 monthly average) - estimated blood Pb levels.
Pathway Contribution Ingestion
Indoor Dust Blood Pb Percentile
Population Above
Predicted Blood Pb (μg/dL) Diet
Drinking Water
Outdoor Soil/Dust Othera
Recent Air
Inhalation (Recent
Air)
Dust Model (Air-only Regression-based), GSD (1.7), Blood Pb Metric (Concurrent)
99.9th 2 5 42% 24% 1% 33% 0% 0% 99.5th 8 4 42% 24% 1% 33% 0% 0% 99th 17 3 38% 22% 11% 30% 0% 0% 95th 85 2 42% 24% 1% 33% 0% 0% 90th 170 2 17% 10% 58% 13% 1% 0% 75th 425 1 40% 23% 6% 31% 0% 0%
Median 849 1 40% 23% 6% 31% 0% 0% 25th 1274 1 42% 24% 1% 33% 0% 0% 1st 1681 <1 38% 22% 11% 30% 0% 0%
a “Other” refers to Pb contributions to indoor dust from outdoor soil/dust, indoor paint, and additional sources, including historical air, while “recent air” refers to contributions associated with recent/current outdoor ambient air, with outdoor ambient air also potentially including resuspended, previously deposited Pb (see Section 2.4.3).
5 6
July 2007 3-41 Draft – Do Not Quote or Cite
1 2 3 4 5 6 7 8 9
10 11 12 13 14 15 16 17 18
19 20 21
22 23 24 25 26 27 28 29 30 31 32 33 34
3.5 UNCERTAINTY CHARACTERIZATION The characterization of uncertainty associated with exposure assessment included
performance evaluation which is discussed in this section. In addition, uncertainty in exposure assessment is also considered as part of characterizing uncertainty in the risk estimates and is reflected in the sensitivity analysis, inclusions of multiple modeling approaches and the qualitative discussion of key sources of uncertainty which are discussed in Section 4.3.
Performance evaluation for the exposure assessment focused on evaluation of projections of Pb in exposure media (i.e., ambient air, outdoor soil, and indoor dust) (discussed in Section 3.5.1) and projections of Pb in blood (covered in Section 3.5.2). Those case studies (or case study elements) for which media concentrations were estimated using empirical data as the basis are not considered here; only those estimates based directly on modeling were included.
Comparing model output to monitoring data is often considered the most desirable form of performance evaluation. In addition to monitoring data, or in the absence of such data, outputs from other models and expert opinion about how outputs should look can be used as comparison benchmarks in performance evaluation. The performance evaluation activities reported here have focused on the comparison of model outputs to measurements. Favorable comparisons, including a lack of systematic trends in either over- or underestimation of modeled results relative to empirical data, provide confidence in the modeling estimates.
3.5.1 Performance Evaluation Related to Exposure Media Modeling This section discusses performance evaluation conducted for modeling of Pb
concentrations in exposure media including ambient air, outdoor soil and indoor dust.
3.5.1.1 Evaluation of Modeled Ambient Air Pb Concentrations Performance evaluation for ambient air Pb predictions focused on the two point source
case studies, in which air dispersion modeling was used. For the primary Pb smelter case study current NAAQS scenario, the ISCST3-Prime
model was used with input files (e.g., source characterization, meteorological data) used in developing the 2007 proposed revision to the SIP for that location (Appendix D). The submission to EPA for the proposed SIP revision included a model performance evaluation, focused on the “actual value” modeling scenario (MDNR 2007a). The actual value modeling included three separate comparisons based on relating model predictions to measured Pb concentrations at five monitor sites in the study area. These comparisons included:
• Day-to-day evaluation of modeling output compared to monitor values: The review of the model performance evaluation conducted by the state of Missouri concluded that all sites demonstrated a pattern of overall accuracy for directional prediction (i.e.,
July 2007 3-42 Draft – Do Not Quote or Cite
1 2 3 4 5 6 7 8 9
10 11 12 13 14 15 16 17 18 19 20 21 22 23 24 25 26 27 28
29 30 31 32 33 34 35
high modeled days being high monitored days and low modeled days being low monitored days), suggesting that the model was performing well in relating wind direction to Pb transport (MDNR, 2007a).
• Comparison of source contribution analysis using chemical mass balance (CMB) with dispersion model predicted relative contributions: Source contribution analysis using CMB of monitor filter residue to identify significant sources of Pb for each monitor (e.g., in-plant roads and yard dust, blast furnace) were compared with relative contributions predicted by the dispersion model for individual modeled sources. The review of the model performance evaluation concluded that there was generally good agreement between the CMB results and the air dispersion results in terms of major sources contributing Pb at each monitor (MDNR, 2007a).
• Comparison of overall average modeled results with monitored levels: This performance evaluation involved comparing modeled results (for 247 days simulated for 2005) at six monitor locations with actual measured values for that same period at those locations. Results of this evaluation suggested a slight over-prediction bias (<10%) for those sites likely to have the greatest impacts from the facility.
This evaluation of model performance for the actual value modeling scenario increases confidence in estimates developed for the current NAAQS attainment scenario with this modeling setup and inputs particular to the 2007 proposed SIP revision.
Performance evaluation of air dispersion modeling for the secondary Pb smelter is discussed in Appendix E (Section E.2.4), and involved comparing modeled ambient air Pb levels to measured levels at two monitoring locations within the study area. Results of that evaluation suggest that the model might be slightly under-predicting levels at the closest monitor, and slightly more under-predictive of levels at the more distant monitors. The use of meteorological data that is not site-specific and may not be fully representative of actual wind patterns in the area may be contributing to this. When modeled concentrations at distances matching those of the monitors, and for all directional points around the facility, are compared with monitor values, modeled values are identified which match or exceed the measured values.
3.5.1.2 Evaluation of Modeled Outdoor Soil/Dust Pb Concentrations Modeling was used in estimating the spatial pattern of outdoor soil/dust Pb
concentrations for the secondary Pb smelter case study (see Section 3.1.3.3). As the modeling did not use estimates of historical Pb emissions (presumed to be higher than current emissions), absolute values of the model predictions were not expected to be representative of current Pb concentrations in soil/dust in this case study. Although measurements were not available for the case study location, comparison of model predicted soil Pb levels with Pb concentrations
July 2007 3-43 Draft – Do Not Quote or Cite
1 2 3 4 5
6 7 8 9
10 11 12 13 14 15 16 17 18 19 20 21 22 23 24 25 26 27 28 29 30 31 32 33 34 35
reported for a surrogate secondary Pb smelter location confirmed this expectation (see Appendix E, Section E.3). Model predictions were - on average - a factor of 3 lower than Pb concentrations at the surrogate location. Accordingly, we used a hybrid modeled-empirical approach for characterizing outdoor soil Pb levels for this case study, scaling the model estimates of soil Pb concentration across the study area by a factor of 3 (see Appendix E, Section E.3).
3.5.1.3 Evaluation of Modeled Indoor Dust Pb Concentrations Performance evaluation completed in support of indoor dust Pb prediction involved two
components. First, the site-specific hybrid model developed for the general urban case study was evaluated using available data from the literature (see Appendix G, Section G.3.6). Results of this evaluation help us assess the overall reasonableness of this model in supporting indoor dust prediction for the general urban case study in particular. Additionally, predicted indoor dust Pb levels for all three case studies were compared with data identified in the literature, including measurements from individual studies focusing on smaller areas and data from national-scale surveys. The general urban case study model and model projections are discussed here first
The hybrid indoor dust model developed for the general urban case study (Section 3.1.4.1 and Appendix G) is a combination of mechanistic model (to relate outdoor ambient air Pb to indoor dust Pb) and empirical data (to characterize the non-air related fraction of indoor dust Pb in the residential urban setting). Components of the mechanistic portion of the model were subjected to a range of evaluations based on available data in the literature. In addition, the conversion of model-generated indoor dust Pb loadings to concentrations (a key step required prior to blood Pb modeling) was evaluated. Finally, model predictions of indoor dust Pb levels were evaluated using data from several studies for specific cities.
Evaluation of the mechanistic component of the hybrid dust model focused on (a) predicted deposition fluxes of Pb to indoor surfaces and (b) prediction of relationship between indoor air Pb and ambient outdoor air Pb (Appendix G, Section G.3.6). Generally, modeled indoor deposition fluxes for Pb appear to be in-line with values reported for a location in Manhattan with closed windows (Caravanos et al., 2006). The model predicted ratio of indoor air Pb to outdoor ambient air Pb are lower (~50%) than ratios based on data collected from residences in the Midwest (Roy et al., 2003) but similar to ratios generated by a different hybrid model which combines empirical data with a mass balance modeling approach in predicting indoor ambient air concentrations (Riley et al., 2002). The under-estimate of this ratio, when compared with the empirical data from Roy et al. (2003), may result from the fact that the hybrid model does not consider resuspension of indoor dust Pb. Generally, these findings with regard to substeps of the mechanistic (and air-focused) component of the hybrid model (Appendix G, Section G.3.6) suggest a potential to under-predict the influence of outdoor ambient air Pb on
July 2007 3-44 Draft – Do Not Quote or Cite
1 indoor dust Pb. The conversion for predicted indoor dust loadings to concentrations, however, 2 may over-predict concentrations based on a comparison data collected in residences in the 3 Midwest (Roy et al., 2003; Appendix G, Section G.3.6). This finding may counter-balance any 4 potential for the mechanistic component of the model to under-estimate the influence of ambient 5 air Pb on indoor dust Pb. 6 Indoor dust Pb concentrations (in terms of mass per mass) were identified from a few 7 studies in the literature (e.g., CD, Table 3-8; Tang et al., 2004), as well as the HUD National 8 Survey of Lead-Based Paint in Housing (USEPA, 1995) described in Section 3.1.4.1. These 9 studies are identified in Table 3-23. Although the HUD survey was used for the empirical
10 component of the hybrid model, it is considered here with regard to the total dust Pb 11 concentrations predicted by both the hybrid and air-only models used in the general urban case 12 study (use of these models is described in Section 3.1.4.1).9 Comparison of the model-predicted 13 indoor dust concentrations for the current conditions scenarios (122 and 198 ppm for the hybrid 14 model and 107-157 ppm for the air-only model) to empirical data collected in Jersey City, NJ, 15 and Ottawa Canada (Table 3-23) suggest that the model may be under-predicting indoor dust Pb, 16 although the housing stock in these studies was much older than housing generally in U.S., 17 which may mean that the measurements are impacted to a greater extent by indoor Pb paint than 18 would be the general case in the U.S. Thus, it would be expected that those reported values 19 would be higher than the model predictions. Additionally, the model-predicted values fall 20 between the medians for the youngest and oldest houses sampled in the HUD national survey 21 (Table 3-23). Given that indoor dust Pb modeling completed for the general urban case study 22 was aimed at capturing central tendency indoor dust Pb levels (and is not expected to, for 23 example, capture variability related to cleaning rates or indoor paint Pb levels), this finding 24 provides confidence in the estimates.
9 The use of HUD indoor dust Pb data for performance evaluation is considered reasonable, even in light of its use in deriving the air-related portion of the hybrid model, since total indoor dust Pb levels generated by the hybrid model (reflecting both the air-related and non air-related components of the model) are being examined in the performance evaluation. In this context, nationally representative indoor dust Pb concentrations (obtained from the HUD dataset) are considered a useful empirical dataset the evaluation.
July 2007 3-45 Draft – Do Not Quote or Cite
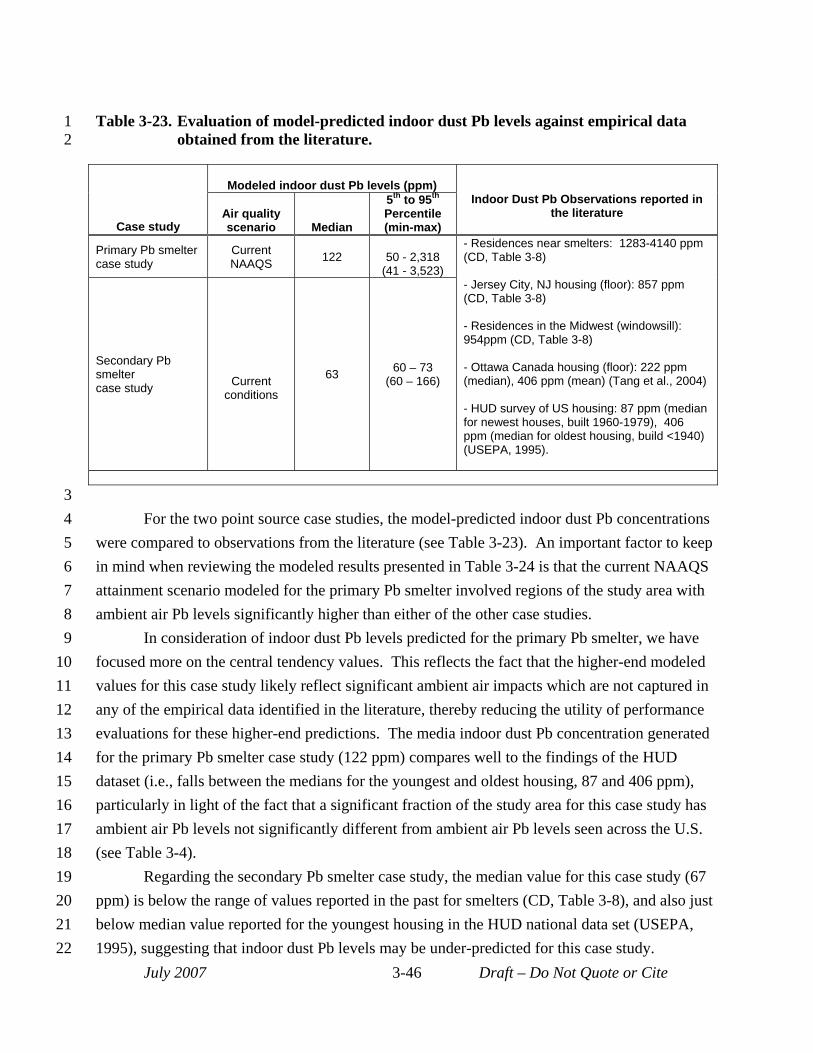
1 Table 3-23. Evaluation of model-predicted indoor dust Pb levels against empirical data 2 obtained from the literature.
Case study
Modeled indoor dust Pb levels (ppm) Indoor Dust Pb Observations reported in
the literature Air quality scenario Median
5th to 95th
Percentile (min-max)
Primary Pb smelter case study
Current NAAQS 122 50 - 2,318
(41 - 3,523)
- Residences near smelters: 1283-4140 ppm (CD, Table 3-8)
- Jersey City, NJ housing (floor): 857 ppm (CD, Table 3-8)
- Residences in the Midwest (windowsill): 954ppm (CD, Table 3-8)
- Ottawa Canada housing (floor): 222 ppm (median), 406 ppm (mean) (Tang et al., 2004)
- HUD survey of US housing: 87 ppm (median for newest houses, built 1960-1979), 406 ppm (median for oldest housing, build <1940) (USEPA, 1995).
Secondary Pb smelter case study Current
conditions
63 60 – 73 (60 – 166)
3 4 For the two point source case studies, the model-predicted indoor dust Pb concentrations 5 were compared to observations from the literature (see Table 3-23). An important factor to keep 6 in mind when reviewing the modeled results presented in Table 3-24 is that the current NAAQS 7 attainment scenario modeled for the primary Pb smelter involved regions of the study area with 8 ambient air Pb levels significantly higher than either of the other case studies. 9 In consideration of indoor dust Pb levels predicted for the primary Pb smelter, we have
10 focused more on the central tendency values. This reflects the fact that the higher-end modeled 11 values for this case study likely reflect significant ambient air impacts which are not captured in 12 any of the empirical data identified in the literature, thereby reducing the utility of performance 13 evaluations for these higher-end predictions. The media indoor dust Pb concentration generated 14 for the primary Pb smelter case study (122 ppm) compares well to the findings of the HUD 15 dataset (i.e., falls between the medians for the youngest and oldest housing, 87 and 406 ppm), 16 particularly in light of the fact that a significant fraction of the study area for this case study has 17 ambient air Pb levels not significantly different from ambient air Pb levels seen across the U.S. 18 (see Table 3-4). 19 Regarding the secondary Pb smelter case study, the median value for this case study (67 20 ppm) is below the range of values reported in the past for smelters (CD, Table 3-8), and also just 21 below median value reported for the youngest housing in the HUD national data set (USEPA, 22 1995), suggesting that indoor dust Pb levels may be under-predicted for this case study.
July 2007 3-46 Draft – Do Not Quote or Cite
1 2 3 4 5 6
7 8 9
10 11 12 13 14 15 16 17 18 19 20 21 22 23 24 25 26 27 28 29 30 31 32 33 34 35
3.5.2 Performance Evaluation Related to Blood Pb Modeling Performance evaluation completed in support of blood Pb modeling involved three steps:
(a) evaluation of candidate blood Pb models for the analysis, (b) comparison of ambient outdoor air Pb-to-blood Pb ratios generated for the three case studies against ratios obtained from the literature and (c) comparison of modeled blood Pb levels for these three case studies against NHANES IV data. Each of these evaluation steps is discussed below.
3.5.2.1 Evaluation of Candidate Blood Pb Models Evaluation of candidate blood Pb models (IEUBK and Leggett) involved three separate
stages: (a) application of the candidate models to three hypothetical individual-child exposure scenarios used previously by EPA and others in evaluations of blood Pb models, (b) comparison of candidate model predictions for a general U.S. childhood exposure scenario (using typical Pb exposures for key pathways) to NHANES IV empirical data, and (c) evaluation of candidate model performance in replicating measurements of urban child blood Pb levels obtained in Rochester. Detailed results of the evaluation of candidate blood Pb models are presented in Appendix J (and summarized in Section J.4).
The first stage (focusing on reproducing results of previous performance evaluations) demonstrated that we were applying the candidate models correctly. Tests of the models against specific individual exposure scenarios (Section J.1.3) reproduced, to a high degree, the results of previous model comparison.
The second stage of the model evaluation (focusing on reproducing general US child blood Pb levels presented in NHANES IV) demonstrated that, depending on assumptions regarding typical outdoor soil/dust and indoor dust Pb concentrations, the IEUBK model either moderately over-predicted child GM blood Pb levels (by two-fold or less) or generated predictions close to NHANES summary statistics (see Section J.3.1). By contrast, predictions from the Leggett model were more than three to six times higher than the age-specific NHANES IV GM values.
The third stage of the model evaluation focused on evaluating the candidate models in predicting blood Pb levels for an urban child cohort (Appendix J, Section J.3.2). The dataset, which included matched Pb media concentrations (outdoor soil/dust and indoor dust levels) and blood Pb levels, was collected as part of an epidemiological study focusing on the effects of Pb exposure in children living in Rochester, NY (Lanphear et al., 1995; Lanphear and Roghmann, 1997). Blood Pb levels for each child sampled in the study were predicted using IEUBK and Leggett, with the measured media Pb levels collected as part of the study as inputs. These predicted blood Pb levels were then compared to the measured blood Pb levels for each child. The results of this stage of the model evaluation were similar to those from the NHANES
July 2007 3-47 Draft – Do Not Quote or Cite
1 2 3 4 5 6 7
8 9
10 11 12 13 14 15 16 17 18 19 20 21 22 23 24 25 26 27 28 29 30 31 32 33 34 35
evaluation in that IEUBK results suggested a moderate over-prediction (~70%) while Leggett results indicated a much greater over-prediction (a factor of 2 to 6).
Results of the model evaluation for IEUBK and Leggett suggest that IEUBK generates more representative blood Pb estimates relative to Leggett in the context of the evaluations conducted here. Based on the results of the model evaluation, we decided to use IEUBK in generating the primary set of exposure and risk results for this analysis, and include Leggett as part of the sensitivity analysis but not in the primary analysis.
3.5.2.2 Evaluation of model-derived outdoor air Pb-to-blood Pb ratios In deriving the current NAAQS in 1978 (43 FR 46246), USEPA used an estimate of the
relationship between ambient air Pb concentration and associated blood Pb concentration (i.e., 1:2, µg/m3 to µg/dL). In this assessment, we rely on several distinct modeling steps which, when taken together, translate ambient air Pb into blood Pb. As part of the blood Pb model performance evaluation we have extracted air-to-blood Pb ratios from the modeling completed for the three case studies for comparison to estimates reported in the literature.
Ratios were developed that relate ambient air Pb to blood Pb contributed from the following different exposure pathways or pathway combinations: (a) inhalation of ambient air, (b) inhalation of ambient air plus ingestion of the Pb in indoor dust that is predicted to be associated with ambient air Pb levels (i.e., “recent air” per Section 2.4.3), and (c) inhalation of ambient air plus ingestion of indoor dust plus ingestion of outdoor soil/dust (i.e., not including the diet and drinking water ingestion pathways). The limitations of our modeling tools precluded us from parsing air-related blood contributions any more finely. The ratios (actually, the blood Pb side of the ratio) will be larger as you move from (a) to (c) because there is a progressively larger fraction of overall blood Pb (exposure) being associated with air. With regard to the potential impact of ambient air Pb on blood Pb, the first ratio (inhalation pathway) is an underestimate because it excludes the important ingestion pathways to which ambient air Pb can contribute. Conversely, the third ratio, although not including any impact of air Pb on diet (and blood), potentially includes some contributions to blood Pb that are not influenced by air (e.g., indoor paint). For the purposes of this model performance discussion, we have focused on the second type of ratio (those for “recent air”) derived using the concurrent blood Pb metric. The full set of ratios are presented for each case study in Appendix I
In this evaluation, we have considered the ratios derived from the blood Pb estimate prior to application of the GSD reflecting inter-individual variability in Blood Pb levels (i.e., the central tendency estimate of blood Pb derived for each US Census block or blockgroup for the point source case studies and for the entire study area for the general urban case study). Although air-to-blood Pb ratios can be derived for individual simulated children after application
July 2007 3-48 Draft – Do Not Quote or Cite
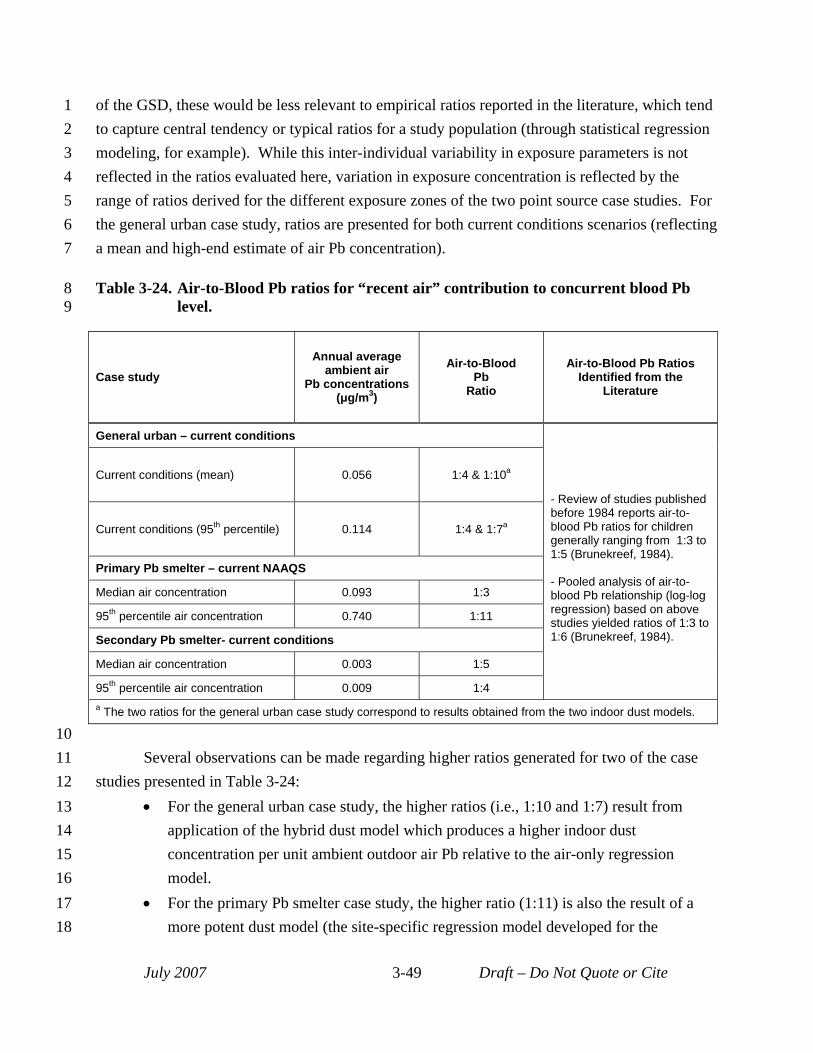
1 of the GSD, these would be less relevant to empirical ratios reported in the literature, which tend 2 to capture central tendency or typical ratios for a study population (through statistical regression 3 modeling, for example). While this inter-individual variability in exposure parameters is not 4 reflected in the ratios evaluated here, variation in exposure concentration is reflected by the 5 range of ratios derived for the different exposure zones of the two point source case studies. For 6 the general urban case study, ratios are presented for both current conditions scenarios (reflecting 7 a mean and high-end estimate of air Pb concentration).
8 Table 3-24. Air-to-Blood Pb ratios for “recent air” contribution to concurrent blood Pb 9 level.
Case study Annual average
ambient air Pb concentrations
(μg/m3)
Air-to-Blood Pb
Ratio
Air-to-Blood Pb Ratios Identified from the
Literature
General urban – current conditions
- Review of studies published before 1984 reports air-toblood Pb ratios for children generally ranging from 1:3 to 1:5 (Brunekreef, 1984).
- Pooled analysis of air-toblood Pb relationship (log-log regression) based on above studies yielded ratios of 1:3 to 1:6 (Brunekreef, 1984).
Current conditions (mean) 0.056 1:4 & 1:10a
Current conditions (95th percentile) 0.114 1:4 & 1:7a
Primary Pb smelter – current NAAQS
Median air concentration 0.093 1:3
95th percentile air concentration 0.740 1:11
Secondary Pb smelter- current conditions
Median air concentration 0.003 1:5
95th percentile air concentration 0.009 1:4 a The two ratios for the general urban case study correspond to results obtained from the two indoor dust models.
10 11 Several observations can be made regarding higher ratios generated for two of the case 12 studies presented in Table 3-24: 13 • For the general urban case study, the higher ratios (i.e., 1:10 and 1:7) result from 14 application of the hybrid dust model which produces a higher indoor dust 15 concentration per unit ambient outdoor air Pb relative to the air-only regression 16 model. 17 • For the primary Pb smelter case study, the higher ratio (1:11) is also the result of a 18 more potent dust model (the site-specific regression model developed for the
July 2007 3-49 Draft – Do Not Quote or Cite
1 2 3 4 5 6 7 8 9
10 11 12 13 14 15 16 17 18 19 20 21 22 23 24 25 26 27 28 29 30 31 32
33 34
35
remediation zone of this study area). That indoor dust model was used for the higher-impact (95th percentile) block, while the regression (air plus soil) model was used for the majority of the study area, including the median block (producing the 1:3 ratio).
The air-to-blood Pb ratios from the literature presented in Table 3-24 all come from older studies summarized in a single review from 1984 (Brunekreef, 1984). This review presents both (a) the ratios identified from the reviewed studies, which included surveys focused on smelter and urban study areas (generally range from 1:3 to 1:5) and (b) the results of a pooled analysis where a log-log regression model was developed relating ambient air Pb directly to blood Pb levels based on the underlying study data (this yields the range of 1:3 to 1:6 presented in Table 325). The studies reported in Brunekreef (1984) generally involved blood Pb levels significantly greater than 10 µg/dL. This means that they are generally not representative of the range of modeled blood Pb levels associated with the three case studies, which, prior to application of the GSD, are generally well below 10 μg/dL. This disconnect between the studies in the literature and the modeled case studies (regarding blood Pb ranges) introduces uncertainty into performance evaluation of air-to-blood Pb ratios completed here. That is, it is possible that ratios seen at blood Pb levels significantly above 10 µg/dL are different from those below 10 µg/dL, although this can not be verified without updated characterizations of air-to-blood Pb ratios based on contemporary trends in Pb exposure and blood Pb levels). Despite this uncertainty, however, comparison of the air-to-blood Pb ratios developed for the three case studies against those found in the literature is considered useful.
The lower air-to-blood ratios generated for the three case studies (1:4 for the general urban case study, 1:3 for the primary Pb smelter case study and 1:4 to 1:5 for the secondary Pb smelter case study) fall within the range of ratios identified in the literature (1:3 to 1:6). However, the higher ratios ranging from 1:7 to 1:11) are higher than the bulk of Brunekreff reported ratios, although a subset of the individual studies reviewed by Brunekreef presented air-to-blood Pb ratios that were 8.5 and higher. In several instances, such higher ratios are associated with lower blood Pb levels and lower ambient air Pb levels (both factors that would seem to be more relevant to exposure conditions found in the three case studies modeled for this analysis). However, the studies reporting these higher ratios are complicated by a number of factors (e.g., involving older children, use of ambient air measurement techniques which may underestimate results, thereby inflating ratios, relatively small sample sizes, etc.).
3.5.2.3 Comparison of modeled blood Pb levels to nationally representative data Evaluation of modeled blood Pb levels using empirical data depends on the availability
of empirical datasets for populations with exposure similar to those in the case studies. While
July 2007 3-50 Draft – Do Not Quote or Cite
1
2
3
4
5
6
7
8
9
10
11
12
13
14
15
16
17
18
19
20
21
22
23
24
25
26
27
28
29
30
31
there are many blood Pb studies reported in the literature, they are largely composed of
populations experiencing exposures from all pathways that are higher than current exposures.
No datasets were identified for specific subpopulations with exposures corresponding to current
exposures that would be appropriate for performance evaluation here. In the case of the general
urban case study, while it is not location-specific, we have not identified any contemporary
datasets for urban locations with ambient air Pb levels matching those modeled in the current
scenario that are not heavily influenced by Pb-paint. For the primary Pb smelter case study
location, the most generally available blood Pb monitoring study was completed in 2001 and
2002, and given the changes in exposures since that time and the use of a future (current NAAQS
attainment) scenario these older blood Pb surveys do not correspond to the exposures modeled
for this case study. In the case of the secondary Pb smelter, the blood Pb data available for the
county containing the secondary Pb smelter does not indicate residence location handicapping
efforts to consider blood Pb levels for children in the secondary Pb smelter case study location.
While blood Pb datasets were not identified for populations representative of those
modeled for the three case studies, we have compared the modeled blood Pb levels against
general national-scale blood Pb levels (for a child age group matching that modeled for the case
studies). While each of the case studies involves a population that is different than the national
population (reflecting the nature of the exposure scenario being considered), the background
exposures for the case studies and the national population are similar. Accordingly, the
relationship between the modeled blood Pb levels for each study area and the national
distribution are evaluated. For this evaluation, we have used measured values interpolated from
the NHANES IV dataset. Specifically, we have interpolated a series of percentile estimates for 7
yr olds based on summary data presented for NHANES IV (CDC, 2005). The process of
interpolating these values involved the following steps: (a) use summary statistics (GM and
associated confidence intervals) for 1-5 yr olds and 6-19 yr olds (for years 1999-2002) to
establish log-normal distributions for each age range, (b) identify population percentiles of
interest (e.g., median, 90th, 95th, 99.5th percentiles) for each age group using these log-normal
distributions, and (c) interpolate a series of percentiles for a 7yr age cohort using the percentiles
for the two age ranges (the 1-5 yr old and 6-19 yr old). This interpolation procedure resulted in
the population percentile estimates for a 7 yr old cohort (for the years 1999-2002) presented in
Table 3-25.
July 2007 3-51 Draft – Do Not Quote or Cite
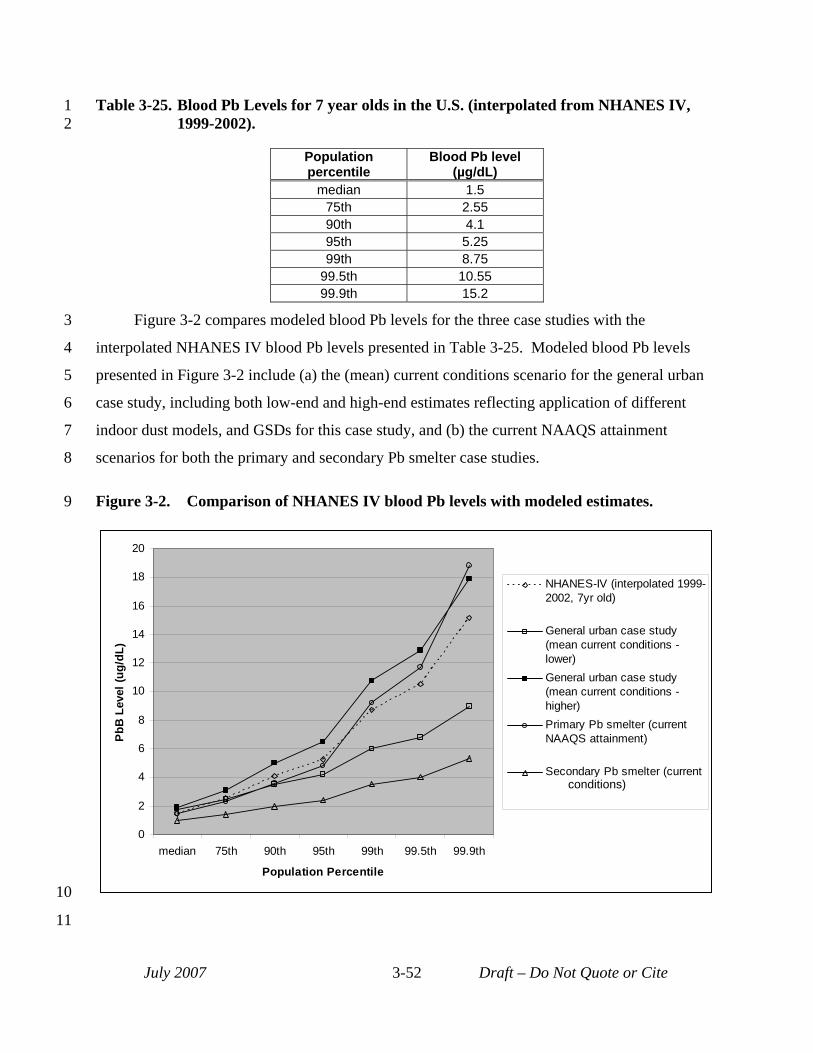
NAAQS attainment)
1 Table 3-25. Blood Pb Levels for 7 year olds in the U.S. (interpolated from NHANES IV, 2 1999-2002).
Population percentile
Blood Pb level (µg/dL)
median 1.5 75th 2.55 90th 4.1 95th 5.25 99th 8.75
99.5th 10.55 99.9th 15.2
3 Figure 3-2 compares modeled blood Pb levels for the three case studies with the
4 interpolated NHANES IV blood Pb levels presented in Table 3-25. Modeled blood Pb levels
5 presented in Figure 3-2 include (a) the (mean) current conditions scenario for the general urban
6 case study, including both low-end and high-end estimates reflecting application of different
7 indoor dust models, and GSDs for this case study, and (b) the current NAAQS attainment
8 scenarios for both the primary and secondary Pb smelter case studies.
9 Figure 3-2. Comparison of NHANES IV blood Pb levels with modeled estimates.
0
2
4
6
8
10
12
14
16
18
20
median 75th 90th 95th 99th 99.5th 99.9th
Population Percentile
PbB
Lev
el (u
g/dL
)
NHANES-IV (interpolated 19992002, 7yr old)
General urban case study (mean current conditions lower) General urban case study (mean current conditions higher) Primary Pb smelter (current NAAQS attainment)
Secondary Pb smelter (current conditions)
10
11
July 2007 3-52 Draft – Do Not Quote or Cite
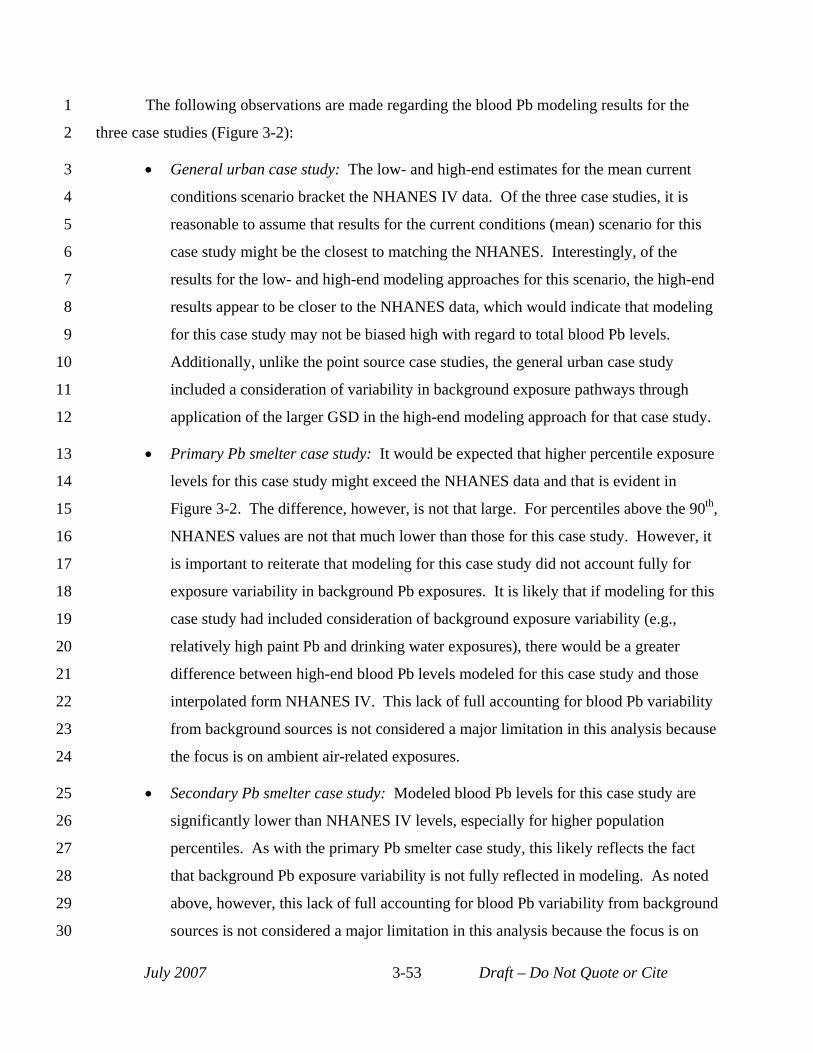
1
2
3
4
5
6
7
8
9
10
11
12
13
14
15
16
17
18
19
20
21
22
23
24
25
26
27
28
29
30
The following observations are made regarding the blood Pb modeling results for the
three case studies (Figure 3-2):
• General urban case study: The low- and high-end estimates for the mean current
conditions scenario bracket the NHANES IV data. Of the three case studies, it is
reasonable to assume that results for the current conditions (mean) scenario for this
case study might be the closest to matching the NHANES. Interestingly, of the
results for the low- and high-end modeling approaches for this scenario, the high-end
results appear to be closer to the NHANES data, which would indicate that modeling
for this case study may not be biased high with regard to total blood Pb levels.
Additionally, unlike the point source case studies, the general urban case study
included a consideration of variability in background exposure pathways through
application of the larger GSD in the high-end modeling approach for that case study.
• Primary Pb smelter case study: It would be expected that higher percentile exposure
levels for this case study might exceed the NHANES data and that is evident in
Figure 3-2. The difference, however, is not that large. For percentiles above the 90th,
NHANES values are not that much lower than those for this case study. However, it
is important to reiterate that modeling for this case study did not account fully for
exposure variability in background Pb exposures. It is likely that if modeling for this
case study had included consideration of background exposure variability (e.g.,
relatively high paint Pb and drinking water exposures), there would be a greater
difference between high-end blood Pb levels modeled for this case study and those
interpolated form NHANES IV. This lack of full accounting for blood Pb variability
from background sources is not considered a major limitation in this analysis because
the focus is on ambient air-related exposures.
• Secondary Pb smelter case study: Modeled blood Pb levels for this case study are
significantly lower than NHANES IV levels, especially for higher population
percentiles. As with the primary Pb smelter case study, this likely reflects the fact
that background Pb exposure variability is not fully reflected in modeling. As noted
above, however, this lack of full accounting for blood Pb variability from background
sources is not considered a major limitation in this analysis because the focus is on
July 2007 3-53 Draft – Do Not Quote or Cite
1
2
3
4
5
6
7
ambient air-related exposures, particularly those associated with the secondary
smelter. Additionally, air Pb estimates for much of the study area were significantly
lower than the mean current conditions levels modeled for the general urban case
study, which may be a result of only modeling sources directly related to the smelter
and not including other non-smelter related contributions to ambient air (e.g.,
resuspension of roadside dust containing Pb).
July 2007 3-54 Draft – Do Not Quote or Cite
1 2 3
4 5
6 7
8 9
10 11
12 13 14
15 16
17 18
19 20 21
22 23
24 25 26 27
28 29 30 31
32 33 34
35 36 37
38 39
REFERENCES Adgate, J. L.; Willis, R. D.; Buckley, T. J.; Chow, J. C.; Watson, J. G.; Rhoads, G. G.; Lioy, P. J. (1998) Chemical
mass balance source apportionment of Pb in house dust. Environ. Sci. Technol. 32: 108-114.
Bellinger, D.C., Stiles, K.M., Needleman, H.L. (1992) Low-level lead exposure, intelligence and academic achievement: A long-term follow-up study. Pediatrics 90(6): 855-861.
Brunekreef, B. (1984) The relationship between air lead and blood lead in children: a critical review. Science of the total environment, 38: 79–123.
Caravanos, J.; Weiss, A. L.; Jaeger, R. J. (2006) An exterior and interior Pbed dust deposition survey in New York City: results of a 2-year study. Environ. Res. 100: 159-164.
Centers for Disease Control and Prevention (CDC). (2005) Blood Lead Levels - United States, 1999-2002. Available online at: http://www.cdc.gov/mmwr/preview/mmwrhtml/mm5420a5.htm.
Gustavsson, N., Bolviken, B., Smith, D.B., and Severson, R.C. (2001) Geochemical Landscapes of the Conterminous United States -- New Map Presentations of 22 Elements. U.S. Department of the Interior, U.S. Geological Survey. Professional Paper 1648. Available at http://pubs.usgs.gov/pp/p1648.
Hattis, D. (2005) Preliminary Analysis of Blood Pb Distributional Data from Various Years of the National Health and Nutrition Surveys (NHANES). Prepared for ICF International. October.
Hilts, S. R. (2003) Effect of smelter emission reductions on children's blood Pb levels. Sci. Total Environ. 303: 5158.
Lanphear, B. P.; Emond, M.; Jacobs, D. E.; Weitzman, M.; Tanner, M.; Winter, N. L.; Yakir, B.; Eberly, S. (1995) A Side-by-Side Comparison of Dust Collection Methods for Sampling Lead-Contaminated House Dust. Environ. Res. 68(2): 114-123.
Lanphear, B.P. and Roghmann, K. J. (1997) Pathways of Lead Exposure in Urban Children. Environ. Res. 74(67): 73.
Lanphear, B. P.; Matte, T. D.; Rogers, J.; Clickner, R. P.; Dietz, B.; Bornschein, R. L.; Succop, P.; Mahaffey, K. R.; Dixon, S.; Galke, W.; Rabinowitz, M.; Farfel, M.; Rohde, C.; Schwartz, J.; Ashley, P.; Jacobs, D. E. (1998) The Contribution of Lead-Contaminated House Dust and Residential Soil to Children's Blood Lead Levels: A Pooled Analysis of 12 Epidemiologic Studies. Environmental Research. 79: 51-68.
Lanphear, B.P., Hornung, R., Khoury, J., Yolton, K., Baghurst, P., Bellinger, D.C., Canfield, R.L., Dietrich, K.N., Bornschein, R., Greene, T., Rothenberg, S.J., Needleman, H.L., Schnaas, L., Wasserman, G., Graziano, J., and Robe, R. (2005) Low-level environmental Pb exposure and children's intellectual function: An international pooled analysis. Environmental Health Perspectives. 113(7):894-899.
Missouri Department of Natural Resources (MDNR). (2007a) Doe Run – Herculaneum State Implementation Plan (SIP) Dispersion Modeling Review. Memorandum from Jeffry D. Bennett to John Rustige. February 12, 2007. Available at: http://www.dnr.mo.gov/env/apcp/herculaneumsip.htm
Missouri Department of Natural Resources (MDNR). (2007b) 2007 Revision of the State Implementation Plan for the Herculaneum Lead Nonattainment Area, as adopted by the Missouri Air Conservation Commission April 26, 2007.
Riley, W. J., McKone, T. E., Lai, A. C., Nazaroff, W. W. (2002) Indoor Particulate Matter of Outdoor Origin: Importance of Size-Dependent Removal Mechanisms. Environ. Sci. Technol. 36(2): 200-207.
July 2007 3-55 Draft – Do Not Quote or Cite
5
10
15
20
25
1
2 Roy, A., Georgopoulos, P. G., Ouyang, M., Freeman, N., Lioy, P. J. (2003) Environmental, Dietary, Demographic, 3 and Activity Variables Associated With Biomarkers of Exposure for Benzene and Lead. J. Expo. Anal. 4 Environ. Epidemiol. 13(6): 417-426.
Tang, K. M., Nace, C. G., Jr., Lynes, C. L., Maddaloni, M. A., LaPosta, D., Callahan, K. C. (2004) Characterization 6 of Background Concentrations in Upper Manhattan, New York Apartments for Select Contaminants 7 Identified in World Trade Center Dust. Environ. Sci. Technol. 38(24): 6482-6490.
8 U.S. Environmental Protection Agency. (1989) Review of National Ambient Air Quality Standard for Pb: Exposure 9 Analysis Methodology and Validation. Research Triangle Park, NC: Office of Air Quality Planning and
Standards. EPA-450/2-89-011. June.
11 U.S. Environmental Protection Agency. (1994a) Technical Support Document: Parameters and Equations Used in 12 the Integrated Exposure Uptake Biokinetic Model for Pb in Children (v.099d). EPA 540/R-94/040.
13 U.S. Environmental Protection Agency. (1994b) Guidance Manual for the IEUBK Model for Lead in Children . 14 EPA PB93-963510 (OSWER #9285.7-15-1).
U.S. Environmental Protection Agency (USEPA). (1995) Report on the National Survey of Lead-Based Paint in 16 Housing: Appendix I: Design and Methodology. EPA 747-R95-004. Office of Pollution Prevention and 17 Toxics.
18 U.S. Environmental Protection Agency (USEPA). (1997) Conversion Equations for Use in Section 403 Rulemaking. 19 EPA 747-R-96-012. Office of Pollution, Prevention, and Toxics.
U.S. Environmental Protection Agency (USEPA). (2000) Hazard Standard Risk Analysis Supplement - TSCA 21 Section 403. Available online at: http://www.epa.gov/lead/pubs/403risksupp.htm.
22 U.S. Environmental Protection Agency. (2006a) 1999 National-Scale Air Toxics Assessment. Available at 23 http://www.epa.gov/ttn/atw/nata1999/nsata99.html.
24 U.S. Environmental Protection Agency. (2006b) Lead soil trend analysis through May, 2006. Evaluation by individual quadrant. Herculaneum lead smelter site, Herculaneum, Missouri. Prepared by TetraTech for
26 U.S. EPA, Region 7.
27 Von Lindern, I. H.; Spalinger, S. M.; Bero, B. N.; Petrosyan, V.; Von Braun, M. C. (2003a) The influence of soil 28 remediation on lead in house dust. Sci. Total Environ. 303(1-2): 59-78.
July 2007 3-56 Draft – Do Not Quote or Cite
5
10
15
20
25
30
1 4 RISK ASSESSMENT
2 This chapter describes the approach used to characterize risk, including discussion of the 3 methodology (Section 4.1), presentation of risk estimates (Section 4.2), and uncertainty 4 characterization (Section 4.4).
4.1 METHODS FOR DERIVING RISK ESTIMATES 6 Risk characterization for this assessment focuses on IQ loss in children. IQ loss is 7 derived using a set of concentration-response functions developed based on results from a pooled 8 analysis of epidemiology studies (Lanphear et al., 2005). These concentration-response 9 functions are combined with the population-level blood Pb distributions generated for the case
studies to produce distributions of IQ loss estimates for each study population. IQ loss is also 11 apportioned among different exposure pathways using the pathway apportionment information 12 generated as part of the exposure analysis. 13 Two key elements of the risk methodology are described in greater detail below: (a) the 14 concentration-response functions used in the analysis (Section 4.1.1) and (b) the step-wise
analytical procedure used to generate the IQ loss (risk) distributions (Section 4.1.2).
16 4.1.1 Concentration-Response Functions 17 As discussed in Section 2.1.5, log-linear concentration-response functions for IQ loss for 18 the concurrent and lifetime average blood Pb metrics were obtained from a large pooled study 19 (Lanphear et al., 2005) and used as the basis for estimating IQ changes in children in this
analysis. Three types of concentration-response functions were drawn from this study, and two 21 equations of each type are used in this assessment: one for the concurrent blood Pb metric, and a 22 second for the lifetime average blood Pb metric. The three types include: (a) a log-linear 23 function with cutpoint (Section 4.1.1.1), (b) a log-linear function with low-exposure linearization 24 (Section 4.1.1.2) and (c) a two-piece linear function (Section 4.1.1.3). Plots of the three types of
IQ-loss functions developed for this assessment are presented in Figure 4-1 for the concurrent 26 blood Pb metric. Table 4-1 presents a comparison of total IQ loss and incremental IQ loss (IQ 27 loss/µg/dL) for the three functions across a range of concurrent blood Pb levels. As can be seen 28 by comparing the plots of the three functions together with the results presented in Table 4-1, the 29 log-linear function with low-exposure linearization will generate the greatest IQ change across
the exposure range 0 to 10 µg/dL followed by the log-linear function with cutpoint and then the 31 two-piece linear function.
July 2007 4-1 Draft – Do Not Quote or Cite
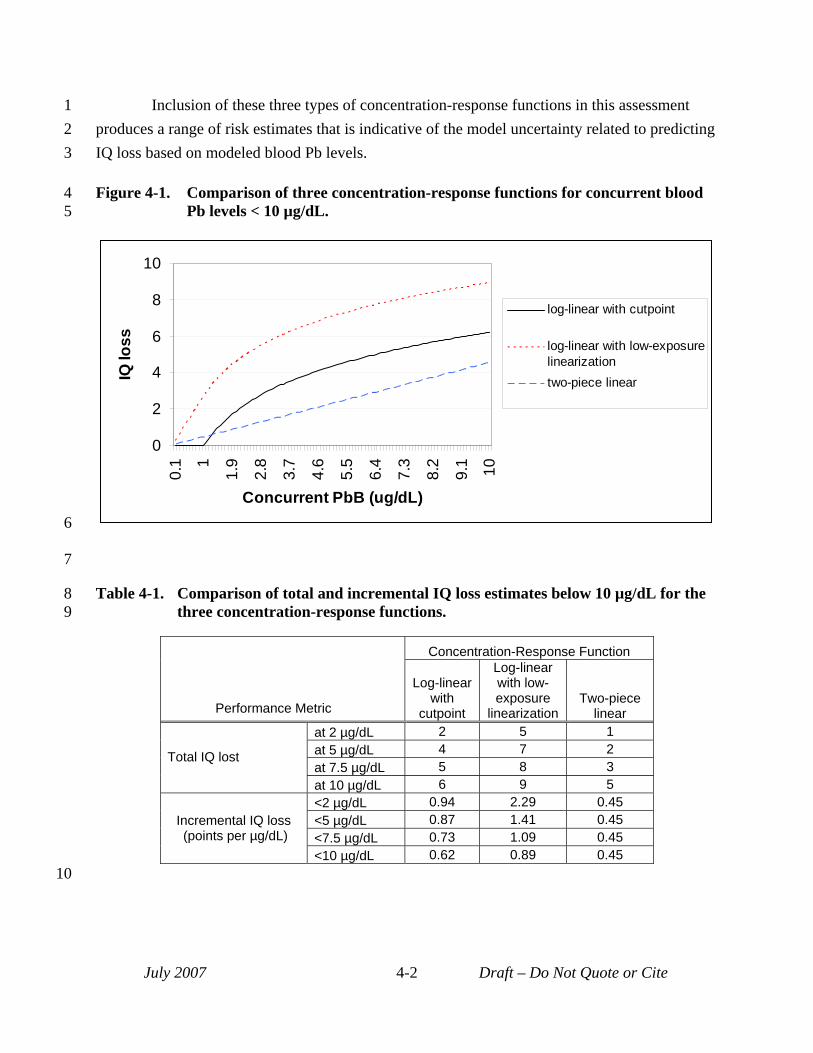
1 Inclusion of these three types of concentration-response functions in this assessment 2 produces a range of risk estimates that is indicative of the model uncertainty related to predicting 3 IQ loss based on modeled blood Pb levels.
4 Figure 4-1. Comparison of three concentration-response functions for concurrent blood 5 Pb levels < 10 µg/dL.
0
2
4
6
8
10
0.1 1
1.9
2.8
3.7
4.6
5.5
6.4
7.3
8.2
9.1 10
Concurrent PbB (ug/dL)
IQ lo
ss
log-linear with cutpoint
log-linear with low-exposure linearization two-piece linear
6
7
8 Table 4-1. Comparison of total and incremental IQ loss estimates below 10 µg/dL for the 9 three concentration-response functions.
Performance Metric
Concentration-Response Function
Log-linear with
cutpoint
Log-linear with low-exposure
linearization Two-piece
linear
Total IQ lost
at 2 µg/dL 2 5 1 at 5 µg/dL 4 7 2 at 7.5 µg/dL 5 8 3 at 10 µg/dL 6 9 5
Incremental IQ loss (points per µg/dL)
<2 µg/dL 0.94 2.29 0.45 <5 µg/dL 0.87 1.41 0.45 <7.5 µg/dL 0.73 1.09 0.45 <10 µg/dL 0.62 0.89 0.45
July 2007 4-2 Draft – Do Not Quote or Cite
10
1 2 3 4 5 6 7 8 9
10 11 12 13 14 15 16 17
18 19 20 21 22 23 24 25 26 27 28 29 30 31 32 33 34
4.1.1.1 Log-Linear Function with Cutpoint This concentration-response function is the log-linear function for IQ change from
Lanphear et al. (2005), with incorporation of a cutpoint at the blood Pb level corresponding to the lowest levels represented by measurements in the underlying pooled analysis. The values used for cutpoints, for both the concurrent and lifetime average blood Pb metrics, are based on the corresponding low end of the range of values for these two indices in the pooled analysis (Hornung, 2007a, b). The values are 1.0 µg/dL and 1.47 µg/dL, for the concurrent and lifetime average blood Pb metrics, respectively. Slopes for the two log-linear functions were obtained directly from the study (Lanphear et al., 2005). Parameterization for these two log-linear functions with cutpoints is presented below, along with the mathematical form of the function:
• Form of function: IQ loss = beta * ln (concurrent blood Pb/cutpoint) • Log-linear function with cutpoint (concurrent metric):
- beta (slope): -2.70 - cutpoint: 1.0 µg/dL
• Log-linear function with cutpoint (lifetime average metric): - beta (slope): -3.04 - cutpoint: 1.47 µg/dL
4.1.1.2 Log-Linear Function with Low-Exposure Linearization We also developed risk estimates that reflect the possibility that IQ loss is associated with
the entire range of Pb exposure all the way down to "zero" exposure, as recommended by CASAC (Henderson, 2007). The risk assessment included IQ loss prediction based on a log-linear IQ change function with a linearization of the log-linear function taking over at lower exposure levels. The transition point from the log-linear function to the linearized slope was selected with the same basis as the cutpoint described in Section 4.1.1.1, the lower end of the range of the pertinent blood Pb index values in the pooled analysis (Lanphear et al., 2005). The linearized slope is obtained by taking the tangent to the log-linear function at the point of departure, with different slopes being identified for the concurrent and lifetime average blood Pb metrics (per Lanphear et al, 2005). Parameterization for the two log-linear functions with low-exposure linearization is presented below, with the mathematical form of the function:
• Form of function: - For blood Pb level > cutpoint:
IQ loss = beta * ln (concurrent blood Pb/cutpoint) + linear slope * cutpoint - For blood Pb level < cutpoint:
IQ loss = linear slope * concurrent blood Pb
July 2007 4-3 Draft – Do Not Quote or Cite
1 2 3 4 5 6
7 8 9
10 11 12 13 14 15 16 17 18 19 20 21 22 23 24 25 26 27 28 29 30 31 32 33 34 35
• Log-linear function with low-exposure linearization (concurrent metric): - beta (slope): -2.70 - linear slope to be applied below 1.0 µg/dL: -2.70
• Log-linear function with low-exposure linearization (lifetime average metric): - beta (slope): -3.04 - linear slope to be applied below 1.47 µg/dL: -2.1
4.1.1.3 Two-piece Linear Function This category of concentration-response function was developed by fitting a two-piece
linear model to the log-linear IQ-loss function obtained from the pooled analysis (Lanphear et al., 2005). Inclusion of this function in the risk assessment is intended to address the practical problem of the shape associated with application of the log-linear model at the low end of the blood Pb value range. In this case, we consider an alternate functional form that allows ready prediction of IQ loss across the full range of modeled Pb exposure. The procedure involved first generating blood Pb values for each of the two blood Pb metrics, concurrent and lifetime average, for a set of N = 1,333 simulated children representative of those included in the pooled analysis (Lanphear et al., 2005). This was accomplished by sampling from a blood Pb distribution constructed from the median and 95th percentile of the concurrent and lifetime average blood Pb indices, respectively, reported in Lanphear et al. (2005). IQ values for each of the 1,333 simulated children were then estimated using the reported log-linear models that relate blood Pb to absolute IQ (Lanphear, et al., 2005). Nonlinear regression techniques were then used to fit two piece linear models to these two sets of simulated children with their matched pairs of blood Pb and IQ values. The regressions provided parameter estimates (slopes and "hinge" point) of the best fitting two piece linear segment function for each blood Pb metric, concurrent and lifetime average. As discussed in Section 4.3.1, that the use of a constructed dataset introduces uncertainty related to fitting of a model to a model. Parameterization for the two two-piece linear functions is presented below, with the mathematical form of the function:
• Form of function: - For blood Pb level > hinge:
IQ loss = beta 2 * concurrent blood Pb - For blood Pb level < hinge:
IQ loss = beta 1 * concurrent blood Pb • Two-piece linear function (concurrent metric):
- "hinge" linking two segments: 10.82 µg/dL - beta 1 (slope at <10.82 µg/dL): -0.4539 - beta 2 (slope at >10.82 µg/dL: -0.1130
July 2007 4-4 Draft – Do Not Quote or Cite
1 2 3 4
5 6 7 8 9
10 11 12 13 14 15 16 17 18 19 20 21 22 23 24 25 26 27 28 29 30 31 32 33 34 35
• Two-piece linear function (lifetime average metric): - "hinge" linking two segments: 13.39 µg/dL - beta 1 (slope at <13.39 µg/dL): -0.3790 - beta 2 (slope at >13.39 µg/dL: -0.1187
4.1.2 Projection of Population Risk Risk characterization completed for this assessment involved converting the population-
level blood Pb distributions generated for the three case studies into population-level distributions of IQ loss using the three types of concentration-response functions described in the last section. This procedure is described below for each of the functions.
• Log-linear function with cutpoint: Each modeled blood Pb level is compared against the cutpoint. If the blood Pb level is lower than the cutpoint, then no IQ loss is estimated because the simulated individual’s blood Pb level is below the level for predicting IQ loss with this function. If the blood Pb level is greater than the cutpoint, then the log-linear function is used to predict IQ loss for the portion of the estimated blood Pb level extending above the cutpoint.
• Log-linear function with low-exposure linearization: Each modeled blood Pb level is compared against the point of linearization. If the blood Pb level is below the point where the function becomes linear, than the linear slope is used to predict IQ loss. If the modeled Pb level is above the point where the function becomes linear, than IQ loss is calculated as the sum of IQ loss across the linear portion of the curve plus the additional contribution from the log-linear portion of the function extending up to the total blood Pb level.
• Two-piece linear function: Similar to the last function, the modeled blood Pb level is compared against the blood Pb level of the “hinge”. If the blood Pb level falls below the hinge, as is the case for most simulated individuals at the three case studies, then the steeper, low-exposure slope is used to estimate IQ loss. If the simulated blood Pb level falls above the hinge, then IQ loss associated with the low-exposure (steeper slope) piece of the function (for the portion of the blood Pb level up to the hinge) is combined with IQ loss estimated using the shallower and higher exposure slope, for that portion of the blood Pb level extending above the hinge.
The IQ loss estimates generated using this approach are pooled to form a population-level distribution of IQ loss for a given study area. Each of these IQ loss estimates are pathway apportioned based on pathway contribution to the underlying blood Pb levels. That is, IQ loss estimates are apportioned among policy-relevant background pathways, recent air-related
July 2007 4-5 Draft – Do Not Quote or Cite
5
10
15
20
25
30
1 pathways, and other (including older historical air-related) pathways (see Section 2.4.3). As with 2 pathway apportionment for blood Pb levels (Section 3.2), pathway apportionment of risk 3 estimates is also at the exposure zone-level. All simulated individuals from a given zone are 4 assigned the same pathway apportionment. As noted with regard to blood Pb levels (Section
3.2.3), there is increased uncertainty associated with pathway apportioned IQ loss estimates for 6 higher-end risk percentiles, since these reflect an assumption that relative pathway contributions 7 at central tendency exposure levels hold at the high-end percentiles of the blood Pb level 8 distribution. 9 Just as with the population-level exposure estimates discussed in Section 3.2.2, risk
estimates generated using the approach outlined above are used to generate several types of risk 11 metrics, depending on the case study. For the two point source case studies, because they are 12 location-specific and include a defined and enumerated receptor population, two categories of 13 risk metrics are generated: 14 • Population-weighted risk (IQ loss) percentiles: IQ loss (with pathway apportionment)
for simulated individuals representing specific points along the population risk 16 distribution (e.g., 50, 90, 95, 99 and 99.5th percentile simulated individuals). 17 • Incidence counts: Number of children within a given study area projected to experience a 18 magnitude of IQ loss. 19
As for the exposure estimates, the general urban case study risk metrics are restricted to 21 population-weighted risk (IQ loss) percentiles.
22 4.2 RISK ESTIMATES 23 Estimates of IQ loss resulting from Pb exposure have been developed for each air quality 24 scenario in each case study (see Appendix K). Further, multiple sets of risk results were
generated for each combination of case study and air quality scenario, in an effort to consider 26 key sources of uncertainty and their impact on blood Pb estimates (see Section 2.4.6.2). That is, 27 twenty four separate risk distributions were generated for each air quality scenario of the general 28 urban case study and six distributions were generated for each air quality scenario of the point 29 source case studies (see Table 2-3).
As discussed in Section 2.4.6.2, generating multiple sets of risk results for each 31 combination of case study and air quality scenario provides a range of results reflecting the 32 impact of key sources of uncertainty on risk results. However, because we could not assign 33 specific confidence levels to each modeling approach, these multiple sets of results are not 34 translated into single uncertainty distributions of risk for each air quality scenario in each case
July 2007 4-6 Draft – Do Not Quote or Cite
1 2 3 4 5 6 7 8 9
10 11 12 13 14 15 16 17 18 19 20 21 22 23 24 25 26 27 28 29 30 31 32 33 34 35 36
study. Therefore, we consider the multiple sets of risk results to span the best estimate risk distribution.
The discussions of risk results in the following subsections are focused on the following three types of tables:
• Summary of risk estimates for recent air: This table focuses on risk estimates derived from inhalation of ambient air Pb and ingestion of Pb in indoor dust that is predicted to be associated with ambient air Pb concentrations based on the indoor dust model (i.e., “recent air” risk per Sections 2.4.3 and 3.2.2) Given the overall modeling approach used in this analysis, this set of risk estimates is expected to be most responsive to alternative NAAQS.
• Summary of risk estimates for recent air plus past air (other indoor dust and outdoor soil contribution: This table focuses on risk estimates derived from inhalation of ambient air Pb, ingestion of indoor dust and ingestion of outdoor soil/dust (Sections 2.4.3 and 3.2.2). That is, this table includes the pathways represented in previous summary table in addition to other indoor dust and outdoor soil pathways. These estimates include some contribution from indoor paint because the indoor dust models handicapped our ability to parse out this contribution. Otherwise, these estimates reflect contributions from all except the policy-relevant background pathways of diet and drinking water.
• Expanded set of risk estimates: This set of tables presents the population percentile risk results with full pathway apportionment information for the low-risk and high-risk modeling approaches for each air quality scenario in each case study.
Although there are a variety of uncertainties associated with these risk estimates including the estimates of pathway apportionment (see Section 4.3), an uncertainty specific to the higher population percentile pathway contribution estimates for all three case studies is noted here. Pathway apportionment for higher population percentiles are subject to significant uncertainty for all three case studies. This is because the pathway apportionment estimates are derived using central tendency blood Pb levels (prior to application of the GSD). Consequently, pathway apportionment results for higher-end population percentiles reflect an assumption that pathway apportionment for lower (central tendency) estimates hold for higher population percentiles. There is uncertainty in this assumption since there is the potential for higher-end population percentiles to demonstrate significantly different pathway apportionment (e.g., have their exposures dominated by particular sources such as Pb paint or Pb in drinking water).
In presenting IQ loss estimates, we have presented all values below 0.5 as <1 and values between 0.5 and 1.0 as 1.0. All values above 1.0 are rounded to the nearest whole number.
July 2007 4-7 Draft – Do Not Quote or Cite
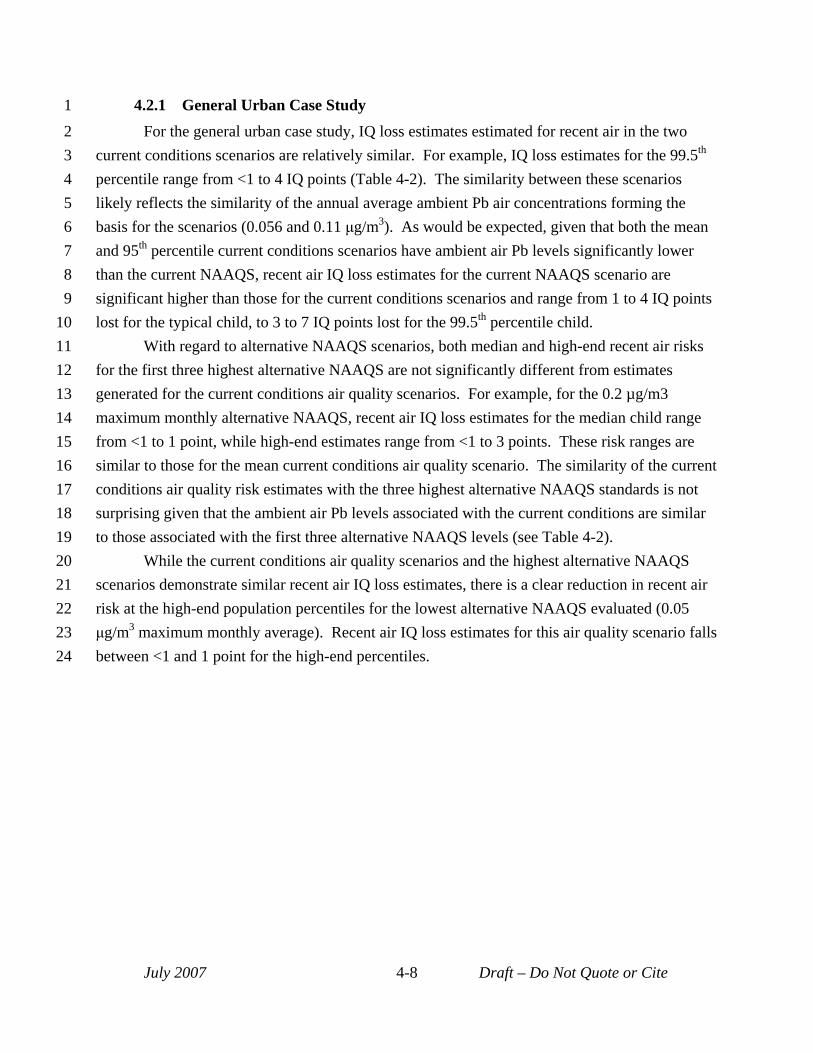
1 2 3 4 5 6 7 8 9
10 11 12 13 14 15 16 17 18 19 20 21 22 23 24
4.2.1 General Urban Case Study For the general urban case study, IQ loss estimates estimated for recent air in the two
current conditions scenarios are relatively similar. For example, IQ loss estimates for the 99.5th
percentile range from <1 to 4 IQ points (Table 4-2). The similarity between these scenarios likely reflects the similarity of the annual average ambient Pb air concentrations forming the basis for the scenarios (0.056 and 0.11 μg/m3). As would be expected, given that both the mean and 95th percentile current conditions scenarios have ambient air Pb levels significantly lower than the current NAAQS, recent air IQ loss estimates for the current NAAQS scenario are significant higher than those for the current conditions scenarios and range from 1 to 4 IQ points lost for the typical child, to 3 to 7 IQ points lost for the 99.5th percentile child.
With regard to alternative NAAQS scenarios, both median and high-end recent air risks for the first three highest alternative NAAQS are not significantly different from estimates generated for the current conditions air quality scenarios. For example, for the 0.2 µg/m3 maximum monthly alternative NAAQS, recent air IQ loss estimates for the median child range from <1 to 1 point, while high-end estimates range from <1 to 3 points. These risk ranges are similar to those for the mean current conditions air quality scenario. The similarity of the current conditions air quality risk estimates with the three highest alternative NAAQS standards is not surprising given that the ambient air Pb levels associated with the current conditions are similar to those associated with the first three alternative NAAQS levels (see Table 4-2).
While the current conditions air quality scenarios and the highest alternative NAAQS scenarios demonstrate similar recent air IQ loss estimates, there is a clear reduction in recent air risk at the high-end population percentiles for the lowest alternative NAAQS evaluated (0.05 μg/m3 maximum monthly average). Recent air IQ loss estimates for this air quality scenario falls between <1 and 1 point for the high-end percentiles.
July 2007 4-8 Draft – Do Not Quote or Cite
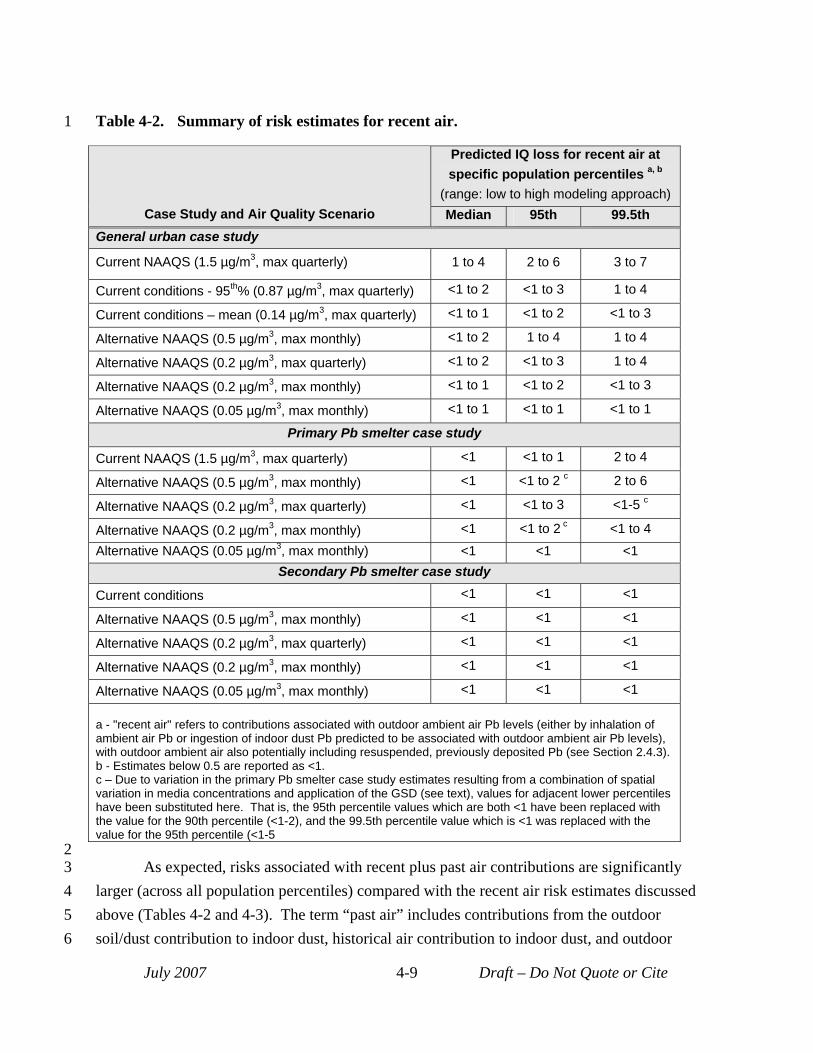
1 Table 4-2. Summary of risk estimates for recent air.
Case Study and Air Quality Scenario
Predicted IQ loss for recent air at specific population percentiles a, b
(range: low to high modeling approach) Median 95th 99.5th
General urban case study
Current NAAQS (1.5 µg/m3, max quarterly) 1 to 4 2 to 6 3 to 7
Current conditions - 95th% (0.87 µg/m3, max quarterly) <1 to 2 <1 to 3 1 to 4
Current conditions – mean (0.14 µg/m3, max quarterly) <1 to 1 <1 to 2 <1 to 3
Alternative NAAQS (0.5 µg/m3, max monthly) <1 to 2 1 to 4 1 to 4
Alternative NAAQS (0.2 µg/m3, max quarterly) <1 to 2 <1 to 3 1 to 4
Alternative NAAQS (0.2 µg/m3, max monthly) <1 to 1 <1 to 2 <1 to 3
Alternative NAAQS (0.05 µg/m3, max monthly) <1 to 1 <1 to 1 <1 to 1
Primary Pb smelter case study
Current NAAQS (1.5 µg/m3, max quarterly) <1 <1 to 1 2 to 4
Alternative NAAQS (0.5 µg/m3, max monthly) <1 <1 to 2 c 2 to 6
Alternative NAAQS (0.2 µg/m3, max quarterly) <1 <1 to 3 <1-5 c
Alternative NAAQS (0.2 µg/m3, max monthly) <1 <1 to 2 c <1 to 4
Alternative NAAQS (0.05 µg/m3, max monthly) <1 <1 <1 Secondary Pb smelter case study
Current conditions <1 <1 <1
Alternative NAAQS (0.5 µg/m3, max monthly) <1 <1 <1
Alternative NAAQS (0.2 µg/m3, max quarterly) <1 <1 <1
Alternative NAAQS (0.2 µg/m3, max monthly) <1 <1 <1
Alternative NAAQS (0.05 µg/m3, max monthly) <1 <1 <1
a - "recent air" refers to contributions associated with outdoor ambient air Pb levels (either by inhalation of ambient air Pb or ingestion of indoor dust Pb predicted to be associated with outdoor ambient air Pb levels), with outdoor ambient air also potentially including resuspended, previously deposited Pb (see Section 2.4.3). b - Estimates below 0.5 are reported as <1. c – Due to variation in the primary Pb smelter case study estimates resulting from a combination of spatial variation in media concentrations and application of the GSD (see text), values for adjacent lower percentiles have been substituted here. That is, the 95th percentile values which are both <1 have been replaced with the value for the 90th percentile (<1-2), and the 99.5th percentile value which is <1 was replaced with the value for the 95th percentile (<1-5
2 3 As expected, risks associated with recent plus past air contributions are significantly 4 larger (across all population percentiles) compared with the recent air risk estimates discussed 5 above (Tables 4-2 and 4-3). The term “past air” includes contributions from the outdoor 6 soil/dust contribution to indoor dust, historical air contribution to indoor dust, and outdoor
July 2007 4-9 Draft – Do Not Quote or Cite
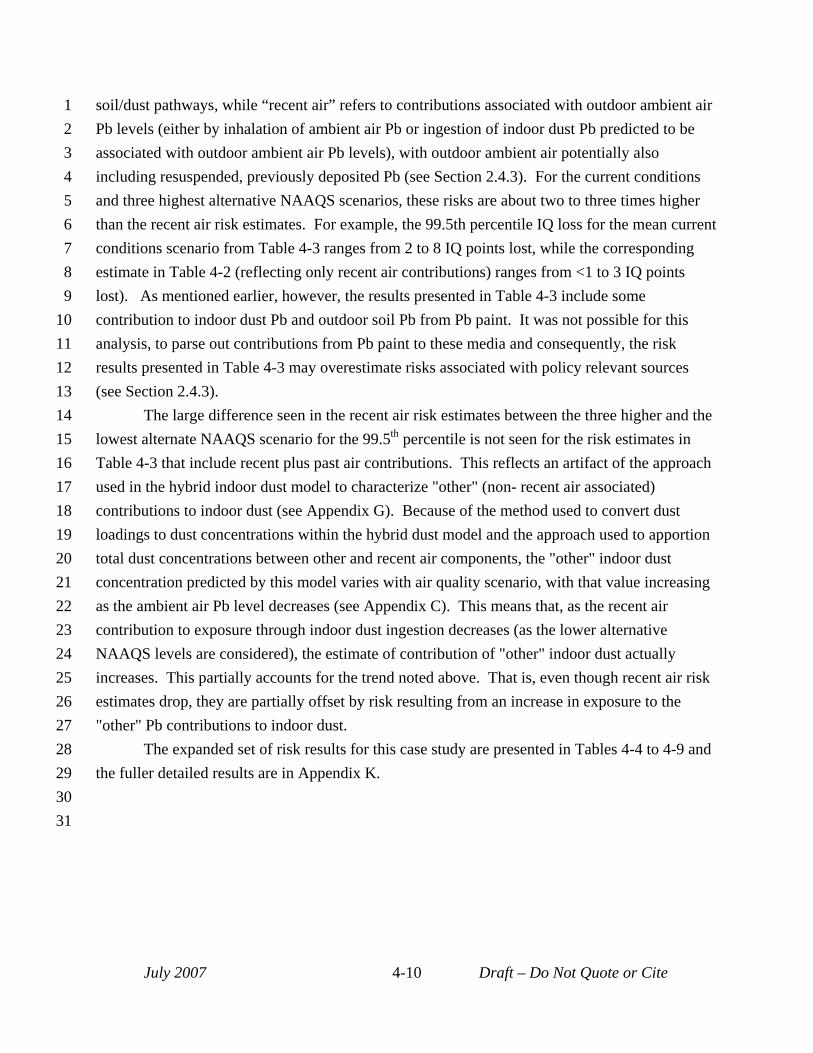
1 2 3 4 5 6 7 8 9
10 11 12 13 14 15 16 17 18 19 20 21 22 23 24 25 26 27 28 29 30 31
soil/dust pathways, while “recent air” refers to contributions associated with outdoor ambient air Pb levels (either by inhalation of ambient air Pb or ingestion of indoor dust Pb predicted to be associated with outdoor ambient air Pb levels), with outdoor ambient air potentially also including resuspended, previously deposited Pb (see Section 2.4.3). For the current conditions and three highest alternative NAAQS scenarios, these risks are about two to three times higher than the recent air risk estimates. For example, the 99.5th percentile IQ loss for the mean current conditions scenario from Table 4-3 ranges from 2 to 8 IQ points lost, while the corresponding estimate in Table 4-2 (reflecting only recent air contributions) ranges from <1 to 3 IQ points lost). As mentioned earlier, however, the results presented in Table 4-3 include some contribution to indoor dust Pb and outdoor soil Pb from Pb paint. It was not possible for this analysis, to parse out contributions from Pb paint to these media and consequently, the risk results presented in Table 4-3 may overestimate risks associated with policy relevant sources (see Section 2.4.3).
The large difference seen in the recent air risk estimates between the three higher and the lowest alternate NAAQS scenario for the 99.5th percentile is not seen for the risk estimates in Table 4-3 that include recent plus past air contributions. This reflects an artifact of the approach used in the hybrid indoor dust model to characterize "other" (non- recent air associated) contributions to indoor dust (see Appendix G). Because of the method used to convert dust loadings to dust concentrations within the hybrid dust model and the approach used to apportion total dust concentrations between other and recent air components, the "other" indoor dust concentration predicted by this model varies with air quality scenario, with that value increasing as the ambient air Pb level decreases (see Appendix C). This means that, as the recent air contribution to exposure through indoor dust ingestion decreases (as the lower alternative NAAQS levels are considered), the estimate of contribution of "other" indoor dust actually increases. This partially accounts for the trend noted above. That is, even though recent air risk estimates drop, they are partially offset by risk resulting from an increase in exposure to the "other" Pb contributions to indoor dust.
The expanded set of risk results for this case study are presented in Tables 4-4 to 4-9 and the fuller detailed results are in Appendix K.
July 2007 4-10 Draft – Do Not Quote or Cite
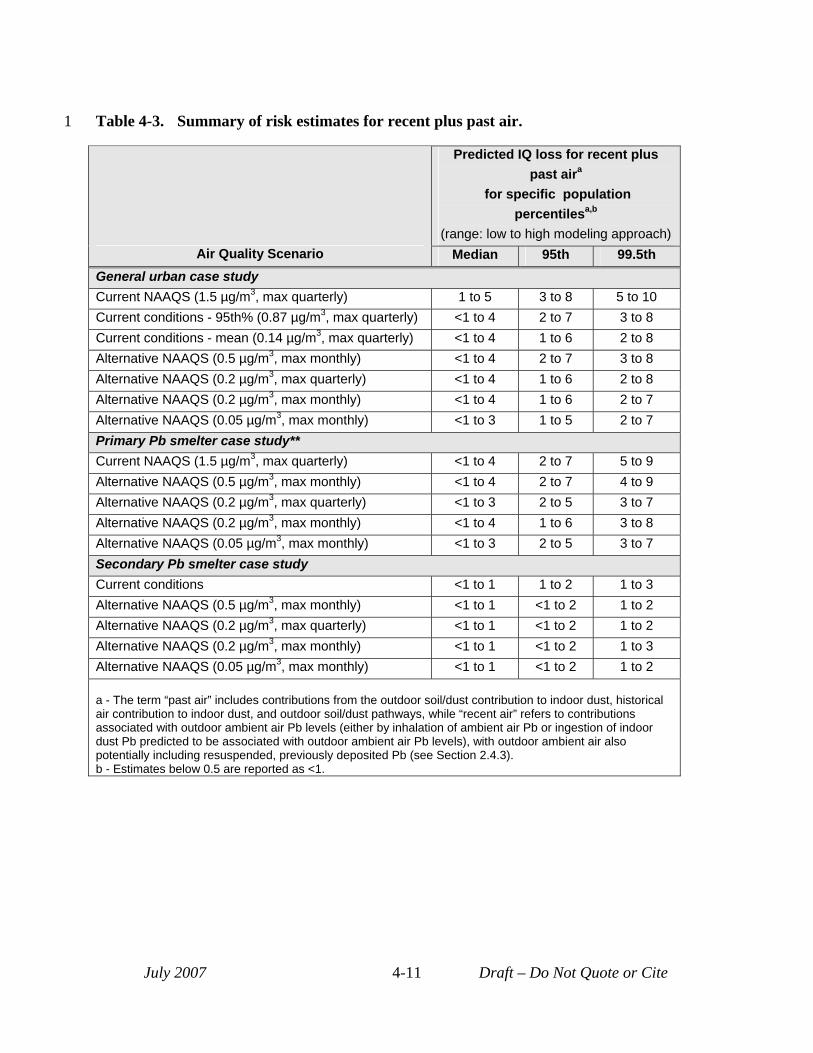
1 Table 4-3. Summary of risk estimates for recent plus past air.
Air Quality Scenario
Predicted IQ loss for recent plus past aira
for specific population percentilesa,b
(range: low to high modeling approach) Median 95th 99.5th
General urban case study Current NAAQS (1.5 µg/m3, max quarterly) 1 to 5 3 to 8 5 to 10 Current conditions - 95th% (0.87 µg/m3, max quarterly) <1 to 4 2 to 7 3 to 8 Current conditions - mean (0.14 µg/m3, max quarterly) <1 to 4 1 to 6 2 to 8 Alternative NAAQS (0.5 µg/m3, max monthly) <1 to 4 2 to 7 3 to 8 Alternative NAAQS (0.2 µg/m3, max quarterly) <1 to 4 1 to 6 2 to 8 Alternative NAAQS (0.2 µg/m3, max monthly) <1 to 4 1 to 6 2 to 7 Alternative NAAQS (0.05 µg/m3, max monthly) <1 to 3 1 to 5 2 to 7 Primary Pb smelter case study** Current NAAQS (1.5 µg/m3, max quarterly) <1 to 4 2 to 7 5 to 9 Alternative NAAQS (0.5 µg/m3, max monthly) <1 to 4 2 to 7 4 to 9 Alternative NAAQS (0.2 µg/m3, max quarterly) <1 to 3 2 to 5 3 to 7 Alternative NAAQS (0.2 µg/m3, max monthly) <1 to 4 1 to 6 3 to 8 Alternative NAAQS (0.05 µg/m3, max monthly) <1 to 3 2 to 5 3 to 7 Secondary Pb smelter case study Current conditions <1 to 1 1 to 2 1 to 3 Alternative NAAQS (0.5 µg/m3, max monthly) <1 to 1 <1 to 2 1 to 2 Alternative NAAQS (0.2 µg/m3, max quarterly) <1 to 1 <1 to 2 1 to 2 Alternative NAAQS (0.2 µg/m3, max monthly) <1 to 1 <1 to 2 1 to 3 Alternative NAAQS (0.05 µg/m3, max monthly) <1 to 1 <1 to 2 1 to 2
a - The term “past air” includes contributions from the outdoor soil/dust contribution to indoor dust, historical air contribution to indoor dust, and outdoor soil/dust pathways, while “recent air” refers to contributions associated with outdoor ambient air Pb levels (either by inhalation of ambient air Pb or ingestion of indoor dust Pb predicted to be associated with outdoor ambient air Pb levels), with outdoor ambient air also potentially including resuspended, previously deposited Pb (see Section 2.4.3). b - Estimates below 0.5 are reported as <1.
July 2007 4-11 Draft – Do Not Quote or Cite
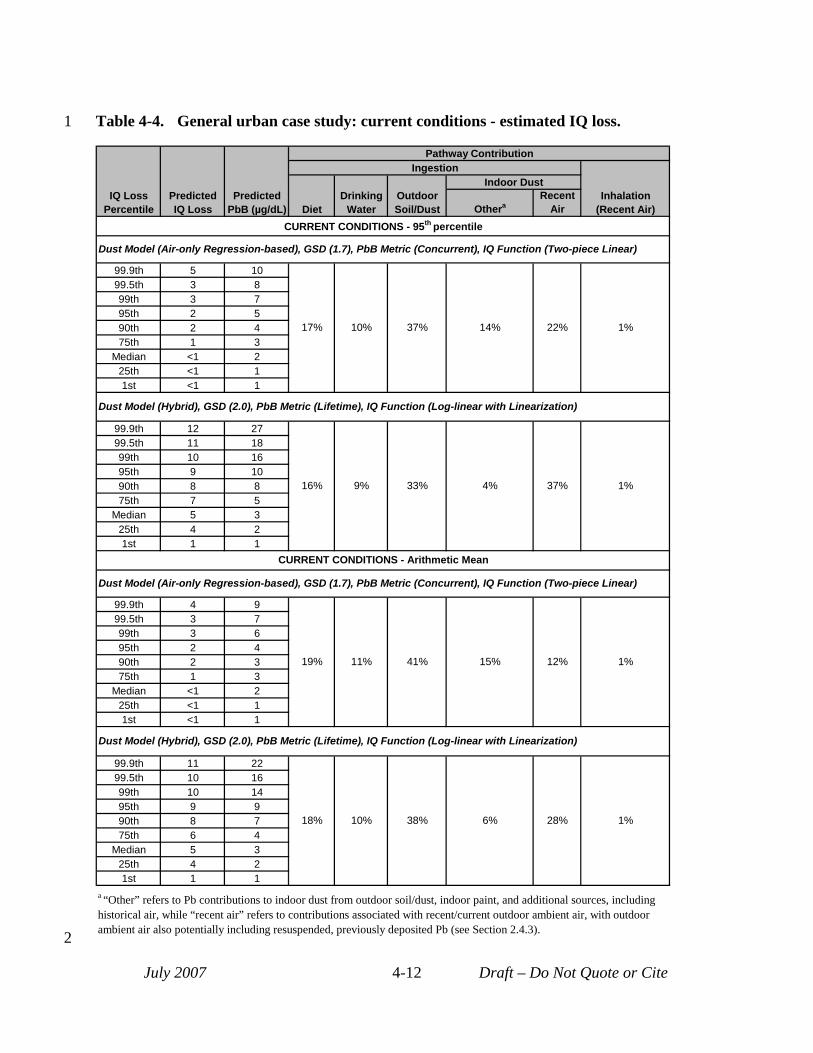
1 Table 4-4. General urban case study: current conditions - estimated IQ loss.
IQ Loss Percentile
Predicted IQ Loss
Predicted PbB (µg/dL)
Pathway Contribution Ingestion
Inhalation (Recent Air) Diet
Drinking Water
Outdoor Soil/Dust
Indoor Dust
Othera Recent
Air CURRENT CONDITIONS - 95th percentile
Dust Model (Air-only Regression-based), GSD (1.7), PbB Metric (Concurrent), IQ Function (Two-piece Linear)
99.9th 5 10
17% 10% 37% 14% 22% 1%
99.5th 3 8 99th 3 7 95th 2 5 90th 2 4 75th 1 3
Median <1 2 25th <1 1 1st <1 1
Dust Model (Hybrid), GSD (2.0), PbB Metric (Lifetime), IQ Function (Log-linear with Linearization)
99.9th 12 27
16% 9% 33% 4% 37% 1%
99.5th 11 18 99th 10 16 95th 9 10 90th 8 8 75th 7 5
Median 5 3 25th 4 2 1st 1 1
CURRENT CONDITIONS - Arithmetic Mean
Dust Model (Air-only Regression-based), GSD (1.7), PbB Metric (Concurrent), IQ Function (Two-piece Linear)
99.9th 4 9
19% 11% 41% 15% 12% 1%
99.5th 3 7 99th 3 6 95th 2 4 90th 2 3 75th 1 3
Median <1 2 25th <1 1 1st <1 1
Dust Model (Hybrid), GSD (2.0), PbB Metric (Lifetime), IQ Function (Log-linear with Linearization)
99.9th 11 22
18% 10% 38% 6% 28% 1%
99.5th 10 16 99th 10 14 95th 9 9 90th 8 7 75th 6 4
Median 5 3 25th 4 2 1st 1 1
a “Other” refers to Pb contributions to indoor dust from outdoor soil/dust, indoor paint, and additional sources, including historical air, while “recent air” refers to contributions associated with recent/current outdoor ambient air, with outdoor ambient air also potentially including resuspended, previously deposited Pb (see Section 2.4.3).
July 2007 4-12 Draft – Do Not Quote or Cite
2
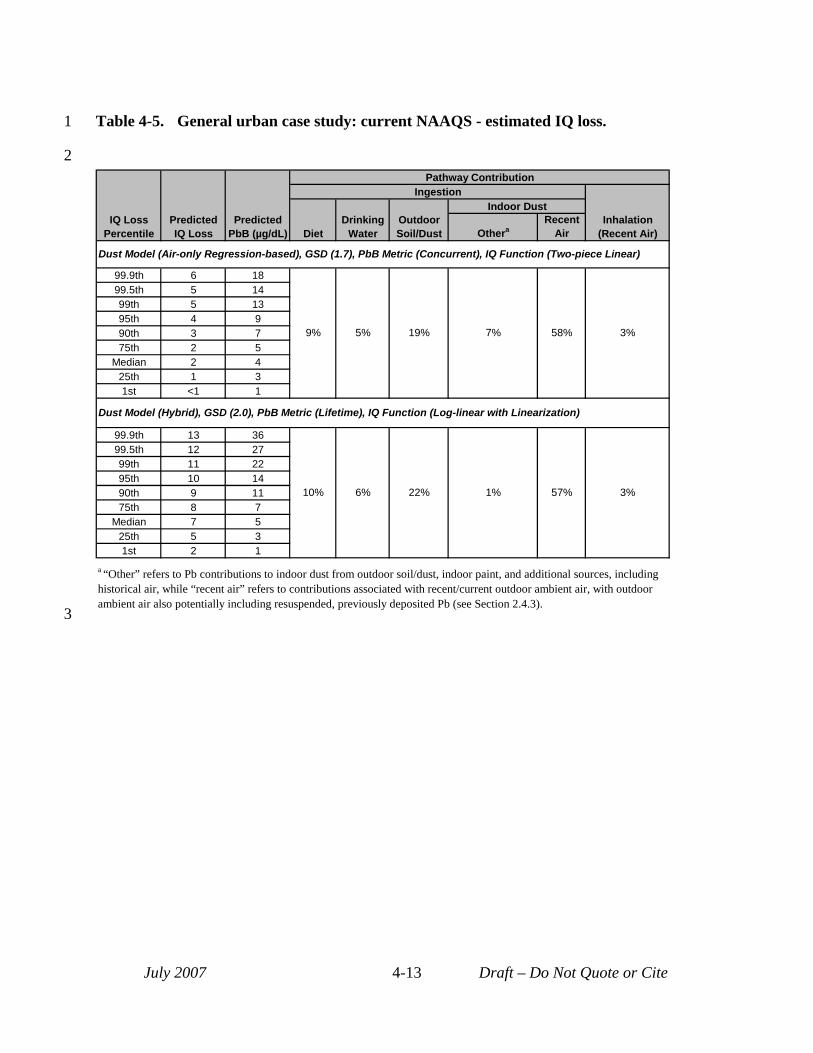
3
1 Table 4-5. General urban case study: current NAAQS - estimated IQ loss.
2
IQ Loss Percentile
Predicted IQ Loss
Predicted PbB (µg/dL)
Pathway Contribution Ingestion
Inhalation (Recent Air) Diet
Drinking Water
Outdoor Soil/Dust
Indoor Dust
Othera Recent
Air
Dust Model (Air-only Regression-based), GSD (1.7), PbB Metric (Concurrent), IQ Function (Two-piece Linear)
99.9th 6 18
9% 5% 19% 7% 58% 3%
99.5th 5 14 99th 5 13 95th 4 9 90th 3 7 75th 2 5
Median 2 4 25th 1 3 1st <1 1
Dust Model (Hybrid), GSD (2.0), PbB Metric (Lifetime), IQ Function (Log-linear with Linearization)
99.9th 13 36
10% 6% 22% 1% 57% 3%
99.5th 12 27 99th 11 22 95th 10 14 90th 9 11 75th 8 7
Median 7 5 25th 5 3 1st 2 1
a “Other” refers to Pb contributions to indoor dust from outdoor soil/dust, indoor paint, and additional sources, including historical air, while “recent air” refers to contributions associated with recent/current outdoor ambient air, with outdoor ambient air also potentially including resuspended, previously deposited Pb (see Section 2.4.3).
July 2007 4-13 Draft – Do Not Quote or Cite
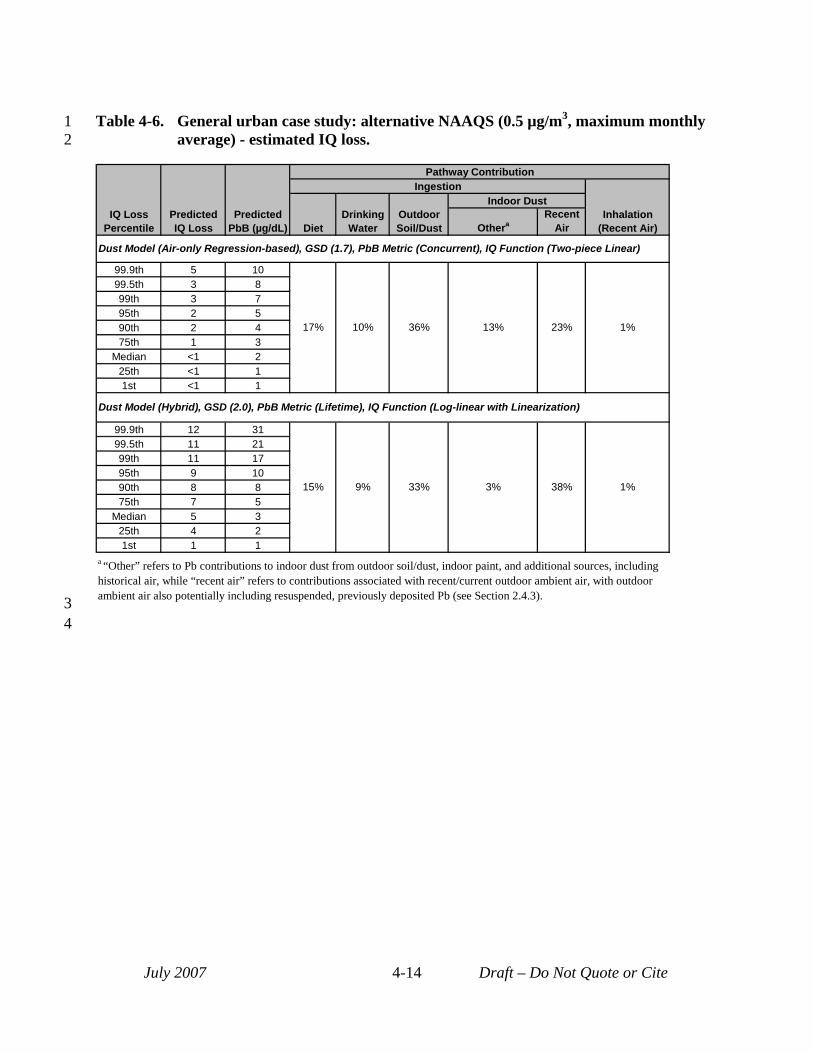
1 Table 4-6. General urban case study: alternative NAAQS (0.5 µg/m3, maximum monthly 2 average) - estimated IQ loss.
IQ Loss Percentile
Predicted IQ Loss
Predicted PbB (µg/dL)
Pathway Contribution Ingestion
Inhalation (Recent Air) Diet
Drinking Water
Outdoor Soil/Dust
Indoor Dust
Othera Recent
Air
Dust Model (Air-only Regression-based), GSD (1.7), PbB Metric (Concurrent), IQ Function (Two-piece Linear)
99.9th 5 10
17% 10% 36% 13% 23% 1%
99.5th 3 8 99th 3 7 95th 2 5 90th 2 4 75th 1 3
Median <1 2 25th <1 1 1st <1 1
Dust Model (Hybrid), GSD (2.0), PbB Metric (Lifetime), IQ Function (Log-linear with Linearization)
99.9th 12 31
15% 9% 33% 3% 38% 1%
99.5th 11 21 99th 11 17 95th 9 10 90th 8 8 75th 7 5
Median 5 3 25th 4 2 1st 1 1
a “Other” refers to Pb contributions to indoor dust from outdoor soil/dust, indoor paint, and additional sources, including historical air, while “recent air” refers to contributions associated with recent/current outdoor ambient air, with outdoor ambient air also potentially including resuspended, previously deposited Pb (see Section 2.4.3). 3
4
July 2007 4-14 Draft – Do Not Quote or Cite

1 Table 4-7. General urban case study: alternative NAAQS (0.2 µg/m3, maximum quarterly 2 average) - estimated IQ loss.
IQ Loss Percentile
Predicted IQ Loss
Predicted PbB (µg/dL)
Pathway Contribution Ingestion
Inhalation (Recent Air) Diet
Drinking Water
Outdoor Soil/Dust
Indoor Dust
Othera Recent
Air
Dust Model (Air-only Regression-based), GSD (1.7), PbB Metric (Concurrent), IQ Function (Two-piece Linear)
99.9th 4 9
18% 11% 39% 15% 16% 1%
99.5th 3 7 99th 3 6 95th 2 4 90th 2 4 75th 1 3
Median <1 2 25th <1 1 1st <1 1
Dust Model (Hybrid), GSD (2.0), PbB Metric (Lifetime), IQ Function (Log-linear with Linearization)
99.9th 12 25
17% 10% 36% 5% 33% 1%
99.5th 11 18 99th 10 15 95th 9 9 90th 8 7 75th 7 5
Median 5 3 25th 4 2 1st 1 1
a “Other” refers to Pb contributions to indoor dust from outdoor soil/dust, indoor paint, and additional sources, including historical air, while “recent air” refers to contributions associated with recent/current outdoor ambient air, with outdoor ambient air also potentially including resuspended, previously deposited Pb (see Section 2.4.3). 3
4
July 2007 4-15 Draft – Do Not Quote or Cite
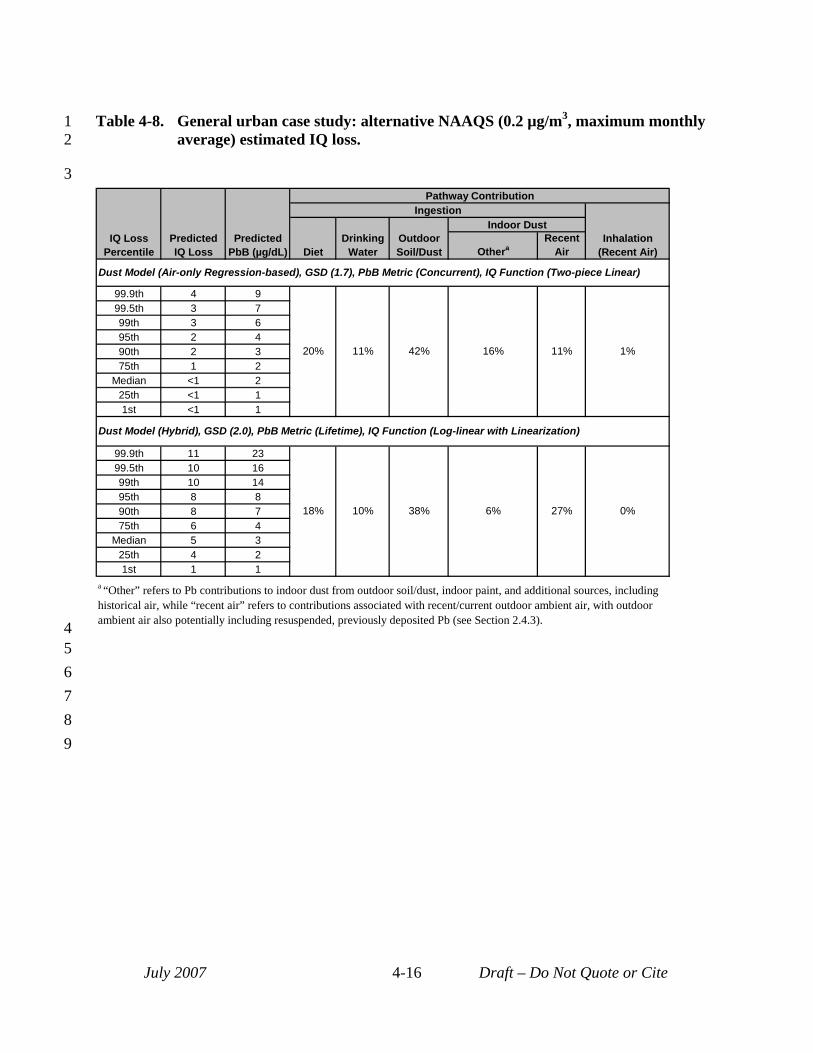
1 Table 4-8. General urban case study: alternative NAAQS (0.2 µg/m3, maximum monthly 2 average) estimated IQ loss.
3
IQ Loss Percentile
Predicted IQ Loss
Predicted PbB (µg/dL)
Pathway Contribution Ingestion
Inhalation (Recent Air) Diet
Drinking Water
Outdoor Soil/Dust
Indoor Dust
Othera Recent
Air
Dust Model (Air-only Regression-based), GSD (1.7), PbB Metric (Concurrent), IQ Function (Two-piece Linear)
99.9th 4 9
20% 11% 42% 16% 11% 1%
99.5th 3 7 99th 3 6 95th 2 4 90th 2 3 75th 1 2
Median <1 2 25th <1 1 1st <1 1
Dust Model (Hybrid), GSD (2.0), PbB Metric (Lifetime), IQ Function (Log-linear with Linearization)
99.9th 11 23
18% 10% 38% 6% 27% 0%
99.5th 10 16 99th 10 14 95th 8 8 90th 8 7 75th 6 4
Median 5 3 25th 4 2 1st 1 1
a “Other” refers to Pb contributions to indoor dust from outdoor soil/dust, indoor paint, and additional sources, including historical air, while “recent air” refers to contributions associated with recent/current outdoor ambient air, with outdoor
4 ambient air also potentially including resuspended, previously deposited Pb (see Section 2.4.3).
5 6 7 8 9
July 2007 4-16 Draft – Do Not Quote or Cite

1 Table 4-9. General urban case study: alternative NAAQS (0.05 µg/m3, maximum monthly 2 average) estimated IQ loss.
IQ Loss Percentile
Predicted IQ Loss
Predicted PbB (µg/dL)
Pathway Contribution Ingestion
Inhalation (Recent Air) Diet
Drinking Water
Outdoor Soil/Dust
Indoor Dust
Othera Recent
Air
Dust Model (Air-only Regression-based), GSD (1.7), PbB Metric (Concurrent), IQ Function (Two-piece Linear)
99.9th 4 8
22% 13% 46% 17% 3% 0%
99.5th 3 6 99th 2 6 95th 2 4 90th 1 3 75th 1 2
Median <1 2 25th <1 1 1st <1 <1
Dust Model (Hybrid), GSD (2.0), PbB Metric (Lifetime), IQ Function (Log-linear with Linearization)
99.9th 11 20
21% 12% 44% 11% 13% 0%
99.5th 10 14 99th 10 12 95th 8 8 90th 7 6 75th 6 4
Median 5 2 25th 3 1 1st 1 <1
a “Other” refers to Pb contributions to indoor dust from outdoor soil/dust, indoor paint, and additional sources, including historical air, while “recent air” refers to contributions associated with recent/current outdoor ambient air, with outdoor ambient air also potentially including resuspended, previously deposited Pb (see Section 2.4.3). 3
4
July 2007 4-17 Draft – Do Not Quote or Cite
1 2 3 4 5 6 7 8 9
10 11 12 13 14 15 16 17 18 19 20 21 22 23 24 25 26 27 28 29 30 31 32 33 34 35
4.2.2 Primary Pb Smelter Case Study Risk estimates for recent air for the primary Pb smelter case study are generally similar to
those generated for the general urban case study. As with the general urban case study, the alternate NAAAQS scenarios produce lower risk estimates compared to the current NAAQS scenario. The 99.5th percentile recent air IQ loss estimates for the current NAAQS scenario range from 2 to 4 points, while the same population percentile for the current NAAQS scenario for the general urban case study ranges from 3 to 7 points (see Table 4-2). The reason for this difference relates to the use of spatially varying media concentrations in the primary Pb smelter case study such that much of the study area is well below the current NAAQS, while all of the general urban case study area is set equal to the current NAAQS in that scenario. As with the general urban case study, while recent air risks are similar for the first three alternative NAAQS evaluated, risks for the high-end population percentiles for the lowest alternative NAAQS (0.05 µg/m3 maximum monthly) are noticeably lower than the other alternative NAAQS, with risks for the high-end modeled child being < 1 IQ point lost.
Although the recent air risks for the primary Pb smelter are similar to those for the general urban case study, there are differences between the two sets of risk results (Table 4-2). For example, generally, the median and 95th percentile recent air risk estimates are somewhat higher for the general urban case study compared with the primary Pb smelter case study. However, the trend is reversed for the 99.5th percentile, where the primary Pb smelter case study has slightly higher upper bound risk estimates across the air quality scenarios. These differences in risk estimates generated for the two case studies reflect a number of factors including:
• Use of a study area with uniform ambient air Pb levels for the general urban case study compared with a study area having significant spatial gradients in air Pb levels for the primary Pb smelter. This results in the general urban case study having larger central tendency risk estimates compared with the primary Pb smelter case study, since all modeled children for the general urban case study experience the ambient air Pb level associated with a particular air quality scenario, while only a relatively small portion of the study area for the primary Pb smelter experiences that level.
• Differences in the way ambient air Pb levels for the different alternate NAAQS scenarios are generated, with application of empirically derived ratios for the general urban case study and use of proportional rollback methods for the primary Pb smelter. The exact impact of this difference may differ depending on the population percentile being considered.
• Different indoor dust models used at the two case studies, with hybrid and regression models for the general urban case study and generic and site-specific regression
July 2007 4-18 Draft – Do Not Quote or Cite
1 2 3 4 5 6 7 8 9
10 11 12 13 14 15 16 17 18 19 20 21 22 23 24 25 26 27 28 29 30 31 32 33 34 35 36
models at the primary Pb smelter. While the use of the hybrid dust model with its greater air-related loading of indoor dust will effect the entire set of modeled children under a given modeling approach, the site-specific regression model used for the primary Pb smelter case study with its greater air-related loading of indoor dust is only applied within the remediation zone and therefore, its higher air-related loading will only effect the highest percentile of modeled children. It is likely that the higher risks seen at the 99.5th percentile for the primary Pb smelter case study reflect the impact of this site-specific indoor dust model with its strong air-to-dust signal.
• Inclusion of a higher GSD reflecting inter-individual variability in blood Pb levels for the general urban case study, along with the same lower GSD used for the primary Pb smelter: Inclusion of a higher GSD for the general urban case study will push the high-end modeled blood Pb levels higher relative to application of the lower GSD in the case of the primary Pb smelter case study. Note, however, that other factors seem to overwhelm this GSD effect for the extreme high-end population percentiles, since as noted earlier, the 99.5th percentile risks for the primary Pb smelter (using the lower GSD) are somewhat higher than the same population percentile risks generated for the general urban case study (with its higher GSD).
As with the general urban case study, risks associated with recent plus past air contributions (Table 4-3) are 2 to 3 times higher than the recent air risks (see Tables 4-2 and 43). However, as described in Section 2.4.3, results presented in Table 4-3 likely represent an overestimate of risks associated with policy-relevant sources because these risk estimates include some contribution from Pb paint.
The trend in recent air risk estimates across air quality scenarios for the 95th and 99.5th
percentiles in this case study sometimes appears inconsistent (Table 4-2). Specifically, several of the alternative NAAQS scenarios have <1 point IQ loss (noted with a "b" footnote in Table 42) when lower alternative NAAQS scenarios yield higher values. This inconsistent trend relates to the influence of inter-Census block and block group variation in exposure concentrations and of the GSD on high-end population exposure and risk. For the two point source case studies, high-end exposure and risk can result from either (a) an individual being located in a block or block group with the highest modeled media Pb concentrations and/or (b) that individual having a GSD-based adjustment factor (reflecting inter-individual variability in Pb exposure) that is relatively high. The fact that either of these factors can produce a high exposure and risk level is reflected in the fact that the pathway apportionment estimates for the high-end population percentiles for the two point source case studies are inconsistent (see expanded set of risk results). Accordingly, as seen in Table 4-2, two adjacent high-end population percentiles (e.g.,
July 2007 4-19 Draft – Do Not Quote or Cite
1 2 3 4 5 6
99th and 99.5th) for a given combination of case study and air quality scenario may have quite different contributions from recent air. This variation in recent air contributions to total Pb exposure is not seen for the general urban case study, since that case study is modeled using a single exposure zone with uniform ambient air Pb levels. That is, for that case study variation in blood Pb levels, for a given modeling approach, results exclusively from the GSD and not from the location of a modeled child relative to an emissions source).
July 2007 4-20 Draft – Do Not Quote or Cite
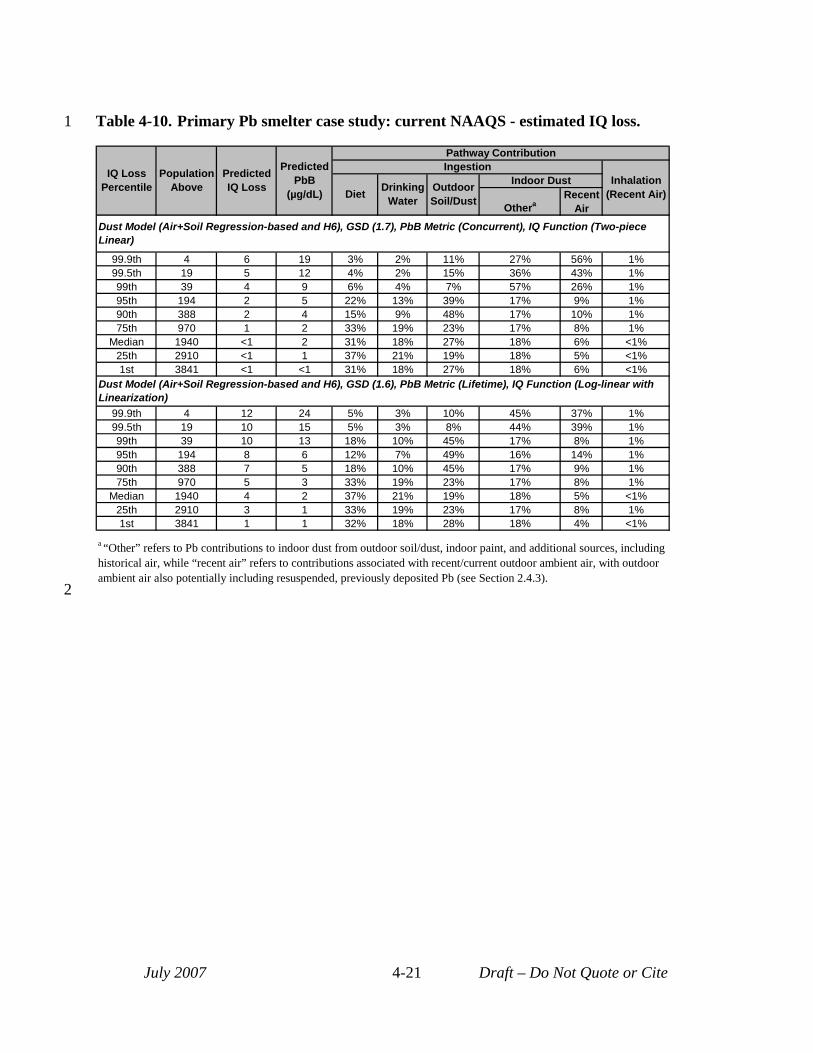
1
2
Table 4-10. Primary Pb smelter case study: current NAAQS - estimated IQ loss.
IQ Loss Percentile
Population Above
Predicted IQ Loss
Predicted PbB
(µg/dL)
Pathway Contribution Ingestion
Inhalation (Recent Air) Diet Drinking
Water Outdoor Soil/Dust
Indoor Dust
Othera Recent
Air Dust Model (Air+Soil Regression-based and H6), GSD (1.7), PbB Metric (Concurrent), IQ Function (Two-piece Linear)
99.9th 4 6 19 3% 2% 11% 27% 56% 1% 99.5th 19 5 12 4% 2% 15% 36% 43% 1% 99th 39 4 9 6% 4% 7% 57% 26% 1% 95th 194 2 5 22% 13% 39% 17% 9% 1% 90th 388 2 4 15% 9% 48% 17% 10% 1% 75th 970 1 2 33% 19% 23% 17% 8% 1%
Median 1940 <1 2 31% 18% 27% 18% 6% <1% 25th 2910 <1 1 37% 21% 19% 18% 5% <1% 1st 3841 <1 <1 31% 18% 27% 18% 6% <1%
Dust Model (Air+Soil Regression-based and H6), GSD (1.6), PbB Metric (Lifetime), IQ Function (Log-linear with Linearization)
99.9th 4 12 24 5% 3% 10% 45% 37% 1% 99.5th 19 10 15 5% 3% 8% 44% 39% 1% 99th 39 10 13 18% 10% 45% 17% 8% 1% 95th 194 8 6 12% 7% 49% 16% 14% 1% 90th 388 7 5 18% 10% 45% 17% 9% 1% 75th 970 5 3 33% 19% 23% 17% 8% 1%
Median 1940 4 2 37% 21% 19% 18% 5% <1% 25th 2910 3 1 33% 19% 23% 17% 8% 1% 1st 3841 1 1 32% 18% 28% 18% 4% <1%
a “Other” refers to Pb contributions to indoor dust from outdoor soil/dust, indoor paint, and additional sources, including historical air, while “recent air” refers to contributions associated with recent/current outdoor ambient air, with outdoor ambient air also potentially including resuspended, previously deposited Pb (see Section 2.4.3).
July 2007 4-21 Draft – Do Not Quote or Cite
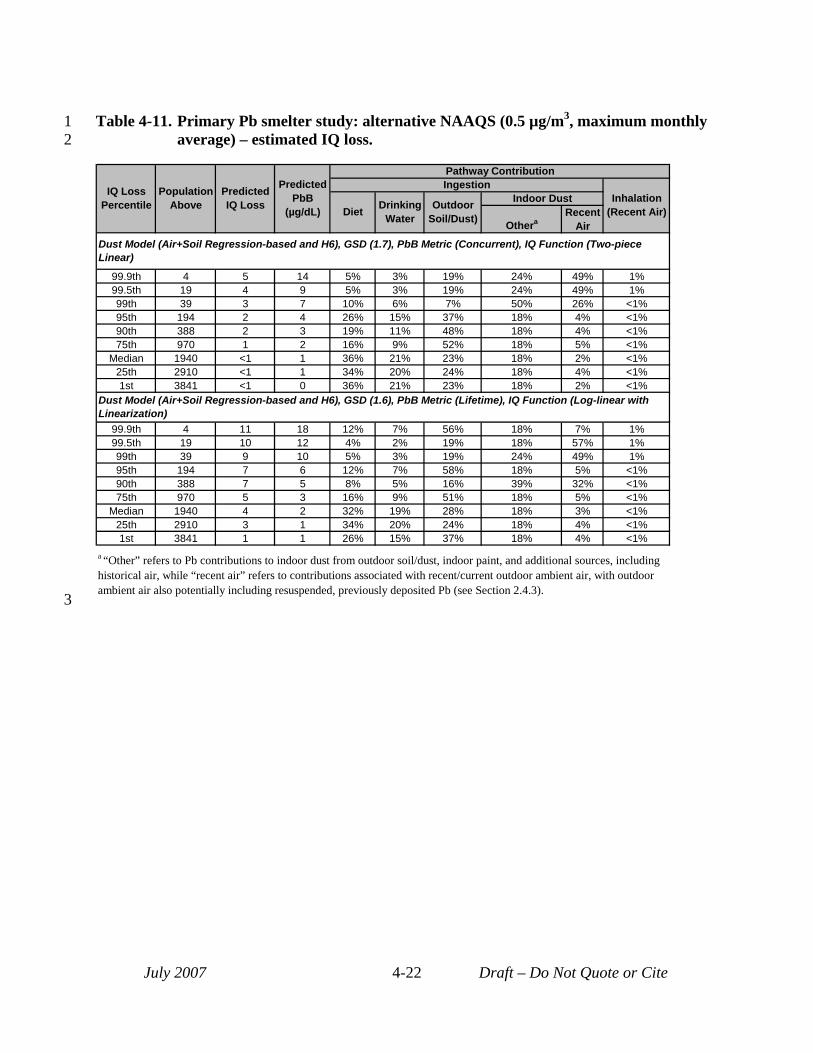
3
1 Table 4-11. Primary Pb smelter study: alternative NAAQS (0.5 µg/m3, maximum monthly 2 average) – estimated IQ loss.
IQ Loss Percentile
Population Above
Predicted IQ Loss
Predicted PbB
(µg/dL)
Pathway Contribution Ingestion
Inhalation (Recent Air) Diet Drinking
Water Outdoor
Soil/Dust)
Indoor Dust
Othera Recent
Air Dust Model (Air+Soil Regression-based and H6), GSD (1.7), PbB Metric (Concurrent), IQ Function (Two-piece Linear)
99.9th 4 5 14 5% 3% 19% 24% 49% 1% 99.5th 19 4 9 5% 3% 19% 24% 49% 1% 99th 39 3 7 10% 6% 7% 50% 26% <1% 95th 194 2 4 26% 15% 37% 18% 4% <1% 90th 388 2 3 19% 11% 48% 18% 4% <1% 75th 970 1 2 16% 9% 52% 18% 5% <1%
Median 1940 <1 1 36% 21% 23% 18% 2% <1% 25th 2910 <1 1 34% 20% 24% 18% 4% <1% 1st 3841 <1 0 36% 21% 23% 18% 2% <1%
Dust Model (Air+Soil Regression-based and H6), GSD (1.6), PbB Metric (Lifetime), IQ Function (Log-linear with Linearization)
99.9th 4 11 18 12% 7% 56% 18% 7% 1% 99.5th 19 10 12 4% 2% 19% 18% 57% 1% 99th 39 9 10 5% 3% 19% 24% 49% 1% 95th 194 7 6 12% 7% 58% 18% 5% <1% 90th 388 7 5 8% 5% 16% 39% 32% <1% 75th 970 5 3 16% 9% 51% 18% 5% <1%
Median 1940 4 2 32% 19% 28% 18% 3% <1% 25th 2910 3 1 34% 20% 24% 18% 4% <1% 1st 3841 1 1 26% 15% 37% 18% 4% <1%
a “Other” refers to Pb contributions to indoor dust from outdoor soil/dust, indoor paint, and additional sources, including historical air, while “recent air” refers to contributions associated with recent/current outdoor ambient air, with outdoor ambient air also potentially including resuspended, previously deposited Pb (see Section 2.4.3).
July 2007 4-22 Draft – Do Not Quote or Cite

3
1 Table 4-12. Primary Pb smelter study: alternative NAAQS (0.2 µg/m3, maximum quarterly 2 average) - estimated IQ loss.
IQ Loss Percentile
Population Above
Predicted IQ Loss
Predicted PbB
(µg/dL)
Pathway Contribution Ingestion
Inhalation (Recent Air) Diet Drinking
Water Outdoor Soil/Dust
Indoor Dust
Othera Recent
Air Dust Model (Air+Soil Regression-based and H6), GSD (1.7), PbB Metric (Concurrent), IQ Function (Two-piece Linear)
99.9th 4 5 11 5% 3% 27% 16% 49% <1% 99.5th 19 4 8 10% 6% 63% 19% 2% <1% 99th 39 3 7 12% 7% 59% 19% 3% <1% 95th 194 2 4 16% 10% 53% 19% 2% <1% 90th 388 1 3 24% 14% 41% 18% 2% <1% 75th 970 <1 2 12% 7% 59% 19% 3% <1%
Median 1940 <1 1 33% 19% 29% 18% 1% <1% 25th 2910 <1 1 16% 10% 53% 19% 2% <1% 1st 3841 <1 <1 38% 22% 20% 18% 1% <1%
Dust Model (Air+Soil Regression-based and H6), GSD (1.6), PbB Metric (Lifetime), IQ Function (Log-linear with Linearization)
99.9th 4 10 14 7% 4% 68% 19% 1% <1% 99.5th 19 9 10 16% 9% 54% 19% 2% <1% 99th 39 9 9 6% 4% 17% 18% 55% 1% 95th 194 7 6 8% 4% 17% 23% 48% <1% 90th 388 6 4 12% 7% 59% 19% 3% <1% 75th 970 5 3 25% 15% 40% 19% 1% <1%
Median 1940 4 2 34% 20% 26% 18% 1% <1% 25th 2910 3 1 23% 13% 43% 19% 2% <1% 1st 3841 1 1 32% 19% 29% 18% 2% <1%
a “Other” refers to Pb contributions to indoor dust from outdoor soil/dust, indoor paint, and additional sources, including historical air, while “recent air” refers to contributions associated with recent/current outdoor ambient air, with outdoor ambient air also potentially including resuspended, previously deposited Pb (see Section 2.4.3).
July 2007 4-23 Draft – Do Not Quote or Cite
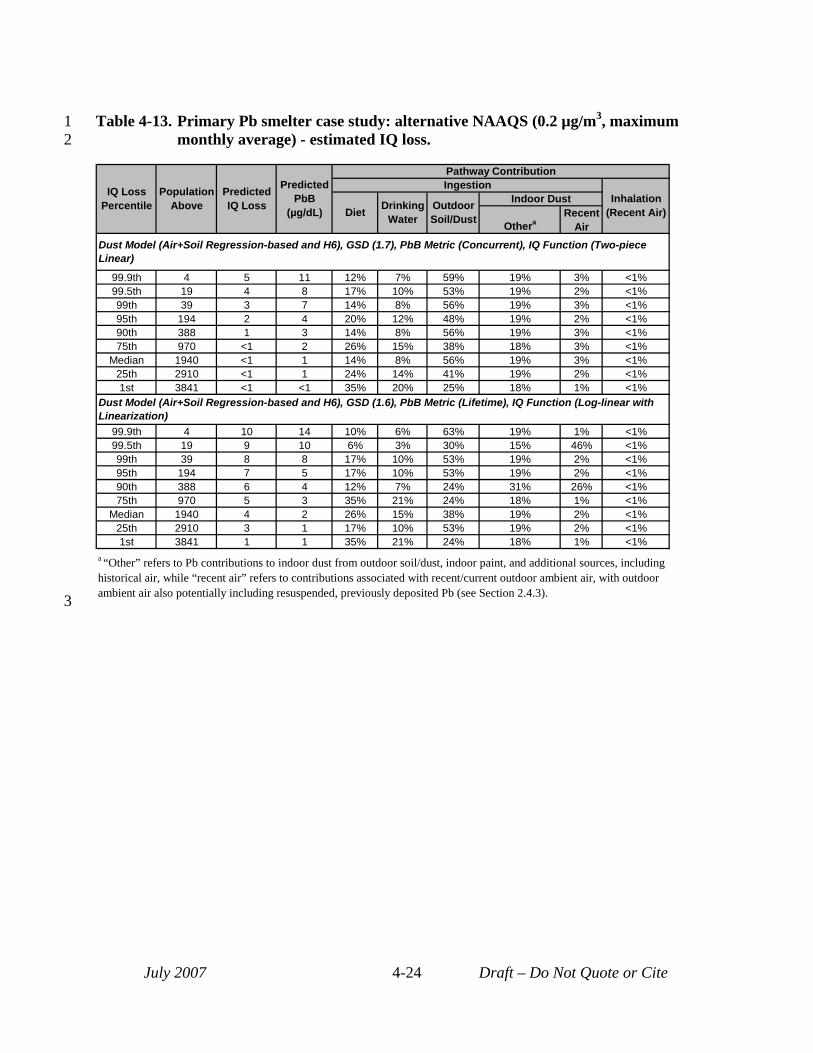
3
1 Table 4-13. Primary Pb smelter case study: alternative NAAQS (0.2 µg/m3, maximum 2 monthly average) - estimated IQ loss.
IQ Loss Percentile
Population Above
Predicted IQ Loss
Predicted PbB
(µg/dL)
Pathway Contribution Ingestion
Inhalation (Recent Air) Diet Drinking
Water Outdoor Soil/Dust
Indoor Dust
Othera Recent
Air Dust Model (Air+Soil Regression-based and H6), GSD (1.7), PbB Metric (Concurrent), IQ Function (Two-piece Linear)
99.9th 4 5 11 12% 7% 59% 19% 3% <1% 99.5th 19 4 8 17% 10% 53% 19% 2% <1% 99th 39 3 7 14% 8% 56% 19% 3% <1% 95th 194 2 4 20% 12% 48% 19% 2% <1% 90th 388 1 3 14% 8% 56% 19% 3% <1% 75th 970 <1 2 26% 15% 38% 18% 3% <1%
Median 1940 <1 1 14% 8% 56% 19% 3% <1% 25th 2910 <1 1 24% 14% 41% 19% 2% <1% 1st 3841 <1 <1 35% 20% 25% 18% 1% <1%
Dust Model (Air+Soil Regression-based and H6), GSD (1.6), PbB Metric (Lifetime), IQ Function (Log-linear with Linearization)
99.9th 4 10 14 10% 6% 63% 19% 1% <1% 99.5th 19 9 10 6% 3% 30% 15% 46% <1% 99th 39 8 8 17% 10% 53% 19% 2% <1% 95th 194 7 5 17% 10% 53% 19% 2% <1% 90th 388 6 4 12% 7% 24% 31% 26% <1% 75th 970 5 3 35% 21% 24% 18% 1% <1%
Median 1940 4 2 26% 15% 38% 19% 2% <1% 25th 2910 3 1 17% 10% 53% 19% 2% <1% 1st 3841 1 1 35% 21% 24% 18% 1% <1%
a “Other” refers to Pb contributions to indoor dust from outdoor soil/dust, indoor paint, and additional sources, including historical air, while “recent air” refers to contributions associated with recent/current outdoor ambient air, with outdoor ambient air also potentially including resuspended, previously deposited Pb (see Section 2.4.3).
July 2007 4-24 Draft – Do Not Quote or Cite

3
1 Table 4-14. Primary Pb smelter case study: alternative NAAQS (0.05 µg/m3, maximum 2 monthly average) - estimated IQ loss.
IQ Loss Percentile
Population Above
Predicted IQ Loss
Predicted PbB
(µg/dL)
Pathway Contribution Ingestion
Inhalation (Recent Air) Diet Drinking
Water Outdoor Soil/Dust
Indoor Dust
Othera Recent
Air Dust Model (Air+Soil Regression-based and H6), GSD (1.7), PbB Metric (Concurrent), IQ Function (Two-piece Linear)
99.9th 4 4 10 16% 10% 45% 15% 14% <1% 99.5th 19 3 7 8% 4% 68% 19% <1% <1% 99th 39 3 6 17% 10% 54% 19% <1% <1% 95th 194 2 4 17% 10% 54% 19% 1% <1% 90th 388 1 3 23% 13% 44% 19% <1% <1% 75th 970 <1 2 28% 17% 36% 19% <1% <1%
Median 1940 <1 1 33% 19% 29% 19% <1% <1% 25th 2910 <1 1 14% 8% 57% 19% 1% <1% 1st 3841 <1 <1 19% 11% 38% 17% 14% <1%
Dust Model (Air+Soil Regression-based and H6), GSD (1.6), PbB Metric (Lifetime), IQ Function (Log-linear with Linearization)
99.9th 4 10 12 14% 8% 57% 19% 1% <1% 99.5th 19 9 9 14% 8% 57% 19% 1% <1% 99th 39 8 8 14% 8% 57% 19% 1% <1% 95th 194 7 5 14% 8% 57% 19% 1% <1% 90th 388 6 4 9% 5% 67% 19% <1% <1% 75th 970 5 3 36% 21% 25% 19% <1% <1%
Median 1940 4 2 36% 21% 25% 19% <1% <1% 25th 2910 3 1 19% 11% 51% 19% <1% <1% 1st 3841 1 1 36% 21% 24% 19% <1% <1%
a “Other” refers to Pb contributions to indoor dust from outdoor soil/dust, indoor paint, and additional sources, including historical air, while “recent air” refers to contributions associated with recent/current outdoor ambient air, with outdoor ambient air also potentially including resuspended, previously deposited Pb (see Section 2.4.3).
July 2007 4-25 Draft – Do Not Quote or Cite
1 2 3 4 5 6 7 8 9
10 11 12 13 14 15 16
4.2.3 Secondary Pb Smelter Case Study Recent air risk for this case study across all population percentiles and air quality
scenarios is less than 1 IQ point lost (see Table 4-2). This reflects the fact that ambient air Pb levels across this study area for all air quality scenarios modeled are significantly lower than those associated with the other study areas (see Table 3-3). As shown in the expanded set of risk results (Tables 4-15 to 4-19), the percent contribution of the recent air pathways to total Pb exposure and risk are below 7% for all scenarios in this case study. This is in contrast to the other two case studies where the percent contribution to total risk from recent air ranges up to 60% for some air quality scenarios. Therefore, in the case of the secondary Pb smelter case study, while absolute IQ loss estimates for the recent air pathways (Table 4-2) are reduced with the lowest alternative NAAQS relative to higher NAAQS levels, all of the shifts in those IQ reductions are associated with IQ values significantly lower than 1.0 and consequently are not reflected in the summary tables presented here (i.e., they are reported as <1 IQ point).
As with the other two case studies, risks associated with recent plus past air contributions are 2 to 3 times higher than the recent air risks (see Table 4-3).
July 2007 4-26 Draft – Do Not Quote or Cite
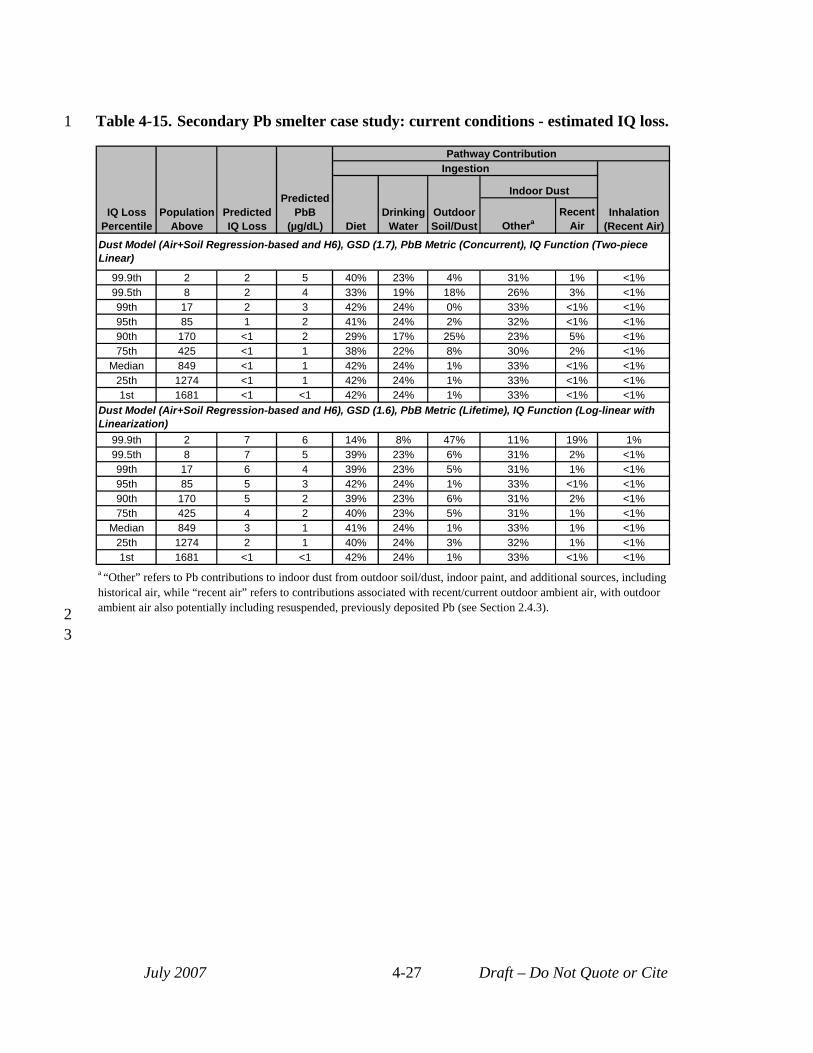
1 Table 4-15. Secondary Pb smelter case study: current conditions - estimated IQ loss.
IQ Loss Percentile
Population Above
Predicted IQ Loss
Predicted PbB
(µg/dL)
Pathway Contribution Ingestion
Inhalation (Recent Air) Diet
Drinking Water
Outdoor Soil/Dust
Indoor Dust
Othera Recent
Air
Dust Model (Air+Soil Regression-based and H6), GSD (1.7), PbB Metric (Concurrent), IQ Function (Two-piece Linear)
99.9th 2 2 5 40% 23% 4% 31% 1% <1% 99.5th 8 2 4 33% 19% 18% 26% 3% <1% 99th 17 2 3 42% 24% 0% 33% <1% <1% 95th 85 1 2 41% 24% 2% 32% <1% <1% 90th 170 <1 2 29% 17% 25% 23% 5% <1% 75th 425 <1 1 38% 22% 8% 30% 2% <1%
Median 849 <1 1 42% 24% 1% 33% <1% <1% 25th 1274 <1 1 42% 24% 1% 33% <1% <1% 1st 1681 <1 <1 42% 24% 1% 33% <1% <1%
Dust Model (Air+Soil Regression-based and H6), GSD (1.6), PbB Metric (Lifetime), IQ Function (Log-linear with Linearization)
99.9th 2 7 6 14% 8% 47% 11% 19% 1% 99.5th 8 7 5 39% 23% 6% 31% 2% <1% 99th 17 6 4 39% 23% 5% 31% 1% <1% 95th 85 5 3 42% 24% 1% 33% <1% <1% 90th 170 5 2 39% 23% 6% 31% 2% <1% 75th 425 4 2 40% 23% 5% 31% 1% <1%
Median 849 3 1 41% 24% 1% 33% 1% <1% 25th 1274 2 1 40% 24% 3% 32% 1% <1% 1st 1681 <1 <1 42% 24% 1% 33% <1% <1%
a “Other” refers to Pb contributions to indoor dust from outdoor soil/dust, indoor paint, and additional sources, including historical air, while “recent air” refers to contributions associated with recent/current outdoor ambient air, with outdoor ambient air also potentially including resuspended, previously deposited Pb (see Section 2.4.3). 2
3
July 2007 4-27 Draft – Do Not Quote or Cite
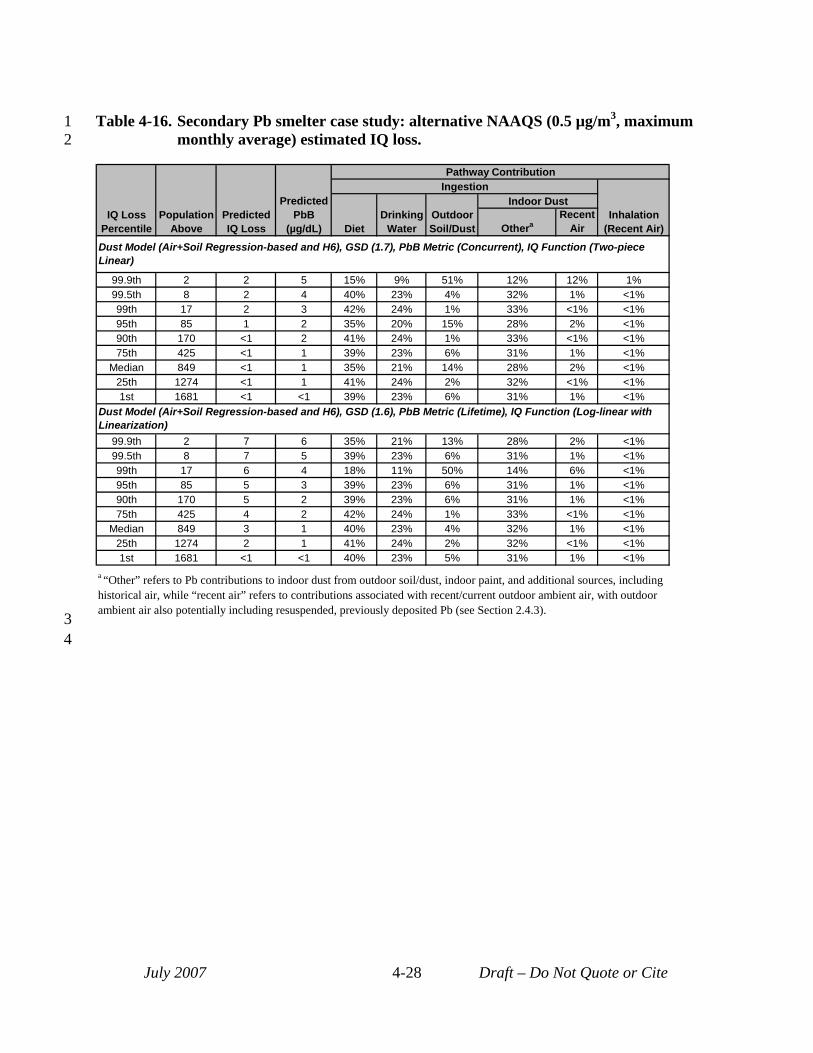
1 Table 4-16. Secondary Pb smelter case study: alternative NAAQS (0.5 µg/m3, maximum 2 monthly average) estimated IQ loss.
IQ Loss Percentile
Population Above
Predicted IQ Loss
Predicted PbB
(µg/dL)
Pathway Contribution Ingestion
Inhalation (Recent Air) Diet
Drinking Water
Outdoor Soil/Dust
Indoor Dust
Othera Recent
Air
Dust Model (Air+Soil Regression-based and H6), GSD (1.7), PbB Metric (Concurrent), IQ Function (Two-piece Linear)
99.9th 2 2 5 15% 9% 51% 12% 12% 1% 99.5th 8 2 4 40% 23% 4% 32% 1% <1% 99th 17 2 3 42% 24% 1% 33% <1% <1% 95th 85 1 2 35% 20% 15% 28% 2% <1% 90th 170 <1 2 41% 24% 1% 33% <1% <1% 75th 425 <1 1 39% 23% 6% 31% 1% <1%
Median 849 <1 1 35% 21% 14% 28% 2% <1% 25th 1274 <1 1 41% 24% 2% 32% <1% <1% 1st 1681 <1 <1 39% 23% 6% 31% 1% <1%
Dust Model (Air+Soil Regression-based and H6), GSD (1.6), PbB Metric (Lifetime), IQ Function (Log-linear with Linearization)
99.9th 2 7 6 35% 21% 13% 28% 2% <1% 99.5th 8 7 5 39% 23% 6% 31% 1% <1% 99th 17 6 4 18% 11% 50% 14% 6% <1% 95th 85 5 3 39% 23% 6% 31% 1% <1% 90th 170 5 2 39% 23% 6% 31% 1% <1% 75th 425 4 2 42% 24% 1% 33% <1% <1%
Median 849 3 1 40% 23% 4% 32% 1% <1% 25th 1274 2 1 41% 24% 2% 32% <1% <1% 1st 1681 <1 <1 40% 23% 5% 31% 1% <1%
a “Other” refers to Pb contributions to indoor dust from outdoor soil/dust, indoor paint, and additional sources, including historical air, while “recent air” refers to contributions associated with recent/current outdoor ambient air, with outdoor ambient air also potentially including resuspended, previously deposited Pb (see Section 2.4.3). 3
4
July 2007 4-28 Draft – Do Not Quote or Cite

1 Table 4-17. Secondary Pb smelter case study: alternative NAAQS (0.2 µg/m3, maximum 2 quarterly average) estimated IQ loss.
IQ Loss Percentile
Population Above
Predicted IQ Loss
Predicted PbB
(µg/dL)
Pathway Contribution Ingestion
Inhalation (Recent Air) Diet
Drinking Water
Outdoor Soil/Dust
Indoor Dust
Othera Recent
Air
Dust Model (Air+Soil Regression-based and H6), GSD (1.7), PbB Metric (Concurrent), IQ Function (Two-piece Linear)
99.9th 2 2 5 40% 23% 5% 32% <1% <1% 99.5th 8 2 4 40% 23% 5% 31% <1% <1% 99th 17 2 3 41% 24% 3% 32% <1% <1% 95th 85 1 2 42% 24% 1% 33% <1% <1% 90th 170 <1 2 42% 24% 1% 33% <1% <1% 75th 425 <1 1 41% 24% 3% 32% <1% <1%
Median 849 <1 1 39% 23% 7% 31% <1% <1% 25th 1274 <1 1 40% 23% 5% 32% <1% <1% 1st 1681 <1 <1 42% 24% 1% 33% <1% <1%
Dust Model (Air+Soil Regression-based and H6), GSD (1.6), PbB Metric (Lifetime), IQ Function (Log-linear with Linearization)
99.9th 2 7 6 33% 19% 21% 26% 1% <1% 99.5th 8 6 4 40% 24% 4% 32% <1% <1% 99th 17 6 4 37% 22% 11% 29% 1% <1% 95th 85 5 3 38% 22% 10% 30% 1% <1% 90th 170 5 2 40% 23% 5% 32% <1% <1% 75th 425 4 2 39% 23% 8% 31% 1% <1%
Median 849 3 1 41% 24% 3% 32% <1% <1% 25th 1274 2 1 40% 23% 5% 31% <1% <1% 1st 1681 <1 <1 41% 24% 2% 33% <1% <1%
a “Other” refers to Pb contributions to indoor dust from outdoor soil/dust, indoor paint, and additional sources, including historical air, while “recent air” refers to contributions associated with recent/current outdoor ambient air, with outdoor ambient air also potentially including resuspended, previously deposited Pb (see Section 2.4.3). 3
4
July 2007 4-29 Draft – Do Not Quote or Cite

1 Table 4-18. Secondary Pb smelter case study: alternative NAAQS (0.2 µg/m3, maximum 2 monthly average) estimated IQ loss.
IQ Loss Percentile
Population Above
Predicted IQ Loss
Predicted PbB
(µg/dL)
Pathway Contribution Ingestion
Inhalation (Recent Air) Diet
Drinking Water
Outdoor Soil/Dust
Indoor Dust
Othera Recent
Air
Dust Model (Air+Soil Regression-based and H6), GSD (1.7), PbB Metric (Concurrent), IQ Function (Two-piece Linear)
99.9th 2 2 5 19% 11% 52% 15% 2% <1% 99.5th 8 2 4 42% 24% 1% 33% <1% <1% 99th 17 2 3 32% 19% 23% 25% 2% <1% 95th 85 1 2 34% 20% 18% 27% 1% <1% 90th 170 <1 2 42% 24% 0% 33% <1% <1% 75th 425 <1 1 39% 23% 6% 31% <1% <1%
Median 849 <1 1 39% 23% 7% 31% <1% <1% 25th 1274 <1 1 39% 23% 7% 31% <1% <1% 1st 1681 <1 <1 36% 21% 13% 29% 1% <1%
Dust Model (Air+Soil Regression-based and H6), GSD (1.6), PbB Metric (Lifetime), IQ Function (Log-linear with Linearization)
99.9th 2 7 6 39% 23% 6% 31% <1% <1% 99.5th 8 6 4 38% 22% 10% 30% <1% <1% 99th 17 6 4 41% 24% 2% 33% <1% <1% 95th 85 5 3 41% 24% 2% 33% <1% <1% 90th 170 5 2 34% 20% 19% 27% 1% <1% 75th 425 4 2 39% 22% 8% 30% 1% <1%
Median 849 3 1 42% 24% 1% 33% <1% <1% 25th 1274 2 1 37% 22% 12% 29% 1% <1% 1st 1681 <1 <1 42% 24% 0% 33% <1% <1%
a “Other” refers to Pb contributions to indoor dust from outdoor soil/dust, indoor paint, and additional sources, including historical air, while “recent air” refers to contributions associated with recent/current outdoor ambient air, with outdoor ambient air also potentially including resuspended, previously deposited Pb (see Section 2.4.3). 3
4
July 2007 4-30 Draft – Do Not Quote or Cite
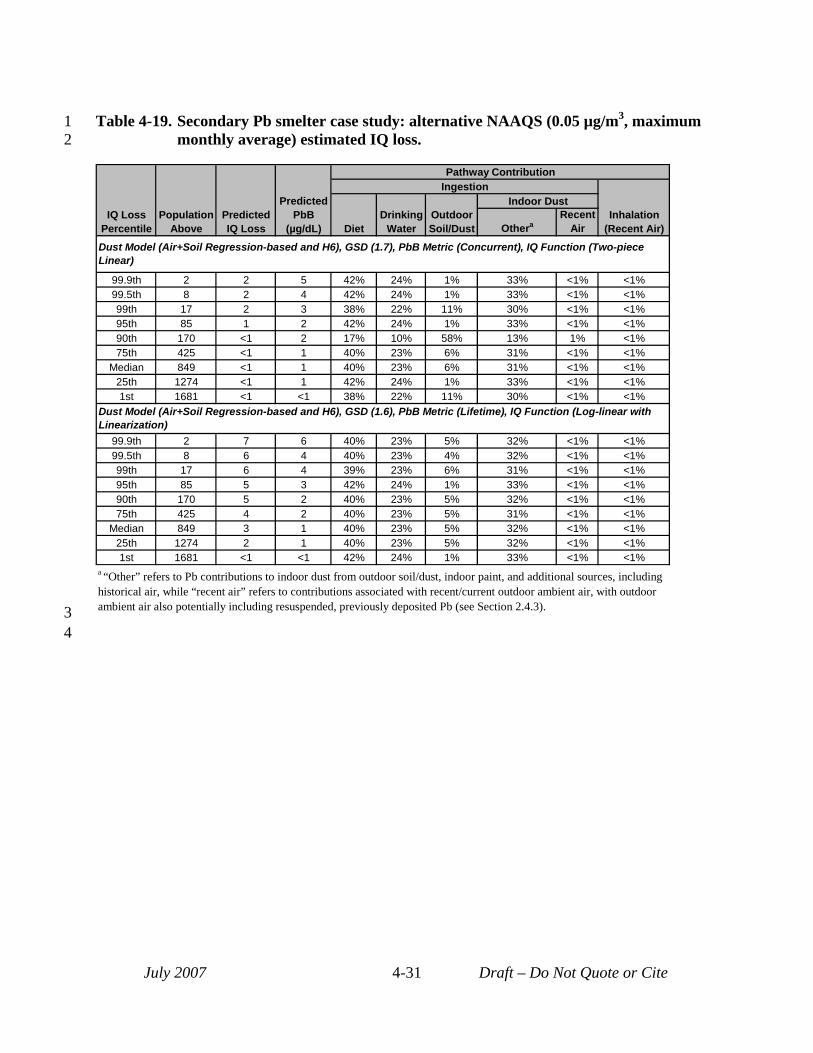
1 Table 4-19. Secondary Pb smelter case study: alternative NAAQS (0.05 µg/m3, maximum 2 monthly average) estimated IQ loss.
IQ Loss Percentile
Population Above
Predicted IQ Loss
Predicted PbB
(µg/dL)
Pathway Contribution Ingestion
Inhalation (Recent Air) Diet
Drinking Water
Outdoor Soil/Dust
Indoor Dust
Othera Recent
Air
Dust Model (Air+Soil Regression-based and H6), GSD (1.7), PbB Metric (Concurrent), IQ Function (Two-piece Linear)
99.9th 2 2 5 42% 24% 1% 33% <1% <1% 99.5th 8 2 4 42% 24% 1% 33% <1% <1% 99th 17 2 3 38% 22% 11% 30% <1% <1% 95th 85 1 2 42% 24% 1% 33% <1% <1% 90th 170 <1 2 17% 10% 58% 13% 1% <1% 75th 425 <1 1 40% 23% 6% 31% <1% <1%
Median 849 <1 1 40% 23% 6% 31% <1% <1% 25th 1274 <1 1 42% 24% 1% 33% <1% <1% 1st 1681 <1 <1 38% 22% 11% 30% <1% <1%
Dust Model (Air+Soil Regression-based and H6), GSD (1.6), PbB Metric (Lifetime), IQ Function (Log-linear with Linearization)
99.9th 2 7 6 40% 23% 5% 32% <1% <1% 99.5th 8 6 4 40% 23% 4% 32% <1% <1% 99th 17 6 4 39% 23% 6% 31% <1% <1% 95th 85 5 3 42% 24% 1% 33% <1% <1% 90th 170 5 2 40% 23% 5% 32% <1% <1% 75th 425 4 2 40% 23% 5% 31% <1% <1%
Median 849 3 1 40% 23% 5% 32% <1% <1% 25th 1274 2 1 40% 23% 5% 32% <1% <1% 1st 1681 <1 <1 42% 24% 1% 33% <1% <1%
a “Other” refers to Pb contributions to indoor dust from outdoor soil/dust, indoor paint, and additional sources, including historical air, while “recent air” refers to contributions associated with recent/current outdoor ambient air, with outdoor ambient air also potentially including resuspended, previously deposited Pb (see Section 2.4.3). 3
4
July 2007 4-31 Draft – Do Not Quote or Cite
1 2 3 4
5 6
7 8
9 10
11 12 13
14
15 16 17 18 19 20 21 22 23 24 25 26 27 28 29 30 31 32 33
4.3 UNCERTAINTY CHARACTERIZATION This section discusses uncertainty related to exposure and risk estimates generated for
this analysis. Several methods have been used to examine uncertainty in our modeling approach and its potential impact on exposure and risk estimates. These include the following:
• qualitative discussion of key sources of uncertainty and their potential impact on exposure and risk estimates (Section 4.3.1),
• sensitivity analysis, intended to characterize the potential impact of individual modeling elements on risk results (Section 4.3.2),
• evaluation of model performance, including comparison with empirical data (Section 4.3.3) and
• development of multiple sets of exposure and risk estimates for each assessment scenario that illustrate the combined impact of different models and input data on risk results and the associated uncertainty (Section 4.3.4).
Each of these elements of the uncertainty characterization is briefly summarized below.
4.3.1 Qualitative Discussion of Key Sources of Uncertainty Given the complexity of this assessment and the range of models and input data used in
completing it, there is a wide variety of sources of uncertainty potentially impacting the exposure and risk results generated (Appendix M, Table M-1). This section identifies those sources of uncertainty with the potential to have a significant impact on risk results (see Appendix M, Table M-1 bold text). When it was feasible with the available methods and data, these key sources of uncertainty have been quantitatively assessed for their potential impact on risk results either as part of the multiple modeling approaches implemented (see Section 4.3.4) or as part of the sensitivity analysis (see Section 4.3.2). Key sources of uncertainty include:
• Non-location specific aspect of the general urban case study: The use of a non-location specific approach for the general urban case study, including the assumption of uniform media concentrations across a single hypothetical study area, means that the risk results for this case study, while generally representative of an urban residential population exposed to these ambient air Pb levels, cannot be readily related to a specific urban population. Furthermore, an actual urban population would experience a range of ambient air Pb levels rather than a constant unvarying level through time and space. Thus, while a uniform ambient air Pb level is useful for the purposes of this assessment, is not representative of actual urban residential exposures. Any use for that purpose would carry with it high uncertainty and
July 2007 4-32 Draft – Do Not Quote or Cite
1 presumably an upward bias in risk, particularly for large areas, where specification of 2 the same air concentration across the study becomes less applicable.1
3 • Indoor dust Pb modeling for the general urban case study: The hybrid indoor dust 4 Pb model was developed for the general urban case study due to a lack of an existing 5 urban-focused dust model, and this hybrid model is subject to particular uncertainties. 6 Key among these uncertainties is failure to consider house-to-house variability in 7 factors related to the infiltration of ambient air Pb indoors and subsequent buildup of 8 Pb on indoor surfaces. This handicaps our ability to predict variation in indoor dust 9 Pb levels for non-typical residential conditions. In addition, a lack of comprehensive
10 data in the literature on rates and efficiency of indoor cleaning, introduces significant 11 uncertainty into the model. The method used to convert Pb loadings generated by the 12 hybrid model to Pb concentrations is also subject to significant uncertainty, partially 13 due to the age of the underlying dataset. Because the underlying dataset is an older 14 dataset (see Section 3.1.4.1), there is potential for bias toward greater representation 15 of housing with Pb-based paint. Additionally, the component of the hybrid model 16 that converts dust Pb loadings to concentrations (Appendix G, Section G.3.4) 17 introduces an uncertainty into the estimates of percent contribution from recent air 18 compared to other pathways. This is related to a non-linearity in this conversion and 19 results in the "other" indoor dust concentration predicted by this model varying with 20 air quality scenario, with that value increasing as the ambient air Pb level decreases 21 (see Appendix C). This means that, as the recent air contribution to exposure through 22 indoor dust ingestion decreases for the lower alternative NAAQS levels, the estimate 23 of contribution of "other" indoor dust actually increases. 24 • Indoor dust Pb modeling for the primary Pb smelter case study: The site-specific 25 regression-based indoor dust model developed for the remediation zone of the 26 primary Pb smelter case study is subject to significant uncertainty resulting from 27 several factors. This model predicts indoor dust Pb based only on ambient air 28 concentration and an intercept. Because the soil Pb levels in the remediation zone are 29 not representative of soil Pb levels that would be associated with the current air 30 concentrations, we were unable to derive a regression relating yard soil Pb to indoor 31 dust Pb even thought it is likely that a relationship exists. Similarly, the remediation 32 zone empirical dataset did not include roadway Pb dust measurements matched 33 spatially to indoor dust Pb measurements, which may be particularly useful for
1 Additionally, in applying the results of this case study to a specific urban area, one would need to identify the appropriate GSD, with a smaller GSD usually being more appropriate for a smaller study area.
July 2007 4-33 Draft – Do Not Quote or Cite
1 2 3 4 5 6 7 8 9
10 11 12 13 14 15 16 17 18 19 20 21 22 23 24 25 26 27 28 29 30 31 32 33 34 35 36
housing near the haul routes. This meant that the dataset could not be used to evaluate a potential association between Pb in roadway dust and indoor dust Pb, another potentially important relationship in predicting indoor dust Pb.
• Outdoor soil/dust concentrations in alternate NAAQS scenarios: Outdoor soil/dust Pb concentrations in all air quality scenarios have been set equal to the values for the current conditions scenarios. In areas where air concentrations have been greater in the past, however, implementation of a reduced NAAQS might be expected to yield reduced soil Pb levels over the long-term. As described in Section 2.3.3, however, there is potentially significant uncertainty associated with this specification, particularly with regard to implications for areas in which a Pb source may locate where one of comparable size had not been previously.
• Recontamination of residential yard soil near the primary Pb smelter: Although data collected in residential yards within ¾ mile of the primary Pb smelter indicate a trend of increasing surface soil Pb concentrations, soil Pb estimates in this area of the primary Pb smelter case study were not adjusted using this information. Therefore, these estimates likely were underestimates of soil Pb levels associated with the current ambient air Pb levels. Because the indoor dust Pb model used in this part of this case study did not rely on outdoor soil/dust concentrations this did not affect indoor dust Pb estimates, although as described in previous bullet the lack of soil data to consider in developing the indoor dust Pb model increased uncertainty in that model’s results. Additionally, the outdoor soil/dust ingestion pathway is a small contributor to blood Pb levels, which also reduced the impact of this factor on blood Pb estimates
• Inter-individual variability GSD: There is uncertainty associated with the GSD specified for each case study. In the case of the general urban case study, the use of a uniform ambient air Pb concentration across the hypothetical study area complicates selection of a GSD. This is because any urban area for which GSDs can be developed would be subject to spatial variation in ambient air Pb levels. To the extent that these ambient air Pb levels influence children’s blood Pb levels, this influence would be reflected in the associated GSD. In the case of the two point source case studies, the use of the spatial templates complicates selection of a GSD for a different reason. Because the spatial templates are intended to contribute variability in risk results related to spatial gradients in air-related Pb media concentrations, the GSDs used for these case studies need to reflect the remaining sources of variability in blood Pb levels (e.g., inter-individual variability in behavior and biokinetics related to Pb exposure as well as variability in non-air related Pb
July 2007 4-34 Draft – Do Not Quote or Cite
1 2 3 4 5 6 7 8 9
10 11 12 13 14 15 16
17 18 19 20 21 22 23 24 25 26 27 28 29 30 31 32 33 34 35
exposures). The extent to which the specified GSDs reflect the sources of variability at play in each of these case studies is unknown.
• Exposure pathway apportionment for higher percentile blood Pb level and IQ loss estimates: As discussed in Section 3.2.2, pathway apportionment of blood Pb levels for higher population percentiles is specified to be the same as that estimated using the central tendency estimate of blood Pb in an exposure zone. This introduces significant uncertainty into projections of pathway apportionment for higher population percentiles of blood Pb and IQ loss. In reality, pathway apportionment may shift as you consider higher exposure percentiles. For example, paint and/or drinking water exposures may increase in importance, with air-related contributions decreasing as an overall percentage of blood Pb levels and associated risk.
• Projection of IQ loss at lower exposure levels: Because available epidemiological data are limited in their description of the relationship of IQ decrement to blood Pb at lower blood Pb levels (< 5 µg/dL), there is significant uncertainty associated with projecting IQ loss at these blood Pb levels which are particularly relevant to the current population of children in the U.S.
4.3.2 Sensitivity Analysis Sensitivity analysis techniques were used to examine the uncertainty for individual
modeling elements and their impact on exposure and risk estimates. Specifically, we used a "one element at a time elasticity analysis" approach, in which the full risk model was run with one of the selected modeling elements adjusted to reflect an alternate input value or modeling choice. The results of that run with the modified modeling element was then compared to those for the "baseline risk" run to determine the magnitude of the impact on risk results of selections for that one modeling element.
The sensitivity analysis described in Appendix L focused on the general urban case study, reflecting the fact that this case study has potential relevance for a larger number of Pb-exposed children compared with the two point source case studies. Additionally, we recognized that exposure patterns for urban children can be highly variable compared with exposures near Pb smelters and the availability of data sets for specific urban areas that reflect current blood Pb levels is limited. The modeling elements examined in the sensitivity analysis included those inputs and modeling steps believed to have a significant potential for impacting exposure and risk results (e.g., oral uptake factor, inter-individual blood Pb variability GSD, biokinetic model, concentration-response function for IQ loss). The one element at a time sensitivity analysis indicates which of the modeling elements included in the sensitivity analysis has the greatest impact on risk results, which can be used to guide future efforts to refine the overall risk model.
July 2007 4-35 Draft – Do Not Quote or Cite
1 2 3 4 5 6 7 8 9
10 11 12 13 14 15 16 17 18 19 20 21 22 23 24 25 26 27 28 29 30 31 32 33 34 35
The results of the sensitivity analysis (Appendix L) can be considered both in terms of the impact of individual modeling element choices on (a) overall risk results and (b) recent air risk results, i.e., IQ loss estimates for inhalation plus ingestion of indoor dust Pb predicted to be associated with ambient outdoor air Pb levels, where ambient outdoor air potentially includes resuspended, previously deposited Pb (see Section 2.4.3). Given the relevance of the recent air exposure pathways to the NAAQS review, the results of the sensitivity analysis are summarized here in terms of their impact on recent air risk results, rather than total risk results. Results of the sensitivity analysis for total risk estimates, however, are similar (Appendix L).
Results of the sensitivity analysis showed the following modeling elements to have the greatest impact on recent air risk estimates for the general urban case study (i.e., >50% impact on the 99.5th percentile recent air risk estimates and an even greater impact, in terms of percent change, on median estimates). These elements are presented in order of decreasing magnitude of impact on risk estimates:
• IQ loss function: Use of the log-linear with linearization IQ loss model (the model producing the greatest IQ loss) resulted in 137% increase in recent air risk results over results for baseline which used the 2-piece linear model. These results suggest that characterization of the relationship between Pb exposure and IQ loss has the greatest impact on high-end risk results.
• Indoor dust Pb modeling: Use of a combination of high-end modeling parameters for the hybrid dust model results in a 136% increase in recent air risk estimates over results using the hybrid model with those input values used in the primary analysis. In addition, use of the air-only regression model in place of the hybrid model results in a 61% decrease in the recent air risk results. These results together suggest that predicting the relationship between outdoor ambient air Pb and indoor dust Pb is an important factor impacting risk results.
• Blood Pb modeling: Use of the Leggett model as compared to the IEUBK model, results in a 99% increase in recent air risk estimates. This indicates the importance of the blood Pb modeling step in the analysis. However, these results need to be considered in the context of the performance evaluation for blood Pb which suggested that the Leggett model may be significantly over-predicting blood Pb levels, thereby decreasing our confidence in considering it as an alternative to the IEUBK model.
• Monitor-based ratio of maximum quarterly to annual average Pb-TSP concentrations: A ratio of monitored maximum quarterly average to annual average air Pb concentrations is used in the general urban case study to translate maximum quarterly average air concentrations into the annual average values used in the risk
July 2007 4-36 Draft – Do Not Quote or Cite
1 2 3 4 5 6 7 8
9 10 11 12 13 14 15 16 17 18 19 20 21 22 23 24 25 26 27 28 29 30 31 32 33 34 35
assessment. Use of the 95th percentile of urban Pb-TSP monitor ratios as compared to the mean value, results in a 50% reduction in recent air risk estimates.
• GSD reflecting inter-individual variability in blood Pb levels: Use of the larger GSD (2.1) in place of the smaller value (1.7) resulted in a 50% increase in the recent air risk estimates.
Alternate selections for the other modeling elements included in the sensitivity analysis yielded changes to the 99.5th percentile risk results of less than 50% from baseline.
4.3.3 Performance Analyses Performance evaluation for the exposure assessment (Section 3.5) focused on evaluation
of estimates of Pb in ambient air, outdoor soil, and indoor dust (discussed in Section 3.5.1) and estimates of Pb in blood (covered in Section 3.5.2). Consideration of the results of performance evaluation can provide insights into potential sources of uncertainty in an analysis, by identifying those elements of the analysis that appear inconsistent with available empirical data. This can, in turn, point to underlying bias or other errors associated with that particular modeling step, reflecting either parameter or model uncertainty. This section identifies key findings of the performance analysis describing the nature of associated uncertainty, including results which either supported modeling elements or suggested increased uncertainty.
• Modeled ambient air Pb levels: The evaluation of the air model performance for the primary Pb smelter case study (Sect 3.5.1.1) indicated performance generally consistent with empirical data, increasing our confidence in air-related results generated for this case study. Evaluation of air dispersion model performance for the secondary Pb smelter suggested the potential for low bias in predictions of ambient air Pb concentrations.
• Estimates of outdoor soil/dust Pb concentration for secondary Pb smelter case study: The use of a combination of dispersion and soil mixing models to generate a spatial pattern of concentrations combined with a scaling factor based on a surrogate location contributes significant uncertainty to the soil Pb characterization for this case study. Specifically, while the approach used is unlikely to significantly underestimate soil Pb levels at this type of facility, the degree to which it is representative of conditions at this specific location is not known.
• Modeled indoor dust Pb concentrations: Evaluation of the hybrid indoor dust model used in the general urban case study suggested the potential for both under- and overestimation. The mechanistic ambient air-related portion of the model may underestimate that component of dust Pb, while the indoor dust loading-to-
July 2007 4-37 Draft – Do Not Quote or Cite
1 2 3 4 5 6 7 8 9
10 11 12 13 14 15 16 17 18 19 20 21 22 23 24 25 26 27 28 29 30 31 32 33 34 35 36
concentration conversion algorithm may contribute to overestimate of dust Pb. It is not know to what extent these two biases cancel out each other. Overall comparison of indoor dust Pb concentrations generated for the three case studies against available empirical data suggest that: (a) for the general urban case study, estimates fall within the range of measured values from a national-scale study, adding confidence to the estimates, (b) central tendency estimates for the primary Pb smelter also fall within the range for the national-scale dataset referenced above for the general urban case study and high-end estimates seem to fit with available data near smelters, and (c) comparison of estimates for the secondary Pb smelter against empirical data suggest that these estimates may be biased low.
• Evaluation of candidate blood Pb models: A number of performance evaluations were completed on the two candidate blood Pb models considered for this analysis (IEUBK and Leggett). The results of these performance evaluations, which included application of both models in replicating national-scale child blood Pb levels (NHANES IV results) and blood Pb levels for an urban child cohort, suggested that the Leggett model consistently over-predicted blood Pb levels by a factor of 3 to 6, while IEUBK estimates were usually within a factor of 2. These findings resulted in our selecting the IEUBK model as primary blood Pb model for this assessment, with the Leggett model being reserved for application in the sensitivity analysis. Note also that the empirical Lanphear Pb model was considered for use in the analysis but not selected because the child cohort to which it applies (16 month olds) does not match either of the blood Pb metrics used in the analysis (i.e., concurrent or lifetime average).
• Outdoor air Pb-to-blood Pb ratios: Three sets of outdoor air Pb-to-blood Pb ratios were derived. These related outdoor ambient air Pb to blood Pb resulting (1) inhalation pathway only, (2) all recent air pathways (inhalation plus ingestion of indoor dust Pb predicted to be associated with ambient air Pb levels, with ambient air potentially included resuspended, previously deposited Pb), and (3) all recent and past air pathways (see Section 2.4.3). All ratios were derived prior to application of the GSD reflecting inter-individual variability in blood Pb levels and therefore reflect central tendency blood Pb levels and not high-end population percentiles. The modeled ratios were compared to both empirical data and statistically derived ratios based on a pooled analysis (Section 3.5.2.2). With the exception of the primary Pb smelter case study recent air ratio using 95th percentile air concentration and the general urban case study recent air ratios for the hybrid dust model, the ratios for recent air contribution to concurrent blood Pb level (Table 3-24) generated for the
July 2007 4-38 Draft – Do Not Quote or Cite
1 2 3 4 5 6 7 8 9
10 11 12 13 14 15 16 17 18 19 20 21 22 23 24 25 26 27 28 29 30 31 32 33 34 35 36
three case studies were reasonable and supported by available empirical data. As described in Section 3.5.2.2, the exceptions relate to use in those case studies of the dust models predicting the greatest influence of air concentration on indoor dust Pb among the set of dust models used. These were the general urban case study hybrid dust model and the site-specific regression dust model used in the remediation zone for the primary Pb smelter case study. In both cases, the ratios based on these models were significantly higher than empirically derived ratios obtained from the literature. However, the literature indicated a potential for higher ratios for locations with either lower ambient air Pb levels or lower blood Pb levels, both conditions of which are present at the two case studies. Therefore, the higher modeled ratios obtained using the site-specific indoor dust models for the general urban and primary Pb smelter case studies do not necessarily point to potential high bias in predicting blood Pb levels for the study populations.
• Comparison of modeled blood Pb levels to nationally representative data: Our ability to compare modeled blood Pb levels to empirical data was handicapped by a lack of studies for populations of children directly comparable to those in the three case studies (see Section 3.5.2.3). Therefore, we focused most of our evaluation of modeled blood Pb levels on consideration of the national-level data obtained from NHANES IV. Note that while higher-end population percentiles for the three case studies might not be reflected in a national-level dataset, blood Pb levels associated with background exposures for all three case studies are similar to blood Pb levels in the national dataset. Thus, we considered a comparison of modeled blood Pb levels for the three case studies against a national-scale dataset for central tendency population percentiles appropriate. In this comparison, we included the highest and lowest of the multiple sets of blood Pb estimates for the general urban case study generated using the multiple modeling approaches employed used for this case study. These two blood Pb distributions bracketed the NHANES IV based distribution, which adds confidence to blood Pb modeling conducted for this case study. Results for the primary Pb smelter were similar to the NHANES IV distribution across population percentiles up to the 99th%, but then diverged with the case study percentiles exceeding those for the national-level dataset. This result is not surprising given the fact that exposure modeling for the primary Pb smelter did not fully consider variability in background Pb exposure (e.g., paint, diet, drinking water). The difference between the high-end population percentiles likely reflects primarily air-related exposures for the primary Pb smelter case study population and, had background exposures been fully considered, the degree of divergence between the
July 2007 4-39 Draft – Do Not Quote or Cite
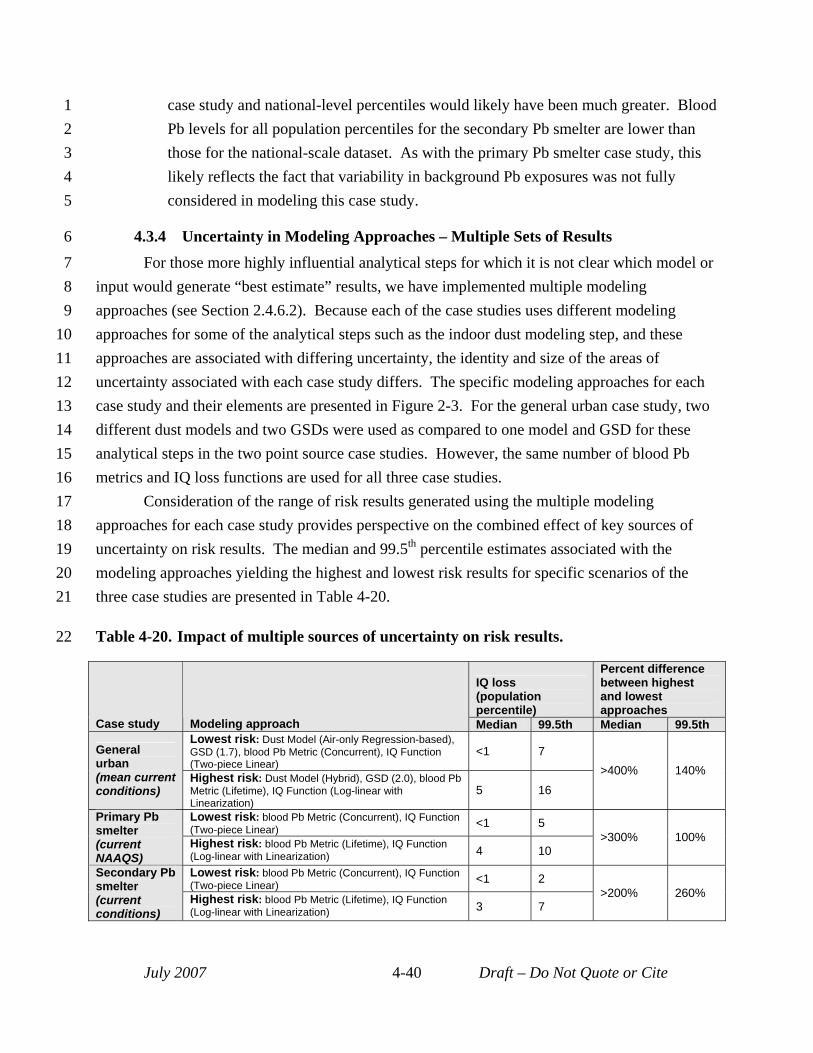
1 case study and national-level percentiles would likely have been much greater. Blood 2 Pb levels for all population percentiles for the secondary Pb smelter are lower than 3 those for the national-scale dataset. As with the primary Pb smelter case study, this 4 likely reflects the fact that variability in background Pb exposures was not fully 5 considered in modeling this case study.
6 4.3.4 Uncertainty in Modeling Approaches – Multiple Sets of Results 7 For those more highly influential analytical steps for which it is not clear which model or 8 input would generate “best estimate” results, we have implemented multiple modeling 9 approaches (see Section 2.4.6.2). Because each of the case studies uses different modeling
10 approaches for some of the analytical steps such as the indoor dust modeling step, and these 11 approaches are associated with differing uncertainty, the identity and size of the areas of 12 uncertainty associated with each case study differs. The specific modeling approaches for each 13 case study and their elements are presented in Figure 2-3. For the general urban case study, two 14 different dust models and two GSDs were used as compared to one model and GSD for these 15 analytical steps in the two point source case studies. However, the same number of blood Pb 16 metrics and IQ loss functions are used for all three case studies. 17 Consideration of the range of risk results generated using the multiple modeling 18 approaches for each case study provides perspective on the combined effect of key sources of 19 uncertainty on risk results. The median and 99.5th percentile estimates associated with the 20 modeling approaches yielding the highest and lowest risk results for specific scenarios of the 21 three case studies are presented in Table 4-20.
22 Table 4-20. Impact of multiple sources of uncertainty on risk results.
Case study Modeling approach
IQ loss (population percentile)
Percent difference between highest and lowest approaches
Median 99.5th Median 99.5th
General urban
Lowest risk: Dust Model (Air-only Regression-based), GSD (1.7), blood Pb Metric (Concurrent), IQ Function (Two-piece Linear)
<1 7 >400% 140% (mean current
conditions) Highest risk: Dust Model (Hybrid), GSD (2.0), blood Pb Metric (Lifetime), IQ Function (Log-linear with Linearization)
5 16
Primary Pb smelter
Lowest risk: blood Pb Metric (Concurrent), IQ Function (Two-piece Linear) <1 5
>300% 100% (current NAAQS)
Highest risk: blood Pb Metric (Lifetime), IQ Function (Log-linear with Linearization) 4 10
Secondary Pb smelter
Lowest risk: blood Pb Metric (Concurrent), IQ Function (Two-piece Linear) <1 2
>200% 260% (current conditions)
Highest risk: blood Pb Metric (Lifetime), IQ Function (Log-linear with Linearization) 3 7
July 2007 4-40 Draft – Do Not Quote or Cite
1 2 3 4 5 6 7 8 9
10 11 12 13 14
The lack of a consistent pattern regarding the magnitude of differences between the modeling approaches generating the lowest and highest risk results either across case studies, or across population percentiles (Table 4-20), is due to different influences of various factors specific to the modeling approaches for each case study. For example, the finding with regard to the 99.5th percentile results that the greatest difference across approaches occurs for the secondary Pb smelter case study (260%) reflects the influence of the lower absolute blood Pb levels estimated via both modeling approaches for that case study which are translated into IQ response using the relatively steeper portion of the concentration-response function, thus magnifying the difference. The finding for the 99.5th percentile results that there is a greater difference for the general urban case study than the primary Pb smelter case study is because of the larger range of GSDs applied in this case study (2.1 and 1.6).
In summary, results presented in Table 4-20 suggest that these key sources of uncertainty, when acting in concert, can produce an impact on overall risk results on the order of a factor of 2 to 3.
July 2007 4-41 Draft – Do Not Quote or Cite
1 2
3 4 5
6
7
8 9
10 11
REFERENCES
Henderson, R. (2007) Letter from Dr. Rogene Henderson, Chair, Clean Air Scientific Advisory Committee, to Administrator Stephen L. Johnson. Re: Clean Air Scientific Advisory Committee’s (CASAC) Review of the 1st Draft Lead Staff Paper and Draft Lead Exposure and Risk Assessments. March 27, 2007.
Hornung, R. (2007a) Email message to David Svendsgaard, U.S. EPA. April 24, 2007.
Hornung R. (2007b) Email message to Zachary Pekar, U.S. EPA, May 1, 2007.
Lanphear, B.P., Hornung, R., Khoury, J., Yolton, K., Baghurst, P., Bellinger, D.C., Canfield, R.L., Dietrich, K.N., Bornschein, R., Greene, T., Rothenberg, S.J., Needleman, H.L., Schnaas, L., Wasserman, G., Graziano, J., and Robe, R. (2005) Low-level environmental Pb exposure and children's intellectual function: An international pooled analysis. Environmental Health Perspectives. 113(7):894-899.
July 2007 4-42 Draft – Do Not Quote or Cite
United States
Office of A
ir Quality Planning and Standards
Publication No. EPA
-452/D-07-001a
Environmental Protection
Health and Environm
ental Impacts D
ivision July 2007
Agency
Research Triangle Park, N
C