le sof implemen implementing lean and agile tti software ...835490/fulltext01.pdf · overview of...
TRANSCRIPT
ISSN 1653-2090
ISBN 978-91-7295-180-8
Background: The software market is becoming more dynamic which can be seen in frequent-ly changing customer needs. Hence, software companies need to be able to quickly respond to these changes. For software companies this means that they have to become agile with the objective of developing features with very short lead-time and of high quality. A consequence of this challenge is the appearance of agile and lean software development. Practices and principles of agile software development aim at increasing flexibility with regard to changing requirements. Lean software development aims at systemati-cally identifying waste to focus all resources on value adding activities.
Objective: The objective of the thesis is to evalua-te the usefulness of agile practices in a large-scale industrial setting. In particular, with regard to agi-le the goal is to understand the effect of migra-ting from a plan-driven to an agile development approach. A positive effect would underline the usefulness of agile practices. With regard to lean software development the goal is to propose no-vel solutions inspired by lean manufacturing and product development, and to evaluate their use-fulness in further improving agile development.
Method: The primary research method used throughout the thesis is case study. As secon-dary methods for data collection a variety of approaches have been used, such as semi-struc-tured interviews, workshops, study of process documentation, and use of quantitative data.
Results: The agile situation was investigatedthrough a series of case studies. The baseline situation (plan-driven development) was eva-luated and the effect of the introduction of agile practices was captured, followed by an in-depth analysis of the new situation. Finally, a novel ap-proach, Software Process Improvement through the Lean Measurement (SPI-LEAM) method, was introduced providing a comprehensive measu-rement approach supporting the company to manage their work in process and capacity. SPI-LEAM focuses on the overall process integrating different dimensions (requirements, maintenance, testing, etc.). When undesired behavior is obser-ved a drill-down analysis for the individual dimen-sions should be possible. Therefore, we provided solutions for the main product development flow and for software maintenance. The lean solutions were evaluated through case studies.
Conclusion: With regard to agile we found that the migration from plan-driven to agile develop-ment is beneficial. Due to the scaling of agile new challenges arise with the introduction. The lean practices introduced in this thesis were percei-ved as useful by the practitioners. The practitio-ners identified concrete decisions in which the lean solutions could support them. In addition, the lean solutions allowed identifying concrete improvement proposals to achieve a lean soft-ware process.
ABSTRACT
2010:04
Blekinge Institute of TechnologyDoctoral Dissertation Series No. 2010:04
School of Computing
ImplemenTIng leAn And AgIle SofTwARe developmenT In InduSTRy
Kai Petersen
Imp
le
me
nT
Ing
le
An
An
d
Ag
Ile
So
fT
wA
Re
de
ve
lo
pm
en
T In
Ind
uS
TRy
Kai Petersen
2010:04
Implementing Lean and Agile Software Development in Industry
Kai Petersen

Implementing Lean and Agile Software Development in Industry
Kai Petersen
Blekinge Institute of Technology Doctoral Dissertation SeriesNo 2010:04
School of ComputingBlekinge Institute of Technology
SWEDEN

© 2010 Kai PetersenSchool of ComputingPublisher: Blekinge Institute of TechnologyPrinted by Printfabriken, Karlskrona, Sweden 2010ISBN 978-91-7295-180-8Blekinge Institute of Technology Doctoral Dissertation SeriesISSN 1653-2090 urn:nbn:se:bth-00465
Q: What are the most exciting, promising software engineering ideas ortechniques on the horizon?
A: I don’t think that the most promising ideas are on the horizon. Theyare already here and have been for years, but are not being used properly.
–David L. Parnas
v

vi
AbstractBackground: The software market is becoming more dynamic which can be seen infrequently changing customer needs. Hence, software companies need to be able toquickly respond to these changes. For software companies this means that they have tobecome agile with the objective of developing features with very short lead-time andof high quality. A consequence of this challenge is the appearance of agile and leansoftware development. Practices and principles of agile software development aim atincreasing flexibility with regard to changing requirements. Lean software develop-ment aims at systematically identifying waste to focus all resources on value addingactivities.
Objective: The objective of the thesis is to evaluate the usefulness of agile practicesin a large-scale industrial setting. In particular, with regard to agile the goal is to un-derstand the effect of migrating from a plan-driven to an agile development approach.A positive effect would underline the usefulness of agile practices. With regard to leansoftware development the goal is to propose novel solutions inspired by lean manufac-turing and product development, and to evaluate their usefulness in further improvingagile development.
Method: The primary research method used throughout the thesis is case study.As secondary methods for data collection a variety of approaches have been used, suchas semi-structured interviews, workshops, study of process documentation, and use ofquantitative data.
Results: The agile situation was investigated through a series of case studies. Thebaseline situation (plan-driven development) was evaluated and the effect of the in-troduction of agile practices was captured, followed by an in-depth analysis of thenew situation. Finally, a novel approach, Software Process Improvement through theLean Measurement (SPI-LEAM) method, was introduced providing a comprehensivemeasurement approach supporting the company to manage their work in process andcapacity. SPI-LEAM focuses on the overall process integrating different dimensions(requirements, maintenance, testing, etc.). When undesired behavior is observed adrill-down analysis for the individual dimensions should be possible. Therefore, weprovided solutions for the main product development flow and for software mainte-nance. The lean solutions were evaluated through case studies.
Conclusion: With regard to agile we found that the migration from plan-drivento agile development is beneficial. Due to the scaling of agile new challenges arisewith the introduction. The lean practices introduced in this thesis were perceived asuseful by the practitioners. The practitioners identified concrete decisions in which thelean solutions could support them. In addition, the lean solutions allowed identifyingconcrete improvement proposals to achieve a lean software process.
vii

viii
AcknowledgementsFirst and foremost, I would like to thank my supervisor and collaborator ProfessorClaes Wohlin for his support and feedback on my work, for the fruitful collaborationon papers, and for always responding to my questions at any time of day or night.
I would also like to thank all colleagues at Ericsson AB for participating in mystudies. These include participants in interviews, workshops, and in the TiQ analysisteam. All of you have provided valuable input and feedback to my work despite yourbusy schedules, for which I am thankful. In particular, I also would like to expressmy gratitude to Eva Nilsson at Ericsson for her strong support and thus for making theimplementations of the solutions presented in this thesis possible, and for providingimportant feedback. Thanks also go to PerOlof Bengtsson for his continuous supportand commitment throughout my studies.
The support from my friends and colleagues from the SERL and DISL researchgroups is also highly appreciated. In particular, I would like to thank Dejan Baca andShahid Mujtaba for their collaboration on papers, and for the good times after work.
Last but not least, I would like to express my sincere gratitude to my mother Fraukefor always supporting me in what I wanted to achieve against all obstacles, and to mybrother Stephan for always being there.
This work was funded jointly by Ericsson AB and the Knowledge Foundation in Swe-den under a research grant for the project “Blekinge - Engineering Software Qualities(BESQ)” (http://www.bth.se/besq).
ix

x
Overview of PapersPapers included in this thesis.
Chapter 2. Kai Petersen.’Is Lean Agile and Agile Lean? A Comparison Between Two Development Paradigms’,To be published in: Modern Software Engineering Concepts and Practices: AdvancedApproaches; Ali Dogru and Veli Bicer (Eds.), IGI Global, 2010
Chapter 3. Kai Petersen, Claes Wohlin, and Dejan Baca.’The Waterfall Model in Large-Scale Development’, Proceedings of the 10th Interna-tional Conference on Product Focused Software Development and Process Improve-ment (PROFES 2009), Springer, Oulu, Finland, pp. 386-400, 2009.
Chapter 4. Kai Petersen and Claes Wohlin.’The Effect of Moving from a Plan-Driven to an Incremental and Agile DevelopmentApproach: An Industrial Case Study’, Submitted to a journal, 2009.
Chapter 5. Kai Petersen and Claes Wohlin.’A Comparison of Issues and Advantages in Agile and Incremental Development Be-tween State of the Art and Industrial Case’. Journal of Systems and Software, 82(9),pp. 1479-1490, 2009.
Chapter 6. Kai Petersen.’An Empirical Study of Lead-Times in Incremental and Agile Development’, To ap-pear in: Proceedings of the International Conference on Software Process (ICSP2010), 2010.
Chapter 7. Kai Petersen and Claes Wohlin.’Software Process Improvement through the Lean Measurement (SPI-LEAM) Method’.Journal of Systems and Software, in print, 2010.
Chapter 8. Kai Petersen and Claes Wohlin.’Measuring the Flow of Lean Software Development’, Software: Practice and Experi-ence, in print, 2010.
Chapter 9. Kai Petersen.’Lean Software Maintenance’, submitted to a conference, 2010.
xi
Papers that are related to but not included in this thesis.
Paper 1. Kai Petersen.’A Systematic Review of Software Productivity Measurement and Prediction’, submit-ted to a journal, 2010.
Paper 2. Dejan Baca and Kai Petersen.’Prioritizing Countermeasures through the Countermeasure Method for Software Secu-rity (CM-Sec)’, To appear in: Proceedings of the International Conference on ProductFocused Software Development and Process Improvement (PROFES 2010), 2010.
Paper 3. Shahid Mujtaba, Kai Petersen, and Robert Feldt.’A Comparative Study Between Two Industrial Approaches for Realizing SoftwareProduct Customizations’, submitted to a conference, 2010.
Paper 4. Dejan Baca, Bengt Carlsson, and Kai Petersen.’Static analysis as a security touch point: an industrial case study’, submitted to a jour-nal, 2010.
Paper 5. Shahid Mujtaba, Robert Feldt, and Kai Petersen.’Waste and Lead Time Reduction in a Software Product Customization Process withValue Stream Maps’, To appear in: Proceedings of the Australian Software Engineer-ing Conference (ASWEC 2010), IEEE, Auckland, New Zealand, 2010.
Paper 6. Kai Petersen and Claes Wohlin.’Context in Industrial Software Engineering Research’, Proceedings of the 3rd Interna-tional Symposium on Empirical Software Engineering and Measurement (ESEM 2009),IEEE, Florida, USA, pp. 401-404, 2009.
Paper 7. Dejan Baca, Kai Petersen, Bengt Carlsson, and Lars Lundberg.’Static Code Analysis to Detect Software Security Vulnerabilities: Does ExperienceMatter?’, Proceedings of the 3rd International Workshop on Secure Software Engi-neering (SecSE 2009), IEEE, Fukuoka, Japan, pp. 804-810, 2009.
Paper 8. Joachim Bayer, Michael Eisenbarth, Theresa Lehner, and Kai Petersen.’Service Engineering Methodology’, In: Semantic Service Provisioning, Eds. DominikKuropka, Peter Troger, Steffen Staab , Springer, April 2008.
xii
Paper 9. Kai Petersen and Claes Wohlin.’Issues and Advantages of Using Agile and Incremental Practices: Industrial CaseStudy vs. State of the Art’, Proceedings of the 8th Software Engineering Researchand Practice Conference in Sweden (SERPS 2008), Karlskrona, Sweden, 2008. Chap-ter 5 is an extension of this paper.
Paper 10. Kai Petersen, Robert Feldt, Shahid Mujtaba, and Michael Mattsson.’Systematic Mapping Studies in Software Engineering’, Proceedings of the 12th Inter-national Conference on Empirical Assessment and Evaluation in Software Engineering(EASE 2008), British Computer Society, Bari, Italy, pp. 71-80, 2008.
Paper 11. Kai Petersen, Kari Ronkko, and Claes Wohlin.’The Impact of Time Controlled Reading on Software Inspection Effectiveness and Ef-ficiency: A Controlled Experiment’, Proceedings of the 2nd International Symposiumon Empirical Software Engineering and Measurement (ESEM 2008), ACM, Kaiser-slautern, Germany, pp. 139-148, 2008.
Paper 12. Kai Petersen, Johannes Maria Zaha, and Andreas Metzger.’Variability-Driven Selection of Services for Service Compositions’, Proceedings ofthe ICSOC Workshops 2007, Springer, Vienna, Austria, pp. 388-400, 2007.
xiii

xiv
Table of Contents
1 Introduction 11.1 Preamble . . . . . . . . . . . . . . . . . . . . . . . . . . . . . . . . 11.2 Background . . . . . . . . . . . . . . . . . . . . . . . . . . . . . . . 3
1.2.1 Plan-Driven Software Development . . . . . . . . . . . . . . 31.2.2 Agile Software Development . . . . . . . . . . . . . . . . . . 51.2.3 Lean Software Development . . . . . . . . . . . . . . . . . . 6
1.3 Research Gaps and Contributions . . . . . . . . . . . . . . . . . . . . 71.4 Research Questions . . . . . . . . . . . . . . . . . . . . . . . . . . . 121.5 Research Method . . . . . . . . . . . . . . . . . . . . . . . . . . . . 14
1.5.1 Method Selection . . . . . . . . . . . . . . . . . . . . . . . . 141.5.2 Case and Units of Analysis . . . . . . . . . . . . . . . . . . . 181.5.3 Data Collection and Analysis . . . . . . . . . . . . . . . . . . 191.5.4 Validity Threats . . . . . . . . . . . . . . . . . . . . . . . . . 21
1.6 Results . . . . . . . . . . . . . . . . . . . . . . . . . . . . . . . . . . 231.7 Synthesis . . . . . . . . . . . . . . . . . . . . . . . . . . . . . . . . 291.8 Conclusions . . . . . . . . . . . . . . . . . . . . . . . . . . . . . . . 311.9 References . . . . . . . . . . . . . . . . . . . . . . . . . . . . . . . . 32
2 Is Lean Agile and Agile Lean? A Comparison between Two Software De-velopment Paradigms 372.1 Introduction . . . . . . . . . . . . . . . . . . . . . . . . . . . . . . . 372.2 Background . . . . . . . . . . . . . . . . . . . . . . . . . . . . . . . 392.3 Comparison . . . . . . . . . . . . . . . . . . . . . . . . . . . . . . . 40
2.3.1 Goals . . . . . . . . . . . . . . . . . . . . . . . . . . . . . . 412.3.2 Principles . . . . . . . . . . . . . . . . . . . . . . . . . . . . 432.3.3 Practices . . . . . . . . . . . . . . . . . . . . . . . . . . . . 532.3.4 Processes . . . . . . . . . . . . . . . . . . . . . . . . . . . . 68
xv
Table of Contents
2.4 Discussion . . . . . . . . . . . . . . . . . . . . . . . . . . . . . . . . 692.4.1 Practical Implications . . . . . . . . . . . . . . . . . . . . . . 692.4.2 Research Implications . . . . . . . . . . . . . . . . . . . . . 69
2.5 Conclusion . . . . . . . . . . . . . . . . . . . . . . . . . . . . . . . 702.6 References . . . . . . . . . . . . . . . . . . . . . . . . . . . . . . . . 71
3 The Waterfall Model in Large-Scale Development 753.1 Introduction . . . . . . . . . . . . . . . . . . . . . . . . . . . . . . . 753.2 Related Work . . . . . . . . . . . . . . . . . . . . . . . . . . . . . . 763.3 The Waterfall Model at the Company . . . . . . . . . . . . . . . . . . 783.4 Case Study Design . . . . . . . . . . . . . . . . . . . . . . . . . . . 79
3.4.1 Research Questions . . . . . . . . . . . . . . . . . . . . . . . 803.4.2 Case Selection and Units of Analysis . . . . . . . . . . . . . 803.4.3 Data Collection Procedures . . . . . . . . . . . . . . . . . . . 803.4.4 Data Analysis Approach . . . . . . . . . . . . . . . . . . . . 833.4.5 Threats to Validity . . . . . . . . . . . . . . . . . . . . . . . 84
3.5 Qualitative Data Analysis . . . . . . . . . . . . . . . . . . . . . . . . 853.5.1 A Issues . . . . . . . . . . . . . . . . . . . . . . . . . . . . . 863.5.2 B Issues . . . . . . . . . . . . . . . . . . . . . . . . . . . . . 873.5.3 C Issues . . . . . . . . . . . . . . . . . . . . . . . . . . . . . 873.5.4 D Issues . . . . . . . . . . . . . . . . . . . . . . . . . . . . . 88
3.6 Quantitative Data Analysis . . . . . . . . . . . . . . . . . . . . . . . 893.7 Comparative Analysis of Case Study and SotA . . . . . . . . . . . . 893.8 Conclusion . . . . . . . . . . . . . . . . . . . . . . . . . . . . . . . 913.9 References . . . . . . . . . . . . . . . . . . . . . . . . . . . . . . . . 91
4 The Effect of Moving from a Plan-Driven to an Incremental and Agile Soft-ware Development Approach: An Industrial Case Study 934.1 Introduction . . . . . . . . . . . . . . . . . . . . . . . . . . . . . . . 934.2 Related Work . . . . . . . . . . . . . . . . . . . . . . . . . . . . . . 95
4.2.1 Plan-Driven Development . . . . . . . . . . . . . . . . . . . 954.2.2 Incremental and Agile Development . . . . . . . . . . . . . . 974.2.3 Empirical Studies on Comparison of Models . . . . . . . . . 98
4.3 The Plan-Driven and Agile Models at the Company . . . . . . . . . . 984.3.1 Plan-Driven Approach . . . . . . . . . . . . . . . . . . . . . 984.3.2 Agile and Incremental Model . . . . . . . . . . . . . . . . . 994.3.3 Comparison with General Process Models . . . . . . . . . . . 102
4.4 Case Study Design . . . . . . . . . . . . . . . . . . . . . . . . . . . 1044.4.1 Study Context . . . . . . . . . . . . . . . . . . . . . . . . . . 104
xvi
Table of Contents
4.4.2 Research Questions and Propositions . . . . . . . . . . . . . 1044.4.3 Case Selection and Units of Analysis . . . . . . . . . . . . . 1064.4.4 Data Collection Procedures . . . . . . . . . . . . . . . . . . . 1074.4.5 Data Analysis . . . . . . . . . . . . . . . . . . . . . . . . . . 1124.4.6 Threats to Validity . . . . . . . . . . . . . . . . . . . . . . . 115
4.5 Qualitative Data Analysis . . . . . . . . . . . . . . . . . . . . . . . . 1184.5.1 General Issues . . . . . . . . . . . . . . . . . . . . . . . . . 1194.5.2 Very Common Issues . . . . . . . . . . . . . . . . . . . . . . 1214.5.3 Common Issues . . . . . . . . . . . . . . . . . . . . . . . . . 1224.5.4 Comparison of Issues . . . . . . . . . . . . . . . . . . . . . . 1244.5.5 Commonly Perceived Improvements . . . . . . . . . . . . . . 124
4.6 Quantitative Data Analysis . . . . . . . . . . . . . . . . . . . . . . . 1264.6.1 Requirements Waste . . . . . . . . . . . . . . . . . . . . . . 1264.6.2 Software Quality . . . . . . . . . . . . . . . . . . . . . . . . 127
4.7 Discussion . . . . . . . . . . . . . . . . . . . . . . . . . . . . . . . . 1294.7.1 Improvement Areas . . . . . . . . . . . . . . . . . . . . . . . 1294.7.2 Open Issues . . . . . . . . . . . . . . . . . . . . . . . . . . . 1304.7.3 Implications . . . . . . . . . . . . . . . . . . . . . . . . . . 131
4.8 Conclusions and Future Work . . . . . . . . . . . . . . . . . . . . . . 1324.9 References . . . . . . . . . . . . . . . . . . . . . . . . . . . . . . . . 133
5 A Comparison of Issues and Advantages in Agile and Incremental Devel-opment between State of the Art and an Industrial Case 1395.1 Introduction . . . . . . . . . . . . . . . . . . . . . . . . . . . . . . . 1395.2 State of the Art . . . . . . . . . . . . . . . . . . . . . . . . . . . . . 1415.3 Incremental and Agile Process Model . . . . . . . . . . . . . . . . . 142
5.3.1 Model Description . . . . . . . . . . . . . . . . . . . . . . . 1445.3.2 Mapping . . . . . . . . . . . . . . . . . . . . . . . . . . . . 147
5.4 Research Method . . . . . . . . . . . . . . . . . . . . . . . . . . . . 1485.4.1 Case Study Context . . . . . . . . . . . . . . . . . . . . . . . 1485.4.2 Research Questions and Propositions . . . . . . . . . . . . . 1495.4.3 Case Selection and Units of Analysis . . . . . . . . . . . . . 1495.4.4 Data Collection Procedures . . . . . . . . . . . . . . . . . . . 1495.4.5 Data Analysis Approach . . . . . . . . . . . . . . . . . . . . 1525.4.6 Threats to Validity . . . . . . . . . . . . . . . . . . . . . . . 154
5.5 Results . . . . . . . . . . . . . . . . . . . . . . . . . . . . . . . . . . 1555.5.1 Advantages . . . . . . . . . . . . . . . . . . . . . . . . . . . 1565.5.2 Issues . . . . . . . . . . . . . . . . . . . . . . . . . . . . . . 158
5.6 Discussion . . . . . . . . . . . . . . . . . . . . . . . . . . . . . . . . 159
xvii
Table of Contents
5.6.1 Practices Lead to Advantages and Issues . . . . . . . . . . . . 1605.6.2 Similarities and Differences between SotA and Industrial Case
Study . . . . . . . . . . . . . . . . . . . . . . . . . . . . . . 1625.6.3 A Research Framework for Empirical Studies on Agile Devel-
opment . . . . . . . . . . . . . . . . . . . . . . . . . . . . . 1625.7 Conclusions and Future Work . . . . . . . . . . . . . . . . . . . . . . 1635.8 References . . . . . . . . . . . . . . . . . . . . . . . . . . . . . . . . 164
6 An Empirical Study of Lead-Times in Incremental and Agile Software De-velopment 1676.1 Introduction . . . . . . . . . . . . . . . . . . . . . . . . . . . . . . . 1676.2 Related Work . . . . . . . . . . . . . . . . . . . . . . . . . . . . . . 1696.3 Research Method . . . . . . . . . . . . . . . . . . . . . . . . . . . . 169
6.3.1 Research Context . . . . . . . . . . . . . . . . . . . . . . . . 1706.3.2 Hypotheses . . . . . . . . . . . . . . . . . . . . . . . . . . . 1716.3.3 Data Collection . . . . . . . . . . . . . . . . . . . . . . . . . 1726.3.4 Data Analysis . . . . . . . . . . . . . . . . . . . . . . . . . . 1736.3.5 Threats to Validity . . . . . . . . . . . . . . . . . . . . . . . 173
6.4 Results . . . . . . . . . . . . . . . . . . . . . . . . . . . . . . . . . . 1746.4.1 Time Distribution Phases . . . . . . . . . . . . . . . . . . . . 1746.4.2 Multi-System vs. Single-System Requirements . . . . . . . . 1746.4.3 Difference Between Small / Medium / Large . . . . . . . . . 176
6.5 Discussion . . . . . . . . . . . . . . . . . . . . . . . . . . . . . . . . 1786.5.1 Practical Implications . . . . . . . . . . . . . . . . . . . . . . 1786.5.2 Research Implications . . . . . . . . . . . . . . . . . . . . . 179
6.6 Conclusion . . . . . . . . . . . . . . . . . . . . . . . . . . . . . . . 1796.7 References . . . . . . . . . . . . . . . . . . . . . . . . . . . . . . . . 180
7 Software Process Improvement through the Lean Measurement (SPI-LEAM)Method 1837.1 Introduction . . . . . . . . . . . . . . . . . . . . . . . . . . . . . . . 1837.2 Related Work . . . . . . . . . . . . . . . . . . . . . . . . . . . . . . 185
7.2.1 Lean in Software Engineering . . . . . . . . . . . . . . . . . 1857.2.2 Lean Manufacturing and Lean Product Development . . . . . 186
7.3 SPI-LEAM . . . . . . . . . . . . . . . . . . . . . . . . . . . . . . . 1887.3.1 Lean Measurement Method at a Glance . . . . . . . . . . . . 1917.3.2 Measure and Analyze Inventory Levels . . . . . . . . . . . . 1937.3.3 Analysis and Flow Between States . . . . . . . . . . . . . . . 199
7.4 Evaluation . . . . . . . . . . . . . . . . . . . . . . . . . . . . . . . . 203
xviii
Table of Contents
7.4.1 Static Validation and Implementation . . . . . . . . . . . . . 2037.4.2 Preliminary Data . . . . . . . . . . . . . . . . . . . . . . . . 2067.4.3 Improvements Towards Lean . . . . . . . . . . . . . . . . . . 208
7.5 Discussion . . . . . . . . . . . . . . . . . . . . . . . . . . . . . . . . 2097.5.1 Comparison with Related Work . . . . . . . . . . . . . . . . 2097.5.2 Practical Implications . . . . . . . . . . . . . . . . . . . . . . 2097.5.3 Research Implications . . . . . . . . . . . . . . . . . . . . . 210
7.6 Conclusion . . . . . . . . . . . . . . . . . . . . . . . . . . . . . . . 2117.7 References . . . . . . . . . . . . . . . . . . . . . . . . . . . . . . . . 212
8 Measuring the Flow of Lean Software Development 2158.1 Introduction . . . . . . . . . . . . . . . . . . . . . . . . . . . . . . . 2158.2 Related Work . . . . . . . . . . . . . . . . . . . . . . . . . . . . . . 217
8.2.1 Lean in Software Engineering . . . . . . . . . . . . . . . . . 2178.2.2 Lean Performance Measures in Manufacturing . . . . . . . . 2198.2.3 Lean Performance Measures in Software Engineering . . . . . 219
8.3 Visualization and Measures . . . . . . . . . . . . . . . . . . . . . . . 2208.3.1 Visualization with Cumulative Flow Diagrams . . . . . . . . 2208.3.2 Measures in Flow Diagrams . . . . . . . . . . . . . . . . . . 222
8.4 Research Method . . . . . . . . . . . . . . . . . . . . . . . . . . . . 2278.4.1 Research Context . . . . . . . . . . . . . . . . . . . . . . . . 2278.4.2 Case Description . . . . . . . . . . . . . . . . . . . . . . . . 2288.4.3 Units of Analysis . . . . . . . . . . . . . . . . . . . . . . . . 2298.4.4 Research Questions . . . . . . . . . . . . . . . . . . . . . . . 2308.4.5 Data Collection . . . . . . . . . . . . . . . . . . . . . . . . . 2318.4.6 Data Analysis . . . . . . . . . . . . . . . . . . . . . . . . . . 2338.4.7 Threats to Validity . . . . . . . . . . . . . . . . . . . . . . . 233
8.5 Results . . . . . . . . . . . . . . . . . . . . . . . . . . . . . . . . . . 2358.5.1 Application of Visualization and Measures . . . . . . . . . . 2358.5.2 Industry Evaluation of Visualization and Measures . . . . . . 237
8.6 Discussion . . . . . . . . . . . . . . . . . . . . . . . . . . . . . . . . 2428.6.1 Practical Implications and Improvements to the Measures . . 2428.6.2 Research Implications . . . . . . . . . . . . . . . . . . . . . 2448.6.3 Comparison with State of the Art . . . . . . . . . . . . . . . 244
8.7 Conclusion . . . . . . . . . . . . . . . . . . . . . . . . . . . . . . . 2458.8 References . . . . . . . . . . . . . . . . . . . . . . . . . . . . . . . . 246
xix
Table of Contents
9 Lean Software Maintenance 2519.1 Introduction . . . . . . . . . . . . . . . . . . . . . . . . . . . . . . . 2519.2 Related Work . . . . . . . . . . . . . . . . . . . . . . . . . . . . . . 2539.3 Lean Software Maintenance . . . . . . . . . . . . . . . . . . . . . . 256
9.3.1 Maintenance Inflow (M1) . . . . . . . . . . . . . . . . . . . 2589.3.2 Visualization Through Cumulative Flow Diagrams (M2) . . . 2589.3.3 Lead-time measurement (M3) . . . . . . . . . . . . . . . . . 2599.3.4 Work-load (M4) . . . . . . . . . . . . . . . . . . . . . . . . 2619.3.5 Prerequisites . . . . . . . . . . . . . . . . . . . . . . . . . . 261
9.4 Research Method . . . . . . . . . . . . . . . . . . . . . . . . . . . . 2619.4.1 Case and Context . . . . . . . . . . . . . . . . . . . . . . . . 2629.4.2 Unit of Analysis . . . . . . . . . . . . . . . . . . . . . . . . 2629.4.3 Proposition . . . . . . . . . . . . . . . . . . . . . . . . . . . 2639.4.4 Data Collection and Analysis . . . . . . . . . . . . . . . . . . 2649.4.5 Validity Threats . . . . . . . . . . . . . . . . . . . . . . . . . 265
9.5 Results . . . . . . . . . . . . . . . . . . . . . . . . . . . . . . . . . . 2669.5.1 Maintenance Inflow (M1) . . . . . . . . . . . . . . . . . . . 2669.5.2 Visualization Through Cumulative Flow Diagrams (M2) . . . 2669.5.3 Lead-Time Measurement (M3) . . . . . . . . . . . . . . . . . 2689.5.4 Work-Load (M4) . . . . . . . . . . . . . . . . . . . . . . . . 270
9.6 Discussion . . . . . . . . . . . . . . . . . . . . . . . . . . . . . . . . 2709.7 Conclusion . . . . . . . . . . . . . . . . . . . . . . . . . . . . . . . 2739.8 References . . . . . . . . . . . . . . . . . . . . . . . . . . . . . . . . 273
A Appendix A: Interview Protocol 277A.1 Introduction . . . . . . . . . . . . . . . . . . . . . . . . . . . . . . . 277A.2 Warm-up and Experience . . . . . . . . . . . . . . . . . . . . . . . . 278A.3 Main Body of the Interview . . . . . . . . . . . . . . . . . . . . . . . 278
A.3.1 Plan-Driven Development . . . . . . . . . . . . . . . . . . . 278A.3.2 Incremental and Agile Approach . . . . . . . . . . . . . . . . 280
A.4 Closing . . . . . . . . . . . . . . . . . . . . . . . . . . . . . . . . . 280
B Appendix B: Example of the Qualitative Analysis 281
List of Figures 283
List of Tables 284
xx
Chapter 1
Introduction
1.1 Preamble
The market for software is fast paced with frequently changing customer needs. Inorder to stay competitive companies have to be able to react to the changing needs ina rapid manner. Failing to do so often results in a higher risk of market lock-out [34],reduced probability of market dominance [15], and it is less likely that the productconforms to the needs of the market. In consequence software companies need to takeaction in order to be responsive whenever there is a shift in the customers’ needs onthe market. That is, they need to meet the current requirements of the market, the re-quirements being function or quality related. Two development paradigms emerged inthe last decade to address this challenge, namely agile and lean software development.
Throughout this thesis agile software development is defined as a developmentparadigm using a set of principles and practices allowing to respond flexibly andquickly to changes in customers’ needs. All agile methods, such as the most prominentones (SCRUM and eXtreme programming), are driven by similar values. The individ-ual methods differ with regard to the selection of their practices. The values driving theagile community are (1) “Individuals and interactions over processes and tools”, (2)“Working software over comprehensive documentation”, (3) “Customer collaborationover contract negotiation”, and “Responding to change over following a plan” [17].
We define the lean software development paradigm as a set of principles and prac-tices focused on the removal of waste leading to a lean software development process.Waste thereby is defined as everything that does not contribute to the value creation forthe customer. It is important to acknowledge that it is challenging to define and quan-
1

Chapter 1. Introduction
tify value, which is a relatively new research field on its own referred to as value-basedsoftware engineering [4]. In the field of value-based software engineering the focusis not only on the customer, but concerns all stakeholders involved in the creation ofsoftware. Thereby, different stakeholders may value certain aspects of software devel-opment (e.g. quality attributes of the software product) differently (cf. [2]). However,in lean manufacturing and software engineering the main focus has been on the valuecreated for the customer (see [23] and Chapter 2). In Chapter 2 we also provide a de-scription of different wastes that are considered as not contributing to the value of thecustomer, and hence should be removed.
Lean software engineering received much attention primarily from industry afterthe publication of a book on lean software development by Poppendieck and Pop-pendieck [23]. The Poppendiecks have practical experience from lean manufacturingand product development. When Mary Poppendick got to k now about the waterfallmodel in software development, she recognized that the software community couldbenefit from the ideas of flexible production processes. This was the motivation forthem to look into how the lean principles and practices from product development andmanufacturing could be used in the case of software development. The main ideasbehind lean are to focus all development effort on value adding activities from a cus-tomers’ perspective and to systematically analyze software processes to identify thewaste and then remove it [21, 23], as is reflected in the definition.
The thesis investigates the implementation of lean and agile practices in the soft-ware industry. The primary research method used throughout the thesis is case study[38, 29]. The case is a development site of Ericsson AB, located in Sweden. The com-pany produces software applications in the telecommunication and multimedia domain.At the case company agile practices were first introduced. That is, the company studiedis coming from a plan-driven approach and step-wise moved towards an agile develop-ment approach. In order to further improve the agile approach in place lean analysistools and measurements were used with the goal of further improving the companies’ability to respond to changes in the market needs.
In relation to the introduction of the lean and agile development approaches thethesis makes two contributions. As the first contribution (from hereon referred to asContribution I) of the thesis, the impact of migrating from a plan-driven to an agiledevelopment approach is investigated empirically. For this, first the baseline situation(plan-driven development) is analyzed empirically. Secondly, the effect of the migra-tion from a plan-driven to an agile approach is investigated. Finally, the new situationis analyzed in more depth. As the second contribution (from hereon referred to as Con-tribution II), new solutions inspired by lean ideas are proposed and their usefulness isevaluated in industrial case studies to further improve the processes established in themigration from plan-driven to agile development. A bridge between the two contribu-
2
tion is built by comparing the goals, principles, practices, and processes of lean andagile software development.
As this thesis focuses on the implementation of lean as well as agile software devel-opment it is important to mention that both paradigms share principles and practices,but that there are some distinguishing characteristics as well. When focusing on thelean implementation principles and practices unique to the lean software developmentparadigm are investigated to determine whether these provide additional benefits toagile software development.
The introduction is synthesizing the individual contributions of the papers included.Section 1.2 provides background information on the investigated software developmentparadigms. Section 1.3 identifies research gaps in the related work and discusses howthe individual studies address these research gaps. The research questions arising fromthe research gaps are stated and motivated in Section 1.4. The research method usedto answer the research questions is presented in Section 1.5. The results (Section 1.6)summarize the outcomes of the individual studies and are the input for synthesizing theevidence from the studies for the lean and agile part 1.7). Finally, Section 1.8 concludesthe introduction.
1.2 BackgroundThree development paradigms are investigated in this thesis, namely plan-driven soft-ware development, agile software development, and lean software development. Thissection provides a brief description of the studied paradigms.
1.2.1 Plan-Driven Software DevelopmentPlan-driven software development is focused on planning everything from the start of aproject (as suggested by the name). In addition, the plan-driven approach is character-ized as very documentation centric with designated responsibilities for the individualsoftware development disciplines (e.g. requirements engineering, architecture design,implementation, and quality assurance).
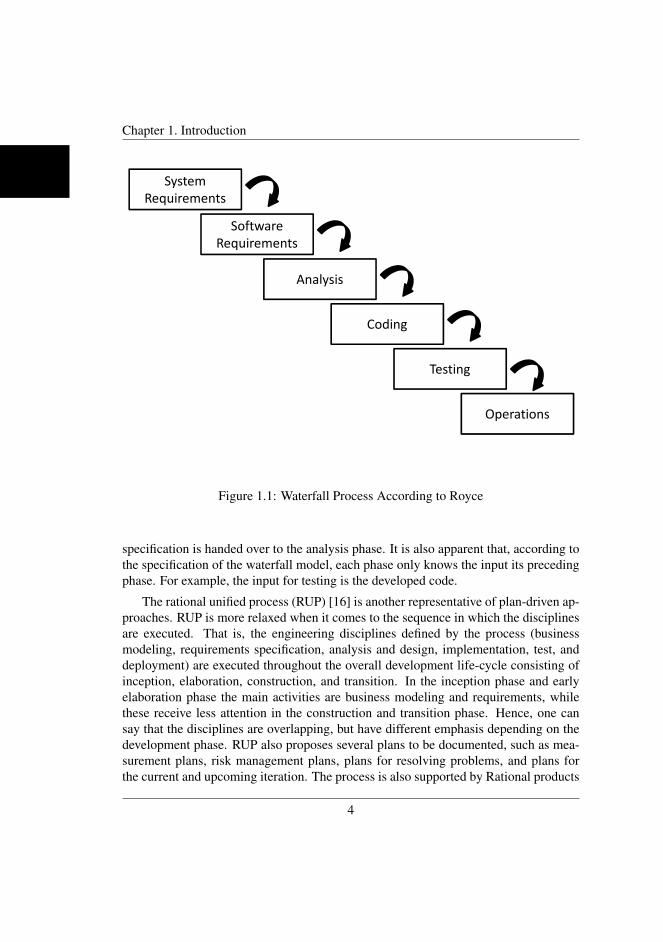
The most prominent instantiation of plan-driven software development is the wa-terfall process as suggested by Royce [28], the process being shown in Figure 1.1. Thewaterfall process is executed sequentially, following steps representing the differentsoftware development disciplines. The goal Royce was pursuing was to provide somestructure for executing software processes by assigning the disciplines to distinct soft-ware process phases. When a phase is completed the product of that phase is handedover to the following phase, e.g. when the software requirements are specified the
3
Chapter 1. Introduction
System
Requirements
Software
Requirements
Analysis
Coding
Testing
Operations
Figure 1.1: Waterfall Process According to Royce
specification is handed over to the analysis phase. It is also apparent that, according tothe specification of the waterfall model, each phase only knows the input its precedingphase. For example, the input for testing is the developed code.
The rational unified process (RUP) [16] is another representative of plan-driven ap-proaches. RUP is more relaxed when it comes to the sequence in which the disciplinesare executed. That is, the engineering disciplines defined by the process (businessmodeling, requirements specification, analysis and design, implementation, test, anddeployment) are executed throughout the overall development life-cycle consisting ofinception, elaboration, construction, and transition. In the inception phase and earlyelaboration phase the main activities are business modeling and requirements, whilethese receive less attention in the construction and transition phase. Hence, one cansay that the disciplines are overlapping, but have different emphasis depending on thedevelopment phase. RUP also proposes several plans to be documented, such as mea-surement plans, risk management plans, plans for resolving problems, and plans forthe current and upcoming iteration. The process is also supported by Rational products
4
providing tools for modeling and automation aspects related to the software process(e.g. Rational DOORS [14] for requirements management, and ClearCase [35]/ Clear-Quest [5] for change and configuration management). To support the tailoring of theRUP process to specific company needs the Rational Method Composer supports in thecomposition of methods and tools.
The V-Model [30] can be seen as an extension of the waterfall process by mappingverification and validation activities to each sequential development step. That is, thedelivered product is verified through operation and supported by maintenance activ-ities, the specification of the requirements is verified through acceptance and systemintegration testing, and the detailed design and coding activities are verified throughunit and component testing.
1.2.2 Agile Software Development
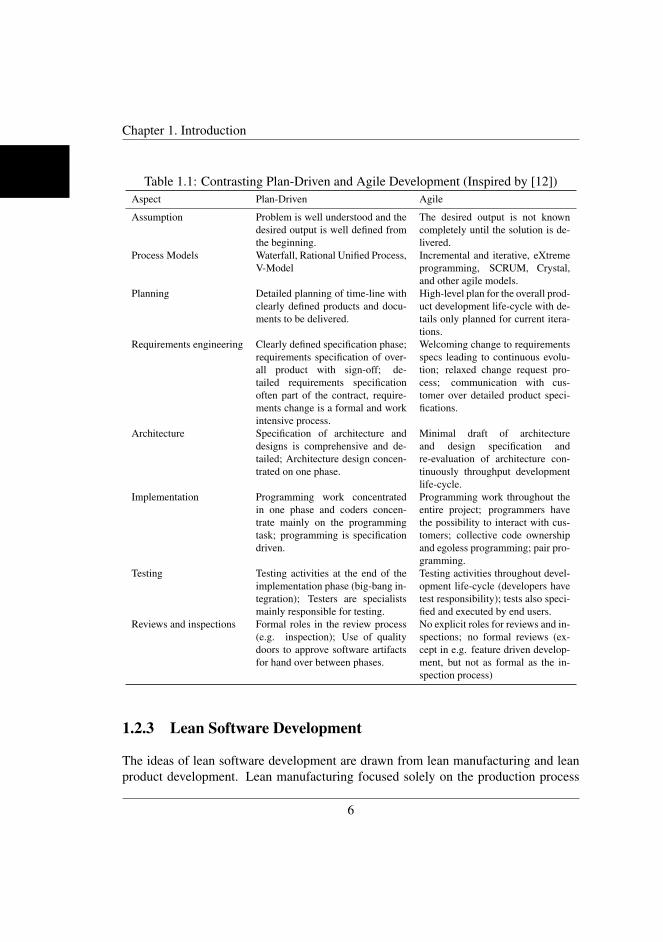
The agile approach stands in strong contrast to the plan-driven methods. This be-comes particularly visible considering the four values of agile software development.“Individuals and interactions over processes and tools” conflicts with plan-driven asplan-driven prefers strictly separated phases and the communication between phasesrelies heavily on documentation. In addition the value contradicts RUP as this processrelies heavily on planning. “Working software over comprehensive documentation”puts an emphasis on the implementation phase and stresses the importance to createa working and valuable product early in the process, which would not be possible inwaterfall development where each phase has to be complete before the next one can bestarted, i.e. deliveries in small increments and iterations are not considered. “Customercollaboration over contract negation” contradicts plan-driven development where therequirements specification is a measure of whether the contract has been fulfilled, therequirements specification being established early in the process. In agile develop-ment the content of the contract is not set in stone in the beginning as the practice ofsoftware engineering has shown that the specification changes continuously. Hence,agile proposes that the customer should be continuously involved throughout the pro-cess. “Responding to change over following the plan” is not supported by plan-drivendevelopment as any change would require a tremendous effort. Looking at the water-fall process in Figure 1.1 a change in the requirements when being in the test phasewould lead to changes in the analysis, and coding phase. Working in small incrementsand iterations allows much shorter feedback cycles and with that supports the abilityto change, as proposed by agile development. In Table 1.1 the differences betweenplan-driven and agile developed are summarized.
5
Chapter 1. Introduction
Table 1.1: Contrasting Plan-Driven and Agile Development (Inspired by [12])Aspect Plan-Driven Agile
Assumption Problem is well understood and thedesired output is well defined fromthe beginning.
The desired output is not knowncompletely until the solution is de-livered.
Process Models Waterfall, Rational Unified Process,V-Model
Incremental and iterative, eXtremeprogramming, SCRUM, Crystal,and other agile models.
Planning Detailed planning of time-line withclearly defined products and docu-ments to be delivered.
High-level plan for the overall prod-uct development life-cycle with de-tails only planned for current itera-tions.
Requirements engineering Clearly defined specification phase;requirements specification of over-all product with sign-off; de-tailed requirements specificationoften part of the contract, require-ments change is a formal and workintensive process.
Welcoming change to requirementsspecs leading to continuous evolu-tion; relaxed change request pro-cess; communication with cus-tomer over detailed product speci-fications.
Architecture Specification of architecture anddesigns is comprehensive and de-tailed; Architecture design concen-trated on one phase.
Minimal draft of architectureand design specification andre-evaluation of architecture con-tinuously throughput developmentlife-cycle.
Implementation Programming work concentratedin one phase and coders concen-trate mainly on the programmingtask; programming is specificationdriven.
Programming work throughout theentire project; programmers havethe possibility to interact with cus-tomers; collective code ownershipand egoless programming; pair pro-gramming.
Testing Testing activities at the end of theimplementation phase (big-bang in-tegration); Testers are specialistsmainly responsible for testing.
Testing activities throughout devel-opment life-cycle (developers havetest responsibility); tests also speci-fied and executed by end users.
Reviews and inspections Formal roles in the review process(e.g. inspection); Use of qualitydoors to approve software artifactsfor hand over between phases.
No explicit roles for reviews and in-spections; no formal reviews (ex-cept in e.g. feature driven develop-ment, but not as formal as the in-spection process)
1.2.3 Lean Software Development
The ideas of lean software development are drawn from lean manufacturing and leanproduct development. Lean manufacturing focused solely on the production process
6
and focused on removing waste from the production process. Waste is defined as ev-erything that does not contribute to the creation of value for the customer. In productionseven types of waste were defined (physical transportation of intermediate products, in-ventory in form of unfinished work in process, motion of people and equipment, wait-ing time, over production, over processing by executing activities that are not valueadding, and defects) [37]. In lean product development not only the manufacturingprocess for mass production was in the center of attention, but the overall product de-velopment process [21], from creating an idea for the product and specifying it untilthe delivery of the final product. Hence, lean product development is somewhat closerto software engineering than the pure manufacturing view. Much attention in prac-tice was generated by Mary and Tom Poppendieck who published several books (cf.[23, 24, 25]) on the translation and application of lean manufacturing and product de-velopment practices to a software engineering context. Lean software developmentshares many principles and practices with agile software development. However, atthe same time there are differences making the potential for the complementary use ofthe two paradigms explicit. For example, if a practice found in lean is not included inagile it might be a useful complement. The detailed comparison of the two paradigmsis provided in Chapter 2.
1.3 Research Gaps and Contributions
The research gaps have been identified based on the literature reviews of the individualstudies. Overall, studying the literature on agile software development we observedthat:
• The majority of empirical studies of sufficient quality focused on a single processmodel, namely eXtreme programming (XP) [3] as identified in the systematicreview by Dyba and Dingsøyr [8].
• Studies were focused on projects with development teams, but do not take pre-and post-project activities into account, as they are often found in larger-scalesoftware development. For example, pre-project activities are related to productmanagement and to distributing requirements to development projects. Post-project activities are concerned with integration of individual project results andthe release of the software product [11].
• The studies on agile often focused on agile implementations in a smaller scale(focus on teams with a size range from 4 to 23 [8]).
7
Chapter 1. Introduction
• Mostly immature agile implementations have been studied, which means that weknow little about how very experienced organizations perform [8].
• When studying agile the baseline situation is not presented which makes it hardto judge the effect/ improvement potential of agile development in comparisonto other models [8].
This makes the general need for studying agile implementations in a large-scaleenvironment under consideration of the overall development life-cycle explicit. Thefirst bullet is partially addressed in this thesis as we do not investigate a particular agileprocess (such as XP, or SCRUM [31]). Instead, an agile implementation based on aselection of practices that a company found most useful in its specific context (large-scale, market-driven) is investigated. The second bullet is covered in this thesis as wetake the end-to-end perspective into account, covering the overall software develop-ment life-cycle. The third bullet is addressed by investigating an agile software processwhere the products developed include more than 500 people overall at the developmentsite of the case company, with multiple projects being run in parallel. The fourth bulletis not addressed as the studied company was in the migration from a plan-driven to anagile process. The fifth bullet is addressed by investigating the baseline situation indetail, then investigating the effect of the migration, and finally taking a closer look atthe new situation with the agile practices in place.
With regard to lean it can be observed that lean practices have been well describedin a software engineering context in the books by Poppendieck and Poppendieck[23, 24, 25]. However, little empirical evidence on their usefulness in the softwareengineering context has been provided so far. That is, Middleton [19] studied the leanapproach in industry with two teams of different experiences, implementing the princi-ple of building quality in (i.e. assuring quality of the product as early as possible in thedevelopment process) by stopping all work and immediately correcting defects, whichwas the main practice introduced. Another study of Middleton showed lessons learnedfrom introducing several lean practices in the organization (such as minimizing inven-tory, balance work-load, elimination of rework, and standard procedures). Results werebriefly presented in lessons learned. Overall the study of related work showed that therewas only one study reporting on the impact of a lean implementation [20]. However,to the best of our knowledge no studies on lean software development have been con-ducted using the case study approach, and discussing elemental parts of empirical work(such as validity threats, data collection approaches, etc.). Hence, this makes the needexplicit to (1) provide and tailor solutions of lean manufacturing/product developmentto the specific needs in the software industry that are not as explicitly addressed in agiledevelopment, and (2) use empirical methods to show their merits and limitations.
8
As mentioned earlier the thesis makes two contributions, namely the investigationof the effect of moving from plan-driven to agile (Contribution I), and from agile to leansoftware development (Contribution II). The two contributions are realized throughsub-contributions provided by the individual studies. For Contribution I studies S2 toS5 provide the sub-contributions shown in Table 1.3. The sub-contributions relatingto Contribution II are shown in Table 1.4, namely studies S6 to S8. Agile and leansoftware development are introduced and systematically compared prior to the sub-contributions reported in S2 to S8 to provide the reader with sufficient background onthe software development principles and practices associated with the paradigms (seestudy S1 in Table 1.2).
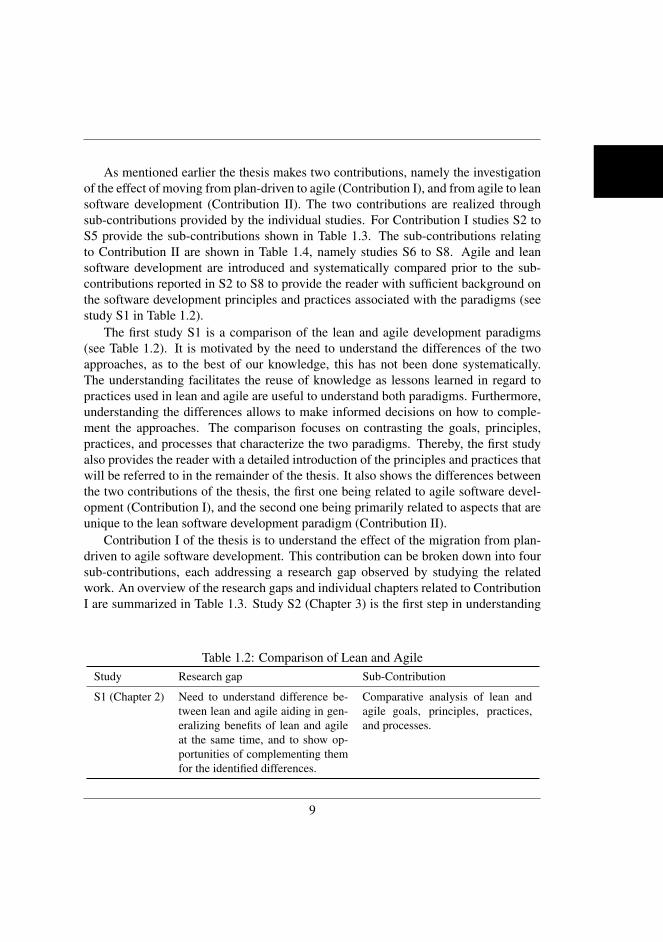
The first study S1 is a comparison of the lean and agile development paradigms(see Table 1.2). It is motivated by the need to understand the differences of the twoapproaches, as to the best of our knowledge, this has not been done systematically.The understanding facilitates the reuse of knowledge as lessons learned in regard topractices used in lean and agile are useful to understand both paradigms. Furthermore,understanding the differences allows to make informed decisions on how to comple-ment the approaches. The comparison focuses on contrasting the goals, principles,practices, and processes that characterize the two paradigms. Thereby, the first studyalso provides the reader with a detailed introduction of the principles and practices thatwill be referred to in the remainder of the thesis. It also shows the differences betweenthe two contributions of the thesis, the first one being related to agile software devel-opment (Contribution I), and the second one being primarily related to aspects that areunique to the lean software development paradigm (Contribution II).
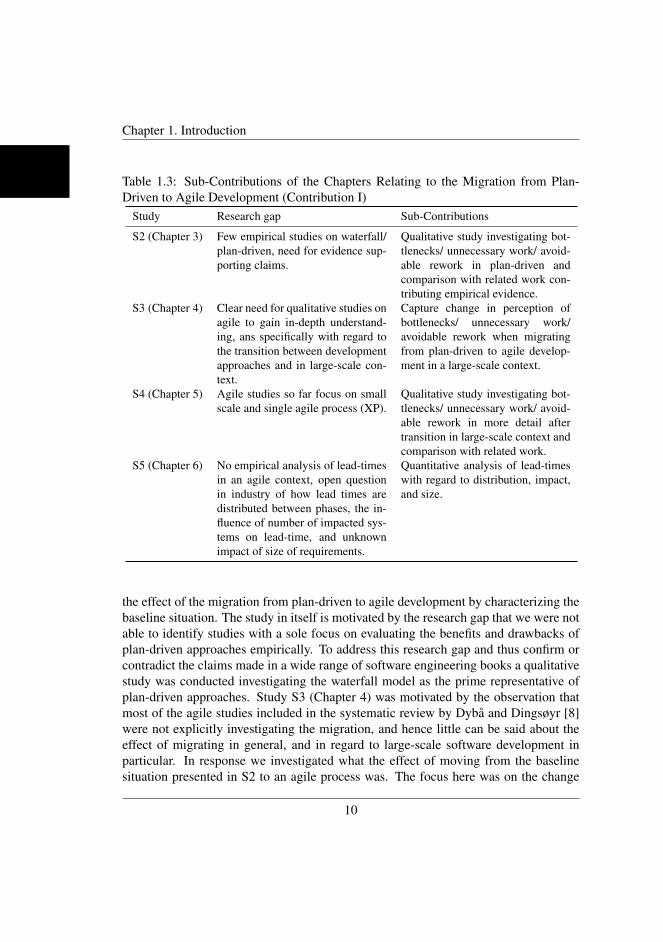
Contribution I of the thesis is to understand the effect of the migration from plan-driven to agile software development. This contribution can be broken down into foursub-contributions, each addressing a research gap observed by studying the relatedwork. An overview of the research gaps and individual chapters related to ContributionI are summarized in Table 1.3. Study S2 (Chapter 3) is the first step in understanding
Table 1.2: Comparison of Lean and AgileStudy Research gap Sub-Contribution
S1 (Chapter 2) Need to understand difference be-tween lean and agile aiding in gen-eralizing benefits of lean and agileat the same time, and to show op-portunities of complementing themfor the identified differences.
Comparative analysis of lean andagile goals, principles, practices,and processes.
9
Chapter 1. Introduction
Table 1.3: Sub-Contributions of the Chapters Relating to the Migration from Plan-Driven to Agile Development (Contribution I)
Study Research gap Sub-Contributions
S2 (Chapter 3) Few empirical studies on waterfall/plan-driven, need for evidence sup-porting claims.
Qualitative study investigating bot-tlenecks/ unnecessary work/ avoid-able rework in plan-driven andcomparison with related work con-tributing empirical evidence.
S3 (Chapter 4) Clear need for qualitative studies onagile to gain in-depth understand-ing, ans specifically with regard tothe transition between developmentapproaches and in large-scale con-text.
Capture change in perception ofbottlenecks/ unnecessary work/avoidable rework when migratingfrom plan-driven to agile develop-ment in a large-scale context.
S4 (Chapter 5) Agile studies so far focus on smallscale and single agile process (XP).
Qualitative study investigating bot-tlenecks/ unnecessary work/ avoid-able rework in more detail aftertransition in large-scale context andcomparison with related work.
S5 (Chapter 6) No empirical analysis of lead-timesin an agile context, open questionin industry of how lead times aredistributed between phases, the in-fluence of number of impacted sys-tems on lead-time, and unknownimpact of size of requirements.
Quantitative analysis of lead-timeswith regard to distribution, impact,and size.
the effect of the migration from plan-driven to agile development by characterizing thebaseline situation. The study in itself is motivated by the research gap that we were notable to identify studies with a sole focus on evaluating the benefits and drawbacks ofplan-driven approaches empirically. To address this research gap and thus confirm orcontradict the claims made in a wide range of software engineering books a qualitativestudy was conducted investigating the waterfall model as the prime representative ofplan-driven approaches. Study S3 (Chapter 4) was motivated by the observation thatmost of the agile studies included in the systematic review by Dyba and Dingsøyr [8]were not explicitly investigating the migration, and hence little can be said about theeffect of migrating in general, and in regard to large-scale software development inparticular. In response we investigated what the effect of moving from the baselinesituation presented in S2 to an agile process was. The focus here was on the change
10

of perception with regard to issues (e.g. bottlenecks) before and after the migration.Study S4 (Chapter 5) is different from Study S3 as it makes a more in-depth analysisof the new situation and compares the findings with those in the related work. Inparticular, the issues and advantages associated with agile software development werecompared between the case study and empirical studies conducted by others. Finally,the lead-times of the new situation two years after the migration were investigated inStudy S5 (Chapter 6) to capture the speed with which the requirements are deliveredto the market. The goal of the company was to reduce the lead-time by setting realisticimprovement targets. In order to set these targets it was necessary to understand howlead-times differ between phases, between requirements affecting single and multiplesystems, and requirements with different sizes. If there is a difference it has to betaken into consideration. As this was an open question to the company it motivated anempirical study. In order to actually improve the lead-times lean provides a number ofanalysis tools and ideas that are focused on improving throughput and speed, leadingto the Contribution II of the thesis, i.e. the proposal and evaluation of novel analysisapproaches to improve the process with a focus of making it more lean and with thatincrease speed and throughput.
The second contribution (Contribution II) is the proposal and evaluation of leansoftware development tools to improve the agile processes in place. In Study S6 (Chap-ter 7) an approach for continuous improvement towards a lean process is presented.The study was motivated by the observation in related work that when introducinglean software development with a big bang strategy the introduction often failed. Thisobservation has been made in lean manufacturing/ product development and in the soft-ware engineering context. Hence, the solution proposed (Software Process Improve-ment through Lean Measurement (SPI-LEAM Method) uses a measurement approachshowing the absence of a lean process in different disciplines (e.g. development ofsoftware requirements, quality and test efficiency, maintenance, and so forth). The ap-proach is based on the measurement of work in process (queues/inventories) and aimsat achieving an integrated view on an abstract level to avoid sub-optimization. Whendetecting the absence in specific disciplines (e.g. maintenance) a more detailed look atthe performance in this discipline should be possible. Approaches for the detailed anal-ysis (i.e. drill-down view of each of the disciplines) are investigated in study S7 and S8.In study S7 (Chapter 8) a solution for the drill-down of main product development (i.e.inventory of requirements in the process life-cycle) is presented and evaluated. Thegoal in main product development is to achieve a smooth and continuous throughput.Whether this goal is achieved is not obvious with many requirements being developedin parallel in the large-scale context. Hence, we propose a visualization and measure-ment solution to be used in order to show the presence or absence of a continuous flowwith high throughput. The approach has been evaluated empirically in a case study.
11
Chapter 1. Introduction
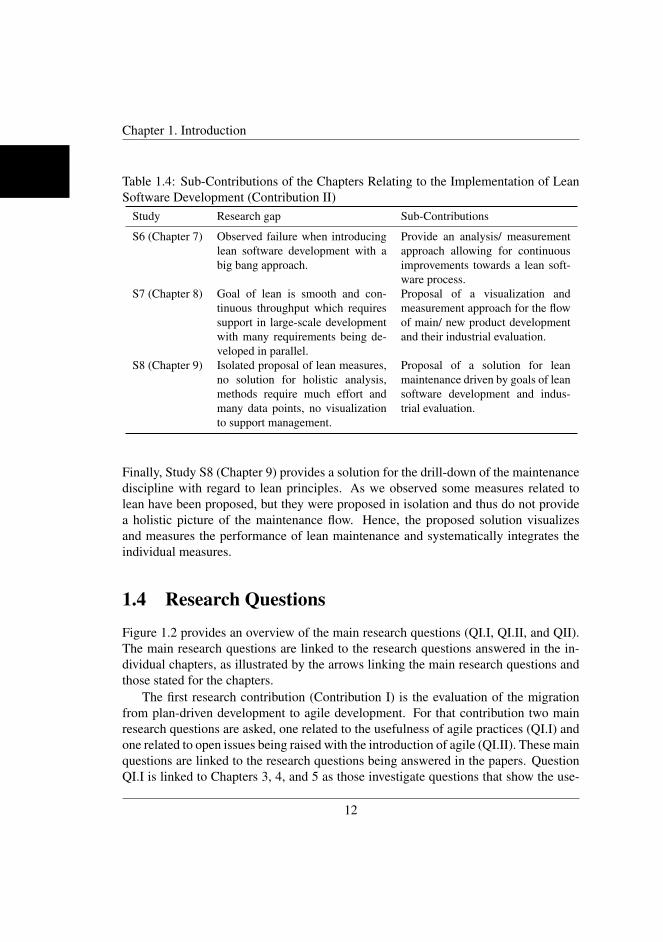
Table 1.4: Sub-Contributions of the Chapters Relating to the Implementation of LeanSoftware Development (Contribution II)
Study Research gap Sub-Contributions
S6 (Chapter 7) Observed failure when introducinglean software development with abig bang approach.
Provide an analysis/ measurementapproach allowing for continuousimprovements towards a lean soft-ware process.
S7 (Chapter 8) Goal of lean is smooth and con-tinuous throughput which requiressupport in large-scale developmentwith many requirements being de-veloped in parallel.
Proposal of a visualization andmeasurement approach for the flowof main/ new product developmentand their industrial evaluation.
S8 (Chapter 9) Isolated proposal of lean measures,no solution for holistic analysis,methods require much effort andmany data points, no visualizationto support management.
Proposal of a solution for leanmaintenance driven by goals of leansoftware development and indus-trial evaluation.
Finally, Study S8 (Chapter 9) provides a solution for the drill-down of the maintenancediscipline with regard to lean principles. As we observed some measures related tolean have been proposed, but they were proposed in isolation and thus do not providea holistic picture of the maintenance flow. Hence, the proposed solution visualizesand measures the performance of lean maintenance and systematically integrates theindividual measures.
1.4 Research Questions
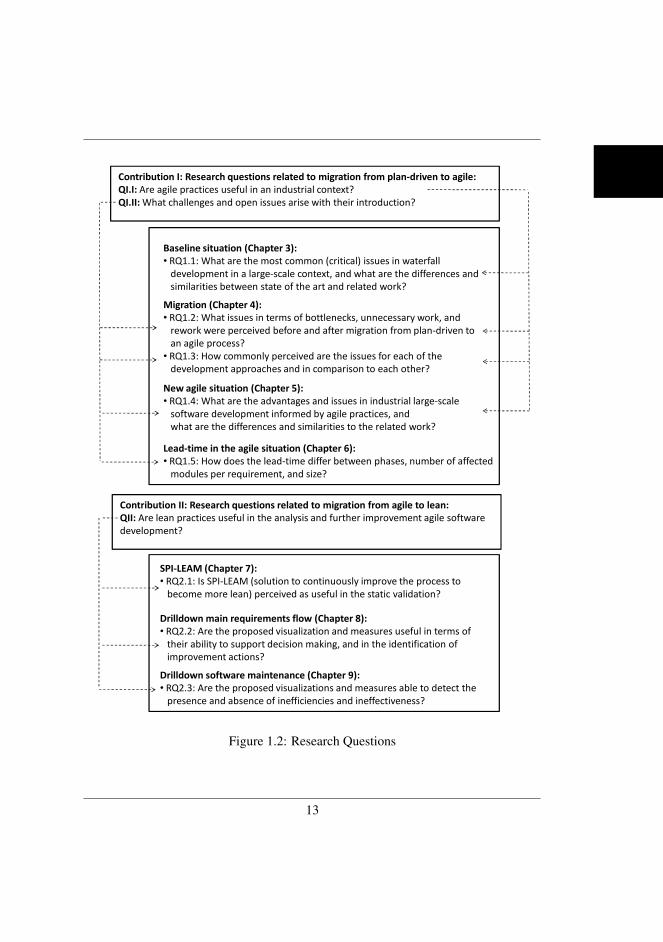
Figure 1.2 provides an overview of the main research questions (QI.I, QI.II, and QII).The main research questions are linked to the research questions answered in the in-dividual chapters, as illustrated by the arrows linking the main research questions andthose stated for the chapters.
The first research contribution (Contribution I) is the evaluation of the migrationfrom plan-driven development to agile development. For that contribution two mainresearch questions are asked, one related to the usefulness of agile practices (QI.I) andone related to open issues being raised with the introduction of agile (QI.II). These mainquestions are linked to the research questions being answered in the papers. QuestionQI.I is linked to Chapters 3, 4, and 5 as those investigate questions that show the use-
12
Contribution I: Research questions related to migration from plan-driven to agile:
QI.I: Are agile practices useful in an industrial context?
QI.II: What challenges and open issues arise with their introduction?
Baseline situation (Chapter 3):
• RQ1.1: What are the most common (critical) issues in waterfall
development in a large-scale context, and what are the differences and
similarities between state of the art and related work?
Migration (Chapter 4):
• RQ1.2: What issues in terms of bottlenecks, unnecessary work, and
rework were perceived before and after migration from plan-driven to
an agile process?
• RQ1.3: How commonly perceived are the issues for each of the
development approaches and in comparison to each other?development approaches and in comparison to each other?
New agile situation (Chapter 5):
• RQ1.4: What are the advantages and issues in industrial large-scale
software development informed by agile practices, and
what are the differences and similarities to the related work?
Lead-time in the agile situation (Chapter 6):
• RQ1.5: How does the lead-time differ between phases, number of affected
modules per requirement, and size?
Contribution II: Research questions related to migration from agile to lean:
QII: Are lean practices useful in the analysis and further improvement agile software
development?
SPI-LEAM (Chapter 7):
• RQ2.1: Is SPI-LEAM (solution to continuously improve the process to • RQ2.1: Is SPI-LEAM (solution to continuously improve the process to
become more lean) perceived as useful in the static validation?
Drilldown main requirements flow (Chapter 8):
• RQ2.2: Are the proposed visualization and measures useful in terms of
their ability to support decision making, and in the identification of
improvement actions?
Drilldown software maintenance (Chapter 9):
• RQ2.3: Are the proposed visualizations and measures able to detect the
presence and absence of inefficiencies and ineffectiveness?
Figure 1.2: Research Questions
13
Chapter 1. Introduction
fulness by investigating whether an improvement is achieved from migrating from thebaseline situation (plan-driven) to the new situation (agile). Question QI.II is lookingfor open issues that need to be addressed in order to leverage on the full benefits thatagile software development seeks to achieve. Open issues are investigated in S3 by de-termining which of the issues in agile development are still perceived as very common.The questions in S4 have an explicit focus on the comparison of the issues identifiedin the case study with those reported in related work. Finally, study S5 looks at openissues from a lead-time perspective as the speed with which the company can react tocustomer needs was considered of high priority in the studied context.
The second research contribution (Contribution II) evaluates whether the additionof lean practices is useful in further improving the agile situation in place. The ques-tions are very much related to the usefulness of the individual solutions proposed inthe chapters. Study S6 evaluates the perceived usefulness of SPI-LEAM, an approachthat evaluates how lean a software process is on a high level integrating different disci-plines in one view (e.g. requirements flow, software maintenance, software testing, andso forth). The questions of Chapters 8 and 9 are related to the drill down to understandthe behavior of the disciplines in more depth.
Chapter 2 connects Contribution I and II by answering the question of how the leanand agile development paradigms are different with regard to their goals, principles,practices, and processes.
1.5 Research MethodThe choice of research method is motivated, followed by a description of the researchquestions, case and units of analysis, data collection and analysis, and validity threats.
1.5.1 Method SelectionCommonly used research methods in the software engineering context are controlledexperiments [36], surveys [9], case studies [38], action research [33], and simulation[32].
Controlled Experiments: This research method is used to test theories in a con-trolled environment. For that purpose hypotheses are formulated regarding the cause-effect relationship between one or more independent variables and independent (out-come) variables. The experiment is conducted in a controlled environment, meaningthat variables other than the independent variables should not have an effect on theoutcome variables. For example, when testing the effect of two testing techniques ontesting efficiency other factors such as experience should be controlled so they do not
14
affect the outcome. In practice it is often challenging to control the other factors, whichmakes it important to consider possible threats to validity when designing the exper-iment study. It is important to note that experiments with human subjects often needa sufficient number of participants carrying out a task for a longer period of time. Inconsequence, experiments are often conducted in a laboratory setting with students assubjects due to the limited availability of practitioners. The analysis of experiments ismainly based on statistical inference, e.g. by comparing whether there is a statisticallysignificant difference with regard to the outcome variable for two different treatments.
Surveys: A survey studies a phenomena for a population by surveying a samplethat is representative for that population. In order to collect the data from the samplequestionnaires and interviews are often used. Online questionnaires are preferred asthey allow to reach a larger sample and are less time consuming from the researcherspoint of view, and are thus more efficient than interviews with regard to the numberof data points that could be collected (see, for example, [10] who received more than3000 answers on their questionnaire). Having collected the data of the sample statisticalinference is used to draw conclusions for the overall population.
Case Studies: Case studies are an in-depth investigation of a phenomena focusingon a specific case. The cases are objects of the real world studied in a natural setting, insoftware engineering this means they are real software organizations, software projects,software developers, etc. Case studies are conducted by defining the case to be studied,the units of analysis, as well as a data collection strategy. With regard to case studiesa number of decisions have to be made. The first one being whether the study is ofconfirmative or exploratory nature [26]. A confirmative case study sets out with aproposition or hypotheses to be tested in the real world. In the case of the exploratorycase study little knowledge about the phenomena in the real world is available andhence the study aims at identifying theories and propositions. When these are definedthey can be confirmed in forthcoming confirmative case studies or by other researchmethods, such as experiments. Another decision to be made is whether a flexible orfixed design should be used [26]. A flexible design allows to change the design basedon new information gathered while executing the case study, e.g. leading to a change ofresearch questions or data sources. In a fixed design the researcher sticks with the initialdesign throughout the case study process. In comparison to controlled experimentsthere is much less control in an industrial case study, which means that confoundingfactors very likely play a role when making inferences, e.g. as is the case in this thesiswhere inferences were made about the effect of the transition between two developmentparadigms. The analysis of case studies ranges from a purely qualitative analysis whereraw data from interviewees is categorized and coded to the exclusive use of statisticalinference.
Simulation: Simulations are executable models of a real world phenomena (e.g.
15
Chapter 1. Introduction
software processes, software architecture) to study their behavior [32]. After buildingthe simulation model complex real-world processes can be simulated by calibrating themodel parameters based on empirical data, be it from existing publications or directlycollected from software industry. Simulation is able to capture complex processes andsystems to determine their performance, the calculation of the performance outcomebeing too complex for a human to calculate in a time-efficient manner. This is dueto that software processes have complex looping mechanisms and the flow through theprocesses is determined by many different factors that occur with specific probabilities.Simulations have been used in many different application areas, e.g. release planning[1], requirements engineering [13], and quality assurance [7]. In these applicationareas simulation can be, for example, used for software productivity prediction [27]or to manage risk. Simulation as a tool for empirical research can be used to test anew solution in a “what-if” scenario, such as introducing a new testing technique intoa process and determine the impact on multiple process performance parameters.
Action Research: In action research the goal is to introduce an intervention in a real-world setting and then observe what the affect of the intervention is. The researcheris actively involved in introducing the intervention and making the observations [26],in fact the researcher takes an active part in the organization (e.g. by participatingin a development team affected by the intervention introduced). The steps of actionresearch are planning of the intervention and the collection of the data to capture theintervention effect, the implementation of the actual intervention, and the collection ofdata and their interpretation [33]. As pointed out by Martella et al. [18] much can belearned by continuously observing the effect of a change after inducing it. However, asthe researcher is actively involved in the team work action research is an effort intensiveapproach from the researcher’s point of view.
Motivation for Choice of Research Method: The research method of choice for thisthesis was case study. The motivation for the choice is given by a direct comparisonwith the other methods.
• Case study vs. experiment: As mentioned earlier, the contribution of this thesisis the investigation of the implementation of lean and agile practices in a real-world setting. As processes are concerned and the goal was to focus on large-scale software development with hundreds of people involved it is not possibleto replicate such a solution in a lab environment with students.
• Case study vs. survey: A survey is classified as research in the large to getan overall overview of a phenomena with regard to a population, hence beingreferred to as research in the large [26], or research in the breadth. As in thisstudy the aim was to gain an in-depth understanding research in the breadth isnot an option. For example, asking too many detailed and free-text questions in a
16
survey would likely result in respondents not completing the survey. Hence, casestudy is more suitable when it is agreed with a company that people are availablefor detailed interviews allowing for the in-depth understanding.
• Case study vs. simulation: Simulation primarily focuses on measurable charac-teristics of a process. As in-depth understanding requires a qualitative approachfor research case study is given preference over simulation.
• Case study vs. action research: Action research is very much based on plan-ning an action or intervention and observing its effect. In the first contributionof the thesis this was not possible as the action has been taken (i.e. the mi-gration from plan-driven to agile). For the second contribution (introduction ofnovel approaches to lean software engineering) action research would have beena suitable alternative for the research goals, but was not chosen due to the ef-fort connected with that, specifically as the intervention was done throughout theoverall development site at the studied company. Thus, instead of taking activepart in all implementations the researcher acted more as an observer.
Overall, the comparison shows that case study was considered the most suitable re-search method in order to achieve the research contributions. The case studies areconfirmative as propositions could either be defined based on literature (studies S2 toS5), or the case studies seek to confirm the usefulness of solutions (S6 to S8). The casestudy design was fixed and agreed on with the company.
It is also important to distinguish between static and dynamic validation. Staticvalidation means to present the solution to practitioners and then incorporate theirfeedback. This step is important to receive early feedback and to get a buy-in forthe implementation of the solution. Dynamic validation is the evaluation of the actualusage of the solution in an industrial setting. The actual use (dynamic validation) isconducted through case study research. If no dynamic validation was used yet, but wepresented the solution to the practitioners to receive early feedback, we refer to theresearch method as static validation.
Within the case studies a number of sub-methods have been used, namely inter-views (S2 to S4) and workshops (S6 and S7) for data collection, and grounded theory(S2 to S4) as well as statistical analysis (S3, S6 to S8).
Interviews: Interviews are conversations guided by an interview protocol and areconsidered one of the most important resources for data when conducting case studies[38]. The interview protocol can vary in the degree of structure, ranging from verystructured (interviewee has to stick with research questions) over semi-structured (in-terviewee has a guide, but can change the course of the interview to follow interestingdirections) to unstructured (rough definitions of topics to be covered). In this case
17
Chapter 1. Introduction
study we used semi-structured interviews to allow for some flexibility in the conversa-tion. Unstructured interviews were not considered as interviews with some structuresseem to be the most efficient way of eliciting information [6].
Workshops: In a workshop a group of people is working together to solve a task.A moderator is leading the workshop to guide the participants in achieving the task.Workshops have been used in the studies where a new solution was provided to thecompany to gather feedback. Workshops have been chosen to allow for an open dis-cussion and reflection on the introduced solutions considering different roles. Theadvantage of workshops is that they are very efficient in collecting data from severalperspectives in only one occasion. The disadvantage is that workshops require severalpeople to be available at the same time on one occasion, which can be a challenge whenconducting research with industry. Hence, workshops were used in the later phases ofthe research (implementation of lean in studies S6 to S8) as it was easier to get theright people at the same time. That is, the solution was under implementation at thestudied company with management support, assigning people to reflect and support theimprovement of the solution implementation.
Grounded Theory: The goal of grounded theory is to develop theories [26]. Inthis research the goal was not to develop theories. However, grounded theory providesvaluable tools to analyze an overwhelming amount of qualitative data [26]. The fol-lowing concepts from grounded theory have been applied to this research: reduction ofdata through coding, display of data (use of matrices and tables), and documenting re-lationships in mind-maps with narrative descriptions of the branches of the maps. Thedetailed descriptions of the analysis process can be found in the chapters describingstudies S2 to S4.
Statistical Analysis: Descriptive statistics are also a means of reducing the amountof data, and to visualize quantitative data in order to aid analysis [26]. Different kindsof diagrams have been used in the studies, such as box-plots (S5 and S8), bar charts(S7), etc. In study S5 we were interested in establishing relationships between differentvariables. Hence, correlation analysis and regression was used to determine whetherone variable accounts for the variance in another variable.
1.5.2 Case and Units of AnalysisThe case being studied is Ericsson AB located in Sweden. The company is developingsoftware in the telecommunication and multimedia domain. The market to which theproducts are delivered can be characterized as highly dynamic and customized. Cus-tomized means that customers often ask the delivered product to be adapted to theirspecific needs after release. The company is ISO 9001:2000 certified. As the companyis delivering to a dynamic market the type of development is market-driven. That is,
18
the customers to which products are delivered are not all known beforehand. Instead,the product is developed for many potential customers operating on the market. Incontrast, in bespoke development the customer and the users are known beforehandand thus the main customers with that users are very clear when developing the soft-ware. Additional details on the context elements relevant for the individual studies arepresented within the chapters.
The units of analysis were the systems developed at the case company. Two majorsystems are developed at the development site that was investigated in this thesis. Eachof the systems is of very large scale and thus the systems are broken down into nodes(also referred to as sub-systems). Different nodes have been studied throughout thechapters of the thesis and are labeled and discussed within the chapters. The numberof sub-systems studied in each study are also stated in Table 1.5.
1.5.3 Data Collection and AnalysisTable 1.5 provides an overview of the data collection approaches and the evaluationcriteria for determining the usefulness of lean and agile development. In addition, theresearch methods used and the units of analysis are summarized. For the collectionin the industry studies we used interviews, quantitative data collected at the company,process documentation, and workshops.
Interviews: Chapters 3, 4, and 5 are based on a large-scale industry case studyand the data was primarily collected from a total of 33 interviews. The interviewswere semi-structured meaning that the interviewee used an interview guide, but wasallowed to depart from the guide and ask follow-up questions on interesting answersraised during the interviews [26]. In that way the semi-structured interviews providesome flexibility to the interviewee. Questions regarding the experience of the inter-viewees were closed questions while the actual interview only contained open-endedquestions. Interviews have been chosen as they allow to gain an in-depth understand-ing of the situation at the company. A systematic review in the context of requirementselicitation, requirements elicitation aiming at gaining an in-depth understanding of thecustomers’ needs regarding a software system to be developed, showed that interviewswith some structure seem to be the most effective way to elicit information [6], whichis supporting our choice of method.
Quantitative data: In addition to the qualitative data collected in Chapters 3, 4,and 5 quantitative data on the effect of the migration from plan-driven to an agile de-velopment approach has been used. The data source for that was data collected at thecompany, which was closed source. That means, the original data sources were notvisible to the researchers and with that there was little control on the data collectionand with that constitutes a risk to validity. The collected data in Chapters 6, 7, and
19
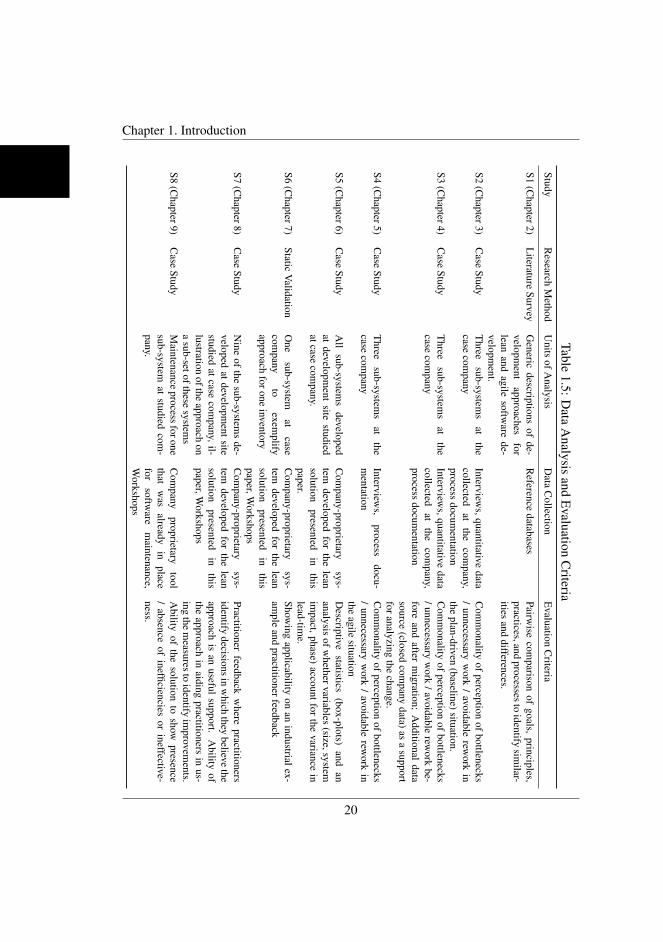
Chapter 1. Introduction
Table1.5:D
ataA
nalysisand
Evaluation
Criteria
StudyR
esearchM
ethodU
nitsofA
nalysisD
ataC
ollectionE
valuationC
riteria
S1(C
hapter2)L
iteratureSurvey
Generic
descriptionsof
de-velopm
entapproaches
forlean
andagile
software
de-velopm
ent.
Reference
databasesPairw
isecom
parisonof
goals,principles,
practices,andprocessesto
identifysim
ilar-ities
anddifferences.
S2(C
hapter3)C
aseStudy
Three
sub-systems
atthe
casecom
panyInterview
s,quantitativedata
collectedat
thecom
pany,process
documentation
Com
monality
ofperception
ofbottlenecks
/unnecessary
work
/avoidable
rework
inthe
plan-driven(baseline)situation.
S3(C
hapter4)C
aseStudy
Three
sub-systems
atthe
casecom
panyInterview
s,quantitativedata
collectedat
thecom
pany,process
documentation
Com
monality
ofperception
ofbottlenecks
/unnecessaryw
ork/avoidable
rework
be-fore
andafter
migration;
Additional
datasource
(closedcom
panydata)
asa
supportforanalyzing
thechange.
S4(C
hapter5)C
aseStudy
Three
sub-systems
atthe
casecom
panyInterview
s,process
docu-m
entationC
omm
onalityof
perceptionof
bottlenecks/
unnecessaryw
ork/
avoidablerew
orkin
theagile
situationS5
(Chapter6)
Case
StudyA
llsub-system
sdeveloped
atdevelopm
entsite
studiedatcase
company.
Com
pany-proprietarysys-
temdeveloped
forthe
leansolution
presentedin
thispaper.
Descriptive
statistics(box-plots)
andan
analysisofw
hethervariables(size,system
impact,phase)
accountforthe
variancein
lead-time.
S6(C
hapter7)Static
Validation
One
sub-systemat
casecom
panyto
exemplify
approachforone
inventory
Com
pany-proprietarysys-
temdeveloped
forthe
leansolution
presentedin
thispaper,W
orkshops
Showing
applicabilityon
anindustrialex-
ample
andpractitionerfeedback
S7(C
hapter8)C
aseStudy
Nine
ofthe
sub-systems
de-veloped
atdevelopm
entsite
studiedat
casecom
pany,il-lustration
oftheapproach
ona
sub-setofthesesystem
s
Com
pany-proprietarysys-
temdeveloped
forthe
leansolution
presentedin
thispaper,W
orkshops
Practitionerfeedback
where
practitionersidentify
decisionsinw
hichthey
believethe
approachis
anuseful
support.A
bilityof
theapproach
inaiding
practitionersin
us-ing
them
easurestoidentify
improvem
ents.S8
(Chapter9)
Case
StudyM
aintenanceprocessforone
sub-systemat
studiedcom
-pany.
Com
panyproprietary
toolthat
was
alreadyin
placefor
software
maintenance,
Workshops
Ability
ofthe
solutionto
showpresence
/absence
ofinefficiencies
orineffective-
ness.
20
8 was based on a company-proprietary tool constructed by the author and a colleagueat Ericsson. Hence, in that case the data was available to the researcher having fullaccess, and thus was able to conduct quality checks on the data to assure completenessand consistency. The study presented in study S8 also made use of a company propri-etary tool for defect tracking with full access to the researcher. Therefore, the data instudy S8 was also under the researcher’s control.
Process documentation: Process documentation played an important role in theearly studies of the paper presented in Chapters 3 to 5 as they allowed to gain knowl-edge about the terminology used in the company. Furthermore, a basic understandingof the processes and ways of working was achieved, which was useful when conductingthe interviews. That is, the study of company documentation made the communicationbetween the researcher and practitioners much easier and hence allowed to focus theinterviews on the actual issues rather than clarifying terminology.
Practitioner Workshops: Practitioner workshops were used to gather feedback onthe proposed solutions as well as the researcher’s interpretation of the research results.In general workshops were organized by providing an introduction to the theme(s) ofthe workshop and then the themes were openly discussed in the workshops. Someworkshops also provided tasks to the workshop participants, such as writing notes andpresenting them to the audience (see e.g. study S7). How individual workshops wereorganized and who participated in them is presented in the individual chapters. Over-all, we found workshops to be efficient in gathering feedback as they allow to openlydiscuss the same theme from different perspectives and roles at a single occasion.
Regarding the analysis different evaluation criteria have been used. Studies 2, 3,and 4 used the commonality of responses across different roles in the developmentlife-cycle and across sub-systems for evaluation purposes. If an issue, for example, isnot perceived as common in the new way of working (agile) in comparison to the oldway of working (plan-driven) then this indicates an improvement. The evaluation ofthe lean approaches was primarily based on the feedback of the practitioners, and theirreflections when using them. The evaluation criteria for each study are summarized inthe very right column in Table 1.5.
1.5.4 Validity ThreatsFour types of validity threats are commonly discussed in empirical studies such as ex-periments [36] and case studies [38, 29]. Construct validity is concerned with choos-ing and collecting the right measures for the concept being studied. Internal validity isconcerned with the ability to establish a casual relationship statistically or the ability tomake inferences. External validity is about the ability to generalize the findings of thestudy. Finally, conclusion validity is concerned with the ability of replicating the study
21
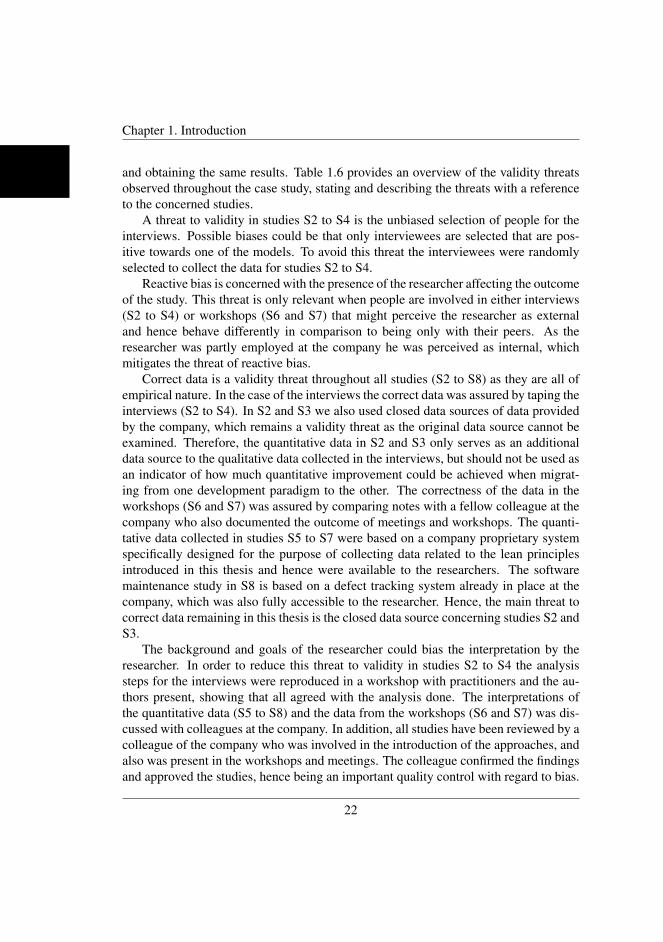
Chapter 1. Introduction
and obtaining the same results. Table 1.6 provides an overview of the validity threatsobserved throughout the case study, stating and describing the threats with a referenceto the concerned studies.
A threat to validity in studies S2 to S4 is the unbiased selection of people for theinterviews. Possible biases could be that only interviewees are selected that are pos-itive towards one of the models. To avoid this threat the interviewees were randomlyselected to collect the data for studies S2 to S4.
Reactive bias is concerned with the presence of the researcher affecting the outcomeof the study. This threat is only relevant when people are involved in either interviews(S2 to S4) or workshops (S6 and S7) that might perceive the researcher as externaland hence behave differently in comparison to being only with their peers. As theresearcher was partly employed at the company he was perceived as internal, whichmitigates the threat of reactive bias.
Correct data is a validity threat throughout all studies (S2 to S8) as they are all ofempirical nature. In the case of the interviews the correct data was assured by taping theinterviews (S2 to S4). In S2 and S3 we also used closed data sources of data providedby the company, which remains a validity threat as the original data source cannot beexamined. Therefore, the quantitative data in S2 and S3 only serves as an additionaldata source to the qualitative data collected in the interviews, but should not be used asan indicator of how much quantitative improvement could be achieved when migrat-ing from one development paradigm to the other. The correctness of the data in theworkshops (S6 and S7) was assured by comparing notes with a fellow colleague at thecompany who also documented the outcome of meetings and workshops. The quanti-tative data collected in studies S5 to S7 were based on a company proprietary systemspecifically designed for the purpose of collecting data related to the lean principlesintroduced in this thesis and hence were available to the researchers. The softwaremaintenance study in S8 is based on a defect tracking system already in place at thecompany, which was also fully accessible to the researcher. Hence, the main threat tocorrect data remaining in this thesis is the closed data source concerning studies S2 andS3.
The background and goals of the researcher could bias the interpretation by theresearcher. In order to reduce this threat to validity in studies S2 to S4 the analysissteps for the interviews were reproduced in a workshop with practitioners and the au-thors present, showing that all agreed with the analysis done. The interpretations ofthe quantitative data (S5 to S8) and the data from the workshops (S6 and S7) was dis-cussed with colleagues at the company. In addition, all studies have been reviewed by acolleague of the company who was involved in the introduction of the approaches, andalso was present in the workshops and meetings. The colleague confirmed the findingsand approved the studies, hence being an important quality control with regard to bias.
22

Another threat is that one specific company and thus company specific processesare studied. Therefore, the context and processes have been carefully described toaid other researchers and practitioners in the generalization of the results. In orderto identify the relevant context information for the studies included in this thesis weused a checklist of context elements introduced in Petersen and Wohlin [22], exceptfor study S2 and S4 as the checklist has been developed after having the possibility tomake changes to these studies.
Confounding factors are important when making inferences about a root-cause re-lationship which is the case for study S3 in which inferences are made about the changedue to the migration from plan-driven to agile development. The confounding factorscannot be ruled out as the study was conducted in an uncontrolled industrial environ-ment. In order to address the validity threat the most obvious factors were ruled outand a person involved in the measurement collection was asked about confounding fac-tors, saying that at least partially the change could be attributed to the migration fromplan-driven to agile development.
The ability to make inferences in study S3 could be negatively influenced if theinstrument for data collection (interview) is not able to capture the change due to themigration. This threat has been reduced by explicitly asking for the situation beforeand after migration, and has been documented through citing the statements made bythe interviewees which explicitly contained the inferences made in the presentation ofthe case study. In study S5 statistical analysis was used to determine whether lead-timevaries with regard to phase, system impact, and size. The inference to a populationis limited as the data is not drawn from a random sample. Hence, the context wascarefully described as companies in a similar context (large-scale development, parallelsystem development, and incremental deliveries to system test) are more likely to makesimilar observations.
Overall, the analysis of the threats to validity shows that throughout the studiesincluded in the thesis actions have been taken to minimize the threats. Further detailsabout the threats in the context of the individual studies is provided within the chapters.
1.6 ResultsTable 1.7 summarizes the results of the individual studies. The table shows the sub-contributions of the individual study/chapter and shortly provides a description of themain result. The results of studies S2 to S5 are linked to Contribution I and the resultsof studies S6 to S8 to Contribution II. The descriptions of the study results provideanswers to the research questions linked to the individual chapters (see Figure 1.2).
In the very first study (S1) the lean and agile development paradigms evaluated
23
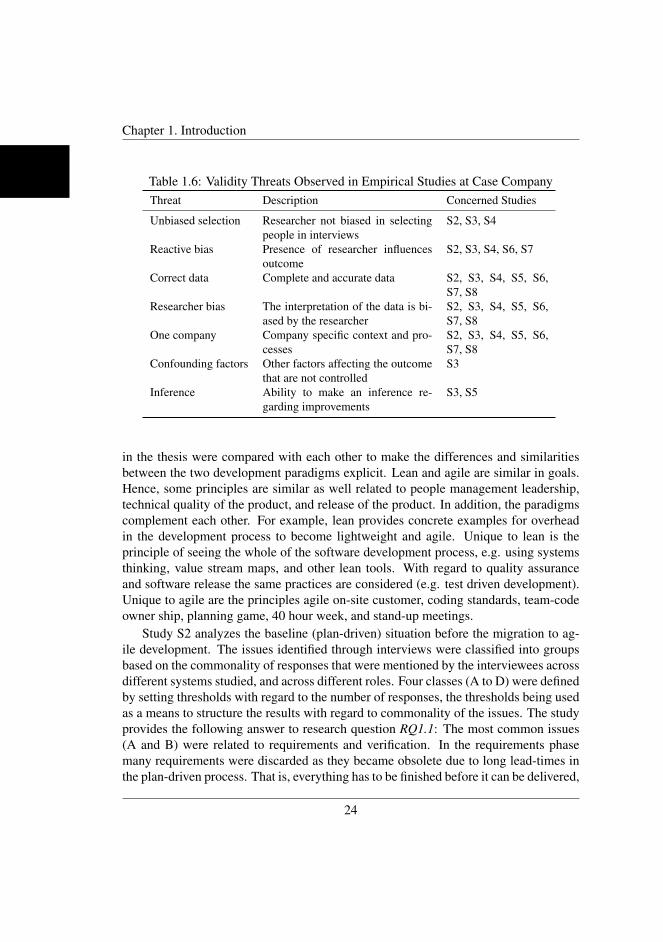
Chapter 1. Introduction
Table 1.6: Validity Threats Observed in Empirical Studies at Case CompanyThreat Description Concerned Studies
Unbiased selection Researcher not biased in selectingpeople in interviews
S2, S3, S4
Reactive bias Presence of researcher influencesoutcome
S2, S3, S4, S6, S7
Correct data Complete and accurate data S2, S3, S4, S5, S6,S7, S8
Researcher bias The interpretation of the data is bi-ased by the researcher
S2, S3, S4, S5, S6,S7, S8
One company Company specific context and pro-cesses
S2, S3, S4, S5, S6,S7, S8
Confounding factors Other factors affecting the outcomethat are not controlled
S3
Inference Ability to make an inference re-garding improvements
S3, S5
in the thesis were compared with each other to make the differences and similaritiesbetween the two development paradigms explicit. Lean and agile are similar in goals.Hence, some principles are similar as well related to people management leadership,technical quality of the product, and release of the product. In addition, the paradigmscomplement each other. For example, lean provides concrete examples for overheadin the development process to become lightweight and agile. Unique to lean is theprinciple of seeing the whole of the software development process, e.g. using systemsthinking, value stream maps, and other lean tools. With regard to quality assuranceand software release the same practices are considered (e.g. test driven development).Unique to agile are the principles agile on-site customer, coding standards, team-codeowner ship, planning game, 40 hour week, and stand-up meetings.
Study S2 analyzes the baseline (plan-driven) situation before the migration to ag-ile development. The issues identified through interviews were classified into groupsbased on the commonality of responses that were mentioned by the interviewees acrossdifferent systems studied, and across different roles. Four classes (A to D) were definedby setting thresholds with regard to the number of responses, the thresholds being usedas a means to structure the results with regard to commonality of the issues. The studyprovides the following answer to research question RQ1.1: The most common issues(A and B) were related to requirements and verification. In the requirements phasemany requirements were discarded as they became obsolete due to long lead-times inthe plan-driven process. That is, everything has to be finished before it can be delivered,
24
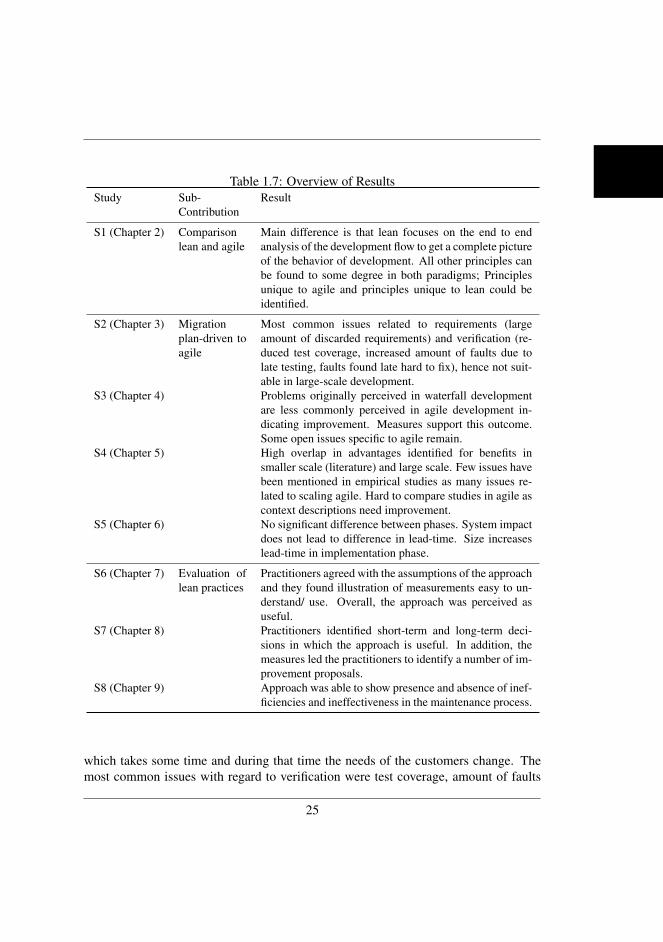
Table 1.7: Overview of ResultsStudy Sub-
ContributionResult
S1 (Chapter 2) Comparisonlean and agile
Main difference is that lean focuses on the end to endanalysis of the development flow to get a complete pictureof the behavior of development. All other principles canbe found to some degree in both paradigms; Principlesunique to agile and principles unique to lean could beidentified.
S2 (Chapter 3) Migrationplan-driven toagile
Most common issues related to requirements (largeamount of discarded requirements) and verification (re-duced test coverage, increased amount of faults due tolate testing, faults found late hard to fix), hence not suit-able in large-scale development.
S3 (Chapter 4) Problems originally perceived in waterfall developmentare less commonly perceived in agile development in-dicating improvement. Measures support this outcome.Some open issues specific to agile remain.
S4 (Chapter 5) High overlap in advantages identified for benefits insmaller scale (literature) and large scale. Few issues havebeen mentioned in empirical studies as many issues re-lated to scaling agile. Hard to compare studies in agile ascontext descriptions need improvement.
S5 (Chapter 6) No significant difference between phases. System impactdoes not lead to difference in lead-time. Size increaseslead-time in implementation phase.
S6 (Chapter 7) Evaluation oflean practices
Practitioners agreed with the assumptions of the approachand they found illustration of measurements easy to un-derstand/ use. Overall, the approach was perceived asuseful.
S7 (Chapter 8) Practitioners identified short-term and long-term deci-sions in which the approach is useful. In addition, themeasures led the practitioners to identify a number of im-provement proposals.
S8 (Chapter 9) Approach was able to show presence and absence of inef-ficiencies and ineffectiveness in the maintenance process.
which takes some time and during that time the needs of the customers change. Themost common issues with regard to verification were test coverage, amount of faults
25
Chapter 1. Introduction
increase with late testing, and faults found in the process are hard to fix. All issuesclassified as A and B were mentioned in literature supporting the generalizability ofthe results. Hence, overall the study confirms the findings in literature, while addingsome new, but less commonly perceived issues, as described in S2. The conclusion wasthat the waterfall approach was not suitable in the studied context. Hence, the studysupports the decision made by the company to change towards a more agile process.
Study S3 compares the plan-driven situation (from S2) with the situation after mi-gration to agile development. In research question RQ1.2 we asked for the perceivedissues before and after the migration. The most common issues before the migrationare presented in S2 and S3. The most common issues remaining after the migration forthe agile situation were:
• Test cycle planning prolong lead-times in case of a rejection of an incrementby the test, or if an increment is delivered too late (increment has to wait forcompletion of the following test cycle);
• Reduction of test coverage due to lack of independent verification and validationand short projects putting time pressure on teams; (3) people concerned with therelease are not involved early in the process;
• Project management overhead due to high number of teams (much coordinationand communication).
The benefits of the migration were:
• More stable requirements led to less rework and reduced waste in the require-ments phase; (2) estimations are more precise;
• Early fault detection allows to get feedback from test early on;
• The lead-time for testing was reduced;
• Moving people together reduced the amount of documentation needed as directcommunication could replace documentation.
Given the results we can answer research question RQ1.3 by saying that the problemsreported in S2 with regard to requirements and verification are not perceived as thatcommon anymore after the change, the exact ratings of the commonalities being statedwithin the Chapters presenting S2 and S3. The measurements, which were based ona closed data source and were used for the purpose of triangulation, supported thequalitative results. Overall this is already a positive result as the introduction of thenew practices had been done quite recently at the time the case study was conducted.
26
In study S4 an in-depth investigation of the situation after migration is conducted.For that purpose the thresholds with regard of how often an issue (or advantage) hasbeen mentioned is reduced to gain a more in-depth understanding of the new situation,the results of the study answering research question RQ1.4. Additional issues to thoseidentified in study S3 were:
• Handover from requirements to implementation takes time due to complex deci-sion processes;
• The requirements priority list used is essential in for company’s model to workand is hard to create and maintain;
• Design has free capacity due to long lead-times as in requirements engineeringcomplex decision making takes place (though as shown in previous study this isless severe);
• Too much documentation in testing, but less severe;
• Many releases on the market mean many different versions of the system thatneeds to be supported which might increase maintenance effort;
• Configuration management requires high effort to coordinate the high number ofinternal releases;
• The development of the configuration environment to select features for cus-tomizing solutions takes a long time;
• Product packaging effort is increased as it is still viewed from a technical pointof view, but not from a commercial point of view;
• Dependencies rooted in implementation details are hard to identify and not cov-ered in the anatomy plan.
Additional benefits were:
• Time of testers used more efficiently as testing and design can be easily paral-lelized due to short ways of communication;
• Higher transparency of who is responsible for developing increments, this gen-erating incentives for delivering quality.
With regard to the comparison with related work we found that existing empirical stud-ies and study S4 agreed on the advantages that could be achieved with agile software
27
Chapter 1. Introduction
development. However, some new issues have been identified that need to be addressedto fully leverage on the benefits of agile software development.
Study S5 set out to investigate effects of different attributes related to requirementson lead-time (difference between phases, difference with regard to the number of sys-tems affected, and difference with regard to size). The following answers for researchquestion RQ1.5 were obtained:
• No significant difference between lead-times of phases could be establishedbased on statistical tests (i.e. no specific time intensive activity);
• No difference between requirements affecting one or multiple systems, whichwas considered a surprising result;
• Large requirements have a tendency of increased lead-time in the implementationphase, but not in other phases.
In order to further improve the lead-time situation observed in study S5 lean tools areproposed to identify and remove wastes in the development process, which leads to theresults of Contribution II of this thesis (see Table 1.7).
Study S6 presents a novel approach called software process improvement throughthe lean measurement (SPI-LEAM) method. SPI-LEAM evaluates how well an overallsoftware process performs considering the work in process in comparison to capacity.The approach facilitates a combined analysis of different dimensions of the softwareprocess (such as main product development, software testing, software maintenance,and so forth). The dynamic validation conducted with practitioners showed that theoverall approach was perceived positively, and that the practitioners agreed with theunderlying assumptions of the approach, e.g. that the work-load should be below ca-pacity as this allows for a continuous flow of development (research question RQ2.1).At the same time being below capacity provides flexibility in case of required mainte-nance or other high priority tasks emerging.
The previous study (S6) analyzed the overall process. When undesired behavior isdiscovered (e.g. in particular dimension of the process) it might be necessary to takea closer look at these dimensions. Study S7 proposes a visualization of the flow of re-quirements through development in combination with a set of measures. The measuresallow for the discovery of bottlenecks, discontinuous work flow, and the discovery ofwaste in forms of discarded requirements. The approach was evaluated by practitionersusing the approach and then reflecting upon it. The findings were that:
• Requirements prioritization is supported;
• The measures aid in allocating staff;
28
• The measures provide transparency for teams and project managers of what workis to be done in the future and what has been completed;
• Software process improvement drivers can use the measures as indicators toidentify problems and achieve improvements from a long-term perspective.
In addition we evaluated what improvement actions practitioners identified based onthe measurements. The identified improvements were:
• An increased focus on continuous development by limiting the allowed numberof requirements in inventories;
• Earlier and more frequent integration and system testing of the software systemto increase quality.
The case study showed that the visualization and measures are perceived as valuablefrom an industrial perspective and that the practitioners could identify improvementactions (research question RQ2.2).
Study S8 proposed lean measures and visualizations specifically tailored towardsthe needs of software maintenance. Individual visualizations and measures were pro-posed for the inflow of maintenance requests, flow of requests for maintenance tasksthroughout the maintenance process, lead-times, and work-load. The approach hasbeen applied to an industrial case for one system and it was demonstrated that the pres-ence or absence of inefficiencies and ineffectiveness in the maintenance process couldbe identified (research question RQ2.3). The major improvement potential identifiedwas the reduction of waiting times and the need for a more continuous work-flow insome phases of the maintenance process.
1.7 SynthesisThe synthesis draws together the obtained results in order to provide answers to themain research questions asked in this thesis.
• QI.I: Are agile practices useful in an industrial context? In the study investigat-ing the baseline (plan-driven development) it was shown that many critical issueswere identified, making the need for more agility and flexibility explicit (S2).The need is further strengthened by the fact that the company decided to movetowards agile practices across all its development sites. With the introduction ofagile practices we have shown that the practitioners perceived the migration pos-itively, mentioning multiple advantages. At the same time major issues that were
29
Chapter 1. Introduction
commonly perceived for the plan-driven approach are less commonly perceivedin the new process (S3). Finally, study S4 adds further advantages when look-ing at the process in detail, as presented in the previous section (Results). Thequantitative data, though facing validity threats of a closed data source, supportsthe qualitative results, which further strengthens the qualitative result from theinterviews. In addition it has to be considered that the migration was done quiterecently and for that considerable improvements have already been achieved.Hence, the answer to the first research question is that agile practices appear tobe useful in a large-scale industrial context.
• QI.II: What challenges and open issues arise with the introduction of agile prac-tices? Though, the result showed improvement there is still potential to furtherimprove the new situation after migration as open issues have been identified.The most critical open issues were reported in study S3 investigating the effectof the migration, namely long lead-times due to test cycle planning, reduction oftest coverage, release planning involved too late in the process, and overhead dueto coordination needs. Further open issues have been identified in study S4. Instudy S5 lead-times were analyzed showing no difference in lead-times betweenphases, and no differences between requirements affecting one system and sev-eral systems. Based on the lead-time analysis the company seeks to achievefurther improvements. This leads to the next question concerning lean practices,which have shown major improvements in lead-time reduction and value creationfor customers in the manufacturing and product development domain.
• QII: Are lean practices useful in the analysis and further improvement of ag-ile software development? The lean approaches proposed in this thesis havebeen evaluated using practitioner feedback and the reflection of the practition-ers when using them. The approaches were perceived useful, this is true forthe SPI-LEAM solution, but also for the solutions of analyzing main productdevelopment and the maintenance process. SPI-LEAM is able to integrate thedifferent dimensions of the process. However, the individual solutions presentedin studies S6 and S8 were also perceived as valuable stand-alone, meaning thatSPI-LEAM (S6) is not a pre-requisite for the solutions presented in S7 and S8to be useful. In addition, the usefulness of the approaches is supported by thefact that the company is adopting them, and in particular is using the solutionpresented in S7 continuously. Now that the lean practices have been used foralmost a year it can also be said that they are a driver for improvements, e.g. theimplementation of Kanban principles (see Chapter 2 for a description) and otherimprovements. In consequence, the answer to this research question is that leanpractices are useful in further improving agile processes.
30
1.8 ConclusionsIn this thesis two contributions are made, namely the usefulness of the implementationof agile software development (Contribution I) and the added benefit of using leanpractices on top of that (Contribution II).
In order to determine the usefulness of agile practices (Contribution I) a series offour studies was used. In the first study the baseline situation was analyzed (i.e. theplan-driven situation). Thereafter, the effect of moving from the plan-driven to anagile process was investigated. Finally, an in-depth analysis of the new situation wasdescribed. In addition an analysis of lead-times in the situation after the migration hasbeen conducted.
With regard to the lean practices the goal was to determine if they have some addedvalue to agile practices (Contribution II). Therefore, novel approaches strongly inspiredby lean thinking as presented in the context of lean manufacturing and product develop-ment were proposed. The first approach (referred to as software process improvementthrough the lean measurement method, short SPI-LEAM) analyzes the capacity of theprocess in comparison to the workload in order to avoid overload situations and withthat realize a smooth flow of development. The solution is multi-dimensional in that itintegrates different dimensions of the process (such as main product development, soft-ware maintenance, software testing, and so forth). When observing undesired behaviorwith SPI-LEAM in specific dimensions a drill-down analysis should be possible to un-derstand the problem in more detail. Therefore, lean approaches for the main productdevelopment flow of requirements and for software maintenance have been proposed.
To build a bridge between the agile and lean software development a chapter on thedifference between these two development approaches has been included.
The evaluation of the agile practices has been done through a series of three indus-trial case studies. All case studies have been conducted at Ericsson AB. The outcomeof the case studies showed that the migration from plan-driven development to agiledevelopment is beneficial as improvements in several areas (primarily requirementsengineering, and verification) could be achieved. Furthermore, open issues and chal-lenges have been identified that have to be addressed in order to fully leverage on thebenefits that agile practices can provide.
The evaluation of the lean practices showed that they were generally perceivedas useful by the practitioners. In addition, the lean practices aided the practitionersin identifying improvements, and they also identified concrete decisions in which thelean practices provide valuable support. The feedback by the practitioners was basedon their experience when using the approaches.
With regard to future work further studies are needed on agile software develop-ment in general, and with a focus on large-scale software development in particular.
31
REFERENCES
Furthermore, more mature agile implementations need to be studied to understand thelong-term effects in terms of benefits and challenges that come with their introduction.With regard to lean future work is needed to evaluate the lean practices and solutionsproposed in this thesis in different contexts. As with agile the long-term effect of usinglean practices needs to be investigated. Only a sub-set of lean tools has been proposedin this thesis, but there are others as well (e.g. value-stream maps). Hence, a compar-ison of different lean tools would be beneficial to support in the selection of the mostsuitable approaches.
1.9 References[1] Ahmed Al-Emran, Puneet Kapur, Dietmar Pfahl, and Gunther Ruhe. Simulating
worst case scenarios and analyzing their combined effect in operational releaseplanning. In Proceedings of the International Conference on Software Process(ICSP 2008), pages 269–281, 2008.
[2] Sebastian Barney, Aybuke Aurum, and Claes Wohlin. Software product quality:ensuring a common goals. In Proceedings of the International Conference onSoftware Process (ICSP 2009), pages 256-267, 2009.
[3] Kent Beck. Extreme Programming explained: embrace change. Addison-Wesley,Reading, Mass., 2000.
[4] Stefan Biffl, Aybuke Aurum, Barry Boehm, Hakan Erdogmus, Paul Grunbacher.Value-based software engineering. Springer, Heidelberg, 2005.
[5] Christian D. Buckley, Darran W. Pusipher, and Kandell Scott. Implementing IBMrational clearQuest: an end-to-end deployment guide. IBM Press, 2000.
[6] Alan M. Davis, Oscar Dieste Tubıo, Ann M. Hickey, Natalia Juristo Juzgado,and Ana Marıa Moreno. Effectiveness of requirements elicitation techniques:empirical results derived from a systematic review. In Proceedings of the 14thIEEE International Conference on Requirements Engineering (RE 2006), pages176–185, 2006.
[7] Paolo Donzelli and Giuseppe Iazeolla. A hybrid software process simulationmodel. Software Process: Improvement and Practice, 6(2):97–109, 2001.
[8] Tore Dyba and Torgeir Dingsøyr. Empirical studies of agile software develop-ment: A systematic review. Information & Software Technology, 50(9-10):833–859, 2008.
32
[9] Floyd J. Jr. Fowler. Improving survey questions: design and evaluation. SagePublications, Thousand Oaks, California, 1995.
[10] Tony Gorschek, Ewan Tempero, and Lefteris Angelis. A large-scale empiricalstudy of practitioners’ use of object-oriented concepts. In Proceedings of theProceedings of the 32nd ACM/IEEE International Conference on Software Engi-neering (ICSE 2010), 2010.
[11] Tony Gorschek and Claes Wohlin. Requirements abstraction model. Requir. Eng.,11(1):79–101, 2006.
[12] Michael Hirsch. Moving from a plan driven culture to agile development. InProceedings of the 27th International Conference on Software Engineering (ICSE2005), page 38, 2005.
[13] Martin Host, Bjorn Regnell, Johan Natt och Dag, Josef Nedstam, and Chris-tian Nyberg. Exploring bottlenecks in market-driven requirements managementprocesses with discrete event simulation. Journal of Systems and Software,59(3):323–332, 2001.
[14] Elizabeth Hull, Ken Jackson, and Jeremy Dick. Requirements engineering.Springer, London, 2005.
[15] George Stalk Jr. Time - the next source of competitive advantage. HarvardBusiness Review, 66(4), 1988.
[16] Philippe Kruchten. The rational unified process: an introduction. Addison-Wesley, Boston, 2004.
[17] Craig Larman. Agile and iterative Development: a manager’s guide. PearsonEducation, 2003.
[18] Ronald C. Martella, Ronald Nelson, and Nancy E. Marchand-Martella. Researchmethods : learning to become a critical research consumer. Allyn & Bacon,Boston, 1999.
[19] Peter Middleton. Lean software development: two case studies. Software QualityJournal, 9(4):241–252, 2001.
[20] Peter Middleton, Amy Flaxel, and Ammon Cookson. Lean software managementcase study: Timberline inc. In Proceedings of the 6th International Conference onExtreme Programming and Agile Processes in Software Engineering (XP 2005),pages 1–9, 2005.
33
REFERENCES
[21] James M. Morgan and Jeffrey K. Liker. The Toyota product development system:integrating people, process, and technology. Productivity Press, New York, 2006.
[22] Kai Petersen and Claes Wohlin. Context in industrial software engineering re-search. In Proceedings of the 3rd International Symposium on Empirical SoftwareEngineering and Measurement (ESEM 2009), pages 401–404, 2009.
[23] Mary Poppendieck and Tom Poppendieck. Lean software development: an agiletoolkit. Addison-Wesley, Boston, 2003.
[24] Mary Poppendieck and Tom Poppendieck. Implementing lean software develop-ment: from concept to cash. Addison-Wesley, 2007.
[25] Mary Poppendieck and Tom Poppendieck. Leading lean software development:results are not the point. Addison-Wesley, Upper Saddle River, NJ, 2010.
[26] Colin Robson. Real world research: a resource for social scientists andpractitioner-researchers. Blackwell, Oxford, 2002.
[27] Jorge L. Romeu. A simulation approach for the analysis and forecast of softwareproductivity. Computers and Industrial Engineering, 9(2):165–174, 1985.
[28] Walter Royce. Managing the development of large software systems: Conceptsand techniques. In Proc. IEEE WESCOM. IEEE Computer Society Press, 1970.
[29] Per Runeson and Martin Host. Guidelines for conducting and reporting case studyresearch in software engineering. Empirical Software Engineering, 14(2):131–164, 2009.
[30] Viktor Schuppan and Winfried Rußwurm. A CMM-based evaluation of the V-model 97. In Proceedings of the 7th European Workshop on Software ProcessTechnology (EWSPT 2000), pages 69–83, 2000.
[31] Ken Schwaber. Agile project management with Scrum. Microsoft Press, Red-mond, Wash., 2004.
[32] Forrest Shull, Janice. Singer, and Dag I. K. Sjøberg. Guide to advanced empiricalsoftware engineering. Springer-Verlag London Limited, London, 2008.
[33] Bridget Somekh. Action research: a methodology for change and development.Open University Press, Maidenhead, 2006.
34
[34] Glen L. Urban, Theresa Carter, Steven Gaskin, and Zofia Mucha. Market sharerewards to pioneering brands: an empirical analysis and strategic implications.Management Science, 32(6):645–659, 1986.
[35] Brian White. Software configuration management strategies and RationalClearCase: a practical introduction. Addison-Wesley, Harlow, 2000.
[36] Claes Wohlin, Per Runeson, Martin Host, Magnus C. Ohlsson, Bjorn Regnell,and Anders Wesslen. Experimentation in software engineering: an introduction(international series in software engineering). Springer, 2000.
[37] James P. Womack, Daniel T. Jones, and Daniel Roos. The machine that changedthe world: how lean production revolutionized the global car wars. Simon &Schuster, London, 2007.
[38] Robert K. Yin. Case study research: design and methods. Sage Publications, 3ed. edition, 2003.
35
REFERENCES
36
Chapter 2
Is Lean Agile and Agile Lean?A Comparison between TwoSoftware DevelopmentParadigms
Kai PetersenTo appear in Book Modern Software Engineering Concepts andPractices: Advanced Approaches, IGI Global
2.1 IntroductionThe nature of software development has changed in recent years. Today, software isincluded in a vast amount of products, such as cars, mobile phones, entertainment andso forth. The markets for these products are characterized as highly dynamic and withfrequent changes in the needs of the customers. As a consequence, companies have torespond rapidly to changes in needs requiring them to be very flexible.
Due to this development, agile methods have emerged. In essence agile methods arelight-weight in nature, work with short feedback and development cycles, and involvethe customer tightly in the software development process. The main principles that
37
Chapter 2. Is Lean Agile and Agile Lean? A Comparison between Two SoftwareDevelopment Paradigms
guided the development of different agile practices such as eXtreme programming [3]and SCRUM [28] are summarized in the agile manifesto [9]. As shown in a systematicreview by Dyb and Dingsyr [8] agile has received much attention from the researchcommunity.
While agile became more and more popular lean software development has emergedwith the publication of the book [24], which proposes ways of how practices from leanmanufacturing could be applied in the software engineering context. Lean has a verystrong focus on removing waste from the development process, i.e. everything thatdoes not contribute to the customer value. Furthermore, according to lean the devel-opment process should only be looked at from an end-to-end perspective to avoid sub-optimization. The aim is to have similar success with lean in software development aswas the case in manufacturing. That is, delivering what the customer really needs in avery short time.
Both development paradigms (agile and lean) seem similar in their goal of focusingon the customers and responding to their needs in a rapid manner. Though, it is not wellunderstood what distinguishes both paradigms from each other. In order to make thebest use of both paradigms it is important to understand differences and similarities fortwo main reasons:
• Research results from principles, practices, and processes shared by both paradigmsare beneficial to understand the usefulness of both paradigms. This aids in gener-alizing and aggregating research results to determine the benefits and limitationsof lean as well as agile at the same time.
• The understanding of the differences shows opportunities of how both paradigmscan complement each other. For instance, if one principle of lean is not appliedin agile it might be a valuable addition.
The comparison is based on the general descriptions of the paradigms. In particular,this chapter makes the following contributions:
• Aggregation of lean and agile principles and an explicit mapping of principles topractices.
• A comparison showing the overlap and differences between principles regardingdifferent aspects of the paradigms.
• A linkage of the practices to the principles of each paradigm, as well as an inves-tigation whether the practices are considered part of either lean or agile, or bothof the paradigms.
38
The remainder of the chapter is structured as follows: Section 2 presents back-ground on lean and agile software development. Section 3 compares the paradigmswith respect to goals, principles, practices, and processes. Section 4 discusses the find-ings focusing on the implications on industry and academia. Section 5 concludes thechapter.
2.2 BackgroundPlan-driven software development is focused on heavy documentation and the sequen-tial execution of software development activities. The best known plan-driven develop-ment model is the waterfall model introduced by Royce in the 1970s [27]. His intentionwas to provide some structure for software development activities. As markets becamemore dynamic companies needed to be able to react to changes quickly. However, thewaterfall model was built upon the assumption that requirements are relatively stable.For example, the long lead-times in waterfall projects lead to a high amount of require-ments being discarded as the requirements became obsolete due to changes in the needsof the customers. Another problem is the reduction of test coverage due to big-bangintegration and late testing. Testing often has to be compromised as delays in earlierphases (e.g. implementation and design) lead to less time for testing in the end of theproject.
In response to the issues related to plan-driven approaches agile software devel-opment emerged in the late 1990s and early 2000s. Agile software development isdifferent from plan-driven development in many ways. For example, a plan-drivenproject contains detailed planning of the time-line with clearly defined products anddocumentation to be delivered while agile focuses on a high-level plan for the over-all product development life-cycle with detailed plans only for the current iterations.Another difference is the way requirements are specified. That is, in plan-driven devel-opment there is a clearly defined specification phase where the complete requirementsspecification is created, the specification representing the contract. Hence, a changein requirements is a formal and work intensive process. On the other hand, agile wel-comes changing requirements leading to continuous evolution. Consequently, changerequests are handled through a more relaxed change request process. With regard toother activities (such as programming and testing) waterfall development concentratedthese activities on one specific phase of development, while in agile development theactivities are conducted throughout the overall development life-cycle [11]. The mostprominent descriptions of agile software development process are eXtreme Program-ming (XP) [3] and SCRUM [28]. Each of these processes contains a high-level descrip-tion of the work-flow and a set of agile software development practices. A mapping of
39
Chapter 2. Is Lean Agile and Agile Lean? A Comparison between Two SoftwareDevelopment Paradigms
the practices and a description of the work-flows of different agile processes (includingeXtreme Programming and SCRUM) can be found in [15] and [16].
Lean software development is inspired by ideas that have been used in the contextof manufacturing and product development. Lean manufacturing led to tremendousperformance improvement in the context of manufacturing cars at Toyota, the approachbeing referred to as the Toyota Production System. The lean manufacturing approachallowed delivering high quality products with fewer resources and in shorter time. Theimprovements were achieved by continuously improving processes through a system-atic analysis focusing on waste identification; waste being everything that does notcontribute to customer value. The ideas of lean manufacturing were put forward in thebook The Machine that Changed the World (cf. [31]). In lean manufacturing the mainfocus was on optimizing the shop floor. Car manufacturers today have implementedthe lean principles in their shop floors, i.e. the use of lean manufacturing does not leadto a competitive advantage anymore. Hence, to achieve further improvements the ideasbehind lean have been extended to the overall product development life-cycle and thewhole research & development organization. This includes the disciplines purchasing,sales and marketing, product planning, people management, and so forth. This view ismore relevant for software development than the pure manufacturing view as in soft-ware engineering the overall development cycle should be in focus when improvingsoftware processes. The extensions to incorporate the whole of product developmentare known as the Toyota Product Development System (cf. [19]). The Poppendieckstranslated the lean principles and practices known from manufacturing and product de-velopment to software engineering. Mary Poppendick stated that they were motivatedto translate the practices when she heard about the waterfall model of software develop-ment, believing that software development would largely benefit from lean principlesand practices, which helped product development in creating a flexible organization.The references from Mary and Tom Poppendieck (cf. [24, 25, 26]) are the main sourcesof how to interpret lean practices in the context of developing software. Hence, theirbooks are used as the main sources for the identification of goals, principles, practices,and processes of lean software development. In comparison to agile, there are veryfew studies with an explicit focus on lean software development. The lack of empiricalevidence for lean software development means that the comparison is focused on thegeneric descriptions provided in books.
2.3 ComparisonIn this section the goals, principles, practices, and processes of the development paradigmsare described and compared. The comparison focuses on different facets of the paradigms,
40

namely goals, principles, practices, and processes.
• Goals state what should be achieved by the paradigm. Hence, they present therationale for why the principles, practices, and processes should be applied. Inother words, goals represent the “why” (Subsection 2.1).
• Principles are rules that should be followed while using the paradigms. A ruleof agile, for example, says that one should achieve technical excellence. Rulesrepresent the “What” (Subsection 2.2).
• Practices are the implementation of the principles. For example, in order toimplement technical excellence eXtreme programming uses pair programmingto reduce the number of faults introduced into the code due to the continuouspeer review process. Practices represent the “How” (Subsection 2.3).
• Processes describe the workflow and artifacts produced. That means the processis a representation of “when” an activity is done, and in which order (Subsection2.4).
Each of the subsections of the comparison follows a similar pattern. First, thegoals/principles/practices are introduced and thereafter the comparison is made.
2.3.1 GoalsDescription of Goals
Goals describe why we should care about agile and lean; they provide a rational forsoftware companies to adapt the paradigms. The following goals are identified foragile and lean:
• Goal agile: Agile (in comparison to traditional approaches such as plan-drivendevelopment) has the goal of delivering working software continuously that canbe demonstrated to the customers to illustrate the latest status checking whetherthe software fulfills the customers’ needs. Thus, the customers can provide feed-back early and by that make sure that a product fulfills the needs of the customers.The goal becomes clear from the statement that working software is the primarymeasure of progress that should be delivered on regular bases in short cycles[9, 3, 15, 16].
• Goal lean: The goal of lean software development focuses on creating value forthe customer rapidly and not spending time on activities that do not create value[24]. Value in this case has to be seen through the glasses of the customer [19].
41
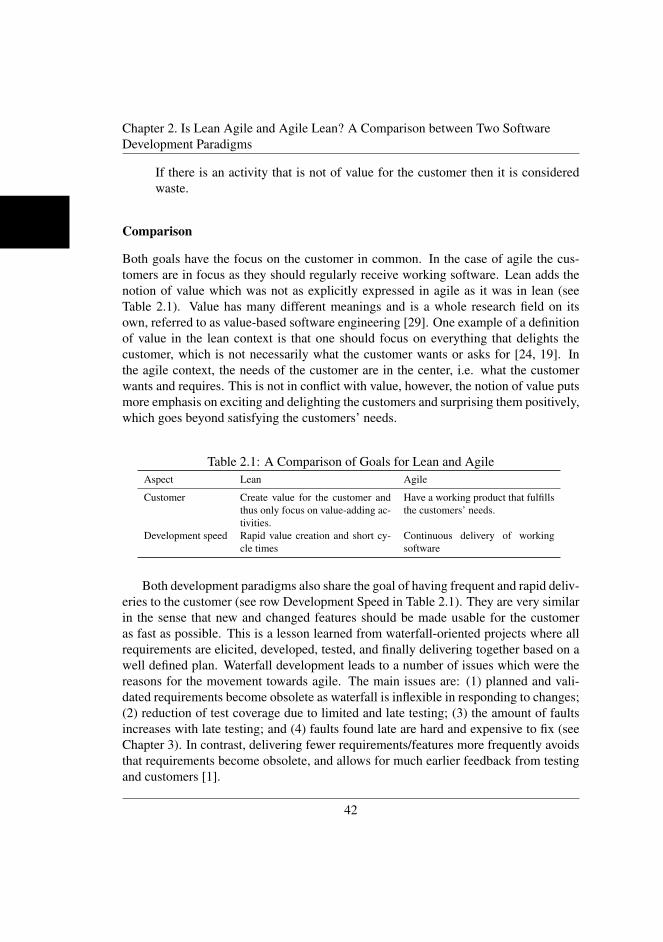
Chapter 2. Is Lean Agile and Agile Lean? A Comparison between Two SoftwareDevelopment Paradigms
If there is an activity that is not of value for the customer then it is consideredwaste.
Comparison
Both goals have the focus on the customer in common. In the case of agile the cus-tomers are in focus as they should regularly receive working software. Lean adds thenotion of value which was not as explicitly expressed in agile as it was in lean (seeTable 2.1). Value has many different meanings and is a whole research field on itsown, referred to as value-based software engineering [29]. One example of a definitionof value in the lean context is that one should focus on everything that delights thecustomer, which is not necessarily what the customer wants or asks for [24, 19]. Inthe agile context, the needs of the customer are in the center, i.e. what the customerwants and requires. This is not in conflict with value, however, the notion of value putsmore emphasis on exciting and delighting the customers and surprising them positively,which goes beyond satisfying the customers’ needs.
Table 2.1: A Comparison of Goals for Lean and AgileAspect Lean Agile
Customer Create value for the customer andthus only focus on value-adding ac-tivities.
Have a working product that fulfillsthe customers’ needs.
Development speed Rapid value creation and short cy-cle times
Continuous delivery of workingsoftware
Both development paradigms also share the goal of having frequent and rapid deliv-eries to the customer (see row Development Speed in Table 2.1). They are very similarin the sense that new and changed features should be made usable for the customeras fast as possible. This is a lesson learned from waterfall-oriented projects where allrequirements are elicited, developed, tested, and finally delivering together based on awell defined plan. Waterfall development leads to a number of issues which were thereasons for the movement towards agile. The main issues are: (1) planned and vali-dated requirements become obsolete as waterfall is inflexible in responding to changes;(2) reduction of test coverage due to limited and late testing; (3) the amount of faultsincreases with late testing; and (4) faults found late are hard and expensive to fix (seeChapter 3). In contrast, delivering fewer requirements/features more frequently avoidsthat requirements become obsolete, and allows for much earlier feedback from testingand customers [1].
42
The goals that we identified drive the principles by which lean and agile work. Theprinciples of both development paradigms are analyzed in the following section.
2.3.2 Principles
Description of Principles
The principles constitute the rules that, according to the general descriptions of themethods, should be followed to achieve the goals (see Section 2.1). The principles foragile and lean are explicitly defined for both paradigms. The agile manifesto statesfour values and twelve related principles of agile development. In the lean contextseven principles have been defined. For each principle we assigned a unique ID whicheases the mapping and comparison between lean and agile, and also to make it easier toconnect the principles to the practices implementing them. The following four valuesare presented in the agile manifesto [9]:
• V1: Individuals and interactions over processes and tools.
• V2: Working software over comprehensive documentation.
• V3: Customer collaboration over contract negotiation.
• V4: Responding to change over following a plan.
The agile manifesto states that the statements on the left have a higher value thanthe ones on the right. For example, agile does not say that there is no value in pro-cesses. However, as Koch [15] points out processes can be harmful if they are misusedand hinder people in working together, drain people’s enthusiasm and excitement, andrequire more investment in maintaining them than they help in working more effec-tively and efficiently. The 12 principles are based on the values and can be related tothem. For each of the principles (AP01 to AP12) we state to which value the principlerelates (cf. [9]).
• AP01: Customer satisfaction: The satisfaction of the customer should have thehighest priority. To achieve this, software needs to be delivered early and contin-uously (i.e. software fulfilling the customer needs as stated in the goals). (V3)
• AP02: Welcome change: Changes should be welcomed by software developers,no matter if they come in early or late. The ability to react to late changes is seenas a competitive advantage. (V4)
43
Chapter 2. Is Lean Agile and Agile Lean? A Comparison between Two SoftwareDevelopment Paradigms
• AP03: Frequent deliveries: Working software should be delivered frequently tothe customer. Deliveries should happen within a couple of months or weeks. Themanifesto stresses that preference should be given to the shorter time-scale. (V2)
• AP04: Work together: Developers (i.e. technicians) and business people (i.e.product managers, administration, management, etc.) are required to work to-gether on a daily basis throughout projects. (V2)
• AP05: Motivated individuals: Motivated individuals are a prerequisite for suc-cessful projects and hence projects should be built around them. Building projectsaround them means to provide them with environments (e.g. tools and workspace)and to support them (e.g. project managers could help in avoiding unnecessaryproject disturbances). Furthermore, the project teams should be trusted to besuccessful in achieving the project goals. (V1)
• AP06: Face-to-face conversation: Face-to-face communication is seen as themost efficient way of exchanging information (e.g. in comparison to e-mail andtelephone conversation). This is true within a development team, but also be-tween teams and other relevant stakeholders of the project. (V1)
• AP07: Working software: The progress of software development should be mea-sured through working software. Hence, working software is more importantthan detailed documentation, as was expressed in the second value of agile soft-ware development (V2).
• AP08: Sustainable pace: Everyone involved in the project (developers, softwareusers, sponsors, managers, etc.) should be able to work indefinitely in a contin-uous pace. A process supporting the achievement of sustainable pace is referredto as sustainable development. (V1)
• AP09: Technical excellence: Agile requires discipline in focusing on technicalexcellence and good design. Having a high quality product and a good designallows for easy maintenance and change, making a project more agile. (V2)
• AP10: Simplicity: The agile manifesto defines simplicity as “the art of maximiz-ing the amount of work not done - and is essential”. (V4)
• AP11: Self-organizing teams: Teams organizing themselves (e.g. picking theirown tasks, and taking responsibility for completing the tasks) leads to the bestrequirements, architectures, and designs. (V1)
44
• AP12: Continuous reflection: Teams should reflect on their work continuouslyand think about how to become more efficient. Improvements should be imple-mented according to the discoveries made during the reflection. (V4)
Lean is based on seven principles, which are explained in more detail as they arenot as self-contained as the ones presented for the agile manifesto.
• LP01: Eliminate waste: Waste in lean is everything that does not contribute tothe value for the customer, i.e. everything that does not help to fulfill the needs ofthe customer or does delight the customer. Seven types of waste were identifiedin manufacturing and mapped to software development (see Table 2.2). The leftcolumn of the table describes the wastes in manufacturing and the right columnthe corresponding wastes in software engineering (cf. [24]). Each waste relatedto software development has an ID which is used to reference the wastes in thetext. The wastes slow down the development flow and thus should be removedto speed up value creation.
• LP02: Amplify learning: Software development is a knowledge-intensive pro-cess where learning happens during the whole development lifecycle and needsto be amplified. Learning includes getting a better understanding of the cus-tomer needs, potential solutions for architecture, good testing strategies, and soforth. Thus, the processes and practices employed in a company should supportlearning.
• LP03: Defer commitment: A commitment should be delayed as far as possi-ble for irreversible decisions. For example, a tough architectural decision mightrequire some experimentation and therefore should not be committed early. In-stead, the option for change should be open for as long as possible. [24] pointout that not all decisions are irreversible and thus do not have to be made late asthey can be changed.
• LP04: Deliver as fast as possible: Lean has a strong focus on short cycle times,i.e. to minimize the time from receiving a request for a feature to the delivery ofthe feature. The reason for the strong focus on cycle time is that while a featureis under development it does not create value for the customer.
• LP05: Respect people: Poppendieck and Poppendieck [24] provide three prin-ciples that were used in the context of the Toyota Product Development Systemfostering the respect for people: (1) Entrepreneurial leadership: People that are
45
Chapter 2. Is Lean Agile and Agile Lean? A Comparison between Two SoftwareDevelopment Paradigms
led by managers who trust and respect them are more likely to become good lead-ers themselves. This helps in creating a management culture facilitating commit-ted and independent people in an organization. (2) Expert technical workforce:Successful companies help building expertise and managers in these companiesmake sure that the necessary expertise for achieving a task is within the teams.(3) Responsibility-based planning and control: Management should trust theirteams and not tell them how to get the job done. Furthermore, it is important toprovide the teams with reasonable and realistic goals.
• LP06: Build quality in: Quality of the software product should be built in asearly as possible, and not late in development by fixing the defects that testingdiscovered. In result the integrity of the software in development should be highat any point in time during the development lifecycle. As [24] point out, a prereq-uisite for achieving integrity is very high discipline. For example, if a defect isdiscovered early in the development process the ongoing work must be stoppedand the defect fixed.
• LP07: See the whole: When improving the process of software developmentthe whole value-stream needs to be considered end to end (E2E). For example,there is no point in sub-optimizing the requirements process and by that increasethe speed of the requirements flow into coding and testing if coding can onlyimplement the requirements in a much slower pace.
Comparison
Figure 2.1 shows a mapping of the principles related to lean and agile. The identifiedprinciples were grouped into seven aspects (people management and leadership; qualityof the product; release of the product; flexibility; priority of the customer needs/value;learning; and E2E flow). Each aspect contains a set of principles for lean and agile.If principles from the lean and agile paradigms respectively are stated in the same rowthen they are related and their relationship is explained further. For example, AP11(self-organizing teams) and LP05 (respect people) are related within the aspect “peoplemanagement and leadership”. We can also see that there exists an N to N relationshipbetween the principles of both paradigms, e.g. AP07 (working software) can be relatedto LP01 (eliminate waste) and LP06 (build quality in). Vice versa the principle LP01(eliminate waste) relates to several agile principles (e.g. AP03 - frequent deliveries andAP01 - customer satisfaction) . If only one column states a principle then the principleis only explicitly referred to in one of the development paradigms, such as LP07 (seethe whole). For LP01 (eliminate waste) we also state which waste is concerned in the
46
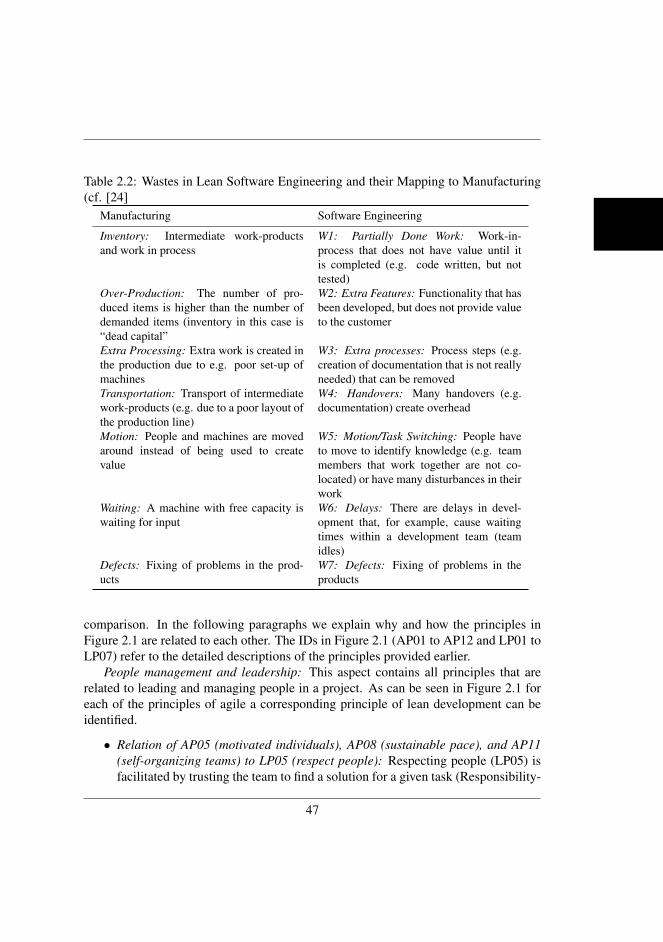
Table 2.2: Wastes in Lean Software Engineering and their Mapping to Manufacturing(cf. [24]
Manufacturing Software Engineering
Inventory: Intermediate work-productsand work in process
W1: Partially Done Work: Work-in-process that does not have value until itis completed (e.g. code written, but nottested)
Over-Production: The number of pro-duced items is higher than the number ofdemanded items (inventory in this case is“dead capital”
W2: Extra Features: Functionality that hasbeen developed, but does not provide valueto the customer
Extra Processing: Extra work is created inthe production due to e.g. poor set-up ofmachines
W3: Extra processes: Process steps (e.g.creation of documentation that is not reallyneeded) that can be removed
Transportation: Transport of intermediatework-products (e.g. due to a poor layout ofthe production line)
W4: Handovers: Many handovers (e.g.documentation) create overhead
Motion: People and machines are movedaround instead of being used to createvalue
W5: Motion/Task Switching: People haveto move to identify knowledge (e.g. teammembers that work together are not co-located) or have many disturbances in theirwork
Waiting: A machine with free capacity iswaiting for input
W6: Delays: There are delays in devel-opment that, for example, cause waitingtimes within a development team (teamidles)
Defects: Fixing of problems in the prod-ucts
W7: Defects: Fixing of problems in theproducts
comparison. In the following paragraphs we explain why and how the principles inFigure 2.1 are related to each other. The IDs in Figure 2.1 (AP01 to AP12 and LP01 toLP07) refer to the detailed descriptions of the principles provided earlier.
People management and leadership: This aspect contains all principles that arerelated to leading and managing people in a project. As can be seen in Figure 2.1 foreach of the principles of agile a corresponding principle of lean development can beidentified.
• Relation of AP05 (motivated individuals), AP08 (sustainable pace), and AP11(self-organizing teams) to LP05 (respect people): Respecting people (LP05) isfacilitated by trusting the team to find a solution for a given task (Responsibility-
47
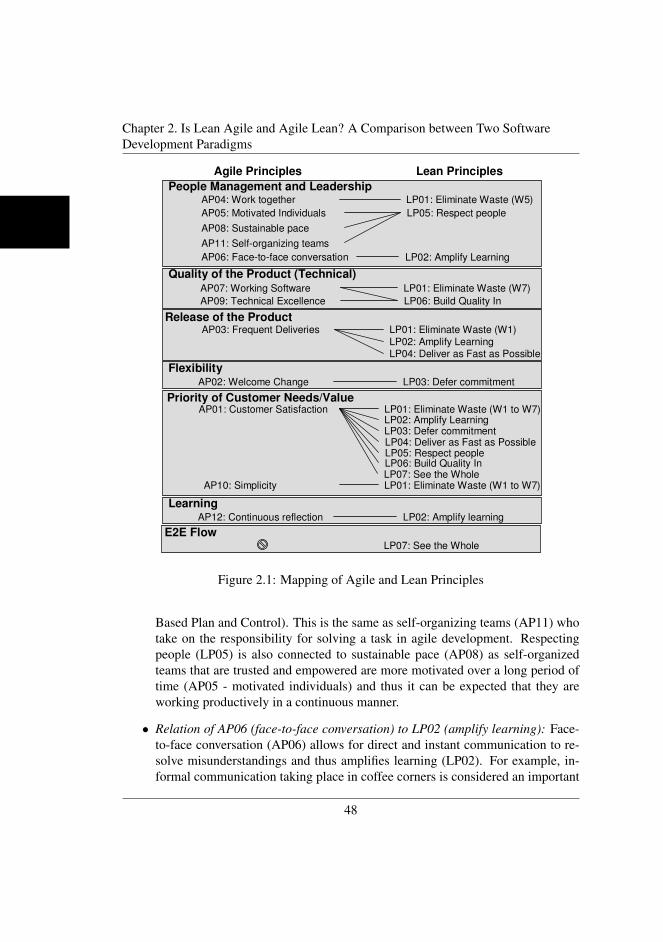
Chapter 2. Is Lean Agile and Agile Lean? A Comparison between Two SoftwareDevelopment Paradigms
• Relation of AP04 (work together) to LP01 (eliminate waste “motion/task switching”):
Agile raises the importance of different groups of people (e.g. technical developers and
business/marketing) to work closely together (AP04). Close cooperation between people
of different competence areas (LP01 - eliminate waste) helps in making their competence
more easily accessible which reduces the time to find the information. Consider the
example of a developer who should decide which requirement to implement next based
on its importance to the market. Without cooperation the developer would have to spend
time searching for documentation and/or the right person to ask. Having cooperation
between marketing and development in the first place would allow for easy and quick
access to the information by just asking the marketing-representative in the team.
Comparison: Every principle in lean has a corresponding principle in agile for the aspect “People
Management and Leadership”. In conclusion both paradigms very much share the same rules
when it comes to managing people.
AP11: Self-organizing teams
AP08: Sustainable pace
AP05: Motivated Individuals
AP06: Face-to-face conversation
AP04: Work together
AP09: Technical Excellence
AP07: Working Software
AP03: Frequent Deliveries
AP01: Customer Satisfaction
AP10: Simplicity
LP05: Respect people
LP02: Amplify Learning
LP03: Defer commitment
LP06: Build Quality In
LP01: Eliminate Waste (W5)
People Management and Leadership
LP01: Eliminate Waste (W7)
Quality of the Product (Technical)
LP01: Eliminate Waste (W1)
LP02: Amplify Learning
LP04: Deliver as Fast as Possible
Release of the Product
AP02: Welcome Change
Priority of Customer Needs/Value
Flexibility
LP01: Eliminate Waste (W1 to W7)
LP02: Amplify Learning
LP03: Defer commitment
LP04: Deliver as Fast as Possible
LP05: Respect people
LP06: Build Quality In
LP07: See the Whole
LP01: Eliminate Waste (W1 to W7)
LP07: See the Whole
E2E Flow
Agile Principles Lean Principles
LP02: Amplify learningAP12: Continuous reflection
Learning
Figure 1 - Mapping of Agile and Lean Principles
Technical quality of the product: This aspect contains the principles that are related to achieve a
working product with high quality from a technical perspective. Figure 1 shows that lean and
agile both apply principles related to technical product quality.
Figure 2.1: Mapping of Agile and Lean Principles
Based Plan and Control). This is the same as self-organizing teams (AP11) whotake on the responsibility for solving a task in agile development. Respectingpeople (LP05) is also connected to sustainable pace (AP08) as self-organizedteams that are trusted and empowered are more motivated over a long period oftime (AP05 - motivated individuals) and thus it can be expected that they areworking productively in a continuous manner.
• Relation of AP06 (face-to-face conversation) to LP02 (amplify learning): Face-to-face conversation (AP06) allows for direct and instant communication to re-solve misunderstandings and thus amplifies learning (LP02). For example, in-formal communication taking place in coffee corners is considered an important
48
part of information exchange allowing people to share knowledge [7].
• Relation of AP04 (work together) to LP01 (eliminate waste “motion/task switch-ing”): Agile raises the importance of different groups of people (e.g. technicaldevelopers and business/marketing) to work closely together (AP04). Close co-operation between people of different competence areas (LP01 - eliminate waste)helps in making their competence more easily accessible which reduces the timeto find the information. Consider the example of a developer who should de-cide which requirement to implement next based on its importance to the market.Without cooperation the developer would have to spend time searching for docu-mentation and/or the right person to ask. Having cooperation between marketingand development in the first place would allow for easy and quick access to theinformation by just asking the marketing-representative in the team.
Comparison: Every principle in lean has a corresponding principle in agile for the as-pect “People Management and Leadership”. In conclusion both paradigms very muchshare the same rules when it comes to managing people.
Technical quality of the product: This aspect contains the principles that are relatedto achieve a working product with high quality from a technical perspective. Figure 2.1shows that lean and agile both apply principles related to technical product quality.
• Relation of AP09 (technical excellence) to LP06 (build quality in): Agile stressesthat technical excellence should receive continuous attention (AP09). In lean thisis achieved by building in quality early in the development process, and not bytesting for and fixing defects later (LP06). Thus, LP06 fulfills the principle ofhaving a continuous focus on building technically excellent products.
• Relation of AP07 (working software) to LP01 (eliminate waste) and LP06 (buildquality in): The rule of having working software (AP07) throughout develop-ment enforces that the quality of the software has to be ensured throughout thewhole development lifecycle. For example, having mechanisms in place to in-crease the quality of code while it is written (LP01 - eliminate waste) helps toachieve the goal of working product with few defects (LP06, W7).
Comparison: Both paradigms stress the continuous attention to quality and technicalexcellence. A consequence of this attention is a working software product throughoutthe development lifecycle. Thus, both paradigms strongly agree on the rules appliedto the quality of the software product. A small distinction is made in principle AP09(technical excellence) where agile emphasizes that good design enhances agility. Forexample, an easy extension of the architecture enables a rapid and agile response tochanging customer needs.
49
Chapter 2. Is Lean Agile and Agile Lean? A Comparison between Two SoftwareDevelopment Paradigms
Release of the product: The release aspect refers to the delivery of software to thecustomer. The release aspect is also covered in both development paradigms.
• Relation of AP03 (frequent deliveries) to LP01 (eliminate waste), LP02 (am-plify learning), and LP04 (deliver as fast as possible): Frequent deliveries to thecustomer (AP03) have a positive effect on the elimination of waste concerningpartially done work (LP01). That is, enforcing frequent deliveries avoids thatcompleted work (e.g. adding a new feature) stays within the development orga-nization without being made available to the customer. Frequent deliveries alsoamplify learning (LP02) as they allow the customer to provide regular feedbackon the latest status of the product. Thereby, the development organization canlearn about the needs of the customers and what features excite them. In additionAP03 influences the speed of delivery (LP04) positively. In waterfall develop-ment the delivery of the overall scope is done in the end which means that allfeatures together have a very long lead-time. Frequent deliveries, however, im-ply that less software is delivered at once, but much more frequently and withshorter lead-time (see Chapter 5).
Comparison: There is a clear relation between the principles of the release aspectbetween lean and agile, i.e. both paradigms are in strong agreement on this.
Flexibility: Flexibility is the ability to react on changes that impact the developmentof the software product. The most common is the change in the needs of the customerreflected in changing requirements. Other changes are time line changes (e.g. dead-lines), changes of rules and regulations (law) that affect development, or innovationsin technology.
• Relation of AP02 (welcome change) to LP03 (defer commitment): Agile stressesthat software organizations should welcome change instead of fighting it (AP02)as being able to deliver what the market needs today determines the success ofproducts. The principle refers to the attitude that one should have when devel-oping software. Lean adds to that by providing a rule that supports the attitudeof welcoming change, i.e. to defer commitment (LP03). Deferring commitmentmeans to decide as late as possible. For example, a company should not decideof an overall release scope early on in development (early decision), but insteaddecide whether a feature should be included into the scope as late as possible(deferred commitment).
Comparison: Both paradigms address flexibility, but describe it in a different way. Inlean one should defer commitment, i.e. decide as late as possible. However, softwareorganizations that are generally driven by plans, scopes, and deadlines have to change
50
their attitude towards harnessing change as this is a prerequisite to implement late deci-sions. Hence, the principles of the two development paradigms complement each othervery well as accepting and harnessing change in the process is a pre-requisite to defercommitment.
Priority of customer needs/value: This aspect contains principles that stress thepriority of the customer in software development over other focuses (such as the focuson documentation).
• Relation of AP01 (customer satisfaction) to LP01 (eliminate waste, all wastes inTable 2.2): The priority of the customer (AP01) is reflected in all the principlesthat are stated for lean (LP01-LP07). This is very clear for the wastes (LP01) asthe waste is identified from the point of view of the customer. Amplify learning(LP02) puts high priority on customers’ needs as it is about learning the needsof customers and what delights them. The same holds for deferred commitment(LP03) as this enables a flexible reaction to customer change requests that aredue to a change in needs. Delivering fast (LP04) implies that the needs of thecustomer are realized quickly as soon as they are articulated. The respect forpeople (LP05) can also be related to the customer focus as happy employeesare an important factor for project success [7]. Furthermore, technical quality(LP06) is a prerequisite to deliver valuable software (e.g. if the software is notstable then the customer cannot make sufficient use of its functionality). Finally,see the whole (LP07) implies that one should not put too much effort in sub-optimization of the process as this is does not lead to significant improvementsfor the customer. Thus, the improvement effort would be wasted.
• Relation of AP10 (simplicity) to LP01 (eliminate waste, all wastes in Table 2.2):Simplicity is about maximizing the amount of work not done (AP10). In thatsense it is very strongly related to wastes (LP01) as the elimination of wasteleads to a reduction of work. This includes unnecessary work that can be easilyavoided (e.g. documentation never used) or reduction of rework (e.g. defects).
Comparison: The comparison indicates that customer priority in agile is related toall principles in lean. As we have shown the principles in lean are also linked to theprinciples in agile other than AP10 we conclude that AP10 is the very central principleof both development paradigms.
Learning: This aspect is about gaining new knowledge (e.g. about customer needs,ways of working, etc.) and is addressed in both paradigms.
• Relation of AP12 (continuous reflection) to LP02 (amplify learning): Continu-ous reflection allows time for the team to reflect on how to improve the ways
51
Chapter 2. Is Lean Agile and Agile Lean? A Comparison between Two SoftwareDevelopment Paradigms
of working to become more efficient (AP12). Thus, the learning focus is onidentifying improvement potential for efficiency. In lean the learning focus has abroader perspective by emphasizing learning in general, not with a specific focuson efficiency. Learning in general includes, for example, gaining new knowledgeabout customer needs and market trends.
Comparison: Both paradigms focus on learning, while lean takes a more general per-spective.
E2E flow: The E2E flow includes principles that emphasize the focus on the over-all flow of value (i.e. from the very beginning when a need for a feature enters theorganization till it is delivered). The principle related to the E2E flow is “see thewhole” (LP07). When comparing the principles within the aspect “priority of customerneeds/value” LP07 is related to the prioritization of the customer needs (AP01 - cus-tomer satisfaction). However, the E2E flow aspect is not considered in the principlesof agile and thus is what sets lean and agile apart when looking at the principles.
Overall, the comparison shows which principles are the same, complement eachother, or are new to either one of the two paradigms.
• Same: For the aspects people management and leadership, technical quality ofthe product, and release of the product both paradigms strongly agree on theprinciples. That is, they mean the same, but only express it in different words.
• Complementary: The paradigms complement each other with regard to the as-pects flexibility, priority of customer needs/value, and learning. For flexibilitylean emphasizes deferred commitment, while agile stresses the attitude a com-pany must have to be willing to defer commitments. For priority of customerneeds/value lean complements agile by concretizing what does not contributepositively to the value for the customer in the form of the seven wastes of soft-ware development (see Table 2.2).
• New: The need to look at the development and value flow from an end to endperspective is unique for lean and therefore is what clearly distinguishes bothparadigms from each other.
Regarding the question whether lean development is agile and agile development islean we can provide the following answer for the principles: Lean is agile as it includesall the principles of agile. However, agile is not lean as it does not emphasize the E2Efocus on flow in its principles.
In the next section we analyze the practices which implement the principles of leanand agile development. A proposition based on the similarities is that both paradigmsalso propose similar practices. However, this proposition has to be investigated as:
52
• Agile and lean might propose different practices (“How”) in order to fulfill thepractices they agree on (“What”).
• Lean is unique in its E2E focus and hence we can expect to identify practicesthat are not already proposed in the agile context.
Furthermore, it is interesting to investigate which principles are covered by which prac-tices, as this investigation shows the coverage of practices through principles.
2.3.3 PracticesPractices describe how the principles are implemented by the development paradigms.Therefore, we first present the practices for lean and agile and link each of the differentpractices to the principles. After that we make a comparison between the paradigms.
In total we identified 26 principles by looking at the literature describing lean[24, 25, 26] and agile software development [3, 28, 16, 15], as well as lean product de-velopment [19]. The principles are described and for each principle it is stated whetherliterature connects it to lean, agile, or both paradigms. The principles are grouped asbeing related to requirements engineering, design and implementation, quality assur-ance, software releases, project planning, team management, and E2E flow. First, acomparison of practices in each group is made, and thereafter we provide an overallcomparison.
Requirements Engineering
P01: On-site customer: Representatives of the customer are located at the developmentsite to allow for immediate feedback on the product (AP02 - welcome change). At thesame time the customer always knows about the progress of the development (AP01 -customer satisfaction). The co-location also allows the developers to interact with thecustomer to ask questions and clarify requirements, which avoids implementation offeatures not needed by the customer (LP01 - eliminate waste “extra features”). Fur-thermore, a regular face-to-face communication between the team and the customer isensured (AP05 - face-to-face conversation).
P02: Metaphors and user stories: A metaphor is a very high level requirementoutlining the purpose of the system and characterizes what the system should be like.The purpose on the high level should be stable. The metaphor is broken down intomore detailed requirements to be used in the development project. These are featuredescriptions (FDD) or user stories (XP and SCRUM). The features/user stories shouldbe used to track the progress and apply the pull concept (see P26 - Kanban pull-system).Having the metaphor defined also avoids the inclusion of irrelevant user stories (LP01
53
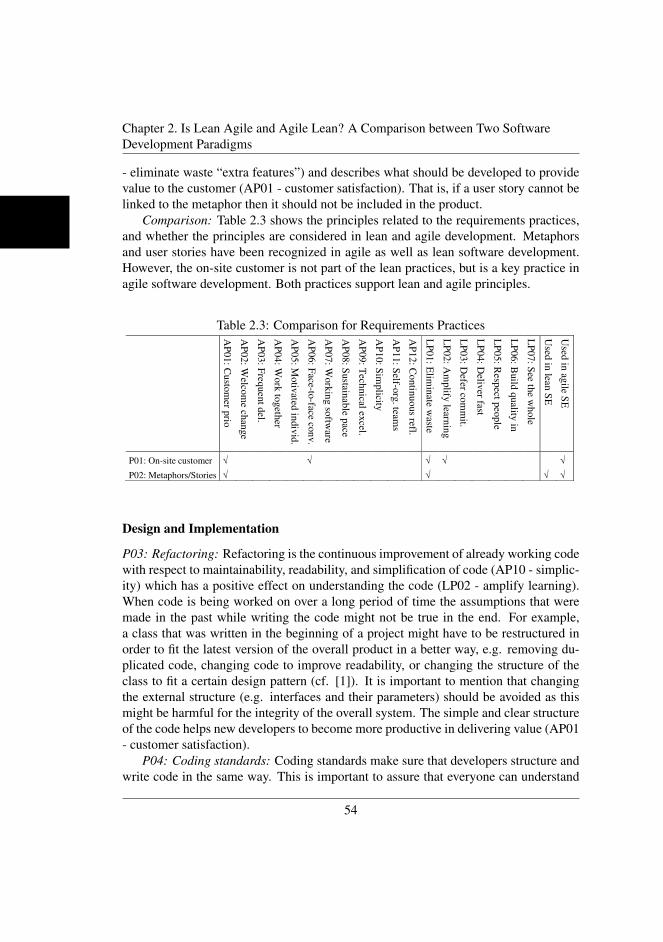
Chapter 2. Is Lean Agile and Agile Lean? A Comparison between Two SoftwareDevelopment Paradigms
- eliminate waste “extra features”) and describes what should be developed to providevalue to the customer (AP01 - customer satisfaction). That is, if a user story cannot belinked to the metaphor then it should not be included in the product.
Comparison: Table 2.3 shows the principles related to the requirements practices,and whether the principles are considered in lean and agile development. Metaphorsand user stories have been recognized in agile as well as lean software development.However, the on-site customer is not part of the lean practices, but is a key practice inagile software development. Both practices support lean and agile principles.
Table 2.3: Comparison for Requirements Practices
– eliminate waste “extra features”). Furthermore, a regular face-to-face communication between
the team and the customer is ensured (AP05 - face-to-face conversation).
P02: Metaphors and user stories: A metaphor is a very high level requirement outlining the
purpose of the system and characterizes what the system should be like. The purpose on the high
level should be stable. The metaphor is broken down into more detailed requirements to be used
in the development project. These are feature descriptions (FDD) or user stories (XP and
SCRUM). The features/user stories should be used to track the progress and apply the pull
concept (see P26 – Kanban pull-system). Having the metaphor defined also avoids the inclusion
of irrelevant user stories (LP01 – eliminate waste “extra features”) and describes what should be
developed to provide value to the customer (AP01 – customer satisfaction). That is, if a user story
cannot be linked to the metaphor then it should not be included in the product.
Comparison: Table 3 shows the principles related to the requirements practices, and whether the
principles are considered in lean and agile development. Metaphors and user stories have been
recognized in agile as well as lean software development. However, the on-site customer is not
part of the lean practices, but is a key practice in agile software development. Both practices
support lean and agile principles.
AP
01: C
usto
mer p
rio
AP
02: W
elcom
e chan
ge
AP
03: F
requent d
el.
AP
04: W
ork
togeth
er
AP
05: M
otiv
ated in
div
id.
AP
06: F
ace-to-face co
nv.
AP
07: W
ork
ing so
ftware
AP
08: S
usta
inable p
ace
AP
09: T
echnical ex
cel.
AP
10: S
implicity
AP
11: S
elf-org
. teams
AP
12: C
ontin
uo
us refl.
LP
01: E
limin
ate w
aste
LP
02: A
mplify
learnin
g
LP
03: D
efer com
mit.
LP
04: D
eliver fast
LP
05: R
esp
ect people
LP
06: B
uild
quality
in
LP
07: S
ee the w
hole
Used
in lea
n S
E
Used
in ag
ile SE
P01: On-site customer √ √ √ √ √
P02: Metaphors/Stories √ √ √ √
2.3.2 Design and Implementation
P03: Refactoring: Refactoring is the continuous improvement of already working code with
respect to maintainability, readability, and simplification of code (AP10 - simplicity) which has a
positive effect on understanding the code (LP02 - amplify learning). When code is being worked
on over a long period of time the assumptions that were made in the past while writing the code
might not be true in the end. For example, a class that was written in the beginning of a project
might have to be restructured in order to fit the latest version of the overall product in a better
way, e.g. removing duplicated code, changing code to improve readability, or changing the
structure of the class to fit a certain design pattern (cf. [Andersen and Fagerhaug 2000]). It is
important to mention that changing the external structure (e.g. interfaces and their parameters)
should be avoided as this might be harmful for the integrity of the overall system. The simple
Design and Implementation
P03: Refactoring: Refactoring is the continuous improvement of already working codewith respect to maintainability, readability, and simplification of code (AP10 - simplic-ity) which has a positive effect on understanding the code (LP02 - amplify learning).When code is being worked on over a long period of time the assumptions that weremade in the past while writing the code might not be true in the end. For example,a class that was written in the beginning of a project might have to be restructured inorder to fit the latest version of the overall product in a better way, e.g. removing du-plicated code, changing code to improve readability, or changing the structure of theclass to fit a certain design pattern (cf. [1]). It is important to mention that changingthe external structure (e.g. interfaces and their parameters) should be avoided as thismight be harmful for the integrity of the overall system. The simple and clear structureof the code helps new developers to become more productive in delivering value (AP01- customer satisfaction).
P04: Coding standards: Coding standards make sure that developers structure andwrite code in the same way. This is important to assure that everyone can understand
54
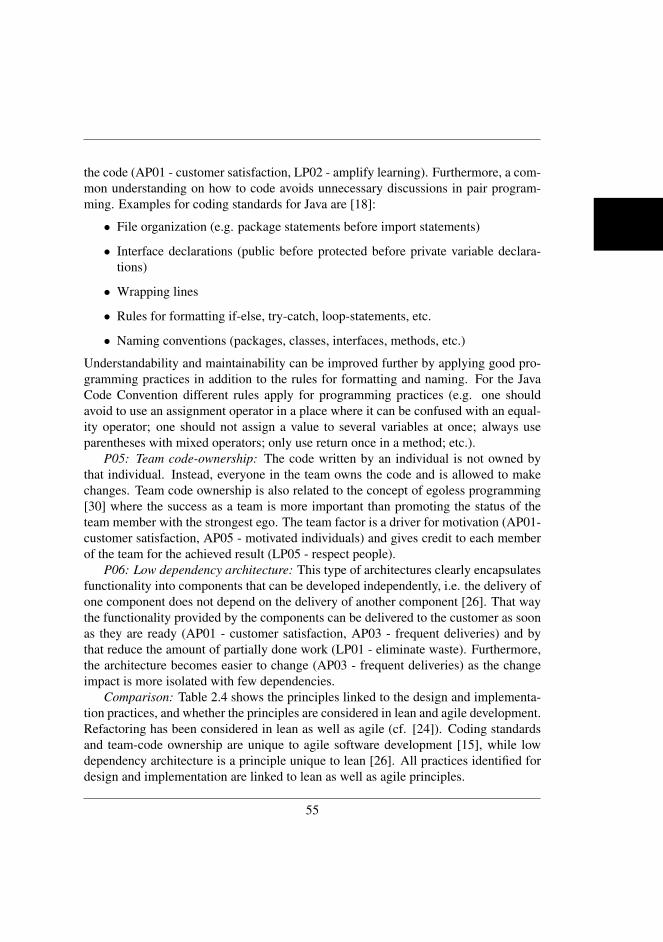
the code (AP01 - customer satisfaction, LP02 - amplify learning). Furthermore, a com-mon understanding on how to code avoids unnecessary discussions in pair program-ming. Examples for coding standards for Java are [18]:
• File organization (e.g. package statements before import statements)
• Interface declarations (public before protected before private variable declara-tions)
• Wrapping lines
• Rules for formatting if-else, try-catch, loop-statements, etc.
• Naming conventions (packages, classes, interfaces, methods, etc.)
Understandability and maintainability can be improved further by applying good pro-gramming practices in addition to the rules for formatting and naming. For the JavaCode Convention different rules apply for programming practices (e.g. one shouldavoid to use an assignment operator in a place where it can be confused with an equal-ity operator; one should not assign a value to several variables at once; always useparentheses with mixed operators; only use return once in a method; etc.).
P05: Team code-ownership: The code written by an individual is not owned bythat individual. Instead, everyone in the team owns the code and is allowed to makechanges. Team code ownership is also related to the concept of egoless programming[30] where the success as a team is more important than promoting the status of theteam member with the strongest ego. The team factor is a driver for motivation (AP01-customer satisfaction, AP05 - motivated individuals) and gives credit to each memberof the team for the achieved result (LP05 - respect people).
P06: Low dependency architecture: This type of architectures clearly encapsulatesfunctionality into components that can be developed independently, i.e. the delivery ofone component does not depend on the delivery of another component [26]. That waythe functionality provided by the components can be delivered to the customer as soonas they are ready (AP01 - customer satisfaction, AP03 - frequent deliveries) and bythat reduce the amount of partially done work (LP01 - eliminate waste). Furthermore,the architecture becomes easier to change (AP03 - frequent deliveries) as the changeimpact is more isolated with few dependencies.
Comparison: Table 2.4 shows the principles linked to the design and implementa-tion practices, and whether the principles are considered in lean and agile development.Refactoring has been considered in lean as well as agile (cf. [24]). Coding standardsand team-code ownership are unique to agile software development [15], while lowdependency architecture is a principle unique to lean [26]. All practices identified fordesign and implementation are linked to lean as well as agile principles.
55
Chapter 2. Is Lean Agile and Agile Lean? A Comparison between Two SoftwareDevelopment Paradigms
Table 2.4: Comparison for Design and Implementation Practices
AP
01: C
usto
mer p
rio
AP
02: W
elcom
e chan
ge
AP
03: F
requent d
el.
AP
04: W
ork
togeth
er
AP
05: M
otiv
ated in
div
id.
AP
06: F
ace-to-face co
nv.
AP
07: W
ork
ing so
ftware
AP
08: S
usta
inable p
ace
AP
09: T
echnical e
xcel.
AP
10: S
implicity
AP
11: S
elf-org
. teams
AP
12: C
ontin
uo
us refl.
LP
01: E
limin
ate w
aste
LP
02: A
mplify
learn
ing
LP
03: D
efer com
mit.
LP
04: D
eliver fast
LP
05: R
esp
ect people
LP
06: B
uild
quality
in
LP
07: S
ee the w
hole
Used
in lea
n S
E
Used
in ag
ile SE
P03: Refactoring √ √ √ √ √
P04: Coding standards √ √ √
P05: Team-Code Own. √ √ √ √
P06: Low Dep. Arch. √ √ √ √ √ √ √
2.3.3 Quality Assurance
P07: Test-driven development and test automation: In test-driven development (TDD) [Beck
2003] the test cases for unit tests are written before the implementation takes place. The test cases
are to be implemented (e.g. JUnit [Beck 2004] is a test framework supporting the implementation
in Java) so that they can verify the implementation as soon as it is finished (AP07 - working
software, AP09 - technical excellence, L06). Thereby, defects are caught early (LP01 – eliminate
waste “delays”), which results in higher quality software for the customer (AP01 – customer
satisfaction). Whenever the implementation is changed the test cases can be re-run as they are
already implemented. This aids in automation of regression tests. After the test is completed the
code is refactored (see P03 - refactoring).
P08: Pair-programming: In pair programming two developers share one workstation. One of the
developers is actively developing the test cases and writing the code. The second developer
should reflect on what the first developer is doing and act as a reviewer thinking about the impact
(e.g. how does the implementation affect other parts of the system) and the quality (e.g. is the
code defective, or are any important unit test cases missing). The review allows to detect defects
in the code immediately after their introduction (AP09 - technical excellence, LP01 – eliminate
waste “defects”, LP06 - build quality in) improving the quality for the customer early on (AP01 –
customer satisfaction). The second developer can improve the work by asking questions and
providing feedback on the work done. Agile recommends to continuously changing pairs
throughout a project to improve knowledge transfer (LP02 - amplify learning).
P09: Continuous integration: Features that are developed as increments for a product should be
integrated into the overall product as soon as possible after they are finalized, making every
extension to the product deliverable (AP01 – customer satisfaction, AP03 - frequent deliveries,
LP01 – eliminate waste “partially done work”). That way, problems in integration are discovered
early and can be fixed close to their discovery (AP07 - working software, AP09 - technical
excellence, LP01 – eliminate waste “partially done work”, and LP06 - build quality in).
Furthermore, integrating a large scope at once often leads to unpredictable results in terms of
quality and schedule [Petersen et al. 2009b].
Quality Assurance
P07: Test-driven development and test automation: In test-driven development (TDD)[4] the test cases for unit tests are written before the implementation takes place. Thetest cases are to be implemented (e.g. JUnit [5] is a test framework supporting theimplementation in Java) so that they can verify the implementation as soon as it is fin-ished (AP07 - working software, AP09 - technical excellence, L06). Thereby, defectsare caught early (LP01 - eliminate waste “delays”), which results in higher quality soft-ware for the customer (AP01 - customer satisfaction). Whenever the implementationis changed the test cases can be re-run as they are already implemented. This aids inautomation of regression tests. After the test is completed the code is refactored (seeP03 - refactoring).
P08: Pair-programming: In pair programming two developers share one worksta-tion. One of the developers is actively developing the test cases and writing the code.The second developer should reflect on what the first developer is doing and act asa reviewer thinking about the impact (e.g. how does the implementation affect otherparts of the system) and the quality (e.g. is the code defective, or are any importantunit test cases missing). The review allows to detect defects in the code immediatelyafter their introduction (AP09 - technical excellence, LP01 - eliminate waste “defects”,LP06 - build quality in) improving the quality for the customer early on in the codingprocess (AP01 - customer satisfaction). The second developer can improve the workby asking questions and providing feedback on the work done. Agile recommends tocontinuously changing pairs throughout a project to improve knowledge transfer (LP02- amplify learning).
56
P09: Continuous integration: Features that are developed as increments for a prod-uct should be integrated into the overall product as soon as possible after they are final-ized, making every extension to the product deliverable (AP01 - customer satisfaction,AP03 - frequent deliveries, LP01 - eliminate waste “partially done work”). That way,problems in integration are discovered early and can be fixed close to their discovery(AP07 - working software, AP09 - technical excellence, LP01 - eliminate waste “par-tially done work”, and LP06 - build quality in). Furthermore, integrating a large scopeat once often leads to unpredictable results in terms of quality and schedule [23].
P10: Reviews and inspections: Inspections are a visual examination of any soft-ware artifact (requirements, code, test cases, etc.) allowing the detection of defectsearly in the process (AP01 - customer satisfaction, AP07 - working software, AP09 -technical excellence, LP01 - eliminate waste “defects”, and LP06 - build quality in).Fagan introduced a very formal inspection process in 1976 [10]. However, the for-mality requirements are not given in the agile context, i.e. different agile methods usereviews and inspections in a different way. The inspection in Feature Driven Devel-opment (FDD) [15] is a relatively rigorous peer review. Furthermore, post-mortemsare used in FDD where completed development activities are reviewed to identify im-provement potential for upcoming iterations. SCRUM also uses reviews after each 30day sprint where the work product of the sprint is reviewed by all relevant stakeholdersduring a meeting [28].
P11: Configuration management: The goal of configuration management is toachieve consistency between versions of software artifacts and thus to achieve sys-tem integrity [17]. Different software artifacts linked to a configuration item shouldbe consistent in the sense that requirements, code, and test cases match and representthe same version of the system. For example, an inconsistent situation would be iftest cases are derived from a specific requirements specification, but are linked to anolder version of the requirements specification within the configuration. The negativeconsequence is that the wrong things would be tested. In order to achieve and maintainconsistency configuration management has mechanism for version control and changeprocesses. Configuration management is not explicitly acknowledged in most of agileprocess models, only FDD has configuration management as one of its practices [15].The benefits of configuration management are: (1) create transparency in terms ofstatus and progress of configuration items to be reported to the customer (AP01 - cus-tomer satisfaction); (2) the knowledge about status avoids making the wrong decisionscausing waiting (LP01 - eliminate waste “delays”), quality problems (AP07 - workingsoftware, AP09 - technical excellence, LP01 - eliminate waste “defects”, and LP06 -build quality in); and (3) the information of configuration items aids in communicationand reflection (AP12 - continuous reflection).
Comparison: Table 2.5 shows the principles linked to the quality assurance prac-
57
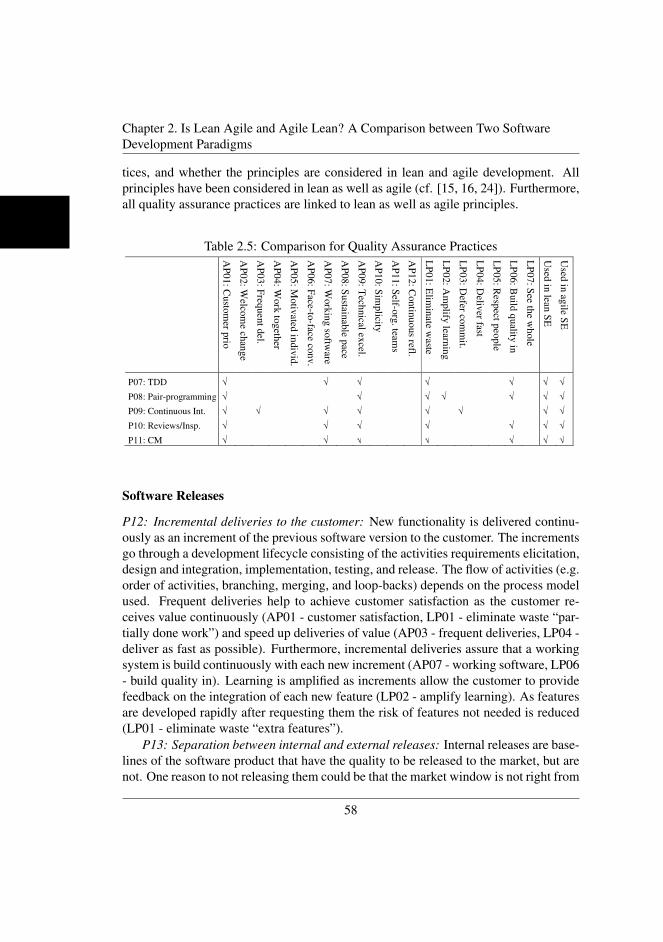
Chapter 2. Is Lean Agile and Agile Lean? A Comparison between Two SoftwareDevelopment Paradigms
tices, and whether the principles are considered in lean and agile development. Allprinciples have been considered in lean as well as agile (cf. [15, 16, 24]). Furthermore,all quality assurance practices are linked to lean as well as agile principles.
Table 2.5: Comparison for Quality Assurance Practices
AP
01: C
usto
mer p
rio
AP
02: W
elcom
e chan
ge
AP
03: F
requent d
el.
AP
04: W
ork
togeth
er
AP
05: M
otiv
ated in
div
id.
AP
06: F
ace-to-face co
nv.
AP
07: W
ork
ing so
ftware
AP
08: S
usta
inable p
ace
AP
09: T
echnical e
xcel.
AP
10: S
implicity
AP
11: S
elf-org
. teams
AP
12: C
ontin
uo
us refl.
LP
01: E
limin
ate w
aste
LP
02: A
mplify
learnin
g
LP
03: D
efer com
mit.
LP
04: D
eliver fast
LP
05: R
esp
ect people
LP
06: B
uild
quality
in
LP
07: S
ee the w
hole
Used
in lea
n S
E
Used
in ag
ile SE
P07: TDD √ √ √ √ √ √ √
P08: Pair-programming √ √ √ √ √ √ √
P09: Continuous Int. √ √ √ √ √ √ √ √
P10: Reviews/Insp. √ √ √ √ √ √ √
P11: CM √ √ √ √ √ √ √
2.3.4 Software Releases
P12: Incremental deliveries to the customer: New functionality is delivered continuously as an
increment of the previous software version to the customer. The increments go through a
development lifecycle consisting of the activities requirements elicitation, design and integration,
implementation, testing, and release. The flow of activities (e.g. order of activities, branching,
merging, and loop-backs) depends on the process model used. Frequent deliveries help to achieve
customer satisfaction as the customer receives value continuously (AP01 – customer satisfaction,
LP01 – eliminate waste “partially done work”) and speed up deliveries of value (AP03 - frequent
deliveries, LP04 - deliver as fast as possible). Furthermore, incremental deliveries assure that a
working system is build continuously with each new increment (AP07 - working software, LP06 -
build quality in). Learning is amplified as increments allow the customer to provide feedback on
the integration of each new feature (LP02 - amplify learning). As features are developed rapidly
after requesting them the risk of features not needed is reduced (LP01 – eliminate waste “extra
features”).
P13: Separation between internal and external releases: Internal releases are baselines of the
software product that have the quality to be released to the market, but are not. One reason to not
releasing them could be that the market window is not right from a marketing strategy. The
internal release makes sure that there is a continuous attention to quality as baselines should be
releasable (AP01 – customer satisfaction, AP09 - technical excellence, LP01 – eliminate waste
“defects”, and LP06 - build quality in). An example of the implementation of internal and
external releases in a market-driven context can be found in [Petersen and Wohlin 2009a].
Comparison: Table 3 shows the comparison of software release practices. The principles can be
found in both paradigms (cf. [Poppendieck and Poppendieck 2003][Larman 2004][Koch 2005])).
Furthermore, the practices fulfill principles of lean and agile.
Software Releases
P12: Incremental deliveries to the customer: New functionality is delivered continu-ously as an increment of the previous software version to the customer. The incrementsgo through a development lifecycle consisting of the activities requirements elicitation,design and integration, implementation, testing, and release. The flow of activities (e.g.order of activities, branching, merging, and loop-backs) depends on the process modelused. Frequent deliveries help to achieve customer satisfaction as the customer re-ceives value continuously (AP01 - customer satisfaction, LP01 - eliminate waste “par-tially done work”) and speed up deliveries of value (AP03 - frequent deliveries, LP04 -deliver as fast as possible). Furthermore, incremental deliveries assure that a workingsystem is build continuously with each new increment (AP07 - working software, LP06- build quality in). Learning is amplified as increments allow the customer to providefeedback on the integration of each new feature (LP02 - amplify learning). As featuresare developed rapidly after requesting them the risk of features not needed is reduced(LP01 - eliminate waste “extra features”).
P13: Separation between internal and external releases: Internal releases are base-lines of the software product that have the quality to be released to the market, but arenot. One reason to not releasing them could be that the market window is not right from
58
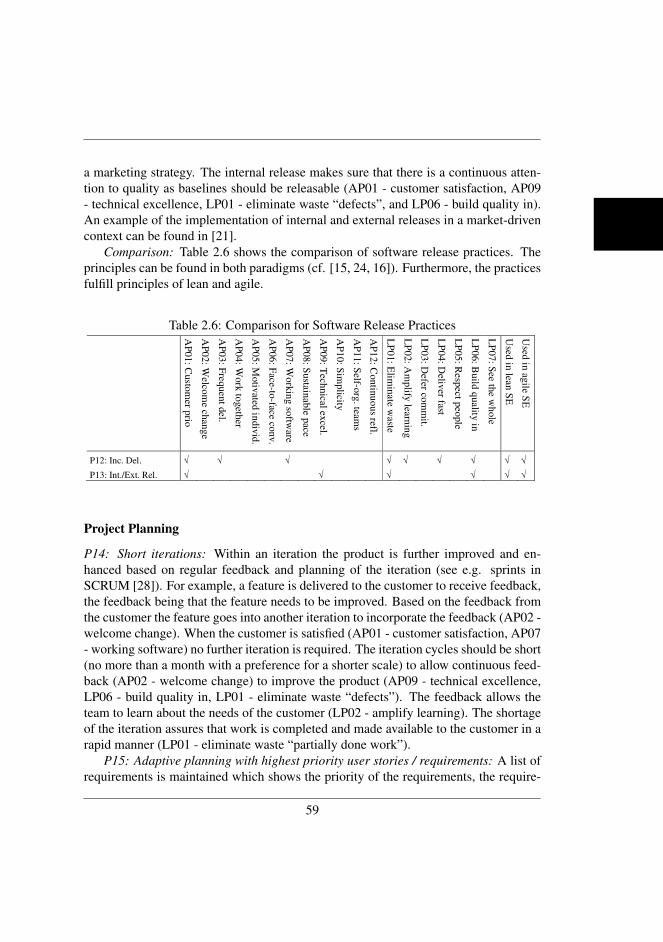
a marketing strategy. The internal release makes sure that there is a continuous atten-tion to quality as baselines should be releasable (AP01 - customer satisfaction, AP09- technical excellence, LP01 - eliminate waste “defects”, and LP06 - build quality in).An example of the implementation of internal and external releases in a market-drivencontext can be found in [21].
Comparison: Table 2.6 shows the comparison of software release practices. Theprinciples can be found in both paradigms (cf. [15, 24, 16]). Furthermore, the practicesfulfill principles of lean and agile.
Table 2.6: Comparison for Software Release Practices
AP
01: C
usto
mer p
rio
AP
02: W
elcom
e chan
ge
AP
03: F
requent d
el.
AP
04: W
ork
togeth
er
AP
05: M
otiv
ated in
div
id.
AP
06: F
ace-to-face co
nv.
AP
07: W
ork
ing so
ftware
AP
08: S
usta
inable p
ace
AP
09: T
echnical e
xcel.
AP
10: S
implicity
AP
11: S
elf-org
. teams
AP
12: C
ontin
uo
us refl.
LP
01: E
limin
ate w
aste
LP
02: A
mplify
learnin
g
LP
03: D
efer com
mit.
LP
04: D
eliver fast
LP
05: R
esp
ect people
LP
06: B
uild
quality
in
LP
07: S
ee the w
hole
Used
in lea
n S
E
Used
in ag
ile SE
P12: Inc. Del. √ √ √ √ √ √ √ √ √
P13: Int./Ext. Rel. √ √ √ √ √ √
2.3.5 Project Planning
P14: Short iterations: Within an iteration the product is further improved and enhanced based on
regular feedback and planning of the iteration (see e.g. sprints in SCRUM [Schwaber 2004]). For
example, a feature is delivered to the customer to receive feedback, the feedback being that the
feature needs to be improved. Based on the feedback from the customer the feature goes into
another iteration to incorporate the feedback (AP02 - welcome change). When the customer is
satisfied (AP01 – customer satisfaction, AP07 - working software) no further iteration is required.
The iteration cycles should be short (no more than a month with a preference for a shorter scale)
to allow continuous feedback (AP02 – welcome change) to improve the product (AP09 -
technical excellence, LP06 - build quality in, LP01 – eliminate waste “defects”). The feedback
allows the team to learn about the needs of the customer (LP02 - amplify learning). The shortage
of the iteration assures that work is completed and made available to the customer in a rapid
manner (LP01 – eliminate waste “partially done work”).
P15: Adaptive planning with highest priority user stories / requirements: A list of requirements is
maintained which shows the priority of the requirements, the requirements that are more
important for the customer being higher ranked in the list (AP01 - customer satisfaction). The
priority of the requirements is important to indicate which requirement should be implemented
next. The list is the backlog of work. Adaptive planning means that the priority of requirements
can be changed in the backlog and there is flexibility in choosing work-tasks for the next iteration
(AP02 - welcome change, LP03 - defer commitment). Furthermore, adoption avoids delivering
features the customer does not need (LP01 – eliminate waste “extra features”) while learning
more about the customers’ needs (LP02 - amplify learning).
P16: Time-boxing: Fixed start and end dates are set for iterations and projects. SCRUM, for
example, proposes to have 30 day sprints in which the next increment has to be completed
[Schwaber 2004]. In consequence the scope of development (i.e. how much to implement in a
project) has to be decided based on the maximum duration of the project. In consequence time-
boxing forces new functionality to be delivered within one cycle speeding up value creation
(AP01 - customer satisfaction) and the rate in which new functions can be delivered (AP03 -
frequent deliveries,LP01 – eliminate waste “partially done work”).
Project Planning
P14: Short iterations: Within an iteration the product is further improved and en-hanced based on regular feedback and planning of the iteration (see e.g. sprints inSCRUM [28]). For example, a feature is delivered to the customer to receive feedback,the feedback being that the feature needs to be improved. Based on the feedback fromthe customer the feature goes into another iteration to incorporate the feedback (AP02 -welcome change). When the customer is satisfied (AP01 - customer satisfaction, AP07- working software) no further iteration is required. The iteration cycles should be short(no more than a month with a preference for a shorter scale) to allow continuous feed-back (AP02 - welcome change) to improve the product (AP09 - technical excellence,LP06 - build quality in, LP01 - eliminate waste “defects”). The feedback allows theteam to learn about the needs of the customer (LP02 - amplify learning). The shortageof the iteration assures that work is completed and made available to the customer in arapid manner (LP01 - eliminate waste “partially done work”).
P15: Adaptive planning with highest priority user stories / requirements: A list ofrequirements is maintained which shows the priority of the requirements, the require-
59
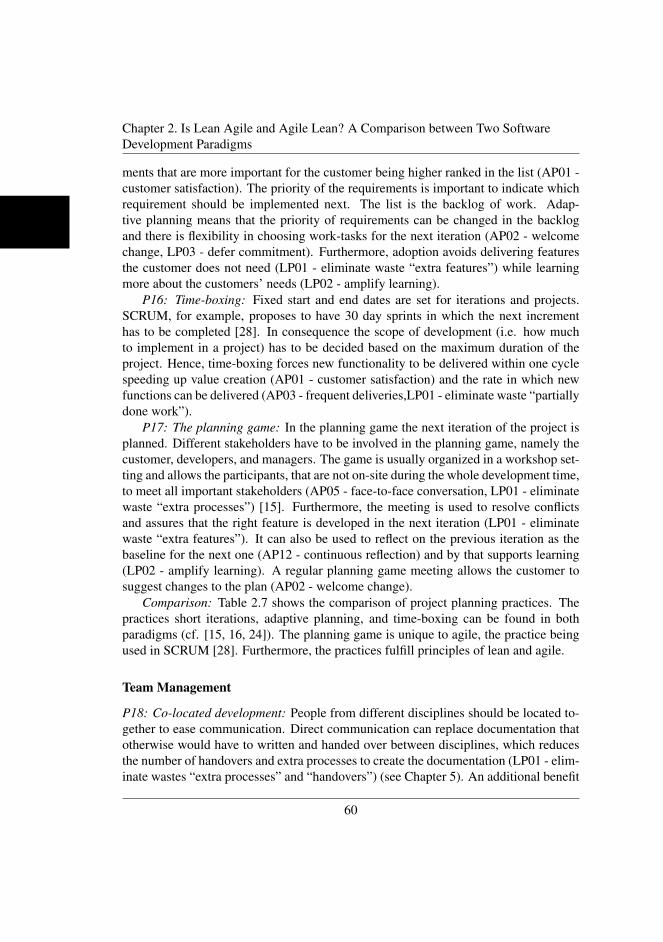
Chapter 2. Is Lean Agile and Agile Lean? A Comparison between Two SoftwareDevelopment Paradigms
ments that are more important for the customer being higher ranked in the list (AP01 -customer satisfaction). The priority of the requirements is important to indicate whichrequirement should be implemented next. The list is the backlog of work. Adap-tive planning means that the priority of requirements can be changed in the backlogand there is flexibility in choosing work-tasks for the next iteration (AP02 - welcomechange, LP03 - defer commitment). Furthermore, adoption avoids delivering featuresthe customer does not need (LP01 - eliminate waste “extra features”) while learningmore about the customers’ needs (LP02 - amplify learning).
P16: Time-boxing: Fixed start and end dates are set for iterations and projects.SCRUM, for example, proposes to have 30 day sprints in which the next incrementhas to be completed [28]. In consequence the scope of development (i.e. how muchto implement in a project) has to be decided based on the maximum duration of theproject. Hence, time-boxing forces new functionality to be delivered within one cyclespeeding up value creation (AP01 - customer satisfaction) and the rate in which newfunctions can be delivered (AP03 - frequent deliveries,LP01 - eliminate waste “partiallydone work”).
P17: The planning game: In the planning game the next iteration of the project isplanned. Different stakeholders have to be involved in the planning game, namely thecustomer, developers, and managers. The game is usually organized in a workshop set-ting and allows the participants, that are not on-site during the whole development time,to meet all important stakeholders (AP05 - face-to-face conversation, LP01 - eliminatewaste “extra processes”) [15]. Furthermore, the meeting is used to resolve conflictsand assures that the right feature is developed in the next iteration (LP01 - eliminatewaste “extra features”). It can also be used to reflect on the previous iteration as thebaseline for the next one (AP12 - continuous reflection) and by that supports learning(LP02 - amplify learning). A regular planning game meeting allows the customer tosuggest changes to the plan (AP02 - welcome change).
Comparison: Table 2.7 shows the comparison of project planning practices. Thepractices short iterations, adaptive planning, and time-boxing can be found in bothparadigms (cf. [15, 16, 24]). The planning game is unique to agile, the practice beingused in SCRUM [28]. Furthermore, the practices fulfill principles of lean and agile.
Team Management
P18: Co-located development: People from different disciplines should be located to-gether to ease communication. Direct communication can replace documentation thatotherwise would have to written and handed over between disciplines, which reducesthe number of handovers and extra processes to create the documentation (LP01 - elim-inate wastes “extra processes” and “handovers”) (see Chapter 5). An additional benefit
60
Table 2.7: Comparison for Project Planning Practices
P17: The planning game: In the planning game the next iteration of the project is planned.
Different stakeholders have to be involved in the planning game, namely the customer,
developers, and managers. The game is usually organized in a workshop setting and allows the
participants, that are not on-site during the whole development time, to meet all important
stakeholders (AP05 - face-to-face conversation, LP01 - eliminate waste “extra processes”) [Koch
2005]. Furthermore, the meeting is used to resolve conflicts and assures that the right feature is
developed in the next iteration (LP01 – eliminate waste “extra features”). It can also be used to
reflect on the previous iteration as the baseline for the next one (AP12 - continuous reflection)
and by that supports learning (LP02 - amplify learning). A regular planning game meeting allows
the customer to suggest changes to the plan (AP02 - welcome change).
Comparison: Fehler! Verweisquelle konnte nicht gefunden werden. shows the comparison of
project planning practices. The practices short iterations, adaptive planning, and time-boxing can
be found in both paradigms (cf. [Poppendieck and Poppendieck 2003][Larman 2004][Koch
2005])). The planning game is unique to agile, the practice being used in Scrum [Schwaber 2004].
Furthermore, the practices fulfill principles of lean and agile.
AP
01: C
usto
mer p
rio
AP
02: W
elcom
e chan
ge
AP
03: F
requent d
el.
AP
04: W
ork
togeth
er
AP
05: M
otiv
ated in
div
id.
AP
06: F
ace-to-face co
nv.
AP
07: W
ork
ing so
ftware
AP
08: S
usta
inable p
ace
AP
09: T
echnical e
xcel.
AP
10: S
implicity
AP
11: S
elf-org
. teams
AP
12: C
ontin
uo
us refl.
LP
01: E
limin
ate w
aste
LP
02: A
mplify
learnin
g
LP
03: D
efer com
mit.
LP
04: D
eliver fast
LP
05: R
esp
ect people
LP
06: B
uild
quality
in
LP
07: S
ee the w
hole
Used
in lea
n S
E
Used
in ag
ile SE
P14: Short iterations √ √ √ √ √ √ √ √ √ √
P15: Adaptive Planning √ √ √ √ √ √ √
P16: Time-boxing √ √ √ √ √
P17: Planning game √ √ √ √ √ √ √
2.3.6 Team Management
P18: Co-located development: People from different disciplines should be located together to
ease communication. Direct communication can replace documentation that otherwise would
have to written and handed over between disciplines, which reduces the number of handovers and
extra processes to create the documentation (LP01 – eliminate wastes “extra processes” and
“handovers”) [Petersen and Wohlin 2009a]. An additional benefit is that people do not have to
move around or wait to discuss (motion/task-switching), which eases learning from each other
(LP02 - amplify learning). With the removal of this waste one can concentrate on value-adding
activities instead (AP01 - customer satisfaction). The continuous discussions between team
members also aid in the continuous reflection with regard to the ways of working (AP12 -
continuous reflection).
P19: Cross-functional teams: Teams need to be cross-functional so that they gather the
competence needed to develop a feature. Two situations are shown in Figure 2. In the first
is that people do not have to move around or wait to discuss (motion/task-switching),which eases learning from each other (LP02 - amplify learning). With the removalof this waste one can concentrate on value-adding activities instead (AP01 - customersatisfaction). The continuous discussions between team members also aid in the con-tinuous reflection with regard to the ways of working (AP12 - continuous reflection).
P19: Cross-functional teams: Teams need to be cross-functional so that they gatherthe competence needed to develop a feature. Two situations are shown in Figure 2.2. Inthe first situation (top of the figure) a development-centric organization is shown whereother disciplines, such as requirements and testing, exchange information with the de-velopment team. There is also information exchange between each of the disciplines,which is not included in the figure for simplification. The separation of the develop-ment team (coding) from other disciplines hinders the exchange of information (e.g.in the form of barriers and lack of understanding for each other) (cf. [8, 21]). Con-sequently, it is beneficial to create cross-functional teams where each discipline has atleast one representative in the team (see bottom of the figure) [19, 13]. The represen-tation of different disciplines helps them in learning from each other (LP02 - amplifylearning), and assures that business and technical people work together and developan understanding for each other’s work (AP04 - work together). Furthermore, peopledo not have to search long to find the right competence (LP01 - eliminate waste “mo-tion/task switching”) and do not have to rely on handovers and documentation (LP01- eliminate wastes “extra processes” and “handovers”). Overall, the avoidance of han-dovers and extensive documentation frees resources for value-adding activities (AP01- customer satisfaction).
P20: 40-hour week: Overtime should be avoided as rested people produce better
61
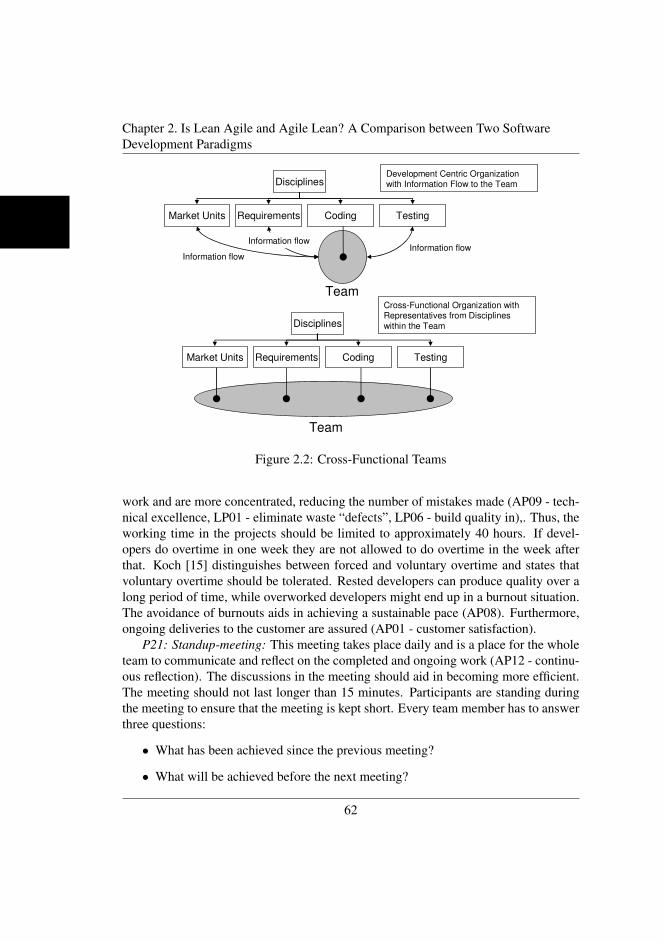
Chapter 2. Is Lean Agile and Agile Lean? A Comparison between Two SoftwareDevelopment Paradigms
situation (top of the figure) a development-centric organization is shown where other disciplines,
such as requirements and testing, exchange information with the development team. There is also
information exchange between each of the disciplines, which is not included in the figure for
simplification. The separation of the development team (coding) from other disciplines hinders
the exchange of information (e.g. in the form of barriers and lack of understanding for each other)
(cf. [Petersen and Wohlin 2009a][Dybå and Dingsøyr 2008]). Consequently, it is beneficial to
create cross-functional teams where each discipline has at least one representative in the team
(see bottom of the figure) [Morgan and Liker 2006][Karlsson and Ahlström 2009]. This helps
them in learning from each other (LP02 - amplify learning), and assures that business and
technical people work together and develop an understanding for each other’s work (AP04 - work
together). Furthermore, people do not have to search long to find the right competence (LP01 –
eliminate waste “motion/task switching”) and do not have to rely on handovers and
documentation (LP01 – eliminate wastes “extra processes” and “handovers”). Overall, this frees
resources for value-adding activities (AP01 - customer satisfaction).
Disciplines
Requirements Coding TestingMarket Units
Information flow
Information flow
Information flow
Team
Development Centric Organization
with Information Flow to the Team
Disciplines
Requirements Coding TestingMarket Units
Team
Cross-Functional Organization with
Representatives from Disciplines
within the Team
Figure 2 - Cross-functional teams
P20: 40-hour week: Overtime should be avoided as rested people produce better work and are
more concentrated, reducing the number of mistakes made (AP09 - technical excellence, LP01 –
eliminate waste “defects”, LP06 - build quality in),. Thus, the working time in the projects should
be limited to approximately 40 hours. If developers do overtime in one week they are not allowed
to do overtime in the week after that. Koch [Koch 2005] distinguishes between forced and
voluntary overtime and states that voluntary overtime should be tolerated. Rested developers can
produce quality over a long period of time, while overworked developers might end up in a
burnout situation. The avoidance of burnouts aids in achieving a sustainable pace (AP08).
Furthermore, ongoing deliveries to the customer are assured (AP01 - customer satisfaction).
Figure 2.2: Cross-Functional Teams
work and are more concentrated, reducing the number of mistakes made (AP09 - tech-nical excellence, LP01 - eliminate waste “defects”, LP06 - build quality in),. Thus, theworking time in the projects should be limited to approximately 40 hours. If devel-opers do overtime in one week they are not allowed to do overtime in the week afterthat. Koch [15] distinguishes between forced and voluntary overtime and states thatvoluntary overtime should be tolerated. Rested developers can produce quality over along period of time, while overworked developers might end up in a burnout situation.The avoidance of burnouts aids in achieving a sustainable pace (AP08). Furthermore,ongoing deliveries to the customer are assured (AP01 - customer satisfaction).
P21: Standup-meeting: This meeting takes place daily and is a place for the wholeteam to communicate and reflect on the completed and ongoing work (AP12 - continu-ous reflection). The discussions in the meeting should aid in becoming more efficient.The meeting should not last longer than 15 minutes. Participants are standing duringthe meeting to ensure that the meeting is kept short. Every team member has to answerthree questions:
• What has been achieved since the previous meeting?
• What will be achieved before the next meeting?
62
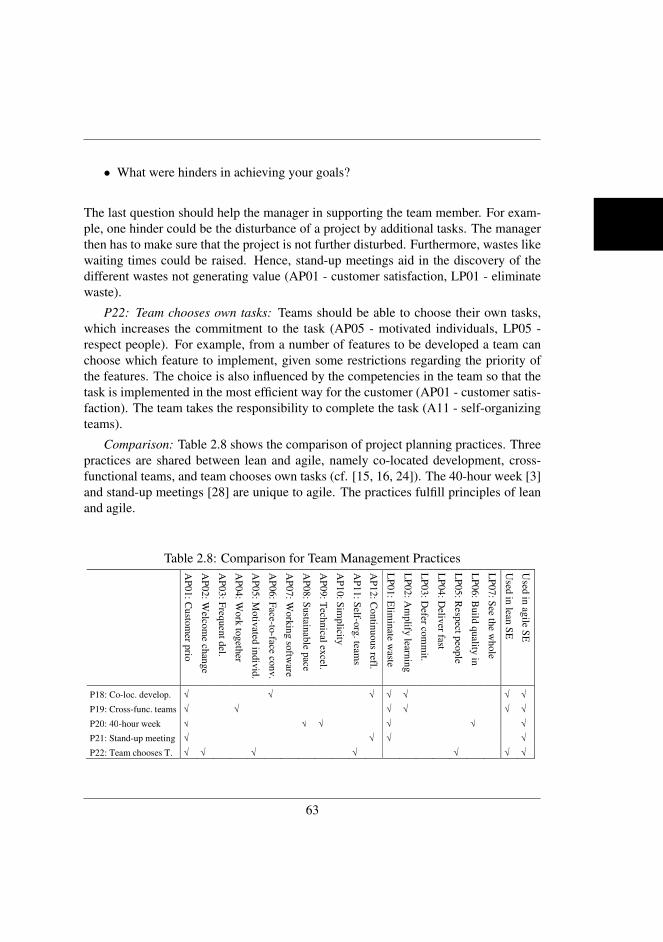
• What were hinders in achieving your goals?
The last question should help the manager in supporting the team member. For exam-ple, one hinder could be the disturbance of a project by additional tasks. The managerthen has to make sure that the project is not further disturbed. Furthermore, wastes likewaiting times could be raised. Hence, stand-up meetings aid in the discovery of thedifferent wastes not generating value (AP01 - customer satisfaction, LP01 - eliminatewaste).
P22: Team chooses own tasks: Teams should be able to choose their own tasks,which increases the commitment to the task (AP05 - motivated individuals, LP05 -respect people). For example, from a number of features to be developed a team canchoose which feature to implement, given some restrictions regarding the priority ofthe features. The choice is also influenced by the competencies in the team so that thetask is implemented in the most efficient way for the customer (AP01 - customer satis-faction). The team takes the responsibility to complete the task (A11 - self-organizingteams).
Comparison: Table 2.8 shows the comparison of project planning practices. Threepractices are shared between lean and agile, namely co-located development, cross-functional teams, and team chooses own tasks (cf. [15, 16, 24]). The 40-hour week [3]and stand-up meetings [28] are unique to agile. The practices fulfill principles of leanand agile.
Table 2.8: Comparison for Team Management Practices
P21: Standup-meeting: This meeting takes place daily and is a place for the whole team to
communicate and reflect on the completed and ongoing work (AP12 - continuous reflection). The
discussions in the meeting should aid in becoming more efficient. The meeting should not last
longer than 15 minutes. Participants are standing during the meeting to ensure that the meeting is
kept short. Every team member has to answer three questions:
• What has been achieved since the previous meeting?
• What will be achieved before the next meeting?
• What were hinders in achieving your goals?
The last question should help the manager in supporting the team member. For example, one
hinder could be the disturbance of a project by additional tasks. The manager then has to make
sure that the project is not further disturbed. Furthermore, wastes like waiting times could be
raised. Hence, stand-up meetings aid in the discovery of the different wastes not generating value
(AP01 - customer satisfaction, LP01 – eliminate waste).
P22: Team chooses own tasks: Teams should be able to choose their own tasks, which increases
the commitment to the task (AP05 - motivated individuals, LP05 - respect people). For example,
from a number of features to be developed a team can choose which feature to implement, given
some restrictions regarding the priority of the features. The choice is also influenced by the
competencies in the team so that the task is implemented in the most efficient way for the
customer (AP01 - customer satisfaction). The team takes the responsibility to complete the task
(A11 - self-organizing teams).
Comparison: Fehler! Verweisquelle konnte nicht gefunden werden. shows the comparison of
project planning practices. Three practices are shared between lean and agile, namely co-located
development, cross-functional teams, and team chooses own tasks (cf. [Poppendieck and
Poppendieck 2003][Larman 2004][Koch 2005])). The 40-hour week [Beck 2000] and stand-up
meetings [Schwaber 2004] are unique to agile. The practices fulfill principles of lean and agile.
AP
01: C
usto
mer p
rio
AP
02: W
elcom
e chan
ge
AP
03: F
requent d
el.
AP
04: W
ork
togeth
er
AP
05: M
otiv
ated in
div
id.
AP
06: F
ace-to-face co
nv.
AP
07: W
ork
ing so
ftware
AP
08: S
usta
inable p
ace
AP
09: T
echnical ex
cel.
AP
10: S
implicity
AP
11: S
elf-org
. teams
AP
12: C
ontin
uo
us refl.
LP
01: E
limin
ate w
aste
LP
02: A
mplify
learnin
g
LP
03: D
efer com
mit.
LP
04: D
eliver fast
LP
05: R
esp
ect people
LP
06: B
uild
quality
in
LP
07: S
ee the w
hole
Used
in lea
n S
E
Used
in ag
ile SE
P18: Co-loc. develop. √ √ √ √ √ √ √
P19: Cross-func. teams √ √ √ √ √ √
P20: 40-hour week √ √ √ √ √ √
P21: Stand-up meeting √ √ √ √
P22: Team chooses T. √ √ √ √ √ √ √
2.3.7 E2E Flow
63
Chapter 2. Is Lean Agile and Agile Lean? A Comparison between Two SoftwareDevelopment Paradigms
E2E Flow
P23: Value-stream mapping: A value-stream map visualizes the end-to-end flow of theoverall development lifecycle [19], i.e. the emphasis is on seeing the whole (LP07).The map shows the activities and lead-times. The lead-times are separated into pro-cessing time and waiting time. Processing time means that work is done during thattime (e.g. a requirement is implemented). Waiting time means that nobody workson the requirement (e.g. the requirement has been implemented and is waiting to betested). The processing time value is added to the product while waiting time is non-value adding. The overall lead time is the sum of all waiting and processing times. Themap should help in identifying everything that does not contribute to the value of thecustomer (AP01 - customer satisfaction). A value-stream map analysis is conducted infour steps:
• Create current-state value-stream map: First, the value-stream map is created byfollowing the steps a single work product (e.g. requirements, test cases, changerequests, etc.). The data is collected through interviews across the lifecycle ofthe work product. If lead time measurements are available then these should beconsidered as well.
• Analyze current-state value-stream map: The map is analyzed by looking atcritical wastes as those have the largest improvement potential. The criticality oflead times from an end to end perspective can be determined by calculating theratio of non-value adding time and overall lead time.
• Identify reasons for waiting times and propose improvements: The reasons forwaiting times and long processing times are identified in workshops and discus-sions with practitioners, e.g. in form of a root cause analysis [1]. During the rootcause analysis all types of waste can be discovered by having a dialogue aboutthe map. For example, by asking an engineer why a certain activity takes so longthe engineer can pinpoint many types of waste (LP01 - eliminate wastes W1 toW7). Depending on the nature of the problems for long processing and waitingtimes the value stream map can potentially pinpoint to reasons that, when beingaddressed, fulfill any of the principles of agile and lean development (AP01 toAP12 and LP01 to LP07)
• Create future-state map: Solutions are proposed for the identified problems andthe potential of the solution candidates in reducing the waiting and processingtimes is evaluated. Based on the assessment of the improvement suggestions anew map (future-state map) can be constructed. The future-state map provides
64
an indication of the overall improvement potential in terms of lead-time whenimplementing the solutions.
An example of an analysis of a software process for product customizations with value-stream maps and the notation to illustrate them can be found in [20].
P24: Inventory management with queuing theory and theory of constraints: Inven-tory is the work in process that is not completed and thus does not provide value to cus-tomers. High inventory levels have a negative impact on the performance of softwaredevelopment for multiple reasons: (1) Inventory hides defects (hinders fulfilling AP07- working software, AP09 - technical excellence, LP01 - eliminate waste “defects”,and LP06 - build quality in); (2) Time and effort has been spent on the artifacts in theinventory and when not making them available to the market they might become ob-solete (hinders fulfilling AP03 - frequent deliveries, LP01 - eliminate waste “partiallydone work”, and LP04 - deliver as fast as possible) [23]; (3) Inventory creates waitingand slows down the development flow (hinders fulfilling AP03 - frequent deliveries,LP01 - eliminate waste “delays”, and LP04 - deliver as fast as possible). Point (3) canbe related to queuing theory where one can calculate the work-in-process and the timework stays in process based on arrival distributions and processing times (distributionof time needed for the server, e.g. a development team, to complete a task), and bythat identify overload situations. An example of identifying overload situations withqueuing theory based on real world data for a requirements process is shown in [12].In order to achieve a continuous flow of development the workload should be belowthe capacity of the development organization (see Chapter 7). Being below the capac-ity also allows for emergency situations (e.g. customer faults, emerging high priorityrequirements).
The theory of constraints (TOC) also helps to reduce inventory levels. TOC con-sists of five steps: (1) Identify the system constraint; (2) Decide candidate solutionsof how to remove the constraint; (3) Select candidate solution that is focused on con-straint; (4) Remove constraint with selected solution; (5) go to step (1) to see whethera new system constraint has become visible [2]. The constraint can be identified bylooking at processing times of different steps in the development flow. For example,how many requirements are processed per time unit (e.g. weeks) in different phases(e.g. requirements specification, design, implementation, testing, and release)? If theprocessing time for test produces the least amount of requirements per time unit thenthis is the constraint. As the constraint produces at a slower rate than the other activitiesinventories that are inputs to the constraint will grow. A method for integrated analysisof multiple inventories is presented in Chapter 7. As in value-stream maps the focushas to be on the end-to-end flow to avoid sub-optimization (LP07) and to achieve acontinuous flow of customer value (AP01 - customer satisfaction).
65
Chapter 2. Is Lean Agile and Agile Lean? A Comparison between Two SoftwareDevelopment Paradigms
P25: Chief engineer: The chief engineer is one person that is accountable for thesuccess and failure of the development teams. The chief engineer has a wide range ofresponsibilities (voice of the customer, product concepts and requirements, product ar-chitecture and performance, product planning) and requires special abilities (feeling forthe needs of customers, exceptional engineering skills, intuition, hard driving teacherand motivator, patient listener, exceptional communicator, etc.) [19]. At the same timethe chief engineer does not have formal authorities over the teams. Overall, the chiefengineer is an important driving force in optimizing value creation which makes himan initiator to any potential improvement towards agile (AP01 to AP12) or lean (LP01to LP07).
P26: Kanban pull-system: In a push system requirements are pushed from therequirements activity into the development organization, e.g. by defining a require-ments road map and assigning time slots for each requirement. The push approachis likely to result in an overload situation. The Kanban approach, on the other hand,is a pull approach that avoids planning too far ahead (AP02 - welcome change, LP03- defer commitment). When a work team (or machine in the manufacturing context)has free capacity a signal is given that the next work task can be taken. For softwareengineering this means that the development systems would pull requirements froma prioritized requirements list when they have enough free capacity. However, teamsshould not pull new work if there is not enough capacity as this would result in anoverload situation creating inventory (LP01 - eliminate waste “partially done work”).Furthermore, if possible they should pull work that has highest priority to the customer(AP01 - customer satisfaction). This strategy might not always be possible due to com-plex dependencies between features. The management of Kanban is supported by aso-called Kanban board (see Figure 2.3). The Kanban board also shows the progressof development, which fulfills the call of FDD for a progress measure visualizing whathas been achieved.
Comparison: Table 2.9 shows the comparison of E2E flow practices. All practicespresented in the table are unique to lean as the “see the whole” principle is the driverfor their usage. For the value-stream map and the chief engineer all principles of leanand agile are ticked. That does not mean that the approaches guarantee the fulfillmentof all principles. However, the value-stream map is a tool that can potentially drivethe implementation of practices that fulfill the principles. For example, if the value-stream map helps to discover that long waiting times are due to overload situation thenthe improvement could be to apply the techniques related to inventory management,as well as to implement a Kanban pull approach. Another discovery through value-streams might be long processing times due to a lack of motivation, which could leadto the practice of teams choosing their own tasks. The chief engineer has all principlesticked as he/she is a potential driver for the improvements by having an overall picture
66
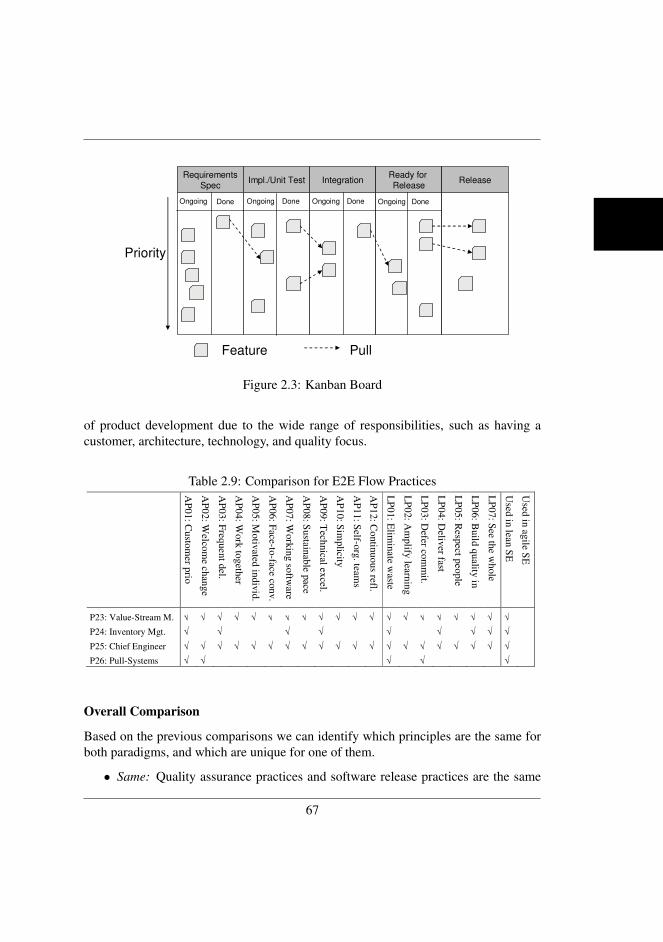
Kanban board also shows the progress of development, which fulfills the call of FDD for a
progress measure visualizing what has been achieved.
Figure 3 - Kanban Board
Requirements
Spec
Impl./Unit Test Integration
Ready for
Release
Release
Priority
Feature Pull
Ongoing Done Ongoing Done Ongoing Done Ongoing Done
Comparison: Table 3 shows the comparison of E2E flow practices. All practices presented in the
table are unique to lean as the “see the whole” principle is the driver for their usage. For the
value-stream map and the chief engineer all principles of lean and agile are ticked. That does not
mean that the approaches guarantee the fulfillment of all principles. However, the value-stream
map is a tool that can potentially drive the implementation of practices that fulfill the principles.
For example, if the value-stream map helps to discover that long waiting times are due to
overload situation then the improvement could be to apply the techniques related to inventory
management, as well as to implement a Kanban pull approach. Another discovery through value-
streams might be long processing times due to a lack of motivation, which could lead to the
practice of teams choosing their own tasks. The chief engineer has all principles ticked as he/she
is a potential driver for the improvements by having an overall picture of product development
due to the wide range of responsibilities, such as having a customer, architecture, technology, and
quality focus.
Table 3 - Comparison for E2E Flow Practices
AP
01: C
usto
mer p
rio
AP
02: W
elcom
e chan
ge
AP
03: F
requent d
el.
AP
04: W
ork
togeth
er
AP
05: M
otiv
ated in
div
id.
AP
06: F
ace-to-face co
nv.
AP
07: W
ork
ing so
ftware
AP
08: S
usta
inable p
ace
AP
09: T
echnical e
xcel.
AP
10: S
implicity
AP
11: S
elf-org
. teams
AP
12: C
ontin
uo
us refl.
LP
01: E
limin
ate w
aste
LP
02: A
mplify
learnin
g
LP
03: D
efer com
mit.
LP
04: D
eliver fast
LP
05: R
esp
ect people
LP
06: B
uild
quality
in
LP
07: S
ee the w
hole
Used
in lea
n S
E
Used
in ag
ile SE
P23: Value-Stream M. √ √ √ √ √ √ √ √ √ √ √ √ √ √ √ √ √ √ √ √
P24: Inventory Mgt. √ √ √ √ √ √ √ √ √
P25: Chief Engineer √ √ √ √ √ √ √ √ √ √ √ √ √ √ √ √ √ √ √ √
P26: Pull-Systems √ √ √ √ √
2.3.8 Overall Comparison
Figure 2.3: Kanban Board
of product development due to the wide range of responsibilities, such as having acustomer, architecture, technology, and quality focus.
Table 2.9: Comparison for E2E Flow Practices
Kanban board also shows the progress of development, which fulfills the call of FDD for a
progress measure visualizing what has been achieved.
Figure 3 - Kanban Board
Requirements
Spec
Impl./Unit Test Integration
Ready for
Release
Release
Priority
Feature Pull
Ongoing Done Ongoing Done Ongoing Done Ongoing Done
Comparison: Fehler! Verweisquelle konnte nicht gefunden werden. shows the comparison of
E2E flow practices. All practices presented in the table are unique to lean as the “see the whole”
principle is the driver for their usage. For the value-stream map and the chief engineer all
principles of lean and agile are ticked. That does not mean that the approaches guarantee the
fulfillment of all principles. However, the value-stream map is a tool that can potentially drive the
implementation of practices that fulfill the principles. For example, if the value-stream map helps
to discover that long waiting times are due to overload situation then the improvement could be to
apply the techniques related to inventory management, as well as to implement a Kanban pull
approach. Another discovery through value-streams might be long processing times due to a lack
of motivation, which could lead to the practice of teams choosing their own tasks. The chief
engineer has all principles ticked as he/she is a potential driver for the improvements by having
an overall picture of product development due to the wide range of responsibilities, such as
having a customer, architecture, technology, and quality focus.
AP
01: C
usto
mer p
rio
AP
02: W
elcom
e chan
ge
AP
03: F
requent d
el.
AP
04: W
ork
togeth
er
AP
05: M
otiv
ated in
div
id.
AP
06: F
ace-to-face co
nv.
AP
07: W
ork
ing so
ftware
AP
08: S
usta
inable p
ace
AP
09: T
echnical e
xcel.
AP
10: S
implicity
AP
11: S
elf-org
. teams
AP
12: C
ontin
uo
us refl.
LP
01: E
limin
ate w
aste
LP
02: A
mplify
learnin
g
LP
03: D
efer com
mit.
LP
04: D
eliver fast
LP
05: R
esp
ect people
LP
06: B
uild
quality
in
LP
07: S
ee the w
hole
Used
in lea
n S
E
Used
in ag
ile SE
P23: Value-Stream M. √ √ √ √ √ √ √ √ √ √ √ √ √ √ √ √ √ √ √ √
P24: Inventory Mgt. √ √ √ √ √ √ √ √ √
P25: Chief Engineer √ √ √ √ √ √ √ √ √ √ √ √ √ √ √ √ √ √ √ √
P26: Pull-Systems √ √ √ √ √
2.3.8 Overall Comparison
Overall Comparison
Based on the previous comparisons we can identify which principles are the same forboth paradigms, and which are unique for one of them.
• Same: Quality assurance practices and software release practices are the same
67
Chapter 2. Is Lean Agile and Agile Lean? A Comparison between Two SoftwareDevelopment Paradigms
for both paradigms. Hence, for these practices lean is agile and agile is lean. Allother groups contain practices that are either unique to agile or lean. In total 15practices are shared between lean and agile.
• Unique to agile: The following practices have been identified as unique to ag-ile: on-site customer, coding standards, team-code ownership, planning game,40 hour week, and stand-up meetings. In consequence for the practices the con-clusion is that lean is not agile. However, all practices identified for agile supportlean principles and hence are potentially valuable to lean software development.
• Unique to lean: One principle in the group “design and implementation” isunique to lean, namely low dependency architecture. Furthermore, all princi-ples connected to the E2E perspective can only be found in the lean context.This is due to the principle “see the whole” that distinguishes lean from agileregarding the principles.
Overall, the analysis shows that lean as well as agile have unique practices (lean hasfive, and agile has six). Hence, when it comes to practices the statement lean is not ag-ile, and agile is not lean is partially true. The majority of practices are shared betweenboth paradigms. The explanation for the differences can be found in the propositionsstated earlier, namely that both paradigms see different ways of implementing theirpractices, and that lean has a specific focus on E2E which results in unique lean prac-tices.
2.3.4 Processes
The agile development paradigm consists of a number of instantiations in the form ofagile processes. The most famous representatives are eXtreme programming (XP) andSCRUM. Both paradigms consist of a set of principles, but also describe a workflowand artifacts that are produced in the process. Detailed descriptions of the processes canbe found in [28] for SCRUM and in [3] for XP. However, lean software developmentdoes not propose a workflow or the production of specific artifacts. Rather lean statesprinciples and provides analysis tools for processes to guide engineers in improvingtheir processes to achieve a good flow of value. An advantage of not providing aprocess is that the approaches of lean become more generally applicable, while anagile process often needs tailoring to a specific context. That is, the general agileprocess models are often not applied exactly as they are described in the books, but aretailored to the specific needs of the context in which they are used (see Chapter 5).
68
2.4 Discussion
2.4.1 Practical Implications
Potential benefit of E2E perspective in agile: The lean practices (value-stream map-ping, inventory management, chief engineer, and pull-systems) are potentially strongtools to support the E2E flow of agile software development. When not having the E2Efocus in mind there is, for example, a risk that agile is only implemented in implemen-tation projects and not in the overall development lifecycle. Though, the benefits ofagile cannot be leveraged when not focusing on the overall development lifecycle andbalancing the flow of work across the complete development lifecycle. Hence, whenmoving towards agile it is not enough to make the projects agile, as this is likely toresult in a sub-optimization of the actual implementation and testing part of develop-ment. An additional risk is that the overall flow of requirements is not continuous dueto coordination problems when developing large systems with many teams (see Chap-ter 5). How well the flow actually works can be evaluated with value stream maps andinventory management as shown in [20, 22]. Vice versa, lean could also benefit fromthe principles unique to agile.
Looking for evidence: Companies are interested in research results that show whichpractices are most successful in specific contexts. A company wanting to know aboutthe benefits of lean practices should turn to the agile literature due to the large overlapbetween lean and agile principles. We also have shown that agile principles positivelyinfluence the principles of lean as well. Only very little is known about the principlesand practices that are related to “see the whole”, thus companies looking for infor-mation related to principles with an E2E focus will not find much information in thesoftware engineering literature. The high overlap between lean and agile also meansthat companies having adopted agile practices are not too far away from having a leansoftware process, given that they add the flow and E2E perspective on-top of theircurrent practices.
2.4.2 Research Implications
Combination of practices: The agile community often states that an agile process onlyworks if all its principles are implemented. However, there is little empirical evidencefor this statement. In particular, there is little evidence for which combinations of prac-tices work well in which context (e.g. large-scale vs. small-scale, telecommunicationvs. information systems, and so forth). Hence, future research should focus on figur-ing out which combinations of practices are most beneficial, depending on the context.For example, different practices contribute to the quality related principles. Hence, it
69
Chapter 2. Is Lean Agile and Agile Lean? A Comparison between Two SoftwareDevelopment Paradigms
is interesting to know which combination of quality assurance practices is most costefficient, which calls for further empirical evidence.
Investigate practices related to E2E flow: Several books describe lean practicesrelated to the end to end flow of software development. Though, no research (industrialcase studies, experiments, or simulations) document the benefits and challenges relatedto their usage. For example, further case studies are needed that apply value-streammaps in practice. In addition, little work is done on inventory management and Kanbanimplementations in software development. We believe that the evaluations will aidin driving the technology transfer of value-stream maps, inventory management, andKanban.
Overall, lean software development is a research area with great promise and littlework done, making it an attractive field for software engineering research.
2.5 Conclusion
This chapter compares two development paradigms (lean and agile development) whichare of high relevance for industry due to that they focus on making companies agilein responding to changing market needs. The ability to respond quickly is essentialin today’s rapidly changing market. The result of the comparison is: (1) Agile andlean agree on the goals they want to achieve; (2) Lean is agile in the sense that theprinciples of lean reflect the principles of agile, while lean is unique in stressing theend-to-end perspective more; (3) Lean has adopted many practices known in the agilecontext, while stressing the importance of using practices that are related to the end-to-end flow. These practices are value-stream maps, inventory management, Kanban pullsystems, and the use of a chief engineer. In addition, agile uses practices that are notfound in lean. The practical implications are that: (1) Industry can potentially benefitfrom adopting lean practices related to flow, which helped to revolutionize manufac-turing and product development; (2) Companies looking for evidence on lean will findimportant information in the agile literature as there is a high overlap between leanand agile. However, few papers are available that focus on the flow aspect in the soft-ware engineering context. The research implications are: (1) Research should focuson investigating which combination of practices should be recommended to industrydepending on the industrial context, and (2) practices related to the E2E flow should beinvestigated to provide evidence for their benefit in the software engineering context.
70
2.6 References[1] Bjørn Andersen and Tom Fagerhaug. Root cause analysis: simplified tools and
techniques. ASQ Quality, Milwaukee, Wis., 2000.
[2] David Anderson. Agile management for software engineering: applying the the-ory of constraints for business results. Prentice Hall, 2003.
[3] Kent Beck. Extreme Programming explained: embrace change. Addison-Wesley,Reading, Mass., 2000.
[4] Kent Beck. Test-driven development: by example. Addison-Wesley, Boston, MA,2003.
[5] Kent Beck. JUnit pocket guide. O’Reilly, Sebastopol, Calif., 2004.
[6] Sarah Beecham, Nathan Baddoo, Tracy Hall, Hugh Robinson, and Helen Sharp.Motivation in software engineering: A systematic literature review. Information& Software Technology, 50(9-10):860–878, 2008.
[7] Tom DeMarco and Timothy Lister. Peopleware: productive projects and teams.Dorset House Pub, New York, 2. ed. edition, 1999.
[8] Tore Dyba and Torgeir Dingsøyr. Empirical studies of agile software develop-ment: A systematic review. Information & Software Technology, 50(9-10):833–859, 2008.
[9] Kent Beck et al. Manifesto for agile software development. Web:http://agilemanifesto.org, 2010.
[10] Michael E. Fagan. Design and code inspections to reduce errors in program de-velopment. IBM Systems Journal, 15(3):182–211, 1976.
[11] Michael Hirsch. Moving from a plan driven culture to agile development. InProceedings of the 27th International Conference on Software Engineering (ICSE2005), page 38, 2005.
[12] Martin Host, Bjorn Regnell, Johan Natt och Dag, Josef Nedstam, and Chris-tian Nyberg. Exploring bottlenecks in market-driven requirements managementprocesses with discrete event simulation. Journal of Systems and Software,59(3):323–332, 2001.
[13] Christer Karlsson and Par Ahlstrohm. The difficult path to lean product develop-ment. Journal of Product Innovation Management, 13(4):283–295, 2009.
71
REFERENCES
[14] Joshua Kerievsky. Refactoring to patterns. Addison-Wesley, Boston, 2005.
[15] Alan S. Koch. Agile software development: evaluating the methods for yourorganization. Artech House, Boston, 2005.
[16] Craig Larman. Agile and iterative development: a manager’s guide. Addison-Wesley, Boston, 2004.
[17] Alexis Leon. Software configuration management handbook. Artech House,Boston, Mass., 2. ed. edition, 2005.
[18] Sun Microsystems. Java code conventions. http://java.sun.com/docs/codeconv.
[19] James M Morgan and Jeffrey K. Liker. The Toyota product development system:integrating people, process, and technology. Productivity Press, New York, 2006.
[20] Shahid Mujtaba, Robert Feldt, and Kai Petersen. Waste and lead time reduc-tion in a software product customization process with value stream maps. InTo appear in: Proceedings of the Australian Software Engineering Conference(ASWEC 2010), 2010.
[21] Kai Petersen and Claes Wohlin. A comparison of issues and advantages in ag-ile and incremental development between state of the art and an industrial case.Journal of Systems and Software, 82(9):1479–1490, 2009.
[22] Kai Petersen and Claes Wohlin. Software process improvement through the leanmeasurement (spi-leam) method. Journal of Systems and Software, in print, pages1479–1490, 2010.
[23] Kai Petersen, Claes Wohlin, and Dejan Baca. The waterfall model in large-scale development. In Proceedings of the International Conference on Product-Focused Software Process Improvement(PROFES 2009), pages 386–400, 2009.
[24] Mary Poppendieck and Tom Poppendieck. Lean software development: an agiletoolkit. Addison-Wesley, Boston, 2003.
[25] Mary Poppendieck and Tom Poppendieck. Implementing lean software develop-ment: from concept to cash. Addison-Wesley, 2007.
[26] Mary Poppendieck and Tom Poppendieck. Leading lean software development:results are not the point. Addison-Wesley, Upper Saddle River, NJ, 2010.
[27] Walter Royce. Managing the development of large software systems: Conceptsand techniques. In Proc. IEEE WESCOM. IEEE Computer Society Press, 1970.
72
[28] Ken Schwaber. Agile project management with Scrum. Microsoft Press, Red-mond, Wash., 2004.
[29] Barry Boehm Stefan Biffl, Aybueke Aurum. Value-based software engineering.Springer, New York, NY, 1st ed. edition, 2005.
[30] Gerald M. Weinberg. Egoless programming (excerpt from the psychology ofcomputer programming, silver anniversary edition). IEEE Software, 16(1), 1999.
[31] James P. Womack. The machine that changed the world. Simon & Schuster,London, 2010.
73
REFERENCES
74
Chapter 3
The Waterfall Model inLarge-Scale Development
Kai Petersen, Claes Wohlin, and Dejan BacaPublished in Proceedings of the International Conference on Prod-uct Focused Software Process Improvement (PROFES 2009)
3.1 IntroductionThe first publication on the waterfall model is credited to Walter Royce’s article in1970 (cf. [11]). In literature there seems to be an agreement on problems connected tothe use of the waterfall model. Problems are (among others) that the model does notcope well with change, generates a lot of rework, and leads to unpredictable softwarequality due to late testing [13]. Despite the problems identified, the model is stillwidely used in software industry, some researchers are even convinced that it will bearound for a much longer period of time (see [10]). The following trends can be seenin research. First, the model seems to be of very little interest for researchers to focuson as it seems to be old-fashioned. Instead, recent studies have much more focus onagile and incremental development. Secondly, there is very little empirical researchbacking up what we believe to know about the waterfall model. In order to identifythe evidence provided by empirical research on the waterfall model we conducted thefollowing search on Inspec & Compendex:
75
Chapter 3. The Waterfall Model in Large-Scale Development
• (“waterfall model” OR “waterfall development”) AND (“empirical” OR “casestudy” OR “industrial”)
Inspec & Compendex was selected as it integrates many full-text databases in com-puting and thus is considered a good starting point. The search resulted in 33 publi-cations where none of the publications had an explicit focus on studying the waterfallmodel in an industrial setting. Thus, most of the problems reported on the water-fall model are mainly based on researchers’ beliefs and experience reports. Conse-quently, in order to provide substantial evidence on the usefulness of the waterfallmodel in industry empirical studies are needed. Evaluating the usefulness empiricallyaids decision making of whether to use the model in specific context (here large-scale-development).
To address this research gap we conducted a case study focusing on identifyingissues in waterfall development and compare them to what has been said in literature.Furthermore, the issues identified are ranked based on their criticality. The case beingstudied is a development site of Ericsson AB, Sweden. The waterfall model was usedat the company for several years. The case study has been conducted according to theguidelines provided by Yin (see [15]). The case study makes the following contribu-tions to research on waterfall development: 1) Illustration of the waterfall implementa-tion in practice within large-scale industrial software development, 2) Identification ofissues related to the waterfall model and their prioritization showing the most criticalissues, and 3) Comparison of case study results with state of the art (SotA).
The remainder of this chapter is structured as follows: Section 3.2 provides anoverview of related work. Thereafter, Section 3.3 illustrates the waterfall model usedat the company. Section 3.4 presents the case study design. The analysis of the col-lected data is provided in Section 3.5 (qualitative analysis) and Section 3.6 (quantitativeanalysis). Section 3.7 presents a comparison of the case study findings and state of theart. Section 3.8 concludes the chapter.
3.2 Related WorkLiterature identifies a number of problems related to the waterfall model. An overviewof the problems identified in literature is shown in Table 3.1. In addition to the identi-fied articles we considered books discussing advantages and disadvantages of the wa-terfall model.
The waterfall model is connected to high costs and efforts [13][8]. That is, it re-quires approval of many documents, changes are costly to implement, iterations takea lot of effort and rework, and problems are usually pushed to later phases [13]. Few
76
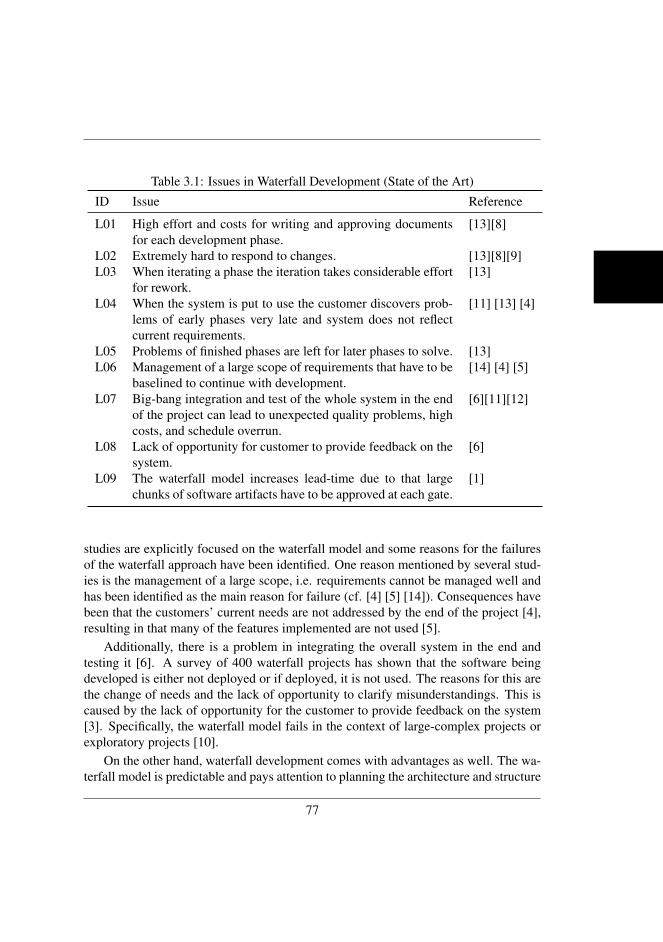
Table 3.1: Issues in Waterfall Development (State of the Art)
ID Issue Reference
L01 High effort and costs for writing and approving documentsfor each development phase.
[13][8]
L02 Extremely hard to respond to changes. [13][8][9]L03 When iterating a phase the iteration takes considerable effort
for rework.[13]
L04 When the system is put to use the customer discovers prob-lems of early phases very late and system does not reflectcurrent requirements.
[11] [13] [4]
L05 Problems of finished phases are left for later phases to solve. [13]L06 Management of a large scope of requirements that have to be
baselined to continue with development.[14] [4] [5]
L07 Big-bang integration and test of the whole system in the endof the project can lead to unexpected quality problems, highcosts, and schedule overrun.
[6][11][12]
L08 Lack of opportunity for customer to provide feedback on thesystem.
[6]
L09 The waterfall model increases lead-time due to that largechunks of software artifacts have to be approved at each gate.
[1]
studies are explicitly focused on the waterfall model and some reasons for the failuresof the waterfall approach have been identified. One reason mentioned by several stud-ies is the management of a large scope, i.e. requirements cannot be managed well andhas been identified as the main reason for failure (cf. [4] [5] [14]). Consequences havebeen that the customers’ current needs are not addressed by the end of the project [4],resulting in that many of the features implemented are not used [5].
Additionally, there is a problem in integrating the overall system in the end andtesting it [6]. A survey of 400 waterfall projects has shown that the software beingdeveloped is either not deployed or if deployed, it is not used. The reasons for this arethe change of needs and the lack of opportunity to clarify misunderstandings. This iscaused by the lack of opportunity for the customer to provide feedback on the system[3]. Specifically, the waterfall model fails in the context of large-complex projects orexploratory projects [10].
On the other hand, waterfall development comes with advantages as well. The wa-terfall model is predictable and pays attention to planning the architecture and structure
77
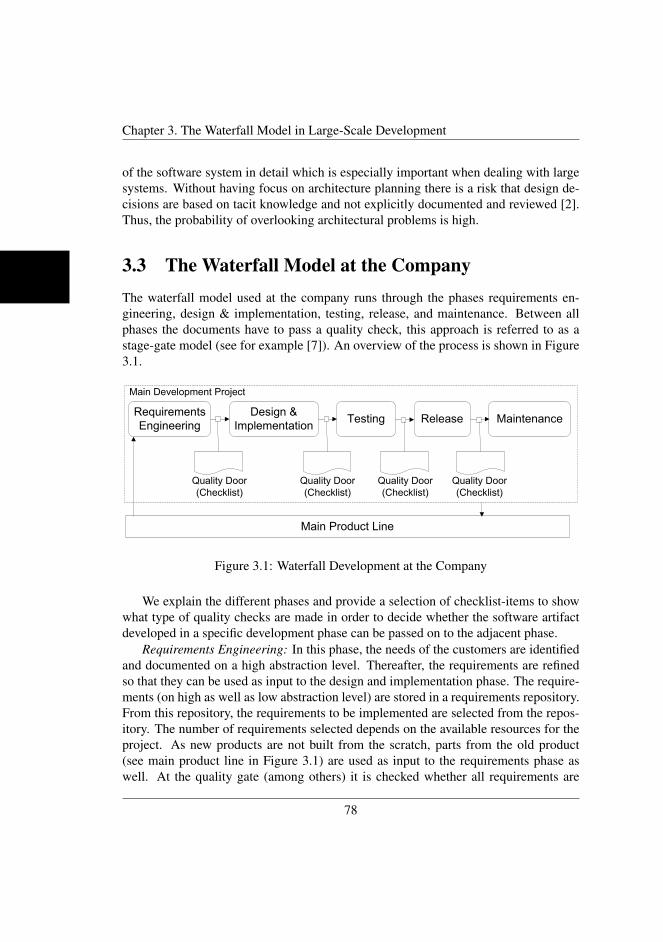
Chapter 3. The Waterfall Model in Large-Scale Development
of the software system in detail which is especially important when dealing with largesystems. Without having focus on architecture planning there is a risk that design de-cisions are based on tacit knowledge and not explicitly documented and reviewed [2].Thus, the probability of overlooking architectural problems is high.
3.3 The Waterfall Model at the CompanyThe waterfall model used at the company runs through the phases requirements en-gineering, design & implementation, testing, release, and maintenance. Between allphases the documents have to pass a quality check, this approach is referred to as astage-gate model (see for example [7]). An overview of the process is shown in Figure3.1.
Main Product Line
Requirements
EngineeringMaintenanceReleaseTesting
Design &
Implementation
Quality Door
(Checklist)
Main Development Project
Quality Door
(Checklist)
Quality Door
(Checklist)
Quality Door
(Checklist)
Figure 3.1: Waterfall Development at the Company
We explain the different phases and provide a selection of checklist-items to showwhat type of quality checks are made in order to decide whether the software artifactdeveloped in a specific development phase can be passed on to the adjacent phase.
Requirements Engineering: In this phase, the needs of the customers are identifiedand documented on a high abstraction level. Thereafter, the requirements are refinedso that they can be used as input to the design and implementation phase. The require-ments (on high as well as low abstraction level) are stored in a requirements repository.From this repository, the requirements to be implemented are selected from the repos-itory. The number of requirements selected depends on the available resources for theproject. As new products are not built from the scratch, parts from the old product(see main product line in Figure 3.1) are used as input to the requirements phase aswell. At the quality gate (among others) it is checked whether all requirements are
78
understood, agreed upon, and documented. Furthermore, it is checked whether the rel-evant stakeholders are identified and whether the solution would support the businessstrategy.
Design and Implementation: In the design phase the architecture of the systemis created and documented. Thereafter, the actual development of the system takesplace. The developers also conduct basic unit testing before handing the developedcode over to the test phase. The quality gate checklist (among others) verifies whetherthe architecture has been evaluated, whether there are deviations from the requirementscompared to the previous quality gate decision, and whether there is a deviation fromplanned time-line, effort, or product scope.
Testing: In this phase the system integration is tested regarding quality and func-tional aspects. In order to make a decision whether the the system can be deployed,measures of performance (e.g, throughput) are collected in the test laboratory. As thecompany provides complete solutions (including hardware and software) the tests haveto be conducted on a variety of hardware and software configurations as those differbetween customers. The outcome of the phase is reviewed according to a checklist tosee whether the system has been verified and whether there are deviations from previ-ous quality gate decisions in terms of quality and time, whether plans for hand-over ofthe product to the customer are defined according to company guidelines, and whetherthe outcome of the project meets the customers’ requirements.
Release: In the release phase the product is brought into a shippable state. Thatis, release documentation is finalized (e.g. installation instructions of the system forcustomers and user-guides). Furthermore, build-instructions for the system have tobe programmed. Build-instructions can be used to enable and disable features of themain product line to tailor the system to specific customer needs. At the quality gate(among others) it is checked whether the outcome meets the customers’ requirements,whether the customer has accepted the outcome, and whether the final outcome waspresented in time and fulfilled its quality requirements. A post-mortem analysis has tobe performed as well.
Maintenance: After the product has been released to the customer it has to bemaintained. That is, if customers discover problems in the product they report them tothe company and get support in solving them. If the problems are due to faults in theproduct, packages for updating the system are delivered to the customers.
3.4 Case Study DesignThe context in which the study is executed is Ericsson AB, a leading and global com-pany offering solutions in the area of telecommunication and multimedia. Such solu-
79
Chapter 3. The Waterfall Model in Large-Scale Development
tions include charging systems for mobile phones, multimedia solutions and networksolutions. The company is ISO 2001:2000 certified. The market in which the companyoperates can be characterized as highly dynamic with high innovation in products andsolutions. The development model is market-driven, meaning that the requirements arecollected from a large base of potential end-customers without knowing exactly whothe customers will be.
3.4.1 Research QuestionsThe following main research questions should be answered in the case study:
• RQ1: What are the most critical problems in waterfall development in large-scale industrial development?
• RQ2: What are the differences and similarities between state of the art and thecase study results?
The relevance of the research questions can be underlined as follows: The relatedwork has shown a number of problems related to waterfall development. However,there is too little empirical evidence on the topic and thus more data points are needed.Furthermore, the criticality of problems is not addressed in any way so far, making ithard to decide in which way it is most beneficial to improve the model, or whetherthe introduction of a new way of working will help in improving the key challengesexperienced in the waterfall model.
3.4.2 Case Selection and Units of AnalysisThe case being studied is one development site of Ericsson AB. In order to under-stand the problems that occurred when the waterfall model was used at the company,three subsystems (S1, S2, and S3) are analyzed that have been built according to themodel. The systems under investigation in this case study have an overall size of ap-prox. 1,000,000 LOC (as shown in Table 3.2). The LOC measure only includes codeproduced at the company (excluding third-party libraries). Furthermore, the number ofpersons involved in building the system are stated. A comparison of the system consid-ered for this study and the size of the Apache web server shows that the system beingstudied is considerably larger and thus can be considered as large-scale.
3.4.3 Data Collection ProceduresThe data is collected through interviews and from process documentation.
80
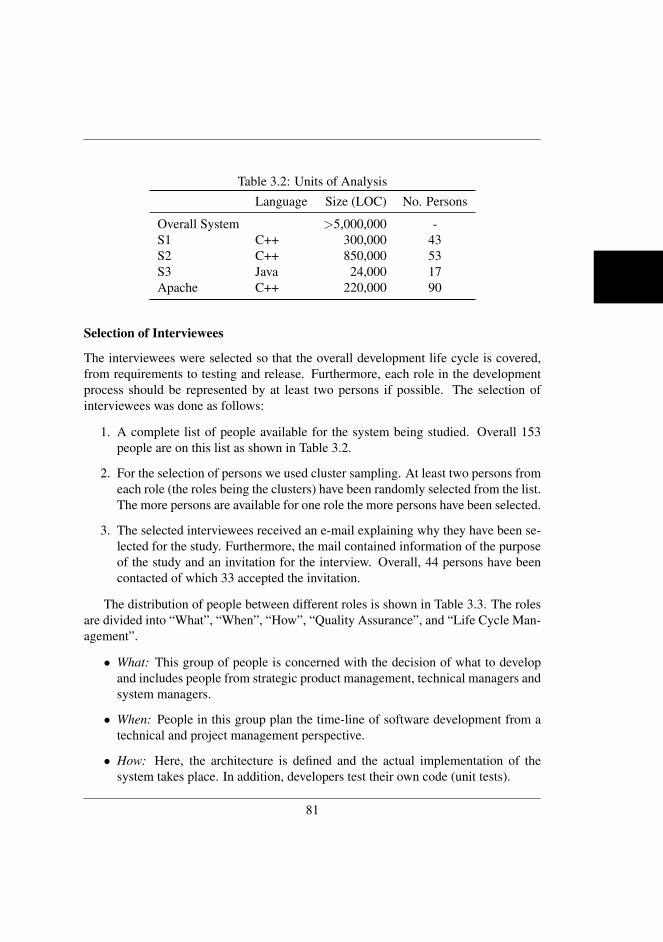
Table 3.2: Units of Analysis
Language Size (LOC) No. Persons
Overall System >5,000,000 -S1 C++ 300,000 43S2 C++ 850,000 53S3 Java 24,000 17Apache C++ 220,000 90
Selection of Interviewees
The interviewees were selected so that the overall development life cycle is covered,from requirements to testing and release. Furthermore, each role in the developmentprocess should be represented by at least two persons if possible. The selection ofinterviewees was done as follows:
1. A complete list of people available for the system being studied. Overall 153people are on this list as shown in Table 3.2.
2. For the selection of persons we used cluster sampling. At least two persons fromeach role (the roles being the clusters) have been randomly selected from the list.The more persons are available for one role the more persons have been selected.
3. The selected interviewees received an e-mail explaining why they have been se-lected for the study. Furthermore, the mail contained information of the purposeof the study and an invitation for the interview. Overall, 44 persons have beencontacted of which 33 accepted the invitation.
The distribution of people between different roles is shown in Table 3.3. The rolesare divided into “What”, “When”, “How”, “Quality Assurance”, and “Life Cycle Man-agement”.
• What: This group of people is concerned with the decision of what to developand includes people from strategic product management, technical managers andsystem managers.
• When: People in this group plan the time-line of software development from atechnical and project management perspective.
• How: Here, the architecture is defined and the actual implementation of thesystem takes place. In addition, developers test their own code (unit tests).
81
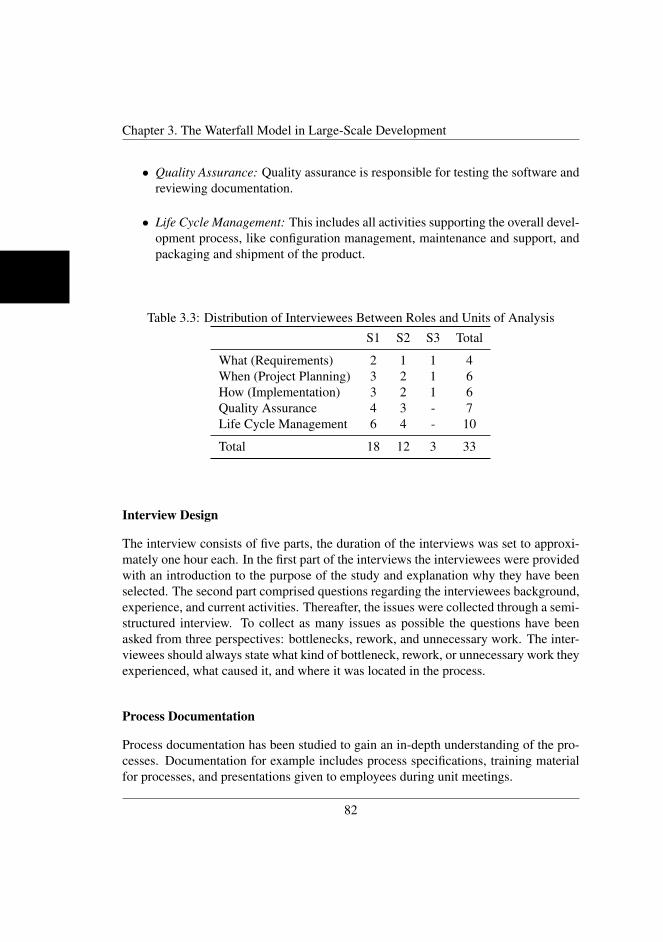
Chapter 3. The Waterfall Model in Large-Scale Development
• Quality Assurance: Quality assurance is responsible for testing the software andreviewing documentation.
• Life Cycle Management: This includes all activities supporting the overall devel-opment process, like configuration management, maintenance and support, andpackaging and shipment of the product.
Table 3.3: Distribution of Interviewees Between Roles and Units of Analysis
S1 S2 S3 Total
What (Requirements) 2 1 1 4When (Project Planning) 3 2 1 6How (Implementation) 3 2 1 6Quality Assurance 4 3 - 7Life Cycle Management 6 4 - 10
Total 18 12 3 33
Interview Design
The interview consists of five parts, the duration of the interviews was set to approxi-mately one hour each. In the first part of the interviews the interviewees were providedwith an introduction to the purpose of the study and explanation why they have beenselected. The second part comprised questions regarding the interviewees background,experience, and current activities. Thereafter, the issues were collected through a semi-structured interview. To collect as many issues as possible the questions have beenasked from three perspectives: bottlenecks, rework, and unnecessary work. The inter-viewees should always state what kind of bottleneck, rework, or unnecessary work theyexperienced, what caused it, and where it was located in the process.
Process Documentation
Process documentation has been studied to gain an in-depth understanding of the pro-cesses. Documentation for example includes process specifications, training materialfor processes, and presentations given to employees during unit meetings.
82
3.4.4 Data Analysis ApproachThe problems related to the waterfall model at the company have been identified con-ducting the four steps outlined below. The steps are based on more than 30 hours ofinterview transcriptions and have been executed by the first author over a three monthperiod.
1. Clustering: The raw data from the transcriptions is clustered, grouping state-ments belonging together. For example, all statements related to requirementsengineering are grouped together. Thereafter, statements addressing similar ar-eas within one group (e.g,. all areas that would relate to requirements engineer-ing lead-times) are grouped.
2. Derivation of Issue Statements: The raw data contains detailed explanations andtherefore is abstracted by deriving problem statements from the raw data, ex-plaining them shortly in one or two sentences. The result was a number of prob-lem statements where statements varied in their abstraction level and could befurther clustered.
3. Mind-Mapping of Issue Statements: The issue statements were grouped basedon their relation to each other and their abstraction level. For example, problemsrelated to requirements lead-times are grouped within one branch called ”longrequirements lead-times”. This was documented in form of a mind-map. Issueswith higher abstraction level are closer to the center of the mind map than issueswith lower abstraction level.
4. Validation of Issues: In studies of qualitative nature there is always a risk that thedata is biased by the interpretation of the researcher. Therefore, the issues havebeen validated in two workshops with three representatives from the company.The representatives have an in-depth knowledge of the processes. Together, thesteps of analysis described here have been reproduced together with the authorsand company representatives. For this a subset of randomly selected issue state-ments have been selected. No major disagreement has been discovered betweenthe workshop participants on the outcome of the analysis. Thus, the validity ofthe issue statements can be considered as high.
After having identified the problems they are prioritized into A-problems (critical),B-problems (very important), C-problems (important), D-problems (less important),and E-problems (local). The actual limits on the classes is based on the results. Themain objective of the classification is to systematize and structure the data and not toclaim that these classes are optimal or suitable for another study.
83
Chapter 3. The Waterfall Model in Large-Scale Development
A. The problem is mentioned by more than one role and more than one subsystem.Moreover, the problem has been referred to by more than 1/3 of the respondents.
B. The problem is mentioned by more than one role and more than one subsystem.Moreover, the problem has been referred to by more than 1/5 of the respondents.
C. The problem is mentioned by more than one role and more than one subsystem.Moreover, the problem has been referred to by more than 1/10 of the respondents.
D. The problem is mentioned by more than one role and more than one subsystem.Moreover, it has been referred to by 1/10 of the respondents or less.
E. The problem is only referred to by one role or one subsystem and thus considereda local or individual problem.
3.4.5 Threats to Validity
Threats to the validity of the outcome of the study are important to consider duringthe design of the study allowing to take actions mitigating them. Threats to validity incase study research are reported in [15]. The threats relevant to the study are: constructvalidity, external validity and reliability.
Construct Validity: Construct validity is concerned with obtaining the right mea-sures for the concept being studies. One threat is the selection of people to obtain theappropriate sample for answering the research questions. Therefore, experienced peo-ple from the company selected a pool of interviewees as they know the persons andorganization best. From this pool the random sample was taken. The selection by therepresentatives of the company was done having the following aspects in mind: pro-cess knowledge, roles, distribution across subsystems, and having a sufficient numberof people involved (although balancing against costs). Furthermore, it is a threat thatthe presence of the researcher influences the outcome of the study. The threat is re-duced as there has been a long cooperation between the company and university andthe author collecting the data is also employed by the company and not viewed as beingexternal. Construct validity is also threatened if interview questions are misunderstoodor misinterpreted. To mitigate the threat pre-tests of the interview have been conducted.
External Validity: External validity is the ability to generalize the findings to aspecific context as well as to general process models. One threat to validity is that onlyone case has been studied. Thus, the context and case have been described in detailwhich supports the generalization of the problems identified. Furthermore, the processmodel studied follows the main principles of waterfall development (see Section 3.3)
84
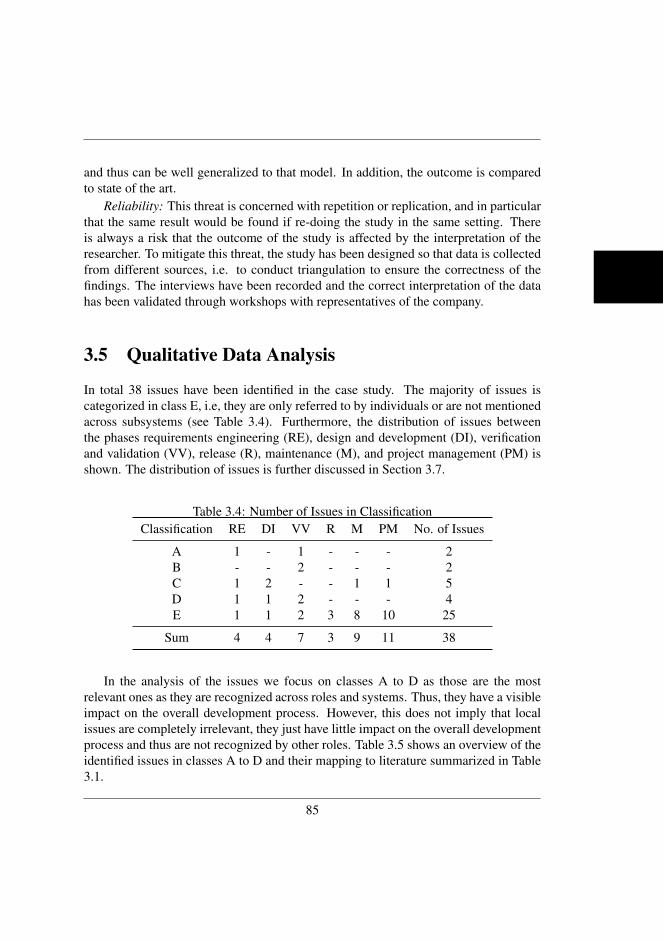
and thus can be well generalized to that model. In addition, the outcome is comparedto state of the art.
Reliability: This threat is concerned with repetition or replication, and in particularthat the same result would be found if re-doing the study in the same setting. Thereis always a risk that the outcome of the study is affected by the interpretation of theresearcher. To mitigate this threat, the study has been designed so that data is collectedfrom different sources, i.e. to conduct triangulation to ensure the correctness of thefindings. The interviews have been recorded and the correct interpretation of the datahas been validated through workshops with representatives of the company.
3.5 Qualitative Data Analysis
In total 38 issues have been identified in the case study. The majority of issues iscategorized in class E, i.e, they are only referred to by individuals or are not mentionedacross subsystems (see Table 3.4). Furthermore, the distribution of issues betweenthe phases requirements engineering (RE), design and development (DI), verificationand validation (VV), release (R), maintenance (M), and project management (PM) isshown. The distribution of issues is further discussed in Section 3.7.
Table 3.4: Number of Issues in ClassificationClassification RE DI VV R M PM No. of Issues
A 1 - 1 - - - 2B - - 2 - - - 2C 1 2 - - 1 1 5D 1 1 2 - - - 4E 1 1 2 3 8 10 25
Sum 4 4 7 3 9 11 38
In the analysis of the issues we focus on classes A to D as those are the mostrelevant ones as they are recognized across roles and systems. Thus, they have a visibleimpact on the overall development process. However, this does not imply that localissues are completely irrelevant, they just have little impact on the overall developmentprocess and thus are not recognized by other roles. Table 3.5 shows an overview of theidentified issues in classes A to D and their mapping to literature summarized in Table3.1.
85
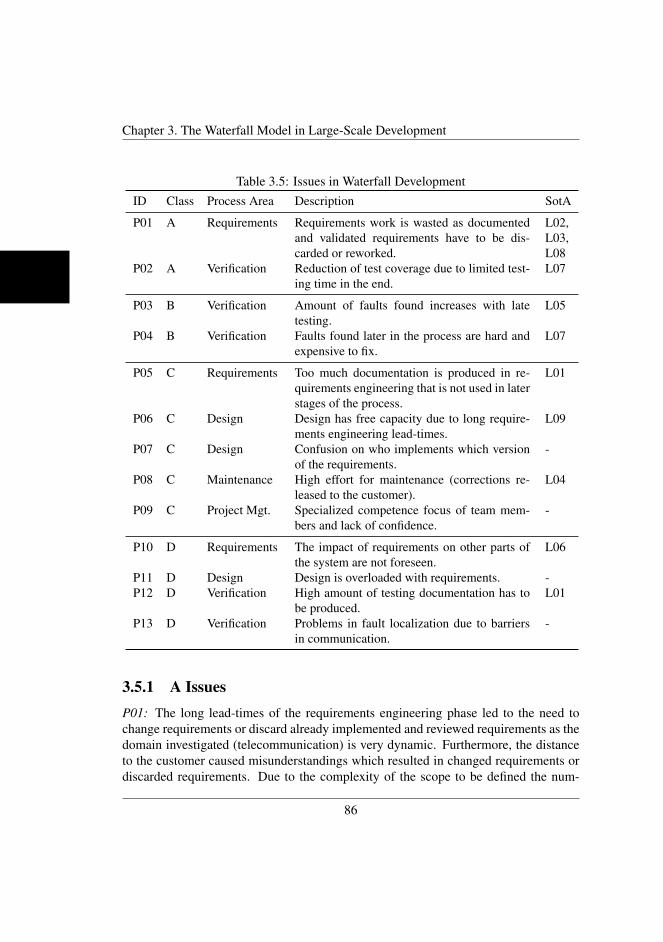
Chapter 3. The Waterfall Model in Large-Scale Development
Table 3.5: Issues in Waterfall DevelopmentID Class Process Area Description SotA
P01 A Requirements Requirements work is wasted as documentedand validated requirements have to be dis-carded or reworked.
L02,L03,L08
P02 A Verification Reduction of test coverage due to limited test-ing time in the end.
L07
P03 B Verification Amount of faults found increases with latetesting.
L05
P04 B Verification Faults found later in the process are hard andexpensive to fix.
L07
P05 C Requirements Too much documentation is produced in re-quirements engineering that is not used in laterstages of the process.
L01
P06 C Design Design has free capacity due to long require-ments engineering lead-times.
L09
P07 C Design Confusion on who implements which versionof the requirements.
-
P08 C Maintenance High effort for maintenance (corrections re-leased to the customer).
L04
P09 C Project Mgt. Specialized competence focus of team mem-bers and lack of confidence.
-
P10 D Requirements The impact of requirements on other parts ofthe system are not foreseen.
L06
P11 D Design Design is overloaded with requirements. -P12 D Verification High amount of testing documentation has to
be produced.L01
P13 D Verification Problems in fault localization due to barriersin communication.
-
3.5.1 A IssuesP01: The long lead-times of the requirements engineering phase led to the need tochange requirements or discard already implemented and reviewed requirements as thedomain investigated (telecommunication) is very dynamic. Furthermore, the distanceto the customer caused misunderstandings which resulted in changed requirements ordiscarded requirements. Due to the complexity of the scope to be defined the num-
86
ber of requirements was too high for the given resources which resulted in discardingrequirements (and sometimes this was done late in the development process). Further-more, the interviewees emphasized that the decision what is in the scope and what isnot takes a lot of time as a high amount of people that have to be involved.
P02: Test coverage in waterfall development was reduced due to multiple reasons.Testing is done late in the project and thus if there have been delays in development,testing has to be compromised as it is one of the last steps in development. Further-more, too much has to be tested at once after the overall system has been implemented.Additional factors are that testing related to quality is often given low priority in com-parison to functional testing, trivial things are tested too intensively, and test resourcesare used to test the same things twice due to coordination problems.
3.5.2 B IssuesP03: The later the testing, the higher the amount of faults found. The number of faultsand quality issues is influenced negatively when using waterfall development. Themain cause for this is late testing after everything has been implemented. This providesfar too late feedback from test on the software product. Furthermore, basic testing isneglected as there has been low interaction between design and testing, resulting in lackof understanding of each other in terms of consequences of neglecting basic testing.Also due to communication issues, testing started verifying unfinished code which ledto a high number of false positives (not real faults).
P04: Having late testing results in faults that are hard to fix, which is especially truefor issues related to quality attributes of the system (e.g. performance). These kinds ofissues are often rooted in the architecture of the system which is hard to change late inthe project.
3.5.3 C IssuesP05: The interviewees emphasized that quite a lot of documentation is produced in therequirements phase. One of the reasons mentioned is limited reuse of documentation(i.e., the same information is reported several times). Furthermore, the concept ofquality gates requires producing a lot of documentation and checklists which have tobe fulfilled before passing on the requirements to the next phase. Though, in waterfalldevelopment the quality gates are required as they assure that the hand-over item is ofgood enough quality to be used as input for all further development activities.
P06: Design and implementation have free capacity, the reasons being that require-ments have to be specified in too much detail, decision making takes a long time, orrequirements resources are tied up due to the too large requirements scope. This has a
87
Chapter 3. The Waterfall Model in Large-Scale Development
negative impact on design, as the designers have to wait for input from requirementsengineering before they can start working. As one interviewee pointed out ”For suchlarge projects with so many people involved half the workforce ends up working for therest”. In consequence, the lead-time of the overall project is prolonged.
P07: From a design perspective, it is not always clear which version of the require-ments should be implemented and by whom. The cause of this problem is that workoften starts on unfinished or unapproved requirements which have not been properlybaselined.
P08: Support is required to release a high number of corrections on already re-leased software. This is due to the overall length of the waterfall projects resulting invery long release cycles. In consequence, the customers cannot wait for the correctionsto be fixed for the next release, making corrections a time-pressing issue. Further-more, the development model requires to handle parallel product branches for customeradaptations of the main product line. In this domain, products have a high degree ofvariability and thus several product branches have to be supported (see Figure 3.1).
P09: The competence focus of people in waterfall development is narrowed, butspecialized. This is due to that people are clearly separated in their phases and disci-plines, and that knowledge is not well spread among them. As one interviewee pointedout, there are communication barriers between phases. Furthermore, a lack of confi-dence has been reported. That is, people are capable but do not recognize their partic-ular strength to a degree they should.
3.5.4 D IssuesP10: New requirements do not have an isolated impact, instead they might affect mul-tiple subsystems. However, due to the large requirements scope, requirements depen-dencies are often overlooked.
P11: The scope of the requirements was too big for the implementation resources.In consequence, designers and architects were overloaded with requirements whichcould not be realized with the given resources. Furthermore, after the project has beenstarted more requirements were forced into the project by the customer. In conse-quence, emergent requirements cannot be implemented by architects and designers asthey already face an overload situation.
P12: Test documentation has been done too extensively as the documents becameobsolete. The reason for the high amount of documentation was mainly that the processhas been very documentation centric.
P13: When dealing with different subsystems, the fault localization is problematicas a problem might only show in one subsystems, but due to communication barriersnot all subsystem developers are aware of the problem. In consequence, due to the lack
88
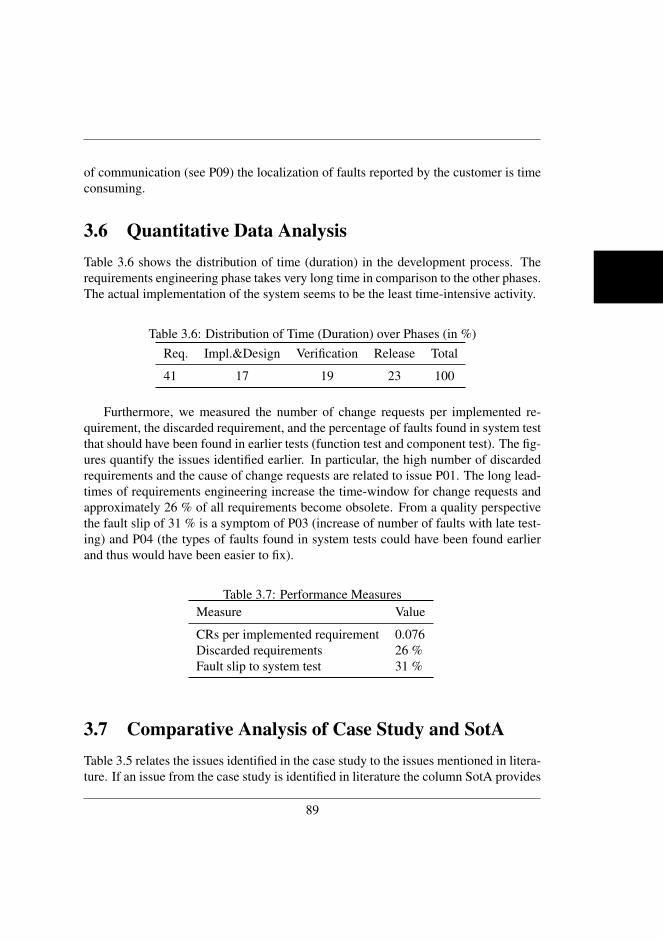
of communication (see P09) the localization of faults reported by the customer is timeconsuming.
3.6 Quantitative Data AnalysisTable 3.6 shows the distribution of time (duration) in the development process. Therequirements engineering phase takes very long time in comparison to the other phases.The actual implementation of the system seems to be the least time-intensive activity.
Table 3.6: Distribution of Time (Duration) over Phases (in %)Req. Impl.&Design Verification Release Total
41 17 19 23 100
Furthermore, we measured the number of change requests per implemented re-quirement, the discarded requirement, and the percentage of faults found in system testthat should have been found in earlier tests (function test and component test). The fig-ures quantify the issues identified earlier. In particular, the high number of discardedrequirements and the cause of change requests are related to issue P01. The long lead-times of requirements engineering increase the time-window for change requests andapproximately 26 % of all requirements become obsolete. From a quality perspectivethe fault slip of 31 % is a symptom of P03 (increase of number of faults with late test-ing) and P04 (the types of faults found in system tests could have been found earlierand thus would have been easier to fix).
Table 3.7: Performance MeasuresMeasure Value
CRs per implemented requirement 0.076Discarded requirements 26 %Fault slip to system test 31 %
3.7 Comparative Analysis of Case Study and SotATable 3.5 relates the issues identified in the case study to the issues mentioned in litera-ture. If an issue from the case study is identified in literature the column SotA provides
89
Chapter 3. The Waterfall Model in Large-Scale Development
the ID of the issue identified in literature (listed in Table 3.1). Through this compari-son it becomes apparent that four issues not mentioned in the identified literature havebeen discovered in the case study, namely P07, P09, P11, and P13. Vice versa all issuesacknowledged in literature have been identified in the case study. Table 3.5 also showsthat the highest prioritized issues (A and B) have all been mentioned in literature de-scribing the waterfall model. In conclusion researchers and practitioners are aware ofthe most pressing issues related to waterfall development, while lower prioritized (butstill important) issues have not been linked to the waterfall model to the same degree.
The issues in the case study are formulated differently from those identified in lit-erature as the formulation is an outcome of the qualitative data analysis. Therefore,we explain how and why the issues of high priority from the case study and SotA arerelated to each other. The most critical issues are related to the phases of requirementsengineering, and verification and validation (both identified in literature). We foundthat requirements often have to be reworked and or discarded (P01). The qualitativeanalysis based on the interviews explained the issue with long lead-times for require-ments and large scope making responding to changes hard (related to L02), distance tothe customer (related to L08), and change in large scope leads to high effort due to thatmany people are involved (related to L03). The quantitative analysis shows that 41 %of the lead-time is consumed for requirements engineering. Having to define a largerequirements scope extends lead-time and thus reduces requirements stability. In con-sequence the waterfall model is not suitable in large-scale development in the contextof a dynamic market. Regarding verification issue L07 identified in literature states thattesting the whole system in the end of the project leads to unexpected quality problemsand project overruns. This issue relates to the case study in the following ways: First,testing has to be compromised and thus test coverage is reduced when having fixeddeadlines which do not allow for project overruns (P02). Secondly, the faults foundlate in the process are hard to fix, especially if they are rooted in the architecture of thesystem (P07).
The issues categorized as C are quite mixed, i.e. they include issues related torequirements, design, maintenance and project management. The issues categorizedas D show a similar pattern as the most critical ones (A and B), i.e. they are relatedto requirements, and verification and validation. Furthermore, one issue is related todesign. As mentioned earlier, less than half of the issues classified as C and D havebeen identified in literature before. An explanation of the issues not yet identified hasbeen provided in the qualitative analysis (see Section 3.5).
It is also interesting to observe that a majority of local issues is related to projectmanagement and maintenance (see Table 3.4). Thus, it seems that there is a high num-ber of issues which do not have such an impact on the process that knowledge aboutthem spreads in the organization.
90
3.8 ConclusionThis case study investigates issues related to the waterfall model applied in the contextof large-scale software development and compares the findings with literature. Theresults are that the most critical issues in waterfall development are related to require-ments and verification. In consequence, the waterfall model is not suitable to be usedin large-scale development. Therefore, the company moved to an incremental and agiledevelopment model in 2005. The comparison of the case study findings with literatureshows that all issues found in literature are found in the case study. Though, the casestudy findings provide more detailed explanations of the issues and identified four newissues, namely 1) confusion of who implements which version of the requirements, 2)high effort for maintenance, 3) specialized competence focus and lack of confidence ofpeople, and 4) problems in fault localization due to communication barriers.
3.9 References[1] David J. Anderson. Agile Management for Software Engineering: Applying the
Theory of Constraints for Business Results (The Coad Series). Prentice Hall PTR,2003.
[2] Barry Boehm. Get ready for agile methods, with care. Computer, 35(1):64–69,2002.
[3] David Cohen, Gary Larson, and Bill Ware. Improving software investmentsthrough requirements validation. In Proceedings of the 26th Annual NASA God-dard Software Engineering Workshop (SEW 2001), page 106, Washington, DC,USA, 2001. IEEE Computer Society.
[4] Joe Jarzombek. The 5th annual jaws s3 proceedings, 1999.
[5] Jim Johnson. Keynote speech: Build only the features you need. In Proceedingsof the 4th International Conference on Extreme Programming and Agile Pro-cesses in Software Engineering (XP 2002), 2002.
[6] Caspers Jones. Patterns of Software Systems: Failure and Success. InternationalThomson Computer Press, 1995.
[7] Daniel Karlstrom and Per Runeson. Combining agile methods with stage-gateproject management. IEEE Software, 22(3):43–49, 2005.
91
REFERENCES
[8] Pete McBreen. Software craftsmanship : the new imperative. Addison-Wesley,Boston, 2002.
[9] Shari Lawrence Pfleeger and Joanne M. Atlee. Software engineering : theory andpractice. Prentice Hall, Upper Saddle River, N.J., 3. ed. edition, 2006.
[10] Lbs Raccoon. Fifty years of progress in software engineering. SIGSOFT Softw.Eng. Notes, 22(1):88–104, 1997.
[11] Walter Royce. Managing the development of large software systems: Conceptsand techniques. In Proc. IEEE WESCOM. IEEE Computer Society Press, 1970.
[12] Johannes Sametinger. Software engineering with reusable components : with 26tables. Springer, Berlin, 1997.
[13] Ian Sommerville. Software Engineering (7th Edition). Pearson Eductation Ltd.,2004.
[14] Michael Thomas. It projects sink or swim. British Computer Society Review2001, 2001.
[15] Robert K. Yin. Case Study Research: Design and Methods, 3rd Edition, AppliedSocial Research Methods Series, Vol. 5. Prentice Hall, 2002.
92
Chapter 4
The Effect of Moving from aPlan-Driven to an Incrementaland Agile SoftwareDevelopment Approach: AnIndustrial Case Study
Kai Petersen and Claes WohlinSubmitted to a Journal
4.1 IntroductionAs software has become a major success factor in software products the competitionhas increased. In consequence, the software industry aims at shorter lead times togain a first-move advantage and to fulfill the current needs of the customer. However,the needs of the customers in terms of functions and quality constantly evolve leadingto high requirements volatility which requires the software companies to be highlyflexible. Therefore, more and more software companies started to adopt incrementaland agile methods and the number of recent empirical studies on agile methods have
93

Chapter 4. The Effect of Moving from a Plan-Driven to an Incremental and AgileSoftware Development Approach: An Industrial Case Study
increased (for example [39], [22], and [5]).Due to the increased importance and interest in agility of software development a
systematic review [13] summarized the results of empirical studies on agile methods.According to the systematic review there is a clear need for exploratory qualitativestudies. In particular, we need to better understand the impact of the change fromtraditional (plan-driven) development models (like waterfall, Rational Unified Process(RUP) or V-model) to more agile methods. Furthermore, the review identified researchmethodological quality problems that frequently occurred in the studies. For example,methods were not well described, the data was biased, and reliability and validity ofthe results were not always addressed. The review also shows that the main focus ofstudies was on XP, and that the settings studied are quite small in terms of the num-ber of team members. Overall, this suggests a clear need to further investigate agileand incremental methods using sound empirical methods. Specifically, to understandthe impact of migrating to incremental and agile methods requires the comparison ofagile with other approaches in different contexts. For example, how does plan-drivendevelopment perform in comparison to agile and incremental development in differentdomains (telecommunication, embedded systems and information systems) and differ-ent system complexities (small scale, medium scale, and large scale)?
In order to address this research gap, we conducted a case study investigating theeffect of moving from plan-driven development to incremental/agile development. Theeffect was captured in terms of advantages and issues for the situation before and afterthe migration. The case being studied was a development site of Ericsson AB, Swe-den. The plan-driven approach was used at the company for several years. Due toindustry benchmarks and thereby identified performance issues (e.g. related to lead-times) the company first adopted incremental practices starting in the middle of 2005.Agile practices were added in late 2006 and early 2007. Overall, we will show thatthe company’s model shares many practices with incremental development, ExtremeProgramming (XP), and Scrum.
The case study was conducted in the last quarter of 2007 where incremental prac-tices were adopted to a large part and about 50 % of the Scrum and XP practices havebeen implemented. We conducted 33 interviews with representatives of different rolesin the company to capture the advantages and issues with the two development ap-proaches. That is, we identified issues/advantages in plan-driven development, andhow the issues/advantages have changed after migrating to incremental/agile practices.Document analysis was used to complement the interviews. Furthermore, quantita-tive data collected by the company was used to identify confirmative and contradictinginformation to the qualitative data. The quantitative data (performance measures) in-cluded requirements waste in terms of share of implemented requirements and softwarequality. The case study research design was strongly inspired by the guidelines pro-
94
vided in [45]. Furthermore, we used the guidelines provided specifically in a softwareengineering context by [35].
The contributions of the paper and case study are:
• Illustrate an incremental and agile process model used in industry and compari-son of the model with models discussed in literature (e.g., XP, Scrum, and incre-mental development) to be able to generalize the results.
• Identify and gain an in-depth understanding of the most important issues in re-lation to process performance in plan-driven development and the incremen-tal/agile process used at the company. The outcomes of the situation before(plan-driven approach) and after the migration (incremental/agile approach) werecompared and discussed. This information was captured through interviews, andthus illustrates the perception of the effect of the migration.
• Provide process performance measurements on the development approaches asan additional source of evidence to support or contradict the primary evidence inthe form of qualitative findings from the interviews.
The remainder of the paper is structured as follows. Section 4.2 presents relatedwork. Thereafter, Section 4.3 illustrates the development processes used at the com-pany and compares them to known models from literature. Section 4.4 describes theresearch design. The analysis of the data is divided into one qualitative (Section 4.5)and one quantitative (Section 4.6) part. Based on the analysis, the results are discussedin Section 4.7. Section 4.8 concludes the paper.
4.2 Related WorkStudies have investigated the advantages and disadvantages of plan-driven and agileprocesses. However, few studies present a comparison of the models in general, andthe effect of moving from one model to the other. This section summarizes the resultsof existing empirical studies on both process models, presenting a list of advantagesand disadvantages for each of them. The description of studies related to plan-drivendevelopment is not split into advantages and disadvantages as few advantages havebeen reported in literature.
4.2.1 Plan-Driven DevelopmentPlan-driven development includes development approaches such as the waterfall model,the Rational Unified Process (RUP), and the V-model. All plan-driven approaches
95
Chapter 4. The Effect of Moving from a Plan-Driven to an Incremental and AgileSoftware Development Approach: An Industrial Case Study
share the following characteristics (cf. [17]): the desired functions / properties of thesoftware need to be specified beforehand; a detailed plan is constructed from the starttill the end of the project; requirements are specified in high detail and a rigor changerequest process is implemented afterwards; the architecture and design specificationhas to be complete before implementation begins; programming work is only con-centrated in the programming phase; testing is done in the end of the project; qualityassurance is handled in a formal way.
Waterfall: Challenges with waterfall development (as a representative for plan-driven approaches) have been studied and factors for the failures of the waterfall ap-proach have been identified in empirical research. The main factor identified is themanagement of a large scope, i.e. requirements cannot be managed well and has beenidentified as the main reason for failure (cf. [41] [19] [20]). Consequences have beenthat the customers’ current needs are not addressed by the end of the project [19], re-sulting in that many of the features implemented are not used [20]. Additionally, thereis a problem in integrating the overall system in the end and testing it [21]. A studyof 400 waterfall projects has shown that only a small portion of the developed codehas actually been deployed or used. The reasons for this are the change of needs andthe lack of opportunity to clarify misunderstandings. This is caused by the lack ofopportunity for the customer to provide feedback on the system [8].
RUP: The RUP process was investigated in a case study mainly based on interviews[15]. The study was conducted in the context of small software companies. The studyidentified positive as well as negative factors related to the use of RUP. Advantagesof the process are: the clear definition of roles; the importance of having a supportiveprocess; good checklists provided by templates and role definitions. Disadvantages ofthe process are: the process is too extensive for small projects (very high agreementbetween interviewees); the process is missing a common standard of use; RUP is hardto learn and requires high level of knowledge; a too strong emphasis is put on theprogramming phase. [16] investigated the effort distribution of different projects usingRUP. They found that poor quality in one phase has significant impact on the effortsrelated to rework in later phases. Thus, balancing effort in a way to avoid poor quality(e.g. more resources in the design phase to avoid quality problems later) is important.
V-model: We were not able to identify industrial case studies focusing on the V-model, though it was part of an experiment comparing different process models (seeSection 4.2.3).
Plan-driven approaches are still widely used in practice as recognized in many re-search articles (c.f. [34] [4] [24] [10]). The case company of this study used the ap-proach till 2005, and there are still new research publications on plan-driven approaches(e.g. [15] [16] [32]).
96
4.2.2 Incremental and Agile Development
[13] conducted an exhaustive systematic review on agile practices and identified a setof relevant literature describing the limitations and benefits of using agile methods.According to the systematic review a majority of the relevant related work focuses onXP (76 % of 36 relevant articles). The following positive and negative factors havebeen identified in the review.
Positive factors: Agile methods help to facilitate better communication and feed-back due to small iterations and customer interaction (cf. [39] [22] [2]). Furthermore,the benefit of communication helps to transfer knowledge [2]. Agile methods furtherpropose to have the customer on-site. This is perceived as valuable by developers asthey can get frequent feedback [40] [39] [22], and the customers appreciate being on-site as this provides them with control over processes and projects [18]. An additionalbenefit is the regular feedback on development progress provided to customers [18].From a work-environment perspective agile projects are perceived as comfortable asthey can be characterized as respectful, trustful, and help preserving quality of work-ing life [26].
Negative factors: Well known problems are that architecture does not have enoughfocus in agile development (cf. [28] [38]) and that agile development does not scalewell [7]. An important concept is continuous testing and integration. Though, realiz-ing continuous testing requires much effort as creating an integrated test environmentis hard for different platforms and system dependencies [39]. Furthermore, testing is abottleneck in agile projects for safety critical systems, the reason being that testing hadto be done very often and at the same time exhaustively due to that a safety critical sys-tem was developed [43]. On the team level team members have to be highly qualified[29]. With regard to on-site customers a few advantages have been mentioned. Thedownside for on-site customers is that they have to commit for the whole developmentprocess which requires their commitment over a long time period and puts them understress [27].
Petersen and Wohlin (cf. [30]) compared issues and advantages identified in liter-ature with an industrial case (see Chapter 5). The source of the information was theinterviews conducted in this study, but the paper focused on a detailed analysis of theagile situation, and its comparison with the literature. The main finding was that agilepractices lead to advantages in one part of the development process, and at the sametime raises new challenges and issues in another part. Furthermore, the need for aresearch framework for agile methods has been identified to describe the context andcharacteristics of the processes studied.
97
Chapter 4. The Effect of Moving from a Plan-Driven to an Incremental and AgileSoftware Development Approach: An Industrial Case Study
4.2.3 Empirical Studies on Comparison of Models
In waterfall development the requirements are specified upfront, even the requirementsthat are not implemented later (due to change). The introduction of an incrementalapproach reduces the impact of change requests on a project. Furthermore, the incre-ments can be delivered to the customer more frequently demonstrating what has beenachieved. This also makes the value of the product visible to the customer early indevelopment [9]. Furthermore, several studies indicate that agile companies are morecustomer centric and generally have better relationships to their customers. This has apositive impact on customer satisfaction [6] [37]. However, a drawback of agile devel-opment is that team members are not as easily interchangeable as in waterfall-orienteddevelopment [3].
Given the results of the related work it becomes apparent that benefits reportedwere not identified starting from a baseline, i.e. the situation before the introductionof agile was not clear. Hence, little is known about the effect of moving from a plan-driven to an incremental and agile approach. Furthermore, the focus of studies has beenon eXtreme programming (XP) and the rigor of the studies was considered as verylow [13]. Hence, the related work strengthens the need for further empirical studiesinvestigating incremental and agile software development. Furthermore, evaluatingthe baseline situation is important to judge the improvements achieved through themigration. In response to the research gap this study investigates the baseline situationto judge the effect of the migration towards the incremental and agile approach.
4.3 The Plan-Driven and Agile Models at the CompanyBefore presenting the actual case study the process models that are compared with eachother have to be introduced and understood first.
4.3.1 Plan-Driven Approach
The plan-driven model that was used at the company implemented the main charac-teristics of plan-driven approaches as summarized by [17]. The main process stepswere requirements engineering, design and implementation, testing, release, and main-tenance. At each step a state-gate model was used to assure the quality of the softwareartifacts passed on to the next phase, i.e. software artifacts produced have to passthrough a quality door. The gathered customers’ needs collected from the market byso-called market units were on a high abstraction level and therefore needed to bespecified in detail to be used as input to design and development. Requirements were
98

stored in a requirements repository. From the repository, requirements were selectedthat should be implemented in a main project. Such a project lasted from one up to twoyears and ended with the completion of one major release. Quality checks related tothe requirements phase were whether the requirements have been understood, agreedon, and documented. In addition it was determined whether the product scope adheredto the business strategy, and whether the relevant stakeholders for the requirementswere identified. The architecture design and the implementation of the source codewas subjected to a quality check with regard to architecture evaluation and adherenceto specification, and whether the time-line and effort deviated from the targets. In thetesting phase the quality door determined whether the functional and quality require-ments have been fulfilled in the test (e.g. performance, load balancing, installation andstability). It was also checked whether the hand-over of the product to the customerwas defined according to company guidelines. In the release phase the product waspackaged, which included programming of build instructions. They were used to en-able and disable features to be able to tailor the system to specific customer needs. Thedocumentation also contains whether the customer accepted the outcome, and whetherthe final result was delivered meeting the time and effort restrictions.
When changes occured in form of a change request (CR), requirements had to bechanged and thus became obsolete. Therefore, all downstream work products relatedto these requirements, like design or already implemented code, had to be changedas well. Late in the process, this led to a considerable amount of rework [42] andprolonged lead-times. Furthermore, software development has not only to cope withchanges in needs that are valid for the whole customer base, but also with customerspecific needs. If the customer specific needs were considered as of high priority, acustomer adaptation project was initiated which took the last available version of theproduct as input. In response to these challenges the company recognized the need fora more agile and flexible process leading to the stepwise introduction of incrementaland agile practices, as described in the following subsections.
Further details on the plan-driven approach employed at the company (i.e. thebaseline situation) can be found in Chapter 3.
4.3.2 Agile and Incremental ModelThe agile and incremental process model used at the company is shown in Figure 4.1.The process relied on a set of company specific practices that have been introduced.The numbers (1 to 5) in Figure 4.1 map to the enumeration of the following practices:
1. Product Backlog: The packaging of requirements for projects was driven by re-quirement priorities. Requirements with the highest priorities were selected and
99
Chapter 4. The Effect of Moving from a Plan-Driven to an Incremental and AgileSoftware Development Approach: An Industrial Case Study
packaged to be implemented. Another criterion for the selection of requirementswas that they fit well together and thus could be implemented in one coherentproject.
2. Anatomy Plan: Furthermore, an anatomy plan was created, based on the depen-dencies between the parts of the system being implemented in each project. Thedependencies were a result of system architecture, technical issues and require-ments dependencies. The anatomy plan resulted in a number of baselines calledlatest system versions (LSV) that needed to be developed. It also determinedthe content of each LSV and the point in time when a LSV was supposed tobe completed. The anatomy plan captured dependencies between features (e.g.one feature had to be ready before another one was implemented) and techni-cal dependencies. Technical dependencies are critical in the telecommunicationdomain as platforms and communication protocols change. For example, if aversion of the software ran on one protocol version it could not be integratedwith the new protocol version. Therefore, besides the prioritization in the prod-uct backlog the anatomy plan provided important input on the order in whichprojects were run, and when increments could be integrated and tested.
3. Small Teams and Time-line: The requirements packages were implemented bysmall teams in short projects lasting approximately three month. The durationof the project determined the number of requirements selected for a require-ment package. Each project included all phases of development, from pre-studyto testing. As emphasized in the figure, when planning the order in which theprojects were executed the prioritization as well as technical dependencies onthe architecture level had to be taken into consideration. Furthermore, the figureshows that an interaction between requirements and architecture took place.
4. Use of Latest System Version: If a project was integrated with the last baselineof the system, a new baseline was created (referred to as LSV). Therefore, onlyone baseline existed at one point in time, helping to reduce the effort for productmaintenance. The LSV can also be considered as a container where the resultsof the projects (including software and documentation) are put together. Whenthe results of the projects had been integrated a system test took place in theLSV, referred to as LSV test. When in time a test should be conducted wasdefined by testing cycles and for each testing cycle it was defined which projectsshould drop within the next cycle. Comparing the work done on team level withthe work done in the LSV one can say that on the project level the goal was tofocus on the development of the requirements packages while the LSV focused
100
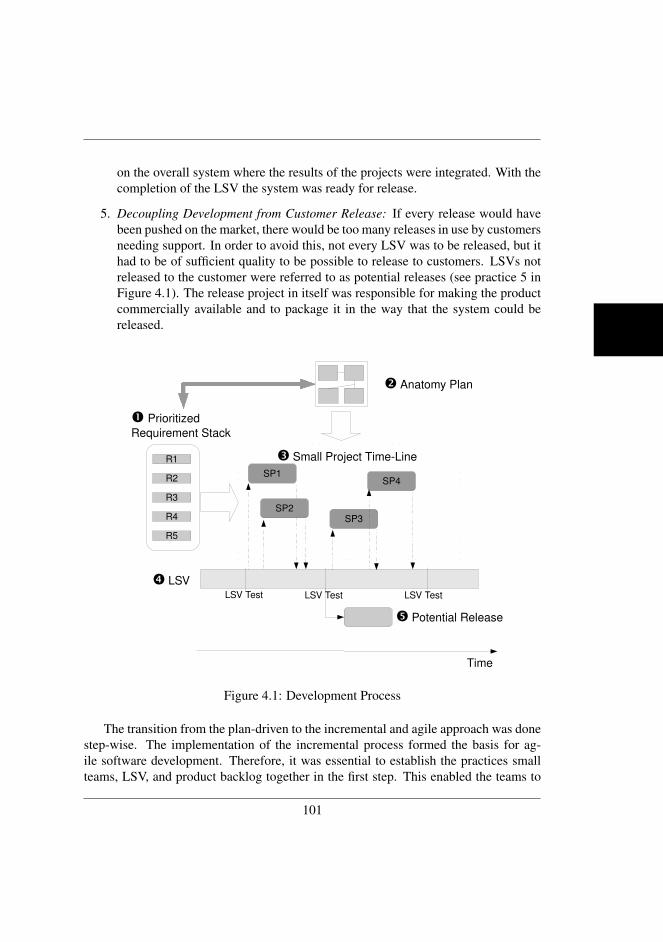
on the overall system where the results of the projects were integrated. With thecompletion of the LSV the system was ready for release.
5. Decoupling Development from Customer Release: If every release would havebeen pushed on the market, there would be too many releases in use by customersneeding support. In order to avoid this, not every LSV was to be released, but ithad to be of sufficient quality to be possible to release to customers. LSVs notreleased to the customer were referred to as potential releases (see practice 5 inFigure 4.1). The release project in itself was responsible for making the productcommercially available and to package it in the way that the system could bereleased.
R1
R2
R3
R4
R5
➋ Anatomy Plan
➊ Prioritized Requirement Stack
Time
SP1
SP2SP3
SP4
➌ Small Project TimeLine
➍ LSV LSV Test LSV Test LSV Test
➎ Potential Release
Figure 4.1: Development Process
The transition from the plan-driven to the incremental and agile approach was donestep-wise. The implementation of the incremental process formed the basis for ag-ile software development. Therefore, it was essential to establish the practices smallteams, LSV, and product backlog together in the first step. This enabled the teams to
101
Chapter 4. The Effect of Moving from a Plan-Driven to an Incremental and AgileSoftware Development Approach: An Industrial Case Study
deliver continuously from a product backlog towards a baseline for testing (LSV). Withthis basic process in place the second step could be implemented, i.e. the teams mov-ing towards an agile way of working through continuous reflection and improvement,and frequent face to face interactions through stand-up meetings. Furthermore, the in-troduction of the last system version optional releases were enabled. In the future thecompany plans to further extend the agile way of working by introducing additionalpractices, such as test driven development, requirements formulated as user stories,refactoring, low dependency architecture,
4.3.3 Comparison with General Process ModelsThe company’s process model was created based on practices applied in general in-cremental and agile process models. To be able to generalize the results of this study,the characteristics of the incremental and agile model used at the company (C) weremapped to the existing models of incremental and iterative development (ID), Extremeprogramming (XP), and Scrum (SC). That is, if the application of a specific practiceleads to problems in the model investigated in this case study, it might also cause prob-lems in models applying the same principle. Table 4.1 (created based on the informa-tion provided in [25]) shows that 4 out of 5 incremental principles are fulfilled whichmeans that lessons learned in this study are generalizable to ID. Furthermore, the modelused at Ericsson shares 5 out of 12 principles with XP and 6 out of 10 principles withScrum.
The company’s model realizes the principles shared with ID, XP and Scrum asfollows:
• Iterations and Increments: Each new LSV was an increment of the product.Projects were conducted in an iterative manner where a set of the projects’ in-crements was dropped to the LSV.
• Internal and External Releases: Software products delivered and tested in theLSV could be potentially delivered to the market. Instead of delivering to themarket, they could also be used as an input to the next internally or externallyused increment.
• Time Boxing: Time boxing means that projects have a pre-defined duration witha fixed deadline. In the company’s model the time box was set to approximatelythree month. Furthermore, the LSV cycles determined when a project had tofinish and drop its components to the LSV.
• No Change to Started Projects: If a feature was selected and the implementationrealizing the feature has been started then it was completed.
102
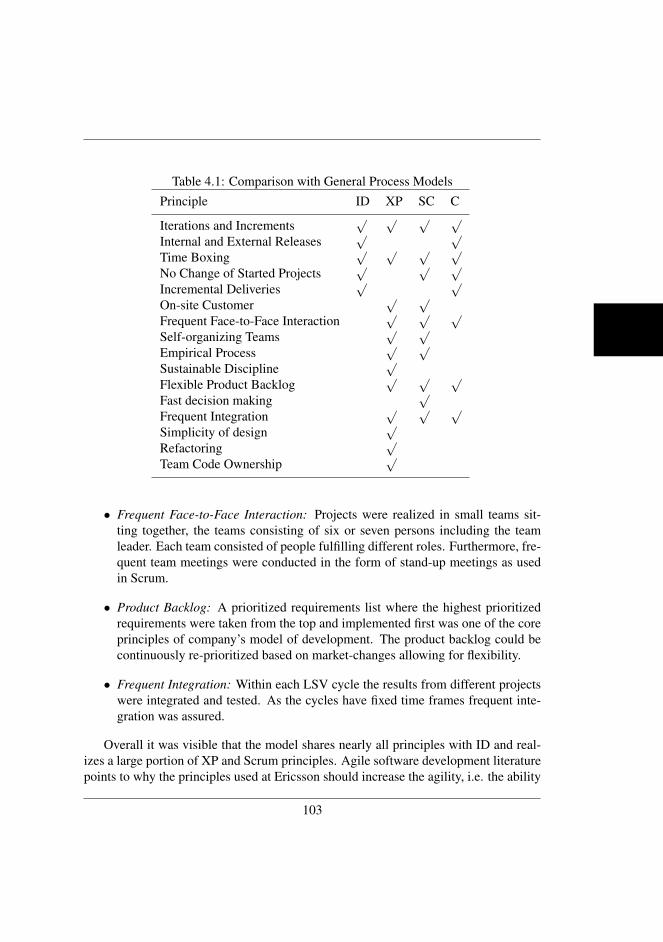
Table 4.1: Comparison with General Process ModelsPrinciple ID XP SC C
Iterations and Increments√ √ √ √
Internal and External Releases√ √
Time Boxing√ √ √ √
No Change of Started Projects√ √ √
Incremental Deliveries√ √
On-site Customer√ √
Frequent Face-to-Face Interaction√ √ √
Self-organizing Teams√ √
Empirical Process√ √
Sustainable Discipline√
Flexible Product Backlog√ √ √
Fast decision making√
Frequent Integration√ √ √
Simplicity of design√
Refactoring√
Team Code Ownership√
• Frequent Face-to-Face Interaction: Projects were realized in small teams sit-ting together, the teams consisting of six or seven persons including the teamleader. Each team consisted of people fulfilling different roles. Furthermore, fre-quent team meetings were conducted in the form of stand-up meetings as usedin Scrum.
• Product Backlog: A prioritized requirements list where the highest prioritizedrequirements were taken from the top and implemented first was one of the coreprinciples of company’s model of development. The product backlog could becontinuously re-prioritized based on market-changes allowing for flexibility.
• Frequent Integration: Within each LSV cycle the results from different projectswere integrated and tested. As the cycles have fixed time frames frequent inte-gration was assured.
Overall it was visible that the model shares nearly all principles with ID and real-izes a large portion of XP and Scrum principles. Agile software development literaturepoints to why the principles used at Ericsson should increase the agility, i.e. the ability
103
Chapter 4. The Effect of Moving from a Plan-Driven to an Incremental and AgileSoftware Development Approach: An Industrial Case Study
of the company to respond to changing requirements. The main source of agility wasthe prioritized requirements list, which was very similar to the flexible product backlogin Scrum [36]. Hence, the development was flexible when the needs of the customerschange as the backlog was continuously re-prioritized. Furthermore, new features wereselected from the backlog continuously and are integrated frequently, which means thatone can deliver less functionality more frequently, which provides flexibility and theopportunity for adaptive planning [36, 25, 23]. This is very much in line with agilesaying that the primary measure of progress is working software and that the softwareshould be useful [25]. In contrast, waterfall development would define the whole re-quirements list upfront and integrate the implementation in the end and hence workingsoftware would not be produced continuously [32]. Consequently requirements be-come obsolete as they are only delivered together creating very long lead-times. Theneed for change in the backlog was communicated through market units as the pro-cess was market-driven without a specific customer, but a large number of potentialcustomers. Requirements engineers and system experts then discuss the change that isneeded. The primary method for prioritizing the requirements was to have a ranked list.We acknowledge that not all agile practices of a specific model were fulfilled. How-ever, due to the specific nature of the development at Ericsson (market-driven withunknown customers and large-scale products) the practitioners made the decision toselect practices they considered to be most beneficial in their specific context.
4.4 Case Study Design
4.4.1 Study Context
It is of importance to describe the context in order to aid in the generalizability of thestudy results (cf. [31]). Ericsson is one of the major telecommunication companies inthe world offering products and services in this domain including charging solutionsfor mobile phones, multimedia solutions and network solutions. The company is ISO9001:2000 certified. The development of the company is market-driven and character-ized by a frequently changing market. Furthermore, the market demands highly cus-tomized solutions (for example customizations for specific countries). Further detailsregarding the context of the study are shown in Table 4.2.
4.4.2 Research Questions and Propositions
In this study, we aimed at answering the following research questions:
104

• RQ1 What issues in terms of bottlenecks, unnecessary work, and rework wereperceived before and after the migration from plan-driven to incremental andagile development? The first research question is the basis for further improve-ment of the process models.
• RQ2: How commonly perceived are the issues (bottlenecks, unnecessary work,and rework) for the each of the development approaches and in comparison toeach other? The second research questions aims at capturing the effect of thechange from plan-driven to incremental/agile development by determining thechange in how commonly perceived the issues were in each of the approaches.
• RQ3: Does the quantitative performance data (requirements waste and data onsoftware quality) support or contradict the qualitative findings in RQ1 or RQ2?Collecting these measures provides quantitative measures on the actual changein process performance at the company, thus being able to serve as an additionalsource of evidence as support for the qualitative analysis.
Based on the research questions, research propositions are formulated. Studypropositions point the researcher into a direction where to look for evidence in or-der to answer the research questions of the case study [45]. A proposition is similarto a hypotheses, stating what the expecting outcome of the study is. The followingpropositions are made for this case study:
• Proposition 1 (related to RQ1): Different issues are mentioned by the intervie-wees for the process models. Literature reports problems specific for plan-drivenand agile development (see Section 4.2). Thus, we assume to also find differentproblems before and after the migration.
• Proposition 2 (related to RQ2 and RQ3): The qualitative and quantitative datashows improvements when using agile and incremental practices. The agile andincremental model used at the company was specifically designed to avoid prob-lems that the organization was facing when using a plan-driven approach. Forexample, too long durations in the requirements phase leading to a vast amountof requirements changes prior to development. Therefore, we hypothesize that1) the issues raised for the incremental/agile way of working are less commonlyperceived than those raised for the plan-driven approach, and 2) there is an im-provement regarding performance measures with the new incremental and agileapproach.
In order to answer the research questions and evaluate the propositions, one ofEricsson’s development sites was selected as a case. The case and units of analysis aredescribed in more detail in the following section.
105
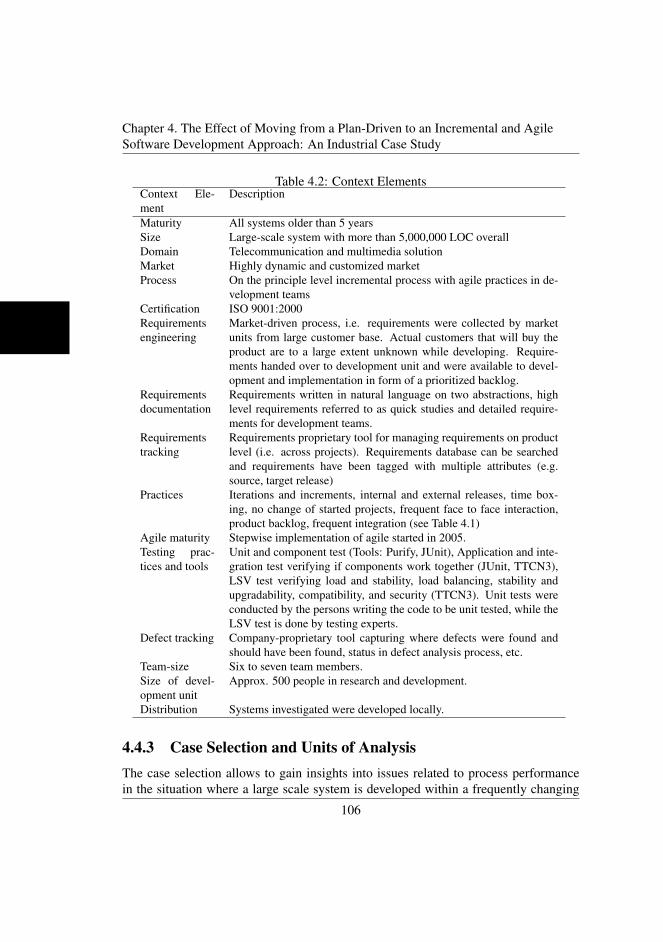
Chapter 4. The Effect of Moving from a Plan-Driven to an Incremental and AgileSoftware Development Approach: An Industrial Case Study
Table 4.2: Context ElementsContext Ele-ment
Description
Maturity All systems older than 5 yearsSize Large-scale system with more than 5,000,000 LOC overallDomain Telecommunication and multimedia solutionMarket Highly dynamic and customized marketProcess On the principle level incremental process with agile practices in de-
velopment teamsCertification ISO 9001:2000Requirementsengineering
Market-driven process, i.e. requirements were collected by marketunits from large customer base. Actual customers that will buy theproduct are to a large extent unknown while developing. Require-ments handed over to development unit and were available to devel-opment and implementation in form of a prioritized backlog.
Requirementsdocumentation
Requirements written in natural language on two abstractions, highlevel requirements referred to as quick studies and detailed require-ments for development teams.
Requirementstracking
Requirements proprietary tool for managing requirements on productlevel (i.e. across projects). Requirements database can be searchedand requirements have been tagged with multiple attributes (e.g.source, target release)
Practices Iterations and increments, internal and external releases, time box-ing, no change of started projects, frequent face to face interaction,product backlog, frequent integration (see Table 4.1)
Agile maturity Stepwise implementation of agile started in 2005.Testing prac-tices and tools
Unit and component test (Tools: Purify, JUnit), Application and inte-gration test verifying if components work together (JUnit, TTCN3),LSV test verifying load and stability, load balancing, stability andupgradability, compatibility, and security (TTCN3). Unit tests wereconducted by the persons writing the code to be unit tested, while theLSV test is done by testing experts.
Defect tracking Company-proprietary tool capturing where defects were found andshould have been found, status in defect analysis process, etc.
Team-size Six to seven team members.Size of devel-opment unit
Approx. 500 people in research and development.
Distribution Systems investigated were developed locally.
4.4.3 Case Selection and Units of AnalysisThe case selection allows to gain insights into issues related to process performancein the situation where a large scale system is developed within a frequently changing
106

environment. This can be used as input to identify issues that need to be addressed inlarge scale development to develop a flexible process, as flexibility and short time tomarket are essential requirements posed on the process in our study context.
As the process models presented earlier were used company-wide, the processesinvestigated can be considered as representative for the whole development site as wellas company-wide. Within the studied system, three different subsystem componentswere studied which represent the units of analysis (subsystem 1 to 3). A subsystem wasa large system component of the overall system. Table 4.3 provides information of thesystem complexity in lines of code (LOC) and number of persons involved. The LOCmeasure only included code produced at the company (i.e., third-party frameworks andlibraries are excluded). Furthermore, as a comparison to the Ericsson systems, the sizemeasure in LOC for the open source product Apache web server (largest web serveravailable) is shown as well, the LOC being counted in the same way.
Table 4.3: Units of AnalysisLanguage Size (LOC) No. Persons
Overall System >5,000,000 -Subsystem 1 C++ 300,000 43Subsystem 2 C++ 850,000 53Subsystem 3 Java 24,000 17Apache C++ 220,000 90
The figures show that the systems were quite large, all together more than 20 timeslarger than the Apache web server. To study the processes of the subsystems, a numberof people were interviewed and the measures for each subsystem were collected. Thedistribution of interviewees and the data collection procedures are explained in thefollowing.
4.4.4 Data Collection Procedures
The data was collected from different sources, following the approach of triangulation.The first source driving the qualitative analysis was a set of interviews. The secondsource was process documentation and presentations on the progress of introducingincremental and agile practices. The third source were performance measures collectedby the company. This section explains the data collection procedures for each sourcein detail.
107
Chapter 4. The Effect of Moving from a Plan-Driven to an Incremental and AgileSoftware Development Approach: An Industrial Case Study
Selection of Interviewees
The interviewees were selected so that the overall development life cycle were cov-ered, from requirements to testing and product packaging. Furthermore, each role inthe development process should be represented by at least two persons if possible.That is, these persons fill out the role as their primary responsibility. Only intervie-wees with process experience were selected. Prior to the main part of the interview theinterviewees were asked regarding their experience. We asked for the duration the in-terviewees have been working at the company, and the experience with the old processmodel (plan-driven) and the new process model (incremental and agile). The experi-ence was captured by asking for activities that support good knowledge with regard tothe process model, such as study of documentation, discussion with colleagues, semi-nar and workshops, and the actual use in one or more projects. The average duration ofthe interviewees working at the studied company was 9.4 years. Only two persons in-terviewed worked less than two years at the company. Ten persons had at least 10 yearsof experience working at the company. This indicates that the interviewees had verygood knowledge of the domain and the company’s processes. They were very familiarwith the old process model with regard to all learning activities mentioned before. Withregard to the new process model trainings have been given to the all interviewees. Inaddition, the new process model was widely discussed in the corridors which supportedthe spread of knowledge about it. Eighteen of the interviewees already completed atleast one project with the new development approach, for the remaining intervieweesprojects using the new approach were currently ongoing, i.e. they were in a transitionphase. Overall, the result of the experience questionnaire showed good knowledge andawareness of the processes, which was also visible in their answers.
The selection process of interviewees was done using the following steps:
1. A complete list of people available for each subsystem was provided by manage-ment, not including newly employed personal not familiar with the processes.
2. At least two persons from each role were randomly selected from the list. Themore persons were available for one role the more persons were selected.
3. The selected interviewees received an e-mail explaining why they had been se-lected for the study. Furthermore, the mail contained information of the purposeof the study and an invitation for the interview. Overall, 44 persons had beencontacted of which 33 accepted the invitation.
The distribution of people between different primary responsibilities and the threesubsystems (S1-S3) is shown in Table 4.4. The roles are divided into What, When,How, Quality Assurance, and Life Cycle Management.
108
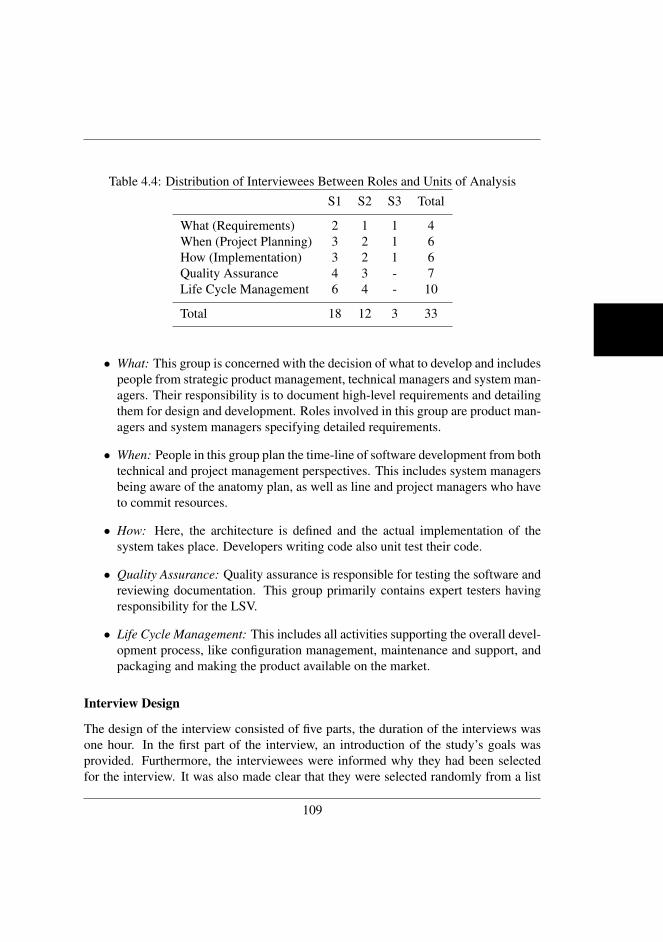
Table 4.4: Distribution of Interviewees Between Roles and Units of AnalysisS1 S2 S3 Total
What (Requirements) 2 1 1 4When (Project Planning) 3 2 1 6How (Implementation) 3 2 1 6Quality Assurance 4 3 - 7Life Cycle Management 6 4 - 10
Total 18 12 3 33
• What: This group is concerned with the decision of what to develop and includespeople from strategic product management, technical managers and system man-agers. Their responsibility is to document high-level requirements and detailingthem for design and development. Roles involved in this group are product man-agers and system managers specifying detailed requirements.
• When: People in this group plan the time-line of software development from bothtechnical and project management perspectives. This includes system managersbeing aware of the anatomy plan, as well as line and project managers who haveto commit resources.
• How: Here, the architecture is defined and the actual implementation of thesystem takes place. Developers writing code also unit test their code.
• Quality Assurance: Quality assurance is responsible for testing the software andreviewing documentation. This group primarily contains expert testers havingresponsibility for the LSV.
• Life Cycle Management: This includes all activities supporting the overall devel-opment process, like configuration management, maintenance and support, andpackaging and making the product available on the market.
Interview Design
The design of the interview consisted of five parts, the duration of the interviews wasone hour. In the first part of the interview, an introduction of the study’s goals wasprovided. Furthermore, the interviewees were informed why they had been selectedfor the interview. It was also made clear that they were selected randomly from a list
109
Chapter 4. The Effect of Moving from a Plan-Driven to an Incremental and AgileSoftware Development Approach: An Industrial Case Study
of people, and that everything they say would be treated confidentially. In the secondpart, the interviewees were asked for their experience and background regarding workat the company in general, and experience with the plan-driven and incremental/agiledevelopment approaches in particular. Therefore, the interviewees filled in a ques-tionnaire rating their experience with the two process models. Thereafter, the actualissues were collected through a semi-structured interview, asking for issues that couldbe characterized as bottlenecks, avoidable rework and unnecessary work (for descrip-tions see Table 4.5). Asking for those areas stimulated the discussion by helping theinterviewee to look at issues from different perspectives and thus allowing to collectmany relevant issues. We asked for issues regarding the plan-driven approach and theincremental/agile approach.
Table 4.5: Questions for Issue ElicitationArea Description
Bottlenecks Bottlenecks are single components hinderingthe performance of the overall developmentprocess. A cause for a bottleneck is the lowcapacity offered by the component [1].
UnnecessaryWork
We understand unnecessary work as activi-ties that do not contribute to the creation ofcustomer value. In lean development, this isreferred to as producing waste ([1] [33]).
AvoidableRework
Rework can be avoided when doing thingscompletely, consistently and correctly [14].For example, having the right test strategyto discover faults as early as possible ([12][11]).
The interviewees should always state the cause of the issue and where the symp-toms of the issue became visible in the process. During the course of the interview,follow-up questions were asked when interesting issues surfaces during the course ofthe interview. All interviews were recorded and transcribed. The interview protocolcan be found in Appendix A.
110

Process Documentation
The company provided process documentation to their employees, as well as presen-tations on the process for training purposes. This documentation was used to facilitatea good understanding of the process in the organization (see Section 4.3). Further-more, presentations given at meetings were collected which showed the progress andfirst results of the introduction of incremental and agile practices from the managementperspective. In addition to that, the documentation provided information of problemswith plan-driven development, which led the company to the decision of making thetransition to incremental and agile development. Overall the documentation servedtwo main purposes: (1) Help the interviewer to gain an initial understanding of howthe processes work prior to the interview. In addition, the interviewer needed to becomefamiliar with the terminology used at the company, which was also well supported bydocumentation; (2) To extract context information relevant for this study.
Performance Measures
The company collected a number of performance measures on their development pro-cesses and projects. The performance measures were identified at the company toprovide an indication of performance changes after moving to incremental and agiledevelopment. The measurements were selected based on availability and usefulnessfor this study.
• Requirements waste and change requests: Requirements waste means that re-quirements are elicited, documented and verified, but they are not implemented.The analysis focused on the ratio of implemented requirements in comparisonto wasted requirements. Furthermore, the change requests per requirement wereanalyzed. Requirements waste and change requests indicate whether the com-pany increases its ability to develop requirements in a timely manner after thecustomer need was raised. If there are fewer change requests and less discardedrequirements then this is an indicator for that the current market needs are ful-filled in a better way. The information for waste and change requests was at-tributed to the plan-driven and incremental development model through releases,i.e. it was known which releases used the purely plan-driven process, and whichreleases used the new incremental process with additional agile practices.
• Quality Data: The change in software quality was analyzed through fault-slipthrough and maintenance effort. Fault-slip-through [12] shows how many faultswere identified in the LSV which should have been found earlier. In order to beable to measure the fault-slip-through a testing strategy has to be developed. The
111
Chapter 4. The Effect of Moving from a Plan-Driven to an Incremental and AgileSoftware Development Approach: An Industrial Case Study
strategy needs to document which type of fault should be detected in a specificphase (e.g. performance related issues should be detected in system test, bufferoverflows should be detected in unit testing and static code analysis, etc.) andwhen they were actually detected. That way one can determine how many faultsshould have been detected before a specific quality assurance phase. In this casestudy the quality of basic test and function test conducted before integration andsystem test was measured. For example, a fault-slip of x% in the system testingphase means that x% of all faults discovered in this phase should have beenfound in earlier phases (e.g. function testing). The data source for the fault-slipthrough measurements was the defect tracking system employed at the company,which was introduced in Table 4.2. The maintenance effort was a an indicatorof the overall quality of the product released on the market. Quality data wasconsidered as quality is an important aspect of the market Ericsson operates in.For telecommunication operators performance and availability are particularlyimportant quality characteristics.
4.4.5 Data AnalysisThe data analysis was done in six different steps, as shown in Figure 4.2. The firstfour activities led to a set of issues related to process performance in both developmentapproaches. The first author transcribed all interviews resulting in more than 30 hoursof interview data. Thereafter, the author conducted the first four steps over a threemonth period based on the transcriptions.
1. Clustering of Raw Data: The statements from each interviewee were mappedto process phases, the role of the interviewee, and the process model they referto (i.e. either plan-driven or incremental/agile development). The informationwas maintained using a matrix. For each statement the identity-number of theinterviewee was documented as well to assure traceability.
2. Derivation of Issues from Raw Data: As the raw data contained detailed ex-planations using company specific terminology the data was summarized andreformulated by deriving issues from the clustered data. Each issue was shortlydescribed in one or two sentences. The result was a quite high number of issuesin each group, as the issues were on different abstraction levels.
3. Mapping of Issues: The issues were grouped based on their relation to eachother, and their abstraction level. For example, issues that negatively affect thecoverage of the system by test cases were grouped within one branch called “lowtest coverage”. The grouping was documented in the form of a mind map. Issues
112
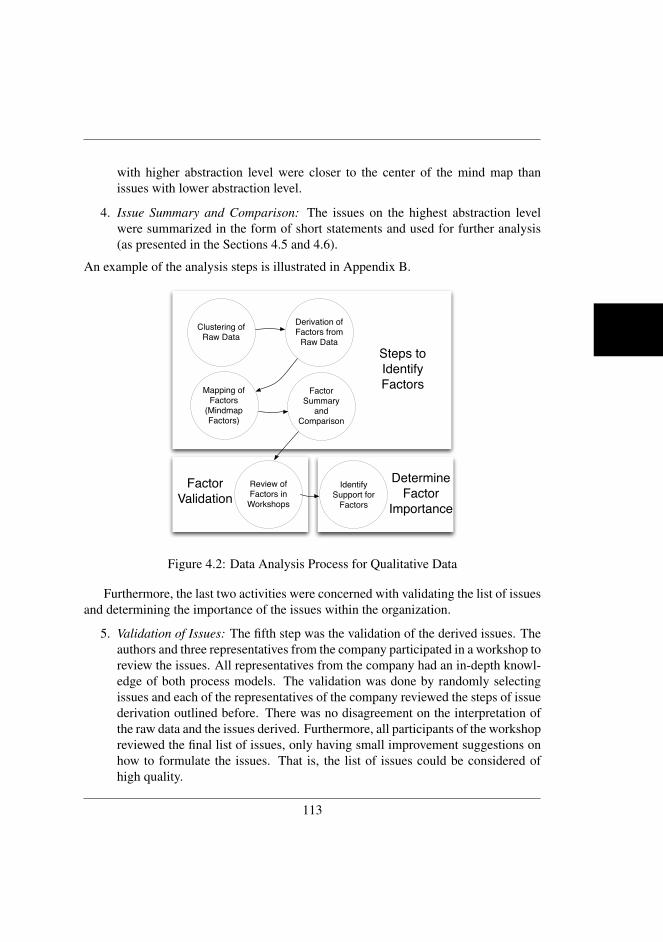
with higher abstraction level were closer to the center of the mind map thanissues with lower abstraction level.
4. Issue Summary and Comparison: The issues on the highest abstraction levelwere summarized in the form of short statements and used for further analysis(as presented in the Sections 4.5 and 4.6).
An example of the analysis steps is illustrated in Appendix B.
Clustering of Raw Data
Derivation of Factors from
Raw Data
Mapping of Factors
(Mindmap Factors)
Factor Summary
and Comparison
Steps to Identify Factors
Review of Factors in
Workshops
Factor Validation
Identify Support for
Factors
Determine Factor
Importance
Figure 4.2: Data Analysis Process for Qualitative Data
Furthermore, the last two activities were concerned with validating the list of issuesand determining the importance of the issues within the organization.
5. Validation of Issues: The fifth step was the validation of the derived issues. Theauthors and three representatives from the company participated in a workshop toreview the issues. All representatives from the company had an in-depth knowl-edge of both process models. The validation was done by randomly selectingissues and each of the representatives of the company reviewed the steps of issuederivation outlined before. There was no disagreement on the interpretation ofthe raw data and the issues derived. Furthermore, all participants of the workshopreviewed the final list of issues, only having small improvement suggestions onhow to formulate the issues. That is, the list of issues could be considered ofhigh quality.
113
Chapter 4. The Effect of Moving from a Plan-Driven to an Incremental and AgileSoftware Development Approach: An Industrial Case Study
6. Weight of Issues: The sixth step aimed at identifying the most commonly per-ceived issues with regard to the approaches (plan-driven and incremental/ agile).As we asked the interviewees to state three bottlenecks/ unnecessary works/ re-works for each of the models we were able to determine which issues mentionedwere most commonly perceived. For example, if an interviewee an issue as crit-ical for plan-driven, but not for incremental and agile, this is an indication for animprovement of the issue. We explicitly asked the interviewees for the situationbefore and after the migration, and used follow-up questions whenever it wasunclear whether an issue was only considered important for one of the processmodels. In order to determine which issues were the most common, the data wasfirst divided into global and local issues. The division in global and local issueswas defined as follows:
• Global Issues: Global issues were stated by interviewees representing morethan one role and representing more than one subsystem component (i.e.,they were spread across the units of analysis).
• Local Issues: Local issues were stated by one or several interviewees rep-resenting one role or one subsystem component.
To systematize the global issues, four different subgroups were defined. Themain objective of the grouping was to structure the responses based on the num-ber of interviewees mentioning each issue. It was hence a way of assigning someweight to each issue based on the responses. The following four subgroups weredefined:
• General Issues: More than 1/3 of the interviewees mentioned the issue.
• Very Common Issues: More than 1/5 of the interviewees mentioned theissue.
• Common Issues: More than 1/10 of the interviewees mentioned the issue.
• Other Issues: Less than 1/10 of the interviewees mentioned the issue, butit was still mentioned by more than one person representing different rolesor different subsystem components.
In addition to that, the interviewees explicitly talked about inferences with regardto improvements that they have recognized after moving to incremental and ag-ile development. The improvements were grouped into commonly perceived andobservation. One should observe that the threshold for commonly perceived im-provements was much lower compared to the above thresholds, and fewer groups
114
were formulated. This was due to that we did not explicitly ask for the improve-ments as the interviews focused on issues determining how the commonality ofissues changed after migration. However, in several cases the interviewee alsotalked about the actual differences between the situation before and after the mi-gration and hence the improvements perceived when moving from a plan-drivenapproach to incremental and agile development. Thus, the improvements per-ceived were only divided into two groups:
• Commonly perceived: More than 1/10 of the interviewees representingmore than one subsystem component mentioned the issue.
• Observation: Less than 1/10 of the interviewees mentioned the issue.
It should be observed that local issues also could be of high importance. However,they may be perceived as local since the issue is not visible outside a certain phase,although major problems inside a phase were communicated to others. Thus, it isbelieved that the main issues influencing process performance are captured in the globalissues.
4.4.6 Threats to ValidityResearch based on empirical studies does have threats, and hence so does the case studyin this paper. However, the success of an empirical study is to a large extent based onearly identification of threats and hence allowing for actions to be taken to mitigateor at least minimize the threats to the findings. Threats to case studies can be foundin for example [45], and threats in a software engineering context is discussed in forexample [44]. The threats to validity can be divided into four types: construct valid-ity, internal validity, external validity and reliability (or conclusion validity). Constructvalidity is concerned with obtaining the right measures for the concept being studies.Internal validity is primarily for explanatory and causal studies, where the objective isto establish a causal relationship. External validity is about generalizability to deter-mine to which context the findings in a study can be generalized. Finally, reliability isconcerned with repetition or replication, and in particular that the same result would befound if re-doing the study in the same setting.
Construct Validity
The following threats were identified and the corresponding actions were taken:
• Selection of people: The results are highly dependent on the people being inter-viewed. To obtain the best possible sample, the selection of people was done by
115
Chapter 4. The Effect of Moving from a Plan-Driven to an Incremental and AgileSoftware Development Approach: An Industrial Case Study
people having worked at Ericsson for a long time and hence knowing people inthe organization very well.
• Reactive bias: There is a risk that the presence of a researcher influences theoutcome. This is not perceived as a large risk given a long term collaborationbetween the company and the university. Furthermore, the main author is alsoemployed at Ericsson and not viewed as an external researcher. However, as thenew model was strongly supported by management the interviews are likely tobe biased towards the new model to reflect the political drift. In order to reducethis threat, the interviewees were informed that they had been randomly selected.Furthermore, anonymity of the individuals’ responses was guaranteed.
• Correct data interview: The questions of the interviewer may be misunderstoodor the data may be misinterpreted. To avoid this threat, several actions havebeen taken. First of all, pre-tests were conducted regarding the interviews toensure a correct interpretation of the questions. Furthermore, all interviews weretaped allowing the researcher to listen to the interview again if some parts weremisunderstood or unclear.
• Correct data measurements: The data sources for requirements waste, faults,and maintenance effort were summarized by the company and the process ofdata collection and the data sources were not made available to the researchers.In consequence, there is a validity threat regarding potential problems of the rigorof the data collection. In addition, the interpretation of the data is limited dueto the high abstraction of the measurements. Hence, the data can only be usedas an additional data source for triangulation purposes in order to support the(main) qualitative findings, but not to make inferences such as to which quan-tified improvement is possible due to the introduction of incremental and agilepractices.
Internal Validity
• Confounding factors influencing measurements: There is a risk that changes inthe performance measurements reported are not solely due to the employment ofincremental and agile practices, but also due to confounding factors. As the stud-ied company is a complex organization we were not able to rule out confoundingfactors as an influence on the measurement outcome. In addition one personinvolved in reporting the measurements were asked about possible confound-ing factors, such as major difference in the products, or a change in personnel.The response was that the products compared had similar complexity and that
116

the products were developed by the same work-force. The person believed thatchanges in the measurements can, at least partly, be attributed to the migration.However, it is important to point out that the main outcome of the study is thequalitative data from the interviews and that the quantitative data was consultedas an additional data-source to identify whether the quantitative data contradictsthe qualitative data, which was not the case.
• Ability to make inferences about improvements (qualitative data): Another threatto internal validity is that the instrument and analysis did not capture the changedue to the migration to incremental and agile development. However, this threatwas reduced by explicitly asking for the situation before and after the migration.In addition, the interviewer asked follow-up questions whenever it was unclearwhether an issue was only considered important for one of the process models bythe interviewee, or whether the issue was equally relevant to both developmentapproaches. Hence, this threat to validity is considered being under control.
External Validity
• Process models: It is impossible to collect data for a general process, i.e., asdescribed in the literature. Both the plan-driven and the incremental and agilemodel were adaptations of general processes presented in the literature. This isobvious when it comes to the incremental and agile process, but it is the samefor the plan-driven model. It is after all a specific instantiation of the generallydescribed plan-driven model. The incremental and agile model is a little morecomplicated in the mapping to the general process models since it was inspiredby two different approaches: incremental development and agile development.To ensure that the findings are not only relevant for these instantiations, care hasbeen taken to carefully describe the context of the study. Furthermore, Table 4.1illustrates which practices from the general process models have been employedat the company. As the instantiated model and the general process models sharepractices lessens learned in this study are of relevance for the general processmodels as well.
• A specific company: A potential threat is of course that the actual case studyhas been conducted within one company. It has been impossible to conduct asimilar study at another company. This type of in-depth study requires a lot ofeffort and that the research is embedded into the organization, which has madeit impossible to approach more than one company. To minimize the influence ofthe study being conducted at one company, the objective is to map the findingsfrom the company specific processes and issues to general processes and higher
117
Chapter 4. The Effect of Moving from a Plan-Driven to an Incremental and AgileSoftware Development Approach: An Industrial Case Study
level issues. This allows others to learn from the findings and to understand howthe results map to another specific context.
Reliability
• Interpretation of data: There is always a risk that the outcome of the study isaffected by the interpretation of the researcher. To mitigate this threat, the studyhas been designed so that data is collected from different sources, i.e., to con-duct triangulation to ensure the correctness of the findings. Another risk is thatthe interpretation of the data is not traceable and very much depended on the re-searcher conducting the analysis. To reduce the risk a workshop was conductedwith both authors of the paper and three company representatives being present(see fifth step in the analysis process presented in Section 4.4.5). In the work-shop the steps of the researcher were repeated on a number of issues in order toidentify potential problems in the analysis steps and interpretations. The practi-tioners as well as the authors of the paper agreed on the interpretation of the rawdata. Hence, the threat to the interpretation of data is considered under control.
Summary
In summary, the case study has been designed according to guidelines and tactics pro-vided in [45]. Measures have been taken whenever possible to mitigate the risks identi-fied in the design. The objective has been to always work in two dimensions: situationspecific and general models. The former will in particular be used when continuingthe improvement work at the company, where the findings will drive the further im-provement work. This is very much the industry view. The latter represents more of anacademic view where the intention has been to understand the issues inhibiting processperformance in different process models.
4.5 Qualitative Data AnalysisSection 4.4 explains the classification of issues into general and local. In total 64 issueswere identified of which 24 were of general nature and the remaining 40 were localproblems relating to experiences of individuals or specific subsystems. We focused thedetailed qualitative analysis on issues that received high weights in terms of number ofresponses for each issue. That gave 13 issues for the detailed analysis of which 2 wereconsidered general, 3 were considered very common and 8 were considered common.An overview of the issues is provided in Table 4.6.
118

Commonly perceived improvements are shown in Table 4.7. The table shows theID, commonality, process model (either plan-driven=PD or incremental/agile=IA), anda description of the issue. The improvements explain why specific issues were not thatimportant in agile and incremental development anymore. The general issue F01, forexample, was mitigated by improvements in requirements engineering (e.g., I02 andI03). A number of improvements on verification were also identified (I04 and I05),which reduced the effect of issue F03 and F04. That is, incremental and agile develop-ment enabled early testing and regular feedback to developers. Furthermore, improve-ment I06 positively influenced the number of documentation which was raised as animportant issue (F06). Overall, the tables indicate that the mentioned improvementswere in-line with the classification of issues related to process performance. In thefollowing subsections a detailed description of issues and improvements is provided.
4.5.1 General IssuesThe most general issues were related to plan-driven development, one being related tothe requirements phase and one to the testing phase.
F01: Requirements change and rework: All requirements had to be ready beforethe next phase starts. That means, when developing a highly complex system the re-quirements gathering, specification and validation took a very long time. Furthermore,it was hard to estimate the resources needed for a complex system resulting in a toobig scope. As interviewees pointed out “the problem is that the capacity of the projectis only that and that means that we need to get all the requirements, discuss them, takethem down, look at them and then fit the people and the time frame that we will usuallybe given. And this negotiation time that was the part that took so long time. It wasalways and often frustrating.” Another interviewee added that “there is always a lotof meetings and discussions and goes back and forth and nobody is putting the footdown.” The long lead times of requirements engineering have negative consequences.The market tended to change significantly in the considered domain. In consequence,a high amount of requirements gathered became obsolete or changed drastically whichled to wasted effort as the discarded requirements had been negotiated and validatedbefore or requirements had to be reworked. Requirements changes were caused bya lack of customer communication (i.e., the customer was far away from the point ofview of the developers or system managers). In addition, misunderstandings were morelikely to happen, which result in changed requirements. Regarding the reasons for in-flexibility one interviewee added that “in the old model because its very strict to thesetollgates (quality doors) and so on and the requirement handling can be very complexbecause the process almost requires to have all the requirements clearly defined in thebeginning and you should not change them during the way, its not very flexible.”
119
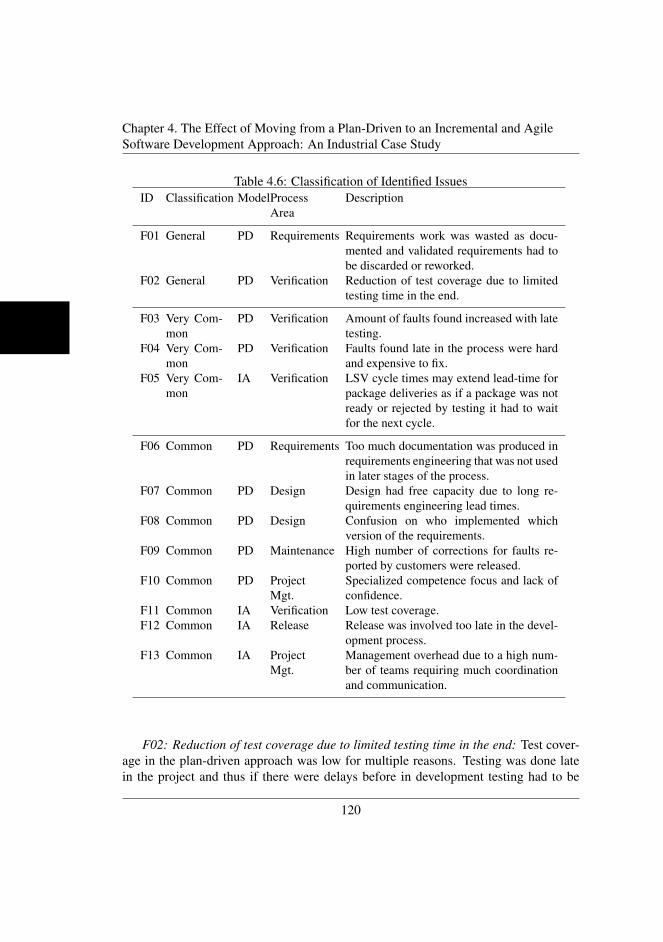
Chapter 4. The Effect of Moving from a Plan-Driven to an Incremental and AgileSoftware Development Approach: An Industrial Case Study
Table 4.6: Classification of Identified IssuesID Classification ModelProcess
AreaDescription
F01 General PD Requirements Requirements work was wasted as docu-mented and validated requirements had tobe discarded or reworked.
F02 General PD Verification Reduction of test coverage due to limitedtesting time in the end.
F03 Very Com-mon
PD Verification Amount of faults found increased with latetesting.
F04 Very Com-mon
PD Verification Faults found late in the process were hardand expensive to fix.
F05 Very Com-mon
IA Verification LSV cycle times may extend lead-time forpackage deliveries as if a package was notready or rejected by testing it had to waitfor the next cycle.
F06 Common PD Requirements Too much documentation was produced inrequirements engineering that was not usedin later stages of the process.
F07 Common PD Design Design had free capacity due to long re-quirements engineering lead times.
F08 Common PD Design Confusion on who implemented whichversion of the requirements.
F09 Common PD Maintenance High number of corrections for faults re-ported by customers were released.
F10 Common PD ProjectMgt.
Specialized competence focus and lack ofconfidence.
F11 Common IA Verification Low test coverage.F12 Common IA Release Release was involved too late in the devel-
opment process.F13 Common IA Project
Mgt.Management overhead due to a high num-ber of teams requiring much coordinationand communication.
F02: Reduction of test coverage due to limited testing time in the end: Test cover-age in the plan-driven approach was low for multiple reasons. Testing was done latein the project and thus if there were delays before in development testing had to be
120
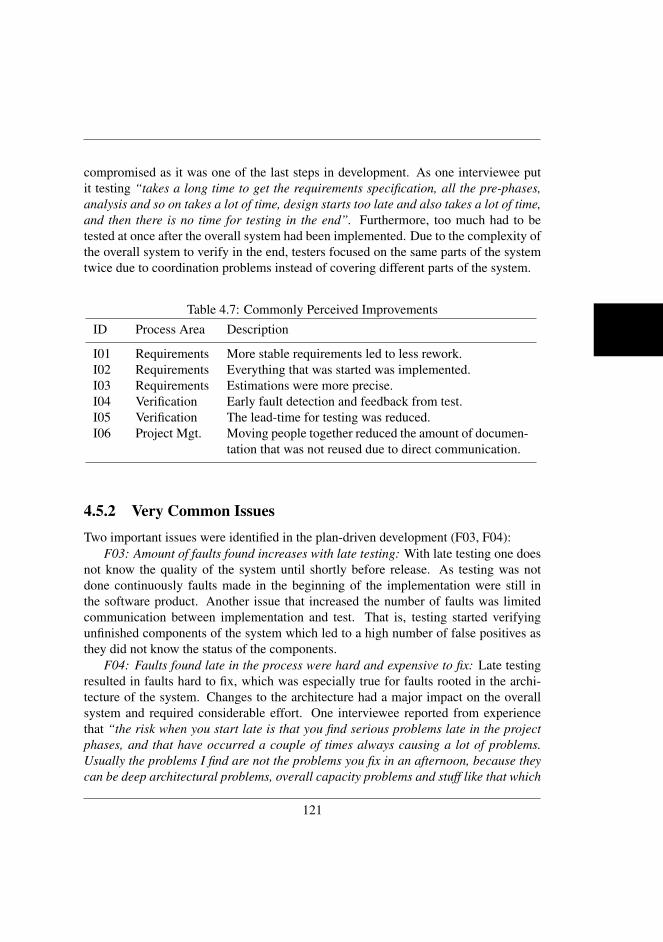
compromised as it was one of the last steps in development. As one interviewee putit testing “takes a long time to get the requirements specification, all the pre-phases,analysis and so on takes a lot of time, design starts too late and also takes a lot of time,and then there is no time for testing in the end”. Furthermore, too much had to betested at once after the overall system had been implemented. Due to the complexity ofthe overall system to verify in the end, testers focused on the same parts of the systemtwice due to coordination problems instead of covering different parts of the system.
Table 4.7: Commonly Perceived ImprovementsID Process Area Description
I01 Requirements More stable requirements led to less rework.I02 Requirements Everything that was started was implemented.I03 Requirements Estimations were more precise.I04 Verification Early fault detection and feedback from test.I05 Verification The lead-time for testing was reduced.I06 Project Mgt. Moving people together reduced the amount of documen-
tation that was not reused due to direct communication.
4.5.2 Very Common IssuesTwo important issues were identified in the plan-driven development (F03, F04):
F03: Amount of faults found increases with late testing: With late testing one doesnot know the quality of the system until shortly before release. As testing was notdone continuously faults made in the beginning of the implementation were still inthe software product. Another issue that increased the number of faults was limitedcommunication between implementation and test. That is, testing started verifyingunfinished components of the system which led to a high number of false positives asthey did not know the status of the components.
F04: Faults found late in the process were hard and expensive to fix: Late testingresulted in faults hard to fix, which was especially true for faults rooted in the archi-tecture of the system. Changes to the architecture had a major impact on the overallsystem and required considerable effort. One interviewee reported from experiencethat “the risk when you start late is that you find serious problems late in the projectphases, and that have occurred a couple of times always causing a lot of problems.Usually the problems I find are not the problems you fix in an afternoon, because theycan be deep architectural problems, overall capacity problems and stuff like that which
121
Chapter 4. The Effect of Moving from a Plan-Driven to an Incremental and AgileSoftware Development Approach: An Industrial Case Study
is sometimes very hard to fix. So I have always lobbied for having time for a pre-testeven if not all the functionality is there.”
Issue F05 is related to testing in incremental and agile development:F05: LSV cycle times may extend lead-time for package deliveries as if a package is
not ready or rejected by testing it had to wait for the next cycle. The lead-time of testingwas not optimized yet which extended the overall lead time of the development process.An LSV was separated in cycles. Within one cycle (time-window with a fixed end-date)the projects needed to drop their completed component to the LSV. The LSV cycles (4weeks) did not match with the target dates of the availability of the product on themarket. That is, coordination between selling the product and developing the productwas complicated. The LSV concept also required a component to wait for anothercomplete LSV cycle if not delivered within the cycle it was supposed to be delivered.Furthermore, if a package was rejected from the LSV due to quality problems andcould not be fixed and retested in time, it also had to wait for the next cycle.
4.5.3 Common Issues
The following important issues are related to plan-driven development:F06: Documentation produced was not used: The interviewees emphasized that
quite a high number of documentation was produced in the requirements phase, oneinterviewee added that “it (documentation) takes much effort because it is not onlythat documents should be written, it should be reviewed, then there should be a reviewprotocol and a second round around the table.” One of the reasons mentioned wasbad reuse of documentation, which was pointed out by another interviewee saying that“even though documentation might be good for the quality it might not be good overallbecause much of the documentation will not be reused or used at all.” Hence, thereview of requirements documents required a too high amount of documentation andcomplex checklists.
F07: Design had free capacity due to long requirements engineering lead times:The requirements lead-time in plan-driven development were quite long. The reasonsbeing that requirements had to be specified in too much detail, decision making took along time, or requirements resources were tied up because of a too big scope. This hada negative impact on the utilization of personnel. One interviewee nicely summarizedthe issue saying that “the whole waterfall principle is not suited for such large projectswith so many people involved because half the workforce ends up working for the rest,and I guess thats why the projects were so long. Because you start off with months ofrequirements handling and during that time you have a number of developers more orless doing nothing.”
122

F08: Confusion on who implements which version of the requirements: From adesign perspective, it was not always clear which version of the requirements shouldbe implemented and by whom. The cause of this problem was that work often startedon unfinished or unapproved requirements which had not been properly base-lined.
F09: High number of corrections for faults reported by customers were released:Support was required to release a high number of corrections on already released soft-ware. This was due to the overall length of the plan-driven projects resulting in verylong release cycles. In consequence, the customers could not wait for the correctionsto be fixed for the next release, making corrections a time-pressing issue.
F10: Specialized competence focus and lack of confidence: The competence focusof people in plan-driven development was narrowed, but specialized. This was due tothat people were clearly separated in their phases and disciplines, and that knowledgewas not well spread among them. Interesting was that not only the specific competencefocus was recognized as an issue, but also the focus on confidence. One intervieweedescribed the relevance of confidence by saying “It is not only competence, it is alsoconfidence. Because you can be very competent, but you are not confident you will notput your finger down and say this is the way we are going to do it, you might say itcould be done in this way, or in this way, or also in these two ways. This will not createa productive way of working. Competence is one thing, confidence is the other onerequired.”
Important issues in incremental and agile development are:F11: Low test coverage: The reasons for low test coverage changed in incremen-
tal/agile development and were mainly related to the LSV concept. Quality testingtakes too much time on the LSV level, the reason being that there was a lack of pow-erful hardware available to developers to do quality testing earlier. In consequence,there was a higher risk of finding faults late. Furthermore, the interviewees had wor-ries on the length of the projects as it would be hard to squeeze everything into a threemonth project (including developing configurations and business logic, testing etc.). Inaddition to that test coverage was influenced negatively by a lack of independent ver-ification and validation. That is, developers and testers in one team were influencingeach other what to test. In consequence, the testing scope was reduced.
F12: Release personnel was involved too late in the development process: Thismeans that release personnel got the information required for packaging the product af-ter requirements, implementation and testing were finished. In consequence, the scopeof the product was not known to release and came as a surprise. With regard to thisobservation one interviewee stated that “In release we are supposed to combine every-thing and send it to the market, we were never involved in the beginning. We can haveproblems with delivering everything that we could have foreseen if we were involvedearly.” Furthermore, the requirements were not written from a sales perspective, but
123
Chapter 4. The Effect of Moving from a Plan-Driven to an Incremental and AgileSoftware Development Approach: An Industrial Case Study
mainly from a technical perspective. This made it harder for release to create a productthat is appealing to the customer. During the interviews it was explicitly mentionedthat this situation has not changed with the introduction of an incremental and agiledevelopment approach.
F13: Management overhead due to a high number of teams requiring much coor-dination and communication: Many small projects working toward the same goal re-quired much coordination and management effort. This included planning of the tech-nical structure and matching it against a time-line for project planning. Thus, projectmanagers had much more responsibility in incremental and agile development. Fur-thermore, there was one more level of management (more team leaders) required forthe coordination of the small teams. The interviewees also had worries that the addedlevel of management had problems to agree on overall product behavior (hardware,application, performance, overall capacity) which delayed decision making. Thus, de-cisions were not taken when they were needed.
4.5.4 Comparison of IssuesTable 4.6 clearly shows that a majority of general problems was related to plan-drivendevelopment. Furthermore, only one issue raised for the incremental and agile modelwas considered very common (none was general), while four issues for the plan-drivenapproach were considered general or very common. It is hence clear that the change toan incremental and more agile development model was perceived as having addressedsome of the main issues raised for the plan-driven approach. Having said this, it doesnot mean that the new development approach is unproblematic. However, the problemsare at least not perceived as commonly as for plan-driven development. Furthermore,the problem related to test coverage was still perceived as present, but the severity andnature of the issue has changed for the better. Additional detail on improvements andopen issues based on the comparison is provided in Section 4.7.
4.5.5 Commonly Perceived ImprovementsThe following improvements due to the introduction of incremental and agile develop-ment practices were mentioned by the interviewees:
I01: More stable requirements led to less rework and changes: Requirements weremore stable as requirements coming into the project could be designed fast due to thatthey were implemented in small coherent packages and projects. That is, the time win-dow was much smaller and the requirements were thus not subjected to change to thesame degree. Furthermore, the flexibility was higher in terms of how to specify therequirements. For example, requirements with very low priorities did not need to be
124
specified in detail. If requirements are just seen as the whole scope of the system, thisdistinction is not made (as is the case in plan-driven development). Also, the communi-cation and interaction between design and requirements improved, allowing clarifyingthings and thus implementing them correctly. This communication was improved, butnot to the degree as the communication between design and implementation had beenimproved (see issues for test/ design). One interviewee summarized the increased flexi-bility by saying that “within the new ways of working its easier to steer around changesand problems if you notice something is wrong, its much easier to change the scope andif you have change requests on a requirement, I think its more easy.”
I02: Everything that is started is implemented: If a requirement was prioritizedit was implemented, the time of implementation depending on the position of the re-quirement in the priority list. As one interviewee (requirements engineer) reported,before a large part of all requirements engineering work was waste, while now onlyapproximately 10 % of the work is wasted. In partuclar, the new situation allows tocomplete tasks continuously with not being so dependend on others to be ready, whichwas explained by one interviewee saying that “when you talk about the waterfall youalways end up in a situation where everybody had to be ready before you continue withnext task, but with the new method what we see is that one activity is done, they canpick the next to do, they are not supposed to do anything else.”
I03: Estimations are more precise: The effort can be estimated in a better way asthere were less requirements coming into the project, and the requirements were morespecific. Furthermore, the incremental and agile model contributed to more realisticestimations. With the plan-driven approach the deadlines and effort estimates wereunrealistic when being compared to the requirements scope. When only estimatinga part of the prioritized list (highest priority requirements first), then the estimationsbecame much more realistic.
I04: Early fault detection and feedback from test: Problems could be traced andidentified much easier as one component was rejected back to the project if a problemoccurs. The ability to reject an increment back to a development team has advantages aspointed out by an interviewee stating the following: “I know that it will be tougher forthe design units to deliver the software to testing in incremental and agile developmentthan it was in waterfall because if they (design and implementation) don’t have theproper quality it (the increment) will be rejected back to the design organization. This isgood as it will put more pressure on the design organization. It will be more visible, youcan always say it does not work, we can not take that. It will be more visible to peopleoutside (management).” Besides that, there was better focus on parts of the systemand feedback was provided much earlier. Furthermore, the understanding of testingpriorities was improved due to the explicit prioritization of features in requirementsengineering. These benefits were summarized by an interviewee who pointed out that
125
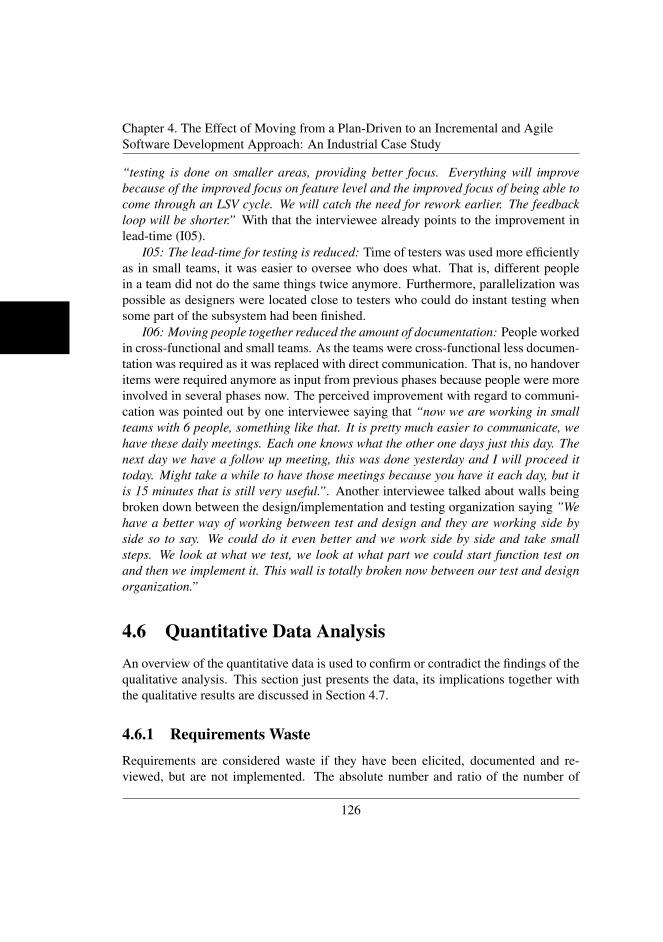
Chapter 4. The Effect of Moving from a Plan-Driven to an Incremental and AgileSoftware Development Approach: An Industrial Case Study
“testing is done on smaller areas, providing better focus. Everything will improvebecause of the improved focus on feature level and the improved focus of being able tocome through an LSV cycle. We will catch the need for rework earlier. The feedbackloop will be shorter.” With that the interviewee already points to the improvement inlead-time (I05).
I05: The lead-time for testing is reduced: Time of testers was used more efficientlyas in small teams, it was easier to oversee who does what. That is, different peoplein a team did not do the same things twice anymore. Furthermore, parallelization waspossible as designers were located close to testers who could do instant testing whensome part of the subsystem had been finished.
I06: Moving people together reduced the amount of documentation: People workedin cross-functional and small teams. As the teams were cross-functional less documen-tation was required as it was replaced with direct communication. That is, no handoveritems were required anymore as input from previous phases because people were moreinvolved in several phases now. The perceived improvement with regard to communi-cation was pointed out by one interviewee saying that “now we are working in smallteams with 6 people, something like that. It is pretty much easier to communicate, wehave these daily meetings. Each one knows what the other one days just this day. Thenext day we have a follow up meeting, this was done yesterday and I will proceed ittoday. Might take a while to have those meetings because you have it each day, but itis 15 minutes that is still very useful.”. Another interviewee talked about walls beingbroken down between the design/implementation and testing organization saying ”Wehave a better way of working between test and design and they are working side byside so to say. We could do it even better and we work side by side and take smallsteps. We look at what we test, we look at what part we could start function test onand then we implement it. This wall is totally broken now between our test and designorganization.”
4.6 Quantitative Data AnalysisAn overview of the quantitative data is used to confirm or contradict the findings of thequalitative analysis. This section just presents the data, its implications together withthe qualitative results are discussed in Section 4.7.
4.6.1 Requirements WasteRequirements are considered waste if they have been elicited, documented and re-viewed, but are not implemented. The absolute number and ratio of the number of
126
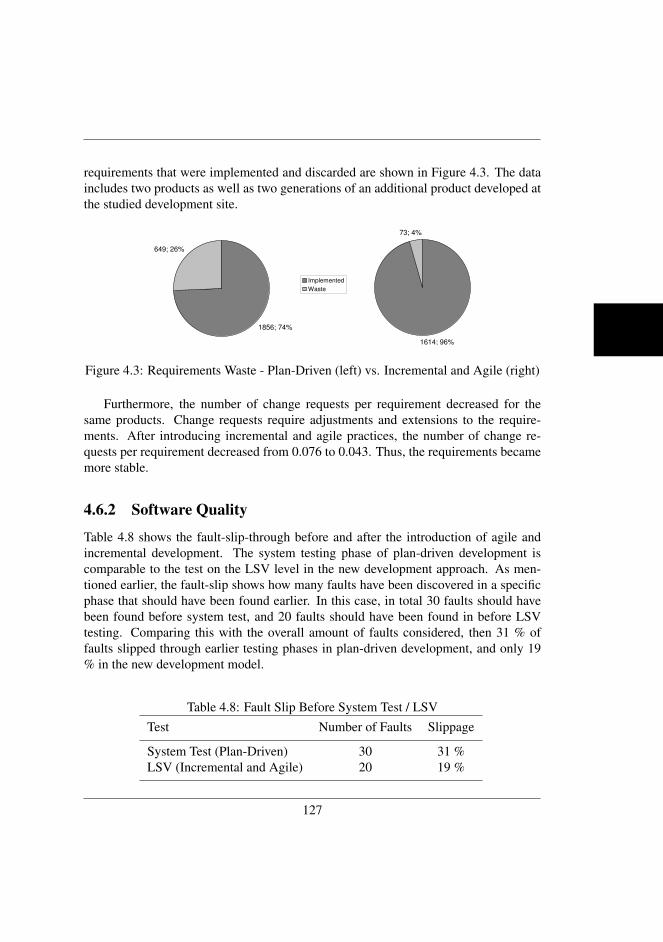
requirements that were implemented and discarded are shown in Figure 4.3. The dataincludes two products as well as two generations of an additional product developed atthe studied development site.
WF (Waste %) Streamline (Waste %)
26 5
25 3 Waterfall Streamline
33 3 Spec Impl Spec Impl
CHARGING 2205 1632 1530 1461
MULTIM 300 224 157 153
Waterfall Incremental / Agile
Waste 28 3,666666667 SUM 2505 1856 1687 1614
Implemented 72 96,33333333 WASTE 649 73
100 100
Implemented 1856 Implemented 1614
Waste 649 Waste 73
1856; 74%
649; 26%
1614; 96%
73; 4%
Implemented
Waste
Figure 4.3: Requirements Waste - Plan-Driven (left) vs. Incremental and Agile (right)
Furthermore, the number of change requests per requirement decreased for thesame products. Change requests require adjustments and extensions to the require-ments. After introducing incremental and agile practices, the number of change re-quests per requirement decreased from 0.076 to 0.043. Thus, the requirements becamemore stable.
4.6.2 Software Quality
Table 4.8 shows the fault-slip-through before and after the introduction of agile andincremental development. The system testing phase of plan-driven development iscomparable to the test on the LSV level in the new development approach. As men-tioned earlier, the fault-slip shows how many faults have been discovered in a specificphase that should have been found earlier. In this case, in total 30 faults should havebeen found before system test, and 20 faults should have been found in before LSVtesting. Comparing this with the overall amount of faults considered, then 31 % offaults slipped through earlier testing phases in plan-driven development, and only 19% in the new development model.
Table 4.8: Fault Slip Before System Test / LSVTest Number of Faults Slippage
System Test (Plan-Driven) 30 31 %LSV (Incremental and Agile) 20 19 %
127
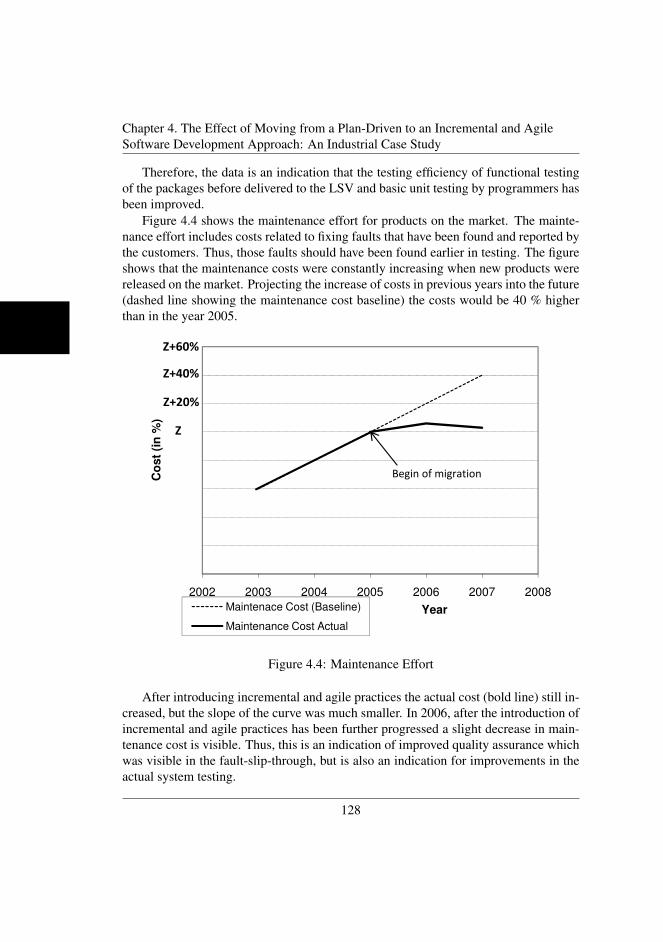
Chapter 4. The Effect of Moving from a Plan-Driven to an Incremental and AgileSoftware Development Approach: An Industrial Case Study
Therefore, the data is an indication that the testing efficiency of functional testingof the packages before delivered to the LSV and basic unit testing by programmers hasbeen improved.
Figure 4.4 shows the maintenance effort for products on the market. The mainte-nance effort includes costs related to fixing faults that have been found and reported bythe customers. Thus, those faults should have been found earlier in testing. The figureshows that the maintenance costs were constantly increasing when new products werereleased on the market. Projecting the increase of costs in previous years into the future(dashed line showing the maintenance cost baseline) the costs would be 40 % higherthan in the year 2005.
Co
st
(in
%)
Z
Z+20%
Z+40%
Z+60%
Begin of migration
2002 2003 2004 2005 2006 2007 2008
YearMaintenace Cost (Baseline)
Maintenance Cost Actual
Figure 4.4: Maintenance Effort
After introducing incremental and agile practices the actual cost (bold line) still in-creased, but the slope of the curve was much smaller. In 2006, after the introduction ofincremental and agile practices has been further progressed a slight decrease in main-tenance cost is visible. Thus, this is an indication of improved quality assurance whichwas visible in the fault-slip-through, but is also an indication for improvements in theactual system testing.
128
4.7 DiscussionThe discussion draws together the results from the qualitative and quantitative analysis.It is divided in two parts, namely improvement areas and open issues. Open issues areproblems that still have to be addressed after moving from plan-driven to incrementaland agile development.
4.7.1 Improvement AreasRelease frequency: The qualitative data showed that a higher release frequency is possi-ble due to building the product in increments using the LSV concept. However, there isno conclusive evidence that the overall productivity of the development has increased.That is, the same workforce does not produce the same amount of software artifactsin shorter time than before. Instead, the company is able to deliver functionality morefrequently which benefits the organization. Frequent releases lead to earlier return oninvestments. In plan-driven development, a large up-front investment is required whichstarts paying off when the overall development has been completed.
Reduction in waste: A clear improvement can be seen in the reduction of waste,shown in the qualitative analysis which is supported by the quantitative analysis. Fur-thermore, the number of change requests have been reduced which is an indicator forthat the requirements are a better reflection of the customers’ needs than with the plan-driven model. The benefits of this are also explicitly mentioned in the qualitative data(see I01 in Section 4.5). Overall, improvements related to waste in requirements canbe considered essential as this type of waste has been identified as one of the mostcrucial problems in plan-driven development (see F01 in Section 4.5). A good reflec-tion of the needs of the users in the requirements is also essential to make sense of theimprovement that everything that is started is implemented (see I03 in Section 4.5).If the requirements would not be reflected in the current needs, this implementationcould be considered waste, even though it has been identified as an improvement. Fi-nally, the reduced scope in the incremental and agile model helps to have more accurateestimations (I06), meaning that the requirements scope is set appropriately for each in-crement. Thus, it is less likely that requirements have to be discarded due to inaccurateplanning.
Software Quality Improvements: The quantitative data shows improvement in earlytesting done before system testing (LSV), reflected in a reduced fault-slip-through incomparison to the plan-driven approach. Furthermore, the constantly rising mainte-nance effort decreased after introducing incremental and agile practices, even thoughthere have not been any major tendencies for it to go below the level of 2005 (see Figure4.4). In the qualitative data, we identified one improvement raised in the interviews.
129
Chapter 4. The Effect of Moving from a Plan-Driven to an Incremental and AgileSoftware Development Approach: An Industrial Case Study
That is, testing has improved due to early fault detection and feedback from test (seeI03 in Section 4.5). Furthermore, if an increment is dropped to the LSV for test onecan trace which increments are of high or low quality and who is responsible for them.Consequently, this creates incentives for teams to deliver high quality as their workresult is visibly linked to them. By testing early many verification issues identified inplan-driven development can be addressed. These are reduction of test coverage dueto complex testing in the end (F02), increase of the number of faults discovered withlate testing (F03), and that problems are harder to fix when discovered late (F02). Thestudy shows that even though there has been improvements in testing, very importantand important issues relate to verification in incremental and agile developed, furtherdiscussed in the context of open issues.
Improved Communication: The qualitative data suggests an improvement in com-munication when moving people together (I06). This positively affects several issuesthat have been identified for plan-driven development. Firstly, the amount of documen-tation can be reduced because much of the documentation was related to hand-oversbetween phases (F06). As a project team focuses on several phases now, direct com-munication can replace parts of the documentation. Furthermore, in plan-driven devel-opment the knowledge of people is very specialized and they is a lack of confidence.This can be hindering in the beginning when moving from plan-driven to incrementaland agile practices as having small teams requires very broad knowledge of the teammembers (see for example [29]). However, at the same time face-to-face interactionhelps team members to learn from each other and gain insight and understanding of theoverall development process [39].
The perceived improvements are further strengthened by the fact that incrementaland agile practices have not been employed for a long time at the studied companies.The positive results already achieved are also important as a motivator and buy-in tofurther progress with the agile implementation by adding further agile practices suchas test driven development or pair programming.
4.7.2 Open IssuesBased on the classification, the most important issues that remain when moving toincremental and agile development are related to verification, project management, andrelease planning.
Verification: For verification, the improvement of reduced lead-times for testinghave been identified (I06). However, the issue relates to that the LSV cycle times arenot optimized and that there is room of improvement to shorten the lead-time of testing,the issue being the only issue related to incremental and agile development classified asvery important. Thus, although the lead time is perceived to have improved, it is still an
130
area needing attention. Furthermore, the test coverage is considered a problem in bothdevelopment models (see F02 for plan-driven development and F11 in incremental andagile development), even though the classification shows that it is less common for thelatter development model. The descriptions of the issues related to test coverage showthat test coverage is a problem due to different reasons in both development models.In plan-driven development, the test coverage is reduced because too much has to betested at once, and the testing time is always compromised in the end of the plan-drivenproject. In incremental and agile development though the problems are more specific:quality testing in the LSV takes too much time; the project cycles are too short tosqueeze everything into the project; and there is a lack of independent verification forbasic and component testing. This still being a problem, it is less common in incremen-tal and agile than in plan-driven development. However, due to the explicitly identifiedproblems in testing it is clear that there is room for improvement to achieve more sig-nificant improvements, e.g., by implementing test-driven development or increase thedegree of automated testing to speed up the testing process.
Management Overhead: Due to the high number of teams, the work on the teamlevel gets more clear and simplistic with an incremental and agile model. However,many projects working toward the same goal have to be coordinated. As discussed ear-lier (see F13 in Section 4.5) this requires much communication and planning involvingmany different people. Therefore, this issue is specifically related to the scalabilityof incremental and agile methods. To address the issue, the first step taken was theanatomy plan which helps to structure the system and dependencies. This is used asinput for deciding on the order of projects to build the increments.
Release Project: The release project is responsible for bringing the product into ashippable state. The release project is very specific for the company as it is related tobuilding customizable solutions. That is, in the release project a tool has to be createdthat allows the selection of features so that the product is customizable. As raisedin the earlier discussion (F12) people of the release project are involved too late in thedevelopment process and thus the product is not viewed from a commercial perspective.Consequently, an action for improvement would be to integrate people from the releaseproject already in the requirements engineering phase.
4.7.3 ImplicationsThe results of the case study indicate that it is beneficial for large-scale organizationto move from plan-driven to incremental and agile development. In fact, the studycame to the surprising result that plan-driven development is not suitable for a large-scale organization as it produces too much waste in development (specifically in therequirements phase). The most pressing issues identified in the organization were in-
131
Chapter 4. The Effect of Moving from a Plan-Driven to an Incremental and AgileSoftware Development Approach: An Industrial Case Study
fact related to the plan-driven approach. On the other hand, important improvementscan be achieved by moving from plan-driven to incremental and agile development.We have shown that specific areas of improvements are reduction of waste and betterresponsiveness to market changes. Furthermore, there are opportunities for faster returnof investment. However, the case study also shows that even though benefits can begained on the one hand, challenges are raised on the other hand. Areas that specificallyshow room for improvements are testing and support for coordinating a large numberof development teams. The challenges are important to recognize and address whenfurther progressing with the agile implementation.
4.8 Conclusions and Future WorkThis paper investigates the effect of migrating from a plan-driven to an incrementaland agile development approach. The study shows that the most commonly perceivedproblems in the development models can be found in plan-driven development, andmoving from plan-driven to agile and incremental development allows to improve onthese most common issues. Returning to the research questions and propositions, wecan conclude:
Issues: Several issues were identified for both the plan-driven and the incremen-tal and agile approach. However, more commonly perceived issues across roles andsystems were identified for the plan-driven approach.
General issues: The two most commonly perceived issues overall were identifiedfor the plan-driven approach: 1) requirements change and rework; and 2) reduction oftest coverage due to limited test time at the end. Several other issues were identifiedboth for the plan-driven and the incremental and agile approach.
Performance measures: It was only possible to collect two comparable perfor-mance measures: waste in terms of investment in requirements never delivered andfault-slip-through. Both these measures were in favor of the incremental and agilemodel.
Proposition 1 is partially true, i.e. both different and in some cases similar issueswere identified for the two models. Proposition 2 holds. Improvements in the quantita-tive data have been observed and thereby supporting the primary evidence reported forthe qualitative data.
Thus, in summary the main improvements identified are 1) ability to increase re-lease frequency and shorten requirements lead-times; 2) significant reduction of wasteand better reflection of the current customers’ needs measured as reduced number ofchange requests; 3) improvements in software quality for basic testing (unit and compo-nent testing) and overall system quality, and 4) improved communication which facili-
132
tates better understanding and allows to reduce documentation. However, incrementaland agile methods raise a number of challenges at the same time, which are: 1) needsfor coordinating testing and increase test coverage; 2) support for coordinating a highnumber of teams and making decisions related to planning time-lines for concurrentprojects; and 3) integration of release projects in the overall development process. Infuture work, more qualitative as well as quantitative studies are needed to comparedevelopment models for large-scale development.
4.9 References[1] David J. Anderson. Agile Management for Software Engineering: Applying the
Theory of Constraints for Business Results (The Coad Series). Prentice Hall PTR,2003.
[2] Bouchaib Bahli and El-Sayed Abou-Zeid. The role of knowledge creation inadopting xp programming model: An empirical study. In ITI 3rd InternationalConference on Information and Communications Technology: Enabling Tech-nologies for the New Knowledge Society, 2005.
[3] Richard Baskerville, Balasubramaniam Ramesh, Linda Levine, Jan Pries-Heje,and Sandra Slaughter. Is internet-speed software development different? IEEESoftware, 20(6):70–77, 2003.
[4] Kent Beck. Embracing change with extreme programming. IEEE Computer,32(10):70–77, 1999.
[5] Oddur Benediktsson, Deee Dalcher, and Haaa thorbergsson. Comparison of soft-ware development life cycles: a multiproject experiment. IEE Proceedings Soft-ware, 153(3):323–332, 2006.
[6] Martina Ceschi, Alberto Sillitti, Giancarlo Succi, and Stefano De Panfilis. Projectmanagement in plan-based and agile companies. IEEE Software, 22(3):21–27,2005.
[7] David Cohen, Mikael Lindvall, and Patricia Costa. Advances in Computers, Ad-vances in Software Engineering, chapter An Introduction to Agile Methods. El-sevier, Amsterdam, 2004.
[8] David Cohen, Gary Larson, and Bill Ware. Improving software investmentsthrough requirements validation. In Proceedings of the 26th Annual NASA God-
133

REFERENCES
dard Software Engineering Workshop (SEW 2001), page 106, Washington, DC,USA, 2001. IEEE Computer Society.
[9] Aldo Dagnino, Karen Smiley, Hema Srikanth, Annie I. Anton, and Laurie A.Williams. Experiences in applying agile software development practices in newproduct development. In Proceedings of the IASTED Conference on SoftwareEngineering and Applications (IASTED-SEA 2004, pages 501–506, 2004.
[10] Liangtie Dai and Wanwu Guo. Concurrent subsystem-component developmentmodel (cscdm) for developing adaptive e-commerce systems. In Proceedingsof the International Conference on Computational Science and its Applications(ICCSA 2007), pages 81–91, 2007.
[11] Lars-Ola Damm and Lars Lundberg. Company-wide implementation of metricsfor early software fault detection. In Proceedings of the 9th International Con-ference on Software Engineering (ICSE 2007), pages 560–570, 2007.
[12] Lars-Ola Damm, Lars Lundberg, and Claes Wohlin. Faults-slip-through - a con-cept for measuring the efficiency of the test process. Software Process: Improve-ment and Practice, 11(1):47–59, 2006.
[13] Tore Dyba and Torgeir Dingsøyr. Empirical studies of agile software develop-ment: A systematic review. Information & Software Technology, 50(9-10):833–859, 2008.
[14] Richard E. Fairley and Mary Jane Willshire. Iterative rework: The good, the bad,and the ugly. IEEE Computer, 38(9):34–41, 2005.
[15] Geir Kjetil Hanssen, Hans Westerheim, and Finn Olav Bjørnson. Using rationalunified process in an sme - a case study. In Proceedings of the 12th EuropeanConference on Software Process Improvement (EuroSPI 2005), pages 142–150,2005.
[16] Werner Heijstek and Michel R. V. Chaudron. Evaluating rup software develop-ment processes through visualization of effort distribution. In Proceedings ofthe 34th Conference on Software Engineering and Advanced Applications (SEAA2008), pages 266–273, 2008.
[17] Michael Hirsch. Moving from a plan driven culture to agile development. InProceedings of the 27th International Conference on Software Engineering (ICSE2005), page 38, 2005.
134
[18] Sylvia Ilieva, Penko Ivanov, and Eliza Stefanova. Analyses of an agile method-ology implementation. In Proceedings of the 30th EUROMICRO Conference(EUROMICRO 2004), pages 326–333, 2004.
[19] J Jarzombek. The 5th annual jaws s3 proceedings, 1999.
[20] Jim Johnson. Keynote speech: Build only the features you need. In Proceedingsof the 4th International Conference on Extreme Programming and Agile Pro-cesses in Software Engineering (XP 2002), 2002.
[21] Caspers Jones. Patterns of Software Systems: Failure and Success. InternationalThomson Computer Press, 1995.
[22] Daniel Karlstrom and Per Runeson. Combining agile methods with stage-gateproject management. IEEE Software, 22(3):43–49, 2005.
[23] Alan S. Koch. Agile software development: evaluating the methods for yourorganization. Artech House, Boston, 2005.
[24] Phillip A. Laplante and Colin J. Neill. Opinion: The demise of the waterfallmodel is imminent. ACM Queue, 1(10):10–15, 2004.
[25] Craig Larman. Agile and Iterative Development: A Manager’s Guide. PearsonEducation, 2003.
[26] Katiuscia Mannaro, Marco Melis, and Michele Marchesi. Empirical analysis onthe satisfaction of it employees comparing xp practices with other software de-velopment methodologies. In Proceedings of the 5th International Conference onExtreme Programming and Agile Processes in Software Engineering (XP 2005),pages 166–174, 2004.
[27] Angela Martin, Robert Biddle, and James Noble. The xp customer role in prac-tice: Three studies. In Agile Development Conference, pages 42–54, 2004.
[28] Pete McBreen. Questioning Extreme Programming. Pearson Education, Boston,MA, USA, 2003.
[29] H. Merisalo-Rantanen, Tuure Tuunanen, and Matti Rossi. Is extreme program-ming just old wine in new bottles: A comparison of two cases. J. DatabaseManag., 16(4):41–61, 2005.
[30] Kai Petersen and Claes Wohlin. A comparison of issues and advantages in ag-ile and incremental development between state of the art and an industrial case.Journal of Systems and Software, in print, 82(9):1479–1490, 2009.
135
REFERENCES
[31] Kai Petersen and Claes Wohlin. Context in industrial software engineering re-search. In Proceedings of the 3rd International Symposium on Empirical SoftwareEngineering and Measurement (ESEM 2009), pages 401–404, 2009.
[32] Kai Petersen, Claes Wohlin, and Dejan Baca. The waterfall model in large-scaledevelopment. In Proceedings of the 10th International Conference on ProductFocused Software Development and Process Improvement (PROFES 2009), pages386–400, 2009.
[33] Mary Poppendieck and Tom Poppendieck. Lean Software Development: An AgileToolkit (The Agile Software Development Series). Addison-Wesley Professional,2003.
[34] Lbs Raccoon. Fifty years of progress in software engineering. SIGSOFT Softw.Eng. Notes, 22(1):88–104, 1997.
[35] Per Runeson and Martin Host. Guidelines for conducting and reporting case studyresearch in software engineering. Empirical Software Engineering, 14(2):131–164, 2009.
[36] Ken Schwaber. Agile project management with Scrum. Microsoft Press, Red-mond, Wash., 2004.
[37] Alberto Sillitti, Martina Ceschi, Barbara Russo, and Giancarlo Succi. Managinguncertainty in requirements: A survey in documentation-driven and agile com-panies. In Proceedings of the 11th IEEE International Symposium on SoftwareMetrics (METRICS 2005), page 17, 2005.
[38] Matt Stephens and Doug Rosenberg. Extreme Programming Refactored: TheCase Against XP. Apress, Berkeley, CA, 2003.
[39] Harald Svensson and Martin Host. Introducing an agile process in a softwaremaintenance and evolution organization. In Proceedings of the 9th EuropeanConference on Software Maintenance and Reengineering (CSMR 2005), pages256–264, 2005.
[40] Bjørnar Tessem. Experiences in learning xp practices: A qualitative study. InProceedings of the 4th International Conference on Extreme Programming andAgile Processes in Software Engineering (XP 2004), pages 131–137, 2003.
[41] Michael Thomas. It projects sink or swim. British Computer Society Review2001, 2001.
136
[42] Piotr Tomaszewski. Software development productivity - evaluation and improve-ment for large industrial projects. PhD thesis, Detp. of Systems and SoftwareEngineering, Blekinge Institute of Technology, 2006.
[43] Andrew Wils, Stefan Van Baelen, Tom Holvoet, and Karel De Vlaminck. Agilityin the avionics software world. In XP, pages 123–132, 2006.
[44] Claes Wohlin, Per Runeson, Martin Host, Magnus C. Ohlsson, Bjorn Regnell,and Anders Wesslen. Experimentation in Software Engineering: An Introduction(International Series in Software Engineering). Springer, 2000.
[45] Robert K. Yin. Case Study Research: Design and Methods, 3rd Edition, AppliedSocial Research Methods Series, Vol. 5. Prentice Hall, 2002.
137
REFERENCES
138
Chapter 5
A Comparison of Issues andAdvantages in Agile andIncremental Developmentbetween State of the Art and anIndustrial Case
Kai Petersen and Claes WohlinPublished in Journal of Systems and Software
5.1 IntroductionThe nature of software development has changed in recent years. Software is nowincluded in a vast amount of products (cars, entertainment, mobile phones) and is amajor factor determining whether a product succeeds. In consequence it becomes moreand more important to be flexible in handling changing requirements to meet currentcustomer needs and to be able to deliver quickly to the market. As a solution, agilemethods have started to be adopted by industry and recent studies have been focusingon evaluating agile and incremental development models.
139
Chapter 5. A Comparison of Issues and Advantages in Agile and IncrementalDevelopment between State of the Art and an Industrial Case
A systematic review [4] identified and analyzed studies on agile software develop-ment. Thirty three relevant studies were identified of which 25 investigated ExtremeProgramming (XP). Furthermore, only three papers investigated projects with morethan 50 people involved in total. Thus, the results so far are hard to generalize dueto the focus on one specific method and small projects. In order to address this re-search gap a large-scale implementation of a set of agile and incremental practices isinvestigated through an industrial case study at Ericsson AB. In particular, issues andadvantages of using agile and incremental methods are extracted from existing studiesand are compared with the results of the case study. Three subsystems have been in-vestigated at Ericsson through 33 interviews, covering persons from each subsystemsand different roles.
The incremental and agile model used at the company is a selection of agile andincremental practices, so it cannot be mapped one to one to the models presented inliterature. However, the company’s agile and incremental model uses practices fromSCRUM (SC), XP, and incremental and iterative development (IID). Some of the keypractices used at the company are, for example, the devision of internal and externalreleases, small and motivated teams developing software in three month projects (time-boxing), frequent integration of software, and always developing the highest prioritizedfeatures first.
The main contribution of the study is to help in the decision of adopting agilemethods and showing the problems that have to be addressed as well as the merits thatcan be gained by agile methods. Based on this, the following objectives are formulatedfor the study:
• Illustrate one way of implementing incremental and agile practices in a large-scale organization.
• Provide an in-depth understanding of the merits and issues related to agile devel-opment.
• Increase the generalizability of existing findings by investigating a differentstudy context (large scale and telecommunication domain) and comparing it tostate of the art.
The structure of the chapter is shown in Figure 5.1: Section 5.2 presents the stateof the art, summarizing issues and advantages identified in literature. Thereafter, theinvestigated process model is described in Section 5.3, and the practices applied in thecompany’s model are mapped to the practices associated with incremental and agile de-velopment, XP and SCRUM for the purpose of generalizability. Section 5.4 illustratesthe research method, which constitutes the context in which the study is conducted, the
140
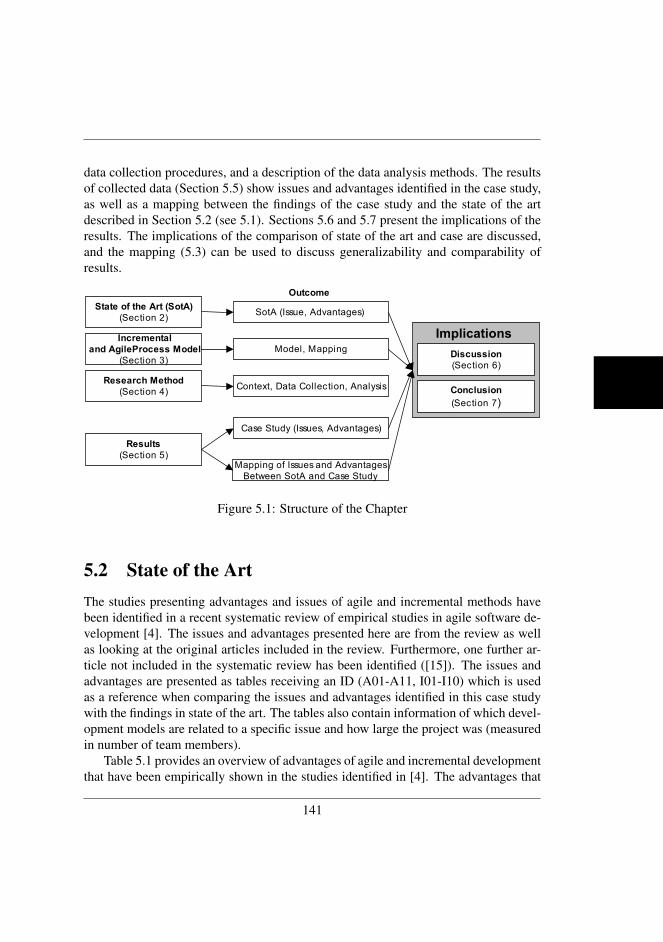
data collection procedures, and a description of the data analysis methods. The resultsof collected data (Section 5.5) show issues and advantages identified in the case study,as well as a mapping between the findings of the case study and the state of the artdescribed in Section 5.2 (see 5.1). Sections 5.6 and 5.7 present the implications of theresults. The implications of the comparison of state of the art and case are discussed,and the mapping (5.3) can be used to discuss generalizability and comparability ofresults.
State of the Art (SotA)(Section 2)
Incremental and AgileProcess Model
(Section 3)
Research Method(Section 4)
Results(Section 5)
Discussion(Section 6)
Conclusion(Section 7)
SotA (Issue, Advantages)
Model, Mapping
Context, Data Collection, Analysis
Mapping of Issues and AdvantagesBetween SotA and Case Study
Case Study (Issues, Advantages)
Implications
Outcome
Figure 5.1: Structure of the Chapter
5.2 State of the ArtThe studies presenting advantages and issues of agile and incremental methods havebeen identified in a recent systematic review of empirical studies in agile software de-velopment [4]. The issues and advantages presented here are from the review as wellas looking at the original articles included in the review. Furthermore, one further ar-ticle not included in the systematic review has been identified ([15]). The issues andadvantages are presented as tables receiving an ID (A01-A11, I01-I10) which is usedas a reference when comparing the issues and advantages identified in this case studywith the findings in state of the art. The tables also contain information of which devel-opment models are related to a specific issue and how large the project was (measuredin number of team members).
Table 5.1 provides an overview of advantages of agile and incremental developmentthat have been empirically shown in the studies identified in [4]. The advantages that
141
Chapter 5. A Comparison of Issues and Advantages in Agile and IncrementalDevelopment between State of the Art and an Industrial Case
have been shown for agile methods are clearly dominated by studies that investigatedXP or a modified version of XP ([6]). Two advantages (A01, A02) have been shownfor SCRUM as well. The size of the projects is quite small (up to 23) and for manyprojects the size has not been reported. The main advantages are related to benefitsof communication leading to better learning and knowledge transfer (A01, A03, A07).Furthermore, it is emphasized that people feel comfortable using agile methods (A08,A10). Also, customers appreciate agile methods as they provide them with the oppor-tunity of influencing the software process and getting feedback (A09). The same is truevice versa, meaning developers also appreciate the presence of customers (A02). De-velopers value the technical focus of agile methods increasing their motivation (A05).There is also a perception of increased quality in software products (A11) and higherproductivity (A10) when using pair programming.
Besides the advantages, agile and incremental models face a number of issues thatare summarized in Table 5.2. Studies identifying issues reveal the same pattern asstudies identifying advantages, that is small projects have been studied and the mainfocus has been on XP. The positive effects that have been shown for pair programming(A03, A10, A11), like higher quality and productivity and facilitated learning, need tobe seen alongside a number of issues. That is, pair programming is perceived as ex-hausting (I04) and requires partners with equal qualifications (I10). Agile can also beconsidered an exhausting activity from customers’ point of view as the customer hasto commit and be present throughout the whole development process. Team relatedissues are that members of teams have to be highly qualified and inter-team communi-cation suffers (I05, I10). From a management point of view two issues are identified,namely that they feel threatened by the empowerment of engineers (I07) and that tech-nical issues are raised too early (I08). Furthermore, agile projects do not scale well(I03) and have too little focus on architecture development (I01). Agile also faces im-plementation problems when realizing continuous testing as this requires much effort(I01).
The advantages and issues of the state of the art shown in Tables 5.1 and 5.2 areused as an input for the comparison with the results from the case study in Section 5.5.
5.3 Incremental and Agile Process Model
The process model used at the company is described and thereafter its principles aremapped to incremental and iterative development, SCRUM, and XP. The model is pri-marily described to set the context for the case study, but the description also illustrateshow a company has implemented an incremental and agile way of working.
142
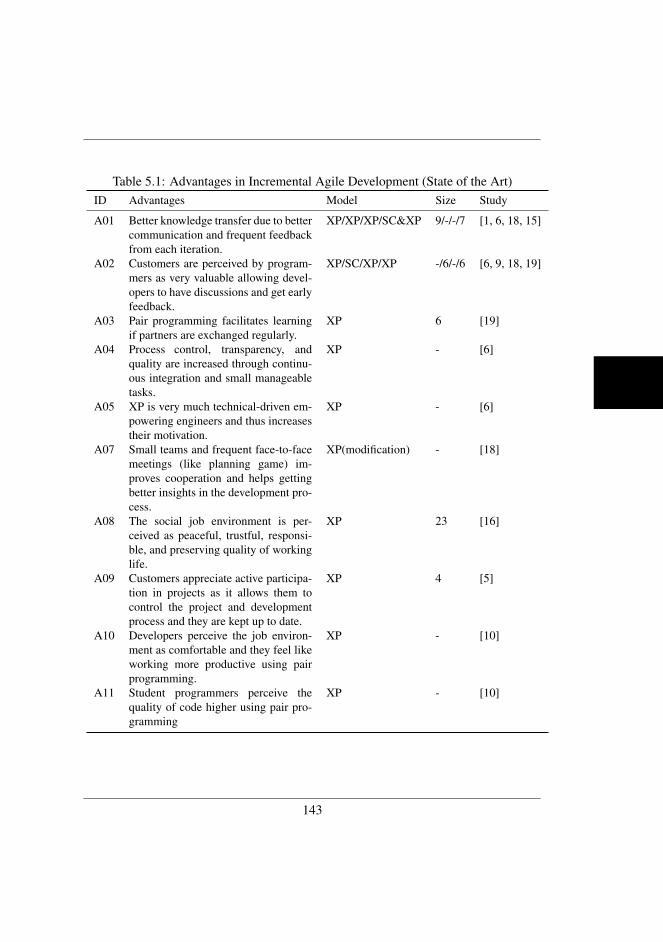
Table 5.1: Advantages in Incremental Agile Development (State of the Art)ID Advantages Model Size Study
A01 Better knowledge transfer due to bettercommunication and frequent feedbackfrom each iteration.
XP/XP/XP/SC&XP 9/-/-/7 [1, 6, 18, 15]
A02 Customers are perceived by program-mers as very valuable allowing devel-opers to have discussions and get earlyfeedback.
XP/SC/XP/XP -/6/-/6 [6, 9, 18, 19]
A03 Pair programming facilitates learningif partners are exchanged regularly.
XP 6 [19]
A04 Process control, transparency, andquality are increased through continu-ous integration and small manageabletasks.
XP - [6]
A05 XP is very much technical-driven em-powering engineers and thus increasestheir motivation.
XP - [6]
A07 Small teams and frequent face-to-facemeetings (like planning game) im-proves cooperation and helps gettingbetter insights in the development pro-cess.
XP(modification) - [18]
A08 The social job environment is per-ceived as peaceful, trustful, responsi-ble, and preserving quality of workinglife.
XP 23 [16]
A09 Customers appreciate active participa-tion in projects as it allows them tocontrol the project and developmentprocess and they are kept up to date.
XP 4 [5]
A10 Developers perceive the job environ-ment as comfortable and they feel likeworking more productive using pairprogramming.
XP - [10]
A11 Student programmers perceive thequality of code higher using pair pro-gramming
XP - [10]
143
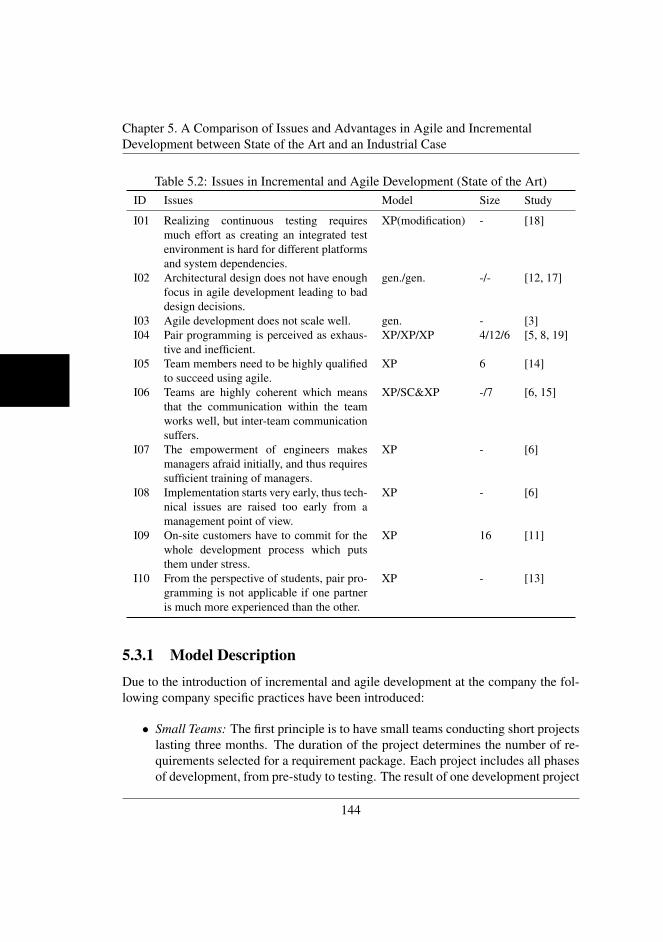
Chapter 5. A Comparison of Issues and Advantages in Agile and IncrementalDevelopment between State of the Art and an Industrial Case
Table 5.2: Issues in Incremental and Agile Development (State of the Art)ID Issues Model Size Study
I01 Realizing continuous testing requiresmuch effort as creating an integrated testenvironment is hard for different platformsand system dependencies.
XP(modification) - [18]
I02 Architectural design does not have enoughfocus in agile development leading to baddesign decisions.
gen./gen. -/- [12, 17]
I03 Agile development does not scale well. gen. - [3]I04 Pair programming is perceived as exhaus-
tive and inefficient.XP/XP/XP 4/12/6 [5, 8, 19]
I05 Team members need to be highly qualifiedto succeed using agile.
XP 6 [14]
I06 Teams are highly coherent which meansthat the communication within the teamworks well, but inter-team communicationsuffers.
XP/SC&XP -/7 [6, 15]
I07 The empowerment of engineers makesmanagers afraid initially, and thus requiressufficient training of managers.
XP - [6]
I08 Implementation starts very early, thus tech-nical issues are raised too early from amanagement point of view.
XP - [6]
I09 On-site customers have to commit for thewhole development process which putsthem under stress.
XP 16 [11]
I10 From the perspective of students, pair pro-gramming is not applicable if one partneris much more experienced than the other.
XP - [13]
5.3.1 Model DescriptionDue to the introduction of incremental and agile development at the company the fol-lowing company specific practices have been introduced:
• Small Teams: The first principle is to have small teams conducting short projectslasting three months. The duration of the project determines the number of re-quirements selected for a requirement package. Each project includes all phasesof development, from pre-study to testing. The result of one development project
144
is an increment of the system and projects can be run in parallel.
• Implementing highest Priority Requirements: The packaging of requirements forprojects is driven by requirement priorities. Requirements with the highest pri-orities are selected and packaged to be implemented. Another criterion for theselection of requirements is that they fit well together and thus can be imple-mented in one coherent project.
• Use of Latest System Version: If a project is integrated with the previous baselineof the system, a new baseline is created. This is referred to as the latest systemversion (LSV). Therefore, only one product exists at one point in time, helpingto reduce the effort for product maintenance. The LSV can also be consideredas a container where the increments developed by the projects (including soft-ware and documentation) are put together. On the project level, the goal is tofocus on the development of the requirements while the LSV sees the overallsystem where the results of the projects are integrated. When the LSV phase iscompleted, the system is ready to be shipped.
• Anatomy Plan: The anatomy plan determines the content of each LSV and thepoint in time when a LSV is supposed to be completed. It is based on the de-pendencies between parts of the system developed which are developed in smallprojects, thus influencing the time-line in which projects have to be executed.
• Decoupling Development from Customer Release: If every release is pushedonto the market, there are too many releases used by customers that need to besupported. In order to avoid this, not every LSV has to be released, but it has tobe of sufficient quality to be possible to release to customers. LSVs not releasedto the customers are referred to as potential releases. The release project in itselfis responsible for making the product commercially available and to package itin the way that the system should be released.
In Figure 5.2 an overview of development process is provided. At the top of Figure5.2 the requirements packages are created from high priority requirements stored inthe repository. These requirements packages are implemented in projects (for exampleProject A-N) resulting in a new increment of the product. Such a project has a durationof approximately three months (time-boxed). When a project is finished developing theincrement, the increment is integrated with the latest version of the system, referred toas last system version (LSV). The LSV has a pre-defined cycle (for example, projectshave to drop their components within a specific time frame to the LSV). At the bottomof the Figure, the different releases of the system are shown. These are either potentialreleases or customer releases.
145
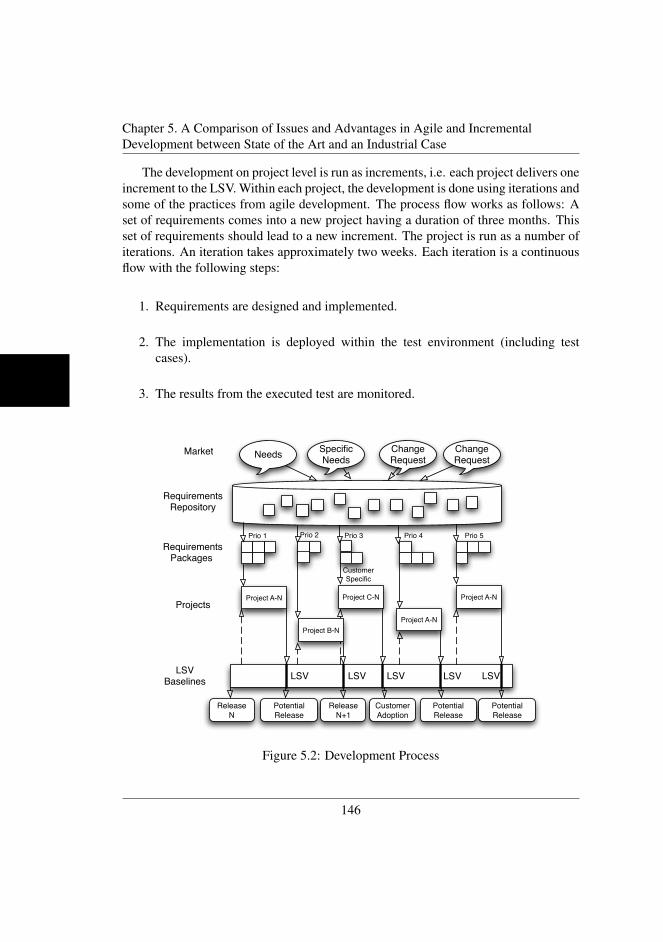
Chapter 5. A Comparison of Issues and Advantages in Agile and IncrementalDevelopment between State of the Art and an Industrial Case
The development on project level is run as increments, i.e. each project delivers oneincrement to the LSV. Within each project, the development is done using iterations andsome of the practices from agile development. The process flow works as follows: Aset of requirements comes into a new project having a duration of three months. Thisset of requirements should lead to a new increment. The project is run as a number ofiterations. An iteration takes approximately two weeks. Each iteration is a continuousflow with the following steps:
1. Requirements are designed and implemented.
2. The implementation is deployed within the test environment (including testcases).
3. The results from the executed test are monitored.
Requirements Repository
RequirementsPackages
Needs SpecificNeeds
ChangeRequest
ChangeRequest
Market
Prio 1 Prio 2 Prio 3 Prio 4 Prio 5
Customer Specific
Project A-N
Project B-N
Project C-N
Project A-N
Project A-N
LSVBaselines LSV LSV LSV LSV LSV
ReleaseN
PotentialRelease
ReleaseN+1
CustomerAdoption
PotentialRelease
PotentialRelease
Projects
Figure 5.2: Development Process
146
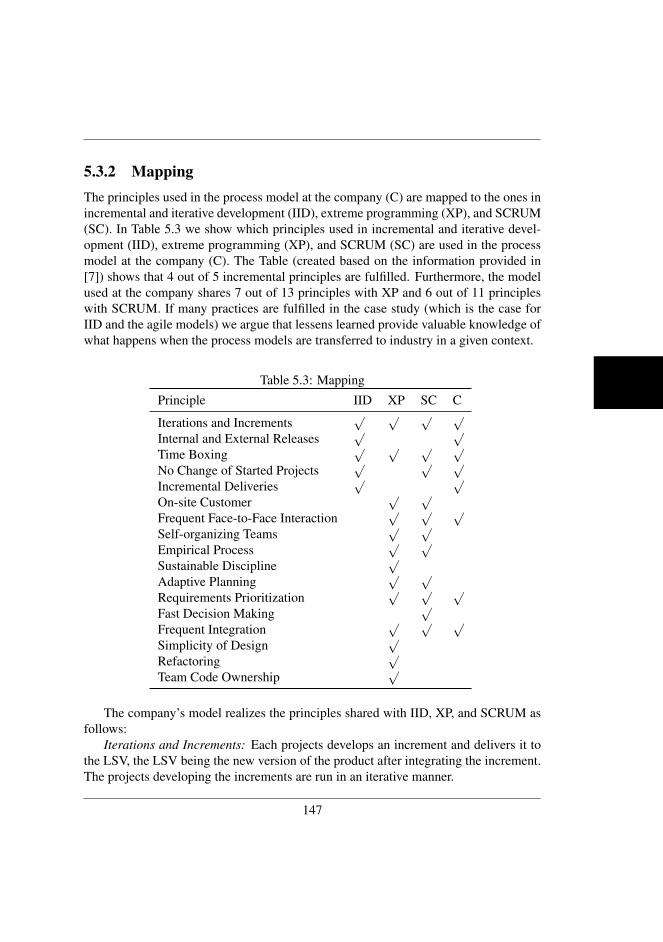
5.3.2 MappingThe principles used in the process model at the company (C) are mapped to the ones inincremental and iterative development (IID), extreme programming (XP), and SCRUM(SC). In Table 5.3 we show which principles used in incremental and iterative devel-opment (IID), extreme programming (XP), and SCRUM (SC) are used in the processmodel at the company (C). The Table (created based on the information provided in[7]) shows that 4 out of 5 incremental principles are fulfilled. Furthermore, the modelused at the company shares 7 out of 13 principles with XP and 6 out of 11 principleswith SCRUM. If many practices are fulfilled in the case study (which is the case forIID and the agile models) we argue that lessens learned provide valuable knowledge ofwhat happens when the process models are transferred to industry in a given context.
Table 5.3: Mapping
Principle IID XP SC C
Iterations and Increments√ √ √ √
Internal and External Releases√ √
Time Boxing√ √ √ √
No Change of Started Projects√ √ √
Incremental Deliveries√ √
On-site Customer√ √
Frequent Face-to-Face Interaction√ √ √
Self-organizing Teams√ √
Empirical Process√ √
Sustainable Discipline√
Adaptive Planning√ √
Requirements Prioritization√ √ √
Fast Decision Making√
Frequent Integration√ √ √
Simplicity of Design√
Refactoring√
Team Code Ownership√
The company’s model realizes the principles shared with IID, XP, and SCRUM asfollows:
Iterations and Increments: Each projects develops an increment and delivers it tothe LSV, the LSV being the new version of the product after integrating the increment.The projects developing the increments are run in an iterative manner.
147
Chapter 5. A Comparison of Issues and Advantages in Agile and IncrementalDevelopment between State of the Art and an Industrial Case
Internal and External Releases: Software products delivered and tested in the LSVcan be potentially delivered to the market. Instead of delivering to the market they canbe used as an input to the next internally or externally used increment.
Time Boxing: Time boxing means that projects have a pre-defined duration witha fixed deadline. In the company model the time box is set to approximately threemonth. Furthermore, the LSV cycles determine when a project has to finish and dropits components to the LSV.
No Change to Started Projects: If a feature is selected and the implementationrealizing the feature has been started then it is finished.
Frequent Face-to-Face Interaction: Projects are realized in small teams sitting to-gether. Each team consists of people fulfilling different roles. Furthermore, frequentteam meetings are conducted in the form of stand-up meetings as used in SCRUM.
Requirements Prioritization: A prioritized requirements list where the highest pri-oritized requirements are taken from the top and implemented first is one of the coreprinciples of the company’s model.
Frequent Integration: Within each LSV cycle the results from different projectsare integrated and tested. As the cycles have fixed time frames frequent integration isassured.
Overall it is visible that the model shares nearly all principles with IID and realizesa majority of XP and SCRUM principles. However, we would like to point out thatwhen comparing the results with models investigated in empirical research it is notalways made explicit to what degree different practices are fulfilled in those studies. Inother words, it is unknown to what extent a so-called XP-study actually implements allXP practices. This issue and its implications are further discussed in Section 5.6.
5.4 Research MethodThe research method used is case study. The design of the study follows the guidelinesprovided for case study research in [20].
5.4.1 Case Study ContextAs a complement to the process model description, the context of the study is as fol-lows. Ericsson AB is a leading and global company offering solutions in the areaof telecommunication and multimedia. Such solutions include charging systems formobile phones, multimedia solutions and network solutions. The company is ISO9001:2000 certified. The market in which the company operates can be characterizedas highly dynamic with high innovation in products and solutions. The development
148
model is market-driven, meaning that the requirements are collected from a large baseof potential end-customers without knowing exactly who the customer will be. Further-more, the market demands highly customized solutions, specifically due to differencesin services between countries.
5.4.2 Research Questions and PropositionsThis study aims at answering the following research questions:
• RQ1: What are the advantages and issues in industrial large-scale software de-velopment informed by agile and incremental practices? So far, very little isknown about advantages and issues of using agile and incremental practices inlarge-scale industrial software development. Thus, the answer to this researchquestion makes an important step toward filling this research gap.
• RQ2: What are the differences and similarities between state of the art and thecase study results? By answering this research question new insights in compar-ison to what has been studied before become explicit. Furthermore, contradic-tions and confirmations of previous results are made explicit and facilitate thegeneralizability of results.
Furthermore, propositions are stated which are similar to hypotheses, stating whatthe expected outcome of a study is. Propositions also help in identifying proper casesand units of analysis. The proposition is stated for the outcome of RQ2: As the casediffers from those presented in state of the art new issues and benefits are discoveredthat have not been empirically identified before.
5.4.3 Case Selection and Units of AnalysisThree subsystems that are part of a large-scale product are studied at the company. Thelarge-scale product is the case being studied while the three subsystems are distinctunits of analysis embedded in the case. Table 5.4 summarizes some characteristics ofthe case and units of analysis. The LOC measure only includes code produced at thecompany (excluding third-party libraries). Furthermore, the approximate number ofpersons involved in each subsystem are stated. A comparison between the case andthe Apache web server shows that the case and its units of analysis can be consideredlarge-scale, the overall system being 20 times larger than Apache.
5.4.4 Data Collection ProceduresThe data is collected through interviews and from process documentation.
149
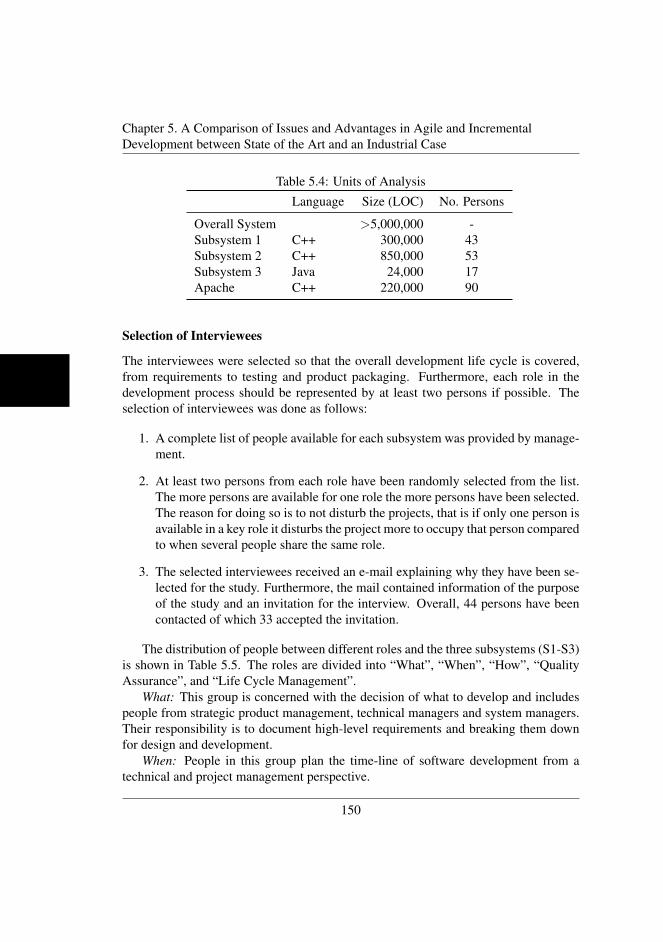
Chapter 5. A Comparison of Issues and Advantages in Agile and IncrementalDevelopment between State of the Art and an Industrial Case
Table 5.4: Units of Analysis
Language Size (LOC) No. Persons
Overall System >5,000,000 -Subsystem 1 C++ 300,000 43Subsystem 2 C++ 850,000 53Subsystem 3 Java 24,000 17Apache C++ 220,000 90
Selection of Interviewees
The interviewees were selected so that the overall development life cycle is covered,from requirements to testing and product packaging. Furthermore, each role in thedevelopment process should be represented by at least two persons if possible. Theselection of interviewees was done as follows:
1. A complete list of people available for each subsystem was provided by manage-ment.
2. At least two persons from each role have been randomly selected from the list.The more persons are available for one role the more persons have been selected.The reason for doing so is to not disturb the projects, that is if only one person isavailable in a key role it disturbs the project more to occupy that person comparedto when several people share the same role.
3. The selected interviewees received an e-mail explaining why they have been se-lected for the study. Furthermore, the mail contained information of the purposeof the study and an invitation for the interview. Overall, 44 persons have beencontacted of which 33 accepted the invitation.
The distribution of people between different roles and the three subsystems (S1-S3)is shown in Table 5.5. The roles are divided into “What”, “When”, “How”, “QualityAssurance”, and “Life Cycle Management”.
What: This group is concerned with the decision of what to develop and includespeople from strategic product management, technical managers and system managers.Their responsibility is to document high-level requirements and breaking them downfor design and development.
When: People in this group plan the time-line of software development from atechnical and project management perspective.
150
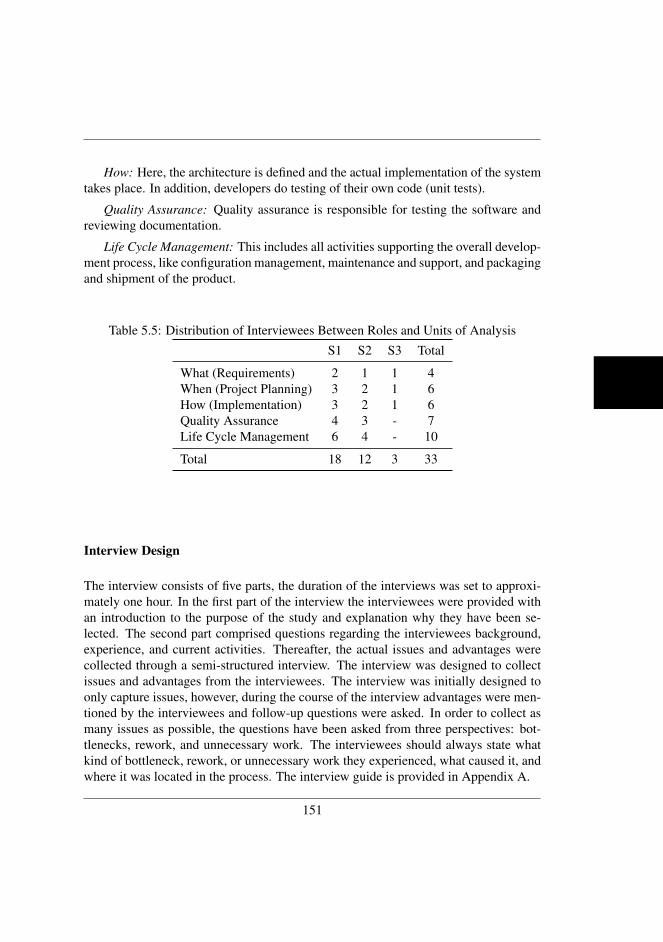
How: Here, the architecture is defined and the actual implementation of the systemtakes place. In addition, developers do testing of their own code (unit tests).
Quality Assurance: Quality assurance is responsible for testing the software andreviewing documentation.
Life Cycle Management: This includes all activities supporting the overall develop-ment process, like configuration management, maintenance and support, and packagingand shipment of the product.
Table 5.5: Distribution of Interviewees Between Roles and Units of Analysis
S1 S2 S3 Total
What (Requirements) 2 1 1 4When (Project Planning) 3 2 1 6How (Implementation) 3 2 1 6Quality Assurance 4 3 - 7Life Cycle Management 6 4 - 10
Total 18 12 3 33
Interview Design
The interview consists of five parts, the duration of the interviews was set to approxi-mately one hour. In the first part of the interview the interviewees were provided withan introduction to the purpose of the study and explanation why they have been se-lected. The second part comprised questions regarding the interviewees background,experience, and current activities. Thereafter, the actual issues and advantages werecollected through a semi-structured interview. The interview was designed to collectissues and advantages from the interviewees. The interview was initially designed toonly capture issues, however, during the course of the interview advantages were men-tioned by the interviewees and follow-up questions were asked. In order to collect asmany issues as possible, the questions have been asked from three perspectives: bot-tlenecks, rework, and unnecessary work. The interviewees should always state whatkind of bottleneck, rework, or unnecessary work they experienced, what caused it, andwhere it was located in the process. The interview guide is provided in Appendix A.
151
Chapter 5. A Comparison of Issues and Advantages in Agile and IncrementalDevelopment between State of the Art and an Industrial Case
Process Documentation
The company provides process documentation to their employees, as well as presen-tations on the process for training purposes. We study this documentation to facilitatea good understanding of the process in the organization. Furthermore, presentationsgiven at meetings are investigated, which show the progress and first results of intro-ducing agile and incremental practices from a management perspective. However, themain source of information is the interviews, with the process documentation mainlyused to get a better understanding of the process and to triangulate what has been saidin the interviews. The documentation and talking to people in the organization resultedin the description of the process model in Section 5.3.
5.4.5 Data Analysis ApproachAs mentioned earlier, the conclusions of the case study are based on the mapping ofthe company’s model to general process models, the state of the art, and the case studyinvestigating issues and advantages.
State of the Art: In order to identify from literature which issues and advantagesexist, the systematic review on agile methods [4] is used as an input. As a startingpoint the advantages and disadvantages have been extracted from the review (SotA). Toidentify more advantages and issues, the results and discussion sections of the identifiedpapers in the review have been read, focusing on qualitative results as those are bestcomparable to the outcome of this study.
Process Mapping: The mapping was done based in the information gathered in theinterviews, documentation of the development process, and validation with a processexpert at the company. The process expert is a driver for agile implementation at thecompany and has profound knowledge of general agile models as well as the company’smodel.
Advantages/issues Mapping: The derivation of advantages and issues is done in asimilar way and advantages/issues is here referred to as factors. As part of the casestudy analysis, the first author of the chapter transcribed more than 30 hours of audiorecordings from the interviews which are used for the data analysis. The data wasanalyzed in a four-step process, the first four steps being conducted by the first authorover a three-month period.
1. Clustering: The raw data from the transcriptions is clustered, grouping state-ments belonging together. For example, statements related to requirements en-gineering are grouped together. Thereafter, statements addressing similar areasare grouped. To provide an example, three statements related to requirementsprioritization are shown in the text-box below.
152
Statement 1: The prioritization is very very hard. I do not envy the SPMsbut that is the single most critical thing to get the incremental and agileprocess working.Statement 2: The priority change and to inform the project that this haschanged has been difficult. To solve this we have invited the release pro-gram manager who is responsible for the project to sit in and the maintechnical coordinator so they are part of the decision to change it. Prior tothat we did not have it and we had more difficult, we just did that a coupleof weeks ago, this improved the situation but still we have difficulties tohave a formalized way of doing these because changes happen.Statement 3: Theoretically, the priority list is nice. The problem is thatthere is a lot of changes in the situation where we are now, there are a lotof changes in the priority list here which means that we have been wastingsome work done here, a little bit more than some.
2. Derivation of Factors: The raw data contains detailed explanations and thereforeis abstracted by deriving factors from the raw data. Each factor is shortly ex-plained in one or two sentences. The result was a high number of factors, wherefactors varied in their abstraction level and could be further clustered. Based onthe original statements regarding the requirements prioritization the followingfactors (in this case issues) have been derived:
Prioritization Issue 1: The prioritization is success critical in incrementaland agile development and at the same time hard to create and maintain(based on statement 1).Prioritization Issue 2: Informing the project that the priorities of require-ments change has been difficult and requires a more formal process (basedon statement 2).Prioritization Issue 3: The priority list changes due to that there is a lot ofchanges in the situation (adoption) leading to rework (based on statement3).
3. Mapping of Factors: The factors were grouped based on their relation to eachother and their abstraction level in a mind map. Factors with higher abstractionlevel are closer to the center of the mind map than factors with lower abstractionlevel. In the example, the issues related to requirements prioritization are in onebranch (see Figure 5.3). This branch resulted in issue CI02 in Table 5.7.
4. Validation of Factors: In studies of qualitative nature there is always a risk thatthe data is biased by the interpretation of the researcher. Thus, the factors have
153
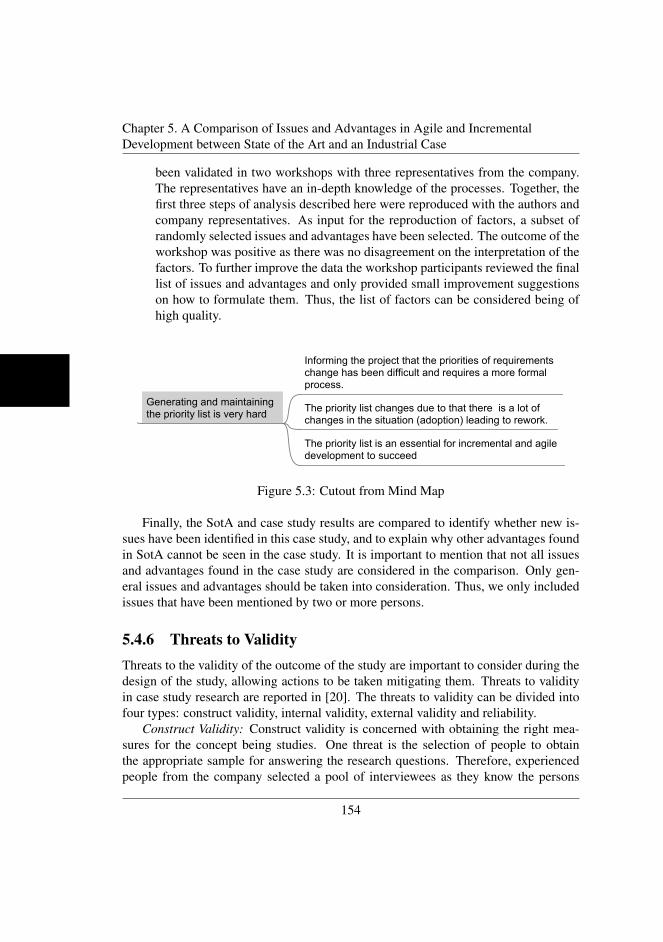
Chapter 5. A Comparison of Issues and Advantages in Agile and IncrementalDevelopment between State of the Art and an Industrial Case
been validated in two workshops with three representatives from the company.The representatives have an in-depth knowledge of the processes. Together, thefirst three steps of analysis described here were reproduced with the authors andcompany representatives. As input for the reproduction of factors, a subset ofrandomly selected issues and advantages have been selected. The outcome of theworkshop was positive as there was no disagreement on the interpretation of thefactors. To further improve the data the workshop participants reviewed the finallist of issues and advantages and only provided small improvement suggestionson how to formulate them. Thus, the list of factors can be considered being ofhigh quality.
Figure 5.3: Cutout from Mind Map
Finally, the SotA and case study results are compared to identify whether new is-sues have been identified in this case study, and to explain why other advantages foundin SotA cannot be seen in the case study. It is important to mention that not all issuesand advantages found in the case study are considered in the comparison. Only gen-eral issues and advantages should be taken into consideration. Thus, we only includedissues that have been mentioned by two or more persons.
5.4.6 Threats to ValidityThreats to the validity of the outcome of the study are important to consider during thedesign of the study, allowing actions to be taken mitigating them. Threats to validityin case study research are reported in [20]. The threats to validity can be divided intofour types: construct validity, internal validity, external validity and reliability.
Construct Validity: Construct validity is concerned with obtaining the right mea-sures for the concept being studies. One threat is the selection of people to obtainthe appropriate sample for answering the research questions. Therefore, experiencedpeople from the company selected a pool of interviewees as they know the persons
154
and organization best. From this pool the random sample was taken. The selectionby the representatives of the company was done having the following aspects in mind:process knowledge, roles, distribution across subsystem components, and having a suf-ficient number of people involved (although balancing against costs). Furthermore, itis a threat that the presence of the researcher influences the outcome of the study. Thethreat is reduced as there has been a long cooperation between the company and uni-versity and the author collecting the data is also employed by the company and notviewed as being external. Construct validity is also threatened if interview questionsare misunderstood or misinterpreted. To mitigate the threat pre-tests of the interviewhave been conducted.
Internal Validity: Internal validity is primarily for explanatory and causal studies,where the objective is to establish a causal relationship. As this study is of exploratorynature internal validity is not considered.
External Validity: External validity is the ability to generalize the findings to a spe-cific context. It is impossible to collect data for a general process, i.e. exactly as it isdescribed in literature. The process studied is an adoption of practices from differentgeneral process models (see Section 5.3). Care has been taken to draw conclusionsand map results to these general models to draw general conclusions and not solelydiscussing issues that are present due to the specific instantiation of the process at thestudied setting. However, if one maps the general findings in this chapter to other de-velopment processes their context must be taken into account. Furthermore, a potentialthreat is that the actual case study is conducted within one company. To minimize theinfluence of the study being conducted at one company, the objective is to map thefindings from the company specific processes and issues to general processes. Thecharacteristics of the context and practices used in the process are made explicit to easethe mapping (see Table 5.3).
Reliability: This threat is concerned with repetition or replication, and in particularthat the same result would be found if re-doing the study in the same setting. Thereis always a risk that the outcome of the study is affected by the interpretation of theresearcher. To mitigate this threat, the study has been designed so that data is collectedfrom different sources, i.e. to conduct triangulation to ensure the correctness of thefindings. The interviews have been recorded and the correct interpretation of the datahas been validated through workshops with representatives of the company.
5.5 ResultsFirst, the advantages identified in the case study are compared with SotA, and the sameis done for the issues.
155
Chapter 5. A Comparison of Issues and Advantages in Agile and IncrementalDevelopment between State of the Art and an Industrial Case
5.5.1 Advantages
Table 5.6 shows the advantages identified in the case study, furthermore the ID of theadvantages of SotA clearly related to the ones in the case study are stated in columnSotA (ID). It is shown that six out of eight advantages can be clearly linked to thoseidentified in literature.
Transparency and Control: Better control and transparency is achieved by hav-ing small and manageable tasks (A04). The case study led to the same result. Theprioritized list of requirements consists of requirements packages that have to be im-plemented and the requirements packages have a small scope (for example comparedto waterfall models where the complete scope is defined upfront). Due to clear separa-tion of packages which are delivered as an increment, responsibilities for an incrementcan be clearly defined increasing transparency (CA03). In particular problems and suc-cesses are more transparent. That is, if an increment is dropped to the LSV for test onecan trace which increments are of high or low quality and who is responsible for them.Consequently, this creates incentives for teams to deliver high quality as their workresult is visibly linked to them (CA08).
Learning, Understanding, and other Benefits of Face-to-Face Communication: Inagile development team members communicate intensively face-to-face as they havefrequent meetings and are physically located together (A07). Thus, learning and un-derstanding from each other is intensified. In the case study, the interviewees provideda concrete example for this. Before using agile, testers and designers were separated.Consequently designers were not able to put themselves in the shoes of the testers veri-fying their software or understand what information or documentation would help test-ing. Now designers and testers sit together and thus they can learn from each other. Thedesigners understand how the quality of the implementation impacts the testers. Fur-thermore, testers can point designers to parts of the system that from their perspectiveare critical and thus require more intensive testing (CA04). The direct communicationalso enables instant testing due to short lines of communication (CA07). An addi-tional benefit is the increased informal communication where important information iscontinuously shared, ultimately resulting in less rework and higher quality (CA06).
Frequent Feedback for each Iteration: Knowledge is transfered through frequentfeedback whenever completing and delivering an iteration (A01). In the case study asimilar result was obtained. Whenever increments are dropped to the LSV there is aclear visibility of who delivered what and with what level of quality. The frequencyof integration is enforced by pre-defined LSV cycles that require integration every fewweeks. This of course also facilitates frequent feedback (CA04).
Further advantages that have not been explicitly identified in literature surfacedduring the case study.
156
Low Requirements Volatility: Small requirements packages are prioritized and cango quickly into the development due to their limited scope. When implemented they aredropped to the LSV and can potentially be released to the market. As the market in thiscase is highly dynamic this is an important advantage. That is, if hot requirements canbe implemented quickly and thus can be released before the customers’ needs change(CA01).
Work Started is always Completed: Packages that have started implementation arealways completed. Therefore, there is very little waste in development as work doneis not discarded, but ends up as a running part of the software. However, it shouldbe emphasized that it is essential to implement the right things, making requirementsprioritization an essential issue for this advantage to pay off (CA02).
Table 5.6: Advantages Identified in Case StudyID Advantages SotA (ID)
CA01 Small projects allow to implement and release requirementspackages fast which leads to reduction of requirements volatilityin projects.
CA02 The waste of not used work (requirements documented, compo-nents implemented etc.) is reduced as small packages started arealways implemented.
CA03 Requirements in requirements packages are precise and due tothe small scope estimates for the package are accurate.
A04
CA04 Small teams with people having different roles only requiresmall amounts of documentation as it is replaced with directcommunication facilitating learning and understanding for eachother.
A07
CA05 Frequent integration and deliveries to subsystem test (LSV) al-lows design to receive early and frequent feedback on their work.
A01
CA06 Rework caused by faults is reduced as testing priorities are mademore clear due to prioritized features, and that testers as well asdesigners work closely together.
A07
CA07 Time of testers is used more efficiently as in small teams as test-ing and design can be easily parallelized due to short ways ofcommunication between designers and testers (instant testing).
A07
CA08 Testing in the LSV makes problems and successes transparent(testing and integration per package) and thus generates high in-centives for designers to deliver high quality.
A04
157
Chapter 5. A Comparison of Issues and Advantages in Agile and IncrementalDevelopment between State of the Art and an Industrial Case
5.5.2 Issues
The issues identified in this case study as well as the references to similar issues ofSotA are shown in Table 5.7. The following issues are shared between SotA and thefindings of this study.
Testing Lead Times and Maintenance: The realization of continuous testing witha variety of platforms and test environments is challenging and requires much effort(I01). This SotA issue relates to two issues identified in this case study. First, testinglead times are extended as packages that should be delivered to the LSV might not bedropped due quality issues or that the project is late. If this happens shortly before anLSV cycle ends and the next increment is built, the package has to wait for the wholenext cycle to be integrated (CI07). Secondly, if increments are released more frequentlymaintenance effort increases. That is, customers report faults for many different ver-sions of the software making it harder to reproduce the fault on the right softwareversion as well as in the right testing environment including released hardware (CI07).
Management Overhead and Coordination: Agile methods do not scale well (I03).In fact, we found that it is challenging to make agile methods scalable. On the one hand,small projects can be better controlled and results are better traceable (as discussed forCA08). On the other hand, many small projects working toward the same goal requiremuch coordination and management effort. This includes planning of the technicalstructure and matching it against a time-line for project planning (CI11).
Little Focus on Architecture: The architecture receives little focus in agile devel-opment leading to bad design decisions (I02). The company’s development model re-quires a high level architecture plan (anatomy plan) enabling them to plan the time-lineof the projects. However, dependencies between parts of the system rooted in technicaldetails are not covered in the plan. As one project implementing a specific package hasno control over other packages the discovery of those dependencies early has not beenpossible (CI12).
Further issues that have not been explicitly identified in literature surfaced duringthe case study.
Requirements Prioritization and Handover: In the development of large scale prod-ucts the strategy of the product and the release plans have to be carefully planned andinvolve a high number of people. Due to the complexity and the number of peoplethat have to be involved in each decision the continuity of the requirements flow isthwarted (CI01). Consequently teams have to wait for requirements and a backlogis created in development (CI03). The decision is further complicated by prioritiza-tion, prioritization being perceived as an essential success factor by the interviewees,which also plays an important role in other agile methods. For example, SCRUM uses
158
a product backlog which is an ordered list of features, the feature of highest priorityalways being at the top of the list. Getting the priority list right is challenging as therequirements list in itself has to be agile reflecting changing customer needs (dynamicre-prioritization)(C2).
Test Coverage Reduction of Basic Test: Teams have to conduct unit testing andtest their overall package before delivering to the LSV. However, the concept of smallprojects and the lack of independent verification make it necessary that the LSV com-pensates the missing test coverage. The perception of interviewees was that it is hardto squeeze the scope into three month projects. One further factor is the get-together ofdesigners and testers resulting in dependent verification and validation. For example,designers can influence testers to only focus on parts of the system, saying that otherparts do not have to be tested because they did not touch them.
Increased Configuration Management Effort: Configuration management has tocoordinate a high number of internal releases. Each LSV is a baseline that could bepotentially released to the market. Thus, the number of baselines in agile developmentis very high.
Issues CI05, CI09, and CI10 are more related to the context than the other issuesdescribed earlier, even though from the company’s perspective they play an importantrole and thus have been mentioned by several people. Because of the limited general-izability of those issues to other models they are only discussed briefly.
Due to the previous way of working at the company a high amount of documen-tation remained (CI05). The ambition is to reduce the number of documents as manydocuments are unnecessary because they are quickly outdated while other documentscan be replaced by direct communication (CA04). However, this issue could be gener-alized to other companies in transition to a more agile way of working. Issues (CI09)and (CI08) are related to product packaging which mainly focuses on programming theconfiguration environment of the system. The environment allows to select features forspecific customers to tailor the products to their specific needs (product customization).The findings are that this requires long lead times (CI09) and that product packaginggets information too late, even though they could start earlier (CI10).
5.6 Discussion
This section discusses the comparison of state of the art and the case study results. Wedescribe the observations made based on the results, and the implications for practiceand research. This includes suggestions for future work.
159

Chapter 5. A Comparison of Issues and Advantages in Agile and IncrementalDevelopment between State of the Art and an Industrial Case
Table 5.7: Issues Identified in Case StudyID Issue SotA (ID)
CI01 Handover from requirements to design takes time due to com-plex decision processes.
CI02 The priority list is essential in the company’s model to work andis hard to create and maintain.
CI03 Design has free capacity due to the long lead times as in require-ments engineering complex decision making (e.g, due to CI02)takes long time.
CI04 Test coverage reduction within projects due to lack of indepen-dent testing and shortage of projects, requiring LSV to compen-sate coverage.
CI05 The company’s process requires to produce too much testingdocumentation.
CI06 LSV cycle times may extend lead-time for package deliveries asif a package is not ready or rejected by testing it has to wait forthe next cycle.
I01
CI07 Making use of the ability of releasing many releases to the mar-ket increases maintenance effort as many different versions haveto be supported and test environments for different versions haveto be recreated.
I01
CI08 Configuration management requires high effort to coordinate thehigh number of internal releases.
CI09 The development of the configuration environment to select fea-tures for customizing solutions takes a long time due to late startof product packaging work and use of sequential programminglibraries.
CI10 Product packaging effort is increased as it is still viewed from atechnical point of view, but not from a commercial point of view.
CI11 Management overhead due to a high number of teams requiringmuch coordination and communication between.
I03
CI12 Dependencies rooted in implementation details are hard to iden-tify and not covered in the anatomy plan.
I02
5.6.1 Practices Lead to Advantages and Issues
Observation: Using certain practices bring benefit and at the same time raise differentissues. In related work this was visible for outcomes related to pair programming.
160
On one hand it facilitates learning, but on the other hand it is also exhaustive andleads to problems if the programmers are on different levels. Similar results have beenidentified in this case study as well:
• Small projects increase control over the project, increase transparency, and ef-fort can be estimated in a better way (CA08). At the same time the small projectshave to be coordinated which raises new challenges from a management perspec-tive with large scale in terms of size of product and people involved (CI11).
• Frequent integration and deliveries to the LSV in given cycles provide regularfeedback to the developers creating packages (A01). Though related issues arethat if a package is rejected it has to wait for the whole new LSV cycle (CI06)and configuration management has increased work effort related to baselining(CI08).
• Direct communication facilitates learning and understanding for each other (CA04).However, the close relation between testers and designers affects independenttesting negatively (CI04).
Implications for Practice: For practice this result implies that companies have tochoose practices carefully, not only focusing on the advantages that come with the tech-niques. At the same time it is important to be aware of drawbacks using incrementaland agile practices which seem to be overlooked all too often.
Implications for Research and Future Work: Research has to support practice inraising the awareness of problems related to incremental and agile development. Noneof the studies in the systematic review by Dyba et al. [4] had the identification ofissues and problems as the main study focus. To address this research gap we proposeto conduct further qualitative studies focusing on issues which often seem to cometogether with the advantages. It is also important to find solutions solving the issuesin order to exploit the benefits that come with agile to an even greater degree. Thisrequires new methods to fully utilize the benefits of agile, to name a few general areasthat should be focused on:
• Agile requirements prioritization techniques to support and deal with frequentchanges in priority lists which have been identified as success critical (see CI02).
• Research on tailoring of configuration management for agile due to high numberof baselines and changes that need to be maintained (see CI08).
• Research on decision making processes and decision support in agile processes(see CI01).
161
Chapter 5. A Comparison of Issues and Advantages in Agile and IncrementalDevelopment between State of the Art and an Industrial Case
5.6.2 Similarities and Differences between SotA and Industrial CaseStudy
Observation: The initial proposition was that there is a difference in issues betweenwhat is said in SotA and the findings of the case study. The opposite is true for theadvantages, we found that there is quite a high overlap between advantages identifiedin SotA and this case study. Six out of eight advantages have also been identifiedin SotA as discussed in Section 5.5. This is an indication that agile leads to similarbenefits in large scale development and small scale development. On the other hand,the overlap regarding the issues is smaller. Many issues identified in SotA are not foundin this case study, mainly because a few of them are related to pair programming whichis not a principle that is applied yet at the company. On the other hand, only a fewissues (three out of twelve) identified in this case study have been empirically shown inother studies. Several explanations are possible for this result. Firstly, the studies didnot have issue identification as a main focus. Another explanation is that even thoughagile leads to benefits in large-scale development it is also harder to implement due toincreased complexity in terms of product size, people and number of projects (reflectedin issues like CI01, CI02, CI03, CI08, CI11), which of course results in more issuesraised.
Implications for Practice: Many of the new problems found in the case study occurdue to complexity in decision making, coordination, and communication. We believethat when studying a company developing small products then the same benefits wouldbe found, but the number of issues identified would be much lower. Thus, companies inlarge-scale development which intend to adopt incremental and agile methods need tobe aware of methods supporting in handling the complexity. For example, Cataldo et al.[2] propose a method that helps coordinate work based on the automatic identificationof technical dependencies, i.e. this makes more clear which teams have to communicatewith each other.
Implications for Research: This observation leads to the same conclusion as theprevious one (practices lead to advantages and issues): further knowledge is neededabout what are the main issues in large scale agile development and how they can beaddressed to get the most out of the benefits.
5.6.3 A Research Framework for Empirical Studies on Agile De-velopment
The need for a research framework is an important implication for research. That is, inorder to learn more about issues and make different studies comparable we believe thatthere is a great need for a framework of empirical studies on agile development. For
162
example, when agile is studied it is often not clear how a certain model is implementedand to what degree the practices are fulfilled. Instead, it is simply said that XP orSCRUM is studied. However, from our experience in industry we know that methodspresented in books are often tailored to specific needs and that practices are enrichedor left out as they do not fit into the context of the company. This makes it hardto determine which practices or combinations of practices in a given context lead toadvantages or issues. Such a framework could include information about:
• Attributes that should be provided in order to describe the context. For example,studies do not report the domain they are investigating or how many people areinvolved in the development of the system (see for example Table 5.2). Further-more, product complexity should be described and it needs to be clear whether ateam or product has been studied.
• Practices should be made explicit and it should be explained how and to whatdegree they are implemented allowing the reader to generalize the outcome ofthe studies. For example, the framework should describe when a practice isconsidered as fully, partly, or not at all fulfilled.
5.7 Conclusions and Future WorkThis chapter compares the state of the art investigating issues and advantages whenusing agile and incremental development models with an industrial case study whereagile as well as incremental practices are applied. The articles considered in the state ofthe art are based on empirical studies. The case being studied can be characterized aslarge-scale in terms of product size and number of persons involved in the developmentprocess. Regarding the research questions and contributions we can conclude:
Issues and Advantages: We found that implementing agile and incremental prac-tices in large-scale software development leads to benefits in one part of the process,while raising issues in another part of the process. For example, using small and coher-ent teams increases control over the project, but leads to new issues on the managementlevel where the coordination of the projects has to take place. Further examples for thishave been identified in the study.
Comparison of State of the Art and Case Study - Advantages: Previous empiricalstudies and the case study results have a high overlap for the advantages. In sum-mary, the main advantages agreed on by literature this case study are 1) requirementsare more precise due to reduced scope and thus easier to estimate, 2) direct commu-nication in teams reduces need for documentation, 3) early feedback due to frequentdeliveries, 4) rework reduction, 5) testing resources are used more efficiently, and 6)
163
REFERENCES
higher transparency of who is responsible for what creates incentives to deliver higherquality. New advantages identified in this case study are 1) low requirements volatil-ity in projects, and 2) reduction of waste (discarded requirements) in the requirementsengineering process.
Comparison of State of the Art and Case Study - Issues: Only few issues identi-fied in the case study are mentioned in literature. Issues agreed on are 1) challengesin regard to realize continuous testing, 2) increased maintenance effort with increaseof the number of releases, 3) management overhead due to the need of coordinationbetween teams, and 4) detailed dependencies are not discovered on detailed level dueto lack of focus on design. In total eight new issues have been identified in this casestudy, five are of general nature while three are strongly related to the study context.The general issues are 1) Long requirements engineering duration due to complex de-cision processes in requirements engineering, 2) requirements priority lists are hardto create and maintain, 3) Waiting times in the process, specifically in design waitingfor requirements, 4) reduction of test coverage due to shortage of projects and lack ofindependent testing, 5) increased configuration management effort. The three contextrelated issues are 6) high amount of testing documentation, 7) long durations for devel-oping the configuration environment realizing product customizations, and 8) increasein product-packaging effort.
The proposition of the study is partly true, i.e. the study did not identify many newadvantages that have not been found in previous empirical studies. However, the studyidentified new issues that have not been reported in empirical studies before. Thoseissues are mainly related to increased complexity when scaling agile.
Furthermore, we identified the need for an empirical research framework for agilemethods which should help to make studies comparable. In future work more qualita-tive studies with an explicit focus on issue identification have to be conducted.
5.8 References[1] Bouchaib Bahli and El-Sayed Abou-Zeid. The role of knowledge creation in
adopting XP programming model: an empirical study. In ITI 3rd InternationalConference on Information and Communications Technology: Enabling Tech-nologies for the New Knowledge Society, 2005.
[2] Marcelo Cataldo and Patrick Wagstrom and James D. Herbsleb and Kathleen M.Carley. Identification of coordination requirements: implications for the designof collaboration and awareness tools. In Proc. of the Conference on ComputerSupported Cooperative Work (CSCW 2006), pages 353–362, 2006.
164
[3] David Cohen, Mikael Lindvall, and atricia Costa. Advances in Computers, Ad-vances in Software Engineering, chapter An Introduction to Agile Methods. El-sevier, Amsterdam, 2004.
[4] Tore Dyba and Torgeir Dingsøyr. Empirical studies of agile software develop-ment: a systematic review. Information & Software Technology, 50(9-10):833–859, 2008.
[5] Sylvia Ilieva, Penko Ivanov, and Eliza Stefanova. Analyses of an agile methodol-ogy implementation. In Proc. of the 30th EUROMICRO Conference (EUROMI-CRO 2004), pages 326–333, 2004.
[6] Daniel Karlstrom and Per Runeson. Combining agile methods with stage-gateproject management. IEEE Software, 22(3):43–49, 2005.
[7] Craig Larman. Agile and iterative development: a manager’s guide. PearsonEducation, 2003.
[8] Adrian MacKenzie and Simon R. Monk. From cards to code: how extreme pro-gramming re-embodies programming as a collective practice. Computer Sup-ported Cooperative Work, 13(1):91–117, 2004.
[9] Chris Mann and Frank Maurer. A case study on the impact of Scrum on overtimeand customer satisfaction. In Proc. of the AGILE Conference (AGILE 2005),pages 70–79, 2005.
[10] Katiuscia Mannaro, Marco Melis, and Michele Marchesi. Empirical analysison the satisfaction of it employees comparing XP practices with other softwaredevelopment methodologies. In Proc. of the 5th International Conference onExtreme Programming and Agile Processes in Software Engineering (XP 2005),pages 166–174, 2004.
[11] Angela Martin, Robert Biddle, and James Noble. The XP customer role in prac-tice: Three studies. In Agile Development Conference, pages 42–54, 2004.
[12] Pete McBreen. Questioning extreme programming. Pearson Education, Boston,MA, USA, 2003.
[13] Grigori Melnik and Frank Maurer. Perceptions of agile practices: a student sur-vey. In Second XP Universe and First Agile Universe Conference on Extreme Pro-gramming and Agile Methods (XP/Agile Universe 2002, pages 241–250, 2002.
165
REFERENCES
[14] H. Merisalo-Rantanen, Tuure Tuunanen, and Matti Rossi. Is extreme program-ming just old wine in new bottles: a comparison of two cases. J. DatabaseManag., 16(4):41–61, 2005.
[15] Minna Pikkarainen, Jukka Haikara, Outi Salo, Pekka Abrahamsson, and Jari Still.The impact of agile practices on communication in software development. Em-pirical Softw. Engg., 13(3):303–337, 2008.
[16] Hugh Robinson and Helen Sharp. The characteristics of XP teams. In Proc. ofthe 5th International Conference on Extreme Programming and Agile Processesin Software Engineering (XP 2004), pages 139–147, 2004.
[17] Matt Stephens and Doug Rosenberg. Extreme programming refactored: the caseagainst XP. Apress, Berkeley, CA, 2003.
[18] Harald Svensson and Martin Host. Introducing an agile process in a softwaremaintenance and evolution organization. In Proc. of the 9th European Confer-ence on Software Maintenance and Reengineering (CSMR 2005), pages 256–264,2005.
[19] Bjørnar Tessem. Experiences in learning XP practices: A qualitative study. InProc. of the 4th International Conference on Extreme Programming and AgileProcesses in Software Engineering (XP 2004), pages 131–137, 2003.
[20] Robert K. Yin. Case study research: design and methods, 3rd Edition, AppliedSocial Research Methods Series, Vol. 5. Prentice Hall, 2002.
166
Chapter 6
An Empirical Study ofLead-Times in Incremental andAgile Software Development
Kai PetersenTo Appear in Proceedings of the International Conference on Soft-ware Process (ICSP 2010)
6.1 Introduction
Lead-time (also referred to as cycle-times) is the time it takes to process an order fromthe request till the delivery [6]. An analysis and improvement of lead-time is highlyrelevant. Not being able to deliver in short lead-times leads to a number of disadvan-tages on the market, identified in the study of Bratthall et al. [4]: (1) The risk of marketlock-out is reduced [12]. Bratthall et al. [4] provided a concrete example for that whereone of the interviewees reported that they had to stall the introduction of a new prod-uct because the competitor was introducing a similar product one week earlier; (2) Anearly enrollment of a new product increase probability of market dominance [14]. Oneof the participants in the study of Bratthall et al. [4] reported that due to introducing aproduct three months after a competitor the company is holding 30 % less of the world
167
Chapter 6. An Empirical Study of Lead-Times in Incremental and Agile SoftwareDevelopment
market in comparison to the market leader; (3) Another benefit of being early on themarket is that the product conforms more to the expectations of the market [13]. Thisis due to the market dynamics. Petersen et al. [10] found that a large portion (26 %)of gathered requirements are already discarded during development. Furthermore, thelong lead-time provides a time-window for change requests and rework.
The review of literature revealed that, to the best of our knowledge, an empiricalanalysis of lead-times in incremental and agile development has not been conductedso far. However, as there is an increasing number of companies employing incremen-tal and agile practices it is important to understand lead-time behavior. The studiedcompany intended to determine target levels for lead-times. The open question at thecompany was whether requirements should have different target levels depending onthe following factors:
1. The distribution of lead-times between different phases.
2. The impact a requirement has on the systems. The impact is measured in terms ofnumber of affected systems. Here we distinguish between single-system require-ments (a requirement only affects one system) and multi-system requirements (arequirement affects at least two systems).
3. The size of the requirements.
This study investigated the effect of the three factors on lead-time. It is importantto stress that existing work indicates what outcomes can be expected for the differentfactors, the expected results being presented in the related work. However, the out-come to be expected was not clear to the practitioners in the studied company. Hence,this study sets out with formulating a set of hypotheses related to the factors withoutassuming a specific outcome of the hypotheses prior to analyzing them.
The research method used was an industrial case study of a company develop-ing large-scale systems in the telecommunication domain. The quantitative data wascollected from a company proprietary system keeping track of the requirements flowthroughout the software development lifecycle.
The remainder of the paper is structured as follows. Section 6.2 presents relatedwork. The research method is explained in Section 6.3. The results of the study areshown in Section 6.4. Section 6.5 discusses the results. Section 6.6 concludes thepaper.
168
6.2 Related Work
Chapter 3 presents lead-times for waterfall development, showing that the majority ofthe time (41 %) is spent on requirements engineering activities. The remaining timewas distributed as follows: 17 % in design and implementation, 19 % on verification,and 23 % on the release project. As in agile software development the main activitisshould be coding and testing [3] the literature would suggest that those are the mosttime consuming activities.
Petersen and Wohlin [8] investigated issues hindering the performance of incre-mental and agile development. When scaling agile the main issues are (1) complexdecision making in the requirements phase; (2) dependencies of complex systems arenot discovered early on; and (3) agile does not scale well as complex architecture re-quires up-front planning (see also Chapter 5). Given this qualitative result the literatureindicates that with increase of requirements impact the lead-time should increase. Forexample, if a requirement can only be deliverable when parts of it are implementedacross several systems a delay in one system would lead to prolonged lead-times forthis requirement.
Harter et al. [7] identified that lines of code (size) is a predictor for cycle time. Thiswas confirmed by [1] who found that size was the only predictor for lead-time. Hence,from the related work point of view an increase of size should lead to an increase oflead-time.
Collier [2] summarizes a number of issues in cycle time reduction and states: (1)size prolongs lead-time, and (2) dependencies influence lead-time.
Carmel [5] investigated key success factors for achieving short lead-times. Thefinding shows that team factors (small team size, cross-functional teams, motivation)are critical. Furthermore, an awareness of lead-times is important to choose actionsspecifically targeted towards lead-time reduction. However, it is important to take qual-ity into consideration when taking actions towards lead-time reduction.
None of the lead-time studies focuses on agile development, and hence raisingthe need for empirical studies on lead-time in an incremental and agile developmentcontext.
6.3 Research Method
The research method used was a quantitative case study, the case being the telecommu-nication company Ericsson AB. The systems studied were developed in Sweden andIndia.
169
Chapter 6. An Empirical Study of Lead-Times in Incremental and Agile SoftwareDevelopment
6.3.1 Research ContextThe research context is important to describe in order to know to what degree the resultsof the study can be generalized [9]. Table 6.1 shows the context elements for thisstudy. The analysis focused on in total 12 systems of which 3 systems are independent.The remaining nine systems belong to a very large communication system and arehighly dependent on each other. Thus, all requirements belonging to the independentsystems are treated as single-system requirements. The same applies to requirementsonly affecting one of the nine dependent systems.
Table 6.1: Context ElementsElement Description
Maturity All systems older than 5 yearsSize Large-scale system with more than 5,000,000 LOCNumber of systems 9 dependent systems (indexed as A to I) and 3 indepen-
dent (indexed as J to K)Domain TelecommunicationMarket Highly dynamic and customized marketProcess On the principle level incremental process with agile
practices in development teamsCertification ISO 9001:2000Practices Continuous integration; Internal and external releases;
Time-boxing with sprints; Face-to-face interaction(stand-up meetings, co-located teams); Requirements pri-oritization with metaphors and Detailed requirements(Digital Product Backlog); Refactoring and system im-provements
The process of the company is shown in Figure 6.1. Requirements from the marketare prioritized and described as high level requirements (HLR) in form of metaphors.These are further detailed by cross-functional work teams (people knowing the mar-ket and people knowing the technology) to detailed requirements specifications (DRS).The anatomy of the system is used to identify the impact of the HLR on the system. Theimpact determines how many systems are affected by the requirement. A requirementaffecting one system is referred to as single-system requirement, while a requirementaffecting multiple system is referred to as a multi-system requirement. Within systemdevelopment agile teams (ATs) implement and unit test the requirements within fourweek sprints. The teams deliver the requirements to the system level test to continu-
170
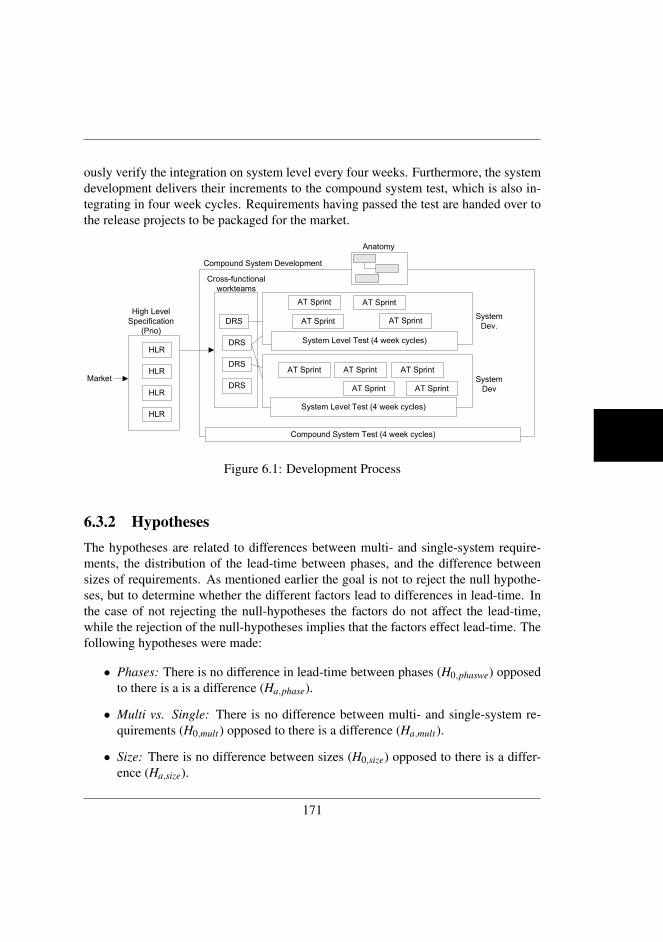
ously verify the integration on system level every four weeks. Furthermore, the systemdevelopment delivers their increments to the compound system test, which is also in-tegrating in four week cycles. Requirements having passed the test are handed over tothe release projects to be packaged for the market.
Compound System Development
Anatomy
High Level
Specification
(Prio)
Compound System Test (4 week cycles)
System
Dev.
HLR
HLR
HLR
HLR
Market
DRS
DRS
DRS
DRSSystem
Dev
System Level Test (4 week cycles)
System Level Test (4 week cycles)
AT Sprint
AT Sprint AT Sprint
AT Sprint
AT Sprint AT Sprint
AT Sprint
AT Sprint
AT Sprint
Cross-functional
workteams
Figure 6.1: Development Process
6.3.2 HypothesesThe hypotheses are related to differences between multi- and single-system require-ments, the distribution of the lead-time between phases, and the difference betweensizes of requirements. As mentioned earlier the goal is not to reject the null hypothe-ses, but to determine whether the different factors lead to differences in lead-time. Inthe case of not rejecting the null-hypotheses the factors do not affect the lead-time,while the rejection of the null-hypotheses implies that the factors effect lead-time. Thefollowing hypotheses were made:
• Phases: There is no difference in lead-time between phases (H0,phaswe) opposedto there is a is a difference (Ha,phase).
• Multi vs. Single: There is no difference between multi- and single-system re-quirements (H0,mult ) opposed to there is a difference (Ha,mult ).
• Size: There is no difference between sizes (H0,size) opposed to there is a differ-ence (Ha,size).
171
Chapter 6. An Empirical Study of Lead-Times in Incremental and Agile SoftwareDevelopment
6.3.3 Data CollectionThe lead-time is determined by keeping track of the duration the high level require-ments reside in different states. When a certain activity related to the high-level re-quirement is executed (e.g. specification of the requirement) then the requirement isput into that state. For the tracking of lead-times a time-stamp was captured whenevera requirement enters a state, and leaves a state.
The lead-time data was collected from an electronic Kanban solution where therequirements can be moved between phases to change their state. The system can beedited over the web, showing the lists of the requirements and in which phase theyare. Whenever a person is moving a requirement from one phase to another, a date isentered for this movement. The requirements go through the following states:
• State Detailed Requirements Specification: The state starts with the decision tohand over requirement to the cross-functional work-team for specification, andends with the hand-over to the development organization.
• State Implementation and Unit Test: The state starts with the hand-over of therequirement to the development organization and ends with the delivery to thesystem test.
• State Node/System Test: The state starts with the hand-over of the requirement tothe system/node test and ends with the successful completion of the compoundsystem test. The time includes maintenance for fixing discovered defects.
• State Ready for Release: The state starts when the requirement has successfullycompleted the compound system test and thus is ready for release to the cus-tomer.
From the duration the requirements stay in the states the following lead-times werecalculated:
• LTa: Lead-time of a specific activity a based on the duration a requirementresided in the state related to the activity.
• LTn−a: Lead-time starting with an activity a and ending with an activity n. Inorder to calculate this lead-time, the sum of the durations of all activities to workon a specific high-level requirement were calculated.
Waiting times are included in the lead-times. The accuracy of the measures is highas the data was under regular review due to that the electronic Kanban solution wasused in daily work, and the data was subject to a monthly analysis and review.
172
6.3.4 Data Analysis
The descriptive statistics used were box-plots illustrating the spread of the data. Thehypotheses were analyzed by identifying whether there is a relationship between thevariable lead-time and the variables phases (H0,phase) and system impact (H0,mult ). Forthe relationship between lead-time and system impact the Pearson correlation was usedto determine whether there is a linear relationship, and the Spearman correlation totest whether there is a non-linear relationship. For the relationship between lead-timeand phase (H0,phase) no correlation was used as phase is a categorical variable. Inorder to capture whether phase leads to variance in lead-time we test whether specificphases lead to variance in lead-time, this is done by using stepwise regression analysis.Thereby, for each category a dummy variable is introduced.
If there is a relationship between the variables (e.g. between system impact andlead-time) this would mean that the system impact would be a variable explaining someof the variance in the lead-time. The hypotheses for size (H0,size) was only evaluatedusing descriptive statistics due to the limited number of data points.
6.3.5 Threats to Validity
Four types of threats to validity are distinguished, namely conclusion validity (abilityto draw conclusions about relationships based on statistical inference), internal validity(ability to isolate and identify factors affecting the studied variables without the re-searchers knowledge), construct validity (ability to measure the object being studied),and external validity (ability to generalize the results) [15].
Conclusion Validity: The statistical inferences that could be made from this studyto a population are limited as this study investigates one particular case. In conse-quence, no inference statistics for comparing sample means and medians with regardto statistical significance are used. Instead correlation analysis was used, correlationanalysis being much more common for observational studies such as case studies. Forthe test of hypotheses H0,phase we used stepwise regression analysis, regression analy-sis being a tool of statistical inference. Hence, the interpretation of regression analysisin observational studies has to be done with great care as for a single case study norandom sampling with regard to a population has been conducted. The main purposeof the regression was to investigate whether the category leads to variance in lead-timeat the specific company. That is, companies with similar contexts might make similarobservations, but an inference to the population of companies using incremental andagile methods based on the regression would be misleading.
Internal Validity: One threat to internal validity is the objectivity of measurements,affected by the interpretation of the researcher. To reduce the risk the researcher pre-
173
Chapter 6. An Empirical Study of Lead-Times in Incremental and Agile SoftwareDevelopment
sented the lead-time data during one meeting and discussed it with peers at the com-pany.
Construct Validity: Reactive bias is a threat where the presence of the researcherinfluences the outcome of the study. The risk is low due that the researcher is employedat the company, and has been working with the company for a couple of years. Correctdata is another threat to validity (in this case whether the lead-time data is accuratelyentered and up-to-date). As the system and the data entered support the practitionersin their daily work the data is continuously updated. Furthermore, the system providesan overview of missing values, aiding in keeping the data complete which reduces therisk.
External Validity: One risk to external validity is the focus on one company andthus the limitation in generalizing the result. To reduce the risk multiple systems werestudied. Furthermore, the context of the case was described as this makes explicit towhat degree the results are generalizable. In this case the results apply to large-scalesoftware development with parallel system development and incremental deliveries tosystem testing. Agile practices were applied on team-level.
6.4 Results
6.4.1 Time Distribution PhasesFigure 6.2 shows the box-plots for lead-times between phases P1 (requirements speci-fication), P2 (implementation and unit test), P3 (node and system test), and P4 (releaseprojects). The box-plots do not provide a clear indication of the differences of lead-timedistribution between phases as the box-plots show high overlaps between the phases.
Table 6.2 provides an overview of the statistical results of the correlations betweenphase and lead-time across systems. The stepwise regression shows that Dummy 4 washighly significant in the regression. Though, the overall explanatory power (which wasslightly increased by the introduction of the Dummy 1) is still very low and accountsfor 1.14 % of the variance in lead-time (R2). Hence, H0,phase cannot be rejected withrespect to this particular case.
6.4.2 Multi-System vs. Single-System RequirementsFigure 6.3 shows single system requirements (labeled as 0) in comparison to multi-system requirements (labeled as 1) for all phases and for the total lead-time. The box-plots indicate that there is no difference between single and multi-system requirements.In fact, it is clearly visible that the boxes and the median values are on the same level.
174
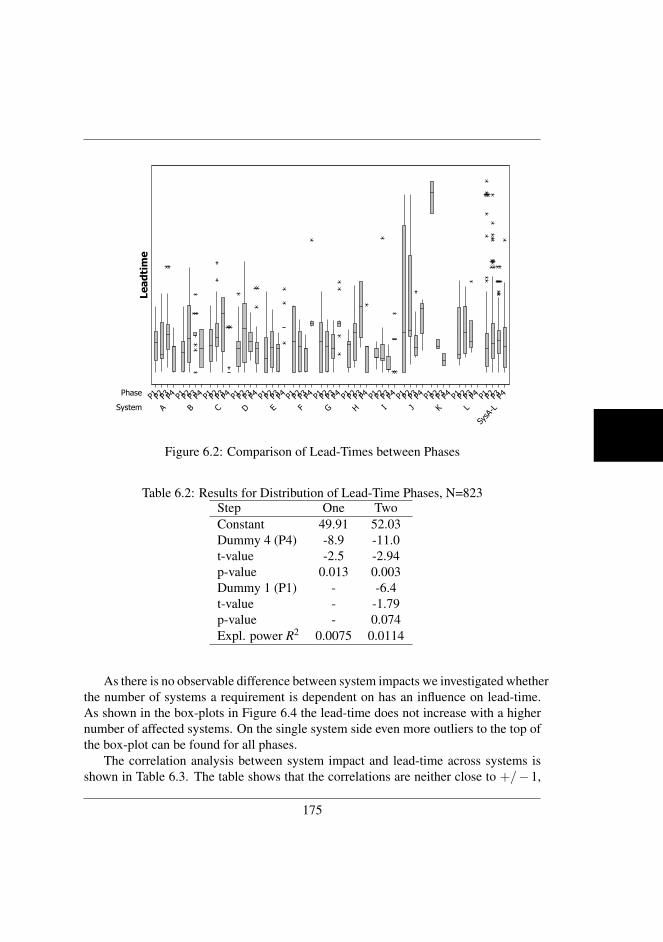
System
Phase
SysA-LLKJIHGFEDCBA
P4P3P2P1P4P3P2P1P4P3P2P1P4P3P2P1P4P3P2P1P4P3P2P1P4P3P2P1P4P3P2P1P4P3P2P1P4P3P2P1P4P3P2P1P4P3P2P1P4P3P2P1
Leadtime
Figure 6.2: Comparison of Lead-Times between Phases
Table 6.2: Results for Distribution of Lead-Time Phases, N=823Step One TwoConstant 49.91 52.03Dummy 4 (P4) -8.9 -11.0t-value -2.5 -2.94p-value 0.013 0.003Dummy 1 (P1) - -6.4t-value - -1.79p-value - 0.074Expl. power R2 0.0075 0.0114
As there is no observable difference between system impacts we investigated whetherthe number of systems a requirement is dependent on has an influence on lead-time.As shown in the box-plots in Figure 6.4 the lead-time does not increase with a highernumber of affected systems. On the single system side even more outliers to the top ofthe box-plot can be found for all phases.
The correlation analysis between system impact and lead-time across systems isshown in Table 6.3. The table shows that the correlations are neither close to +/− 1,
175
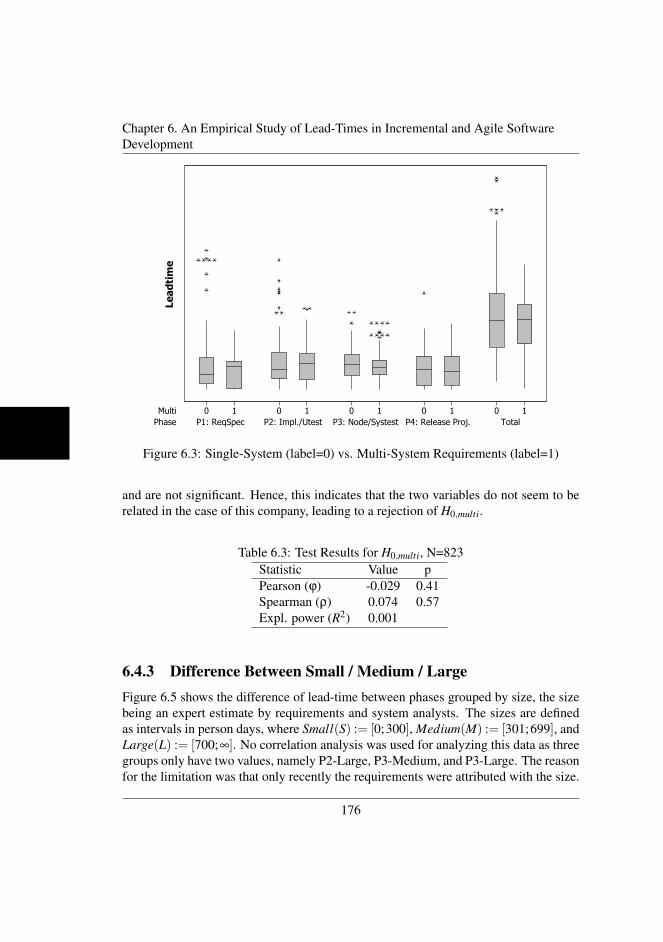
Chapter 6. An Empirical Study of Lead-Times in Incremental and Agile SoftwareDevelopment
Phase
Multi
TotalP4: Release Proj.P3: Node/SystestP2: Impl./UtestP1: ReqSpec
1010101010
Leadtime
Figure 6.3: Single-System (label=0) vs. Multi-System Requirements (label=1)
and are not significant. Hence, this indicates that the two variables do not seem to berelated in the case of this company, leading to a rejection of H0,multi.
Table 6.3: Test Results for H0,multi, N=823Statistic Value pPearson (ϕ) -0.029 0.41Spearman (ρ) 0.074 0.57Expl. power (R2) 0.001
6.4.3 Difference Between Small / Medium / LargeFigure 6.5 shows the difference of lead-time between phases grouped by size, the sizebeing an expert estimate by requirements and system analysts. The sizes are definedas intervals in person days, where Small(S) := [0;300], Medium(M) := [301;699], andLarge(L) := [700;∞]. No correlation analysis was used for analyzing this data as threegroups only have two values, namely P2-Large, P3-Medium, and P3-Large. The reasonfor the limitation was that only recently the requirements were attributed with the size.
176
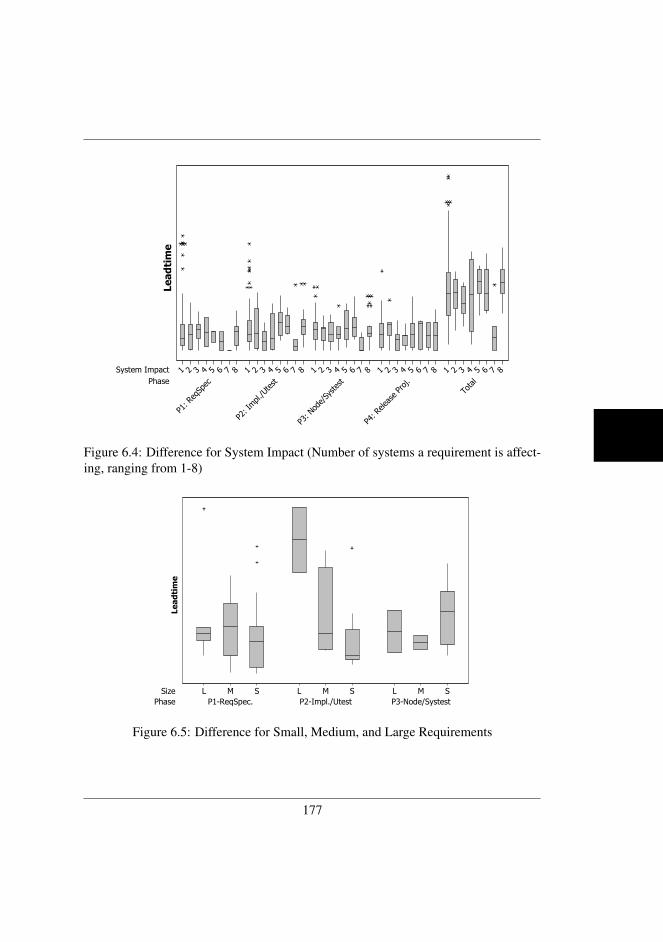
Phase
System Impact
Total
P4: Release Proj.
P3: Node/Systest
P2: Impl./Utest
P1: ReqSpec
8765432187654321876543218765432187654321
Leadtime
Figure 6.4: Difference for System Impact (Number of systems a requirement is affect-ing, ranging from 1-8)
Phase
Size
P3-Node/SystestP2-Impl./UtestP1-ReqSpec.
SMLSMLSML
Leadtime
Figure 6.5: Difference for Small, Medium, and Large Requirements
177
Chapter 6. An Empirical Study of Lead-Times in Incremental and Agile SoftwareDevelopment
However, the data already shows that the difference for size seems to be small inthe phases requirements specification and node as well as compound system testing.However, the size of requirements in the design phase shows a trend of increased lead-time with increased size.
6.5 Discussion
This section presents the practical and research implications. Furthermore, the reasonsfor the results seen in the hypotheses tests are provided. The explanations have beendiscussed within an analysis team at the studied companies and the team agreed on theexplanations given.
6.5.1 Practical Implications
No Difference in Lead-Times Between Phases: One explanation for the similarities oflead-times between phases is that large-scale system requires more specification andtesting, and that system integration is more challenging when having systems of verylarge scale. Thus, systems documentation and management activities should only be re-moved with care in this context as otherwise there is a risk of breaking the consistencyof the large system. Furthermore, there is no single phase that requires a specific focuson shortening the lead-time due to that there is no particularly time-consuming activity.Hence, in the studied context the result contradicts what would be expected from theassumptions made in literature. A consequence for practice is that one should investi-gate which are the value-adding activities in the development life-cycle, and reduce thenon-value adding activities. An approach for that is lean software development [11].
No difference in Multi vs. Single System Requirements: The number of dependen-cies a requirement has does not increase the lead-time. An explanation is that withrequirements affected by multiple systems the systems drive each other to be fast asthey can only deliver value together. The same driving force is not found on singlesystem requirements. However, we can hypothesize that single system lead-time canbe shortened more easily, the reason being that waiting due to dependencies in a com-pound system requires the resolution of these dependencies to reduce the lead-time.On the other hand, no technical dependencies have to be resolved to remove lead-timein single systems.
Difference in Size: No major difference can be observed between small, mediumand large requirements, except for large requirements in implementation and unit test.That is, at a specific size the lead-time for implementation and test increases drastically.
178
In consequence, there seems to be a limit that the size should have to avoid longer lead-times. This result is well in line with the findings presented in literature (cf [7, 1]).
6.5.2 Research ImplicationsThe study investigated a very large system, hence research should focus on investi-gating time consumption for different contexts (e.g. small systems). This helps tounderstand the scalability of agile in relation to lead-times and with that the abilityto respond quickly to market needs. Furthermore, the impact of size on lead-time isinteresting to understand in order to right-size requirements.
In this study we have shown the absence of explanatory power for the variance inlead-time for phases and system impact. As time is such an important outcome variableresearch should focus on investigating the impact of other variables (e.g. experience,schedule pressure, team and organizational size, distribution, etc.) in a broader scale.Broader scale means that a sample of projects should be selected, e.g. by using publiclyavailable repository with project data.
6.6 ConclusionThis paper evaluates software development lead-time in the context of a large-scaleorganization using incremental and agile practices. The following observations weremade regarding lead-time:
• Phases do not explain much of the variance in lead-time. From literature onewould expect that implementation and testing are the most time-consuming ac-tivities in agile development. However, due to the context (large-scale) otherphases are equally time-consuming.
• There is no difference in lead-time for singe-system and multi-system require-ments. This finding also contradicts literature. An explanation is that if a re-quirement has impact on multiple systems these systems drive each other in im-plementing the requirements quickly.
• With increasing size the lead-time within the implementation phase increases.This finding is in agreement with the related work.
In future work lead-times should be investigated in different contexts to providefurther understanding of the behavior of lead-times in incremental and agile develop-ment.
179
REFERENCES
6.7 References[1] Manish Agrawal and Kaushal Chari. Software effort, quality, and cycle time: A
study of cmm level 5 projects. IEEE Trans. Software Eng., 33(3):145–156, 2007.
[2] Mikio Aoyama. Issues in software cycle time reduction. In Proceedings of the1995 IEEE Fourteenth Annual International Phoenix Conference on Computersand Communications, pages 302–309, 1995.
[3] Kent Beck. Embracing change with extreme programming. IEEE Computer,32(10):70–77, 1999.
[4] Lars Bratthall, Per Runeson, K. Adelsward, and W. Eriksson. A survey of lead-time challenges in the development and evolution of distributed real-time systems.Information & Software Technology, 42(13):947–958, 2000.
[5] Erran Carmel. Cycle time in packaged software firms. Journal of Product Inno-vation Management, 12(2):110–123, 1995.
[6] Bill Carreira. Lean manufacturing that works: powerful tools for dramaticallyreducing waste and maximizing profits. American Management Association, NewYork, 2005.
[7] Donald E. Harter, Mayuram S. Krishnan, and Sandra A. Slaughter. Effects of pro-cess maturity on quality, cycle time, and effort in software product development.Management Science, 46(4), 2000.
[8] Kai Petersen and Claes Wohlin. A comparison of issues and advantages in ag-ile and incremental development between state of the art and an industrial case.Journal of Systems and Software, 82(9), 2009.
[9] Kai Petersen and Claes Wohlin. Context in industrial software engineering re-search. In Proceedings of the 3rd International Symposium on Empirical SoftwareEngineering and Measurement, pages 401–404, 2010.
[10] Kai Petersen, Claes Wohlin, and Dejan Baca. The waterfall model in large-scaledevelopment. In Proceedings of the 10th International Conference on Product-Focused Software Process Improvement (PROFES 2009), pages 386–400, 2009.
[11] Mary Poppendieck and Tom Poppendieck. Lean software development: an agiletoolkit. Addison-Wesley, Boston, 2003.
180
[12] Melissa A. Schilling. Technological lockout: an integrative model of the eco-nomic and strategic factors driving technology success and failure. Academy ofManagement Review, 23(2):267–284, 1998.
[13] George Stalk. Time - the next source of competitive advantage. Harvard BusinessReview, 66(4), 1988.
[14] Glen L. Urban, Theresa Carter, Steven Gaskin, and Zofia Mucha. Market sharerewards to pioneering brands: an empirical analysis and strategic implications.Management Science, 32(6):645–659, 1986.
[15] Claes Wohlin, Per Runeson, Martin Host, Magnus C. Ohlsson, Bjorn Regnell,and Anders Wesslen. Experimentation in Software Engineering: An Introduction(International Series in Software Engineering). Springer, 2000.
181
REFERENCES
182
Chapter 7
Software Process Improvementthrough the Lean Measurement(SPI-LEAM) Method
Kai Petersen and Claes WohlinAccepted for Publication in Journal of Systems and Software
7.1 IntroductionSoftware process improvement aims at making the software process more efficientand increasing product quality by continuous assessment and adjustment of the pro-cess. For this several process improvement frameworks have been proposed, includingthe Capability Maturity Model Integration (CMMI) [8] and the Quality ImprovementParadigm (QIP) [2, 4]. These are high level frameworks providing guidance what todo, but not how the actual implementation should look like. The Software ProcessImprovement through the Lean Measurement (SPI-LEAM) method integrates the soft-ware quality improvement paradigm with lean software development principles. Thatis, it describes a novel way of how to implement lean principles through measurementin order to initiate software process improvements.
The overall goal of lean development is to achieve a continuous and smooth flow ofproduction with maximum flexibility and minimum waste in the process. All activitiesand work products that do not contribute to the customer value are considered waste.
183
Chapter 7. Software Process Improvement through the Lean Measurement(SPI-LEAM) Method
Identifying and removing waste helps to focus more on the value creating activities[9, 34]. The idea of focusing on waste was initially implemented in the automotivedomain at Toyota [33] identifying seven types of waste. The types of waste have beentranslated to software engineering into extra processes, extra features, partially donework (inventory), task switching, waiting, motion, and defects [31]. Partially donework (or inventory) is specifically critical [22]. The reason for inventory being a prob-lem is not that software artifacts take a lot of space in stock, but:
• Inventory hides defects that are thus discovered late in the process [22].
• Time has been spent on artifacts in the inventory (e.g., reviewing of require-ments) and due to change in the context the requirements become obsolete andthus the work done on them useless (see Chapter 3).
• Inventory impacts other wastes. For example, a high level of inventory causeswaiting times. Formally this is the case in waterfall development as designershave to wait until the whole requirements document has been approved [30].Long waiting times bare the risk of completed work to become obsolete. Fur-thermore, high inventory in requirements engineering can be due to that a highnumber of extra features have been defined.
• Inventory slows down the whole development process. Consider the example ofa highway, if the highway is overloaded with cars then the traffic moves slowly.
• High inventory causes stress in the organization [25].
Lean manufacturing has drastically increased the efficiency of product develop-ment and the quality of products in manufacturing (see for example [9]). When imple-mented in software development lean led to similar effects (cf. [25, 23]). Even thoughlean principles are very promising for software development, the introduction of leandevelopment is very hard to achieve as it requires a large shift in thinking about soft-ware processes. Therefore, an attempt to change the whole organization at once oftenleads to failure. This has been encountered when using lean in manufacturing [28] andsoftware development [22].
To avoid the risk of failure when introducing lean our method helps the organizationto arrive at a lean software process incrementally through continuous improvements.The method relies on the measurement of different inventories as well as the combinedanalysis of inventory measurements. The focus on inventory measurement is motivatedby the problems caused by inventories discussed earlier. Furthermore, inventories alsoshow the absence of lean practices and thus can be used as support when arguing forthe introduction of the principles. In the analysis of the inventories a system thinking
184
method is proposed as lean thinking requires a holistic view to find the real cause ofproblems. That is, not only single parts of the development process are considered, butthe impact of problems (or improvement initiatives) on the overall process have to betaken into consideration.
Initial feedback on SPI-LEAM was given from two software process improvementrepresentatives at Ericsson AB (see [15]). The objective was to solicit early feedbackon the main assumptions and steps of SPI-LEAM from the company, which needstriggered the development of the method.
The remainder of the paper is structured as follows: Section 7.2 presents the re-lated work on lean software development in general and measurement for lean soft-ware development in particular. Section 7.3 presents the Software Process Improve-ment through the Lean Measurement (SPI-LEAM) Framework. Section 7.4 presents apreliminary evaluation of the method. Section 7.5 discusses the proposed method withfocus on comparison to related work, practical implications, and research implications.Section 7.6 concludes the paper.
7.2 Related Work
7.2.1 Lean in Software Engineering
Middleton [22] conducted two industrial case studies on lean implementation in soft-ware engineering, and the research method used was action research. The companyallocated resources of developers working in two different teams, one with experienceddevelopers (case A) and one with less experienced developers (case B). The responsesfrom the participants was that initially the work is frustrating as errors become visiblealmost immediately and are returned in the beginning. In the long run though the num-ber of errors dropped dramatically. After the use of the lean method the teams were notable to sustain the lean method due to organizational hierarchy, traditional promotionpatterns, and the fear of forcing errors into the open.
Another case study by Middleton et al. [23] studied a company practicing leanin their daily work for two years. They found that the company had many steps inthe process not being value-adding activities. A survey among people in the companyshowed that the majority supports lean ideas and thinks they can be applied to softwareengineering. Only a minority (10 %) is not convinced of the benefits of lean softwaredevelopment. Statistics collected at the company show a 25 % gain in productivity,schedule slippage was reduced to 4 weeks from previously months or years, and timefor defect fixing was reduced by 65 % - 80 %. The customer response on the productreleased using lean development was overwhelmingly positive.
185
Chapter 7. Software Process Improvement through the Lean Measurement(SPI-LEAM) Method
Perera and Fernando [29] compared an agile process with a hybrid process of agileand lean in an experiment involving ten student projects. One half of the projects wasused as a control group applying agile processes. A detailed description of how theprocesses differ and which practices are actually used was not been provided. Theoutcome is that the hybrid approach produces more lines of code and thus is moreproductive. Regarding quality, early in development more defects are discovered withthe hybrid process, but the opposite trend can be found in later phases, which confirmsthe findings in [22].
Parnell-Klabo [27] followed the introduction of lean and documented lessons learnedfrom the introduction. The major obstacles in moving from agile are to obtain open of-fice space to locate teams together, gain executive support, and training and informingpeople to reduce resistance of change. After successfully changing with the help oftraining workshops and use of pilot projects positive results have been obtained. Thelead-time for delivery has been decreased by 40 % - 50 %. Besides having trainingworkshops and pilots sitting together in open office-landscapes and having good mea-sures to quantify the benefits of improvements are key.
7.2.2 Lean Manufacturing and Lean Product DevelopmentLean principles initially focused on the manufacturing and production process and theelimination of waste within these processes that does not contribute to the creation ofcustomer value. Morgan and Liker [24] point out that today competitive advantagecannot be achieved by lean manufacturing alone. In fact most automotive compa-nies have implemented the lean manufacturing principles and the gap in performancebetween them is closing. In consequence lean needs to be extended to lean productdevelopment, not only focusing on the manufacturing/production process. This trendis referred to as lean product development which requires the integration of design,manufacturing, finance, human resource management, and purchasing for an overallproduct [24]. Results of lean product development are more interesting for softwareengineering than the pure manufacturing part as the success of software developmenthighly depends on an integrative view as well (requirements, design and architecture,motivated teams, etc.), and at the same time has a strong product focus.
Morgan and Liker [24] identified that inventory is influenced by the followingcauses: batching (large hand-overs of, for example, requirements), process and arrivalvariation, and unsynchronized concurrent tasks. The causes also have a negative effecton other wastes: batching leads to overproduction; process and arrival variation leadsto overproduction and waiting; and unsynchronized tasks lead to waiting. Thus, quan-tifying inventory aids in detecting the absence of lean principles and can be mapped toroot causes. As Morgan and Liker [24] point out their list of causes is not complete.
186
Hence, it is important to identify the causes for waste after detecting it (e.g. in form ofinventories piling up).
Karlsson and Ahlstrohm [18] identified hinders and supporting factors when intro-ducing lean production in a company in an industrial study. The major hinders are:(1) It is not easy to create a cross-functional focus as people feel loyal to their func-tion; (2) Simultaneous engineering is challenging when coming from sequential work-processes; (3) There are difficulties in coordinating projects as people have problemsunderstanding other work-disciplines; (4) It is challenging to manage the organizationbased on visions as people were used to detailed specifications and instructions; (5)The relationship to customers is challenging as cost estimations are expected, evenin a highly flexible product development process. Factors helping the introduction oflean product development are: (1) Lean buffers in schedules; (2) Close cooperationwith customers in product development to receive feedback; (3) For moving towards anew way of working successfully high competence engineers have to be involved; (4)Commitment and support from top management is required; (5) regular face-to-facemeetings of managers from different disciplines.
Oppenheim [26] presents an extension of the value-stream mapping process to pro-vide a comprehensive framework for the analysis of the development flow in leanproduct development. The framework is split into different steps. In the first step atakt-period is selected. A takt is a time-box in which different tasks are fulfilled andintegrated. The second step is the creation of a current-state-map of the current pro-cess. The current-state map enables the identification of wastes and is the basis for theidentification of improvements (e.g. the relations between waiting times and processingtimes become visible). Thereafter, the future-state-map is created which is an improvedversion of the map. Oppenheim stresses that all participants of the value-stream map-ping process must agree to the future-state-map. After having agreed to the map thetasks of the map are parsed into the takt times defined in the first step. The last step isthe assignment of teams (team architecture) to the different tasks in the value streammap. A number of success measures have been defined for the proposed approach:Amount of throughput time cut in comparison to competitors or similar completedprograms; Amount of waste removed in the value-stream map (time-units or monetaryvalue); Deviation of the planned value stream and the real value stream; Morale of theteams in form of a survey. Furthermore, the article points out that the goal of lean is tobecome better, cheaper, and faster. Though the reality often was that cheaper and fasterwas achieved on the expense of better (i.e. quality). One possible reason could be thatno combined analysis of different measures was emphasized. Instead, measures wereproposed as separate analysis tools (see Maskell and Baggaley [21] for analysis tools inthe manufacturing context), but there is no holistic measurement approach combiningindividual measures to achieve a comprehensive analysis.
187
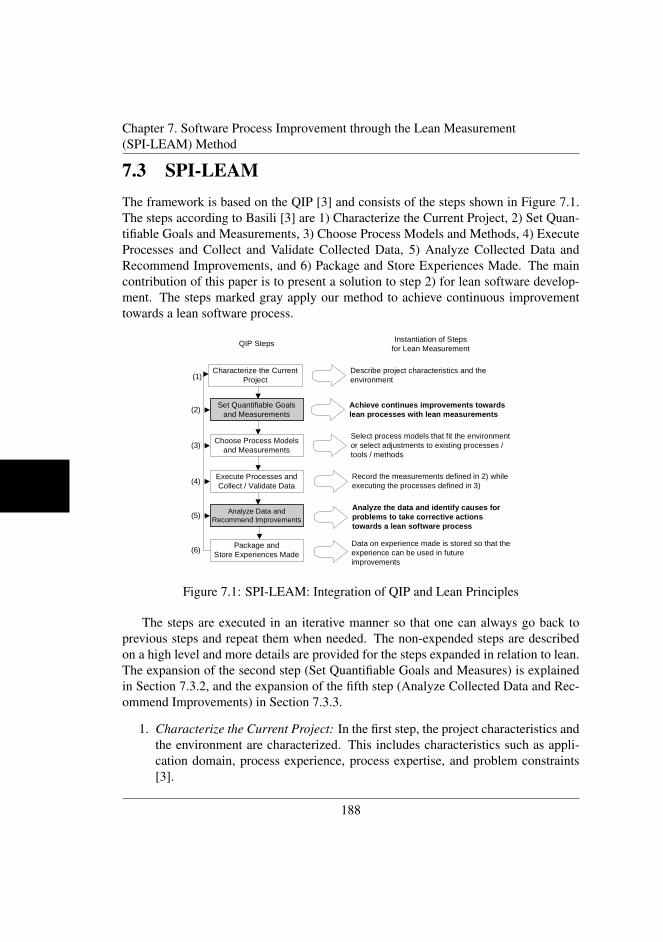
Chapter 7. Software Process Improvement through the Lean Measurement(SPI-LEAM) Method
7.3 SPI-LEAMThe framework is based on the QIP [3] and consists of the steps shown in Figure 7.1.The steps according to Basili [3] are 1) Characterize the Current Project, 2) Set Quan-tifiable Goals and Measurements, 3) Choose Process Models and Methods, 4) ExecuteProcesses and Collect and Validate Collected Data, 5) Analyze Collected Data andRecommend Improvements, and 6) Package and Store Experiences Made. The maincontribution of this paper is to present a solution to step 2) for lean software develop-ment. The steps marked gray apply our method to achieve continuous improvementtowards a lean software process.
Characterize the CurrentProject
Set Quantifiable Goalsand Measurements
Choose Process Modelsand Measurements
Execute Processes andCollect / Validate Data
Analyze Data andRecommend Improvements
Describe project characteristics and theenvironment
Achieve continues improvements towardslean processes with lean measurements
Select process models that fit the environmentor select adjustments to existing processes /tools / methods
Record the measurements defined in 2) whileexecuting the processes defined in 3)
Analyze the data and identify causes forproblems to take corrective actionstowards a lean software process
(1)
(5)
(4)
(3)
(2)
Package andStore Experiences Made(6)
Data on experience made is stored so that theexperience can be used in futureimprovements
QIP Steps Instantiation of Stepsfor Lean Measurement
Figure 7.1: SPI-LEAM: Integration of QIP and Lean Principles
The steps are executed in an iterative manner so that one can always go back toprevious steps and repeat them when needed. The non-expended steps are describedon a high level and more details are provided for the steps expanded in relation to lean.The expansion of the second step (Set Quantifiable Goals and Measures) is explainedin Section 7.3.2, and the expansion of the fifth step (Analyze Collected Data and Rec-ommend Improvements) in Section 7.3.3.
1. Characterize the Current Project: In the first step, the project characteristics andthe environment are characterized. This includes characteristics such as appli-cation domain, process experience, process expertise, and problem constraints[3].
188
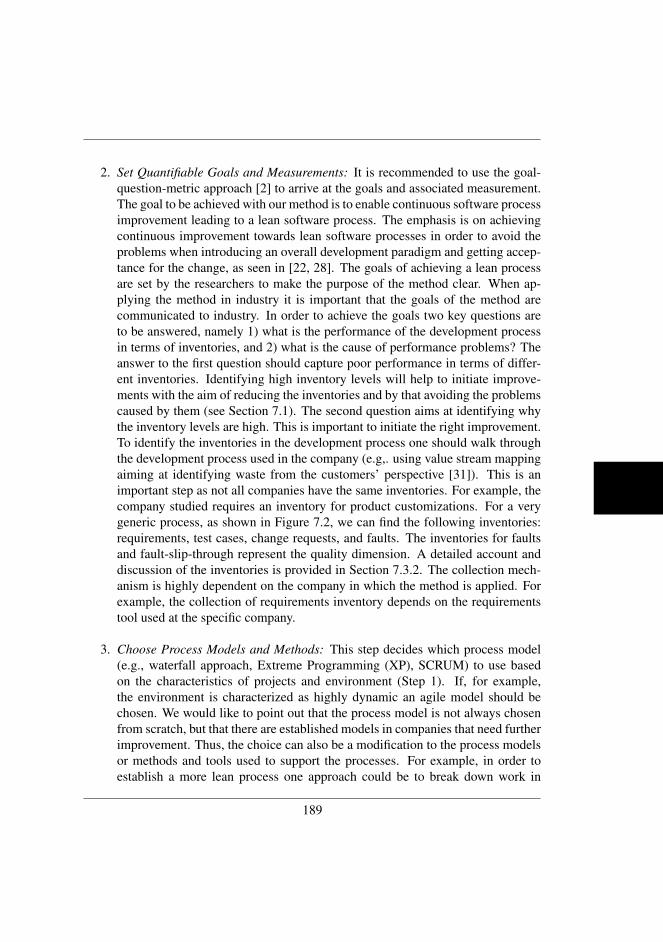
2. Set Quantifiable Goals and Measurements: It is recommended to use the goal-question-metric approach [2] to arrive at the goals and associated measurement.The goal to be achieved with our method is to enable continuous software processimprovement leading to a lean software process. The emphasis is on achievingcontinuous improvement towards lean software processes in order to avoid theproblems when introducing an overall development paradigm and getting accep-tance for the change, as seen in [22, 28]. The goals of achieving a lean processare set by the researchers to make the purpose of the method clear. When ap-plying the method in industry it is important that the goals of the method arecommunicated to industry. In order to achieve the goals two key questions areto be answered, namely 1) what is the performance of the development processin terms of inventories, and 2) what is the cause of performance problems? Theanswer to the first question should capture poor performance in terms of differ-ent inventories. Identifying high inventory levels will help to initiate improve-ments with the aim of reducing the inventories and by that avoiding the problemscaused by them (see Section 7.1). The second question aims at identifying whythe inventory levels are high. This is important to initiate the right improvement.To identify the inventories in the development process one should walk throughthe development process used in the company (e.g,. using value stream mappingaiming at identifying waste from the customers’ perspective [31]). This is animportant step as not all companies have the same inventories. For example, thecompany studied requires an inventory for product customizations. For a verygeneric process, as shown in Figure 7.2, we can find the following inventories:requirements, test cases, change requests, and faults. The inventories for faultsand fault-slip-through represent the quality dimension. A detailed account anddiscussion of the inventories is provided in Section 7.3.2. The collection mech-anism is highly dependent on the company in which the method is applied. Forexample, the collection of requirements inventory depends on the requirementstool used at the specific company.
3. Choose Process Models and Methods: This step decides which process model(e.g., waterfall approach, Extreme Programming (XP), SCRUM) to use basedon the characteristics of projects and environment (Step 1). If, for example,the environment is characterized as highly dynamic an agile model should bechosen. We would like to point out that the process model is not always chosenfrom scratch, but that there are established models in companies that need furtherimprovement. Thus, the choice can also be a modification to the process modelsor methods and tools used to support the processes. For example, in order toestablish a more lean process one approach could be to break down work in
189
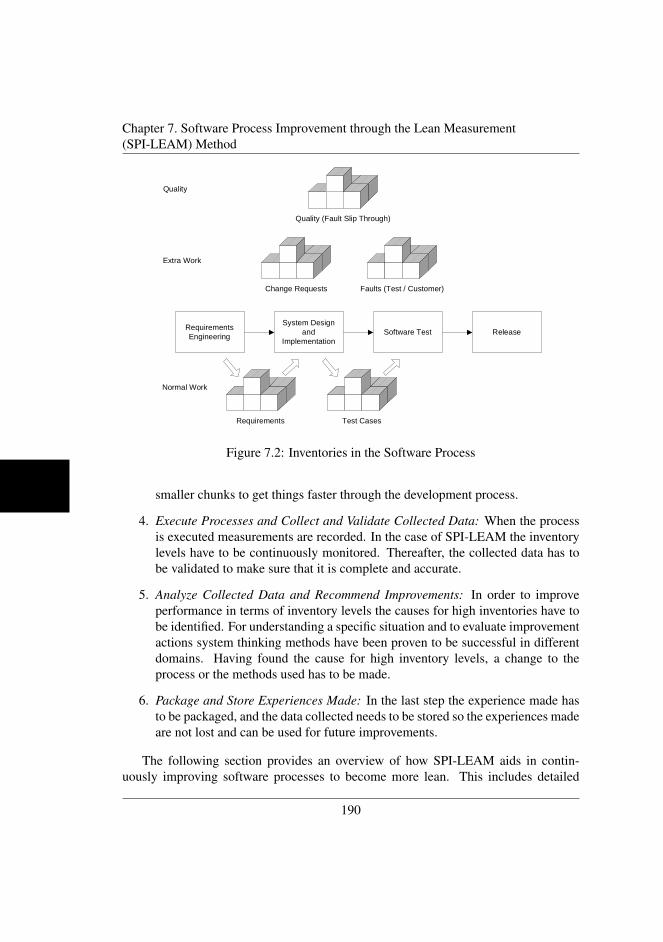
Chapter 7. Software Process Improvement through the Lean Measurement(SPI-LEAM) Method
RequirementsEngineering
System Designand
ImplementationSoftware Test Release
Requirements Test Cases
Change Requests Faults (Test / Customer)
Quality (Fault Slip Through)
Extra Work
Normal Work
Quality
Figure 7.2: Inventories in the Software Process
smaller chunks to get things faster through the development process.
4. Execute Processes and Collect and Validate Collected Data: When the processis executed measurements are recorded. In the case of SPI-LEAM the inventorylevels have to be continuously monitored. Thereafter, the collected data has tobe validated to make sure that it is complete and accurate.
5. Analyze Collected Data and Recommend Improvements: In order to improveperformance in terms of inventory levels the causes for high inventories have tobe identified. For understanding a specific situation and to evaluate improvementactions system thinking methods have been proven to be successful in differentdomains. Having found the cause for high inventory levels, a change to theprocess or the methods used has to be made.
6. Package and Store Experiences Made: In the last step the experience made hasto be packaged, and the data collected needs to be stored so the experiences madeare not lost and can be used for future improvements.
The following section provides an overview of how SPI-LEAM aids in contin-uously improving software processes to become more lean. This includes detailed
190
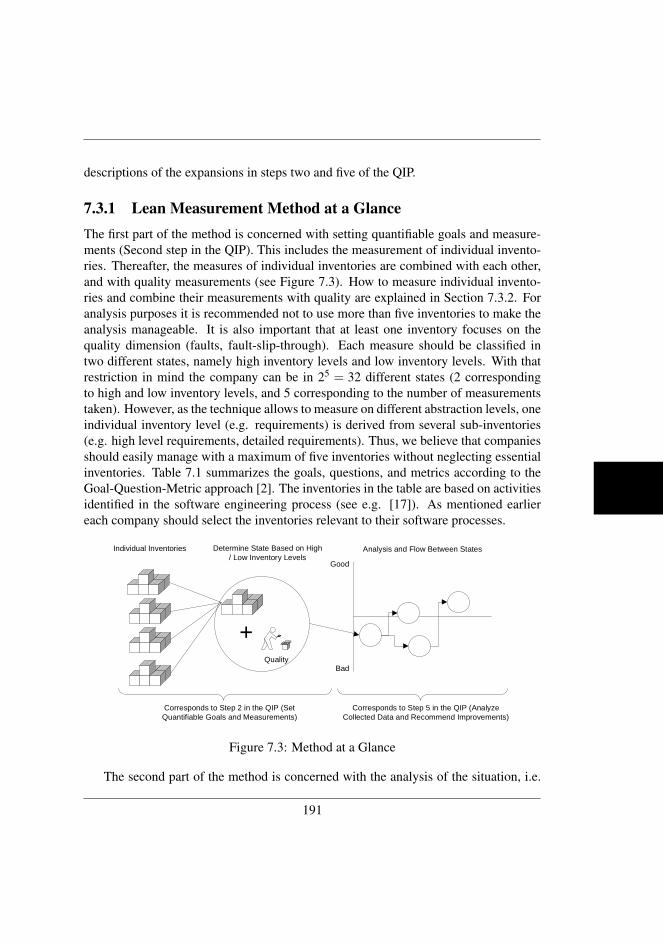
descriptions of the expansions in steps two and five of the QIP.
7.3.1 Lean Measurement Method at a GlanceThe first part of the method is concerned with setting quantifiable goals and measure-ments (Second step in the QIP). This includes the measurement of individual invento-ries. Thereafter, the measures of individual inventories are combined with each other,and with quality measurements (see Figure 7.3). How to measure individual invento-ries and combine their measurements with quality are explained in Section 7.3.2. Foranalysis purposes it is recommended not to use more than five inventories to make theanalysis manageable. It is also important that at least one inventory focuses on thequality dimension (faults, fault-slip-through). Each measure should be classified intwo different states, namely high inventory levels and low inventory levels. With thatrestriction in mind the company can be in 25 = 32 different states (2 correspondingto high and low inventory levels, and 5 corresponding to the number of measurementstaken). However, as the technique allows to measure on different abstraction levels, oneindividual inventory level (e.g. requirements) is derived from several sub-inventories(e.g. high level requirements, detailed requirements). Thus, we believe that companiesshould easily manage with a maximum of five inventories without neglecting essentialinventories. Table 7.1 summarizes the goals, questions, and metrics according to theGoal-Question-Metric approach [2]. The inventories in the table are based on activitiesidentified in the software engineering process (see e.g. [17]). As mentioned earliereach company should select the inventories relevant to their software processes.
Individual Inventories
Quality
+
Determine State Based on High/ Low Inventory Levels
Analysis and Flow Between States
Good
Bad
Corresponds to Step 2 in the QIP (SetQuantifiable Goals and Measurements)
Corresponds to Step 5 in the QIP (AnalyzeCollected Data and Recommend Improvements)
Figure 7.3: Method at a Glance
The second part of the method is concerned with the analysis of the situation, i.e.
191
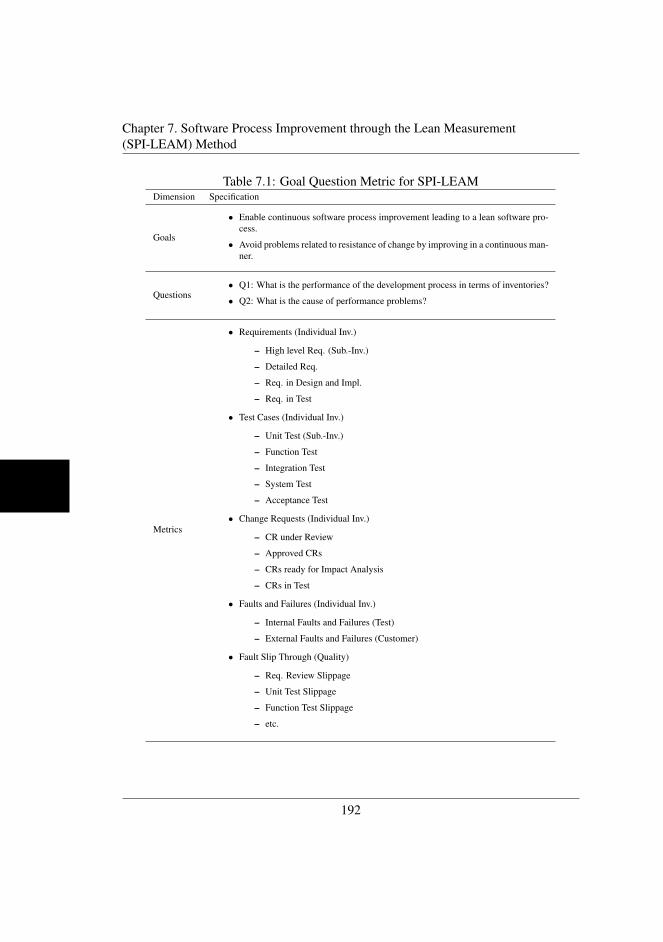
Chapter 7. Software Process Improvement through the Lean Measurement(SPI-LEAM) Method
Table 7.1: Goal Question Metric for SPI-LEAMDimension Specification
Goals
• Enable continuous software process improvement leading to a lean software pro-cess.
• Avoid problems related to resistance of change by improving in a continuous man-ner.
Questions• Q1: What is the performance of the development process in terms of inventories?
• Q2: What is the cause of performance problems?
Metrics
• Requirements (Individual Inv.)
– High level Req. (Sub.-Inv.)
– Detailed Req.
– Req. in Design and Impl.
– Req. in Test
• Test Cases (Individual Inv.)
– Unit Test (Sub.-Inv.)
– Function Test
– Integration Test
– System Test
– Acceptance Test
• Change Requests (Individual Inv.)
– CR under Review
– Approved CRs
– CRs ready for Impact Analysis
– CRs in Test
• Faults and Failures (Individual Inv.)
– Internal Faults and Failures (Test)
– External Faults and Failures (Customer)
• Fault Slip Through (Quality)
– Req. Review Slippage
– Unit Test Slippage
– Function Test Slippage
– etc.
192
the aim is to determine the causes for high inventory level and quality problems. Inother words, we want to know why we are in a certain state. Based on the analysisit is determined to which state one should move next. For example, which inventorylevel should be reduced first, considering the knowledge gained through the analysis.To make the right decisions the end-to-end process and the interaction of its parts aretaken into consideration. As system theory in general and simulation as a sub-set ofsystem theory methods allows to consider the interactions between individual parts ofthe process (as well as the process context) we elaborate on which methods are mostsuitable to use in Section 7.3.3.
7.3.2 Measure and Analyze Inventory LevelsThe measurement and analysis takes place in the second step of the QIP as shown inthe previous section. The measurement and analysis of inventory requires two actions:
• Action 1: Measure the individual inventories, i.e. change requests, faults, re-quirements, and test cases (see Figure 7.2). Each individual inventory (e.g.,requirements) can have sub-inventory (e.g. high level requirements, detailedrequirements, requirements in implementation, requirements in test) and thusthese inventories are combined to a single inventory ”requirements”. The mea-surement of the inventories is done continuously to be able to understand thechange of inventories over time. Inventories can also be split into work in pro-cess and buffer. The advantage is that this allows to determine waiting times, butit also requires to keep track of more data points.
• Action 2: Determine the overall state of the software process for a specific prod-uct combining the individual inventory levels. The combination of individual in-ventories is important as this avoids unintended optimization of measurements.That is, looking on one single inventory like requirements can lead to optimiza-tions such as skipping requirements reviews in order to push the requirementsinto the next phase quicker. However, when combining inventory measureswith each other and considering inventories representing the quality dimensionwill prevent this behavior. As a quality dimension we propose to use fault-slipthrough measurement [10] and the fault inventory.
Step 1: Measure Individual Inventories
Measurement Scale: In this step each of the inventories is measured individually con-sidering the effort required for each item in the inventory. In manufacturing inventory iscounted. In software development just counting the inventory is insufficient as artifacts
193
Chapter 7. Software Process Improvement through the Lean Measurement(SPI-LEAM) Method
in software development are too different. For example, requirements are of differenttypes (functional requirement, quality requirement) and of different complexities andabstraction levels (see for example [15]). Furthermore, requirements might never leavethe inventory as they are always valid (e.g. requirements on system response times).Similar issues can be found for testing, like test cases that are automated for regres-sion testing are different from manual test cases. As a consequence we propose to takeinto account the effort required to implement a requirement, or to run a test case. Tomake the importance of considering effort more explicit, take the example of a high-way again. It is a difference if we put a number of trucks on a crowded highway, ora number of cars. In terms of requirements this means that a high effort requirementtakes much more space in the development flow than small requirements. For each ofthe inventories there are methods available to estimate the effort:
• Requirements: Function points have been widely used to measure the size ofsystems in terms of requirements. This can be used as an input to determine theeffort for requirements [7]. Another alternative is to estimate in intervals by clas-sifying requirements as small, medium, or large. For each class of requirementsan interval has to be set (e.g. in person days).
• Test Cases: Jones [17] proposed a model to estimate the effort of testing basedon function point analysis. Another approach combines the number of test cases,test execution complexity, and knowledge of tester to estimate the effort of testexecution [35].
• Change Requests: The effort of a change is highly influenced by the impact thechange has on the system. Therefore, impact analysis can be used to provide anindication of how much effort the change requires [19].
• Faults: A method for corrective maintenance (e.g. fixing faults) has been evalu-ated by De Lucia et al. [20] considering the number of tasks needed for mainte-nance and the complexity of the system.
Describe Individual Inventory Levels: Individual inventories are broken down fur-ther into sub-inventories when needed. For example, requirements can be broken downinto high level requirements, detailed requirements, requirements in design phase, andrequirements in release. Similar, test cases can be broken down into unit test cases, inte-gration test cases, system test cases, etc. The measurement of effort in inventory is doneon the lowest level (i.e. high level requirements inventory, detailed requirements inven-tory, and so forth) and later combined to one single measure for requirements inventory.In Figure 7.4 the example for requirements (fictional data) and related sub-inventories
194
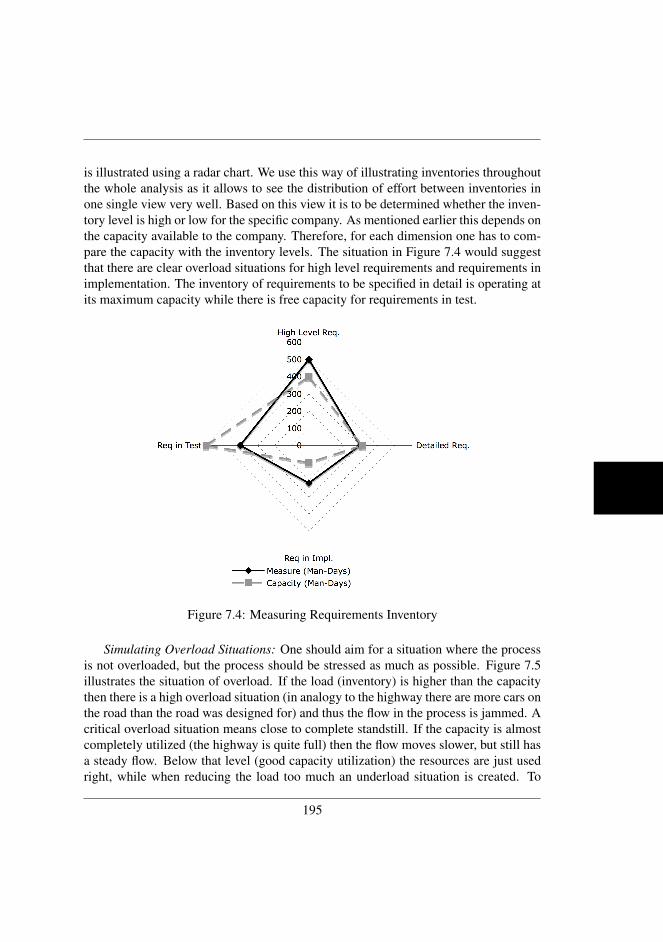
is illustrated using a radar chart. We use this way of illustrating inventories throughoutthe whole analysis as it allows to see the distribution of effort between inventories inone single view very well. Based on this view it is to be determined whether the inven-tory level is high or low for the specific company. As mentioned earlier this depends onthe capacity available to the company. Therefore, for each dimension one has to com-pare the capacity with the inventory levels. The situation in Figure 7.4 would suggestthat there are clear overload situations for high level requirements and requirements inimplementation. The inventory of requirements to be specified in detail is operating atits maximum capacity while there is free capacity for requirements in test.
Figure 7.4: Measuring Requirements Inventory
Simulating Overload Situations: One should aim for a situation where the processis not overloaded, but the process should be stressed as much as possible. Figure 7.5illustrates the situation of overload. If the load (inventory) is higher than the capacitythen there is a high overload situation (in analogy to the highway there are more cars onthe road than the road was designed for) and thus the flow in the process is jammed. Acritical overload situation means close to complete standstill. If the capacity is almostcompletely utilized (the highway is quite full) then the flow moves slower, but still hasa steady flow. Below that level (good capacity utilization) the resources are just usedright, while when reducing the load too much an underload situation is created. To
195
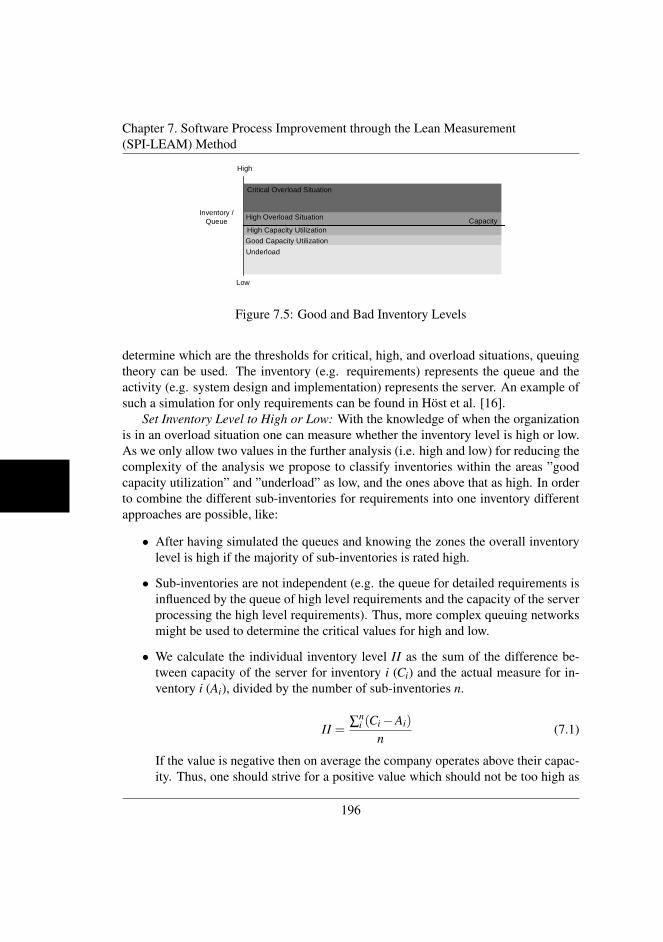
Chapter 7. Software Process Improvement through the Lean Measurement(SPI-LEAM) Method
High
Low
CapacityInventory /
Queue
Critical Overload Situation
High Overload Situation
High Capacity UtilizationGood Capacity UtilizationUnderload
Figure 7.5: Good and Bad Inventory Levels
determine which are the thresholds for critical, high, and overload situations, queuingtheory can be used. The inventory (e.g. requirements) represents the queue and theactivity (e.g. system design and implementation) represents the server. An example ofsuch a simulation for only requirements can be found in Host et al. [16].
Set Inventory Level to High or Low: With the knowledge of when the organizationis in an overload situation one can measure whether the inventory level is high or low.As we only allow two values in the further analysis (i.e. high and low) for reducing thecomplexity of the analysis we propose to classify inventories within the areas ”goodcapacity utilization” and ”underload” as low, and the ones above that as high. In orderto combine the different sub-inventories for requirements into one inventory differentapproaches are possible, like:
• After having simulated the queues and knowing the zones the overall inventorylevel is high if the majority of sub-inventories is rated high.
• Sub-inventories are not independent (e.g. the queue for detailed requirements isinfluenced by the queue of high level requirements and the capacity of the serverprocessing the high level requirements). Thus, more complex queuing networksmight be used to determine the critical values for high and low.
• We calculate the individual inventory level II as the sum of the difference be-tween capacity of the server for inventory i (Ci) and the actual measure for in-ventory i (Ai), divided by the number of sub-inventories n.
II = ∑ni (Ci−Ai)
n(7.1)
If the value is negative then on average the company operates above their capac-ity. Thus, one should strive for a positive value which should not be too high as
196
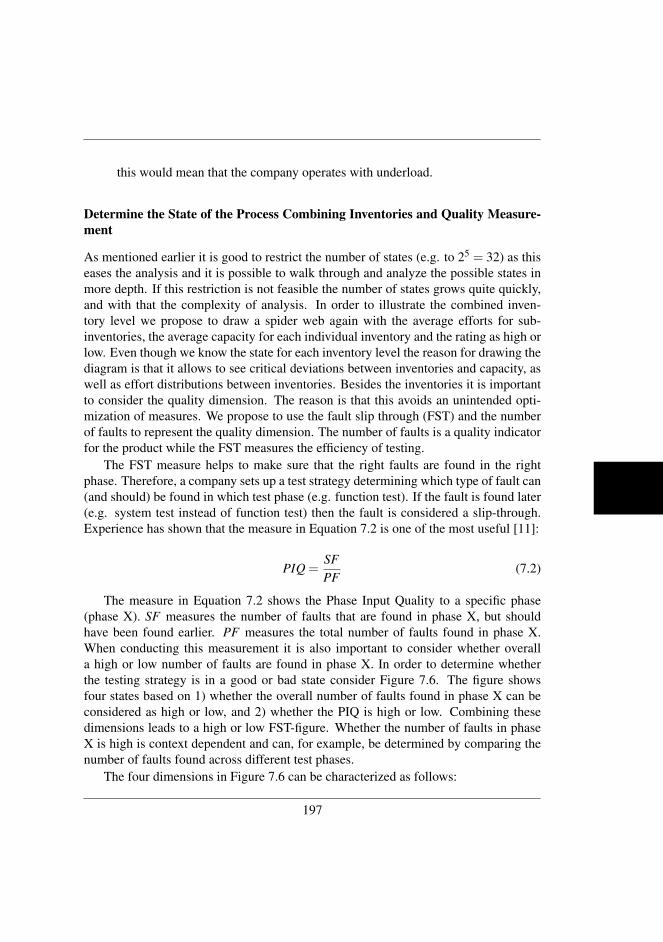
this would mean that the company operates with underload.
Determine the State of the Process Combining Inventories and Quality Measure-ment
As mentioned earlier it is good to restrict the number of states (e.g. to 25 = 32) as thiseases the analysis and it is possible to walk through and analyze the possible states inmore depth. If this restriction is not feasible the number of states grows quite quickly,and with that the complexity of analysis. In order to illustrate the combined inven-tory level we propose to draw a spider web again with the average efforts for sub-inventories, the average capacity for each individual inventory and the rating as high orlow. Even though we know the state for each inventory level the reason for drawing thediagram is that it allows to see critical deviations between inventories and capacity, aswell as effort distributions between inventories. Besides the inventories it is importantto consider the quality dimension. The reason is that this avoids an unintended opti-mization of measures. We propose to use the fault slip through (FST) and the numberof faults to represent the quality dimension. The number of faults is a quality indicatorfor the product while the FST measures the efficiency of testing.
The FST measure helps to make sure that the right faults are found in the rightphase. Therefore, a company sets up a test strategy determining which type of fault can(and should) be found in which test phase (e.g. function test). If the fault is found later(e.g. system test instead of function test) then the fault is considered a slip-through.Experience has shown that the measure in Equation 7.2 is one of the most useful [11]:
PIQ =SFPF
(7.2)
The measure in Equation 7.2 shows the Phase Input Quality to a specific phase(phase X). SF measures the number of faults that are found in phase X, but shouldhave been found earlier. PF measures the total number of faults found in phase X.When conducting this measurement it is also important to consider whether overalla high or low number of faults are found in phase X. In order to determine whetherthe testing strategy is in a good or bad state consider Figure 7.6. The figure showsfour states based on 1) whether the overall number of faults found in phase X can beconsidered as high or low, and 2) whether the PIQ is high or low. Combining thesedimensions leads to a high or low FST-figure. Whether the number of faults in phaseX is high is context dependent and can, for example, be determined by comparing thenumber of faults found across different test phases.
The four dimensions in Figure 7.6 can be characterized as follows:
197
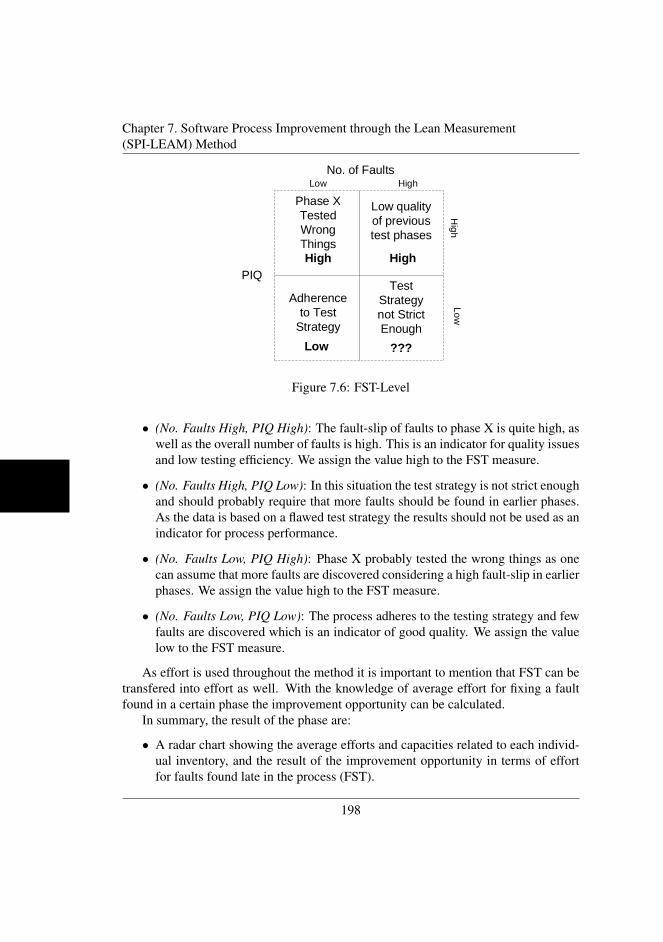
Chapter 7. Software Process Improvement through the Lean Measurement(SPI-LEAM) Method
Low qualityof previoustest phases
High
High
TestStrategynot StrictEnough
???
PIQ
No. of Faults
Adherenceto Test
StrategyLow
Phase XTestedWrongThingsHigh
Low
HighLow
Figure 7.6: FST-Level
• (No. Faults High, PIQ High): The fault-slip of faults to phase X is quite high, aswell as the overall number of faults is high. This is an indicator for quality issuesand low testing efficiency. We assign the value high to the FST measure.
• (No. Faults High, PIQ Low): In this situation the test strategy is not strict enoughand should probably require that more faults should be found in earlier phases.As the data is based on a flawed test strategy the results should not be used as anindicator for process performance.
• (No. Faults Low, PIQ High): Phase X probably tested the wrong things as onecan assume that more faults are discovered considering a high fault-slip in earlierphases. We assign the value high to the FST measure.
• (No. Faults Low, PIQ Low): The process adheres to the testing strategy and fewfaults are discovered which is an indicator of good quality. We assign the valuelow to the FST measure.
As effort is used throughout the method it is important to mention that FST can betransfered into effort as well. With the knowledge of average effort for fixing a faultfound in a certain phase the improvement opportunity can be calculated.
In summary, the result of the phase are:
• A radar chart showing the average efforts and capacities related to each individ-ual inventory, and the result of the improvement opportunity in terms of effortfor faults found late in the process (FST).
198
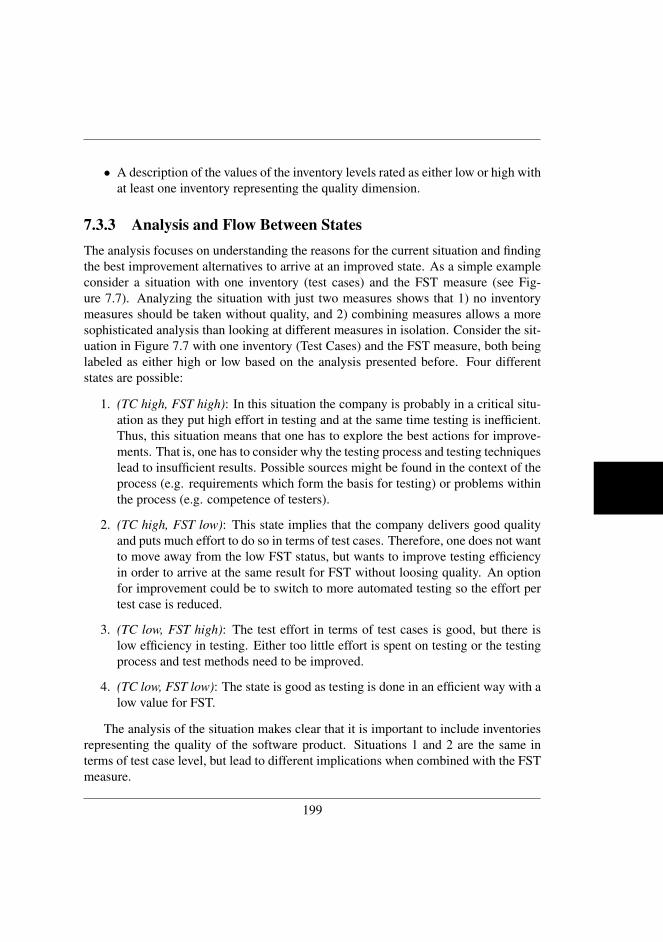
• A description of the values of the inventory levels rated as either low or high withat least one inventory representing the quality dimension.
7.3.3 Analysis and Flow Between StatesThe analysis focuses on understanding the reasons for the current situation and findingthe best improvement alternatives to arrive at an improved state. As a simple exampleconsider a situation with one inventory (test cases) and the FST measure (see Fig-ure 7.7). Analyzing the situation with just two measures shows that 1) no inventorymeasures should be taken without quality, and 2) combining measures allows a moresophisticated analysis than looking at different measures in isolation. Consider the sit-uation in Figure 7.7 with one inventory (Test Cases) and the FST measure, both beinglabeled as either high or low based on the analysis presented before. Four differentstates are possible:
1. (TC high, FST high): In this situation the company is probably in a critical situ-ation as they put high effort in testing and at the same time testing is inefficient.Thus, this situation means that one has to explore the best actions for improve-ments. That is, one has to consider why the testing process and testing techniqueslead to insufficient results. Possible sources might be found in the context of theprocess (e.g. requirements which form the basis for testing) or problems withinthe process (e.g. competence of testers).
2. (TC high, FST low): This state implies that the company delivers good qualityand puts much effort to do so in terms of test cases. Therefore, one does not wantto move away from the low FST status, but wants to improve testing efficiencyin order to arrive at the same result for FST without loosing quality. An optionfor improvement could be to switch to more automated testing so the effort pertest case is reduced.
3. (TC low, FST high): The test effort in terms of test cases is good, but there islow efficiency in testing. Either too little effort is spent on testing or the testingprocess and test methods need to be improved.
4. (TC low, FST low): The state is good as testing is done in an efficient way with alow value for FST.
The analysis of the situation makes clear that it is important to include inventoriesrepresenting the quality of the software product. Situations 1 and 2 are the same interms of test case level, but lead to different implications when combined with the FSTmeasure.
199
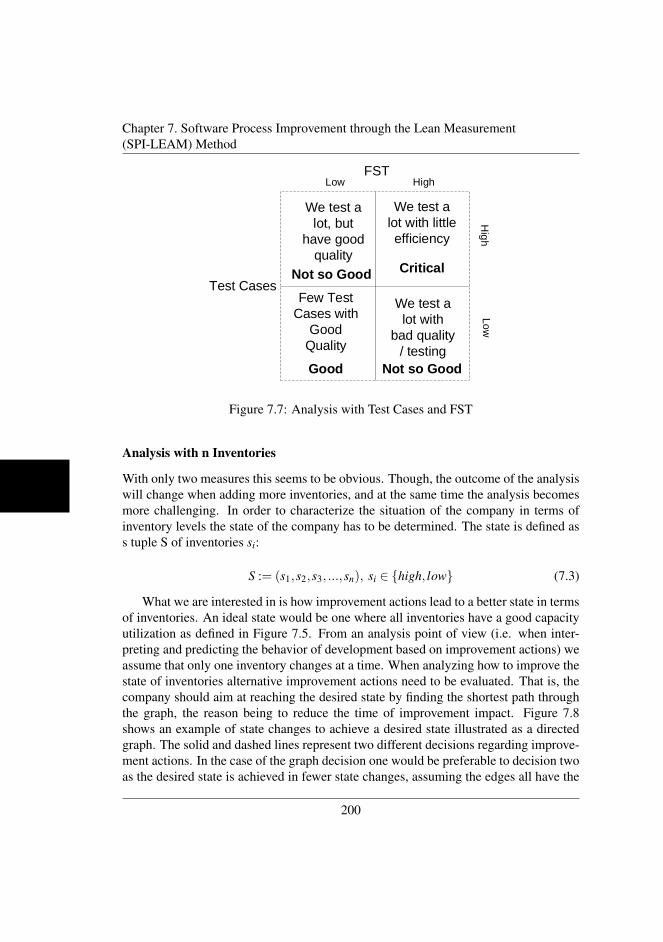
Chapter 7. Software Process Improvement through the Lean Measurement(SPI-LEAM) Method
We test alot, but
have goodquality
Not so Good
High
Few TestCases with
GoodQuality
Good
FST
We test alot with
bad quality/ testing
Not so Good
We test alot with littleefficiency
CriticalTest Cases
LowHighLow
Figure 7.7: Analysis with Test Cases and FST
Analysis with n Inventories
With only two measures this seems to be obvious. Though, the outcome of the analysiswill change when adding more inventories, and at the same time the analysis becomesmore challenging. In order to characterize the situation of the company in terms ofinventory levels the state of the company has to be determined. The state is defined ass tuple S of inventories si:
S := (s1,s2,s3, ...,sn), si ∈ {high, low} (7.3)
What we are interested in is how improvement actions lead to a better state in termsof inventories. An ideal state would be one where all inventories have a good capacityutilization as defined in Figure 7.5. From an analysis point of view (i.e. when inter-preting and predicting the behavior of development based on improvement actions) weassume that only one inventory changes at a time. When analyzing how to improve thestate of inventories alternative improvement actions need to be evaluated. That is, thecompany should aim at reaching the desired state by finding the shortest path throughthe graph, the reason being to reduce the time of improvement impact. Figure 7.8shows an example of state changes to achieve a desired state illustrated as a directedgraph. The solid and dashed lines represent two different decisions regarding improve-ment actions. In the case of the graph decision one would be preferable to decision twoas the desired state is achieved in fewer state changes, assuming the edges all have the
200
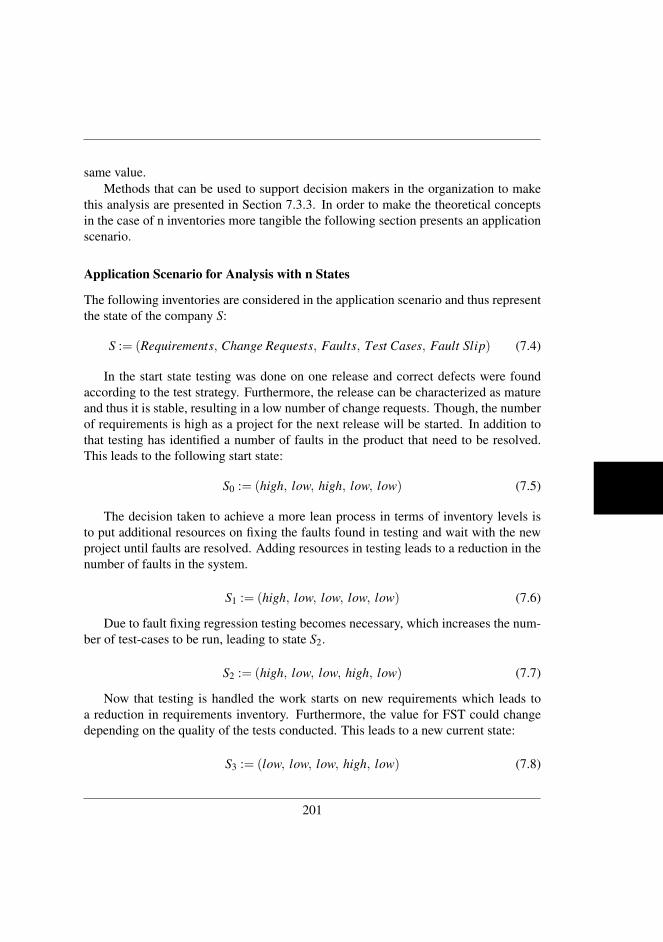
same value.Methods that can be used to support decision makers in the organization to make
this analysis are presented in Section 7.3.3. In order to make the theoretical conceptsin the case of n inventories more tangible the following section presents an applicationscenario.
Application Scenario for Analysis with n States
The following inventories are considered in the application scenario and thus representthe state of the company S:
S := (Requirements, Change Requests, Faults, Test Cases, Fault Slip) (7.4)
In the start state testing was done on one release and correct defects were foundaccording to the test strategy. Furthermore, the release can be characterized as matureand thus it is stable, resulting in a low number of change requests. Though, the numberof requirements is high as a project for the next release will be started. In addition tothat testing has identified a number of faults in the product that need to be resolved.This leads to the following start state:
S0 := (high, low, high, low, low) (7.5)
The decision taken to achieve a more lean process in terms of inventory levels isto put additional resources on fixing the faults found in testing and wait with the newproject until faults are resolved. Adding resources in testing leads to a reduction in thenumber of faults in the system.
S1 := (high, low, low, low, low) (7.6)
Due to fault fixing regression testing becomes necessary, which increases the num-ber of test-cases to be run, leading to state S2.
S2 := (high, low, low, high, low) (7.7)
Now that testing is handled the work starts on new requirements which leads toa reduction in requirements inventory. Furthermore, the value for FST could changedepending on the quality of the tests conducted. This leads to a new current state:
S3 := (low, low, low, high, low) (7.8)
201
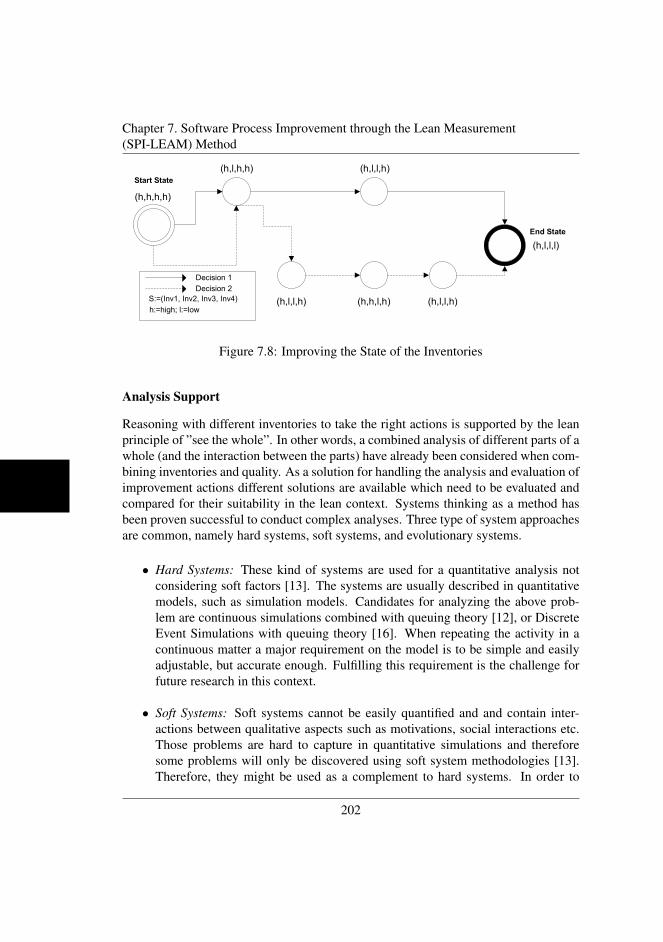
Chapter 7. Software Process Improvement through the Lean Measurement(SPI-LEAM) Method
Start State
(h,h,h,h)
(h,l,h,h) (h,l,l,h)
(h,l,l,l)
Decision 1
Decision 2
S:=(Inv1, Inv2, Inv3, Inv4)
h:=high; l:=low(h,l,l,h) (h,h,l,h) (h,l,l,h)
End State
Figure 7.8: Improving the State of the Inventories
Analysis Support
Reasoning with different inventories to take the right actions is supported by the leanprinciple of ”see the whole”. In other words, a combined analysis of different parts of awhole (and the interaction between the parts) have already been considered when com-bining inventories and quality. As a solution for handling the analysis and evaluation ofimprovement actions different solutions are available which need to be evaluated andcompared for their suitability in the lean context. Systems thinking as a method hasbeen proven successful to conduct complex analyses. Three type of system approachesare common, namely hard systems, soft systems, and evolutionary systems.
• Hard Systems: These kind of systems are used for a quantitative analysis notconsidering soft factors [13]. The systems are usually described in quantitativemodels, such as simulation models. Candidates for analyzing the above prob-lem are continuous simulations combined with queuing theory [12], or DiscreteEvent Simulations with queuing theory [16]. When repeating the activity in acontinuous matter a major requirement on the model is to be simple and easilyadjustable, but accurate enough. Fulfilling this requirement is the challenge forfuture research in this context.
• Soft Systems: Soft systems cannot be easily quantified and and contain inter-actions between qualitative aspects such as motivations, social interactions etc.Those problems are hard to capture in quantitative simulations and thereforesome problems will only be discovered using soft system methodologies [13].Therefore, they might be used as a complement to hard systems. In order to
202
visualize and understand soft systems, one could make use of mind-maps or sce-narios and discuss them during a workshop.
• Evolutionary Systems: This type of system applies to complex social systemsthat are able to evolve over time. However, those systems are very specific forsocial systems of individuals acting independently and are therefore not bestsuited from a process and workflow perspective.
After having decided on an improvement alternative the action is implemented andthe improvements are stored and packaged. Thereby, it is important not just to describethe action, but take the lessons learned from the overall analysis as this will providevaluable data of behavior of the process in different improvement scenarios.
7.4 Evaluation
7.4.1 Static Validation and ImplementationThe purpose of the static validation is to get early feedback from practitioners regardingimprovements and hinders in implementing the proposed approach. Another reason forpresenting the approach is to get a buy-in from the company to implement the approach[14]. In this case the method has been presented and discussed with two representa-tives from Ericsson AB in Sweden, responsible for software process improvement atthe company. The representatives have been selected as they are responsible for identi-fying improvement potential in the company’s processes, as well as to make improve-ment suggestions. Thus, they are the main stakeholders of such a method. The goalwas to receive early feedback on the cornerstones of the methodology (e.g. the goalsof the method; keeping work-load below capacity; combining different measurementdimensions; easy to understand representation of data), as well on limitations of themethod. The following feedback was given:
• The practitioners agree with the observation that the work-load should be belowthe capacity. Being below capacity is good as this, according to the practitionersexperience, makes the development flow more steady. Furthermore, a lower ca-pacity situation provides flexibility to fix problems in already released softwareproducts or in handling customization requests.
• When introducing inventory measures at the company the issue of optimizationof measures was considered early on in the approach. For example, in order to re-duce the level of inventory in requirements one could quickly write requirements
203
Chapter 7. Software Process Improvement through the Lean Measurement(SPI-LEAM) Method
and hand them over to the next phase to achieve measurement goals. In conse-quence, the company decided to consider inventories representing normal work(requirements flow) as well as quality related inventories (number of faults, andfault-slip-through). Furthermore, the company measures the number of requestsfrom customers to provide individual customizations to their systems, which isan inventory representing extra work.
• The illustration of the data (capacity vs. load) in the form of radar charts wasperceived as easy to understand by the practitioners, due to the advantages men-tioned earlier. That is, one can gain an insight of several inventories at the sametime, and observe how significant the deviation between capacity and load is.
The following limitation was observed by the practitioners: The method relies onknowing the capacity of the development in comparison to the work-load. The prac-titioners were worried that the capacity and work-load are hard to determine and arenot comparable. For example, there is a high variance in developer productivity. Eventhough a team has N developers working X hours a day the real capacity is not equalto N*X hours. Furthermore, the work-load needs to be estimated as, for example, interms of size of requirements. An estimation error would lead to an invalid analysis.
In summary, the practitioners perceived the method as useful in achieving a morelean software process. Based on the static validation and further discussions with thepractitioners an implementation plan for the method was created (see Figure 7.9).
The first two steps are related to requirements inventories. The rational for startingwith requirements was that implemented requirements provide value to the customerand thus are of highest priority in the implementation of SPI-LEAM.
The first step of the implementation plan is the creation of a web-platform to capturethe requirements flow. The platform lists the requirements in each phase and allowsthe practitioners to move requirements between phases. When a requirement is movedfrom one phase to another the date of the movement is registered. Thus, the inventorylevel at any point in time for each phase of development can be determined.
The second step is the analysis of the requirements level by measuring the numberof requirements in different phases. Complementarity to the inventory levels the data isalso the basis to conduct analysis to get further insights into how requirements evolveduring the development life-cycle. Cumulative flow diagrams were used to visualizethe flow and throughput of development. In addition, the time requirements stayed indifferent phases were illustrated in the form of box-plots. The first and second stepshave been completed and preliminary data collected in these step is presented in Section7.4.2.
In the third step the number of faults is measured in a similar manner as the re-quirements flow. The company captures the flow of fixing the faults (e.g. number of
204
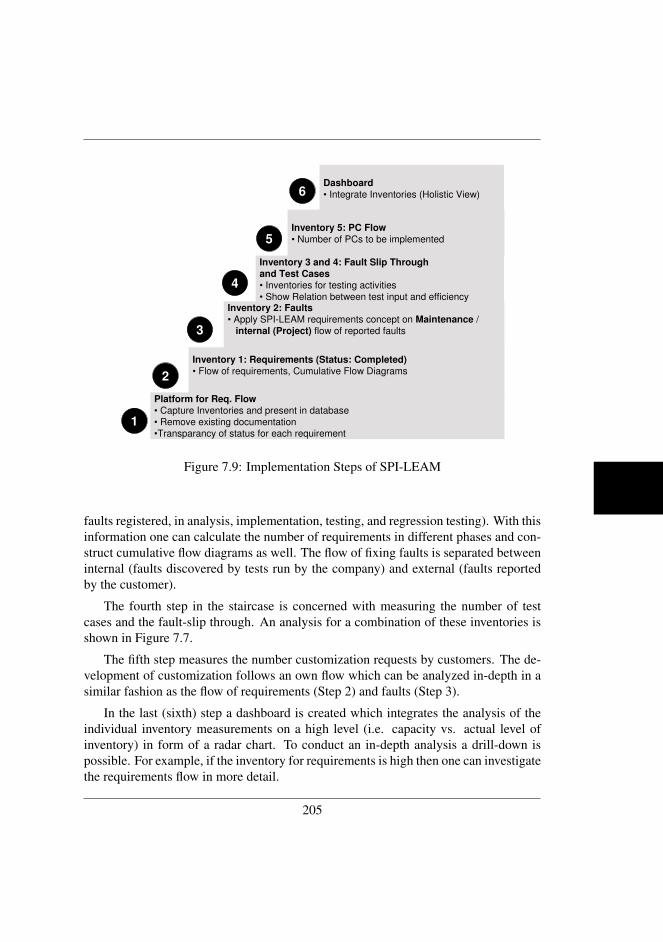
Inventory 1: Requirements (Status: Completed)• Flow of requirements, Cumulative Flow Diagrams
Inventory 2: Faults • Apply SPI-LEAM requirements concept on Maintenance /
internal (Project) flow of reported faults
Inventory 3 and 4: Fault Slip Through
and Test Cases • Inventories for testing activities
• Show Relation between test input and efficiency
Inventory 5: PC Flow
• Number of PCs to be implemented
Platform for Req. Flow• Capture Inventories and present in database
• Remove existing documentation
•Transparancy of status for each requirement
6
2
5
4
3
1
Dashboard
• Integrate Inventories (Holistic View)
Figure 7.9: Implementation Steps of SPI-LEAM
faults registered, in analysis, implementation, testing, and regression testing). With thisinformation one can calculate the number of requirements in different phases and con-struct cumulative flow diagrams as well. The flow of fixing faults is separated betweeninternal (faults discovered by tests run by the company) and external (faults reportedby the customer).
The fourth step in the staircase is concerned with measuring the number of testcases and the fault-slip through. An analysis for a combination of these inventories isshown in Figure 7.7.
The fifth step measures the number customization requests by customers. The de-velopment of customization follows an own flow which can be analyzed in-depth in asimilar fashion as the flow of requirements (Step 2) and faults (Step 3).
In the last (sixth) step a dashboard is created which integrates the analysis of theindividual inventory measurements on a high level (i.e. capacity vs. actual level ofinventory) in form of a radar chart. To conduct an in-depth analysis a drill-down ispossible. For example, if the inventory for requirements is high then one can investigatethe requirements flow in more detail.
205
Chapter 7. Software Process Improvement through the Lean Measurement(SPI-LEAM) Method
7.4.2 Preliminary Data
The requirements inventory was measured for a large-scale telecommunication prod-uct developed at Ericsson AB. The product was written in C++ and Java and consistedof over five million lines of code (LOC). Figure 7.10 shows an individual and mov-ing range (I-MR) chart for the inventory of requirements in implementation (design,coding, and testing) over time. Due to confidentiality reasons no actual values can bereported. The continuous line in the figure shows the mean value while the dashed linesshow the lower and upper control limits. The upper and lower control limits are +/−two or three standard deviations away from the mean. A value that is outside the con-trol limits indicates an instability of the process. The graph on the top of Figure 7.10shows the individual values, while the graph on the bottom shows the moving range.The moving range is calculated as MR = |Xi−Xi−1|, i.e. it shows the size of the changein X between data point i and data point i−1.
The figure for the individual values shows a large area of data points outside theupper control limit. In this time period the data indicates a very high inventory level.When presenting the inventory data to a development unit the participants of the unitconfirmed that development was fully utilized and people felt overloaded. This alsomeant that no other activity (e.g. refactoring) did take place besides the main productdevelopment. The opposite can be observed on the right-hand side of the figure wherethe data points are below the control limit. In this situation most of the requirementspassed testing and were ready for release, which meant that the development teamsidled from a main product development perspective. This time was used to solely con-centrate on activities such as refactoring. To determine the capacity of development(and with that acceptable inventory levels) we believe it is a good and practical ap-proach to visualize the inventories and discuss at which times the development teamsfelt overloaded or underloaded.
It is also interesting to look at the figure showing the moving range. A large differ-ence between two data-points is an indication for batch-behavior, meaning that manyrequirements are handed over at once. Large hand-overs also constitute a risk of anoverload-situation. From a lean perspective one should aim at having a continuousand steady flow of requirements into the development, and at the same time deliveringtested requirements continuously.
Collecting inventory data in a continuous manner also enables the use of other leananalysis tools, such as cumulative flow diagrams [32, 1]. They allow to analyze the re-quirements flow in more detail with respect to throughput and cycle times. The graphin Figure 7.11 shows a cumulative flow diagram which is based on the same data asthe control charts. The top line represents the total number of requirements in develop-ment. The line below that shows the number of requirements that have been detailed
206
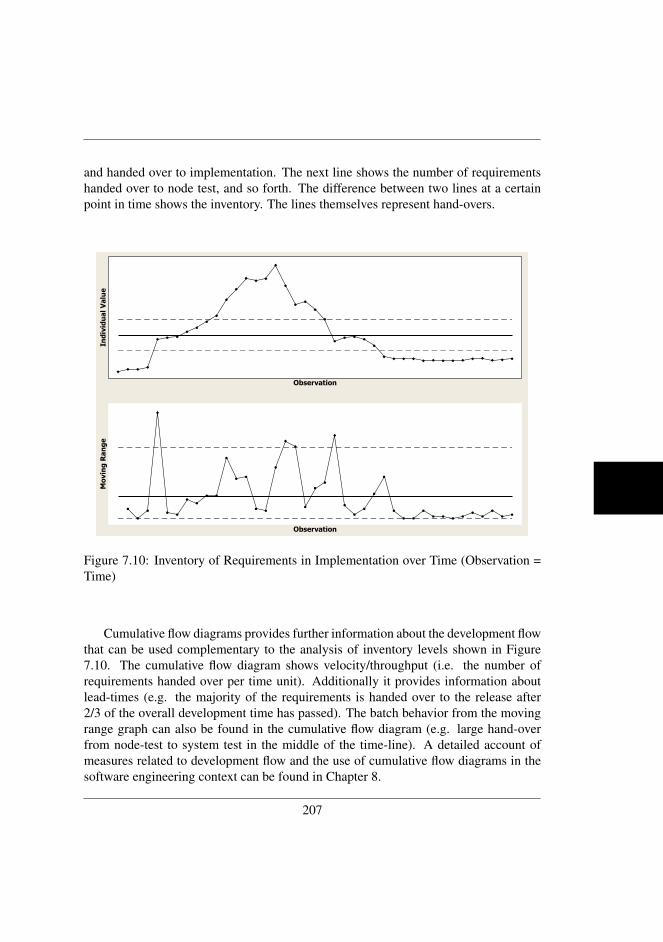
and handed over to implementation. The next line shows the number of requirementshanded over to node test, and so forth. The difference between two lines at a certainpoint in time shows the inventory. The lines themselves represent hand-overs.
Observation
Individual Value
Observation
Moving Range
1
11
11
111
11
111
1
1
1
1
1
1
1
1
1
1
1
1
1
1
11
1
1
1
1
1
Figure 7.10: Inventory of Requirements in Implementation over Time (Observation =Time)
Cumulative flow diagrams provides further information about the development flowthat can be used complementary to the analysis of inventory levels shown in Figure7.10. The cumulative flow diagram shows velocity/throughput (i.e. the number ofrequirements handed over per time unit). Additionally it provides information aboutlead-times (e.g. the majority of the requirements is handed over to the release after2/3 of the overall development time has passed). The batch behavior from the movingrange graph can also be found in the cumulative flow diagram (e.g. large hand-overfrom node-test to system test in the middle of the time-line). A detailed account ofmeasures related to development flow and the use of cumulative flow diagrams in thesoftware engineering context can be found in Chapter 8.
207
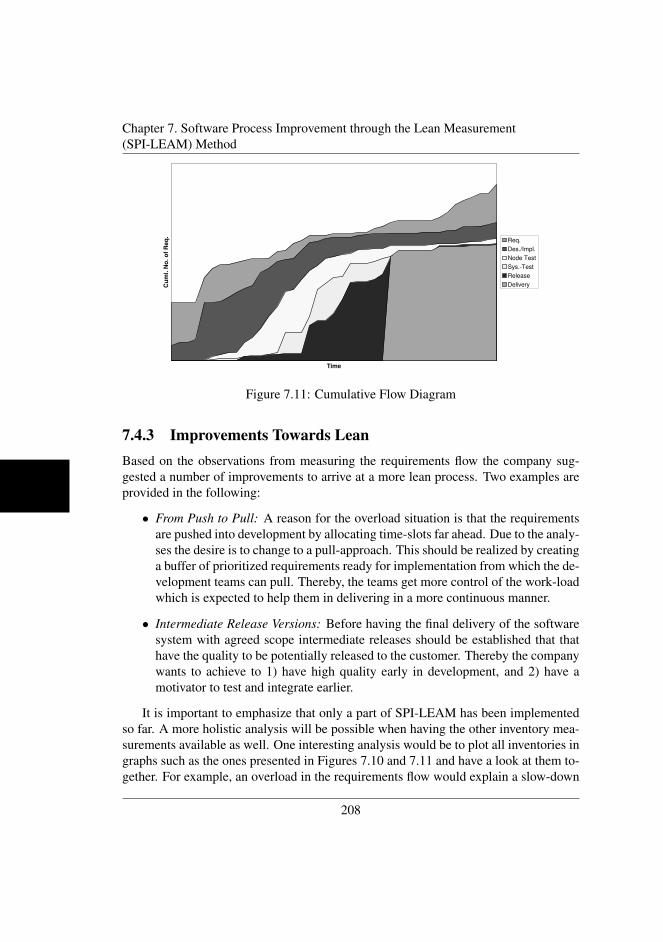
Chapter 7. Software Process Improvement through the Lean Measurement(SPI-LEAM) Method
All CS
Time
Cu
ml.
No
. o
f R
eq
.
Req.
Des./Impl.
Node Test
Sys.-Test
Release
Delivery
Figure 7.11: Cumulative Flow Diagram
7.4.3 Improvements Towards LeanBased on the observations from measuring the requirements flow the company sug-gested a number of improvements to arrive at a more lean process. Two examples areprovided in the following:
• From Push to Pull: A reason for the overload situation is that the requirementsare pushed into development by allocating time-slots far ahead. Due to the analy-ses the desire is to change to a pull-approach. This should be realized by creatinga buffer of prioritized requirements ready for implementation from which the de-velopment teams can pull. Thereby, the teams get more control of the work-loadwhich is expected to help them in delivering in a more continuous manner.
• Intermediate Release Versions: Before having the final delivery of the softwaresystem with agreed scope intermediate releases should be established that thathave the quality to be potentially released to the customer. Thereby the companywants to achieve to 1) have high quality early in development, and 2) have amotivator to test and integrate earlier.
It is important to emphasize that only a part of SPI-LEAM has been implementedso far. A more holistic analysis will be possible when having the other inventory mea-surements available as well. One interesting analysis would be to plot all inventories ingraphs such as the ones presented in Figures 7.10 and 7.11 and have a look at them to-gether. For example, an overload in the requirements flow would explain a slow-down
208
in the maintenance activities.
7.5 Discussion
7.5.1 Comparison with Related WorkA comparison with the related work allows to make two observations which indicatethe usefulness of SPI-LEAM as an extension over existing measurements in the leancontext.
First, Morgan and Liker [24] identified a mapping between root causes and waste.An interesting implication is that the occurrence of waste in fact points to the absenceof lean practices. In consequence SPI-LEAM is a good starting point to identify wastesin development continuously. Based on the results provided by SPI-LEAM an unde-sired behavior of the development becomes visible and can be further investigated withtechniques such as root cause analysis. This can be used as a motivation for manage-ment to focus on the implementation of lean practices. The transparency of the actualsituation can also provide insights helping to overcome hindering factors, such as theones reported in [18].
Secondly, Oppenheim [26] pointed out that it is important to not only focus onspeeding up the development to achieve better cycle times for the expense of quality.To reduce this risk we proposed to provide inventory measurements that can be usedto evaluate cycle times and throughput (see cumulative flow diagrams) and inventoriesrelated to quality together (flow of fixing faults). If, for example, cycle time is short-ened by reducing testing this will show positively in the cycle time, but negatively inthe fault-slip-through and the number of faults reported by the customers.
7.5.2 Practical ImplicationsThe flexibility of the method makes it usable in different contexts. That is, the methodallows companies to choose inventories that are relevant for their specific needs. Though,the only restriction is that at least one inventories should be considered that representsthe quality dimension. The risk of optimizing measures on the cost of quality is therebyreduced. In addition, we presented different alternatives of analysis approaches (hardsystems, soft systems, evolutionary systems) that companies can use to predict the ef-fect of improvement actions.
Criticism was raised regarding the determination of capacity/work-load by the prac-titioners. In order to determine the right work-load, simulation can be used, in partic-ular queuing networks and discrete event simulation (a theoretical description can be
209
Chapter 7. Software Process Improvement through the Lean Measurement(SPI-LEAM) Method
found in [5, 6]). An example of the application of discrete event simulation with queu-ing networks to determine bottlenecks in the software engineering context is shownin [16]. As mentioned earlier, there are also alternative approaches that can be usedwhich are easier and faster to realize (see description of soft systems in Section 7.3.3).Another approach is to plot inventory levels based on historical data and have a dialogwith development teams and managers about the workload situation over time.
The practitioners also perceived the analysis and prediction of the effect of im-provement actions (as shown in Figure 7.8) as theoretical, making them feel that themethod might not be practical. However, this was due to the way of illustrating themovement between states as a directed graph. In practice, one would provide a viewof the inventory levels over time illustrating them as a control chart/cumulative flowdiagram as shown in Section 7.4.2. Doing so allowed the practitioners to identify adeparture from lean practices. For example, the cumulative flow diagram derived fromthe inventory data showed that the system was not built in small and continuous in-crements. This observation helped to raise the need for a more continuous flow ofdevelopment and led the company to take actions accordingly (see Section 7.4.3). Inother words, SPI-LEAM provides facts that allow a stronger position when arguingwhy specific practices should receive more attention.
Considering the feedback from industry on the method it seems a promising newapproach to continuously improve software processes to become more lean. As themethod is an instantiation of the QIP one can leverage of the benefits connected to thatparadigm (e.g. having a learning organization due to keeping track of the experiencesmade, see last step in Figure 7.1).
7.5.3 Research ImplicationsThe related work shows that lean software engineering has been evaluated as a whole,i.e. it is not clear which tools have been applied. Furthermore, the benefit of singletools from the lean tool-box have not been evaluated so far to learn about their benefitsin software engineering contexts. Such applications also show how the methods have tobe tailored (see, for example, capacity discussion in Section 7.5.2). In general there areonly few studies in software engineering and more studies are needed which describethe context in detail in which lean was applied, as well as how lean was implementedin the companies.
Concerning SPI-LEAM, there is a need to evaluate what kind of improvement deci-sions are proposed and implemented based on the measurement results derived by themethod. This has to be followed up in the long run to see whether continuous improve-ments will be achieved in terms of making the software process more lean. In addition,SPI-LEAM has to be applied in different contexts to learn what kind of inventories
210
are the most relevant in specific contexts. For example, how does SPI-LEAM differbetween different agile processes (SCRUM or eXtreme Programming) and differentcomplexities (large products with many development teams vs. small products withfew development teams).
In conclusion, we see a high potential of lean practices improving software engi-neering. However, there is very little work done in this area so far.
7.6 Conclusion
This paper presents a novel method called Software Process Improvement throughLean Measurement (SPI-LEAM). The goals of the method are to 1) enable continu-ous software process improvement leading to a lean software process; and 2) avoidproblems related to resistance of change by improving in a continuous manner. Themethod combines the quality improvement paradigm with lean measurements.
The method is based on measuring inventories representing different dimensions ofsoftware development (normal development work, extra work, and software quality).It was exemplified how the method is used. Feedback from industry and the discussionof the method leads to the following conclusions:
• SPI-LEAM is flexible as it allows companies to choose inventories and analysismethods fitting their needs in the best way. Thus, the method should be applica-ble in many different contexts.
• The practitioners who reflected on the method agreed on how we approachedthe problem. They, for example, observed that the inventories should be belowthe capacity level. Furthermore, they agreed on the need to conduct a combinedanalysis of inventories to have a complete view of the current situation. That is,the risk of optimizing measures is drastically reduced.
In future work the impact of the method on software process improvement activ-ities is needed. The method focused on the overall process life-cycle. However, theideas could be useful for a team working on a specific development task, such as thevisualization of throughput for a single team, and a measure of cycle-time. This allowseach team to determine its own capability level. Furthermore, the analysis of relatedwork showed that generally more research on lean tools is needed.
211
REFERENCES
7.7 References[1] David Anderson. Agile management for software engineering: applying the the-
ory of constraints for business results. Prentice Hall, 2003.
[2] Victor R. Basili. Quantitative evaluation of software methodology. Technicalreport, University of Maryland TR-1519, 1985.
[3] Victor R. Basili. The experience factory and its relationship to other quality ap-proaches. Advances in Computers, 41:65–82, 1995.
[4] Victor R. Basili and Scott Green. Software process evolution at the sel. IEEESoftware, 11(4):58–66, 1994.
[5] Gunter Bolch, Stefan Greiner, Hermann De Meer, and Kishor S. Trivedi. Queu-ing networks and Markov chains: modeling and performance evaluation withcomputer science applications. Wiley, Hoboken, N.J., 2. ed. edition, 2006.
[6] Christos G. Cassandras and Stephane Lafortune. Introduction to discrete eventsystems. Kluwer Academic, Boston, 1999.
[7] Cigdem Gencel and Onur Demirors. Functional size measurement revisited. ACMTransactions on Software Engineering and Methodology, 17(3), 2008.
[8] CMMI-Product-Team. Capability maturity model integration for development,version 1.2. Technical report, CMU/SEI-2006-TR-008, 2006.
[9] Dan Cumbo, Earl Kline, and Matthew S. Bumgardner. Benchmarking perfor-mance measurement and lean manufacturing in the rough mill. Forest ProductsJournal, 56(6):25 – 30, 2006.
[10] Lars-Ola Damm, Lars Lundberg, and Claes Wohlin. Faults-slip-through - a con-cept for measuring the efficiency of the test process. Software Process: Improve-ment and Practice, 11(1):47–59, 2006.
[11] Lars-Ola Damm, Lars Lundberg, and Claes Wohlin. A model for software reworkreduction through a combination of anomaly metrics. Journal of Systems andSoftware, 81(11):1968–1982, 2008.
[12] Paolo Donzelli and Giuseppe Iazeolla. Hybrid simulation modelling of the soft-ware process. Journal of Systems and Software, 59(3):227–235, 2001.
[13] John P. Van Gigch. System design modeling and metamodeling. Plenum Press,New York, 1991.
212
[14] Tony Gorschek, Per Garre, Stig Larsson, and Claes Wohlin. A model for technol-ogy transfer in practice. IEEE Software, 23(6):88–95, 2006.
[15] Tony Gorschek and Claes Wohlin. Requirements abstraction model. Requir. Eng.,11(1):79–101, 2006.
[16] Martin Host, Bjorn Regnell, Johan Natt och Dag, Josef Nedstam, and Chris-tian Nyberg. Exploring bottlenecks in market-driven requirements managementprocesses with discrete event simulation. Journal of Systems and Software,59(3):323–332, 2001.
[17] Capers Jones. Applied software measurement: assuring productivity and quality.McGraw-Hill, New York, 1997.
[18] Christer Karlsson and Par Ahlstrohm. The difficult path to lean product develop-ment. Journal of Product Innovation Management, 13(4):283–295, 2009.
[19] Mikael Lindvall and Kristian Sandahl. Traceability aspects of impact analysis inobject-oriented systems. Journal of Software Maintenance, 10(1):37–57, 1998.
[20] Andrea De Lucia, Eugenio Pompella, and Silvio Stefanucci. Assessing effort esti-mation models for corrective maintenance through empirical studies. Information& Software Technology, 47(1):3–15, 2005.
[21] Brian Maskell and Bruce Baggaley. Practical lean accounting: a proven systemfor measuring and managing the lean enterprise. Productivity Press, 2004.
[22] Peter Middleton. Lean software development: two case studies. Software QualityJournal, 9(4):241–252, 2001.
[23] Peter Middleton, Amy Flaxel, and Ammon Cookson. Lean software managementcase study: Timberline inc. In Proceedings of the 6th International Conference onExtreme Programming and Agile Processes in Software Engineering (XP 2005),pages 1–9, 2005.
[24] James M. Morgan and Jeffrey K Liker. The Toyota product development system:integrating people, process, and technology. Productivity Press, New York, 2006.
[25] Thane Morgan. Lean manufacturing techniques applied to software development.Master’s thesis, Master Thesis at Massachusetts Institute of Technology, April1998.
213
REFERENCES
[26] Bohdan W. Oppenheim. Lean product development flow. Systems Engineering,7(4):352–376, 2004.
[27] Emma Parnell-Klabo. Introducing lean principles with agile practices at a fortune500 company. In Proceedings of the AGILE Conference (AGILE 2006), pages232–242, 2006.
[28] Richard T. Pascale. Managing on the edge: how the smartest companies useconflict to stay ahead. Simon and Schuster, New York, 1990.
[29] G.I.U.S. Perera and M.S.D. Fernando. Enhanced agile software development hy-brid paradigm with lean practice. In Proceedings of the International Conferenceon Industrial and Information Systems (ICIIS 2007), pages 239–244, 2007.
[30] Kai Petersen, Claes Wohlin, and Dejan Baca. The waterfall model in large-scaledevelopment - state of the art vs. industrial case study. In Proceedings of the 10thInternational Conference on Product Focused Software Development and ProcessImprovement (PROFES 2009), pages 386-400, 2009.
[31] Mary Poppendieck and Tom Poppendieck. Lean software development: an agiletoolkit. Addison-Wesley Professional, 2003.
[32] Donald G Reinertsen. Managing the design factory: a product developers toolkit.Free, New York, 1997.
[33] Shigeo Shingo. Study of Toyota production system from the industrial engineeringviewpoint. Japanese Management Association, 1981.
[34] James P. Womack and Daniel T. Jones. Lean thinking: banish waste and createwealth in your corporation. Free Press Business, London, 2003.
[35] Xiaochun Zhu, Bo Zhou, Li Hou, Junbo Chen, and Lu Chen. An experience-based approach for test execution effort estimation. In Proceedings of the 9thInternational Conference for Young Computer Scientists (ICYCS 2008), pages1193 – 1198, 2008.
214
Chapter 8
Measuring the Flow of LeanSoftware Development
Kai Petersen and Claes WohlinSoftware: Practice and Experience, in print
8.1 Introduction
Agile software development aims at being highly focused and responsive to the needsof the customer [16, 3]. To achieve this practices like on-site customer and frequentreleases to customers can be found in all agile practices. Agile practices can be fur-ther enhanced by adopting practices from lean manufacturing. Lean manufacturingfocuses on (1) the removal of waste in the manufacturing process; and (2) analyzingthe flow of material through the manufacturing process (cf. [4, 36, 27]). Both aid theresponsiveness to customer needs that agile seeks to achieve. Firstly, removing waste(everything that does not contribute to customer value) frees resources that can be fo-cused an value-adding activities. Secondly, analyzing the flow of development aids inevaluating progress and identifying bottlenecks.
For the removal of waste and the improvement of the flow it is important to under-stand the current status in terms of waste and flow, which is supported by visualizingand measuring it. Improving the flow means shorter lead-times and thus timely deliverof value to the customer. In manufacturing cumulative flow diagrams have been pro-
215
Chapter 8. Measuring the Flow of Lean Software Development
posed to visualize the flow of material through the process [29]. Such a flow diagramshows the cumulative number of material in each phase of the manufacturing process.To the best of our knowledge, only one source has proposed to analyze the flow ofsoftware development through flow-diagrams by counting customer-valued functions[1]. However, the usefulness of cumulative flow diagrams has not yet been empiricallyevaluated.
The novel contributions of this paper are: (1) The definition of measures to assessthe flow of lean software development with the goals of increasing throughput and cre-ating the transparency of the current status of product development; (2) The evaluationof the visualization combined with the proposed measures in an industrial context.
The case studied was Ericsson AB in Sweden. The units of analysis were ninesub-systems developed at the case company. The structure of the case study designwas strongly inspired by the guidelines provided in Yin [37] and Runeson and Host[31]. The data collection started recently and therefore cannot be used to see long-termtrends in the results of the measurements. Though, the case study was already able toillustrate how the measures could influence decision making, and how the measurescould be used to drive the improvement of the development flow.
The following measures were defined:
• A measure to detect bottlenecks.
• A measure to detect how continuous the requirements flow through the develop-ment process.
• A cost-model separating investment, work done, and waste.
The evaluation of the model showed that practitioners found the model easy touse. They agreed on its usefulness in influencing their management decisions (e.g.when prioritizing requirements or assigning people to tasks). Furthermore, differentmanagers integrated the measures quickly in their work-practice (e.g. using the mea-surement results in their status meetings). However, the quantification of the softwareprocess improvements that can be achieved with the model can only be evaluated whencollecting the data over a longer period of time.
The remainder of the paper is structured as follows: Section 8.2 presents relatedwork. Thereafter, Section 8.3 provides a brief overview of cumulative flow diagramsfor visualizing the flow as well as the measures identifying bottlenecks, continuityof the requirements flow, and cost distribution. Section 8.4 illustrates the researchmethod used, including a description of the case, a description of how the measureswere evaluated, and an analysis of validity threats. The results are presented in Section8.5, including the application of the measures on the industrial data, and the evaluation
216
of usefulness of the measures. The practical and research implications are discussed inSection 8.6. Section 8.7 concludes the paper.
8.2 Related WorkThe related work covers three parts. First, studies evaluating lean software develop-ment empirically are presented. Secondly, measures are presented which are used inmanufacturing to support and improve lean production. These are used to comparethe measures defined within this case study with measures used in manufacturing, dis-cussing the difference due to the software engineering context (see Section 8.6.3). Thethird part presents literature proposing lean measures in a software engineering context.
8.2.1 Lean in Software EngineeringThe software engineering community became largely aware of lean principles and prac-tices in software engineering through Poppendieck and Poppendieck [27] who illus-trated how many of the lean principles and practices can be used in a software en-gineering context. Lean software development shares principles with agile regardingpeople management and leadership, the focus on quality and technical excellence, andthe focus on frequent and fast delivery of value to the customer. What distinguisheslean from agile is the focus on the end to end perspective of the whole value flowthrough development, i.e. from very early concepts and ideas to delivery of softwarefeatures. To support the end to end focus lean proposed a number of tools to analyzeand improve the value flow, such as value stream mapping [21], inventory management[1], and pull systems such as Kanban [12]. Value stream mapping visualizes the devel-opment life-cycle showing processing times and waiting times. Inventory managementaims at limiting the work in process as partially done work does not provide value.Methods to support inventory management are theory of constraints [1] and queuingtheory [14]. Push systems allocate time for requirements far ahead and often overloadthe development process with work. In contrast pull systems allow software teams totake on new tasks whenever they have free capacity. If possible, high priority tasksshould be taken first.
Middleton [18] conducted two industrial case studies on lean implementation insoftware engineering, and the research method used was action research. The companyallocated resources of developers working in two different teams, one with experienceddevelopers (case A) and one with less experienced developers (case B). The practition-ers responded that initially the work was frustrating as errors became visible almostimmediately and were to be fixed right away. In the long run though the number of
217
Chapter 8. Measuring the Flow of Lean Software Development
errors dropped dramatically. However, after using the lean method the teams were notable to sustain it due to organizational hierarchy, traditional promotion patterns, andthe fear of forcing errors into the open.
Another case study by Middleton et al. [19] studied a company practicing lean intheir daily work for two years. They found that the company had many steps in theprocess not adding value. A survey among people in the company showed that themajority supported lean ideas and thought they can be applied to software engineering.Only a minority (10 %) was not convinced of the benefits of lean software develop-ment. Statistics collected at the company showed a 25 % gain in productivity, scheduleslippage was reduced to 4 weeks from previously months or years, and time for defectfixing was reduced by 65 % - 80 %. The customer response on the product releasedusing lean development was overwhelmingly positive.
Perera and Fernando [24] compared an agile process with a hybrid process of agileand lean in an experiment involving ten student projects. One half of the projectswas used as a control group applying agile processes. A detailed description of howthe processes differed and which practices were actually used was not provided. Theoutcome was that the hybrid approach produced more lines of code and thus was moreproductive. Regarding quality, early in development more defects were discovered withthe hybrid process, but the opposite trend was found in later phases, which confirmsthe findings in [18].
Parnell-Klabo [22] followed the introduction of lean and documented lessons learnedfrom the introduction. The major obstacles were to obtain open office space to locateteams together, gain executive support, and training and informing people to reduceresistance of change. After successfully changing with the help of training workshopsand the use of pilot projects positive results were obtained. The lead-time for deliverywas decreased by 40% - 50%. Besides having training workshops and pilots and sit-ting together in open office-landscapes, having good measures to quantify the benefitsof improvements are key.
Overall, the results show that lean principles may be beneficial in a software en-gineering context. Thus, further evaluation of lean principles is needed to understandhow they affect the performance of the software process. Though, the studies did notprovide details on which lean principles and tools were used, and how they were im-plemented. None of the studies focused on evaluating specific methods or principles ofthe lean tool-box. However, in order to understand how specific principles and meth-ods from lean manufacturing are beneficial in software engineering, they have to betailored and evaluated. This case study makes a contribution by implementing cumula-tive flow diagrams in industry, defining measures to analyze the development flow, andevaluating the cumulative flow diagrams and defined measures.
218
8.2.2 Lean Performance Measures in ManufacturingA number of lean process measures have been proposed for manufacturing. Maskelland Baggaley [17] summarize performance measures for lean manufacturing. As thispaper is related to measuring the flow of development we focus the related work onmeasurement of throughput:
• Day-by-the-Hour (DbtH): Manufacturing should deliver at the rate the customersdemand products. This rate is referred to as takt-time. The measure is calculatedas
DbtH =#quantity
#hours(8.1)
where the quantity is the number of items produced in a day, and the hours thenumber of hours worked to produce the units. The rate should be equal to thetakt-rate of demand.
• Capacity utilization (CU): The work in process (WIP) is compared to the capac-ity (C) of the process. CU is calculated as:
CU =WIP
C(8.2)
If CU > 1 then the work-load is too high, and if CU < 1 then the work-load istoo low. A value of 1 is ideal.
• On-time-delivery (OTD): Delivery precision is determined by looking at thenumber of late deliveries in relation to the total deliveries ordered:
OT D =#late deliveries
#deliveries ordered(8.3)
8.2.3 Lean Performance Measures in Software EngineeringAnderson [1] presents the measures cost efficiency and value efficiency, as well asdescriptive statistics to analyze the flow in software development. From a financial(accounting) perspective he emphasizes that a cost perspective is not sufficient as costaccounting assumes that value is always created by investment. However, this ignoresthat cost could be waste and does not contribute to the value creation for the customer.In contrast to this throughput accounting is more sufficient to measure performance asit explicitly considers value creation.
In cost accounting one calculates the cost efficiency (CE) as the number of units de-livered (LOC) divided by the input person hours (PH). Though, this assumes that there
219
Chapter 8. Measuring the Flow of Lean Software Development
is a linear relationship between input and output, meaning that the input is invariable[1]. However, developers are not machines as they are knowledge workers. Therefore,this equation is considered insufficient for software production.
CE =∆LOC
PH(8.4)
Therefore, the value created over time is more interesting from a lean perspective,referred to as value efficiency (VE). It is calculated as the difference of the value ofoutput Vout put and value of input Vinput within the time-window ∆t (see Equation 8.5)[1]. The input Vinput represents the investment to be made to obtain the unit of input tobe transformed in the development process, the value Vout put represents the value of thetransformed input, i.e. final product. Furthermore, Vinput considers investment in toolsand equipment for development.
V E =Vout put −Vinput
∆t(8.5)
In addition to throughput accounting Anderson [1] presents descriptive statistics toevaluate lean performance. Plotting the cumulative number of items in inventory indifferent phases helps determining whether there is a continuous flow of the inventory.How to implement and use this technique as a way to determine process performancein incremental development is shown in the next section.
8.3 Visualization and MeasuresThis section presents our solution for measuring the flow of lean software developmentbased on cumulative flow diagrams. First, cumulative flow diagrams are introducedand thereafter the measures quantifying the diagrams are presented.
8.3.1 Visualization with Cumulative Flow DiagramsCumulative flow diagrams show how many units of production travel through the man-ufacturing process in a specific time window. In software engineering, it is of interestto know how many requirements are processed in a specific time window for a specificphase of development. A sketch of this is shown in Figure 8.1 with terms from thestudied organization.
The x-axis shows the time-line and the y-axis shows the cumulative number ofrequirements having completed different phases of development. For example, the lineon the top represents the total number of requirements in development. The line below
220
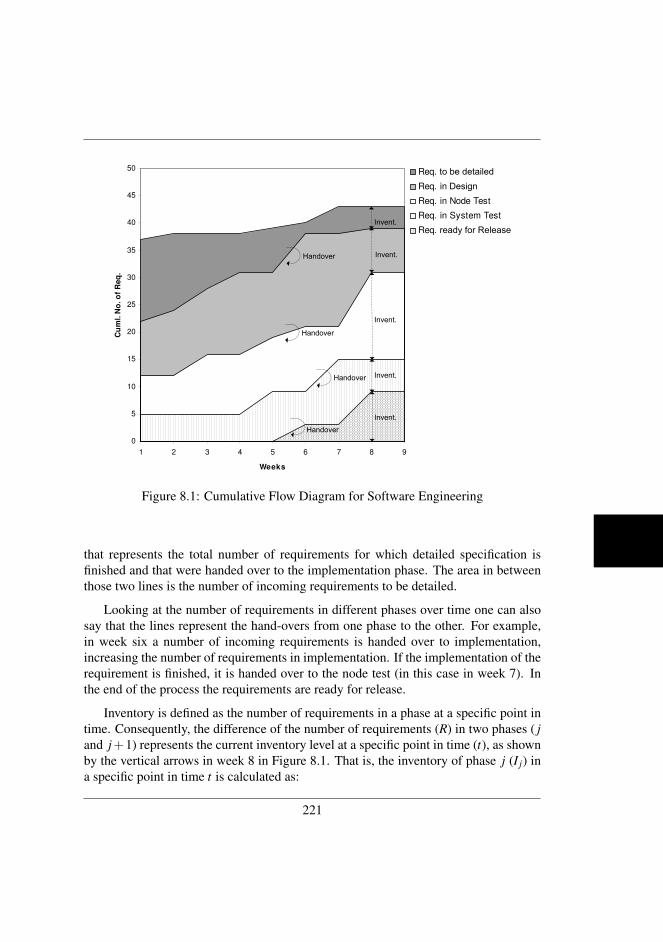
0
5
10
15
20
25
30
35
40
45
50
1 2 3 4 5 6 7 8 9
Weeks
Cu
ml. N
o. o
f R
eq
.
Req. to be detailed
Req. in DesignReq. in Node Test
Req. in System Test
Req. ready for Release
Figure 8.1: Cumulative Flow Diagram for Software Engineering
that represents the total number of requirements for which detailed specification isfinished and that were handed over to the implementation phase. The area in betweenthose two lines is the number of incoming requirements to be detailed.
Looking at the number of requirements in different phases over time one can alsosay that the lines represent the hand-overs from one phase to the other. For example,in week six a number of incoming requirements is handed over to implementation,increasing the number of requirements in implementation. If the implementation of therequirement is finished, it is handed over to the node test (in this case in week 7). Inthe end of the process the requirements are ready for release.
Inventory is defined as the number of requirements in a phase at a specific point intime. Consequently, the difference of the number of requirements (R) in two phases ( jand j +1) represents the current inventory level at a specific point in time (t), as shownby the vertical arrows in week 8 in Figure 8.1. That is, the inventory of phase j (I j) ina specific point in time t is calculated as:
221
Chapter 8. Measuring the Flow of Lean Software Development
I j,t = R j,t −R j+1,t (8.6)
8.3.2 Measures in Flow Diagrams
The flow diagrams were analyzed with the aim of arriving at useful performance mea-sures to increase throughput. Before presenting the actual measurement solution weshow how we constructed the measures with the aid of the GQM approach [2]. TheGQM approach follows a top-down strategy. First, goals were defined which should beachieved. Thereafter, questions were formulated that have to be answered to achievethe goals. In the last step, the measures were identified that need to be collected inorder to answer the question. The GQM was executed as follows:
1. The company drove the analysis by identifying the goals to improve throughputin order to reduce lead-time and improve the responsiveness to customer needs.
2. Based on the goals the two authors of the paper individually derived questionsand measures considering the goal and having the data of the cumulative flowgraphs available. Thereafter, the authors discussed their measures and agreed onthe questions and measurements to present to the case company. Both authorsidentified similar measures.
3. The measures as well as the results of their application were presented to ananalysis team responsible for implementing lean measurement at the company.In the meeting with the analysis team the measures were discussed and feedbackwas given on the measures in an open discussion (see Section 8.4.5). The recep-tion among the practitioners regarding the cumulative flow diagrams was alsopositive.
The goals identified in the first step were:G1: increase throughput in order to reduce lead-times and improve responsiveness
to customers’ needs. Throughput is important due to dynamic markets and rapidlychanging customer requirements. This is specifically true in the case of the companywe studied. In consequence, started development work becomes obsolete if it is notquickly delivered to the customer.
G2: show the current progress/status of software product development. Showingthe current status and progress of development in terms of flow allows management totake corrective actions for improving the flow.
Related to these goals the following questions were used to identify the measures:
222
Q1: Which phase in the development flow is a bottleneck? A bottleneck is a sin-gle constraint in the development process. Resolving this constraint can significantlyincrease the overall throughput. Bottleneck detection allows to continuously improvethroughput by applying the following steps: (1) identify the constraint, (2) identify thecause of the constraint, (3) remove the constraint, (4) go to step (1) [1].
Q2: How even is the workload distributed over time in specific phases? Workloadthroughout the development life-cycle of the software development process should becontinuous. That means, one should avoid situations where requirements are handedover between phases in large batches (see, for example, the hand-over in Figure 8.1where a large batch is handed over in week seven from implementation to node test).Large batches should be avoided for two main reasons. First, when having large batchesthere has to be a time of little activity before the batch is handed over. That means,defects introduced during that time are not detected immediately as they have to waitfor the hand-over to the next phase for detection. Defects that are discovered late aftertheir introduction are expensive to fix because investigating them is harder [27, 1].Secondly, one would like to avoid situations where phases (e.g. requirements, coding,or testing) are overloaded with work at one time, and under-loaded at another time.As discussed in [19, 27, 25] early fault detection and a continuous work-load are anintegral part of lean as well as agile software development to assure the reduction ofwaste, and quick responsiveness to customer needs.
Q3: Where can we save cost and take work-load off the development process? Thisquestion connects directly to waste, showing in which part of the development life-cycle waste has been produced. The focus of improvement activities should be on theremoval of the most significant type of waste.
We would like to point out that RQ1 and RQ2 are not the same thing from a the-oretical perspective. It is possible to have a similar throughput of requirements in twophases, but still one phase can deliver continuously while the other delivers in batches.This is further discussed in Section 8.6.
Measures to Quantify Bottlenecks
The derivation of metrics is driven by the questions formulated before. For each ques-tion (and by looking at the diagrams) we identified the measures.
Q1: Which phase in the development flow is a bottleneck? A bottleneck would existif requirements come into one phase (phase j) in a higher rate than they can be handedover to the next phase (phase j + 1). In Figure 8.1 an example of a bottleneck can befound. That is, the rate in which requirements are handed over from implementation tonode test seems to be higher than from node test to system test. This indicates that thenode test phase is a bottleneck. To quantify the bottleneck we propose linear regression
223
Chapter 8. Measuring the Flow of Lean Software Development
to measure the rate of requirements flow for each phase. Linear regression modelswith two variables are used to predict values for two correlated variables. In our casethe variables are Weeks and Cumulative Number of Requirements. The linear functionrepresents the best fit to the observed data set. To determine the linear function the leastsquare method is commonly used [20]. Furthermore, when the linear regression modelis created, it can be observed that there is a difference between the actual observationsand the regression line, referred to as the estimation error ε. This leads to the followingformula:
y = f (x) = β0 +β1 ∗ x+ ε (8.7)
When conducting the actual prediction of the parameters, β0 and β1 are estimatedas those represent the linear regression function. For the analysis of the bottlenecksthe predicted variable β1 is important, representing the slope of the linear functions.The measure for the bottleneck is thus defined as follows: If the slope of phase j(slope is referred to as β j) is higher than the slope of the subsequent phases (β j+p) thenphase j is a bottleneck in the process. Though, it is important to note that the causeof the bottleneck is not necessarily to be found in phase j. To show the results of themeasurement to management we propose to draw bar-plots of the slope which are wellsuited to illustrate the severity of the difference between phases.
Example: Let’s assume a situation where the current inventory level of require-ment in the specification phase S is 10 (IS = 10). The regression of the incomingrequirements of the last four weeks was βinc,S = 3, and for the outgoing requirementsβout,S = 1. This leads to the following functions over time (t = weeks) for incomingand outgoing requirements: finc,S(t) = 3t + 10 and fout,S(t) = 1t + 10. If in the fol-lowing four weeks the rates do not change then the inventory level (and with that workin process) will almost double, as finc,S(4) = 22 and fout,S(4) = 14. This leads to anew inventory level of IS = 18. Depending on the available capacity this might leadto an overload situation indicating that actions have to be taken to avoid this rate ofincreasing inventory.
Measures to Quantify Workload Distribution Over Time
Q2: How even is the workload distributed over time in specific phases? Examplesfor an uneven work-flow can also be found in Figure 8.1. Continuous flow meansthat the number of requirements handed over at different points in time varies. Forexample, high numbers of requirements were handed over from incoming requirementsto implementation in weeks two to four and week five, while there is few hand-overs inthe remaining weeks. In comparison the variance of the flow of incoming requirements
224
is lower. In order to quantify how continuous the flow of development is we proposeto use the estimation error ε. The estimation error represents the variance around theprediction line of the linear regression, i.e. the difference between the observed andpredicted values. The estimation error εi is calculated as follows:
εi = yi− yi (8.8)
For the analysis the mean estimation error is of interest. In the case of our mea-surements i in the equation would be the week number. The estimation error shouldalso be plotted as bar-plots when shown to management as this illustrates the severityof differences well.
Example: Let’s assume that the variance in hand-overs from the specification phaseto the development teams was very high in the last few month based on the average ofestimation errors ε. Hence, hand-overs come in batches (e.g. in one week 15 require-ments are handed over, while in the previous weeks only 3 requirements were handedover). High variances make the development harder to predict. In a perfectly even flowall observed data points would be on the prediction line, which would only be the casein a completely predictable environment.
Measures of Cost Related to Waste
Q3: Where can we save cost and take work-load off the development process? In orderto save costs the costs need to be broken down into different types. We propose to breakthem down into investment (I), work done (WD), and waste (W) at a specific point intime (i) and for a specific phase (j), which leads to the following equation:
Ci, j = Ii, j +WDi, j +Wi, j (8.9)
The components of the cost model are described as follows:
• Investment (I): Investment is ongoing work that will be delivered to the nextphase in the future (i.e. considered for upcoming increments to be released tothe market). As long as it is potentially delivered it will be treated as investmentin a specific phase j.
• Work done (WD): Work done is completed work in a phase, i.e. what has beenhanded over from phase j to phase j +1.
• Waste (W): Waste is requirements that are discarded in phase j. That means workhas been done on them, but they are not further used in the future; i.e. they willnever make it into a release to customers.
225
Chapter 8. Measuring the Flow of Lean Software Development
An overview of a cost table for one specific point in time is shown in Table 8.1.For each phase j at time i and type of cost (I, WD, and C) the number of requirementsis shown. At the bottom of the table the sums of the types of cost is calculated acrossphases ( j = 1, ...n).
Table 8.1: CostsPhase ( j) Investment (I) Work Done (WD) Waste (W) Cost (C)
j = 1 r1,I r1,WD r1,W r1,Cj = 2 r2,I r2,WD r2,W r2,C
......
......
...j = n rn,I rn,WD rn,W rn,C
all ∑nj=1 r j,I ∑
nj=1 r j,WD ∑
nj=1 r jW ∑
nj=1 r j,C
When analyzing a time-frame (e.g. month) the average waste for the time-frameshould be calculated. For example, if the points in time (i, . . . ,m) are weeks in a giveninterval (i = 1 being the first week of the interval, and m being the last week) wecalculate the average across phases as:
Cavg,all =∑
mi=1 ∑
nj=1 ri, j,I
m+
∑mi=1 ∑
nj=1 ri, j,WD
m+
∑mi=1 ∑
nj=1 ri, j,W
m(8.10)
For an individual phase j we calculate:
Cavg, j =∑
mi=1 ri, j,I
m+
∑mi=1 ri, j,WD
m+
∑mi=1 ri, j,W
m(8.11)
This summary allows to observe the average distribution of I, WD, and W withinthe selected time-frame for the analysis. In order to present the data to management,we propose to also calculate the percentages to show the distribution between types ofcosts. Besides being a detector for waste, this information can be used as an indicatorfor progress. If the investment is always much higher than the work-done in consecu-tive phases that means that the investment is not transferred into a work-product for theinvestigated phase(s).
Example: Let’s assume a cost distribution for the implementation phase of Cimp =9+100+200. The distribution shows that few new requirements are available as inputfor implementation phase (I = 9), and that implementation has completed most of thework (WD = 100). Consequently there is a risk that the implementation phase does not
226
have enough input to work with in the future. Furthermore, the cost distribution showsthat the majority of the requirements was discarded (W = 200). For the requirementsand implementation phase this means that work done (requirements specification, re-view, coding and unit testing) on the discarded requirements does not end up in the endproduct. Too much of the cost is put on requirements that are never delivered and itshows that actions have to be taken in the future to minimize these types of costs.
8.4 Research MethodCandidate research methods for our research questions were design science [13], ac-tion research [32], and case study [9, 37]. Design science proposes that artifacts (inthis case measures) should be created and evaluated. One way to evaluate the artifactsis case study. Hence, design science and case study complement each other. An alter-native to case study is action research, also suitable to answer our research questions.However, this would require the researcher to work with the teams and managers usingour proposed solution continuously which was not feasible. In consequence, the re-search method used is an embedded case study allowing to observe and understand theusefulness of the proposed solution. Embedded means that within the case (Ericsson)different embedded units (the process flow for different sub-systems being developed)were analyzed. The design of the case study is strongly inspired by the guidelines pro-vided in Yin [37] and Runeson and Host [31]. We used Yin’s guidelines in identifyingthe case and the context, as well as the units of analysis. Yin provides an overviewof potential validity threats relevant for this case study and stresses the importance oftriangulation, i.e. to consult different data sources, such as documentation, quantitativedata and qualitative data from workshops, interviews, or observations.
8.4.1 Research ContextEricsson AB is a leading and global company offering solutions in the area of telecom-munication and multimedia. Such solutions include products for telecommunicationoperators, multimedia solutions and network solutions. The company is ISO 9001:2000certified. The market in which the company operates can be characterized as highlydynamic with high innovation in products and solutions. The development model ismarket-driven, meaning that the requirements are collected from a large base of poten-tial end-customers without knowing exactly who the customer will be. Furthermore,the market demands highly customized solutions, specifically due to differences in ser-vices between countries. The following agile practices are used: continuous integra-tion, internal and external releases, time-boxing with sprints, face-to-face interaction
227
Chapter 8. Measuring the Flow of Lean Software Development
(stand-up meetings, co-located teams), requirements prioritization with metaphors anddetailed requirements (digital product backlog), as well as refactoring and system im-provements. Version control is handled with ClearCase [33] and TTCN3 [34] is usedfor test automation. Documentation and faults are tracked in company proprietarytools.
8.4.2 Case DescriptionThe case being studied was Ericsson in Sweden and India. On a high level all systemswere developed following the same incremental process model illustrated in Figure 8.2.The numbers in the figure are mapped to the following practices used in the process.
• Prioritized requirements stack (1) and anatomy plan (2): The company continu-ously collects requirements from the market and prioritizes them based on theirimportance (value to the customer) and requirements dependencies (anatomyplan). Requirements highest in the priority list are selected and packaged to beimplemented by the development teams. Another criterion for packaging therequirements is that they fit well together. The anatomy plan also results in anumber of baselines (called last system versions, LSV) and determines whichrequirement packages should be included in different baselines.
• Small projects time line (3): The requirements packages are handed over to thedevelopment projects implementing and unit testing the increments of the prod-uct. The projects last approximately three months and the order in which theyare executed was determined in the previous two steps.
• Last system version (4): As soon as the increment is integrated into the sub-system a new baseline is created (LSV). Only one baseline exists at one point intime. The last version of the system is tested in predefined testing cycles and it isdefined which projects should be finished in which cycle. When the LSV phasehas verified that the sub-system works and passed the LSV test with the overallsystem the sub-system is ready for release.
• Potential release (5): Not every potential release has to be shipped to the cus-tomer. Though, the release should have sufficient quality to be possible to releaseto customers.
Overall the process can be seen as a continuously running factory that collects,implements, tests, and releases requirements as parts of increments. When a releaseis delivered the factory continuous to work on the last system version by adding new
228
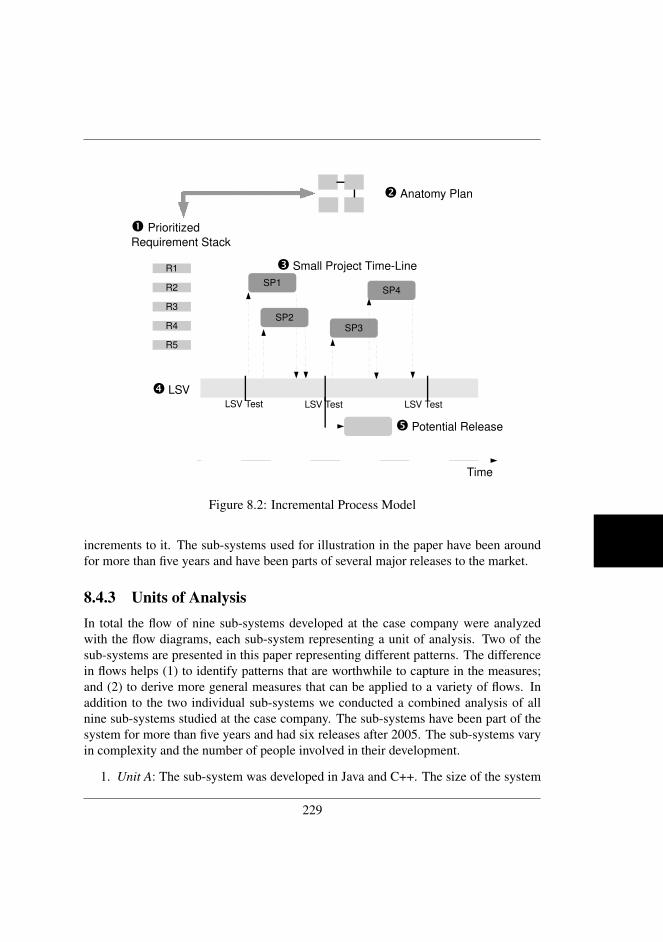
R1
R2
R3
R4
R5
Anatomy Plan
Prioritized Requirement Stack
Time
SP1
SP2SP3
SP4
Small Project Time-Line
LSV LSV Test LSV Test LSV Test
Potential Release
Figure 8.2: Incremental Process Model
increments to it. The sub-systems used for illustration in the paper have been aroundfor more than five years and have been parts of several major releases to the market.
8.4.3 Units of AnalysisIn total the flow of nine sub-systems developed at the case company were analyzedwith the flow diagrams, each sub-system representing a unit of analysis. Two of thesub-systems are presented in this paper representing different patterns. The differencein flows helps (1) to identify patterns that are worthwhile to capture in the measures;and (2) to derive more general measures that can be applied to a variety of flows. Inaddition to the two individual sub-systems we conducted a combined analysis of allnine sub-systems studied at the case company. The sub-systems have been part of thesystem for more than five years and had six releases after 2005. The sub-systems varyin complexity and the number of people involved in their development.
1. Unit A: The sub-system was developed in Java and C++. The size of the system
229
Chapter 8. Measuring the Flow of Lean Software Development
was approximately 400,000 LOC, not counting third party libraries.
2. Unit B: The sub-system was developed in Java and C++, the total number ofLOC without third party libraries was 300,000.
The nine sub-systems together had more than 5,000,000 LOC. The developmentsites at which the sub-systems were developed count more than 500 employees di-rectly involved in development (including requirements engineering, design, and de-velopment) as well as administration and configuration management.
8.4.4 Research Questions
We present the research questions to be answered in this study, as well as a motivationwhy each question is of relevance to the software engineering community.
• Research question 1 (RQ1): Which measures aid in (1) increasing throughputto reduce lead-times, and (2) as a means for tracking the progress of develop-ment? The aim is to arrive at measures that are generally applicable and suitableto increase throughput and track the progress of development. As argued before,throughput and lead-times are highly important as customer needs change fre-quently, and hence have to be addressed in a timely manner. Thus, being ableto respond quickly to customer needs is a competitive advantage. In additionknowing the progress and current status of complex software product develop-ment should help to take corrective actions when needed, and identify the needfor improvements.
• Research question 2 (RQ2): How useful are the visualization and the derivedmeasures from an industrial perspective? There is a need to evaluate the vi-sualization (cumulative flow diagrams) and the measures in industry to provideevidence for their usefulness. For this purpose the following sub-questions areaddressed in the evaluation part of this study:
– Research question 2.1: How do the visualization/measures affect decisionmaking?
– Research question 2.2: What improvement actions in the development pro-cesses do practitioners identify based on the visualization and measures?
– Research question 2.3: How should the visualization and the measures beimproved for practical use?
230
8.4.5 Data CollectionCollection of Data for Visualization and Measurements
The current status (i.e. the phase in which the requirements resides) was maintained ina database. Whenever the decision was taken to move a requirement from one phaseto the next this was documented by a time-stamp (date). With this information theinventory (number of requirements in a specific phase at any point in time) could becalculated.
After the initial data entry documenting the current status of requirements the mainauthor and the practitioners reviewed the data for accuracy and made updates to thedata when needed. From thereon the practitioners updated the data continuously keep-ing it up-to-date. To assure that the data was updated on a regular basis, we selectedpractitioners requiring the status information of requirements in their daily work andwho were interested in the visualization results (cumulative flow diagrams) and mea-surements. The following five inventories were measured in this study:
• Number of incoming requirements: In this phase the high level requirementsfrom the prioritization activity (see practice 1 in Figure 8.2) have to be detailedto be suitable as input for the design and implementation phase.
• Number of requirements in design: Requirements in this phase need to be de-signed and coded. Unit testing takes place as well. This inventory representsthe requirements to be worked on by the development teams, corresponding topractice 3 in Figure 8.2. After the requirements are implemented they are handedover to the LSV test for system testing.
• Number of requirements in LSV test (node and system): These inventories mea-sure the number of requirements that have to be tested in the LSV. The LSVtest is done in two steps, namely node LSV (testing the isolated sub-system) andsystem LSV (testing the integration of sub-systems) measured as two separate in-ventories. When the LSV test has been passed the requirements are handed overto the release project. This inventory corresponds to practice 4 in the processshown in Figure 8.2.
• Number of requirements available for release: This inventory represents thenumber of requirements that are ready to be released to the customer. It is impor-tant to mention that the requirements can be potentially released to the customer,but they do not have to (see Practice 5 in Figure 8.2). After the requirementshave been released they are no longer in the inventories that represent ongoingwork.
231
Chapter 8. Measuring the Flow of Lean Software Development
Only ongoing work was considered in the analysis. As soon as the requirementswere released they were removed from the diagrams. The reason is that otherwise thenumber of requirements would grow continuously, making the diagrams more or lessunreadable and harder to compare over time.
Collection of Qualitative Data on Usefulness of Visualization and Measures
The result of the evaluation answered research question 2, including the two sub-questions to be answered (research question 2.1 and 2.2).
Research question 2.1: In order to answer research question 2.1 a workshop wasconducted by an external facilitator (a consulting company represented by three consul-tants running the workshop), where the researcher acted as a participant and observerin the workshop. In addition to identifying the effect of the measures on the decisionmaking in the company, the workshop was also used to reflect on possible improve-ments and measures complementary to the ones identified in this study. During theworkshop the participants first noted down the roles that are affected by the measures.Those were clustered on a pin-board and the roles were discussed to make sure thateveryone had the same understanding of the responsibilities attached to the identifiedroles. Thereafter, each participant noted down several effects that the measures haveon the decision makers. The effects were discussed openly in the workshop. The re-searcher took notes during the workshop. In addition to that the external facilitatorprovided protocols of the workshop session.
Research question 2.2 and 2.3: These research questions were answered by partic-ipating in regular analysis meetings run by the company once or twice a month. Thepurpose of these meetings was to reflect on the usefulness of the measures as well ason the actual results obtained when measuring the flow of the company. During themeetings it was discussed (1) how the measurement results can be interpreted and im-proved, and (2) what improvement actions can be taken based on the measurementresults. The researcher took an active part in these discussions and documented thediscussions during the meetings.
The roles participating in the workshop and the meetings were the same. The par-ticipants of the meeting and workshop all had management roles. An overview of theroles, and the number of participants filling out each roles are shown in Table 8.2.The criteria for selecting the participants of the workshop and meetings were (1) goodknowledge of the processes of the company, and (2) coverage of different departmentsand thus disciplines (i.e. requirements, testing, and development).
232
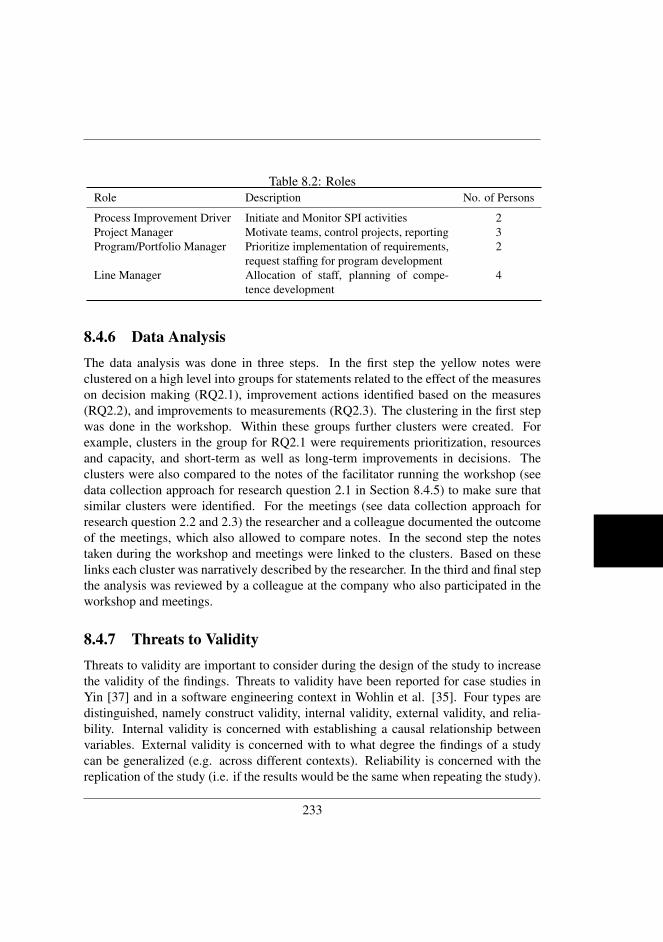
Table 8.2: RolesRole Description No. of Persons
Process Improvement Driver Initiate and Monitor SPI activities 2Project Manager Motivate teams, control projects, reporting 3Program/Portfolio Manager Prioritize implementation of requirements,
request staffing for program development2
Line Manager Allocation of staff, planning of compe-tence development
4
8.4.6 Data AnalysisThe data analysis was done in three steps. In the first step the yellow notes wereclustered on a high level into groups for statements related to the effect of the measureson decision making (RQ2.1), improvement actions identified based on the measures(RQ2.2), and improvements to measurements (RQ2.3). The clustering in the first stepwas done in the workshop. Within these groups further clusters were created. Forexample, clusters in the group for RQ2.1 were requirements prioritization, resourcesand capacity, and short-term as well as long-term improvements in decisions. Theclusters were also compared to the notes of the facilitator running the workshop (seedata collection approach for research question 2.1 in Section 8.4.5) to make sure thatsimilar clusters were identified. For the meetings (see data collection approach forresearch question 2.2 and 2.3) the researcher and a colleague documented the outcomeof the meetings, which also allowed to compare notes. In the second step the notestaken during the workshop and meetings were linked to the clusters. Based on theselinks each cluster was narratively described by the researcher. In the third and final stepthe analysis was reviewed by a colleague at the company who also participated in theworkshop and meetings.
8.4.7 Threats to ValidityThreats to validity are important to consider during the design of the study to increasethe validity of the findings. Threats to validity have been reported for case studies inYin [37] and in a software engineering context in Wohlin et al. [35]. Four types aredistinguished, namely construct validity, internal validity, external validity, and relia-bility. Internal validity is concerned with establishing a causal relationship betweenvariables. External validity is concerned with to what degree the findings of a studycan be generalized (e.g. across different contexts). Reliability is concerned with thereplication of the study (i.e. if the results would be the same when repeating the study).
233
Chapter 8. Measuring the Flow of Lean Software Development
Internal validity is not relevant for this study as we are not seeking to establish thecasual relationship between variables in a statistical manner.
Construct validity: Construct validity is concerned with obtaining the right mea-sures for the concept being studied. There is a risk that the researcher influences theoutcome of the study with his presence in industry (reactive bias) [35]. This risk wasreduced as the researcher is not perceived as being external as he is also employed bythe company. Thus, the participants of the workshops and meetings did not perceivethe researcher as an external observer and hence their behavior was not influenced byhis presence. Another threat is the risk that the practitioners misinterpret the measure-ments and visualizations (incorrect data). In order to minimize the threat of incorrectdata a tutorial was given on how to read and interpret the visualization and measure-ments. Furthermore, tutorial slides were provided to all users of our proposed solution.The practitioners were also given the possibility to ask clarification questions whichaided in achieving a common understanding of the solution.
External validity/generalizability: The main threat to external validity is that thestudy has been conducted in a single company. Consequently, the results were obtainedin the unique environment in which the case is embedded, namely the context [26, 30,37]. The threat to external validity was reduced by describing the context carefully (seeSection 8.4.1) and by that make the degree of generalizability explicit [25, 26]. Hence,the results of this study are likely to be generalizable to companies working with large-scale development in an incremental and iterative manner, and developing softwarefor a dynamic mass market. In order to employ our solution in other contexts therequirements inventories might differ depending on which other phases of developmentcan be found in another company. In summary, it is always very hard to generalize acase study. However, the findings and experiences gained are expected to providevaluable inputs to others interested in applying a similar approach, although the specificcontext has always to be taken into account.
Reliability: When collecting qualitative data there is always a risk that the interpre-tation is affected by the background of the researcher. The threat is reduced becausethe notes of the researcher were compared to the notes of the external facilitator for theworkshop, and with notes from a colleague for the meetings (see Section 8.4.5). Addi-tionally, the analysis was reviewed by a colleague at the company who also participatedin the workshop and meetings. Possible misunderstandings are further reduced due tothat the researcher has good knowledge of the processes at the company and thus un-derstands the terminology (cf. [5]). The comparison of the notes showed that therewere no conflicting statements in the notes.
234
8.5 ResultsThe quantitative results (visualization and measurements) are illustrated first. There-after, the qualitative evaluation of the usefulness of visualization and our proposedmeasures is presented.
8.5.1 Application of Visualization and MeasuresWe applied the measures on data available from the company. The following data isprovided for this: (1) the original graphs including the regression lines to visualizethe relation between original data and metrics collected; (2) bar-plots of the slope toillustrate the bottlenecks; (3) bar-plots of the estimation error to illustrate how even theflow is; (4) a table summarizing costs as I, WD, and W.
Bottlenecks and Even Flow
Figure 8.3 shows the cumulative flow diagrams for all nine sub-systems combined andthe considered units of analysis, including the regression lines. As discussed beforethe regression lines are a measure of the rate in which requirements are handed overbetween the phases. The purpose of the figures is to show how the visualization ofthe original data (cumulative flow diagrams) and the metrics collected are connected.Drawing the regression lines in combination with the original data has advantages.
Measurement makes visualization more objective: The sole visualization of the cu-mulative flow diagram does not always reveal the real trend as it is not easy to recognizewhich of the phases that has a higher rate of incoming requirement. A high variancearound the regression line makes this judgment even harder. Therefore, it is importantto calculate the regression. An example is shown in Figure 8.3(b), where the curves forrequirements to be detailed (HO to be Detailed) and requirements to be implemented(HO to design) have a fairly similar trend. However, the best fit of the data (regression)makes explicit that the slope of requirements to be detailed is higher than the slopeof requirements to be implemented, which (according to our measures) would be anindicator for a bottleneck. Thus, the measurement can be considered more objective incomparison to the sole visualization.
Identifying bottlenecks: All figures show examples of bottlenecks, the main bottle-neck (for the designated time-frame) was the node testing phase (i.e. slope HO to LSVNode test > slope HO to LSV System test). The figures also show opposite trends tobottlenecks, i.e. the rate in which requirements come into a phase was lower than therequirements coming out of the phase (e.g. slope HO to Design < slope HO to LSVNode Test 8.3(c)). Such a trend can be used as a signal for recognizing that there is not
235
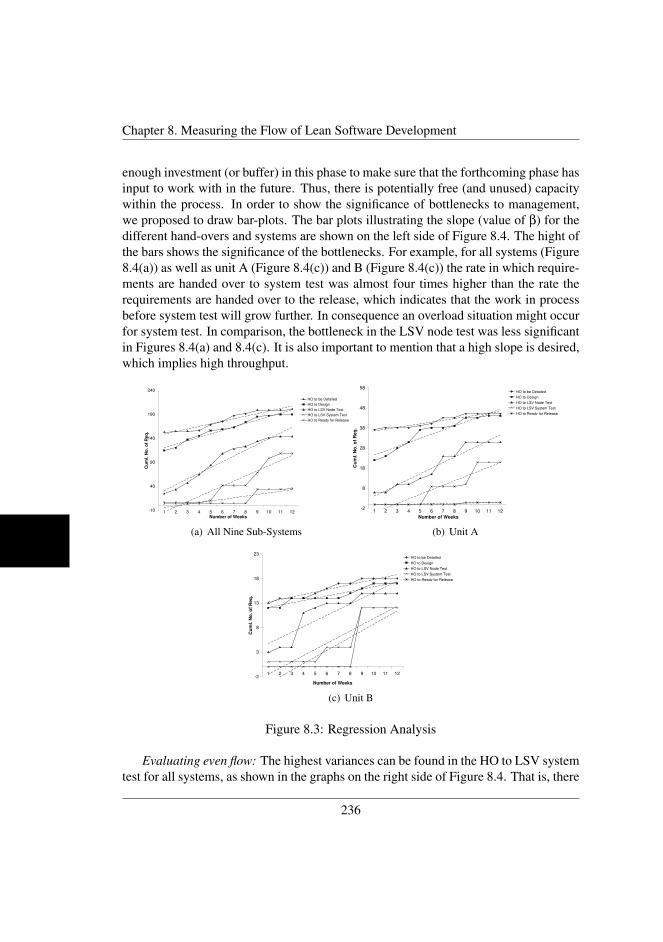
Chapter 8. Measuring the Flow of Lean Software Development
enough investment (or buffer) in this phase to make sure that the forthcoming phase hasinput to work with in the future. Thus, there is potentially free (and unused) capacitywithin the process. In order to show the significance of bottlenecks to management,we proposed to draw bar-plots. The bar plots illustrating the slope (value of β) for thedifferent hand-overs and systems are shown on the left side of Figure 8.4. The hight ofthe bars shows the significance of the bottlenecks. For example, for all systems (Figure8.4(a)) as well as unit A (Figure 8.4(c)) and B (Figure 8.4(c)) the rate in which require-ments are handed over to system test was almost four times higher than the rate therequirements are handed over to the release, which indicates that the work in processbefore system test will grow further. In consequence an overload situation might occurfor system test. In comparison, the bottleneck in the LSV node test was less significantin Figures 8.4(a) and 8.4(c). It is also important to mention that a high slope is desired,which implies high throughput.
-10
40
90
140
190
240
1 2 3 4 5 6 7 8 9 10 11 12Number of Weeks
Cu
ml.
No
. o
f R
eq
.
HO to be DetailedHO to DesignHO to LSV Node TestHO to LSV System TestHO to Ready for Release
(a) All Nine Sub-Systems
-2
8
18
28
38
48
58
1 2 3 4 5 6 7 8 9 10 11 12Number of Weeks
Cu
ml.
No
. o
f R
eq
.
HO to be Detailed
HO to Design
HO to LSV Node Test
HO to LSV System Test
HO to Ready for Release
(b) Unit A
-2
3
8
13
18
23
1 2 3 4 5 6 7 8 9 10 11 12
Number of Weeks
Cu
ml.
No
. o
f R
eq
.
HO to be Detailed
HO to Design
HO to LSV Node Test
HO to LSV System Test
HO to Ready for Release
(c) Unit B
Figure 8.3: Regression Analysis
Evaluating even flow: The highest variances can be found in the HO to LSV systemtest for all systems, as shown in the graphs on the right side of Figure 8.4. That is, there
236
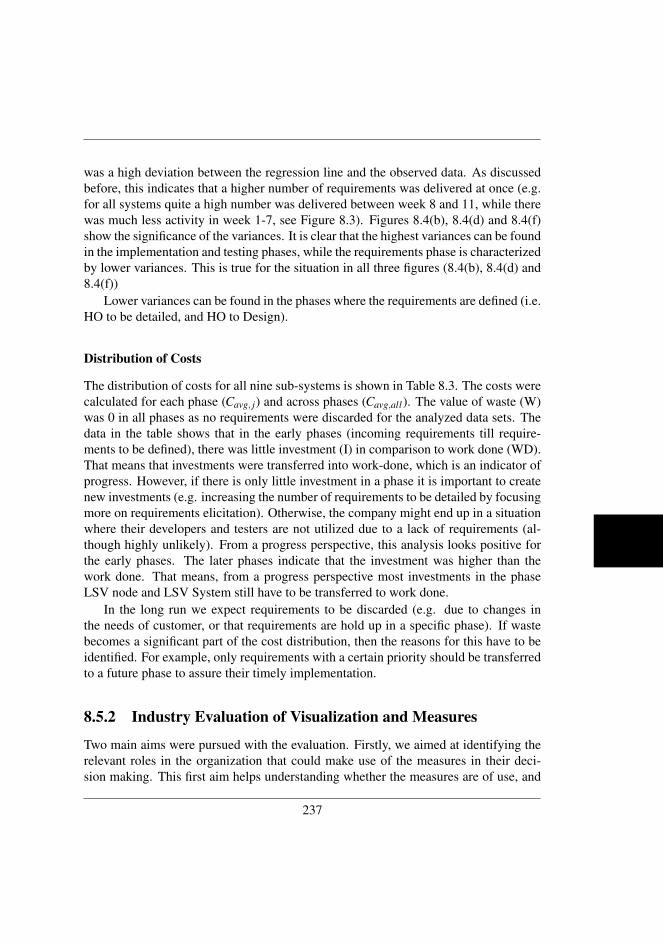
was a high deviation between the regression line and the observed data. As discussedbefore, this indicates that a higher number of requirements was delivered at once (e.g.for all systems quite a high number was delivered between week 8 and 11, while therewas much less activity in week 1-7, see Figure 8.3). Figures 8.4(b), 8.4(d) and 8.4(f)show the significance of the variances. It is clear that the highest variances can be foundin the implementation and testing phases, while the requirements phase is characterizedby lower variances. This is true for the situation in all three figures (8.4(b), 8.4(d) and8.4(f))
Lower variances can be found in the phases where the requirements are defined (i.e.HO to be detailed, and HO to Design).
Distribution of Costs
The distribution of costs for all nine sub-systems is shown in Table 8.3. The costs werecalculated for each phase (Cavg, j) and across phases (Cavg,all). The value of waste (W)was 0 in all phases as no requirements were discarded for the analyzed data sets. Thedata in the table shows that in the early phases (incoming requirements till require-ments to be defined), there was little investment (I) in comparison to work done (WD).That means that investments were transferred into work-done, which is an indicator ofprogress. However, if there is only little investment in a phase it is important to createnew investments (e.g. increasing the number of requirements to be detailed by focusingmore on requirements elicitation). Otherwise, the company might end up in a situationwhere their developers and testers are not utilized due to a lack of requirements (al-though highly unlikely). From a progress perspective, this analysis looks positive forthe early phases. The later phases indicate that the investment was higher than thework done. That means, from a progress perspective most investments in the phaseLSV node and LSV System still have to be transferred to work done.
In the long run we expect requirements to be discarded (e.g. due to changes inthe needs of customer, or that requirements are hold up in a specific phase). If wastebecomes a significant part of the cost distribution, then the reasons for this have to beidentified. For example, only requirements with a certain priority should be transferredto a future phase to assure their timely implementation.
8.5.2 Industry Evaluation of Visualization and Measures
Two main aims were pursued with the evaluation. Firstly, we aimed at identifying therelevant roles in the organization that could make use of the measures in their deci-sion making. This first aim helps understanding whether the measures are of use, and
237
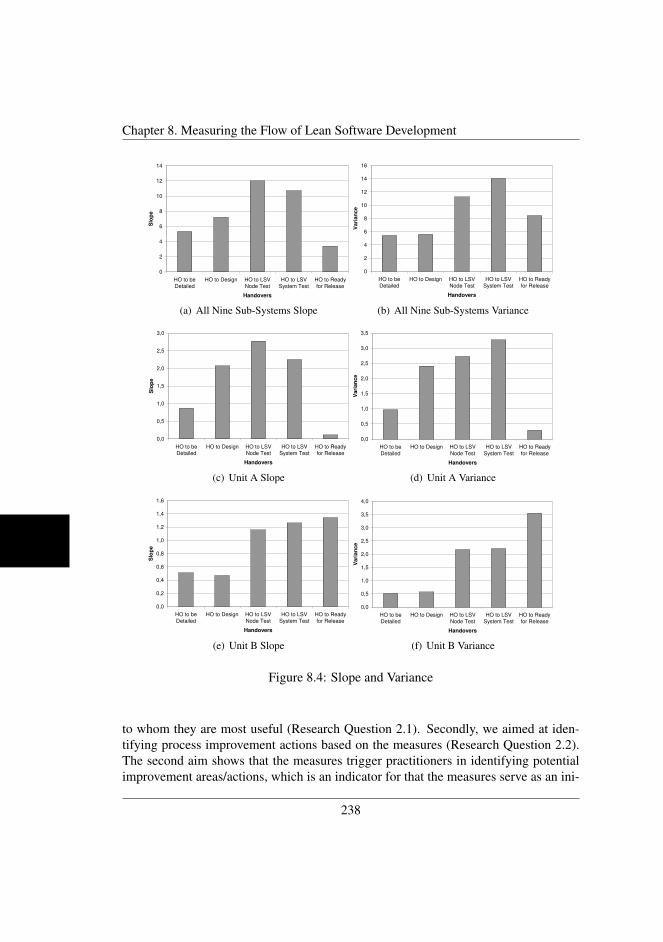
Chapter 8. Measuring the Flow of Lean Software Development
0
2
4
6
8
10
12
14
HO to beDetailed
HO to Design HO to LSVNode Test
HO to LSVSystem Test
HO to Readyfor Release
Handovers
Slo
pe
(a) All Nine Sub-Systems Slope
0
2
4
6
8
10
12
14
16
HO to beDetailed
HO to Design HO to LSVNode Test
HO to LSVSystem Test
HO to Readyfor Release
Handovers
Va
ria
nc
e
(b) All Nine Sub-Systems Variance
0,0
0,5
1,0
1,5
2,0
2,5
3,0
HO to beDetailed
HO to Design HO to LSVNode Test
HO to LSVSystem Test
HO to Readyfor Release
Handovers
Slo
pe
(c) Unit A Slope
0,0
0,5
1,0
1,5
2,0
2,5
3,0
3,5
HO to beDetailed
HO to Design HO to LSVNode Test
HO to LSVSystem Test
HO to Readyfor Release
Handovers
Va
ria
nc
e
(d) Unit A Variance
0,0
0,2
0,4
0,6
0,8
1,0
1,2
1,4
1,6
HO to beDetailed
HO to Design HO to LSVNode Test
HO to LSVSystem Test
HO to Readyfor Release
Handovers
Slo
pe
(e) Unit B Slope
0,0
0,5
1,0
1,5
2,0
2,5
3,0
3,5
4,0
HO to beDetailed
HO to Design HO to LSVNode Test
HO to LSVSystem Test
HO to Readyfor Release
Handovers
Va
ria
nc
e
(f) Unit B Variance
Figure 8.4: Slope and Variance
to whom they are most useful (Research Question 2.1). Secondly, we aimed at iden-tifying process improvement actions based on the measures (Research Question 2.2).The second aim shows that the measures trigger practitioners in identifying potentialimprovement areas/actions, which is an indicator for that the measures serve as an ini-
238
Table 8.3: Costs AllPhase I I (%) WD WD (%) W
Cavg,Inc.Req. 18.00 10.15 160.00 89.85 0.00Cavg,Design 62.92 39.30 97.17 60.70 0.00Cavg,LSV Node 51.58 53.09 45.58 46.91 0.00Cavg,LSV Sys 31.17 68.37 14.42 31.63 0.00Cavg,ReadyRelease 14.42 100.00 0.00 0.00 0.00
Cavg,all 35.63 35,69 63.45 64.04 0.00
tiator for software process improvement activities.
The Effect of Measurements on Decision Making (RQ2.1)
During the workshops with the company representatives, it was discussed how themeasures can affect decision making in the company. In the following the differenttypes of decisions supported by the measures are discussed.
Requirements prioritization: The measure of continuous work-flow may show atrend where too many requirements are handed over at once. Thus, the measure helpsin assuring that requirements are not handed over in big bulks, but instead in smallerchunks and more continuously. Furthermore, if the measure signals that the develop-ment is overloaded, no more requirements should be handed over to avoid an overloadsituation. As the decisions are related to requirements prioritization the measures helpimproving from a short-term perspective.
Staff allocation: In case of bottlenecks managers can use the information fromthe bottleneck analysis to allocate staff when bottlenecks occur. As discussed duringthe workshop, this has to be done with care, as the reason for a bottleneck might besomething else than staffing. However, if staffing is the problem the figures supportmanagers in arguing for the need of staff. Staffing can also be seen as an ad-hoc solutionwith a short-term perspective.
Transparency for teams and project managers: The measurement system allowsseeing which requirements are coming into phases, which are currently worked on,and which have been completed. In consequence, the current status of development foreach team is always visible. For instance, the testing team can see all requirements theyare supposed to be working on in the upcoming weeks. This helps them in planningtheir future work as they are aware of future requirements. Furthermore, seeing whathas been completed has a motivating effect on the teams.
239
Chapter 8. Measuring the Flow of Lean Software Development
Software process improvement: Software process improvement needs to look at thedata from a long-term perspective (i.e. quarterly is not long enough, instead one shoulduse data for 6 or 12 months). If there are significant bottlenecks or uneven requirementsflows the causes for this have to be investigated. Thus, from a process improvementperspective focusing on long-term improvement the data should be used as an indicatorof where to look for problem causes.
The result of the workshop was that the practitioners judged the measurements asuseful for different roles in the organization, which supports their practical relevance.Furthermore, the measures can be used to take actions to improve in the short and thelong term.
Process Improvement Actions Based on Measurements (RQ2.2)
In the analysis team meetings, process improvement actions were identified from asoftware process improvement perspective baed on the measures. The analysis wasdone on quarterly data as the data for half a year is not available yet. However, theanalysis meetings already show that the information provided by the visualization andmeasurements aids the practitioners in identifying concrete areas for improvement. Themost important improvement areas identified so far are (1) avoid to be too much drivenby deadlines and market-windows; and (2) integrate more often to improve quality.
Observation and improvement for (1): The development is done continuously, butwith a deadline (market-window) in mind. This is a way of thinking that leads tothat work is started late before the deadline (e.g. the high amount of requirementshanded over in week 8 to LSV system test in Figure 8.3(c), and the related high valuein variance seen in Figure 8.4(f)). In consequence, there were fewer deliveries of re-quirements from one phase to the other until shortly before the deadline, where a bigbulk of requirements was delivered at once. As an improvement we found that peopleshould not focus on deadlines and market-windows too much when planning the flowof development. Instead, they should focus more on the continuous production withoptional releases. In order to achieve this, an option is to follow the Kanban approach.In Kanban, the work (e.g. maximum number of requirements with similar complexity)that can be in process at a specific point in time is limited [12]. In consequence, bigbulk deliveries of requirements are not possible. Thus, the Kanban approach enforcesto continuously work and deliver requirements between phases, reducing the variancein the flow.
Observation and improvement for (2): The practitioners observed that the systemwas integrated too late, and not often enough. An indication for this observation can beseen in the slope analysis of in Figures 8.4(a) and 8.4(c). Hence, the planning of testingcycles needs to enforce short periods between integration. The main purpose of this is
240
to allow for regular feedback on the builds helping the company to further improve thequality of the products. In order to technically enable more frequent integration thecompany is pursuing a higher degree of testing automation.
Improvements to the Measures (RQ3.3)
The visualization and measures need to be further improved in order to increase theirusefulness and accuracy. Together with the practitioners providing a critical reflectionon the visualization and measures we identified the following improvements:
Treatment of quality requirements: Quality requirements do not flow through thedevelopment process in the same fashion as functional requirements. Functional re-quirements are part of an increment, and are completed with the delivery of the incre-ment. Some quality requirements (e.g. performance) are always relevant for each newrelease of the product and thus always stay in the inventories. That means, one hasto be aware that those requirements are not stuck in the inventory due to a bottleneck.Therefore, we recommend to remove requirements from the analysis that are alwaysvalid for the system.
Requirements granularity and value: If requirements vary largely in complexityit is not a valid approach to only count the requirements. One has to take the weightof each requirement into consideration. The weight should be based on the size ofthe requirements. We propose to estimate the size of the requirements in intervalsfor small, medium, and large requirements. What small, medium, and large meansdiffers between organizations, meaning that each organization has to determine theirown intervals. When counting the requirements, a small requirement is counted once,a medium requirement twice, and a large requirement thrice. Another distinguishingattribute of requirements is their value as suggested by the concept of minimum mar-ketable requirements [7]. High value requirements should flow through the processmore quickly and with higher throughput than low value requirements. Consequently,the solution would benefit from also weighting requirements based on their value.
Optimization of measures: Optimization of measures is always a risk when mea-surements are used to evaluate an organization. For example, it is possible to improvethe rate of requirements hand-overs by delivering detailed requirements with lesserquality to implementation. We believe that this will be visible in the measures as de-sign will not be able to work with the requirements and thus a bottleneck in designbecomes visible. However, it is still beneficial to complement the evaluation of flowwith other quality related measures. Possible candidates for quality measures are fault-slip through [6], or number of faults reported in testing and by the customer.
Visualization of critical requirements: The visualization does not show which re-quirements are stuck in the development process. In order to requirements into account
241
Chapter 8. Measuring the Flow of Lean Software Development
that are stuck in the process one could define thresholds for how long a requirementshould stay in specific phases. Requirements that are approaching the threshold shouldbe alerted to the person responsible for them. In that way, one could pro-actively avoidthat requirements do not flow continuously through the development.
Time frames: The time-frame used at the company for evaluating the flow is eachquarter. As discussed with the practitioners, it is also important to have a more long-term perspective when evaluating the data (i.e. half-yearly and yearly). The data inthe short-term (quarterly) is more useful for the teams, program/line-managers, and re-quirements/portfolio managers, who use the data from a short-term perspective to dis-tribute resources or prioritize requirements (see answers to RQ2.1). However, the prac-titioners responsible for long-term improvements require measurements over a longerperiod of time to reduce the effect of confounding factors. Examples for confound-ing factors are Midsummer in Sweden, upcoming deadline of an important release, orcritical fault report from customer.
The next section discusses practical implications and research implications of thevisualization and measurements presented. Furthermore, the measures are compared tothose presented in the related work section, which leads to a discussion of the differencein measuring lean manufacturing and lean software development.
8.6 Discussion
The application and evaluation of the visualization and the defined measures lead tosome implications for both research and practice. In addition, we discuss how themeasures relate to lean measurements used in manufacturing.
8.6.1 Practical Implications and Improvements to the Measures
The implications describe the relevance of the visualization and measures to industryand what evidence in the results (Section 8.5) supports the relevance.
Perceived usefulness of visualization and measures: The evaluation showed thatthe visualization and measures are useful from an industrial point of view. The mea-sures were introduced in February 2009 and are mandatory to use in the evaluationsof product development of the systems considered in this case study since July 2009for the studied system developed in Sweden and India. The reason for this is that themeasures were able to give a good overview of progress. This kind of transparency isespecially important in complex product development where many tasks go on in par-allel (see Chapter 3). The rapid application of the solution and the commitment of the
242
company to use the solution in their daily work is strong evidence of its perceived use-fulness. The evaluation of the measures with regard to usefulness was very much basedon the perception and feedback by the practitioners. From past experience we foundthat when transferring a new practice to industry the feedback and commitment fromthe practitioners is invaluable, the reason being that the practitioners can influence andimprove the approach (as has been documented in the improvement suggestions madeby the practitioners) [11, 10]. Furthermore, a buy-in by the management is importantfor a long-term success, which can be achieved through feedback and building trust byincorporating that feedback.
Visualization and measures drive practitioners towards lean and agile practices:The proposed process improvement actions are an indication that the measures drive theorganization towards the use of lean and agile practices. The evidence for the claimeddriving force of the measures is the identification of lean and agile improvements thatthe company would like to adopt (see Section 8.5.2). The first improvement proposedis directly related to lean principles (Kanban) [12], stressing the importance to changefrom a push to a pull mechanism, and by that limiting the work in process [27]. Thesecond improvement stresses the importance of frequent integration and early feedbackto improve quality, which is an important principle in all agile development paradigms[3, 25]. Currently actions are in implementation at the company to support the pullapproach from the requirements phase to development, and to enable earlier testing(e.g. changes in architecture to allow for continuous upgrades and earlier testing ofthese upgrades). The actual improvements will not be visible in the visualization andmeasurements immediately as a large-scale organization with more than 500 peopledirectly and indirectly involved in the development of the investigated systems hasbeen studied. Lean is a new way of thinking for many people in the organization whohave to familiarize with the concepts, requiring training and getting a commitment tothis new way of working throughout the organization. As pointed out by [23, 18] theintroduction of lean software development is a continuous process and the attempt of abig-bang introduction often leads to failure.
Measures help in short-term and long-term decision making: The practitioners per-ceive the visualization and measurements as beneficial in supporting them in the shortand the long term. Evidence is the identification of decisions by the practitioners thatwere related to long as well as short term decisions. (see Section 8.5.2). Three deci-sions were related to short term, i.e. requirements prioritization, staff allocation, andproject management and planning decisions. Furthermore, undesired effects seen inthe measures help in making decisions targeted on long-term process improvements.A prerequisite to take the right long-term decisions is to identify the causes for theundesired effects.
Understand complexity: The large system studied is highly complex with many
243
Chapter 8. Measuring the Flow of Lean Software Development
different tasks going on in parallel, which makes transparency and coordination chal-lenging [25]. Hence, measurement and visualization focusing on the end to end flowincreases the transparency for the practitioners. In particular our solution was able toshow the behavior of the development flow of a highly complex system in terms ofbottlenecks, continuous flow, and distribution of costs.
Overall, the discussion shows that the results indicate that the measures can beuseful in supporting software process improvement decisions.
8.6.2 Research Implications
The research implications provide examples of how other researchers can benefit fromthe results in this study.
Complement agile with lean tools: The characteristic that distinguishes lean andagile development is the focus on the flow of the overall development life-cycle. Leanprovides analysis and improvement tools focusing on the overall development life-cycle while agile focuses on solutions and prescribes sets of practices to achieve agility.Given the results of the case study we believe that the agile research community shouldfocus on making lean analysis tools for the development flow an integral part of agilepractices. We believe this to be particularly important in large-scale software devel-opment where many teams develop software in parallel, making it harder to achievetransparency of what is going on in a dynamic and agile environment.
Use solution to evaluate process improvements: The measures provided are po-tentially useful for researchers who would like to evaluate and test improvements in-creasing efficiency of development. For example, simulation models often focus onlead-time (cf. [8, 28]). Complementary to that the simulations could benefit from mak-ing use of the measures identified in this study to provide a solution allowing to analyzethroughput with regard to bottlenecks, variance in flow, and distribution of cost.
8.6.3 Comparison with State of the Art
In the related work section, we presented measures that are applied in measuring leanmanufacturing. However, in the context of software engineering the measures havedrawbacks.
Throughput measures: Throughput measures calculate the output produced pertime-unit. Three throughput measures have been identified in the related work, namelyday-by-the-hour [17], cost efficiency [1], and value efficiency [1]. In the context ofsoftware engineering, this measure would determine the number of requirements com-pleted per hour. However, this measure is very simplistic and does not take into account
244
the variance in which requirements are completed. Therefore, we use regression in or-der to calculate the rate and also calculate the variance to evaluate how continuous theflow of development is.
Capacity utilization: In manufacturing it is predictable how many units a machinecan produce, and thus the desired value of capacity utilization is clear (i.e. CU = 1)[17]. However, software developers are knowledge workers and their behavior is notas predictable. There is a high variance between developers in terms of productivity[15]. Furthermore, when thinking about concepts and creative solutions no output isproduced in this time. This makes the measure unsuitable in the software engineeringcontext.
On-time-delivery: On-time delivery [17] is tightly connected to deadlines in soft-ware development. However, in the case of incremental development one should notfocus too much on a specific deadline, but on being able to continuously deliver aproduct with the highest priority requirements implemented [27].
The analysis of the related work show that there were no comprehensive measuresto capture the flow of development. We addressed the research gap by proposing mea-sures to detect bottlenecks, discontinuous flow, and distribution of costs. The measuresare connected to an easy to understand visualization of the development flow, whichaids in communicating with management.
8.7 ConclusionIn this study we applied cumulative flow diagrams to visualize the flow of requirementsthrough the software development life-cycle. The main contribution of this study is aset of measures to achieve higher throughput and to track the progress of developmentfrom a flow perspective. The measures were evaluated in an industrial case study. Inthe following we present the research questions and the answers to the questions.
RQ1: Which measures aid in (1) increasing throughput to reduce lead-times, and(2) as a means for tracking the progress of development? Three metrics were identifiedin the context of this study. The first metric allows to identify bottlenecks by measuringthe rate of requirements hand-over between different phases through linear regression.The second metric measures the variance in the hand-overs. If the variance of hand-overs is very high then big batches of requirements are handed over at once, precededby a time-span of inactivity. The third metric separates requirements into the cost typesinvestment, work done, and waste. The purpose of the measure is to see the distributionof requirements between the different types of cost.
RQ2: How useful are the visualization and the derived measures from an industrialperspective? This research question was evaluated from two angles. First, we evaluated
245
REFERENCES
how the measures can affect decision making. The findings are that: (1) requirementsprioritization is supported; (2) the measures aid in allocating staff; (3) the measuresprovide transparency for teams and project managers of what work is to be done in thefuture and what has been completed; and (4) software process improvement drivers canuse the measures as indicators to identify problems and achieve improvements from along-term perspective. Secondly, we evaluated what improvement actions practitionersidentified based on the measurements. The improvement areas are: (1) an increasedfocus on continuous development by limiting the allowed number of requirements ininventories; and (2) earlier and more frequent integration and system testing of thesoftware system to increase quality. The solution has been successfully transfered toindustry and will be continuously used at the company in the future.
In conclusion the case study showed that the visualization and measures are per-ceived as valuable from an industrial perspective. It should be emphasized that they areespecially valuable when developing large scale products with many teams and tasksgoing on in parallel, as here transparency is particularly important.
Future work should focus on evaluating our solution in different contexts and howit has to be adjusted to fit these contexts. For example, cumulative flow diagrams andthe suggested measures could be applied to analyze software maintenance, or softwaretesting processes. In addition future work should focus on the analysis of what typeof improvements support a lean software process, the measurements and visualizationsproposed in this paper can be an instrument to evaluate such improvements from alean software engineering perspective. Little is also known about the long-term effectof implementing agile practices such as Kanban, which is also an interesting area forfuture research.
From an analysis perspective other lean tools are available, such as value streammaps and theory of constraints/ queuing theory. The usefulness of these tools willallow to learn more about the benefits that could be achieved when using lean practicesin the software engineering context. As the approaches aim for similar goals (i.e. theidentification of waste) the approaches should be compared empirically to understandwhich of the approaches is the most beneficial.
8.8 References[1] David Anderson. Agile management for software engineering: applying the the-
ory of constraints for business results. Prentice Hall, 2003.
[2] Victor R. Basili. Quantitative evaluation of software methodology. Technicalreport, University of Maryland TR-1519, 1985.
246
[3] Kent Beck and Cynthia Andres. Extreme Programming explained: embracechange. Addison-Wesley, Boston, 2. ed. edition, 2005.
[4] Dan Cumbo, Earl Kline, and Matthew S. Bumgardner. Benchmarking perfor-mance measurement and lean manufacturing in the rough mill. Forest ProductsJournal, 56(6):25 – 30, 2006.
[5] Lars-Ola Damm. Early and Cost-Effective Software Fault Detection. PhD thesis,Blekinge Institute of Technology Doctoral Dissertation Series No. 2007:09, 2006.
[6] Lars-Ola Damm, Lars Lundberg, and Claes Wohlin. Faults-slip-through - a con-cept for measuring the efficiency of the test process. Software Process: Improve-ment and Practice, 11(1):47–59, 2006.
[7] Mark Denne and Jane Clelund-Huang. Software by the numbers: low-risk, high-return development). Prentice Hall, 2004.
[8] Paolo Donzelli and Giuseppe Iazeolla. A software process simulator for softwareproduct and process improvement. In Proceedings of the International Confer-ence on Product Focused Software Process Improvement (PROFES 1999), pages525–538, 1999.
[9] Kathleen M. Eisenhardt. Building theories from case study research. Academy ofManagement Review, 14(4):532–550, 1989.
[10] Tony Gorschek, Per Garre, Stig Larsson, and Claes Wohlin. A model for technol-ogy transfer in practice. IEEE Software, 23(6):88–95, 2006.
[11] Tony Gorschek and Claes Wohlin. Requirements abstraction model. Requir. Eng.,11(1):79–101, 2006.
[12] John M. Gross and Kenneth R. McInnis. Kanban made simple: demystifyingand applying Toyota’s legendary manufacturing process. AMACOM, New York,2003.
[13] Alan R Hevner, March T. Salvatore, Jinsoo Park, and Ram Sudha. Design sciencein information systems research. MIS Quarterly, 28(1):75–103, 2004.
[14] Martin Host, Bjorn Regnell, Johan Natt och Dag, Josef Nedstam, and Chris-tian Nyberg. Exploring bottlenecks in market-driven requirements managementprocesses with discrete event simulation. Journal of Systems and Software,59(3):323–332, 2001.
247
REFERENCES
[15] L. Kemayel, Ali Mili, and I. Ouederni. Controllable factors for programmer pro-ductivity: A statistical study. Journal of Systems and Software, 16(2):151–163,1991.
[16] Craig Larman. Agile and iterative development: a manager’s guide. Addison-Wesley, Boston, 2004.
[17] Brian Maskell and Bruce Baggaley. Practical lean accounting: a proven systemfor measuring and managing the lean enterprise. Productivity Press, 2004.
[18] Peter Middleton. Lean software development: Two case studies. Software QualityJournal, 9(4):241–252, 2001.
[19] Peter Middleton, Amy Flaxel, and Ammon Cookson. Lean software managementcase study: Timberline inc. In Proceedings of the 6th International Conference onExtreme Programming and Agile Processes in Software Engineering (XP 2005),pages 1–9, 2005.
[20] Douglas C. Montgomery and George C. Runger. Applied Statistics and Probabil-ity for Engineers. Wiley, 2006.
[21] Shahid Mujtaba, Robert Feldt, and Kai Petersen. Waste and lead-time reductionin a software product customization process with value-stream maps. In Proceed-ings of the 10th Australian Conference on Software Engineering (ASWEC 2010),2010.
[22] Emma Parnell-Klabo. Introducing lean principles with agile practices at a fortune500 company. In Proceedings of the AGILE Conference (AGILE 2006), pages232–242, 2006.
[23] Richard T. Pascale. Managing on the edge: how the smartest companies useconflict to stay ahead. Simon and Schuster, New York, 1990.
[24] G.I.U.S. Perera and M.S.D. Fernando. Enhanced agile software development hy-brid paradigm with lean practice. In Proceedings of the International Conferenceon Industrial and Information Systems (ICIIS 2007), pages 239–244, 2007.
[25] Kai Petersen and Claes Wohlin. A comparison of issues and advantages in ag-ile and incremental development between state of the art and an industrial case.Journal of Systems and Software, 82(9):1479–1490, 2009.
248
[26] Kai Petersen and Claes Wohlin. Context in industrial software engineering re-search. In Proceedings of the 3rd International Symposium on Empirical SoftwareEngineering and Measurement, pages 401–404, 2010.
[27] Mary Poppendieck and Tom Poppendieck. Lean Software Development: An AgileToolkit (The Agile Software Development Series). Addison-Wesley Professional,2003.
[28] David Raffo. Evaluating the impact of process improvements quantitatively usingprocess modeling. In Proceedings of the 1993 Conference of the Centre for Ad-vanced Studies on Collaborative research (CASCON 1993), pages 290–313. IBMPress, 1993.
[29] Donald G Reinertsen. Managing the design factory: a product developers toolkit.Free, New York, 1997.
[30] Colin Robson. Real world research: a resource for social scientists andpractitioner-researchers. Blackwell, Oxford, 2. ed. edition, 2002.
[31] Per Runeson and Martin Host. Guidelines for conducting and reporting case studyresearch in software engineering. Empirical Software Engineering, 14(2):131–164, 2009.
[32] Bridget Somekh. Action research: a methodology for change and development.Open University Press, Maidenhead, 2006.
[33] Brian White. Software configuration management strategies and RationalClearCase: a practical introduction. Addison-Wesley, Harlow, 2000.
[34] Colin Willcock, Thomas Deiss, Stephan Tobies, Stefan Keil, Federico Engler, andStephan Schulz. An Introduction to TTCN-3. John Wiley & Sons Ltd., 2005.
[35] Claes Wohlin, Per Runeson, Martin Host, Magnus C. Ohlsson, Bjorn Regnell,and Anders Wesslen. Experimentation in Software Engineering: An Introduction(International Series in Software Engineering). Springer, 2000.
[36] James P. Womack and Daniel T. Jones. Lean thinking: banish waste and createwealth in your corporation. Free Press Business, London, 2003.
[37] Robert K. Yin. Case study research: design and methods. Sage Publications, 3ed. edition, 2003.
249
REFERENCES
250
Chapter 9
Lean Software Maintenance
Kai PetersenSubmitted to a conference
9.1 IntroductionDevelopment activities are distinguished into initial software development where thesoftware product is specified, implemented and tested and thereafter delivered to themarket, and software maintenance [1]. Software maintenance distinguishes betweenenhancements (i.e. adaptations to the delivered software to provide minor functionalityenhancements, optimize resources and performance, etc.) and corrections (i.e. resolv-ing problems reported by customers, such as defects). Software maintenance is a largepart of the software development effort, with effort for maintenance being in the rangeof 50-80 % of all software development effort [18]. Given these observations softwaremaintenance is an essential activity in software development and hence improvementsin this activity have the potential to increase the efficiency and effectiveness of an over-all software development organization.
Lean product development has revolutionized the way products are built by iden-tifying waste and providing analysis tools for the production process to make it moreefficient and effective [9]. To leverage on the benefits achieved in lean product de-velopment (high quality, quick response to customer needs, just in time developmentwith little work in progress) lean has become popular for software development aswell [13, 14, 15]. Lean and agile software development share a number of principles
251

Chapter 9. Lean Software Maintenance
and practices, such as self-organizing teams, sustainable pace, face-to-face conversa-tion, the focus on technical excellence, and so forth. In comparison to agile lean hasa stronger focus on providing principles and practices that should help in systemati-cally analyzing and improving a process to become highly effective and efficient, suchas “See the whole”, “Avoidance of waste”, “Short cycle times and rapid feedback”,and “Build in quality” (see Chapter 2). The principles are supported by lean tools, thebest known being value stream maps [10], cumulative flow diagrams [3] and Kanban[13, 3]. The analysis of the related work showed that no solution is available to analyzesoftware maintenance from a lean software development perspective.
The contribution of this paper is to provide a novel analysis approach for the main-tenance process to realize the lean principles mentioned above. “See the whole” issupported by focusing on multiple dimensions (i.e. product quality, continuous deliv-ery of valuable results, process cycle-times and iterations due to internal quality issues)[1]. For the analysis of each dimension’s measures and visualizations are provided. Forthe identification of the measures and visualizations the Goal Question Metric (GQM)approach [4] was used as guidance in identifying a solution supporting the lean princi-ples. The goal driving the analysis was to “Increase the efficiency and effectiveness ofsoftware maintenance from a lean software development perspective”. The proposedsolution is an extension of the software process improvement through lean measure-ment (SPI-LEAM) method (see Chapter 7) which analyzes how an overall softwaredevelopment process performs considering work in process in relation to capacity. Thegoal of the method is to identify signals for problems in different development disci-plines (main requirements flow, change requests, and customizations, software testing,and maintenance). Hence, the method provides a high level overview of the differ-ent disciplines together. In order to identify problems on the more detailed level adrill-down of each dimension is needed to gain a more in-depth understanding of theunderlying behavior. The approach presented in this paper is the drill-down analysisthat is specific for the maintenance process. We would like to point out that the solutionsupports SPI-LEAM, but can also be implemented independently of that solution.
The solution has been evaluated in an industrial case study at Ericsson AB, locatedin Sweden. For that the solution was applied on the maintenance requests (MRs) en-tering the studied company site in the year 2009 as those reflect the performance of themaintenance process currently applied at the company. The goal of the case study is todemonstrate the ability of the approach to show the absence or presence of ineffective-ness and inefficiency in the studied process.
The remainder of the paper is structured as follows: Section 9.2 presents the relatedwork and based on that demonstrates the need for the proposed solution. Section 9.3provides the solution for lean software maintenance. Section 9.4 presents the researchmethod to evaluate the solution. Section 9.5 illustrates the results obtained. Thereafter,
252
Section 9.6 discusses the results and Section 9.7 concludes the paper.
9.2 Related WorkThe related work focuses on measurements proposed in the maintenance context to as-sess maintenance performance in different ways. To get a good idea of the literaturein the topic area the titles and abstracts of the International Conference on SoftwareMaintenance have been browsed manually as this is the primary forum for mainte-nance research. Furthermore, we searched Inspec and Compendex as well as GoogleScholar, given that they cover a variety of databases, such as IEEE Xplore, Wiley In-terscience, Elsevier, and ACM. To identify the literature we searched for: “SoftwareMaintenance” AND (Measurement OR Metric OR Measure OR Quantify OR Produc-tivity OR Efficiency). The lists were browsed and the selection of articles included inthe related work were made based on the titles. Software maintenance in combinationwith lean has, to the best of our knowledge, not been researched before. Hence, norelated work for that combination is included.
Alam et al. [2] observed that progress in maintenance is often captured throughmanual collection of metrics or through automatically collected metrics, such as linesof code. As an improvement to measuring progress as an important performance mea-sure they propose to record code changes and study the time dependencies betweenthem. For example, if a class uses a function of another class then there is a time de-pendency between them as the used class has to be implemented first. The progresstracking is an analogy to construction where a building is continuously built basedon dependent changes. This allows to analyze whether new MRs are built upon newchanges done recently, or old changes, or whether they are independent. To demon-strate the approach it was applied on two open source systems. A difference could beidentified, e.g. it shows that in one system the majority of maintenance activities werebased on new changes, while in another system the number of changes built on newand old changes as well as independent changes was similar. One limitation of themethod is that it does not show the progress with regard to the backlog of changes tobe implemented.
Schneidewind [17] studied enhancement projects and provided a number of perfor-mance measures. The performance measures were mean time between failure whentesting the enhancement (calculated as the ratio of test execution time and the totalnumber of failures), the defect density with regard to the changes in the code countedas changed lines of code, and the overall test time needed for the testing of the en-hancement implementation. Overall, the primary focus of the measurements was theproduct.
253
Chapter 9. Lean Software Maintenance
Henry et al. [7] provide a process modeling approach for maintenance with metricsconnected to it. The model is divided into different abstraction levels (activities, tasks,and procedures), where procedures are a refinement of tasks, and tasks are a refinementof activities. At the different abstraction levels measures were proposed on process andproduct level. On process level the following measures should be collected with regardto the abstraction levels:
• Process (activities): Effort expanded and progress towards a predefined mile-stones.
• Process (tasks and procedures): Completion rate of tasks and defects correctedper week.
The measures on product level were also divided into abstraction levels for the mea-sures (product level, module level, and code level). The following measures should becollected according to the article:
• Product (product level): Number of upgrades to be implemented, defects discov-ered, uncorrected defects, priority of defects, priority of defects.
• Product (module level): Impact of upgrade changes on elementary parts of thesystem.
• Product (code level): Number of LOC added, changed, or deleted.
The article also raised the importance of visually presenting the data to management,which aids communication. However, no visualization examples were provided. Inaddition the authors recommend the usage of statistical analysis to understand howindividual measures are connected, e.g. by calculating correlations. As pointed out inthe study a large number of measures have to be collected.
Sneed and Brossler [19] proposed a set of measurements to evaluate software main-tenance performance. The first measurement was related to productivity measured asthe output (size * change rate) divided by the input (maintenance effort). The produc-tivity measure is complemented by a quality measure of defect density, calculated asnumber of defects per lines of code (old code and changed code). As there is a chal-lenge of keeping different software artifacts consistent degradation also needs to becaptured, e.g. when a document does not conform to system implementation then thethe author talks about document degradation. Another important aspect to be capturedis the user perception of the success of the maintenance task. Therefore, the authorrecommends to ask users for different criteria to be rated on a Likert scale (e.g. per-formance, time for serving the MR, etc.). User satisfaction is measured as the ratio ofpoints achieved divided by the total points possible to achieve.
254
Rombach and Ulery [16] used the Goal Question Metric paradigm (from hereonreferred to as GQM) to identify goals, questions and metrics for analyzing the mainte-nance process. In GQM, the first step is to identify the goals to be achieved, which drivethe identification of questions to be answered in order to achieve the goals. In orderto answer the questions a number of metrics are identified. That is, the GQM providesa top-down approach for the goal-driven identification of measures. The goals identi-fied were the ability to compare maintenance activities between two programming lan-guages, and to collect measures about the behavior of maintenance for predictive pur-poses. The measures collected were the number of changed module per maintenancetask, effort (staff-hours) needed for isolating what to change (i.e. impact analysis), ef-fort (staff-hours) for change implementation, and portion of reused documentation permaintenance task. As pointed out in the article the overall implementation of the mea-surement program took about six staff-years. However, the authors pointed out that thelong-term benefits will likely outweigh the investments made.
Stark [20] provided an experience report on the introduction of a measurement pro-gram for software maintenance. The measures were also derived based on the GQMparadigm. The GQM led to three categories of measures, namely measures regardingcustomer satisfaction, costs of the maintenance program, and schedule. The measurescapturing customer satisfaction was the backlog of MRs to be fulfilled, the cycle time,and reliability. The cost category included measures for cost per delivery of mainte-nance result in dollar, and cost per maintenance activity. In addition the maintenanceeffort of staff and the number of changes needed per request were captured, as wellas the effort spent on invalid change requests. The schedule category was captured bymeasuring the difficulty of implementing the change (e.g. if a change is very complexit takes longer time). Additional measures were the number of changes planned fordelivery, and the number of changes meeting the schedule.
Chan [5] raises the importance of addressing MRs quickly, i.e. with short lead-time.To capture the lead-time he distinguishes queuing time and service time. Queuing timeis the time from arrival of a request until the actual implementation and servicing of therequest is started. In other words, queuing time is waiting time. Service time is the timewhere actual work is done on the request including implementation and verification.
The following observations regarding the related work can be made: Often the lit-erature reported measures that are relevant for lean software development, but they arereported in isolation. For example, it is important to distinguish waiting time and ser-vice time (cf. [5]) as waiting time is often much easier to improve than actual workpractices. In addition, the measures do not make use of visualizations considered im-portant in a lean context to communicate and easily identify improvement potentials.Another important aspect is that some approaches require considerable effort in imple-mentation. The approach introduced by Henry et al. [7] required extensive modeling
255
Chapter 9. Lean Software Maintenance
and hence is a challenge to implement. Furthermore, Rombach and Ulery [16] reportedthat the introduction of their maintenance measurement program required considerableeffort.
Given the benefits achieved in lean product development the novel contribution ofthe approach presented in this paper is to:
• Provide an analysis approach that allows the analysis of the maintenance pro-cess driven by lean principles, as in previous related work some lean measureshave been proposed in isolation, but were not captured in one approach. Fur-thermore, the lean software maintenance approach captures multiple dimensions(i.e. product and process).
• Make use of visualizations for easy communication with management, as veryfew approaches provide good guidelines of how to visualize collected measures.
• Base the analysis tool on as few needed measurements as possible to allow foran easy introduction in software organizations.
9.3 Lean Software MaintenanceAs mentioned earlier, the goal driving the development of lean software maintenanceis to increase the efficiency and effectiveness of software maintenance from a leansoftware development perspective. Hence, the questions asked are linked to the leanprinciples mentioned in the introduction. The following GQM questions were identi-fied:
• Q1: How is the quality over time delivered to the customer? This question islinked to the goal as it relates to the concept of building quality in, i.e. knowingthe quality level over time provides an indication of whether an organizationsucceeded in that principle. Hence, when the answer is that good quality isdelivered then the performance is good from that lean perspective.
• Q2: How continuous and with what throughput do we process MRs from cus-tomers? This principle relates to waste, and in particular work in progress. Workin progress is not yet delivered to the customer and hence is considered waste.This type of waste motivated just in time which is the production without in-ventories in between. In other words, it is important to not have half finishedwork-products being stuck in the process for too long as there is a risk that theybecome obsolete, wasting the already invested effort. Continuous means thatwork products should be produced all the time instead of queuing them up and
256
realizing them all at once. Queuing up and building inventories often leads tothe risk of an overload situation [12]. In addition, queuing up delays feedbackand hence it becomes harder to fix problems. High throughput refers to velocity,i.e. it is desirable to resolve many MRs per time unit. Overall, the answer to thisquestion relates to the goal as much waste in the process indicates inefficiencies(cf. [13].
• Q3: How fast do we respond to the needs raised by the customer? This questioncaptures the ability of the organization of how fast it is able to resolve a requestfrom its emergence to delivery. The fast delivery of valuable software is consid-ered as an important aspect of efficiency in lean [12] as well as agile softwaredevelopment [8].
• Q4: What is the level of work-load? It is important to understand the work-loadlevel on the developers as an overload situation can hinder the continuous flowand throughput, as well as increase lead-times [12]. In Chapter 7 we provided theanalogy of a highway. If the highway is almost full then the traffic goes slowlyand is close to a stand still. The best flow can be achieved with a work loadbelow capacity allowing the developers to think about solutions and to correctmistakes made.
The following measures are proposed for answering the GQM questions:
• M1 for Q1: Maintenance inflow of requests per week (Section 9.3.1).
• M2 for Q2: Visualization of the flow of MRs through the maintenance processin the form of cumulative flow diagrams (Section 9.3.2).
• M3 for Q3: Lead-time measurement considering queuing/waiting time and pro-ductive/value adding time (Section 9.3.3).
• M4 for Q4: Statistical process control chart showing stability of work-load overtime (Section 9.3.4).
The measures mainly concern efficiency (i.e. doing things right to produce MRsin a continuous manner with high throughput and short lead-time). To incorporate theeffectiveness (doing the right thing) we need to incorporate the importance and severityof the MRs and based on that conduct separate analyses for each of the questions. Thisallows to compare the performance of maintenance tasks on critical versus less criticalMRs. The right thing to do in this case is to have better performance for the morecritical tasks.
257

Chapter 9. Lean Software Maintenance
9.3.1 Maintenance Inflow (M1)The maintenance inflow shows the incoming requests from customers for needed main-tenance activities. As pointed out earlier, the MRs can be either corrective or enhance-ments. The inflow should be measured as number of new MRs per time unit (e.g.week). The measure can be visualized through a control chart, showing the time on thex-axis and the number of new MRs on the y-axis (also referred to as a time-series). Todetect whether the process is under control the chart could be extended by marking themean value in the chart, and plotting the upper and lower control limits (usually two orthree standard deviations away from the mean).
9.3.2 Visualization Through Cumulative Flow Diagrams (M2)A fictional example of the construction of a cumulative flow diagram is shown in Figure9.1. The x-axis shows the time-line and the y-axis shows the cumulative number of ofMRs. The top-line (marked as inflow by the arrow) is the total number of MRs indevelopment. In week 9 this was around 160, while it increased to around 220 in week20. Even though the flow is shown we propose to treat it as a separate measure (M1)and with that analyze the stability of the process with regard to the mean value and thedeviations from the mean through upper control and lower control limits, which is notpossible within the flow diagram.
The second line from the top represents the hand-over from phase A to phase B, thefollowing line from phase B to phase C, and so forth. The vertical distance betweentwo lines shows the work in process for a phase at a specific point in time. For example,in week 15 there are about 50 MRs in Phase B.
From the flow diagram a number of interpretations can be made with regard to thecontinuous flow and the high throughput.
• Continuous flow: Observing the figure it is visible that the flow of hand-oversfrom phase C to phase D is discontinuous. That is, there is a long time of inac-tivity (week 9-13) and then suddenly a large hand-over occurs. That means, forexample, that work done in week 9 and 10 can receive feedback from the follow-ing phase 5 weeks later. In addition, a long time of inactivity might lead to anoverload situation when the work has to be done at once, and at the same timehas potential of causing quality problems. For example, if phase D would bean integration testing phase with long times of inactivity a big-bang integrationwould become necessary.
• Throughput: The throughput is characterized by the rate in which MRs arehanded over from one phase to the other. As can be seen the hand-overs from
258
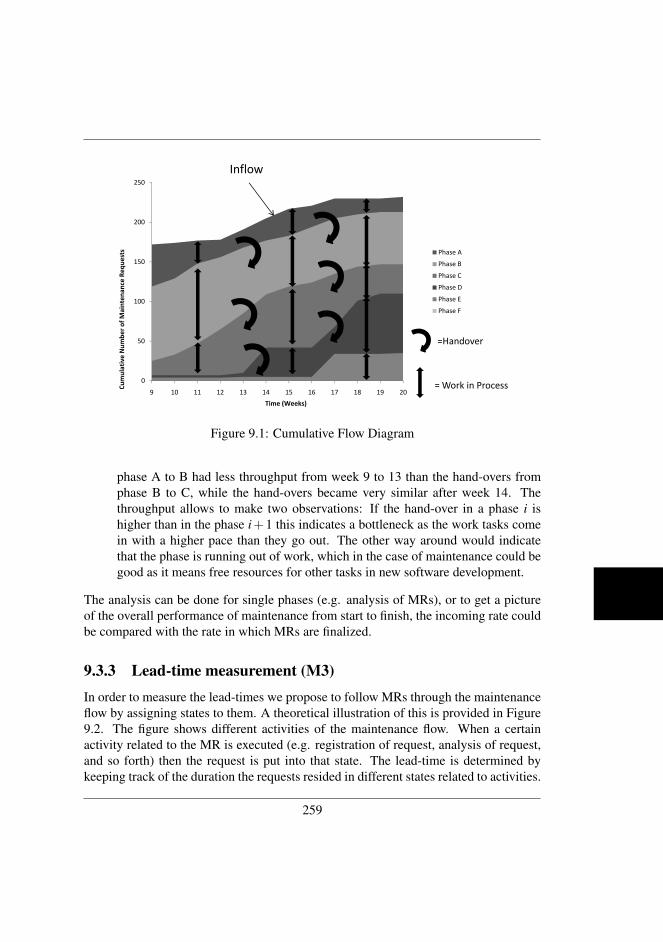
150
200
250
Cu
mu
lati
ve
Nu
mb
er
of
Ma
inte
na
nce
Re
qu
est
s Phase A
Phase B
Phase C
Inflow
0
50
100
9 10 11 12 13 14 15 16 17 18 19 20
Cu
mu
lati
ve
Nu
mb
er
of
Ma
inte
na
nce
Re
qu
est
s
Time (Weeks)
Phase D
Phase E
Phase F
=Handover
= Work in Process
Figure 9.1: Cumulative Flow Diagram
phase A to B had less throughput from week 9 to 13 than the hand-overs fromphase B to C, while the hand-overs became very similar after week 14. Thethroughput allows to make two observations: If the hand-over in a phase i ishigher than in the phase i+1 this indicates a bottleneck as the work tasks comein with a higher pace than they go out. The other way around would indicatethat the phase is running out of work, which in the case of maintenance could begood as it means free resources for other tasks in new software development.
The analysis can be done for single phases (e.g. analysis of MRs), or to get a pictureof the overall performance of maintenance from start to finish, the incoming rate couldbe compared with the rate in which MRs are finalized.
9.3.3 Lead-time measurement (M3)In order to measure the lead-times we propose to follow MRs through the maintenanceflow by assigning states to them. A theoretical illustration of this is provided in Figure9.2. The figure shows different activities of the maintenance flow. When a certainactivity related to the MR is executed (e.g. registration of request, analysis of request,and so forth) then the request is put into that state. The lead-time is determined bykeeping track of the duration the requests resided in different states related to activities.
259
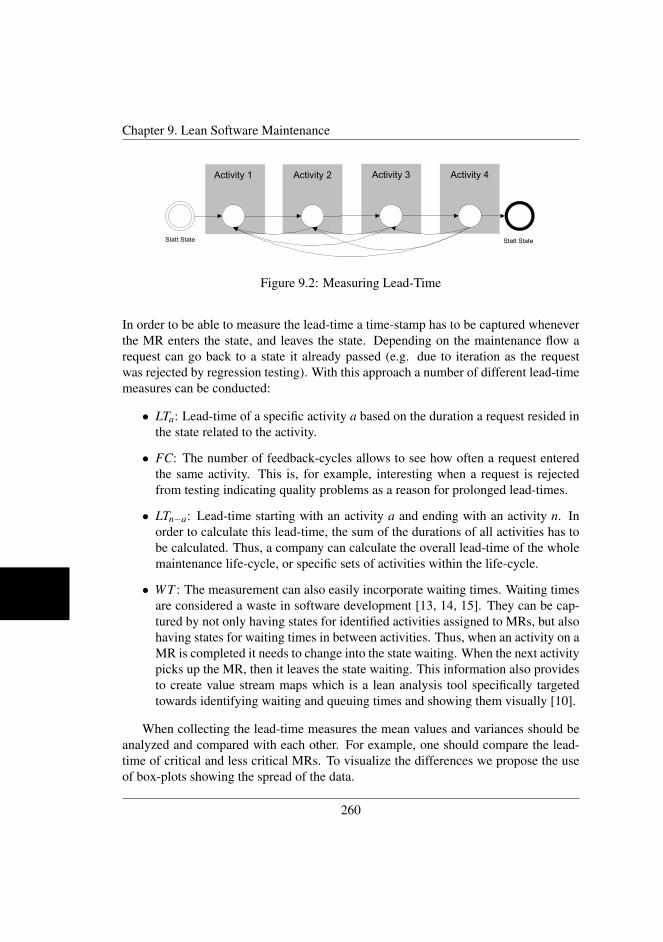
Chapter 9. Lean Software Maintenance
Activity 1 Activity 2 Activity 3 Activity 4
Statt State Statt State
Exploration
PhasePlanning
Phase
Iterations to
Release Phase
Productionizing
Phase
Architectural
Spike
User Story
Release
Planning
Spike
IterationAcceptance
Test
Small
ReleasesSystem
Metaphor
Release
Plan
Customer
Approval
Test Scenarios
Faults
Next Iteration
Rewrite User Story
Project Velocity
Customer
Need DeliveredRelease
User StoryImpementation
Write User
Story/
Requirement
Release
Planning Test
Figure 9.2: Measuring Lead-Time
In order to be able to measure the lead-time a time-stamp has to be captured wheneverthe MR enters the state, and leaves the state. Depending on the maintenance flow arequest can go back to a state it already passed (e.g. due to iteration as the requestwas rejected by regression testing). With this approach a number of different lead-timemeasures can be conducted:
• LTa: Lead-time of a specific activity a based on the duration a request resided inthe state related to the activity.
• FC: The number of feedback-cycles allows to see how often a request enteredthe same activity. This is, for example, interesting when a request is rejectedfrom testing indicating quality problems as a reason for prolonged lead-times.
• LTn−a: Lead-time starting with an activity a and ending with an activity n. Inorder to calculate this lead-time, the sum of the durations of all activities has tobe calculated. Thus, a company can calculate the overall lead-time of the wholemaintenance life-cycle, or specific sets of activities within the life-cycle.
• WT : The measurement can also easily incorporate waiting times. Waiting timesare considered a waste in software development [13, 14, 15]. They can be cap-tured by not only having states for identified activities assigned to MRs, but alsohaving states for waiting times in between activities. Thus, when an activity on aMR is completed it needs to change into the state waiting. When the next activitypicks up the MR, then it leaves the state waiting. This information also providesto create value stream maps which is a lean analysis tool specifically targetedtowards identifying waiting and queuing times and showing them visually [10].
When collecting the lead-time measures the mean values and variances should beanalyzed and compared with each other. For example, one should compare the lead-time of critical and less critical MRs. To visualize the differences we propose the useof box-plots showing the spread of the data.
260
9.3.4 Work-load (M4)
The work-load analysis is interesting with regard to the work-load in value-adding ac-tivities over time. For that purpose the work in progress measured as the number ofMRs at a specific point in time should be plotted and analyzed using statistical processcontrol. The control chart then should be used to have a dialog with the developers exe-cuting the activities to determine which work level is considered an overload situation.In order to be able to properly analyze the workload the requests should be estimatedbased on their complexity, as a complex problem is likely to be causing more work-loadthan an easy to fix problem. This can be, for example, done by categorizing requestsin very complex, complex, and less complex. This can mean different things for dif-ferent companies, and hence each company has to define its own thresholds for thecategorization.
9.3.5 Prerequisites
The analysis for M1 to M4 can be realized with relatively few measurement points.The following information need to be captured to conduct the most basic analysis:
1. Registration of MRs with time-stamps to determine the in-flow (realizing M1).
2. A tracking system for states of the maintenance process. When the state changesit has to be updated in the system. With the update the system keeps track of thedate and time when the update was made (realizing M2, M3, and M4).
3. A weighting of the MR with regard to value and complexity. The weightingsupports the analysis of effectiveness by comparing the performance in resolvingcritical verses less critical MRs.
In the measurement it is of benefit to also have states for waiting times as well, ashas been argued for previously (see Section 9.3.3).
9.4 Research MethodThe research method used is an industrial case study [22], the study allowing to under-stand a specific situation (the use of lean software maintenance) in a given context. Thecase study can be characterized based on the template proposed in Wohlin et al [21].
• Analyze Lean Software Maintenance for the purpose of evaluation,
261
Chapter 9. Lean Software Maintenance
• with respect to the ability to show the presence/absence of inefficiencies andineffectiveness,
• from the point of view of the researcher,
• in the context of large scale industrial software development dealing with cor-rective maintenance.
The description of the case study illustrates the main components as described inYin [22], namely the case and context, the units of analysis, propositions, and the datacollection and analysis. In addition, threats to validity are discussed.
9.4.1 Case and ContextThe case being studied is a development site of Ericsson AB, a Fortune 500 com-pany working with large-scale software development producing telecommunicationand multimedia applications. It is important to describe different dimensions of thecontext (e.g. product, market, process) in order to judge the outcome of a study andto be able to generalize the results [11]. Hence, Table 9.1 shows the context elementsfor this study. It is important to note that the company is dealing with business criticalapplications with MRs on performance and reliability. The products are developed fora market, meaning that it is not developed for one specific customer (bespoke develop-ment). Instead, the product is offered to a market with many potential customers, notknowing exactly in advance who will actually buy the product.
9.4.2 Unit of AnalysisThe unit of analysis is the maintenance process used for maintaining one large systemdeveloped at the case company. Figure 9.3 provides an overview of the maintenanceprocess. The process starts with a customer raising a MR, which then is registered inthe system by support. In the next step the MR is moved to the appropriate designorganization. The next step is the analysis of the MR to understand it. In addition testcases are designed and executed to verify the MR. If the MR is understood and thetest cases are clear it goes to the design, implementation, and test phase. If the MRis not clear, further analysis is necessary. In the analysis the design organization isworking together with support receiving the information about the problem from thecustomer, and with experts knowing the system very well who serve as a consultant.When the MR is understood it is designed and implemented. The implementation ofthe MR needs to be verified, the verification being confirmed in a so-called technicalanswer, confirming that the solution is complete, coding standards are met, and that
262
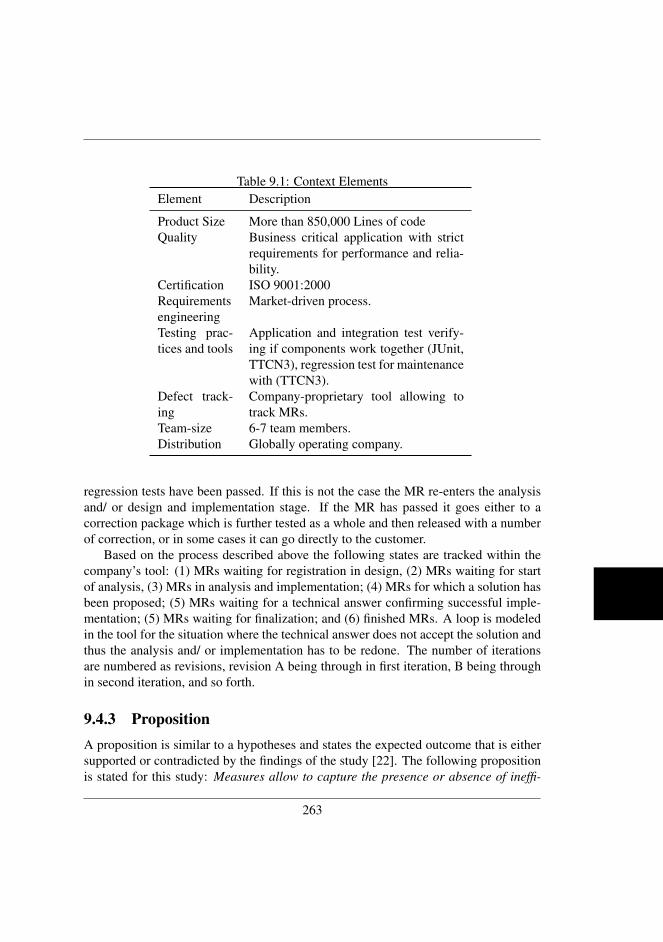
Table 9.1: Context ElementsElement Description
Product Size More than 850,000 Lines of codeQuality Business critical application with strict
requirements for performance and relia-bility.
Certification ISO 9001:2000Requirementsengineering
Market-driven process.
Testing prac-tices and tools
Application and integration test verify-ing if components work together (JUnit,TTCN3), regression test for maintenancewith (TTCN3).
Defect track-ing
Company-proprietary tool allowing totrack MRs.
Team-size 6-7 team members.Distribution Globally operating company.
regression tests have been passed. If this is not the case the MR re-enters the analysisand/ or design and implementation stage. If the MR has passed it goes either to acorrection package which is further tested as a whole and then released with a numberof correction, or in some cases it can go directly to the customer.
Based on the process described above the following states are tracked within thecompany’s tool: (1) MRs waiting for registration in design, (2) MRs waiting for startof analysis, (3) MRs in analysis and implementation; (4) MRs for which a solution hasbeen proposed; (5) MRs waiting for a technical answer confirming successful imple-mentation; (5) MRs waiting for finalization; and (6) finished MRs. A loop is modeledin the tool for the situation where the technical answer does not accept the solution andthus the analysis and/ or implementation has to be redone. The number of iterationsare numbered as revisions, revision A being through in first iteration, B being throughin second iteration, and so forth.
9.4.3 PropositionA proposition is similar to a hypotheses and states the expected outcome that is eithersupported or contradicted by the findings of the study [22]. The following propositionis stated for this study: Measures allow to capture the presence or absence of ineffi-
263
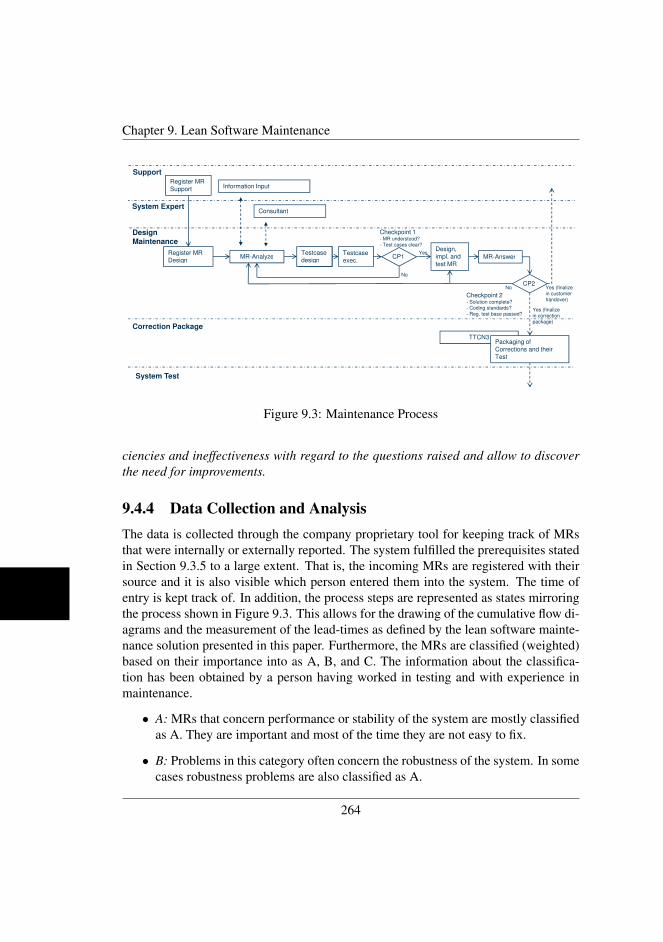
Chapter 9. Lean Software Maintenance
TC
design
SDP DM in-house work flow
Support
System Expert
Design
Maintenance
Register MR
Design
MR-Analyze
TC
designMR-Answer
Register MR
SupportInformation Input
Consultant
CP1
YesTestcase
design
Design,
impl. and
Checkpoint 1
- MR understood?
- Test cases clear?
Testcase
exec.
Ericsson Confidential Buy Design Maintenance 2009-08-272
design
Correction Package
System Test
Design
MR-Analyzedesign
MR-AnswerCP1
No
design
impl. and
test MR
TTCN3
Packaging of
Corrections and their
Test
Checkpoint 2
- Solution complete?
- Coding standards?
- Reg. test base passed?
CP2
No
exec.
Yes (finalize
in correction
package)
Yes (finalize
in customer
handover)
Figure 9.3: Maintenance Process
ciencies and ineffectiveness with regard to the questions raised and allow to discoverthe need for improvements.
9.4.4 Data Collection and AnalysisThe data is collected through the company proprietary tool for keeping track of MRsthat were internally or externally reported. The system fulfilled the prerequisites statedin Section 9.3.5 to a large extent. That is, the incoming MRs are registered with theirsource and it is also visible which person entered them into the system. The time ofentry is kept track of. In addition, the process steps are represented as states mirroringthe process shown in Figure 9.3. This allows for the drawing of the cumulative flow di-agrams and the measurement of the lead-times as defined by the lean software mainte-nance solution presented in this paper. Furthermore, the MRs are classified (weighted)based on their importance into as A, B, and C. The information about the classifica-tion has been obtained by a person having worked in testing and with experience inmaintenance.
• A: MRs that concern performance or stability of the system are mostly classifiedas A. They are important and most of the time they are not easy to fix.
• B: Problems in this category often concern the robustness of the system. In somecases robustness problems are also classified as A.
264
• C: These problems are less severe and more easy to fix, such as fixes in singlefunctions. Depending on how intensively the function is used by the user, or howhard the functional MR is to correct the MR can in cases also be classified as B.
For the analysis the MRs of the year 2009 were used as the performance measure,reflecting the current practice in conducting maintenance activities at the company. Theanalysis was done by applying the lean software maintenance solution on the data andconduct an analysis to demonstrate whether the solution is able to show the presenceor absence of inefficiencies and ineffectiveness. The interpretation was done by theresearcher who has good knowledge a the company’s processes as he is embedded inthe company. In addition, the results have been presented to a fellow practitioner tocheck whether the practitioner agrees with the observations made by the researcher.
9.4.5 Validity ThreatsValidity threats are important to discuss to support the interpretation of the data by oth-ers. In the following the validity threats and their relevance for this study are discussed.
Correctness of data: One threat to validity when working with industrial data is thecorrectness and the completeness of the data. In the case of the company the trackingsystem for MRs has been used for almost 15 years and hence the practitioners arevery familiar with using the system in their work, which reduces the threat of incorrectdata. When changing the state of a MR the system automatically keeps track of thedates, which avoids that dates could be wrongly entered. Hence, the correctness andcompleteness of the data is given.
Company specific maintenance process: The maintenance process of the companyis specific for the company. However, the method should be generally applicable toother maintenance processes as well if the explained prerequisites are met in the com-pany. Another limitation for generalization is that a corrective maintenance process hasbeen studied. However, the principle solution proposed in this paper stays the same,just different phases and thus states have to be identified and need to be kept track off.
One company: When studying a company the results are true in the context ofthe company. In order to aid in the generalization of the results the context has beendescribed. That is, the results were observed in a market-driven context working withlarge-scale software development.
Interpretation by the researcher: Another threat to validity is the correct inter-pretation of the data by the researcher. This threat was reduced as the researcher isembedded in the company and hence has knowledge about the processes. A bias in theanalysis was reduced by presenting the results of the analysis to a practitioner work-ing with testing and maintenance at the company. As the practitioner agreed with the
265
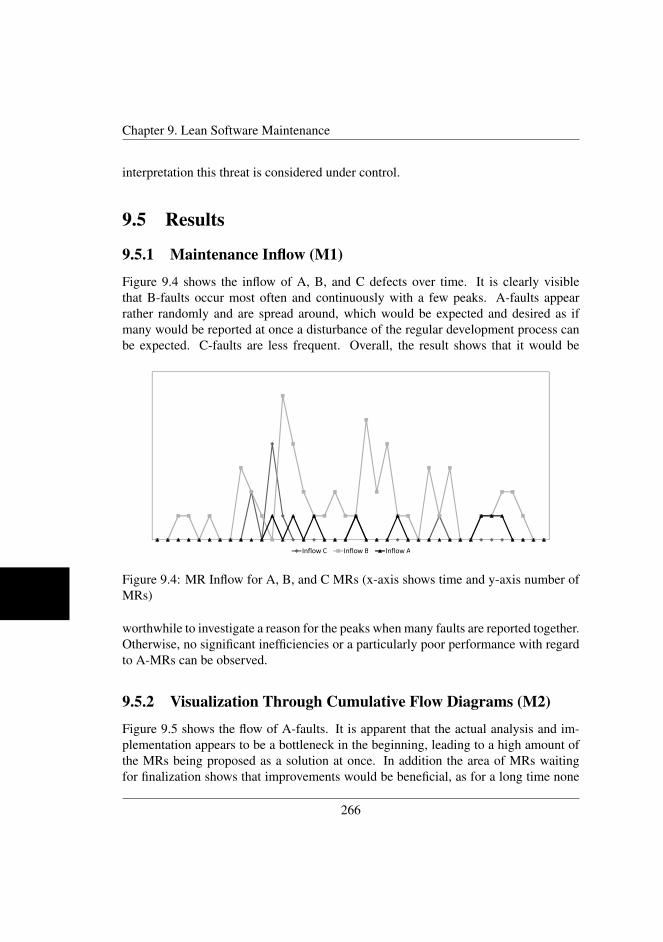
Chapter 9. Lean Software Maintenance
interpretation this threat is considered under control.
9.5 Results
9.5.1 Maintenance Inflow (M1)
Figure 9.4 shows the inflow of A, B, and C defects over time. It is clearly visiblethat B-faults occur most often and continuously with a few peaks. A-faults appearrather randomly and are spread around, which would be expected and desired as ifmany would be reported at once a disturbance of the regular development process canbe expected. C-faults are less frequent. Overall, the result shows that it would be
Inflow C Inflow B Inflow A
Figure 9.4: MR Inflow for A, B, and C MRs (x-axis shows time and y-axis number ofMRs)
worthwhile to investigate a reason for the peaks when many faults are reported together.Otherwise, no significant inefficiencies or a particularly poor performance with regardto A-MRs can be observed.
9.5.2 Visualization Through Cumulative Flow Diagrams (M2)
Figure 9.5 shows the flow of A-faults. It is apparent that the actual analysis and im-plementation appears to be a bottleneck in the beginning, leading to a high amount ofthe MRs being proposed as a solution at once. In addition the area of MRs waitingfor finalization shows that improvements would be beneficial, as for a long time none
266
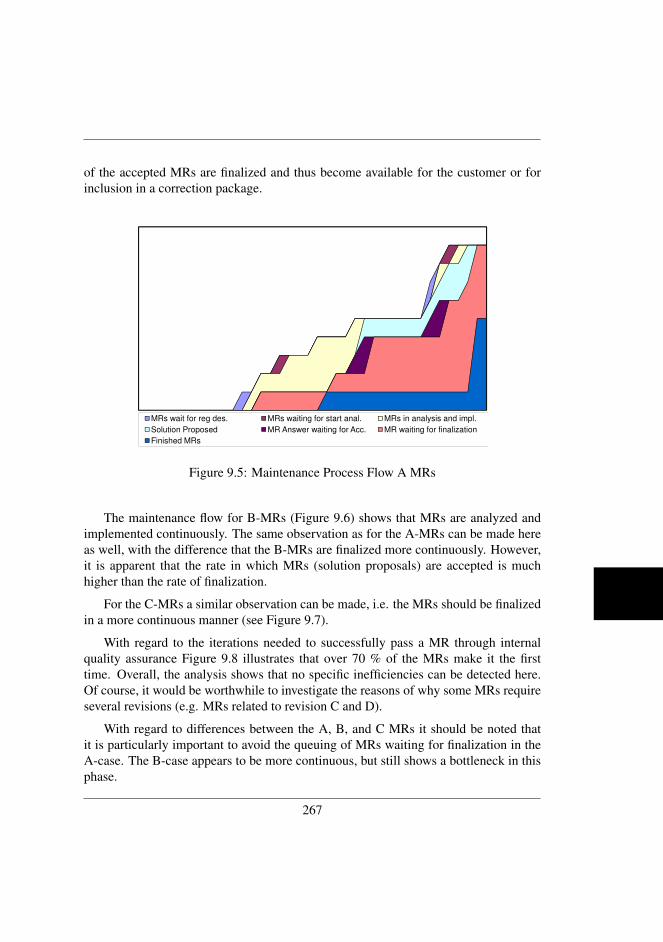
of the accepted MRs are finalized and thus become available for the customer or forinclusion in a correction package.
A TRs
MRs wait for reg des. MRs waiting for start anal. MRs in analysis and impl.
Solution Proposed MR Answer waiting for Acc. MR waiting for finalization
Finished MRs
Figure 9.5: Maintenance Process Flow A MRs
The maintenance flow for B-MRs (Figure 9.6) shows that MRs are analyzed andimplemented continuously. The same observation as for the A-MRs can be made hereas well, with the difference that the B-MRs are finalized more continuously. However,it is apparent that the rate in which MRs (solution proposals) are accepted is muchhigher than the rate of finalization.
For the C-MRs a similar observation can be made, i.e. the MRs should be finalizedin a more continuous manner (see Figure 9.7).
With regard to the iterations needed to successfully pass a MR through internalquality assurance Figure 9.8 illustrates that over 70 % of the MRs make it the firsttime. Overall, the analysis shows that no specific inefficiencies can be detected here.Of course, it would be worthwhile to investigate the reasons of why some MRs requireseveral revisions (e.g. MRs related to revision C and D).
With regard to differences between the A, B, and C MRs it should be noted thatit is particularly important to avoid the queuing of MRs waiting for finalization in theA-case. The B-case appears to be more continuous, but still shows a bottleneck in thisphase.
267
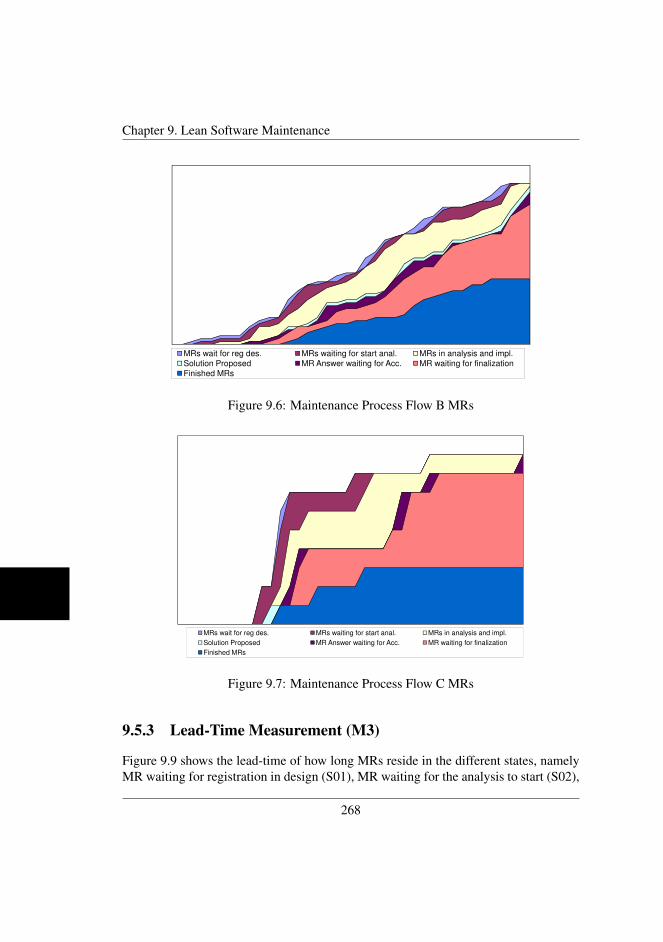
Chapter 9. Lean Software Maintenance
B TRs
MRs wait for reg des. MRs waiting for start anal. MRs in analysis and impl.
Solution Proposed MR Answer waiting for Acc. MR waiting for finalization
Finished MRs
Figure 9.6: Maintenance Process Flow B MRsC TRs
MRs wait for reg des. MRs waiting for start anal. MRs in analysis and impl.
Solution Proposed MR Answer waiting for Acc. MR waiting for finalization
Finished MRs
Figure 9.7: Maintenance Process Flow C MRs
9.5.3 Lead-Time Measurement (M3)
Figure 9.9 shows the lead-time of how long MRs reside in the different states, namelyMR waiting for registration in design (S01), MR waiting for the analysis to start (S02),
268
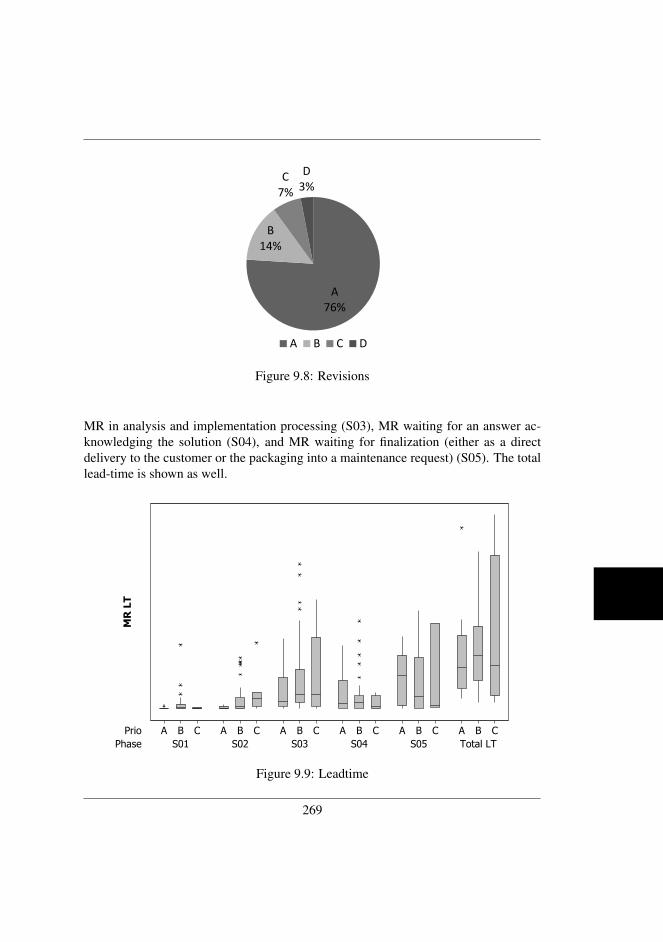
B
C
7%
D
3%
A
76%
B
14%
A B C D
Figure 9.8: Revisions
MR in analysis and implementation processing (S03), MR waiting for an answer ac-knowledging the solution (S04), and MR waiting for finalization (either as a directdelivery to the customer or the packaging into a maintenance request) (S05). The totallead-time is shown as well.
Phase
Prio
Total LTS05S04S03S02S01
CBACBACBACBACBACBA
MR LT
Boxplot of MR LT
Figure 9.9: Leadtime
269
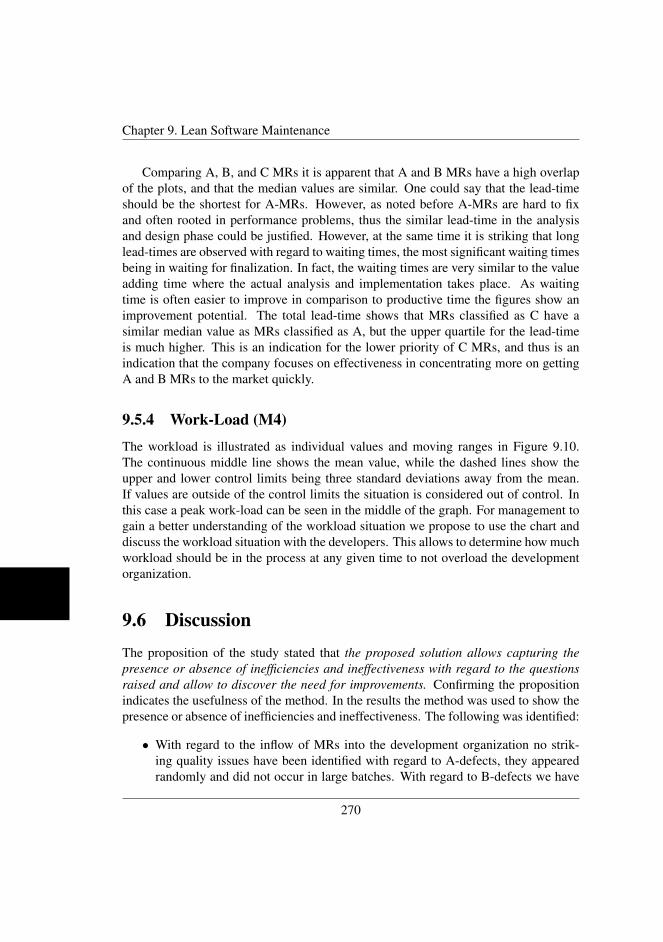
Chapter 9. Lean Software Maintenance
Comparing A, B, and C MRs it is apparent that A and B MRs have a high overlapof the plots, and that the median values are similar. One could say that the lead-timeshould be the shortest for A-MRs. However, as noted before A-MRs are hard to fixand often rooted in performance problems, thus the similar lead-time in the analysisand design phase could be justified. However, at the same time it is striking that longlead-times are observed with regard to waiting times, the most significant waiting timesbeing in waiting for finalization. In fact, the waiting times are very similar to the valueadding time where the actual analysis and implementation takes place. As waitingtime is often easier to improve in comparison to productive time the figures show animprovement potential. The total lead-time shows that MRs classified as C have asimilar median value as MRs classified as A, but the upper quartile for the lead-timeis much higher. This is an indication for the lower priority of C MRs, and thus is anindication that the company focuses on effectiveness in concentrating more on gettingA and B MRs to the market quickly.
9.5.4 Work-Load (M4)
The workload is illustrated as individual values and moving ranges in Figure 9.10.The continuous middle line shows the mean value, while the dashed lines show theupper and lower control limits being three standard deviations away from the mean.If values are outside of the control limits the situation is considered out of control. Inthis case a peak work-load can be seen in the middle of the graph. For management togain a better understanding of the workload situation we propose to use the chart anddiscuss the workload situation with the developers. This allows to determine how muchworkload should be in the process at any given time to not overload the developmentorganization.
9.6 DiscussionThe proposition of the study stated that the proposed solution allows capturing thepresence or absence of inefficiencies and ineffectiveness with regard to the questionsraised and allow to discover the need for improvements. Confirming the propositionindicates the usefulness of the method. In the results the method was used to show thepresence or absence of inefficiencies and ineffectiveness. The following was identified:
• With regard to the inflow of MRs into the development organization no strik-ing quality issues have been identified with regard to A-defects, they appearedrandomly and did not occur in large batches. With regard to B-defects we have
270
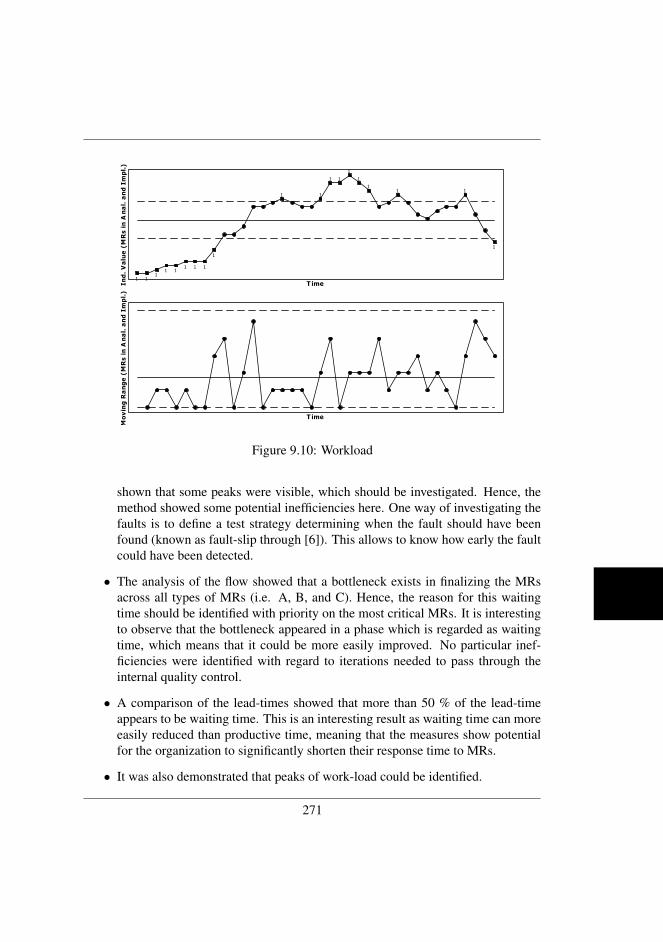
Work in Process
T imeInd. Value (MRs in Anal. and Impl.)
T ime
Moving Range (MRs in Anal. and Impl.)
1
111
1
1
11
11
1
11111
111
Figure 9.10: Workload
shown that some peaks were visible, which should be investigated. Hence, themethod showed some potential inefficiencies here. One way of investigating thefaults is to define a test strategy determining when the fault should have beenfound (known as fault-slip through [6]). This allows to know how early the faultcould have been detected.
• The analysis of the flow showed that a bottleneck exists in finalizing the MRsacross all types of MRs (i.e. A, B, and C). Hence, the reason for this waitingtime should be identified with priority on the most critical MRs. It is interestingto observe that the bottleneck appeared in a phase which is regarded as waitingtime, which means that it could be more easily improved. No particular inef-ficiencies were identified with regard to iterations needed to pass through theinternal quality control.
• A comparison of the lead-times showed that more than 50 % of the lead-timeappears to be waiting time. This is an interesting result as waiting time can moreeasily reduced than productive time, meaning that the measures show potentialfor the organization to significantly shorten their response time to MRs.
• It was also demonstrated that peaks of work-load could be identified.
271
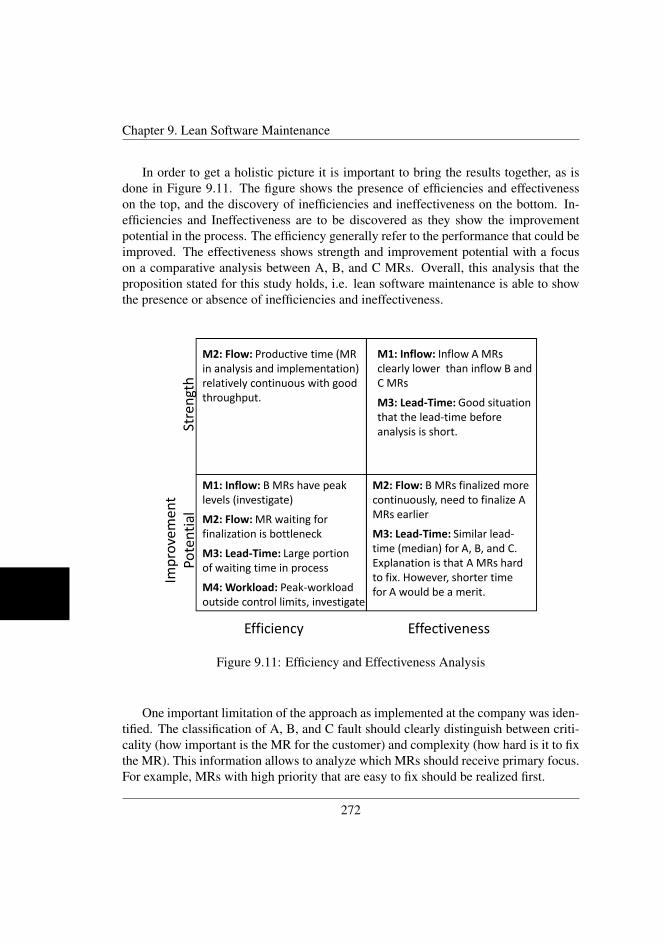
Chapter 9. Lean Software Maintenance
In order to get a holistic picture it is important to bring the results together, as isdone in Figure 9.11. The figure shows the presence of efficiencies and effectivenesson the top, and the discovery of inefficiencies and ineffectiveness on the bottom. In-efficiencies and Ineffectiveness are to be discovered as they show the improvementpotential in the process. The efficiency generally refer to the performance that could beimproved. The effectiveness shows strength and improvement potential with a focuson a comparative analysis between A, B, and C MRs. Overall, this analysis that theproposition stated for this study holds, i.e. lean software maintenance is able to showthe presence or absence of inefficiencies and ineffectiveness.
Str
en
gth
Imp
rove
me
nt
Po
ten
tia
l
M1: Inflow: B MRs have peak
levels (investigate)
M1: Inflow: Inflow A MRs
clearly lower than inflow B and
C MRs
M2: Flow: B MRs finalized more
continuously, need to finalize A
MRs earlierM2: Flow: MR waiting for
finalization is bottleneck
M2: Flow: Productive time (MR
in analysis and implementation)
relatively continuous with good
throughput.
M3: Lead-Time: Similar lead-
M3: Lead-Time: Good situation
that the lead-time before
analysis is short.
Imp
rove
me
nt
Po
ten
tia
l
Efficiency Effectiveness
finalization is bottleneck
M3: Lead-Time: Large portion
of waiting time in process
M3: Lead-Time: Similar lead-
time (median) for A, B, and C.
Explanation is that A MRs hard
to fix. However, shorter time
for A would be a merit. M4: Workload: Peak-workload
outside control limits, investigate
Figure 9.11: Efficiency and Effectiveness Analysis
One important limitation of the approach as implemented at the company was iden-tified. The classification of A, B, and C fault should clearly distinguish between criti-cality (how important is the MR for the customer) and complexity (how hard is it to fixthe MR). This information allows to analyze which MRs should receive primary focus.For example, MRs with high priority that are easy to fix should be realized first.
272
9.7 ConclusionIn this paper a novel approach of implementing lean software maintenance has been in-troduced. The solution relies on the analysis of the software maintenance process witha specific focus on lean aspects (see the whole, build quality in, continuous delivery ofvalue, etc.). The goal of the approach was to identify inefficiencies and ineffectivenesswith regard lean principles. Four analysis tools have been proposed, namely the inflowof MRs, the visualization of the flow through the maintenance process with cumula-tive flow diagrams, lead-time measures based on state diagrams, and the analysis ofworkload peaks with process control charts.
The approach has been evaluated in an industrial case study at Ericsson AB. Thestudy demonstrated that the approach was able to identify the presence or absence ofinefficiencies and ineffectiveness in the maintenance process. We also have shown thatlean software maintenance requires the company to keep track of few measurements,still allowing for a comprehensive analysis. In fact, the system implemented at thecompany allowed the immediate application. The prerequisites for implementing theapproach are quite minimal, a company has only to keep track of registration of MRswith time-stamps, state-changes of the MRs in the process, and the criticality of theMRs have to be identified. Other companies can implement the process by definingspecific states and keeping track of them. In the case of the studied company we wereable to apply the measurements out of the box based on the tracking system alreadyexisting. In future work lean software maintenance needs to be investigated in differentindustrial contexts.
9.8 References[1] Reiner R. Dumke, Alain April, and Alain Abran. Software maintenance pro-
ductivity measurement: how to assess the readiness of your organization. InProceedings of the International Conference on Software Process and ProductMeasurement (IWSM/Metrikon 2004), pages 1–12, 2004.
[2] Omar Alam, Bram Adams, and Ahmed E. Hassan. Measuring the progress ofprojects using the time dependence of code changes. In Proceedings of the IEEEInternational Conference on Software Maintenance (ICSM 2009), pages 329–338, 2009.
[3] David J. Anderson. Agile Management for Software Engineering: Applying theTheory of Constraints for Business Results (The Coad Series). Prentice Hall PTR,2003.
273
REFERENCES
[4] Victor R. Basili. The experience factory and its relationship to other quality ap-proaches. Advances in Computers, 41:65–82, 1995.
[5] Taizan Chan. Beyond productivity in software maintenance: Factors affectinglead time in servicing users’ requests. In Proceedings of the IEEE InternationalConference on Software Maintenance (ICSM 2000), pages 228–235, 2000.
[6] Lars-Ola Damm, Lars Lundberg, and Claes Wohlin. Faults-slip-through - a con-cept for measuring the efficiency of the test process. Software Process: Improve-ment and Practice, 11(1):47–59, 2006.
[7] Joel Henry, Robert Blasewitz, and David Kettinger. Defining and implementinga measurement-based software process. Software Maintenance: Research andPractice, 8:79–100, 1996.
[8] Craig Larman. Agile and Iterative Development: A Manager’s Guide. PearsonEducation, 2003.
[9] James M Morgan and Jeffrey K. Liker. The Toyota product development system:integrating people, process, and technology. Productivity Press, New York, 2006.
[10] Shahid Mujtaba, Robert Feldt, and Kai Petersen. Waste and lead time reduction ina software product customization process with value stream maps. In Proceedingsof the Australian Software Engineering Conference (ASWEC 2010) (accepted),2010.
[11] Kai Petersen and Claes Wohlin. Context in industrial software engineering re-search. In Proceedings of the 3rd International Symposium on Empirical SoftwareEngineering and Measurement (ESEM 2009), pages 401–404, 2009.
[12] Kai Petersen and Claes Wohlin. Software process improvement through the leanmeasurement (SPI-LEAM) method. Journal of Systems and Software, in print,2010.
[13] Mary Poppendieck and Tom Poppendieck. Lean software development: an agiletoolkit. Addison-Wesley, Boston, 2003.
[14] Mary Poppendieck and Tom Poppendieck. Implementing lean software develop-ment: from concept to cash. Addison-Wesley, 2007.
[15] Mary Poppendieck and Tom Poppendieck. Leading lean software development:results are not the point. Addison-Wesley, Upper Saddle River, NJ, 2010.
274
[16] Hans D. Rombach and Bradford T. Ulery. Improving software maintenancethrough measurement. Proceedings of the IEEE, 77(4):581 – 95, 1989.
[17] Norman F. Schneidewind. Measuring and evaluating maintenance process us-ing reliability, risk, and test metrics. In Proceedings of the IEEE InternationalConference on Software Maintenance (ICSM 1997), pages 232–242, 1997.
[18] T. Scott and D. Farley. Slashing software maintenance costs. Business SoftwareReview, 1988.
[19] Harry M. Sneed. Measuring the performance of a software maintenance depart-ment. In Proceedings of the First Euromicro Conference on Software Mainte-nance and Reengineering (EUROMICRO 1997), pages 119 –127, 1997.
[20] George E. Stark. Measurements for managing software maintenance. In Pro-ceedings of the IEEE International Conference on Software Maintenance (ICSM1996), pages 152–162, 1996.
[21] Claes Wohlin, Per Runeson, Martin Host, Magnus C. Ohlsson, Bjorn Regnell,and Anders Wesslen. Experimentation in Software Engineering: An Introduction(International Series in Software Engineering). Springer, 2000.
[22] Robert K. Yin. Case Study Research: Design and Methods, 3rd Edition, AppliedSocial Research Methods Series, Vol. 5. Prentice Hall, 2002.
275
REFERENCES
276
Appendix A
Interview Protocol
A.1 Introduction
• Explain the nature of the study to the respondent, telling how or through whomhe came to be selected:
– Goal of the study: Understanding hindering factors in the different devel-opment models (traditional, streamline, streamline enhanced).
– What is done: Compare the different models against each other in terms ofbottlenecks, avoidable rework and unnecessary work.
– Benefit for the interviewee: Interview is the basis for further improvingthe different models considering the different views of people within theorganization, gives interviewee the chance to contribute to the improvementof the model they are supposed to apply in the future
• Give assurance that respondent will remain anonymous in any written reportsgrowing out of the study, and that his responses will be treated with strictestconfidence.
• Indicate that he may find some of the questions far-fetched, silly or difficult toanswer, for the reason that questions that are appropriate for one person are notalways appropriate for another. Since there are no right or wrong answers, heis not to worry about these but to do as best he can with them. We are onlyinterested in his opinions and personal experiences.
277
Chapter A. Appendix A: Interview Protocol
• Interviewee is to feel perfectly free to interrupt, ask clarification of the inter-viewer, criticize a line of questioning etc.
• Interviewer is to ask permission to tape record the interview, explaining why hewishes to do this.
A.2 Warm-up and Experience• What is your professional background (how long at the company, education)?
• What is your role within the development life-cycle at Ericsson (short descrip-tion)? Include information such as department, discipline (there are a numberof pre-defined disciplines at the company for different development activities).How long have you been working in this role?
• In which other disciplines have you been working and for how long?
• What is your experience with traditional development and streamline develop-ment? Select from the following options with multiple selections being possible(has to be done once for each model):
– No previous experience– Studied documentation– Informal discussion with colleagues– Seminar and group discussions– Used in one project (started or completed)– Used in several projects
A.3 Main Body of the Interview
A.3.1 Plan-Driven DevelopmentThe first question concerns bottlenecks.
Definition provided to the interviewee: Bottlenecks is a phenomena that hinders theperformance or capacity of the entire development lifecycle due to a single componentcausing it (=bottleneck). Bottlenecks are therefore a cause for reduction in throughput.
Question: What are three critical bottlenecks you experienced / you think arepresent in the traditional way of working (plan-driven)?
When describing three bottlenecks, please focus on:
278
• Which product was developed?
• Where in the development process does the bottleneck occur?
• Why is it a bottleneck (ask for the cause)?
• How does the bottleneck affect the overall development lifecycle?
The following questions concern waste. When talking about waste, we distinguishtwo types of waste we would like to investigate. These types of waste are unnecessarywork and avoidable rework. A definition for each type is presented to the interviewee.
Type 1 - Avoidable Rework: Investigating avoidable rework helps us to answer:“are we doing things right”? That is, if something has been done incorrectly, incom-pletely or inconsistently then it needs to be corrected through reworked.
Question: What avoidable rework (three for each) has been done in the plan-drivenapproach?
When describing the avoidable rework, please focus on:
• Which product was developed?
• Where in the development process is the avoidable rework done?
• What was done incorrectly, incompletely or inconsistently?
• Why is the rework avoidable?
Type 2 - Unnecessary work: Investigating unnecessary work helps us to answer:“are we doing the right things”? That is, unnecessary work has been conducted thatdoes not contribute to customer value. It is not avoidable rework, as it is not connectedto correcting things that have been done wrong.
Question: What is unnecessary work (three for each) done in the plan-driven ap-proach?
When describing the unnecessary work, please focus on:
• Which product was developed?
• Where in the development process is the unnecessary work done?
• Why is the unnecessary work executed?
• How is the unnecessary work used in the development?
279
Chapter A. Appendix A: Interview Protocol
A.3.2 Incremental and Agile ApproachAfter having identified the critical issues in plan-driven development we would like tocapture what the situation is after introducing the new incremental and agile practices.
Note: In this part the same questions were asked as was the case for the plan-drivenapproach, now focusing on the situation after migrating to the incremental and agileapproach.
A.4 ClosingIs there anything else you would like to add that you think is interesting in this context,but not covered by the questions asked?
280
Appendix B
Qualitative Analysis
Figure B.1 illustrates the analysis steps presented in the description of the researchmethodology with an example of the identification of factor F01 shown in Table 4.6.
281
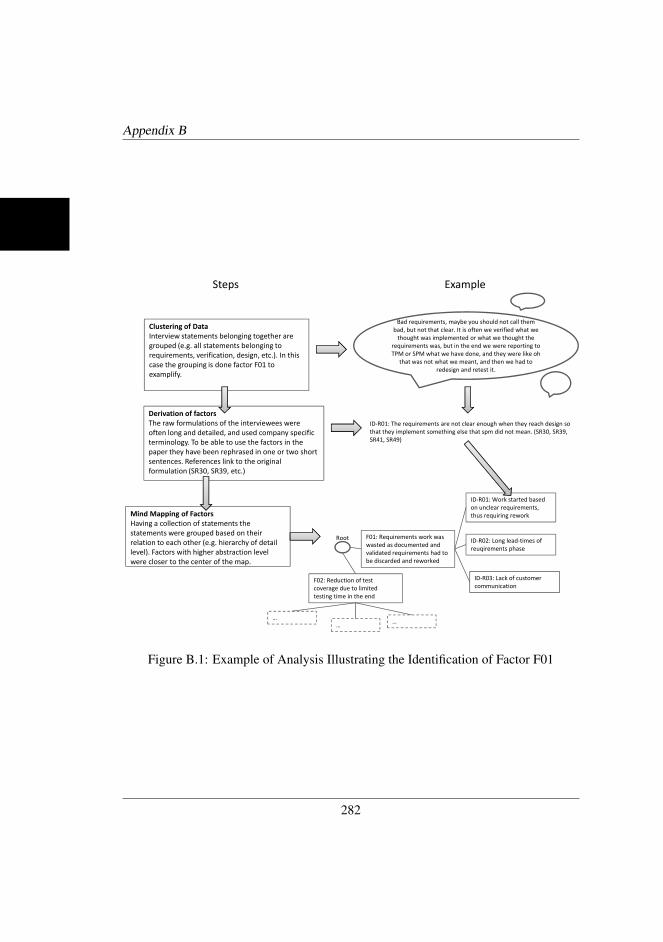
Appendix B
Clustering of Data
Interview statements belonging together are
grouped (e.g. all statements belonging to
requirements, verification, design, etc.). In this
case the grouping is done factor F01 to
examplify.
Derivation of factors
The raw formulations of the interviewees were
often long and detailed, and used company specific
terminology. To be able to use the factors in the
paper they have been rephrased in one or two short
sentences. References link to the original
Steps Example
Bad requirements, maybe you should not call them
bad, but not that clear. It is often we verified what we
thought was implemented or what we thought the
requirements was, but in the end we were reporting to
TPM or SPM what we have done, and they were like oh
that was not what we meant, and then we had to
redesign and retest it.
ID-R01: The requirements are not clear enough when they reach design so
that they implement something else that spm did not mean. (SR30, SR39,
SR41, SR49)
sentences. References link to the original
formulation (SR30, SR39, etc.)
Mind Mapping of Factors
Having a collection of statements the
statements were grouped based on their
relation to each other (e.g. hierarchy of detail
level). Factors with higher abstraction level
were closer to the center of the map.
F01: Requirements work was
wasted as documented and
validated requirements had to
be discarded and reworked
ID-R01: Work started based
on unclear requirements,
thus requiring rework
ID-R02: Long lead-times of
reuqirements phase
ID-R03: Lack of customer
communication
Root
F02: Reduction of test
coverage due to limited
testing time in the end
……
…
Figure B.1: Example of Analysis Illustrating the Identification of Factor F01
282
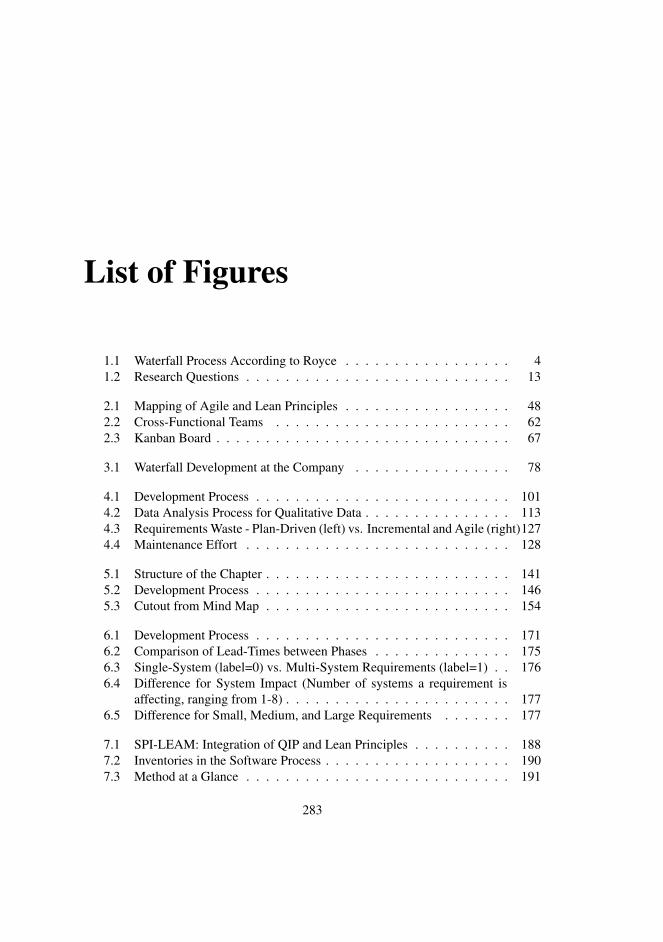
List of Figures
1.1 Waterfall Process According to Royce . . . . . . . . . . . . . . . . . 41.2 Research Questions . . . . . . . . . . . . . . . . . . . . . . . . . . . 13
2.1 Mapping of Agile and Lean Principles . . . . . . . . . . . . . . . . . 482.2 Cross-Functional Teams . . . . . . . . . . . . . . . . . . . . . . . . 622.3 Kanban Board . . . . . . . . . . . . . . . . . . . . . . . . . . . . . . 67
3.1 Waterfall Development at the Company . . . . . . . . . . . . . . . . 78
4.1 Development Process . . . . . . . . . . . . . . . . . . . . . . . . . . 1014.2 Data Analysis Process for Qualitative Data . . . . . . . . . . . . . . . 1134.3 Requirements Waste - Plan-Driven (left) vs. Incremental and Agile (right)1274.4 Maintenance Effort . . . . . . . . . . . . . . . . . . . . . . . . . . . 128
5.1 Structure of the Chapter . . . . . . . . . . . . . . . . . . . . . . . . . 1415.2 Development Process . . . . . . . . . . . . . . . . . . . . . . . . . . 1465.3 Cutout from Mind Map . . . . . . . . . . . . . . . . . . . . . . . . . 154
6.1 Development Process . . . . . . . . . . . . . . . . . . . . . . . . . . 1716.2 Comparison of Lead-Times between Phases . . . . . . . . . . . . . . 1756.3 Single-System (label=0) vs. Multi-System Requirements (label=1) . . 1766.4 Difference for System Impact (Number of systems a requirement is
affecting, ranging from 1-8) . . . . . . . . . . . . . . . . . . . . . . . 1776.5 Difference for Small, Medium, and Large Requirements . . . . . . . 177
7.1 SPI-LEAM: Integration of QIP and Lean Principles . . . . . . . . . . 1887.2 Inventories in the Software Process . . . . . . . . . . . . . . . . . . . 1907.3 Method at a Glance . . . . . . . . . . . . . . . . . . . . . . . . . . . 191
283
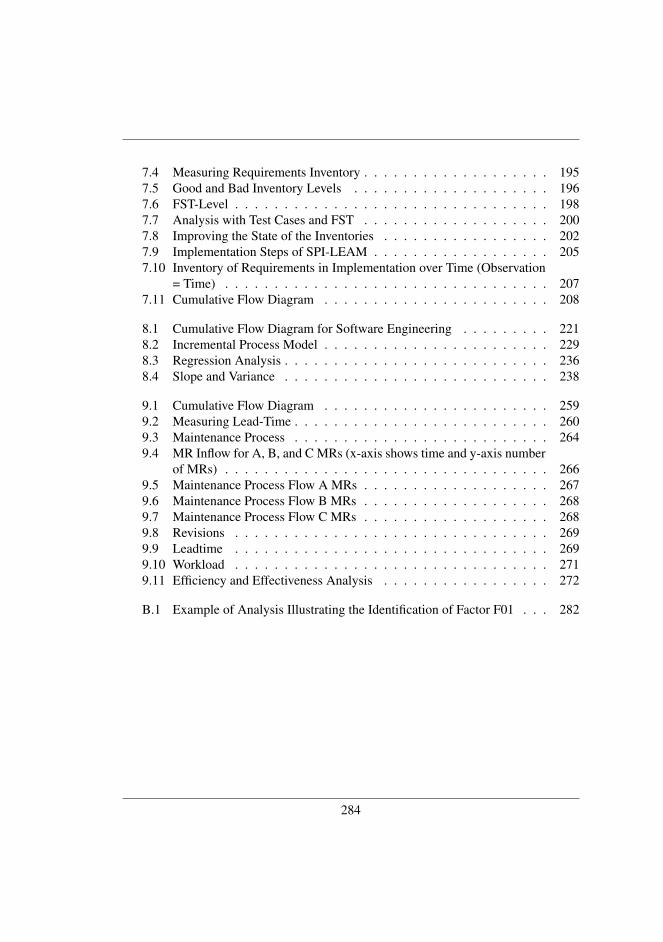
7.4 Measuring Requirements Inventory . . . . . . . . . . . . . . . . . . . 1957.5 Good and Bad Inventory Levels . . . . . . . . . . . . . . . . . . . . 1967.6 FST-Level . . . . . . . . . . . . . . . . . . . . . . . . . . . . . . . . 1987.7 Analysis with Test Cases and FST . . . . . . . . . . . . . . . . . . . 2007.8 Improving the State of the Inventories . . . . . . . . . . . . . . . . . 2027.9 Implementation Steps of SPI-LEAM . . . . . . . . . . . . . . . . . . 2057.10 Inventory of Requirements in Implementation over Time (Observation
= Time) . . . . . . . . . . . . . . . . . . . . . . . . . . . . . . . . . 2077.11 Cumulative Flow Diagram . . . . . . . . . . . . . . . . . . . . . . . 208
8.1 Cumulative Flow Diagram for Software Engineering . . . . . . . . . 2218.2 Incremental Process Model . . . . . . . . . . . . . . . . . . . . . . . 2298.3 Regression Analysis . . . . . . . . . . . . . . . . . . . . . . . . . . . 2368.4 Slope and Variance . . . . . . . . . . . . . . . . . . . . . . . . . . . 238
9.1 Cumulative Flow Diagram . . . . . . . . . . . . . . . . . . . . . . . 2599.2 Measuring Lead-Time . . . . . . . . . . . . . . . . . . . . . . . . . . 2609.3 Maintenance Process . . . . . . . . . . . . . . . . . . . . . . . . . . 2649.4 MR Inflow for A, B, and C MRs (x-axis shows time and y-axis number
of MRs) . . . . . . . . . . . . . . . . . . . . . . . . . . . . . . . . . 2669.5 Maintenance Process Flow A MRs . . . . . . . . . . . . . . . . . . . 2679.6 Maintenance Process Flow B MRs . . . . . . . . . . . . . . . . . . . 2689.7 Maintenance Process Flow C MRs . . . . . . . . . . . . . . . . . . . 2689.8 Revisions . . . . . . . . . . . . . . . . . . . . . . . . . . . . . . . . 2699.9 Leadtime . . . . . . . . . . . . . . . . . . . . . . . . . . . . . . . . 2699.10 Workload . . . . . . . . . . . . . . . . . . . . . . . . . . . . . . . . 2719.11 Efficiency and Effectiveness Analysis . . . . . . . . . . . . . . . . . 272
B.1 Example of Analysis Illustrating the Identification of Factor F01 . . . 282
284
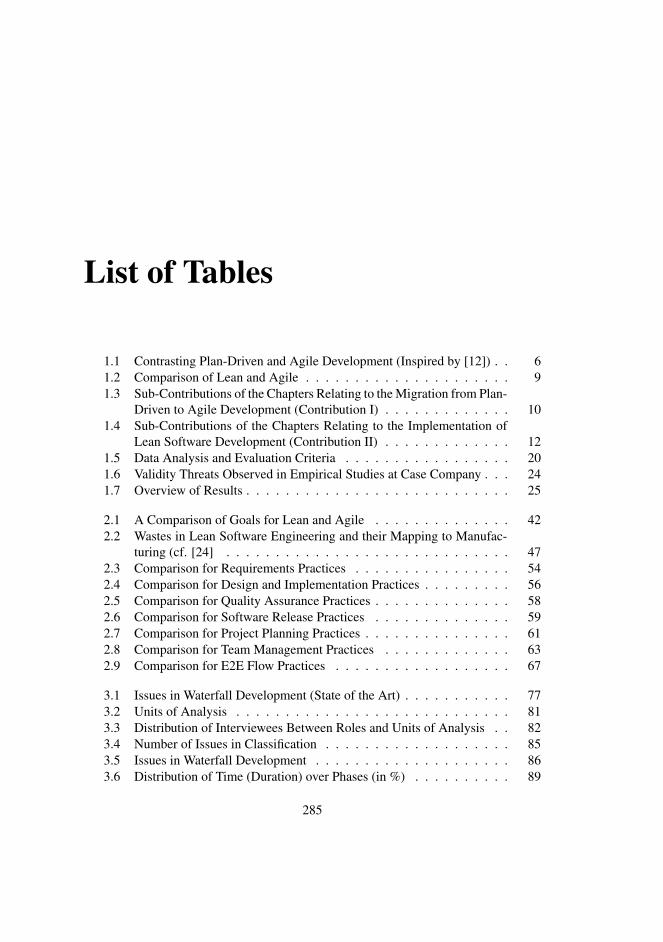
List of Tables
1.1 Contrasting Plan-Driven and Agile Development (Inspired by [12]) . . 61.2 Comparison of Lean and Agile . . . . . . . . . . . . . . . . . . . . . 91.3 Sub-Contributions of the Chapters Relating to the Migration from Plan-
Driven to Agile Development (Contribution I) . . . . . . . . . . . . . 101.4 Sub-Contributions of the Chapters Relating to the Implementation of
Lean Software Development (Contribution II) . . . . . . . . . . . . . 121.5 Data Analysis and Evaluation Criteria . . . . . . . . . . . . . . . . . 201.6 Validity Threats Observed in Empirical Studies at Case Company . . . 241.7 Overview of Results . . . . . . . . . . . . . . . . . . . . . . . . . . . 25
2.1 A Comparison of Goals for Lean and Agile . . . . . . . . . . . . . . 422.2 Wastes in Lean Software Engineering and their Mapping to Manufac-
turing (cf. [24] . . . . . . . . . . . . . . . . . . . . . . . . . . . . . 472.3 Comparison for Requirements Practices . . . . . . . . . . . . . . . . 542.4 Comparison for Design and Implementation Practices . . . . . . . . . 562.5 Comparison for Quality Assurance Practices . . . . . . . . . . . . . . 582.6 Comparison for Software Release Practices . . . . . . . . . . . . . . 592.7 Comparison for Project Planning Practices . . . . . . . . . . . . . . . 612.8 Comparison for Team Management Practices . . . . . . . . . . . . . 632.9 Comparison for E2E Flow Practices . . . . . . . . . . . . . . . . . . 67
3.1 Issues in Waterfall Development (State of the Art) . . . . . . . . . . . 773.2 Units of Analysis . . . . . . . . . . . . . . . . . . . . . . . . . . . . 813.3 Distribution of Interviewees Between Roles and Units of Analysis . . 823.4 Number of Issues in Classification . . . . . . . . . . . . . . . . . . . 853.5 Issues in Waterfall Development . . . . . . . . . . . . . . . . . . . . 863.6 Distribution of Time (Duration) over Phases (in %) . . . . . . . . . . 89
285
3.7 Performance Measures . . . . . . . . . . . . . . . . . . . . . . . . . 89
4.1 Comparison with General Process Models . . . . . . . . . . . . . . . 1034.2 Context Elements . . . . . . . . . . . . . . . . . . . . . . . . . . . . 1064.3 Units of Analysis . . . . . . . . . . . . . . . . . . . . . . . . . . . . 1074.4 Distribution of Interviewees Between Roles and Units of Analysis . . 1094.5 Questions for Issue Elicitation . . . . . . . . . . . . . . . . . . . . . 1104.6 Classification of Identified Issues . . . . . . . . . . . . . . . . . . . . 1204.7 Commonly Perceived Improvements . . . . . . . . . . . . . . . . . . 1214.8 Fault Slip Before System Test / LSV . . . . . . . . . . . . . . . . . . 127
5.1 Advantages in Incremental Agile Development (State of the Art) . . . 1435.2 Issues in Incremental and Agile Development (State of the Art) . . . . 1445.3 Mapping . . . . . . . . . . . . . . . . . . . . . . . . . . . . . . . . . 1475.4 Units of Analysis . . . . . . . . . . . . . . . . . . . . . . . . . . . . 1505.5 Distribution of Interviewees Between Roles and Units of Analysis . . 1515.6 Advantages Identified in Case Study . . . . . . . . . . . . . . . . . . 1575.7 Issues Identified in Case Study . . . . . . . . . . . . . . . . . . . . . 160
6.1 Context Elements . . . . . . . . . . . . . . . . . . . . . . . . . . . . 1706.2 Results for Distribution of Lead-Time Phases, N=823 . . . . . . . . . 1756.3 Test Results for H0,multi, N=823 . . . . . . . . . . . . . . . . . . . . 176
7.1 Goal Question Metric for SPI-LEAM . . . . . . . . . . . . . . . . . 192
8.1 Costs . . . . . . . . . . . . . . . . . . . . . . . . . . . . . . . . . . 2268.2 Roles . . . . . . . . . . . . . . . . . . . . . . . . . . . . . . . . . . 2338.3 Costs All . . . . . . . . . . . . . . . . . . . . . . . . . . . . . . . . 239
9.1 Context Elements . . . . . . . . . . . . . . . . . . . . . . . . . . . . 263
286

Without the right information, you’re just another person with an opinion.
–Tracy O’Rourke, CEO of Allen-Bradley
287
ISSN 1653-2090
ISBN 978-91-7295-180-8
Background: The software market is becoming more dynamic which can be seen in frequent-ly changing customer needs. Hence, software companies need to be able to quickly respond to these changes. For software companies this means that they have to become agile with the objective of developing features with very short lead-time and of high quality. A consequence of this challenge is the appearance of agile and lean software development. Practices and principles of agile software development aim at increasing flexibility with regard to changing requirements. Lean software development aims at systemati-cally identifying waste to focus all resources on value adding activities.
Objective: The objective of the thesis is to evalua-te the usefulness of agile practices in a large-scale industrial setting. In particular, with regard to agi-le the goal is to understand the effect of migra-ting from a plan-driven to an agile development approach. A positive effect would underline the usefulness of agile practices. With regard to lean software development the goal is to propose no-vel solutions inspired by lean manufacturing and product development, and to evaluate their use-fulness in further improving agile development.
Method: The primary research method used throughout the thesis is case study. As secon-dary methods for data collection a variety of approaches have been used, such as semi-struc-tured interviews, workshops, study of process documentation, and use of quantitative data.
Results: The agile situation was investigatedthrough a series of case studies. The baseline situation (plan-driven development) was eva-luated and the effect of the introduction of agile practices was captured, followed by an in-depth analysis of the new situation. Finally, a novel ap-proach, Software Process Improvement through the Lean Measurement (SPI-LEAM) method, was introduced providing a comprehensive measu-rement approach supporting the company to manage their work in process and capacity. SPI-LEAM focuses on the overall process integrating different dimensions (requirements, maintenance, testing, etc.). When undesired behavior is obser-ved a drill-down analysis for the individual dimen-sions should be possible. Therefore, we provided solutions for the main product development flow and for software maintenance. The lean solutions were evaluated through case studies.
Conclusion: With regard to agile we found that the migration from plan-driven to agile develop-ment is beneficial. Due to the scaling of agile new challenges arise with the introduction. The lean practices introduced in this thesis were percei-ved as useful by the practitioners. The practitio-ners identified concrete decisions in which the lean solutions could support them. In addition, the lean solutions allowed identifying concrete improvement proposals to achieve a lean soft-ware process.
ABSTRACT
2010:04
Blekinge Institute of TechnologyDoctoral Dissertation Series No. 2010:04
School of Computing
ImplemenTIng leAn And AgIle SofTwARe developmenT In InduSTRy
Kai Petersen
Imp
le
me
nT
Ing
le
An
An
d
Ag
Ile
So
fT
wA
Re
de
ve
lo
pm
en
T In
Ind
uS
TRy
Kai Petersen
2010:04