lcas of petrol and diesel -...
TRANSCRIPT
Report 2013:058
ISSN 1654-9406
Uppsala 2013
LCAs of petrol and diesel
a literature review Mattias Eriksson and Serina Ahlgren
Cover: Offshore oil platform (from http://office.microsoft.com/sv-se/images/results.aspx?qu=olja&ex=2#ai:MP900399324|) SLU, Swedish University of Agricultural Science Department of Energy and Technology LCAs for petrol and diesel - a literature review Mattias Eriksson and Serina Ahlgren Report 2013:058 ISSN 1654-9406 Uppsala 2013 Keywords: Life cycle assessment, fossil fuels, petrol, diesel, well-to-tank, crude oil, refinery
1
Abstract Many life cycle assessment (LCA) studies have investigated the environmental impact of using biofuel in transportation compared with fossil fuels. Since these studies often use standard values for the fossil fuel reference scenario, there is a need for a thorough review of published data on fossil fuel use in transportation.
This study reviewed the available literature regarding greenhouse gas (GHG) emissions and energy balances in petrol and diesel use and examined possible causes for the differences reported in the literature. This included differences con-nected to the LCA methodology itself, but also those resulting from technical and economic effects.
Thirteen studies were reviewed in order to establish the level of GHG emissions and energy use in the well-to-tank perspective and, where possible, in the entire well-to-wheel perspective. The studies used different input data, allocation meth-ods and system boundaries, but the results fell within a narrow range, since the energy content of the fuels on a tank-to-wheel basis differed only slightly, while the use phase represents most GHG emissions and energy usage in fuel life cycles. For the entire well-to-wheel the GHG emissions varied between 85 to 102 g CO2-eq/MJ fuel and 82 and 99 g CO2-eq/MJ fuel for petrol and diesel respectively All except one of the reviewed studies reported GHG emissions values that exceeded the reference value of 83.8 g CO2-eq/MJ fuel suggested in the EU Renewable En-ergy Directive of 2009.
Keywords: Life cycle assessment, GHG, fossil fuels, petrol, diesel, well-to-tank, crude oil, refinery
2
Acknowledgments This article/report is the result of a cooperation project within the Swedish Knowledge Centre for Renewable Transportation Fuels (f3). The f3 Centre is a nationwide centre, which through cooperation and a systems approach contribute to the development of sustainable fossil free fuels for transportation. The centre is financed by the Swedish Energy Agency, the Region Västra Götaland and the f3 Partners, including universities, research institutes, and industry (see www.f3centre.se). The project had a reference group consisting of Per Ahlvik at Ecotraffic, Sören Eriksson at Preem, Per-Anders Hansson at SLU, Mikael Höök at Uppsala Univer-sity, Sheshti Johansson at SLU, Bertil Karlsson at Preem, Tomas Rydberg at IVL and Per Salomonsson at Volvo.
We thank both the funding organisation and all members of the reference group for their contributions to this project.
Uppsala, May 2013 Mattias Eriksson and Serina Ahlgren
3
Table of contents Abbreviations 4
1 Introduction 5 1.1 Aim 6 1.2 Background 6
1.2.1 Crude oil 7 1.2.2 Processing 8 1.2.3 Petrol and diesel 12 1.2.4 Life Cycle Assessment methodology 13
2 Materials and methods 14
3 Results 15 3.1 Summary of studies 15 3.2 GHG emissions and energy use in petrol and diesel 20
4 Discussion 24 4.1 Differences in results due to the natural and the techno-economic systems 24
4.1.1 Origin of crude oil and processes needed 24 4.1.2 Unconventional fossil fuel sources 25 4.1.3 Oil price determines technologies and investments 26 4.1.4 Supply and demand in the EU 27 4.1.5 Differences in tank-to-wheel 27
4.2 Differences in results due to LCA method 28 4.2.1 Allocation methods 28 4.2.2 Multiple outputs 29 4.2.3 Functional unit 30
4.3 Indirect effects of oil production 30 4.4 What value to choose for fossil fuels in LCA studies? 30
5 Conclusions 32
References 33

4
Abbreviations aLCA Attributional Life Cycle Assessment API American Petroleum Institute BTU British Thermal Unit cLCA Consequential Life Cycle Assessment EROI Energy return On Investment FCC Fluid Catalytic Cracker FQD Fuel Quality Directive GHG Greenhouse Gas GREET Greenhouse gases, Regulated Emissions, and Energy use in
Transportation HBEFA Handbook Emission Factors for Road Transport HHV Higher Heat Value LCA Life Cycle Assessment LHV Lower Heat Value LPG Liquid Petroleum Gas Mbdoe Million barrels per day of oil equivalent MJ Mega Joule MMBTU Million British Thermal Units MTBE Methyl Tertiary Butyl Ether NMVOC Non Methane Volatile Organic Compound RED Renewable Energy Directive TTW Tank-to-Wheel VOC Volatile Organic Compound WTP Well-to-Pump WTT Well-to-Tank WTW Well-to-Wheel
5
1 Introduction During the past decade, many life cycle assessment (LCA) studies have been per-formed to compare the environmental impact of biofuel with that of fossil fuels in transportation (see e.g. an overview of studies by Cherubini & Strømman, 2011). While much attention has been paid to every detail of the emissions from biofuel systems (including e.g. investigating the influence of calculation methods, data uncertainty and the inclusion of indirect effects), comparatively few studies have investigated fossil fuels from an environmental perspective. Most biofuel LCA studies use a standard value for the fossil reference, without paying much attention to how it has been calculated and with what methodology. An LCA assessing marginal effects of biofuels should for example use marginal fossil fuel data for comparison, but this is often not the case.
In policy too, good data on fossil fuel life cycle emissions are becoming more important. In 2009, the EU adopted the Renewable Energy Directive, which man-dates all Member States to have 10% biofuels on an energy basis in their transport sector by 2020 (EC, 2009a). In order for a biofuel to be eligible for financial sup-port and to be accounted within national reporting, it must meet a number of sus-tainability criteria as described in the Renewable Energy Directive . One of these criteria is that the greenhouse gas (GHG) emissions must be reduced by at least 35% compared with a fossil fuel reference. However, quantification of the fossil fuel reference remains controversial. At the moment, a value of 83.8 g CO2-eq/MJ (for the entire life cycle) is suggested for use (EC, 2009a), but this is under revi-sion.
In 2009 the Fuel Quality Directive was also adopted (EC, 2009b). It introduced a requirement on fuel suppliers to reduce the GHG intensity of energy supplied for road transport. According to the Fuel Quality Directive, by the end of 2020 suppli-ers of fuels should reduce life cycle GHG emissions for every unit of energy sold by at least 6% compared with the EU-average fossil fuel in 2010. The Fuel Quali-ty Directive gives the fuel suppliers a number of options by which to obtain this
6
6% reduction, for example via reductions in flaring and venting at production sites, the use of biofuels and alternative fuels (such as LPG).
However, while the rules for origin certification and GHG emissions for biofu-els have been established, the rules for fossil fuels in the Fuel Quality Directive are still not specified (EC, 2009b).
1.1 Aim The aim of this project was to review the literature regarding GHG emissions and energy balance for petrol and diesel. The study adopted a European perspective, and focused on present conventional production.
Based on the literature review, the project aimed to identify and discuss the causes of differences between resulting GHG emissions and energy balances. Such differences could be due for example to differences in production sites, extraction methods, need for refining, transport technology and transport distance to end-users. Calculation choices connected to the LCA methodology that can have an impact on the results, for example how allocation is done and where the system boundaries are set, were also examined. In order to determine the GHG emissions at a given time and place (in this case Sweden/EU at the present time), it is also important to understand the market mechanisms for fossil fuels, as this is decisive for the crude mix used, as well as for the marginal effects. Therefore a very brief appraisal was made of the fossil fuel market and of possible indirect effects of fossil fuel production.
The results are intended for use by anyone interested in learning more about the GHG emissions from fossil fuels, especially LCA practitioners in need of input data for various types of production systems. The results can also be interesting for comparison with biofuel LCA studies. In the context of regulation of GHG emis-sions from both biofuels and fossil fuels, the results can be of particular interest.
1.2 Background This report focuses on petrol and diesel originating from conventional crude oil and intended for use in road transportation. Conventional crude oil is defined geo-logically as a discrete accumulation of petroleum occurring bounded by a down-dip water contact and being significantly affected by the buoyancy of petroleum in water (Jakobsson, 2012). This is opposed to unconventional oil, which is more continuously distributed, e.g. oil shale and tar sands, which is briefly treated in the discussion.
7
1.2.1 Crude oil Crude oil or petroleum is a naturally occurring flammable liquid found in geologi-cal formations beneath the Earth’s surface. This fossil fuel is formed when large quantities of dead organisms, usually zooplankton and algae, are buried under-neath sedimentary rock and undergo intense heat and pressure. This is an ongoing process in parts of the world, but oil extraction is so much faster than the repro-duction of crude oil that it is a non-renewable resource.
To find crude oil, potential areas undergo detailed analysis, including sedimen-tary basin analysis and reservoir characterisation in terms of porosity and permea-ble structures. The petroleum found is then recovered mostly through oil drilling.
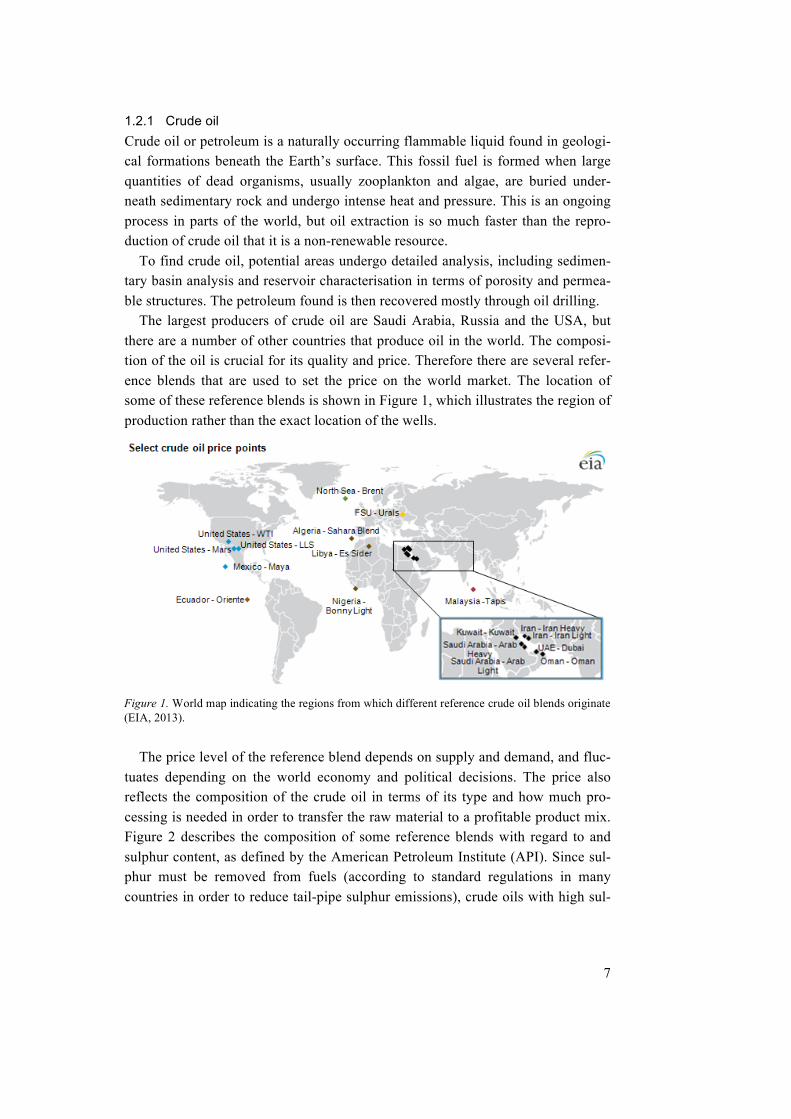
The largest producers of crude oil are Saudi Arabia, Russia and the USA, but there are a number of other countries that produce oil in the world. The composi-tion of the oil is crucial for its quality and price. Therefore there are several refer-ence blends that are used to set the price on the world market. The location of some of these reference blends is shown in Figure 1, which illustrates the region of production rather than the exact location of the wells.
The price level of the reference blend depends on supply and demand, and fluc-
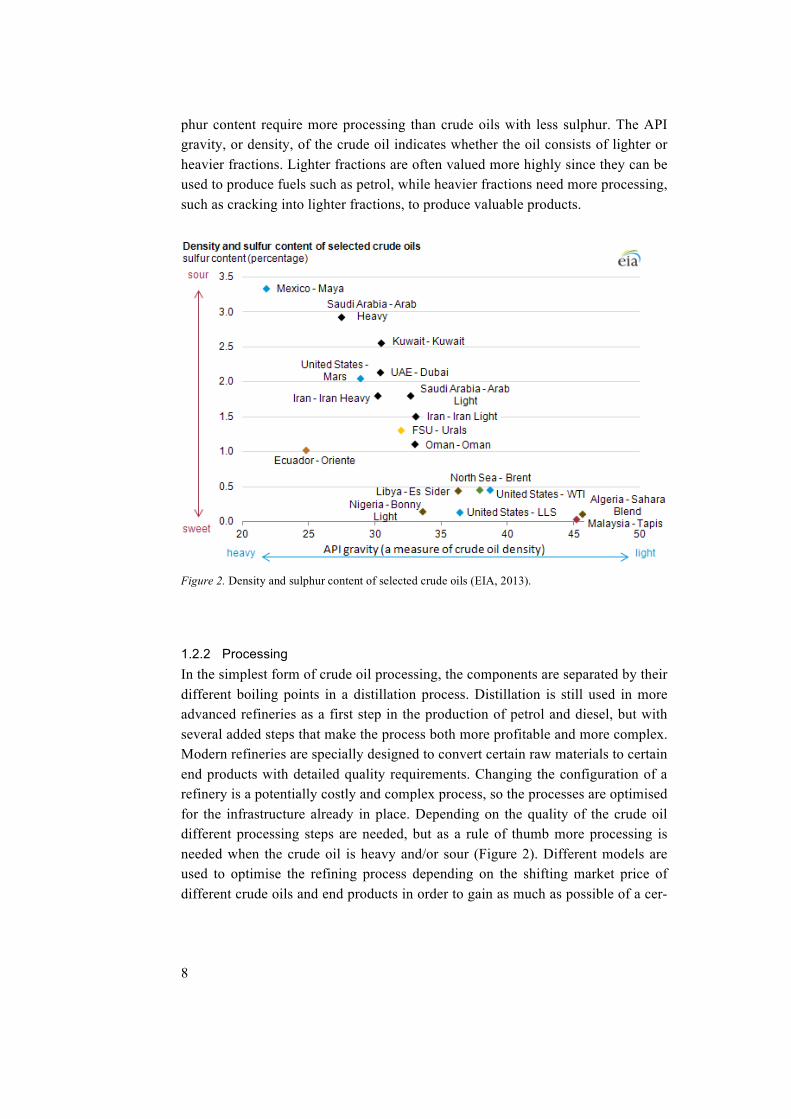
tuates depending on the world economy and political decisions. The price also reflects the composition of the crude oil in terms of its type and how much pro-cessing is needed in order to transfer the raw material to a profitable product mix. Figure 2 describes the composition of some reference blends with regard to and sulphur content, as defined by the American Petroleum Institute (API). Since sul-phur must be removed from fuels (according to standard regulations in many countries in order to reduce tail-pipe sulphur emissions), crude oils with high sul-
Figure 1. World map indicating the regions from which different reference crude oil blends originate (EIA, 2013).
8
phur content require more processing than crude oils with less sulphur. The API gravity, or density, of the crude oil indicates whether the oil consists of lighter or heavier fractions. Lighter fractions are often valued more highly since they can be used to produce fuels such as petrol, while heavier fractions need more processing, such as cracking into lighter fractions, to produce valuable products.
1.2.2 Processing In the simplest form of crude oil processing, the components are separated by their different boiling points in a distillation process. Distillation is still used in more advanced refineries as a first step in the production of petrol and diesel, but with several added steps that make the process both more profitable and more complex. Modern refineries are specially designed to convert certain raw materials to certain end products with detailed quality requirements. Changing the configuration of a refinery is a potentially costly and complex process, so the processes are optimised for the infrastructure already in place. Depending on the quality of the crude oil different processing steps are needed, but as a rule of thumb more processing is needed when the crude oil is heavy and/or sour (Figure 2). Different models are used to optimise the refining process depending on the shifting market price of different crude oils and end products in order to gain as much as possible of a cer-
Figure 2. Density and sulphur content of selected crude oils (EIA, 2013).
9
tain fuel. However, it should be mentioned that there is only a certain degree of change that can be made to the refining process. For simple refineries the crude oil composition decides the outgoing product mix. More advanced refineries have greater possibilities to change the molecular structure of the crude oil fractions, but even if it theoretically possible to produce almost exclusively diesel, it would most likely not be profitable. Therefore crude oil composition also has a large influence on the outcome in advanced refineries. For example, there is a shortage of diesel in the EU, which leads this region to import diesel (Szklo & Schaeffer, 2007). It should also be mentioned that optimisation with regard to economic benefit can involve higher energy use for the processes and that the product mix cannot be radically changed without rebuilding the refinery. If the production of diesel in-creases due to reconfigurations, it will also be at the expense of other products, such as jet fuel (Nygren et al., 2009).
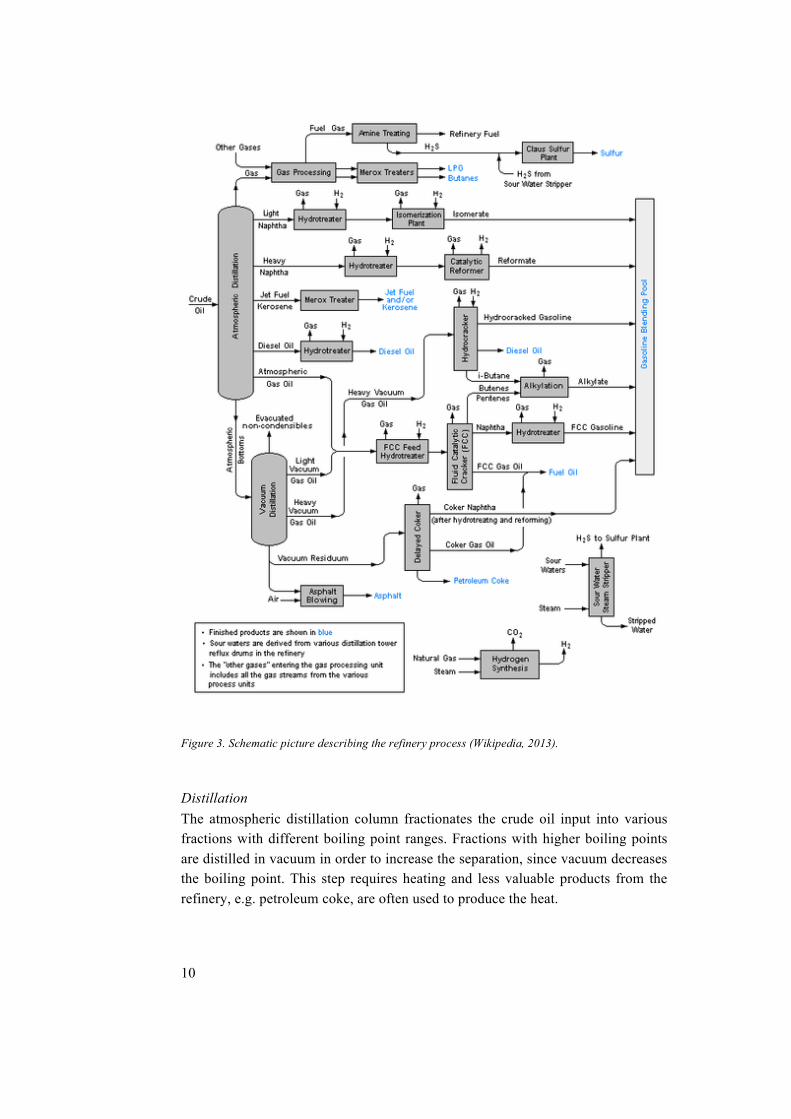
The following sections describe the basic procedures that constitute a modern refinery (Figure 3) and provide a brief description of those procedures, based on Wikipedia (2013), Bruce (2001) and Clayden et al. (2001). Most refineries lack the infrastructure to perform all of these processes, but several combinations of pro-cesses are possible. Processes for production of lubricants and other non-fuel re-finery products are not discussed.
10
Distillation The atmospheric distillation column fractionates the crude oil input into various fractions with different boiling point ranges. Fractions with higher boiling points are distilled in vacuum in order to increase the separation, since vacuum decreases the boiling point. This step requires heating and less valuable products from the refinery, e.g. petroleum coke, are often used to produce the heat.
Figure 3. Schematic picture describing the refinery process (Wikipedia, 2013).
11
Catalytic cracking or fluid catalytic cracking Catalytic cracking is one of the most widely used crude oil upgrading process. It uses heat and the presence of a catalyst to break heavy molecules into smaller molecules. This increases the petrol and diesel fractions at the expense of heavy products such as heavy fuel oil and petroleum coke.
Catalytic hydrocracking Catalytic hydrocracking works in a similar way to catalytic cracking, but with hydrogen added. This is done in order to get molecular decomposition, but it also removes undesirable compounds such as nitrogen and sulphur by reacting with them and forming gases that can be easily separated.
Steam reforming is often used to produce the necessary hydrogen. This process requires heat to produce steam and methane ((CH4) (from other refinery processes or from natural gas) that reacts with the steam in order to produce hydrogen gas. Steam reforming is often used to produce hydrogen for other process steps too.
Hydrotreating This process is also called desulphurisation and is similar to hydrocracking. The basic procedure of adding hydrogen gas is the same, but since reaction with the hydrocarbon is not desired the conditions are milder (lower temperature) than for hydrocracking. This process step reduces the sulphur content by reacting with sulphuric compounds in order to form new compounds that can easily be separat-ed.
Catalytic reforming In order to produce petrol from the less desirable naphtha, a catalytic reformer is used. In this process step, heat and the presence of catalysts rearrange the molecu-lar structure to give a product with significantly higher octane rating than the ini-tial naphtha. The napthenes (cyclic hydrocarbons) are dehydrogenated in order to produce aromatic hydrocarbons (such as toluene). Isomerisation creates isoparaf-fines (branched alkanes) from paraffines (n-alkanes). Paraffines are also dehydro-cyclised in order to produce aromatic compounds. Hydrogen is a byproduct from all these reactions that can be used in other processes in the refinery, but also per-forms hydrocracking already within this reforming process.
Isomerisation Isomerisation not only takes place in the catalytic reformer but is also needed to increase the octane rating for the lighter naphtha in petrol production. In the pres-ence of a catalyst, the paraffines are rearranged into isoparaffines.
12
Alkylation Molecules that are too small to be petrol (e.g. isobutane, isopentane and isohex-ane) can be alkylated, which means that an alkyl group (such as propyl or butyl) is added to the molecule. This requires a strong acid catalyst and heating in order to produce a mixture of branched chain paraffines that are used as petrol additives.
Thermal cracking or visbreaking Heavy hydrocarbons can be upgraded by thermal cracking, which uses heat in order to crack them into lighter residues. This process reduces the viscosity of the residues, so it is also called visbreaking. Thermal cracking shows some similarities with coking, but the important difference is that it is intended to break chemical bonds and not just separate existing compounds.
Coking The heavy hydrocarbon fraction from vacuum distillation is thermally devolati-lised (heated until all gases and liquids are evaporated). The low molecular weight products can be used in other streams to produce petrol or other products. The solid carbon material that is left is called coke, and can be used as coke grains for electrode manufacturing, but is often used as an energy source in the refining in-dustry.
1.2.3 Petrol and diesel There are many pathways in a refinery that lead to petrol or diesel, especially in an advanced refinery that can convert intermediates (Figure 3). In simple refineries petrol is produced from light distillates, typically light naphtha, and diesel is pro-duced from a medium heavy distillate.
Petrol and diesel are the main fuels used for road transportation. Petrol is used in internal combustion engines with spark ignition, while diesel is used in com-pression ignition engines where the heat generated from compression is enough to initiate the combustion process. A standard property of petrol is a density of 745 kg/m3, lower heat value (LHV) of 43.2 MJ/kg and carbon content of 86.4% (Ed-wards et al., 2011). This can be compared with a density of 832 kg/m3, LHV of 43.1 MJ/kg and carbon content of 86.1% for diesel (Edwards et al., 2011).
Diesel fuel of a new high environmental class (MK1) was introduced on the Swedish market in the early 1990s (Ahlvik & Eriksson, 2011). EN 590 is the Eu-ropean standard for diesel fuel that also was introduced in the early 1990s, but since then has been improved from an environmental perspective, with for exam-ple lower sulphur content. When they were first introduced there were significant differences between these two standard fuels, but due to the increased environ-mental benefits of EN 590 the differences are now less. However, there are still
13
much higher emissions of polyaromatic hydrocarbons from EN 590 diesel than from MK1 diesel (Almén, 2008).
1.2.4 Life Cycle Assessment methodology Life Cycle Assessment (LCA) is a methodology used for studying the potential impact on the environment of a specific product, service or system. The amount of energy needed to produce the specific product and the environmental impact are calculated. The LCA is limited by its outer system boundaries. The energy and material flows across the boundaries are looked upon as inputs (resources) and outputs (emissions). There are two main types of LCA studies; attributional and consequential. The attributional LCA study (aLCA) focuses on describing the flows to and from a studied life cycle. The consequential LCA (cLCA) focuses on describing how flows will change in response to possible decisions. Some authors state that attributional LCA are mainly used for existing systems, while conse-quential LCA are used for future changes (for example Baumann & Tillman, 2004). However as Finnveden et al. (2009) point out, both types of LCA can be used for evaluating past, current and future systems.
The type of LCA carried out has an impact on many of the methodological choices in an LCA. For example in handling of by-products, the aLCA typically uses an allocation based on mass, energy, monetary value, etc. In a cLCA, a sys-tem expansion is instead often the choice, e.g. trying to determine the consequenc-es of a new by-product appearing on the market. It also affects the choice of data; in a cLCA marginal data are used, as it studies a change in a system, while an aL-CA uses average data (Baumann & Tillman, 2004).
14
2 Materials and methods This report summarises previous literature in order to describe how much energy and GHG emissions are connected with the production and use of petrol and diesel in a life cycle perspective. Some of the results in the literature were slightly recal-culated in order to present all results in the same units, MJ/MJ for primary energy usage and emissions of g CO2-eq/MJ for global warming potential. For GHG emissions we chose to use conversion values from the EU Renewable Energy Di-rective, whereby 1 g CO2-eq corresponds to 1 g of carbon dioxide, 23 g of me-thane and 296 g of nitrous oxide (EC, 2009a). This was because some of the stud-ies reviewed use these conversion factors, which are slightly lower than those sug-gested by IPCC (2007), where 1 g CO2-eq corresponds to 1 g of carbon dioxide, 25 g of methane and 298 g of nitrous oxide. Both types of factors are based on a 100-year perspective.
Since some previous studies use British thermal units (BTU) as the energy unit, these were recalculated into Joules, assuming that one BTU corresponds to 1055 Joules.
Many studies, especially those concerning the tank-to-wheel perspective, have a functional unit that is per unit distance travelled. These studies were not included in this review, since the actual fuels (petrol and diesel) were the main focus and not the efficiency of the motors used for transportation.
Studies using LCA as a method were the main target of the review, but some studies using other methods were also included. In the case of studies using energy return on investment (EROI) as a method, the point of use EROI (EROIpou) was assumed to be equal to well-to-wheel, since it includes the energy of the usable fuel.
15
3 Results The 13 studies selected for this project are reviewed and summarised below re-garding energy consumption and emissions of GHS and the results are presented in Tables 1-4. The well-to-tank (WTT) perspective was the main focus, but tank-to-wheel (TTW) and the whole well-to-wheel (WTW) perspective are also pre-sented when these data are available.
3.1 Summary of studies
Ahlvik & Eriksson (2011) This is a case study that includes data from five refineries, located in Denmark, Sweden and Finland, that produce diesel of European standard (EN 590) and Swe-dish environmental standard (MK1) for the Swedish market. It describes the WTT chain with production of crude oil, transportation, processing and distribution to filling stations, but any transformation at source is excluded.
Results from the study show that there are only small differences between MK1 and EN 590 diesel. However, the differences between the refineries are much larg-er and therefore introduce a possible bias in the results.
The study includes a scenario where the production is targeted towards the global market instead of the Swedish market. This scenario gives small differences from the main results, since the only difference is that the MK1 diesel is assumed to be blended into the EN 590 diesel, since MK1 is a Swedish standard and there-fore cannot be sold on the global market. This slightly decreases the emissions from EN 590 diesel.
Baptista et al. (2010) In this study the Portuguese transport sector is investigated using life cycle as-sessments for different scenarios. The current situation of fossil fuels is calculated using the GREET model for analysis of the cradle-to-grave of materials. The WTT
16
emissions and energy consumption are mostly based on data available in a previ-ous version of Edwards et al. (2011). Since the results of TTW are presented in MJ/km, they were not taken into consideration in the present report.
Dones et al. (2007) This is a background report to the Swiss LCI database Ecoinvent1, which describes energy sources in a Swiss and European perspective. The data consider the year 2000 and include oil field exploration, crude oil production, long distance trans-portation, oil refining and regional distribution. The crude oil originates from sev-eral regions but the Middle East, North Africa and former Soviet Union represent more than 80% of the imports. Country-specific data are used where available, but with several different levels of quality. For North Sea oil environmental reports with summarised environmental impact are used, for Russia questionnaires are used and for the Middle East and Africa the authors state that rough estimations are made in order to collect data. For venting and flaring, a global average is used due to lack of specific data.
Electricity is assumed to be produced locally at production sites using heavy fuel oil (or crude oil) from production, and the oil transported with both tanker and pipeline from each region to Europe. This is modelled using import and export statistics in order to approximate the transport distances. All fuels investigated are assumed to be refined in Europe. Emissions from refining are allocated by mass to each intermediate when possible, owing to lack of data on economic values and absence of major differences in heat values.
The process until regional storage is assumed to be equal to WTT. In the present report, we opted to present the low sulphur petrol (Tables 1 and 3). The values were calculated from the life cycle inventory presented by Dones et al. (2007).
Edwards et al. (2011) This study aims to analyse the fuels that will be used in the European context in the time horizon until 2020. Fossil diesel and petrol are used as the reference sce-nario, in which they are replaced by different biofuels. Because of this marginal thinking is used, since marginal crude oil will be the first to be replaced by fuels from other sources. In line with this, it is assumed that crude oil from the Middle East is the marginal crude in Europe in the given period.
Most of the data used are the same input data used as the basis for calculations of typical and default GHG savings for biofuels compared with fossil fuels in the EU Renewable Energy Directive (EC, 2009a). The differences in results compared
1 http://www.ecoinvent.org
17
with the Renewable Energy Directive are due to differences in methodology and the use of more and newer data.
The system boundaries do not include emissions associated with construction or decommissioning of plants and vehicles, but focus on the WTT pathway. The fuel consumption from shipping of crude oil is calculated using the “admiralty formu-la”, according to which the fuel consumption of a ship is proportional to the cubic root of the water displacement. All energy values are calculated as primary energy expended to produce a certain energy amount (LHV basis) of finished fuel.
The European refineries used in the study consume about 6-7% of their own in-take as processing energy. The crude oil consumed originates from Russia, Nor-way, Libya, UK, Saudi Arabia, Iran, Nigeria, Kazakhstan, Iraq, Azerbaijan, Ango-la, Algeria, Denmark, Venezuela, Mexico, Syria, Kuwait, Egypt, Brazil and others. The usage of African crudes with comparatively low energy and high emissions makes the EU figures higher in GHG emissions and lower in energy.
Furuholt (1995) This study was performed at the Statoil Research Centre in Norway and therefore uses detailed and specific data provided by the company. The aim is to compare the environmental impact from petrol with 10 weight% of methyl-tert-butyl-ether (MTBE) with ordinary 98 octane petrol and diesel. MTBE is used as an additive, since it increases the octane rating and is produced from natural gas.
The system boundaries exclude elements such as oil drilling and construction of offshore production platforms, pipelines and onshore production plants. Distances are short, since the oil is both produced and consumed in Norway and is transport-ed by tanker boat from the oil field to the refinery and to the terminal.
The study compares energy consumption, emissions to air of CO2, CO, NOx, SO2, volatile organic compounds (VOC), discharges of oil to water and waste gen-erated in producing the fuels. These emissions are all compared to the functional unit of 1000 litres of fuel, but this is also recalculated per MJ in order to make the results comparable with those of other studies. Since the data from offshore plat-form to service station are checked and monitored by Statoil, they can be de-scribed as accurate and the author claims that that the uncertainty in overall accu-racy of emissions and energy consumption is 10% or less. The results are de-scribed as low in comparison with other studies due to short transportation dis-tances (compared with the distance between the Middle East and Norway) and fairly new production facilities that are efficient.
The results are presented with the emissions for every gas emitted to air. In the present report, these were recalculated to CO2-eq assuming that VOC has the same conversion factor as methane.
18
Gode et al. (2011) This study is a literature review of emissions connected to many kinds of energy sources used in Sweden. Petrol and diesel occupy a small part, where Öman et al. (2011) and Jerksjö & Martinsson (2010) are summarised. The results from Jerksjö & Martinsson (2010) are recalculated from emissions per km to emissions per MJ fuel with the assumption that the energy value is 43.5 MJ per kg petrol and 43.1 MJ per kg diesel.
Jerksjö & Martinsson (2010) use the model HBEFA3.12 to calculate TTW emis-sions for a number of combinations of vehicles and fuels, but for petrol and diesel only passenger vehicle emissions are presented. For petrol and diesel fuels with added RME and ethanol, emissions for cars, light trucks and heavy trucks are also presented. For these three types of vehicles the emissions of methane (CH4) and nitrous oxides (NOx) per MJ fuel increase with the size of the engine, while the nitrous oxide (N2O) emissions per MJ fuel decrease due to the different air-fuel ratios. Since Jerksjö & Martinsson (2010) just make an analysis and no actual publication of data, their results are referred to as Gode et al. (2011) when they are cited hereafter in the discussion.
Keesom et al. (2012) This is an executive summary of a more extensive study that compares heavy tar sand with normally used crude oils. In order to compare the production of diesel and petrol, a set of scenarios with five different refineries and different crude oils used in those refineries is set up. The refinery configurations consist of a FCC-coking refinery situated in Germany; a FCC-visbreaking refinery situated in France; a hydrocracking-visbreaking refinery situated in Italy and a high conver-sion FCC-coking refinery situated on the US Gulf Coast. In addition to these re-fineries, a hydroskimming refinery located in Russia is set to produce intermedi-ates such as fuel oil and hydrotreated gas oil to be converted in the three European refineries to fuels that meet the European standards. The crude oils used are said to be based on the European consumption pattern, which includes oil from the former USSR, Norway, Libya, Saudi Arabia, Iran, UK, Nigeria, Iraq, Other Africa, Ango-la, Algeria and others.
The results are based on engineering estimates using estimated crude oil produc-tion parameters and emissions from flaring estimated from satellite light images. The results from the different scenarios vary widely for the WTT perspective be-tween the scenarios. This is said to depend on how the crude oil is produced, the amount of gas flaring, the amount of fugitive emissions released during produc-
2 Accessible at http://www.hbefa.net.
19
tion, and the emissions from oil refining, which depend on crude oil properties and refining configurations.
Lambert et al. (2012) In this study the energy return on investment (EROI) for global energy resources is analysed. The main focus is to describe how high the EROI values have to be to maintain the current economic growth in society for different energy sources and at different stages in energy production. EROIpou is assumed to equal WTT, which was used in the present report, and the value presented was recalculated into MJ primary energy used per MJ fuel. This is a high value, since it represents an EROI value that is on the minimum level to make fuel production from crude oil profita-ble. EROI values from other reports reviewed in the study indicate a significantly higher EROI for Norway, US, Canada, Mexico and China, which indicates more efficient production and therefore less primary energy used per MJ of fuel pro-duced.
López et al. (2009) This study focuses on the TTW perspective of different fuels in a case study of the city of Madrid. Therefore the WTT data are mainly based on a study from General Motors Europe (2002), which is stated to represent an average European crude oil mix that is delivered by ship, refined close to the landing port and finally distribut-ed by road 150 km before usage.
Öman et al. (2011) This study is a life cycle investigation of Swedish petroleum products and the sys-tem boundaries include extraction of crude oil, transportation to refinery, refining and distribution to filling station. It is a bookkeeping study that focuses on crude oil used for the Swedish market during 2009. The emissions are allocated to the energy content of the end products and an average of six refineries is used.
For petrol production, the crude oil used is 55% land-specific oil from Norway, 34% is Russian and 11% is from Africa. The African and Russian crude oil con-tent is estimated as a European average. For diesel production the crude oil used is 41% from Norway, 56% from Russia and 3% from Africa. The land-specific crude oil content is estimated in the same way as for petrol.
In the study there is also a scenario analysis where system expansion is used to calculate the emissions when the waste heat from the refineries is used to replace district heating. The system expansion scenario gives only small benefits, since the system is assumed to replace Swedish district heating, based on biofuels and household waste, with low GHG emissions.
20
Perimenis et al. (2010) This study investigates alternative transportation fuels using LCA. Petrol and die-sel from fossil sources are used as a reference scenario. The data for this reference scenario are taken from many different references that concern European data, including an earlier version of Edwards et al. (2011).
Prieur & Tilagone (2006) Here the WTW perspective of the French and European markets is the focus. The study uses petrol and diesel as a reference scenario, which is compared to the us-age of natural gas as a transportation fuel. Results are presented for 2003, 2010 and 2020 but only the 2003 results are listed in Table 1-4. The results for TTW are presented per km and are therefore not included in this report.
Losses during crude oil extraction are estimated to be 0.37% and no methane leakage is taken into account, since all associated gases are assumed to be flared. Flaring rate ranges from 9.2 m3 gas per ton of oil in sub-Saharan Africa to 1.5 m3 gas per ton of crude in the North Sea. After extraction, the crude is transported average distances with pipeline and/or tanker.
The energy consumption in the refineries is calculated using a model based on linear programming for the total production of the refinery.
Wang et al. (2004) This study tests different methods for allocating emissions and energy use from the refinery process. The actual data on energy balances for each refinery process are taken from Brown et al. (1996), which is stated to be internationally consistent. The three different allocation methods tested are based on mass, energy content and market value for the end-user. All allocations are applied on the process level instead of the refinery level and the outcome is results that vary for diesel but not for petrol. This is in a WTP perspective, which is assumed to be equal to the WTT perspective used in other studies.
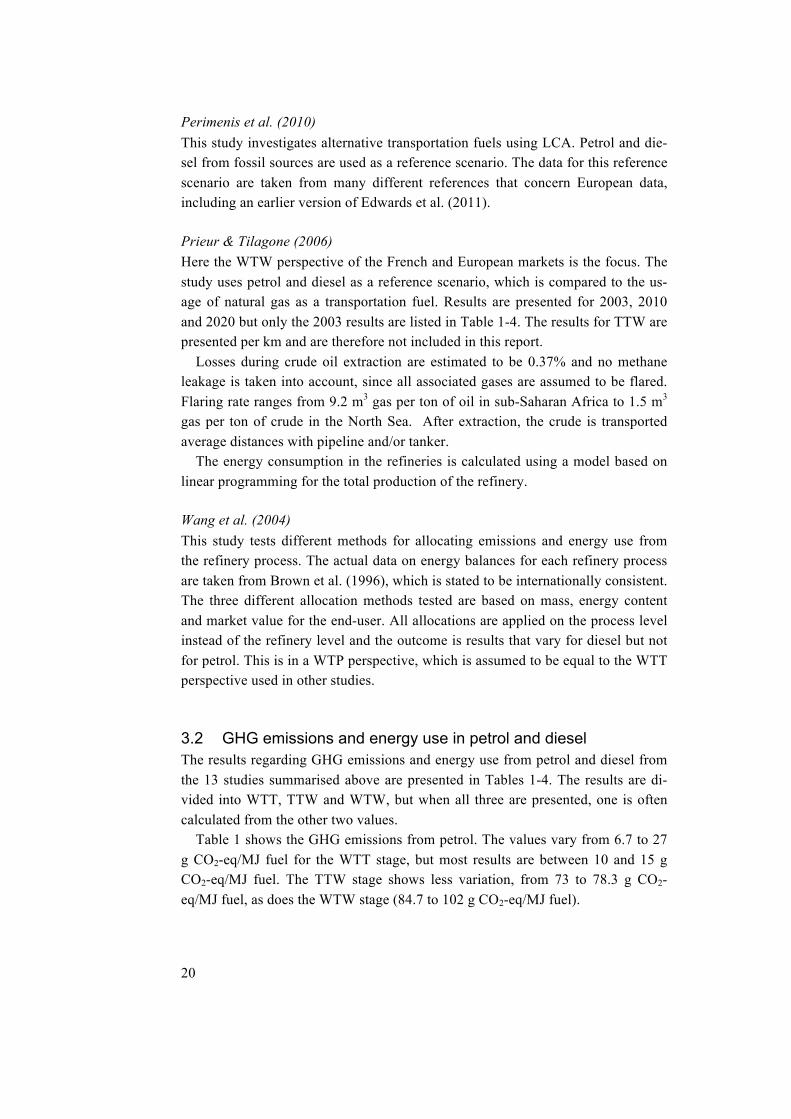
3.2 GHG emissions and energy use in petrol and diesel The results regarding GHG emissions and energy use from petrol and diesel from the 13 studies summarised above are presented in Tables 1-4. The results are di-vided into WTT, TTW and WTW, but when all three are presented, one is often calculated from the other two values.
Table 1 shows the GHG emissions from petrol. The values vary from 6.7 to 27 g CO2-eq/MJ fuel for the WTT stage, but most results are between 10 and 15 g CO2-eq/MJ fuel. The TTW stage shows less variation, from 73 to 78.3 g CO2-eq/MJ fuel, as does the WTW stage (84.7 to 102 g CO2-eq/MJ fuel).
21
Table 1. Emissions from the use of petrol in transportation in various countries, expressed as CO2-eq/MJ of fuel
Fuel Region Well-to-Tank (g/MJ)
Tank-to-Wheel (g/MJ)
Well-to-Wheel. (g/MJ)
Reference
Petrol Sweden 6.71 78.31 85.02 Gode et al., 2011
Petrol 98 octane Norway 10.51 Furuholt, 1995
Petrol France 11.5 Prieur & Tilagone, 2006
Petrol Portugal 13 Baptista et al., 2010
Petrol EN 228 Europe 12.5 73 85.5 Perimenis et al., 2010
Petrol Europe 14.2 73.3 87.5 Edwards et al., 2011
Petrol Europe 10-27 75 85-102 Keesom et al., 2012
Petrol, Low sulphur
Europe 84.71 Dones et al., 2007
Petrol International 18.5 Wang et al., 2004 1 Calculated from LC1 data given in the relevant publication. 2 Calculated as the sum of WTT and TTW.
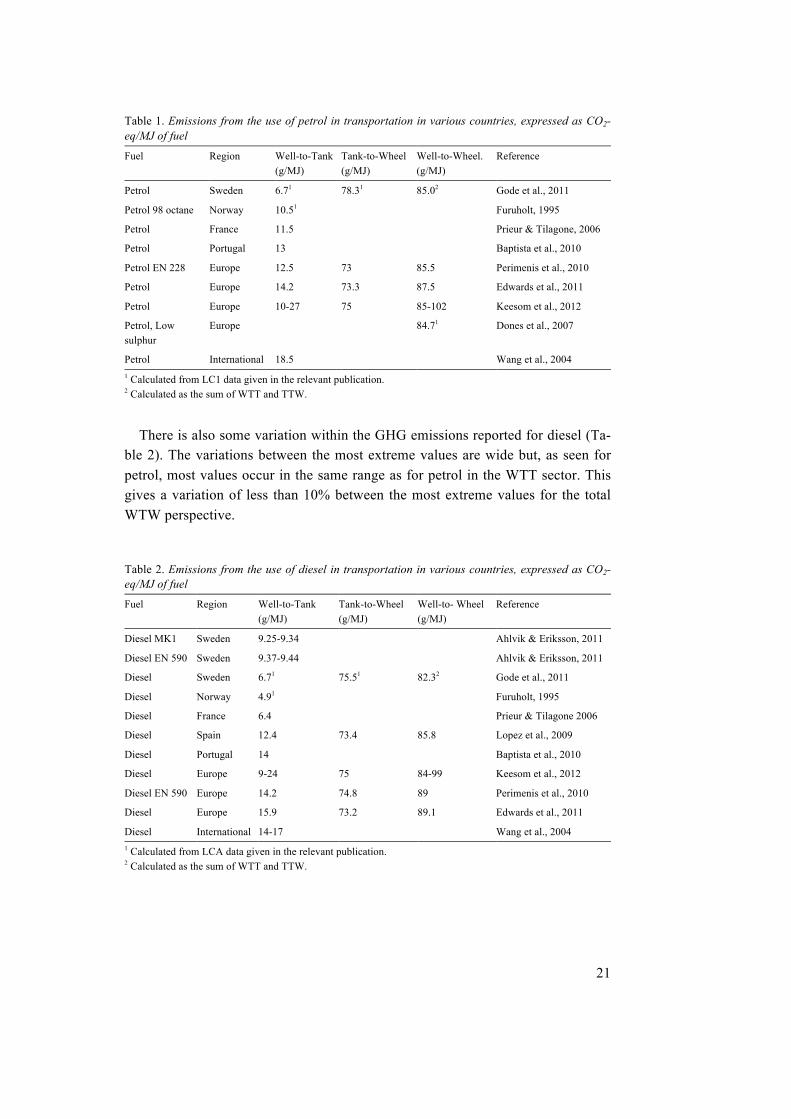
There is also some variation within the GHG emissions reported for diesel (Ta-
ble 2). The variations between the most extreme values are wide but, as seen for petrol, most values occur in the same range as for petrol in the WTT sector. This gives a variation of less than 10% between the most extreme values for the total WTW perspective.
Table 2. Emissions from the use of diesel in transportation in various countries, expressed as CO2-eq/MJ of fuel
Fuel Region Well-to-Tank (g/MJ)
Tank-to-Wheel (g/MJ)
Well-to- Wheel (g/MJ)
Reference
Diesel MK1 Sweden 9.25-9.34 Ahlvik & Eriksson, 2011
Diesel EN 590 Sweden 9.37-9.44 Ahlvik & Eriksson, 2011
Diesel Sweden 6.71 75.51 82.32 Gode et al., 2011
Diesel Norway 4.91 Furuholt, 1995
Diesel France 6.4 Prieur & Tilagone 2006
Diesel Spain 12.4 73.4 85.8 Lopez et al., 2009
Diesel Portugal 14 Baptista et al., 2010
Diesel Europe 9-24 75 84-99 Keesom et al., 2012
Diesel EN 590 Europe 14.2 74.8 89 Perimenis et al., 2010
Diesel Europe 15.9 73.2 89.1 Edwards et al., 2011
Diesel International 14-17 Wang et al., 2004 1 Calculated from LCA data given in the relevant publication. 2 Calculated as the sum of WTT and TTW.
22
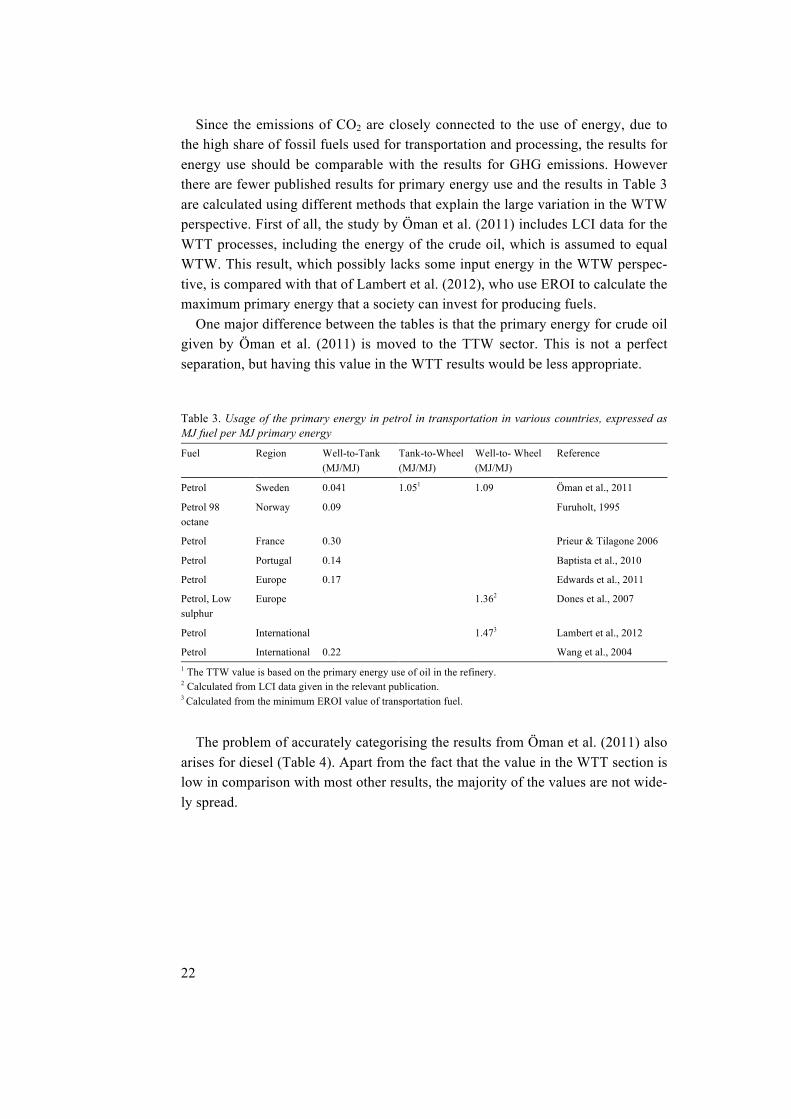
Since the emissions of CO2 are closely connected to the use of energy, due to the high share of fossil fuels used for transportation and processing, the results for energy use should be comparable with the results for GHG emissions. However there are fewer published results for primary energy use and the results in Table 3 are calculated using different methods that explain the large variation in the WTW perspective. First of all, the study by Öman et al. (2011) includes LCI data for the WTT processes, including the energy of the crude oil, which is assumed to equal WTW. This result, which possibly lacks some input energy in the WTW perspec-tive, is compared with that of Lambert et al. (2012), who use EROI to calculate the maximum primary energy that a society can invest for producing fuels.
One major difference between the tables is that the primary energy for crude oil given by Öman et al. (2011) is moved to the TTW sector. This is not a perfect separation, but having this value in the WTT results would be less appropriate.
Table 3. Usage of the primary energy in petrol in transportation in various countries, expressed as MJ fuel per MJ primary energy
Fuel Region Well-to-Tank (MJ/MJ)
Tank-to-Wheel (MJ/MJ)
Well-to- Wheel (MJ/MJ)
Reference
Petrol Sweden 0.041 1.051 1.09 Öman et al., 2011
Petrol 98 octane
Norway 0.09 Furuholt, 1995
Petrol France 0.30 Prieur & Tilagone 2006
Petrol Portugal 0.14 Baptista et al., 2010
Petrol Europe 0.17 Edwards et al., 2011
Petrol, Low sulphur
Europe 1.362 Dones et al., 2007
Petrol International 1.473 Lambert et al., 2012
Petrol International 0.22 Wang et al., 2004 1 The TTW value is based on the primary energy use of oil in the refinery. 2 Calculated from LCI data given in the relevant publication. 3 Calculated from the minimum EROI value of transportation fuel.
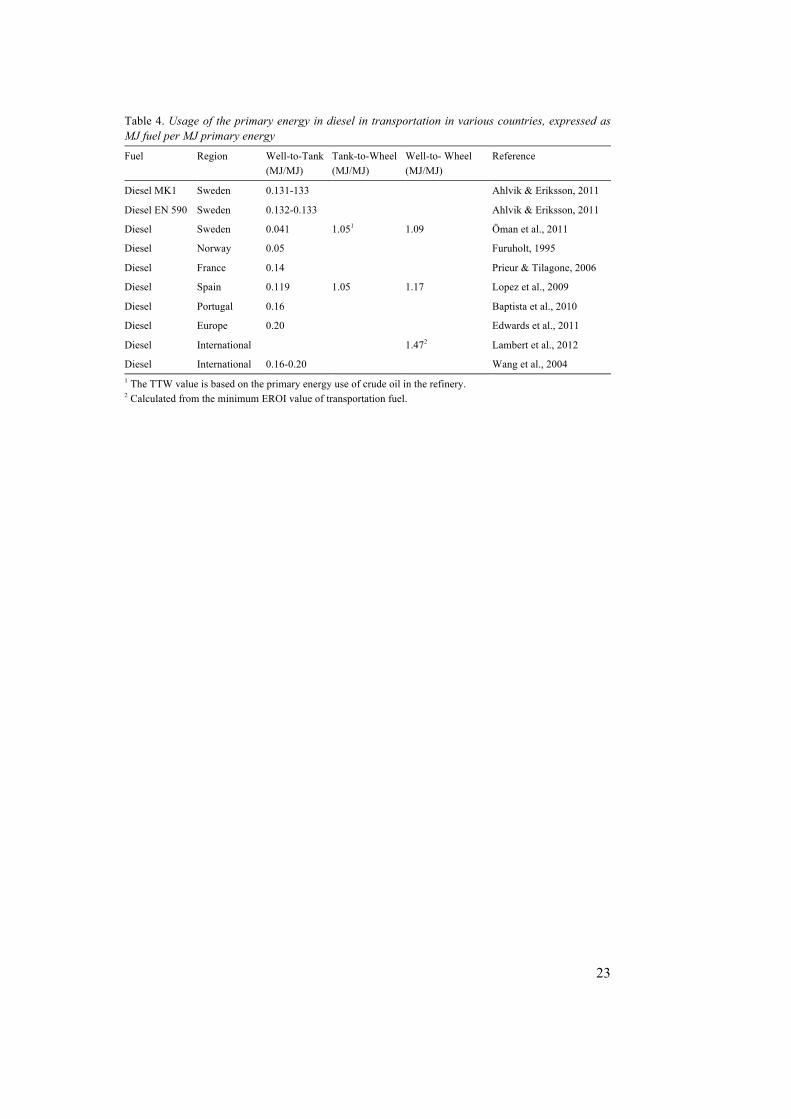
The problem of accurately categorising the results from Öman et al. (2011) also
arises for diesel (Table 4). Apart from the fact that the value in the WTT section is low in comparison with most other results, the majority of the values are not wide-ly spread.
23
Table 4. Usage of the primary energy in diesel in transportation in various countries, expressed as MJ fuel per MJ primary energy
Fuel Region Well-to-Tank (MJ/MJ)
Tank-to-Wheel (MJ/MJ)
Well-to- Wheel (MJ/MJ)
Reference
Diesel MK1 Sweden 0.131-133 Ahlvik & Eriksson, 2011
Diesel EN 590 Sweden 0.132-0.133 Ahlvik & Eriksson, 2011
Diesel Sweden 0.041 1.051 1.09 Öman et al., 2011
Diesel Norway 0.05 Furuholt, 1995
Diesel France 0.14 Prieur & Tilagone, 2006
Diesel Spain 0.119 1.05 1.17 Lopez et al., 2009
Diesel Portugal 0.16 Baptista et al., 2010
Diesel Europe 0.20 Edwards et al., 2011
Diesel International 1.472 Lambert et al., 2012
Diesel International 0.16-0.20 Wang et al., 2004 1 The TTW value is based on the primary energy use of crude oil in the refinery. 2 Calculated from the minimum EROI value of transportation fuel.
24
4 Discussion
4.1 Differences in results due to the natural and the techno-economic systems
In the following, differences in results between LCA studies on fossil fuels are discussed. Such differences can arise e.g. due to natural variations in oil resources, the technology used for extraction, refining and transport, and the economic sys-tem that sets the production criteria. They can also be due to LCA assumptions that are more or less accurate in reflecting reality.
4.1.1 Origin of crude oil and processes needed The crude oil used in a refinery has a large influence on energy use in the WTT perspective, and since the energy is mostly based on fossil fuels, this is reflected in the GHG emissions. Since most refinery processes need heat, the number of pro-cesses is critical for the energy use and emissions produced from a refinery. The simplest refineries basically use atmospheric distillation to separate the crude oil fractions into lighter fractions used for petrol and diesel. This requires less energy than a more advanced refinery that also converts the heavy fractions into lighter fractions using different cracking processes. This means that simple refineries only can use light crudes that already contain mostly light fractions, while advanced refineries can use heavier crudes as raw material. This in turn means that more primary energy is used when petrol and diesel are produced from crudes with higher API-density.
Since heat is essential for many refinery processes, the fuel used and the effi-ciency of this usage have an effect on the LCA results. For example, good insula-tion of pipes and equipment can reduce the need for heating. Heat exchangers can reuse the heat from intermediates that are cooled down and use recovered heat in other process steps. The use of waste heat can reduce the total emissions allocated to the refinery when it replaces other heating sources. The fuel used for heating is also important for the emissions and primary energy use from the refinery. Fuel
25
gas and petroleum coke are often used as a heat source in refineries, which makes them independent from other energy sources, but also has the effect that most or all emissions come from fossil fuels.
Many of the more advanced refinery processes, such as cracking, require hydro-gen gas in addition to heat (Figure 3), which increases the amount of fossil energy needed for processing since natural gas is often used for production. The sulphur content is also important for the energy use, since hydrogen gas is used to remove the sulphur from the crude oils. Szklo & Schaeffer (2007) argue that there is a conflict between the environmental goals of reducing the sulphur content in fuels and reducing emissions of GHG from fuel production.
Process requirements and their effect on LCA results can be briefly summarised as follows: the heavier the crude oil and the higher its sulphur content, the more advanced the refining process needed. Advanced refining is also more costly and may require significant upgrading or reconstruction of the refinery, in particular in Europe, where many refineries are quite old. Including more processes demands more energy, which in turn means more emissions of GHG, especially if the ener-gy comes exclusively from fossil fuels. This connection between API-density and WTT emissions was observed by Skone & Gerdes (2008). Keesom et al. (2012) go one step further and suggest that unconventional crudes such as tar sands simply require a few more processes, implying that there is no major difference from con-ventional oil production.
4.1.2 Unconventional fossil fuel sources Unconventional fossil fuels exist in addition to conventional fossil fuel products, examples being oil shale and tar sands. The reserves of these petroleum products are large (Edwards et al., 2011) and they differ from conventional petroleum, which is found in accumulated deposits, due to their more extended distribution (Jakobsson, 2012). Therefore they require other recovery techniques, such as min-ing in order to collect easily available bitumen, or steam injection in order to re-duce viscosity and make tar sands possible to pump. Natural gas and coal can also be used to produce synthetic oil using the Fischer-Tropsch process, but as with other unconventional sources this requires much more energy than conventional oil (Höök & Aleklett, 2010; Tomaschekt et al., 2012).
These sources of crude oil could be important in a marginal perspective where the most expensive or resource-demanding oil is considered. When comparing EROI values this is clear, since tar sands have lower values than conventional oil, which means that more energy has to be invested to obtain the same amount of usable fuel (Lambert et al., 2012). This makes the unconventional sources less usable even as a marginal crude oil as long as there is conventional oil with high EROI available. According to Edwards et al. (2011), heavy Middle Eastern crudes
26
are more likely to be the marginal crudes in a European perspective in the coming decade, but since synthetic crudes from Canadian tar sands are already on the US and Canadian market, this can still have an effect on the marginal oil in a global perspective.
4.1.3 Oil price determines technologies and investments All production of fossil fuels is to some extent optimised to produce a profit, which means that the most valuable products are produced from the least expen-sive crude oils with the least expensive technology available. Therefore invest-ments in advanced technology and specialised configurations must be based on predictions of future crude oil and fuel prices. The physics of the oil field is also important when deciding whether to invest in advanced recovery technology.
For crude oil production, new technology or increased crude oil prices can make it profitable to make new investments to increase the production. This can be done by exploring new reserves or enhancing the recovery rate in existing fields, both of which require further investments. It has been observed that exploration efforts increase with increasing oil price (Jakobsson, 2012), but this also leads to explora-tion of crude oil in more extreme environments. One example of extreme produc-tion of conventional crude oil is deep water extraction in the Mexican Gulf.
Introduction of new technology and increases in oil prices make new production sites profitable, but when increasing amounts of energy are needed to extract this oil the energy return on investment (EROI) decreases. An example of this is the Norwegian oil fields, which are very efficient in an international perspective, but still have a EROI value that decreased from 46:1 in 1991 to 20:1 in 2008 (Grandell et al., 2011).
On the other hand, production of crude oil also becomes more energy-efficient when previously flared gas is used as fuel instead. However, this is different in different parts of the world and extensive flaring still reduces the energy output from oil extraction, especially in Central Africa and to some extent in former So-viet republics (Prieur & Tilagone, 2006; Edwards et al., 2011) where national oil companies mainly operate. International oil companies are believed to have better performance in terms of flaring and venting reduction than national oil companies. The difference in emissions and energy use can therefore be explained by the dif-ference between these groups of companies rather than the location of the oil re-source (Edwards et al., 2011).
However, it is important to note that technologies and investments are also in-fluenced by policy, concerning e.g. taxes, emission reduction targets and product specifications (EC, 2003; Regeringskansliet, 2004; EC, 2009a; 2009b).
27
4.1.4 Supply and demand in the EU On the European market there is a shortage of diesel and a surplus of petrol. This imbalance has existed since the early 2000s and the petrol surplus exceeded 0.75 million barrels per day of oil equivalent (Mbdoe) in 2009, while the diesel short-age reached 0.5 Mbdoe (Benazzi, 2011). Since the US market has the opposite pattern, petrol is exported from Europe to the US and the reverse occurs for diesel. In order to meet the imbalance in fuel production, Fraysse & Huchette (2011) sug-gest investment in more advanced refinery processes to make the production more flexible. This flexibility will demand high investment, but Fraysse & Huchette (2011) claim that there is a correlation between the investment costs and the posi-tive impact on petrol/diesel imbalance.
The European imbalance between petrol and diesel production is said to be structural (Benazzi, 2011). The shortage of diesel can make more marginal path-ways useful to produce enough diesel fuel in Europe and therefore diesel can have a higher energy demand on average than petrol. Another effect of this is that heavy fuel oils are desulphurised in order to produce diesel that meets European re-quirements (EN 590). Since desulphurisation or hydrotreating consumes energy, this process increases the energy demand and carbon footprint of diesel, especially when crudes with higher sulphur content are used.
4.1.5 Differences in tank-to-wheel In the TTW perspective, the energy use and GHG emissions are dependent on the type of vehicle or engine where the fuel is used. This is clear if the functional unit is per distance, but it also has some influence when the functional unit is per ener-gy content (Gode et al., 2011), as in this review. First of all, the air-fuel ratio is important for the levels of emissions. For optimal combustion the stoichiometric ratio between oxygen and carbon is important and gives carbon dioxide and water from burning hydrocarbons. If there is a surplus of air, some of the oxygen will react with the nitrous gas in the air, producing nitrous oxide (2N2+ O2 à 2N2O), which is a more potent GHG than carbon dioxide (IPCC, 2007). On the other hand, if there is a shortage of oxygen instead there will be more compounds not fully combusted and emissions of methane (CH4) and various nitrous oxides (NOx) will increase (Petchers, 2002). In Gode et al. (2011) this is observed for light and heavy duty vehicles with increasing emissions of methane (CH4) and various ni-trous oxides (NOx) with increasing engine size. At the same time, the emissions of nitrous oxide (N2O) decrease for heavier vehicles.
Another ratio with importance for the fuel emissions in the TTW perspective is the hydrogen-to-carbon (H:C) ratio or the degree of saturation of hydrocarbons. Increased H:C ratio gives higher energy content per mass unit of fuel. At the same time, the emissions of carbon dioxide per unit of energy produced decrease with a
28
higher H:C ratio due to the lower carbon content in the fuel (Edwards et al., 2011). Both of these ratios can influence the level of GHG emissions from fuels combust-ed.
4.2 Differences in results due to LCA method In the studies reviewed, average data are by far the most commonly used and the marginal perspective is only employed by Edwards et al. (2011). This could partly explain why the results presented by Edwards et al. (2011) are slightly higher than those in other European studies (Table 1-4).
The conversion to carbon dioxide-equivalents can differ between studies and create a small variation between results. In the examples given in the Materials and Methods section, the conversion factor for methane varies from 23 to 25 in a 100-year perspective (IPCC, 2007; EC, 2009). When recalculating results in this report, the values given in the European Directive (EC, 2009) were used for CO2, N2O and CH4, which are the gases considered in the Directive. Since the CO2 val-ue always equals 1 CO2-eq and CO2 is the main GHG emission, this factor has a small influence on the results. The release of large amounts of CH4 due to exten-sive venting could create a larger variation, since the conversion factor for me-thane can vary by approximately 10% (EC, 2009; IPCC, 2007) in a 100-year per-spective. In shorter perspectives, i.e. 20 years, methane will be an even more pow-erful GHG (IPCC, 2007).
4.2.1 Allocation methods There are different allocation methods available, such as physical allocation on mass or energy content, but also economic allocation based on the monetary value of products. However the monetary value in particular can vary over time and for different regions for the different refinery products. This makes several versions of the allocation methods possible, which creates a possible variation in the results.
Wang et al. (2004) tested three different allocation methods for the refinery pro-cess and found that the outcome of the different methods did not vary greatly. There was a 20% difference between mass-based or energy content-based alloca-tion and market value-based allocation for diesel, and no variation for petrol. This indicates that the variations in the results caused by different allocation methods are too small to explain the entire range of differences between studies.
However, the allocation can have a large influence when looking at crude oil production. Furuholt (1995) tested three different ways of allocation between gas and oil production at the offshore platform and found that these produced very different results. When allocating by volume, gas represented 99.5% of the pro-duction and oil 0.5%, but when allocating by energy content gas represented only
29
19% and oil 81%. Allocated by energy use, gas represented 48% and oil 52% of the production. This shows that different allocation methods can have a major influence on the emissions at the well. This variation in results can be increased if the gas is used as an energy source at the refinery, is flared at the production site or is simply vented, with large emissions of methane and other volatile organic compounds that are very potent GHG. There is no standard method for usage of the gas and it varies widely between global production sites (Dones et al., 2009).
Both Wang et al. (2004) and Furuholt (1995) use data on a sub-process level in the refinery and allocate emissions to each intermediate and not just to the end product. Both also argue that this gives lower and more correct results than when the refinery is regarded as a black box with just ingoing crude oil, outgoing fuels and resources used in the process. Wang et al. (2004) found that any allocation of emissions to the product category called others (e.g. waxes and lubricants) was difficult. The amount of GHG emissions that could be allocated to these other products was too small at the aggregated refinery level, since they often need more processing per energy unit or mass unit in comparison with petrol or diesel. Fu-ruholt (1995) compared the sub-process allocation of diesel and petrol with the allocation of an aggregated level and found small differences for petrol and large differences for diesel. The energy use and emissions of carbon dioxide were re-duced to approximately 40% by using sub-process allocation instead of refinery level allocation. This explains the comparatively low values for diesel in Tables 2 and 4, since less energy is needed for the sub-processes that diesel undergoes than the average sub-process in the refinery.
4.2.2 Multiple outputs A so-called multi-functionality problem arises when two (or more) products share or partly share production system. Multi-functionality problems can be handled either by allocation (partitioning of environmental impact) or by expanding the studied system. However, system expansion involves identifying a main product or products. The environmental impact of these products is calculated by subtract-ing the emissions that the by-products can avoid by replacing other marginal prod-ucts on the market. This is a common method of allocating the emissions from processes in cLCA. Edwards et al. (2011) argue that system expansion is the only way to handle emissions from a refinery with multiple outputs, since all by-products are not used as an energy source and the energy value is therefore irrele-vant. This marginal approach with system expansion for oil refineries is claimed to be unique by Edwards et al. (2011) and was not found in any of the other studies reviewed here.
Indeed, none of the reviewed studies uses system expansion as a method, except for the recovery of waste heat (Öman et al., 2011). If the waste heat from the re-
30
finery process is used to replace other heating sources, it can potentially reduce the emissions allocated to the refinery process. According to Szklo & Schaeffer (2007), waste heat recovery could reduce fuel consumption by 10% in a Brazilian context. In the Swedish context, district heating is the main use of refinery waste heat but due to the low level of emissions from this heating system it has only marginal effects on the refinery emissions (Öman et al., 2011).
4.2.3 Functional unit The studies reviewed here all use the functional unit per MJ, since they focus on the WTT perspective. This is a useful functional unit for this perspective, since both petrol and diesel are used as a fuel and valued for the energy content. In the TTW perspective a more common functional unit is per distance. This gives more focus on the efficiency of the vehicle and engine in question, since the actual dis-tance that something can be transported is of high interest when using the fuels.
4.3 Indirect effects of oil production Indirect effects are often considered in LCA of biofuels, but this seems to be rare regarding fossil fuels. Crude oil is associated with several socio-economic prob-lems in parts of the world and the control of crude oil has been a source of aggres-sion and conflicts throughout recent history. This can be considered a social prob-lem rather than an environmental problem and might therefore be excluded from LCA studies.
However, Liska & Perrin (2009) provide a rough example of how an indirect ef-fect could influence GHG emissions from petrol and diesel by adding the emis-sions from military forces used to secure the extraction of crude oil in parts of the world. According to Liska & Perrin (2009), the indirect emissions could be as high as the direct emissions, but this is of course a very rough estimate and the result depends largely on what is included in the calculation.
Other indirect environmental effects are connected to accidents in which large quantities of crude oil leak out in the ocean, with catastrophic effects on the local ecosystem. Examples of such accidents are the oil spill resulting from the tanker Exxon Valdez, which ran aground off Alaska in 1989, or the more recent explo-sion on the offshore Deepwater Horizon platform that led to a large oil spill in the Gulf of Mexico.
4.4 What value to choose for fossil fuels in LCA studies? The GHG emissions in the studied literature varied from 6.7 to 27 g CO2-eq/MJ and 7.9 to 24 g CO2-eq/MJ fuel for the WTT stage for petrol and diesel respective-
31
ly. The TTW stage shows less variation, from 73 to 78.3 g CO2-eq/MJ fuel and 82.3 to 99 g CO2-eq/MJ fuel, for petrol and diesel respectively. For the entire life cycle (WTW stage) the GHG emissions varied between 84.7 to 102 g CO2-eq/MJ fuel and 82.3 and 99 g CO2-eq/MJ fuel for petrol and diesel respectively.
In biofuel LCAs, the most widely used fossil fuel reference seems to be Ed-wards et al. (2011) or earlier versions of that study (Edwards et al., 2007). Based on the present review, we can also recommend Edwards et al. (2011) for use as the fossil fuel reference in comparison with biofuels, as the study intends, due to transparency in data and the European context. The WTW results of 87.5 CO2-eq/MJ for petrol and 89.1 CO2-eq/MJ for diesel are also in the same range as those cited in the other studies reviewed.
For the Swedish WTT perspective, the study by Öman et al. (2011) can be used as a reference due to the transparency in original data and the usage of specific data that are representative for the Swedish perspective. For the WTW perspective, Gode et al. (2011) is also a good source due to the presentation of LCI data. Fu-ruholt (1995) presents results that are older and originate only from Norway, but could still be sufficient in the Swedish context, since Swedish refineries use a large proportion of Norwegian oil and can be expected to have the same short distances and modern infrastructure.
All studies reviewed correspond in some way to the methods of aLCA rather than cLCA, due to the usage of average (or total, as some claim) data and to any future scenarios included predicting that some fossil fuels will be replaced by bio-fuels. Since none of the reviewed studies uses cLCA methods to calculate energy use or GHG emissions for the life cycle of petrol and diesel, we cannot give any reference recommendations for consequential perspectives on petrol and diesel usage. Therefore, more research is needed on this topic.
32
5 Conclusions The variations in results in the 13 studies reviewed here can be explained by varia-tions in the natural and techno-economic systems (e.g. origin of crude oil, venting and flaring, refinery technology) or by the usage of different input data and as-sumptions in the LCA (e.g. allocations, conversion factors, model usage, system boundaries). However, the results did not vary widely, since most of the GHG emissions are due to actual use of the fuel in vehicles. Another reason why the results from the studies did not vary more widely is that they are all based on aver-age values and often use the same assumptions for uncertain data, which gives the extreme values less impact. For example, the amount of venting and flaring is very uncertain and there are probably great variations between different production sites, but most studies make the same assumptions.
Swedish refineries often use advanced technology in order to minimise costs and environmental impacts. This is the main reason why studies of the Swedish perspective often report lower values of emissions than the European average.
All studies reviewed report higher values for GHG emissions than the standard value used in the EU Renewable Energy Directive. This could lead to an unfa-vourable situation for biofuels when they are compared against an unexpectedly low value for fossil fuels.
33
References Ahlvik, P., Eriksson, L. (2011) Well to tank assessment – diesel fuel MK1 and EN 590, Report
127057, rev. 2, Ecotraffic. Almén, J. (2008) Emissionsprovning av MK 1 och EN 590-diesel med och utan inblandning av 5 %
RME, Report 8150811, Preem AB and AVL MTC Motortestcenter AB, Haninge, Sweden. Baptista, P., Silva, C., Farias, T. (2010) Impacts of Alternative Vehicle Technologies and Energy
Sources in the Portuguese Road Transportation Sector, IDMEC - Instituto Superior Técnico Uni-versidade Técnica de Lisboa, Lisabon, Portugal.
Bauman, H., Tillman, A.-M. (2004) The Hitch Hiker's Guide to LCA, Studentlitteratur, Lund, Swe-den.
Benazzi, E. (2011) Gasoline and diesel imbalances in the Atlantic Basin, part I: market outlook, PTQ Q2.
Brown, H., Hamel, B., Hedman, B. (1996) Energy Analysis of 108 Industrial Processes, The Fair-mount Press, Georgia, USA.
Bruice, P.Y. (2001) Organic Chemistry, 3rd edition, Prentice Hall, New Jersey, USA. Cherubini, F., Strømman, AH. (2011) Life cycle assessment of bioenergy systems: State of the art
and future challenges, Bioresource Technology, 102, 437–451. Clayden, J., Greeves, N., Warren, S., Wothers, P. (2001) Organic Chemistry, Oxford University
Press, New York, USA. Dones, R., Bauer, C., Bolliger, R., Burger, B., Faist Emmenegger, M., Frischnecht, R., Heck, T.,
Jungbluth, N., Röder, A., Tuchschmid, M. (2007) Life Cycle inventories of Energy Systems: Re-sults for Current Systems in Switzerland and other UCTE Countries, Ecoinvent report no. 5, Paul Scherrer Institut Villigen, Swiss Centre for Life Cycle Inventories, Dübendorf, Switzerland.
EC (2003) Council Directive 2003/96/EC of 27 October 2003 restructuring the Community frame-work for the taxation of energy products and electricity, Official Journal of the European Union.
EC (2009a) Directive 2009/28/EC of the European Parliament and of the Council of 23 April 2009 on the promotion of the use of energy from renewable sources and amending and subsequently repealing Directives 2001/77/EC and 2003/30/EC, Official Journal of the European Union.
EC (2009b) Directive 2009/30/EC of the European Parliament and of the Council of 23 April 2009 amending Directive 98/70/EC as regards the specification of petrol, diesel and gas-oil and intro-ducing a mechanism to monitor and reduce greenhouse gas emissions and amending Council Di-rective 1999/32/EC as regards the specification of fuel used by inland waterway vessels and re-pealing Directive 93/12/EEC, Official Journal of the European Union.
Edwards, R., Larivé, J-F., Maheiu, V., Rouveirolles, P. (2007) Well-to-wheels Analysis of Future Automotive Fuels and Powertrains in the European Context, Well-to-Tank Report Version 2c, European Commission, Joint Research Centre, Institute for Energy and Transport.
34
Edwards, R., Larivé, J-F., Beziat, J-C., (2011) Well-to-wheels Analysis of Future Automotive Fuels and Powertrains in the European Context, Well-to-Tank Report Version 3c, European Commis-sion, Joint Research Centre, Institute for Energy and Transport.
EIA (2013) United States Energy Information Administration, www.eia.gov. Finnveden, G., Hauschild, M., Ekvall, T., Guinee, J., Heijungs, R., Hellweg, S., Koehler, A., Pen-
nington, D. Suh, S. (2009) Recent developments in Life Cycle Assessment, Journal of Environ-mental Management, 91, 1-21.
Fraysse, S., Huchette, H. (2011) Gasoline and diesel imbalances in the Atlantic Basin, part II: Op-tions to re-orientate a refinery´s production towards middle distillates, PTQ Q4.
Furuholt, E. (1995) Life cycle assessment of gasoline and diesel, Resources, Conservation and Recy-cling, 14, 251-263.
General Motors Europe (2002) GM well-to-wheel analysis of energy use and greenhouse gas emis-sions of advanced fuel/vehicle systems – European study, General Motors Europe.
Gode, J., Martinsson, F., Hagberg, L., Öman, A., Höglund, J., Palm, D. (2011) Miljöfaktaboken 2011: Estimated emission factors for fuels, electricity, heat and transportation in Sweden, Värmeforsk Service AB, Stockholm, Sweden.
Grandell, L., Hall, C., Höök, M. (2011) Energy Return on Investment for Norwegian Oil and Gas from 1991 to 2008, Sustainability, 3, 2050-2070.
Höök, M., Aleklett, K. (2010) A review on coal-to-liquid fuels and its coal consumption, Interna-tional Journal of Energy Research, 34, 848–864.
IPCC (2007) Climate Change 2007: The Physical Science Basis. Contribution of Working Group I to the Fourth Assessment Report of the Intergovernmental Panel on Climate Change [Solomon, S., D. Qin, M. Manning, Z. Chen, M. Marquis, K.B. Averyt, M. Tignor and H.L. Miller (eds.)]. Cambridge University Press, Cambridge, United Kingdom and New York, USA.
Jakobsson, K. (2012) Petroleum Production and Exploration: Approaching the End of Cheap Oil with Bottom-Up Modeling, Acta Universitatis Uppsaliensis, ISBN 978-91-554-8252-7, Uppsala, Sweden.
Jerksjö, M., Martinsson, F. (2010) Hämtning och bearbetning av data från modellen HBEFA3.1EV - The handbook of Emission Factors for Road Transport, Referred as in Gode et al., 2012.
Keesom, B., Blieszner, J., Unnasch, S. (2012) EU Pathway Study: Life Cycle Assessment of Crude Oils in a European Context, Exectutive Summary, Jacobs Consultancy, Calgary, Canada.
Lambert, J., Hall, C., Balogh, S., Poisson, A., Gupta, A. (2012) EROI of Global Energy Resources: Preliminary Status and trends, DFID, 59717.
Liska, A., Perrin, R. (2009) Indirect land use emissions in the life cycle of biofuels: regulations vs science, Biofuels, Bioproducts & Biorefining, 3, 318-328.
López, J., Gómez, A., Aparicio, F., Sánchez, J. (2009) Comparison of GHG emissions from diesel, biodiesel and natural gas refuse trucks of the City of Madrid, Applied Energy, 86, 610–615.
Nygren, E., Aleklett, K., Höök, M. (2009) Aviation fuel and future oil production scenarios, Energy Policy, 37, 4003–4010.
Öman, A., Hallberg, L., Rydberg, T. (2011) LCI för petroleumprodukter som används i Sverige, IVL Rapport B1965, IVL Svenska Miljöinstitutet AB, Stockholm, Sweden.
Perimenis, A., Majer, S., Zech, K., Holland, M., Müller-Langer, F. (2010) Lifecycle Assessment of Transportation Fuels, Deliverable D5 (WP 4 report), German Biomass Research Centre, Leipzig, Germany.
Petchers, N. (2002) Combined heating, cooling & power handbook: technologies and applications: an integrated approach to energy conservation/reasource optimization, The Fairmont Press, Lil-burn, USA.
35
Pierru, A. (2007) Allocating the CO2 emissions of an oil refinery with Aumann-Shapley prices, Energy Economics, 29, 563-577.
Prieur, A., Tilagone, R. (2006) A detailed Well to Wheel Analysis of CNG compared to diesel oil and gasoline for the French and the European markets, IFP, Economics Studies Division, Rueil Malmaison Cedex, France.
Regeringskansliet (2004) Environmental Quality Objectives: A Shared Responsibility, Summary of Government Bill 2004/05:150, Regeringskansliet, Stockholm, Sweden.
Simpson, A. (2005) Full-Cycle Assessment of Alternative Fuels for Light-Duty Road Vehicles in Australia, 19th World Energy Congress.
Skone, T., Gerdes, K. (2008) Development of Baseline Data and Analysis of Life Cycle Greenhouse Gas Emissions of Petroleum-Based Fuels, DOE/NETL-2009/1346, U.S. Department of Energy’s National Energy Technology Laboratory.
Szklo, A., Schaeffer, R. (2007) Fuel specification, energy consumption and CO2 emission in oil refineries, Energy, 32, 1075-1092.
Tomaschek, J., Özdemir, E.D., Fahl, U., Eltrop, L. (2012) Greenhouse gas emissions and abatement costs of biofuel production in South Africa, GCB Bioenergy, 4, 799–810.
Wang, M., Lee, H., Molburg, J. (2004) Allocation of Energy Use in Petroleum Refineries to Petrole-um Products: Implications for Life-Cycle Energy Use and Emission Inventory of Petroleum Transportation Fuels, International Journal of Life Cycle Assessments, 9, 34-44.
Wikipedia (2013) http://en.wikipedia.org/wiki/Oil_refinery 2013-02-28.

SLU SLU
Institutionen för energi och teknik Department of Energy and
Box 7032 Technology
750 07 UPPSALA Box 7032
Tel 018-67 10 00 SE-750 07 UPPSALA
SWEDEN
www.slu.se/energyandtechnology Tel +46 18 67 10 00
__________________________________________________________________________________