latitudinal and longitudinal adaptation of switchgrass populations
TRANSCRIPT

Repro
duced
from
Cro
pS
cie
nce.
Publis
hed
by
Cro
pS
cie
nce
Socie
tyof
Am
erica.
All
copyrights
reserv
ed.
CROP SCIENCE, VOL. 47, NOVEMBER–DECEMBER 2007 2249
RESEARCH
Switchgrass (Panicum virgatum L.) is a warm-season native grass, used for livestock feed and biofeedstock production, soil and
wildlife conservation, and prairie restoration in a large portion of the USA. Switchgrass produces a high yield of biomass across a wide geographic range; it is suitable for use on marginal, highly erodable, and droughty soils; it has the potential of sequestering large amounts of atmospheric C in permanent grasslands; and it provides excellent nesting habitat for migratory birds (Vogel, 2004; Paine et al., 1996; Sanderson et al., 1996). Heat, cold, and drought tolerance within the species has allowed adapted ecotypes to inhabit much of North America, ranging west to the front range of the Rocky Mountains, north to Hudson Bay, and south to the Texas Coastal Plain.
Evolutionary processes including gene migration, random genetic drift, mutation, and natural selection combined with envi-ronmental variation due to latitude, altitude, soil type, and precipi-tation have resulted in signifi cant genetic and phenotypic variation
Latitudinal and Longitudinal Adaptation of Switchgrass Populations
M. D. Casler,* K. P. Vogel, C. M. Taliaferro, N. J. Ehlke, J. D. Berdahl, E. C. Brummer, R. L. Kallenbach, C. P. West, and R. B. Mitchell
ABSTRACT
Switchgrass (Panicum virgatum L.) is a warm-
season native grass, used for livestock feed,
bioenergy, soil and wildlife conservation, and
prairie restoration in a large portion of the USA.
The objective of this research was to quantify
the relative importance of latitude and longitude
for adaptation and agronomic performance of
a diverse group of switchgrass populations. Six
populations, chosen to represent remnant prai-
rie populations on two north–south transects,
were evaluated for agronomic traits at 12 loca-
tions ranging from 36 to 47°N latitude and 88
to 101°W longitude. Although the population ×
location interactions accounted for only 10 to
31% of the variance among population means,
many signifi cant changes in ranking and adap-
tive responses were observed. Ground cover
was greater for northern-origin populations
evaluated in hardiness zones 3 and 4 and for
southern-origin populations evaluated in har-
diness zones 5 and 6. There were no adaptive
responses related to longitude (ecoregion).
Switchgrass populations for use in biomass
production, conservation, or restoration should
not be moved more than one hardiness zone
north or south from their origin, but some can
be moved east or west of their original ecore-
gion, if results from fi eld tests support broad
longitudinal adaptation.
M.D. Casler, USDA-ARS, U.S. Dairy Forage Res. Center, 1925 Lin-
den Dr. West, Madison, WI 53706-1108; K.P. Vogel and R.B. Mitchell,
USDA-ARS, Univ. of Nebraska–East Campus, P.O. Box 830937, Lin-
coln, NE 68583-0937; C.M. Taliaferro, Dep. of Plant & Soil Sciences,
Oklahoma State Univ., Stillwater, OK 74078-6028; N.J. Ehlke, Dep. of
Agronomy & Plant Genetics, 1991 Buford Cir., St. Paul, MN 55108-6026;
J.D. Berdahl, USDA-ARS, Northern Great Plains Res. Ctr., P.O. Box 459,
Mandan, ND 58544; E.C. Brummer, Crop and Soil Sciences Dep., Univ.
of Georgia, 111 Riverbend Dr., Athens, GA 30602; R.L. Kallenbach, Divi-
sion of Plant Sciences, 108 Waters Hall, Univ. of Missouri, Columbia, MO
65211; C.P. West, Dep. of Crop, Soil & Environmental Sciences, Univ. of
Arkansas, 1366 W. Altheimer Dr., Fayetteville, AR 72704-6898. Received
12 Dec. 2006. *Corresponding author ([email protected]).
Published in Crop Sci. 47:2249–2260 (2007).doi: 10.2135/cropsci2006.12.0780© Crop Science Society of America677 S. Segoe Rd., Madison, WI 53711 USA
All rights reserved. No part of this periodical may be reproduced or transmitted in any form or by any means, electronic or mechanical, including photocopying, recording, or any information storage and retrieval system, without permission in writing from the publisher. Permission for printing and for reprinting the material contained herein has been obtained by the publisher.
Repro
duced
from
Cro
pS
cie
nce.
Publis
hed
by
Cro
pS
cie
nce
Socie
tyof
Am
erica.
All
copyrights
reserv
ed.
2250 WWW.CROPS.ORG CROP SCIENCE, VOL. 47, NOVEMBER–DECEMBER 2007
in switchgrass. Latitude of origin has a signifi cant impact on productivity, survival, and adaptation traits of switch-grass (Sanderson et al., 1999; Casler et al., 2004). Two distinct cytotypes exist in switchgrass, upland and low-land (Hultquist et al., 1996). Upland cytotypes are more adapted to northern latitudes and lowland cytotypes are more adapted to southern latitudes. Furthermore, there is genetic variability for adaptation within each cytotype, both of which have northern and southern types within their geographic range (Casler et al., 2004). Growth rate, photoperiodism, heat tolerance, and cold or freezing toler-ance regulate adaptation of switchgrass populations.
Adaptation of switchgrass populations has important implications for both agronomic production and prairie conservation and restoration. Agronomically, it is impor-tant to utilize germplasm that has photoperiod traits, mor-phological plasticity, and stress tolerances that match the environmental characteristics of a particular region (Casler et al., 2004; Boe and Casler, 2005). Photoperiod, mor-phological, and adaptation traits are all important in prai-rie restoration and conservation endeavors, to ensure that populations are phenotypically similar and well adapted to local environmental conditions. For this reason, many res-toration ecologists recommend that populations be drawn only from collections made locally, although “local” is often diffi cult to defi ne. USDA hardiness zones, defi ned in 5.5°C increments of mean annual minimum temperature, provide an excellent framework for choosing germplasm for use in agronomic breeding programs and for defi ning “local” conditions for restoration purposes (Casler et al., 2004). However, little is known about genetic variation that conditions the response of switchgrass populations to longitude and its environmental basis. The objective of this research was to quantify the relative importance of latitude and longitude in regulating the adaptation and agronomic performance of a diverse group of switchgrass populations.
MATERIALS AND METHODSSix switchgrass populations were chosen to represent two latitu-
dinal transects based on their site of origin (Table 1; Fig. 1). Each
population was derived from one or more remnant prairie popu-
lations. Pathfi nder and Sunburst have a short selection history
for vigor (Boe and Ross, 1998, Newell, 1968b), but are closely
representative of their original prairie remnant collections. Seeds
from each population were germinated in a greenhouse in Janu-
ary 1999. Seeds of the cultivars Blackwell, Cave-in-Rock, Path-
fi nder, and Sunburst were obtained from commercial sources.
Seeds of WS98-IP and WS98-SB were collected from their
respective site of origin in September 1998.
One thousand seedlings of each population were trans-
planted into isolated crossing blocks at Arlington, WI, in May
1999. Plants were spaced 0.9 m apart in perpendicular direc-
tions. Crossing blocks were isolated from other switchgrass by a
minimum of 100 m. Weeds were controlled using a combina-
tion of tillage, hand weeding, and application of 1.12 kg ha−1
alachlor [2-chloro-N-(2,6-diethylphenyl)-N-(methoxymethyl)
acetamide] with 0.07 kg ha−1 imazethapyr {2-[4,5-dihydro-4-
methyl-4-(1-methylethyl)-5-oxo-1H-imidazol-2-yl]-5-ethyl-
3-pyridinecarboxylic acid}. Each crossing block was fertilized
with 112 kg N ha−1 in May 2000. Bulk seed was harvested
from each crossing block with a combine in September 2000.
Seed was cleaned and stored at 21°C for 5 mo, then 3°C for 2
wk. Two 0.5-g seed samples of each population were tested for
germination using a standard protocol (AOSA, 1998) and used
to determine mean seed mass.
Populations were planted at 12 locations representing four
of the USDA hardiness zones (Table 2; Fig. 1). A Latin square
design was used at all locations. Eleven locations were planted in
spring 2001 and Mandan was planted in spring 2002. Plot size
and soil type for each location are listed in Table 2. Plots were
seeded with a drill, rows were spaced 15 to 20 cm apart, and
the seeding rate was 930 PLS m−2. Weeds were controlled by
use of pre- and postemergence herbicides, which varied among
locations due to local conditions, needs, and restrictions. Forage
growth was harvested, but no data were collected at the end of
the fi rst growing season.
Plots were fertilized with 112 kg N ha−1 in spring of 2002–
2004 (2003–2005 for Mandan). Heading date was scored for
each plot when approximately 10 panicles were fully emerged.
When most plots had reached anthesis, each plot was scored for
maturity using the numerical version of the Nebraska maturity
rating scale (Moore et al., 1991). A random sample of tillers was
hand-clipped from each plot at a 9-cm cutting height. Sam-
ples were weighed, dried at approximately 60°C for 5 to 6 d,
and weighed again for dry matter determination. To determine
biomass yield, plots were harvested once per year with a fl ail
harvester (0.9-m width) or a sickle-bar mower (1.2-m width),
depending on location. Harvest dates ranged from late July at
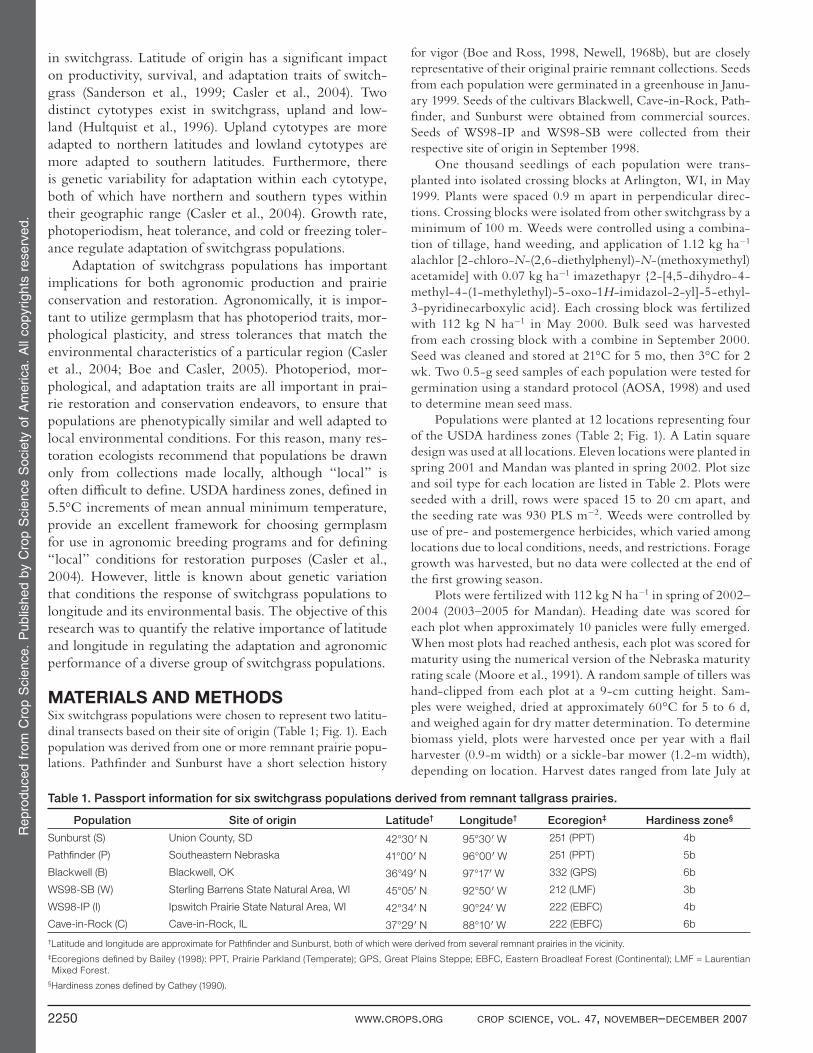
Table 1. Passport information for six switchgrass populations derived from remnant tallgrass prairies.
Population Site of origin Latitude† Longitude† Ecoregion‡ Hardiness zone§
Sunburst (S) Union County, SD 42°30′ N 95°30′ W 251 (PPT) 4b
Pathfi nder (P) Southeastern Nebraska 41°00′ N 96°00′ W 251 (PPT) 5b
Blackwell (B) Blackwell, OK 36°49′ N 97°17′ W 332 (GPS) 6b
WS98-SB (W) Sterling Barrens State Natural Area, WI 45°05′ N 92°50′ W 212 (LMF) 3b
WS98-IP (I) Ipswitch Prairie State Natural Area, WI 42°34′ N 90°24′ W 222 (EBFC) 4b
Cave-in-Rock (C) Cave-in-Rock, IL 37°29′ N 88°10′ W 222 (EBFC) 6b
†Latitude and longitude are approximate for Pathfi nder and Sunburst, both of which were derived from several remnant prairies in the vicinity.
‡Ecoregions defi ned by Bailey (1998): PPT, Prairie Parkland (Temperate); GPS, Great Plains Steppe; EBFC, Eastern Broadleaf Forest (Continental); LMF = Laurentian
Mixed Forest.
§Hardiness zones defi ned by Cathey (1990).

Repro
duced
from
Cro
pS
cie
nce.
Publis
hed
by
Cro
pS
cie
nce
Socie
tyof
Am
erica.
All
copyrights
reserv
ed.
CROP SCIENCE, VOL. 47, NOVEMBER–DECEMBER 2007 WWW.CROPS.ORG 2251
general linear models analysis of variance, treating populations
as a fi xed eff ect and all other factors as random eff ects.
The population × evaluation-location interaction was par-
titioned into contrasts to test specifi c diff erences among popu-
lations using specifi c combinations of locations. First, the six
populations were partitioned into fi ve single degree of freedom
contrasts: ecoregion of origin (Prairie Parkland vs. Eastern For-
est), Prairie Parkland-transect linear and nonlinear, and Eastern
Forest-transect linear and nonlinear. The ecoregion contrast
was computed from four of the six populations, eliminating
some confounding eff ects between ecoregion and hardiness
zone (Fig. 1), using Sunburst and WS98-IP from hardiness zone
4 and Blackwell and Cave-in-Rock from hardiness zone 6. Each
of these fi ve contrasts was computed for six combinations of the
evaluation locations (Table 2; Fig. 1): Prairie Parkland locations
(Mandan, ND; Ames, IA; DeKalb, IL; Mead, NE; Columbia,
MO; Stillwater, OK), Eastern Forest locations (Spooner, WI;
Rosemount, MN; Marshfi eld, WI; Arlington, WI; Lancaster,
WI; Fayetteville, AR), and locations within USDA hardiness
zones 3, 4, 5, and 6. Second, population means at each location
the southernmost locations to mid-September at the northern-
most locations and were timed for late anthesis or postanthesis.
Plot biomass yields were adjusted to a dry matter basis. Ground
cover was determined with two random placements of a 25-cell
grid with a cell size of 15 by 15 cm (Vogel and Masters, 2001),
once after initial spring growth and once after harvest in each
year. Data were collected for 3 yr at all locations, except Fay-
etteville (two years only).
Biomass yield data were analyzed by nearest neighbor anal-
ysis using separate row and column covariates and ignoring all
population and block eff ects for each location-year combina-
tion (Casler, 1999). The residuals, representing all variation due
to populations and blocks, were saved for each location-year
combination. The appropriate location-year mean was added
to each residual to rescale the residuals to represent the raw
data adjusted for spatial variation. Adjusted biomass yield values
were analyzed by general linear models analysis of variance,
subtracting 2 df from error for each location-year combination
(Smith and Casler, 2004). All other variables were analyzed by
Figure 1. Plant Adaptation Region map for the central USA, showing the location of 12 test sites and the origin of six switchgrass
populations. Plant Adaptation Regions (Vogel et al., 2005) are defi ned by a combination of Ecoregion provinces (Bailey, 1997; 1998)
and USDA plant hardiness zones, HZ (Cathey, 1990). Ecoregion province names are as follows: 212 = Laurentian Mixed Forest; 222 =
Eastern Broadleaf Forest (Continental); 231 = Southern Mixed Forest; 234 = Lower Mississippi Riverine Forest; M222 = Ozark Broadleaf
Forest-Meadow; M231 = Ouachita Mixed Forest-Meadow; M234 = Black Hills Coniferous Forest; 251 = Prairie Parkland (Temperate); 255
= Prairie Parkland (Subtropical); 311 = Great Plains Steppe and Shrub; 315 = Southwest Plateau and Plains Dry Steppe and Shrub; 331
= Great Plains and Palouse Dry Steppe; and 332 = Great Plains Steppe. Lines connecting Sunburst, Pathfi nder, and Blackwell indicate
the north–south transect in the Prairie Parkland ecoregion. Lines connecting WS-SB, WS-IP, and Cave-in-Rock indicate the north–south
transect in the Eastern Forest ecoregion. Lines connecting Sunburst with WS-IP and Blackwell with Cave-in-Rock indicate the east–west
comparison of Prairie Parkland vs. Eastern Forest ecoregions.

Repro
duced
from
Cro
pS
cie
nce.
Publis
hed
by
Cro
pS
cie
nce
Socie
tyof
Am
erica.
All
copyrights
reserv
ed.
2252 WWW.CROPS.ORG CROP SCIENCE, VOL. 47, NOVEMBER–DECEMBER 2007
were scaled to eliminate the main eff ect of location by subtract-
ing the location mean from each value (Casler et al., 2004).
Scaled means for each population were separately regressed on
latitude and longitude of each evaluation location (n = 12). All
regressions were formulated as linear contrasts using coeffi cients
computed (Carmer and Seif, 1963) and tested in the general lin-
ear models ANOVAs (Steel et al., 1996).
RESULTSAs expected, based on their diverse origins, populations dem-onstrated signifi cant diff erences for all variables measured (P < 0.01). Because all population × year interactions were nonsig-nifi cant, all results were presented as means over years, with the exception of ground cover, which was presented as means approximately 40 mo after planting (late summer of the third harvest year). Conversely, the population × location interac-tion was signifi cant (P < 0.01) for all variables, accounting for 10.5 to 13.0% of the variance of a population mean for heading date, dry matter concentration, and biomass yield, but 31.0% of the variance of a population mean for ground cover.
The mean growth stage at harvest was mid-anthesis for Blackwell and Pathfi nder, late anthesis for Cave-in-Rock, and postanthesis for the other three populations, corresponding to a range in heading date of 9 d. Matu-rity at harvest was highly and consistently correlated with heading date at all 12 locations (mean r = −0.83 ± 0.06), so the maturity rating was excluded from all further data analyses and presentations.
Ground cover measurements, taken twice per year for 3 yr, had an autoregressive correlation structure in which mea-surements made following shorter time intervals were more highly correlated than measurements made following longer
time intervals. Averaged over locations, the mean phenotypic correlations of ground cover at 40 mo postplanting with the other ground cover measurements were: r = 0.61 ± 0.11 for 12 mo, r = 0.72 ± 0.06 for 16 mo, r = 0.63 ± 0.12 for 24 mo, r = 0.81 ± 0.06 for 28 mo, and r = 0.95 ± 0.02 for 36 mo. Based on these results and their consistency across locations, ground cover at approximately 40 mo was used in all further analyses and presentations.
The three populations originating in the Prairie Parkland ecoregion were later in heading than the three populations originating in the Eastern Forest ecoregion (Table 3). This diff erence was similar for trials at Prairie Parkland and Eastern Forest locations, and there were no consistent trends for variation in this eff ect measured on a north-south transect across hardiness zones 3 to 6. The ecoregion eff ect accounted for an average of 24% of the variation among the six populations.
Populations originating from more southern sites were later in heading, regardless of the evaluation location (Table 3). Regressions of heading date on latitude of ori-gin were negative and signifi cant (P < 0.01) for all ecore-gions and hardiness zones. On average, populations were 0.8 d earlier in heading for each degree of latitude change toward the north. This eff ect was similar in magnitude between Prairie Parkland and Eastern Forest locations and across hardiness zones 3 to 6. The linear portions of this relationship accounted for an average of 49% of the varia-tion among the six populations.
The Prairie Parkland populations had greater dry matter concentration than the Eastern Forest populations for all but one of the location groups (Table 4). This eff ect accounted for an average of 19% of the variation among
Table 2. Soil types, latitude, longitude, Bailey’s ecoregion, USDA hardiness zone, and plot sizes for 12 locations used to evalu-
ate six switchgrass populations.
Location Soil type Latitude Longitude Ecoregion† Hardiness zone‡
Plotsize
m
Mandan, ND Parshall fi ne sandy loam (coarse-loamy, mixed, superactive, frigid
Pachic Haplustoll)46°49′ N 100°56′ W 331 (GP-PDS) 4a 1.8 by 6.1
Spooner, WI Omega loamy sand (sandy, mixed, frigid Typic Haplorthod) 45°49′ N 91°54′ W 212 (LMF) 3b 1.7 by 1.8
Rosemount, MN Waukegan silt loam (fi ne-silty over sandy-skeletal, mixed mesic
Typic Hapludoll)44°45′ N 93°08′ W 222 (EBFC) 4a 1.2 by 7.6
Marshfi eld, WI Withee silt loam (fine-loamy, mixed, superactive frigid Aquic
Glossudalf )44°39′ N 90°08′ W 212 (LMF) 4a 1.7 by 1.8
Arlington, WI Plano silt loam (fi ne-silty, mixed, mesic Typic Argiudoll) 43°20′ N 89°23′ W 222 (EBFC) 4b 1.7 by 1.8
Lancaster, WI Fayette silt loam (fi ne-silty, mixed, mesic Typic Hapludalf) 42°50′ N 90°47′ W 222 (EBFC) 4b 1.7 by 1.8
Ames, IA Nicollet loam (fi ne-loamy, mixed, mesic Aquic Hapludoll) 42°01′ N 93°42′ W 251 (PPT) 5a 1.7 by 3.7
DeKalb, IL Drummer silty clay loam (fi ne-silty, mixed, mesic Typic Endoaquoll) 41°53′ N 88°44′ W 251 (PPT) 5a 1.7 by 1.8
Mead, NE Sharpsburg silt loam (fi ne, smectitic, mesic Typic Argiudoll) 41°13′ N 96°29′ W 251 (PPT) 4b 1.2 by 4.6
Columbia, MO Mexico silt loam (fi ne, smectitic, mesic Vertic Epiaqualf) 38°57′ N 92°19′ W 251 (PPT) 5b 1.5 by 4.6
Stillwater, OK Kirkland silt loam (fi ne, mixed, thermic Udertic Paleustoll) or Teller loam
(fi ne-loamy, mixed, thermic Udic Argiustoll)36°07′ N 96°05′ W 251 (PPT) 6b 1.5 by 4.6
Fayetteville, AR Captina silt loam (fi ne, silty, siliceous, active, mesic Typic Fragiudult) 36°04′ N 94°11′ W 222 (EBFC) 6b 1.7 by 1.8
†Ecoregions defi ned by Bailey (1997, 1998): PPT, Prairie Parkland (Temperate); EBFC, Eastern Broadleaf Forest (Continental); GP-PPS, Great Plains-Palouse Dry Steppe;
LMF, Laurentian Mixed Forest.
‡Hardiness zones defi ned by Cathey (1990).

Repro
duced
from
Cro
pS
cie
nce.
Publis
hed
by
Cro
pS
cie
nce
Socie
tyof
Am
erica.
All
copyrights
reserv
ed.
CROP SCIENCE, VOL. 47, NOVEMBER–DECEMBER 2007 WWW.CROPS.ORG 2253
the six populations. There were distinct trends toward a greater eff ect measured at Prairie Parkland locations and at the more southern locations.
There was a strong positive eff ect of latitude of origin on dry matter concentration, but only when measured at the Eastern Forest locations and in hardiness zones 3 and 4 (Table 4). Heading date and dry matter concentra-tion were negatively correlated with each other at the six Eastern Forest locations (mean r = −0.72 ± 0.14), but this correlation was not signifi cant for the six Prairie Parkland locations (mean r = −0.42 ± 0.21). The linear eff ects of latitude of origin accounted for 62 to 82% of the varia-tion among the six populations at the most eastern and northern locations.
The Prairie Parkland populations produced 3.4 to 7.2% greater biomass yield for all six of the evaluation-location groups (Table 5). Each of these diff erences was signifi -cant, except for HZ3 (P = 0.09), but this was only due to the low precision associated with one location within this hardiness zone. These eff ects were highly uniform across the range of location groups and accounted for an average of 13% of the variation among the six populations.
Although most of the variation among populations in biomass yield could be attributed to hardiness zones
or latitude, it was generally nonlinear in nature, indicat-ing the presence of unknown factors that contributed to the variation in biomass yield. Despite this, there were some small linear eff ects of latitude (Table 5). Biomass yield decreased with increasing latitude of origin for both transects measured at the Prairie Parkland locations and in hardiness zone 5 (i.e., northern populations tended to have lesser biomass yields than southern populations). These linear eff ects accounted for 25 to 39% of the varia-tion among populations.
Populations originating in the Prairie Parkland were signifi cantly greater (P < 0.01) in ground cover than pop-ulations originating in the Eastern Forest for all six loca-tion groups (Table 6). This eff ect accounted for 17 to 56% of the variation among populations and was generally uni-form across location groups.
Ground cover increased signifi cantly (P < 0.01) as a function of latitude of origin for both transects measured in hardiness zone 3 and for the Prairie Parkland transect mea-sured in hardiness zone 4 (Fig. 2). Ground cover decreased signifi cantly (P < 0.01) as a function of latitude of origin for both transects measured in hardiness zone 5 and for the Eastern Forest transect measured in hardiness zone 6. The linear components of these transects accounted for 11
Table 3. Population × location analysis for heading date of six switchgrass populations evaluated at 12 locations, grouped by
ecoregions and hardiness zones.
Population, group, andsource of variation
Evaluation location group†
Prairie Parkland
Eastern Forest
Hardiness zone 3
Hardiness zone 4
Hardiness zone 5
Hardiness zone 6
Mean
—————————————————————————— Day of year (d) ——————————————————————————
Sunburst 204 198 202 207 204 178 201
Pathfi nder 212 203 207 215 206 187 208
Blackwell 213 203 207 215 206 190 208
WS-SB 206 197 200 208 205 180 202
WS-IP 202 197 198 206 205 174 199
Cave-in-Rock 209 202 204 212 208 183 206
Ecoregion means
Prairie Parkland 208** 201** 205** 211** 205 184** 204**
Eastern Forest 206 199 201 209 206 178 202
Hardiness zone transect slopes‡ ————————————————————————————— d degree-1 —————————————————————————————
Prairie Parkland −1.2** −0.8** −0.7** −1.1** −0.3** −1.8** −1.0**
Eastern Forest −0.5** −0.7** −0.7** −0.7** −0.4** −0.5** −0.6**
Source of variation —————————————————————————— Sum of squares (%)§ ——————————————————————————
Ecoregion 14 6 35 10 18 26 11
Prairie Parkland transect, linear 35 33 16 34 19 38 35
Prairie Parkland transect, nonlinear 22 15 11 23 15 11 19
Eastern Forest transect, linear 14 39 25 25 42 7 23
Eastern Forest transect, nonlinear 17 6 13 9 5 18 12
**Ecoregion means signifi cantly different from each other or slope signifi cantly different from zero at P < 0.01.
†Prairie Parkland (Columbia, Ames, DeKalb, Mandan, Mead, and Stillwater), Eastern Forest (Rosemount, Spooner, Marshfi eld, Lancaster, Arlington, and Fayetteville), Hardi-
ness zone 3 (Spooner), Hardiness zone 4 (Mandan, Rosemount, Marshfi eld, Lancaster, and Arlington), Hardiness zone 5 (Mead, Ames, Columbia, and DeKalb), Hardiness
zone 6 (Stillwater and Fayetteville), Mean (all 12 locations).
‡Linear regressions of population means on latitude of population origin.
§Each sum of squares has 1 df, so comparisons among SS within columns provide a direct measure of the amount of variance explained by each source of variation.

Repro
duced
from
Cro
pS
cie
nce.
Publis
hed
by
Cro
pS
cie
nce
Socie
tyof
Am
erica.
All
copyrights
reserv
ed.
2254 WWW.CROPS.ORG CROP SCIENCE, VOL. 47, NOVEMBER–DECEMBER 2007
to 31% of the variation among the six populations (Table 6). Ground cover of both transects was negatively related to latitude of origin at Prairie Parkland locations, but was positively related to latitude of origin at Eastern Forest loca-tions. Ground cover was uniformly correlated with biomass yield across all locations (mean r = 0.72 ± 0.08).
Six of 24 linear regressions for scaled population means on longitude of evaluation location were sig-nifi cant (P < 0.05; Fig. 3). Relative to the other popu-lations, Blackwell and Pathfi nder headed later at the more western locations, while Pathfi nder also had greater dry matter concentration at the more western locations. Blackwell and Pathfi nder are both Prairie Parkland populations (Table 1). Conversely, Cave-in-Rock and WS98-IP were earlier heading at the more western locations, relative to the other populations, while WS98-SB was lower in dry matter concentration at the more western locations. Cave-in-Rock, WS98-IP, and WS98-SB are the three Eastern Forest popula-tions (Table 1).
Blackwell, originating from hardiness zone 6 (Fig. 1), decreased in dry matter concentration and ground cover at the more northern locations relative to the
other populations (Fig. 4). Cave-in-Rock, also orig-inating from hardiness zone 6, decreased in ground cover at the more northern locations relative to the other populations. Conversely, WS98-IP, originating from hardiness zone 4 (Fig. 1), increased in ground cover at the more northern locations relative to the other populations.
DISCUSSIONThe lack of importance and statistical signifi cance of population × year interactions relative to population × location interactions was consistent with results from previous switchgrass experiments that spanned a wide geographic region (Sanderson and Wolf, 1995; Casler et al., 2004). For smaller geographic regions, population × year and population × location interactions tend to be of similar magnitude across a range of traits (Casler and Boe, 2003), particularly when there is considerable variation in weather conditions across years (Hopkins et al., 1995a, 1995b). The importance of population × location interactions across a wide geographic region implicates a number of environmental variables as fac-
Table 4. Population × location analysis for dry matter concentration of six switchgrass populations evaluated at 12 locations,
grouped by ecoregions and hardiness zones.
Population, group, and source of variation
Evaluation location group†
Prairie Parkland
Eastern Forest
Hardiness zone 3
Hardiness zone 4
Hardiness zone 5
Hardiness zone 6
Mean
————————————————————————————— g kg−1 —————————————————————————————
Sunburst 459 447 403 433 435 565 453
Pathfi nder 432 406 368 394 400 549 419
Blackwell 445 411 372 395 422 563 428
WS-SB 446 443 426 418 425 562 444
WS-IP 435 431 402 421 393 547 433
Cave-in-Rock 440 411 367 393 424 554 426
Ecoregion means
Prairie Parkland 452** 429** 388 414* 428** 564* 440**
Eastern Forest 438 421 385 407 409 550 429
Hardiness zone transect slopes‡ —————————————————————————— g kg−1 degree−1 ——————————————————————————
Prairie Parkland 1.3 4.8** 4.1* 5.2** 0.7 −0.5 3.0**
Eastern Forest 0.5 4.2** 7.6** 3.5** −0.9 0.7 2.3**
Source of variation ———————————————————————— Sum of squares (%)§ ————————————————————————
Ecoregion 42 6 0 5 32 51 19
Prairie Parkland transect, linear 6 30 14 36 1 0 21
Prairie Parkland transect, nonlinear 43 32 15 28 32 27 42
Eastern Forest transect, linear 1 32 68 27 3 2 16
Eastern Forest transect, nonlinear 7 1 2 3 33 20 3
*Ecoregion means signifi cantly different from each other or slope signifi cantly different from zero at P < 0.05.
**Ecoregion means signifi cantly different from each other or slope signifi cantly different from zero at P < 0.01.
†Prairie Parkland (Columbia, Ames, DeKalb, Mandan, Mead, and Stillwater), Eastern Forest (Rosemount, Spooner, Marshfi eld, Lancaster, Arlington, and Fayetteville), Hardi-
ness zone 3 (Spooner), Hardiness zone 4 (Mandan, Rosemount, Marshfi eld, Lancaster, and Arlington), Hardiness zone 5 (Mead, Ames, Columbia, and DeKalb), Hardiness
zone 6 (Stillwater and Fayetteville), Mean (all 12 locations).
‡Linear regressions of population means on latitude of population origin.
§Each sum of squares has 1 df, so comparisons among SS within columns provide a direct measure of the amount of variance explained by each source of variation.

Repro
duced
from
Cro
pS
cie
nce.
Publis
hed
by
Cro
pS
cie
nce
Socie
tyof
Am
erica.
All
copyrights
reserv
ed.
CROP SCIENCE, VOL. 47, NOVEMBER–DECEMBER 2007 WWW.CROPS.ORG 2255
tors controlling the relative performance, stability, and plasticity of switchgrass populations.
Latitude and Hardiness ZonesThe populations chosen for this study represented two latitudinal transects, one encompassing hardiness zones 4, 5, and 6 through the Prairie Parkland region (Bailey’s ecoregions 332, Great Plains Steppe, and 252, Prairie Parkland), and the other encompassing hardiness zones 3, 4, and 6 through the Eastern Forest region (Bailey’s ecoregions 221, Laurentian Mixed Forest, and 222, East-ern Broadleaf Forest Continental; Bailey, 1997, 1998). Both transects were characterized by signifi cant levels of phenotypic variability associated with linear responses to latitude of origin. These responses were simple and gener-ally uniform for heading date, dry matter concentration, and biomass yield, but were complex for ground cover, suggesting diff erential adaptation of populations.
Populations originating from southern latitudes were later in heading than populations originating from north-ern latitudes, a result that was consistent with previous studies (McMillan, 1959, 1965; Casler, 2005). Similarly, populations originating from southern latitudes tended
to have lower dry matter concentration at harvest than populations originating from northern latitudes, also con-sistent with previous observations (McMillan, 1965). The relationship between heading date and dry matter concen-tration was consistent for the Eastern Forest locations, but did not exist for the Prairie Parkland locations. Switch-grass populations from the Prairie Parkland ecoregion are more heterogeneous than other populations (McMil-lan and Weiler, 1959) and this region appears to be an important center of diversity for this species (McMillan, 1959). Reduced genetic variability or historical genetic bottlenecks (changes in the population due to reduced population size) in Eastern Forest populations may have resulted in a fi xed relationship between heading date and dry matter concentration. Larger populations and greater genetic diversity in the Prairie Parkland may support a greater diversity in physiological responses to environ-mental factors such as photoperiod and temperature, resulting in populations that may be later in heading, but not necessarily lower in dry matter concentration. The overall mean for dry matter concentration was highest at the Prairie Parkland locations and relatively little varia-tion was observed among populations (Table 4). Hot, dry,
Table 5. Population × location analysis for biomass yield of six switchgrass populations evaluated at 12 locations, grouped by
ecoregions and hardiness zones.
Population, group, andsource of variation
Evaluation location group†
Prairie Parkland
Eastern Forest
Hardiness zone 3
Hardiness zone 4
Hardiness zone 5
Hardiness zone 6
Mean
———————————————————————— Mg ha-1 ————————————————————————
Sunburst 7.30 10.21 10.44 8.72 6.93 10.75 8.75
Pathfi nder 7.32 9.32 9.52 8.44 7.05 9.25 8.32
Blackwell 8.37 9.84 10.00 8.89 8.55 10.13 9.11
WS-SB 8.20 10.50 10.82 9.17 8.26 10.78 9.35
WS-IP 6.26 9.34 9.62 7.72 5.94 9.94 7.80
Cave-in-Rock 8.36 10.04 9.67 8.95 8.91 10.14 9.20
Ecoregion means
Prairie Parkland 7.83** 10.03** 10.22 8.81** 7.74* 10.44* 8.93**
Eastern Forest 7.31 9.69 9.64 8.33 7.42 10.04 8.50
Hardiness zone transect slopes‡ ———————————————————————— Mg ha-1 degree-1 ————————————————————————
Prairie Parkland −0.20** 0.02 0.04 −0.05 −0.30** 0.04 −0.09**
Eastern Forest −0.08** 0.03 0.13 −0.01 −0.16** 0.07 −0.02*
Source of variation ———————————————————————— Sum of squares (%)§ ————————————————————————
Ecoregion 11 13 27 20 2 14 13
Prairie Parkland transect, linear 17 2 2 2 23 4 6
Prairie Parkland transect, nonlinear 2 30 20 5 2 61 10
Eastern Forest transect, linear 8 1 22 1 16 6 3
Eastern Forest transect, nonlinear 62 54 28 72 57 16 68
*Ecoregion means signifi cantly different from each other or slope signifi cantly different from zero at P < 0.05.
**Ecoregion means signifi cantly different from each other or slope signifi cantly different from zero at P < 0.01.
†Prairie Parkland (Columbia, Ames, DeKalb, Mandan, Mead, and Stillwater), Eastern Forest (Rosemount, Spooner, Marshfi eld, Lancaster, Arlington, and Fayetteville), Hardi-
ness zone 3 (Spooner), Hardiness zone 4 (Mandan, Rosemount, Marshfi eld, Lancaster, and Arlington), Hardiness zone 5 (Mead, Ames, Columbia, and DeKalb), Hardiness
zone 6 (Stillwater and Fayetteville), Mean (all 12 locations).
‡Linear regressions of population means on latitude of population origin.
§Each sum of squares has 1 df, so comparisons among SS within columns provide a direct measure of the amount of variance explained by each source of variation.

Repro
duced
from
Cro
pS
cie
nce.
Publis
hed
by
Cro
pS
cie
nce
Socie
tyof
Am
erica.
All
copyrights
reserv
ed.
2256 WWW.CROPS.ORG CROP SCIENCE, VOL. 47, NOVEMBER–DECEMBER 2007
windy weather during late summer or early autumn may have conditioned this response.
Populations originating from southern latitudes tended to have greater biomass yields than populations originating from northern latitudes. Although this eff ect was not observed uniformly across all evaluation loca-tions, it was observed for both the Eastern Forest and the Prairie Parkland population transects and it is similar to results from two previous studies (Sanderson et al., 1999; Casler et al., 2004). In the Southern Great Plains of the USA, biomass yield is largely a function of plant height (Redfearn et al., 1997; Casler et al., 2004). The longer growing season favors plants with later heading dates and an ability to retain photosynthetically active leaf area lon-ger through the growing season (as indicated by lower dry matter concentration), resulting in more phytomers (more leaves) and taller plants compared to northern genotypes (McMillan, 1964; 1965; Casler et al., 2004; Boe and Casler, 2005). Northern populations grown at southern latitudes tend to fl ower early and mature more rapidly, reducing their ability to take advantage of the longer growing season. Conversely, southern populations grown at northern latitudes remain vegetative for a lon-
ger period of time, fl owering later and allowing them to take advantage of longer days and produce higher biomass yields (Newell, 1968a). The linear decline in dry matter concentration of Blackwell (origin in hardiness zone 6) with increasing latitude, relative to the other populations, was consistent with these observations.
McMillan (1959) hypothesized that three gene pools, or primary gene distribution centers, were responsible for repopulation of the tall-grass prairies after the retreat of the Pleiostocene glaciers. A western montane popu-lation, originating at southern latitudes, but higher alti-tudes would have rapidly migrated north, fi lling the northern ecological zones with early-heading plants capable of sexual reproduction under long-day condi-tions in a short growing season. A southern population, originating in Texas and Oklahoma, would have pos-sessed considerable genetic variability for photoperiod response, rapidly migrating north throughout the Great Plains and evolving a range of photoperiod and tem-perature responses as it migrated to higher latitudes and colder climates. A southeastern population would have been responsible for fi lling ecological niches within the various Eastern Forest ecosystems. Hybridization
Table 6. Population × location analysis for ground cover of six switchgrass populations evaluated at 11 locations, grouped by
ecoregions and hardiness zones.
Population, group, and source of variation
Evaluation location group†
Prairie Parkland
Eastern Forest
Hardiness zone 3
Hardiness zone 4
Hardiness zone 5
Hardiness zone 6
Mean
—————————————————————————————— % ——————————————————————————————
Sunburst 85 91 84 94 74 95 88
Pathfi nder 84 77 44 89 74 91 81
Blackwell 93 83 65 91 89 97 88
WS-SB 85 89 85 91 80 83 87
WS-IP 73 83 63 88 63 74 77
Cave-in-Rock 88 84 61 91 82 92 86
Ecoregion means
Prairie Parkland 89** 87** 74** 93** 81** 96** 88**
Eastern Forest 80 83 62 89 73 83 82
Hardiness zone transect slopes‡ ——————————————————————————— % degree−1 ———————————————————————————
Prairie Parkland −0.3** 0.8** 1.5** 0.4** −2.7** −0.5 −0.4*
Eastern Forest −0.4** 0.6** 2.7** 0.0 −0.8** −1.6** −0.1*
Source of variation ———————————————————————— Sum of squares (%)§ ————————————————————————
Ecoregion 39 16 17 41 24 56 41
Prairie Parkland transect, linear 13 12 5 11 25 1 1
Prairie Parkland transect, nonlinear 3 55 52 27 4 4 22
Eastern Forest transect, linear 9 6 14 0 6 21 1
Eastern Forest transect, nonlinear 36 10 12 20 40 18 35
*Ecoregion means signifi cantly different from each other or slope signifi cantly different from zero at P < 0.05.
**Ecoregion means signifi cantly different from each other or slope signifi cantly different from zero at P < 0.01.
†Prairie Parkland (Columbia, Ames, DeKalb, Mandan, Mead, and Stillwater), Eastern Forest (Rosemount, Spooner, Marshfi eld, Lancaster, Arlington, and Fayetteville), Hardi-
ness zone 3 (Spooner), Hardiness zone 4 (Mandan, Rosemount, Marshfi eld, Lancaster, and Arlington), Hardiness zone 5 (Mead, Ames, Columbia, and DeKalb), Hardiness
zone 6 (Stillwater and Fayetteville), Mean (all 12 locations).
‡Linear regressions of population means on latitude of population origin.
§Each sum of squares has 1 df, so comparisons among SS within columns provide a direct measure of the amount of variance explained by each source of variation.

Repro
duced
from
Cro
pS
cie
nce.
Publis
hed
by
Cro
pS
cie
nce
Socie
tyof
Am
erica.
All
copyrights
reserv
ed.
CROP SCIENCE, VOL. 47, NOVEMBER–DECEMBER 2007 WWW.CROPS.ORG 2257
and mixing along contact lines would have occurred frequently and may be partly responsible for much of the genetic variability observed in both chromosome number and morphological traits within many prairie-remnant switchgrass populations. McMillan’s theory suffi ciently explains the existence of latitudinal vari-ability for relatively simple traits such as heading date, dry matter concentration, and biomass yield, that are largely photoperiodic and consistent along latitudinal transects through two distinct ecoregions, the Prairie Parkland and the Eastern Forest.
This was not the case for ground cover. Both latitudi-nal transects showed distinct adaptive responses for ground cover, suggesting that natural selection is an important factor regulating survival of switchgrass plants and popu-lations. Populations originating from northern latitudes were higher in ground cover, measured in hardiness zones 3 and 4, compared to populations originating from south-ern latitudes. Similarly, WS98-IP, originating in hardi-ness zone 4, increased linearly in ground cover relative to the other populations as latitude of evaluation location increased. Blackwell and Cave-in-Rock, originating in hardiness zone 6, both decreased linearly in ground cover relative to the other populations as latitude of evaluation location increased, consistent with results of Berdahl et al. (2005). Conversely, populations originat-ing from northern latitudes were lower in ground cover, measured in hardiness zones 5 and 6, compared to populations originating from southern latitudes.
A previous study, based on 5 of the 12 locations utilized in the current study, demonstrated southern adaptation of low-land populations vs. northern adaptation of upland populations, and that northern- and southern-adapted populations can be dis-tinguished within both lowland and upland cytotypes (Casler et al., 2004). The results of this previous study were confi rmed by the current study for upland populations of switchgrass, confi rming that prairie-rem-nant populations from hardiness zones 5 and 6 are better adapted to more southern latitudes, while populations from hardiness zones 3 and 4 are better adapted to more northern latitudes, as measured by ground cover 40 mo after planting. Natural selec-tion for survivorship within switchgrass populations is most likely controlled largely by photoperiod and perhaps disease resis-tance at southern locations, favoring plants that can respond to shorter days with later heading, delayed moisture loss, and an extended photosynthetically active period.
Figure 3. Mean heading date or dry matter concentration of individual populations at 12
evaluation locations, regressed on location longitude. Population means were scaled
by subtraction of the location mean to eliminate the main effect of evaluation locations.
All displayed regressions were signifi cant at P < 0.05; the remaining 18 regressions
were not signifi cant (out of 24 total regressions for six populations × four variables).
Figure 2. Ground cover, approximately 40 mo after establishment,
of six switchgrass populations that form two north–south transects,
one through the historical Prairie Parkland ecoregion and one
through the historical Eastern Forest ecoregion of the USA. Origins
and transects of the six populations are shown in Fig. 1 and Table 1.
Linear regression coeffi cients are shown in Table 6.

Repro
duced
from
Cro
pS
cie
nce.
Publis
hed
by
Cro
pS
cie
nce
Socie
tyof
Am
erica.
All
copyrights
reserv
ed.
2258 WWW.CROPS.ORG CROP SCIENCE, VOL. 47, NOVEMBER–DECEMBER 2007
It is likely that southern populations also have greater heat tolerance than northern populations. At northern locations, natural selection for survivorship is likely controlled by cold or freezing tolerance. Most switchgrass mortality occurs dur-ing winter months (Casler et al., 2002; unreported data from the current study).
Longitude and EcoregionsThis is the fi rst study of switchgrass populations specifi cally designed to test populations for diff erential adaptation to longitude or ecoregions as defi ned by Bailey (1998). Other studies have evaluated switchgrass populations across a more limited longitudinal gradient of evaluation locations and found strong (Hopkins et al., 1995a) or weak (Hop-kins et al., 1995b) population × location interactions. In the current study, all four variables were characterized by relatively simple plastic responses, indicating that longi-tude or ecoregion is not a major factor in regulating adap-tive responses of switchgrass.
Prairie Parkland populations were consistently later head-ing than Eastern Forest populations, a result that is inconsis-tent with observations made by McMillan (1959), perhaps owing to diff erent germplasm samples. However, four of the six populations had signifi cant linear responses to longitude of the 12 evaluation locations. Two Eastern Forest popula-tions became earlier in heading, relative to the other popula-tions, as they were moved west, while two Prairie Parkland populations became later in heading as they were moved west. These responses resulted in a wide range of heading dates at Prairie Parkland locations, compared to eastern loca-tions. Responses for dry matter concentration were similar
in nature to those for heading date, but not as uniform, frequent, or extreme. For both of these traits, it is not possible to diff erenti-ate whether these responses resulted from Prairie Parkland populations adapting to the eastern environments, Eastern Forest populations adapting to the western envi-ronments, or a combination of the two. Nevertheless, the plasticity of these two traits indicated a clear lack of stability across ecoregions.
Prairie Parkland populations had greater biomass yield and ground cover regardless of the evaluation locations. In contrast, a previous study, which included fi ve Prairie Parkland cultivars and one Eastern Forest cultivar (Cave-in-Rock), demonstrated a population × location interaction that could be consi-dered adaptive in nature (Casler and Boe, 2003). Cave-in-Rock ranked highest in biomass yield and ground cover in south-ern Wisconsin, but fi fth in biomass yield
and sixth in ground cover in eastern South Dakota. Furthermore, the correlation between the two locations was r = 0.67 for biomass yield of all six populations, a value that increased to r = 0.97 when Cave-in-Rock was removed from the data set. Cave-in-Rock consistently ranks highest in biomass yield relative to cultivars from the Prairie Parkland ecoregion when evaluated in eastern Canada (Madakadze et al., 1998, 1999).
However, the majority of literature supports a lack of adaptive responses associated with longitude or ecoregion. Numerous soil and edaphic factors that diff er between the Prairie Parkland and Eastern Forest ecoregions have been investigated as environmental factors that might explain population × location interactions of switchgrass. Soil tex-ture, soil pH, soil cation exchange capacity, soil N avail-ability, populations of arbuscular mycorrhizal fungi, and precipitation or moisture availability during the growing season were all important factors discriminating among locations in one or more switchgrass studies (Nixon and McMillan, 1964; Hopkins and Taliaferro, 1997; Brejda et al., 1998; Cassida et al., 2005; Lee and Boe, 2005). In each case there was no evidence for genotype × environment interaction or interactions could not be described by any of the soil or edaphic factors discriminating the diff er-ent environmental conditions. Because there is genetic variation for transpiration effi ciency in switchgrass (Byrd and May, 2000), there may also be genetic variation for drought tolerance, which would likely have an impact on population × location interactions of fi eld studies over a larger geographic area, such as westward into the rain shadow of the Rocky Mountains.
Figure 4. Mean dry matter concentration or ground cover of individual populations at 12
evaluation locations, regressed on location latitude. Population means were scaled by
subtraction of the location mean to eliminate the main effect of evaluation locations. All
displayed regressions were signifi cant at P < 0.05; the remaining 20 regressions were
not signifi cant (out of 24 total regressions for six populations × four variables).

Repro
duced
from
Cro
pS
cie
nce.
Publis
hed
by
Cro
pS
cie
nce
Socie
tyof
Am
erica.
All
copyrights
reserv
ed.
CROP SCIENCE, VOL. 47, NOVEMBER–DECEMBER 2007 WWW.CROPS.ORG 2259
The lack of diff erential adaptation of eastern- vs. west-ern-origin switchgrass populations suggests that McMil-lan’s theory of three gene pools or centers of deployment following retreat of the Pleistocene glaciers must have been followed by extensive homogenization among the three gene pools (McMillan, 1959, 1964). The principal forces promoting homogenization would be hybridization at population boundaries and gene migration, the latter occurring by wind-borne pollen transport or seed trans-port by birds, mammals, and humans. The forces promot-ing homogenization appear to be considerably stronger than any forces promoting adaptive responses to longitude or ecoregions.
Synthesis: Regional Gene PoolsSwitchgrass breeding programs and the seed industry have combined to create a seed marketing and distribution sys-tem that encourages and facilitates movement of switch-grass seeds across large regional areas. Due to low profi t margins, the seed industry favors high-volume cultivars, which are more likely to result from germplasm that is broadly adapted across multiple ecological zones. Further-more, there are very few cultivars developed from germ-plasm that originates east of the Mississippi River, leading to a heavy reliance on a small number of eastern cultivars and a broad distribution of cultivars from the Great Plains (historical Prairie Parkland ecoregion).
Our research has validated the Plant Adaptation Region proposal of Vogel et al. (2005) as fully compatible with empirical agronomic, adaptation, and stability of switchgrass populations. Plant Adaptation Regions, combining hardiness zones (Cathey, 1990) with ecoregions (Bailey, 1997, 1998), are the functional units that defi ne adaptation of switchgrass populations, incorporating photoperiod, average minimum temperature, historic vegetation, and regional soil type into an eff ective germplasm classifi cation system for both culti-vated and natural germplasm.
Some populations are broadly adapted beyond their Plant Adaptation Region of origin, such as Cave-in-Rock, which is adapted to hardiness zones 5, 6, and 7 throughout ecoregion Province 251 and east through most ecoregions to the Atlantic Ocean (Madakadze et al., 1998, 1999; Vogel, 2004). This broad adaptation indicates that cultivars such as Cave-in-Rock have a genetic composition that provides for a robust responsiveness to environmental variables, a valuable characteristic for use in both livestock and feedstock produc-tion systems. Germplasm with broad adaptation potential also will be very valuable for long-term conservation plant-ings if predicted climatic changes occur.
As fossil fuel reserves become more depleted and their eff ects on Earth’s atmosphere become more promi-nent, the need for renewable and cleaner energy sources increases. Switchgrass will be an essential component of a new paradigm in sustainable energy production systems in
North America. In the USA alone, 16 million ha of pro-ductive farmland is set aside every year for conservation purposes (Perlack et al., 2005). This land, combined with many more hectares of marginal cropland, could support bioenergy production from switchgrass, providing many additional socioeconomic benefi ts derived from perma-nent grassland (Paine et al., 1996; Vogel, 1996, 2004). Our research indicates that a comprehensive program of devel-oping switchgrass cultivars for use in bioenergy produc-tion will require some level of regional breeding in North America (Sanderson et al., 2006). Eff orts should continue to focus on large-scale regional testing of new candidate cultivars as the only means of identifying broadly adapted cultivars such as Cave-in-Rock and the limits to their adaptation range. Breeding eff orts should continue to focus on regional gene pools, defi ned by hardiness zones, gathering germplasm from throughout the region, con-ducting selection in representative environments, and developing large networks of collaborators to support fi eld trials throughout the target hardiness zones.
AcknowledgmentsThis research was funded in part by the U.S. Department of Energy
Biomass Feedstock Development Program via the Oak Ridge
National Lab. Contract No. DE-A105-900R2194. We thank the
following individuals for their valuable assistance and support of
this research: Lyle Paul, Northern Illinois Agronomy Research
Center; Tim Wood, Lancaster Agricultural Research Station;
Mike Bertram, Marshfi eld Agricultural Research Station; Phil
Holman, Spooner Agricultural Research Station; Donn Vellekson,
Department of Agronomy and Plant Genetics, University of
Minnesota; Danny England, Division of Plant Sciences, University
of Missouri; Steve Masterson, USDA-ARS, Lincoln, NE; Mike
Barker, Department of Agronomy, Iowa State University; Gary
Williams, Plant and Soil Sciences Department, Oklahoma State
University; and Gordon Jensen, USDA-ARS, Mandan, ND. We
thank Marty Schmer, USDA-ARS and University of Nebraska,
for valuable assistance in creating Fig. 1.
ReferencesAssociation of Offi cial Seed Analysts. 1998. Rules for seed testing.
AOSA, Beltsville, MD.
Bailey, R.G. 1997. Ecoregions of North America (rev). Available at
http://www.fs.fed.us/colorimagemap/ecoreg1_provinces (veri-
fi ed 18 June 2007). U.S. Forest Service, Washington, DC.
Bailey, R.G. 1998. Ecoregions: The ecosystem geography of the
oceans and continents. Springer-Verlag, New York.
Berdahl, J.D., A.B. Frank, J.M. Krupinsky, P.M. Carr, J.D. Han-
son, and H.A. Johnson. 2005. Biomass yield, phenology, and
survival of diverse switchgrass cultivars and experimental
strains in western North Dakota. Agron. J. 97:549–555.
Boe, A., and M.D. Casler. 2005. Hierarchical analysis of switch-
grass morphology. Crop Sci. 45:2465–2472.
Boe, A., and J.G. Ross. 1998. Registration of ‘Sunburst’ switch-
grass. Crop Sci. 38:540.
Brejda, J.J., L.E. Moser, and K.P. Vogel. 1998. Evaluation of
switchgrass rhizosphere microfl ora for enhancing seedling
yield and nutrient uptake. Agron. J. 90:753–758.

Repro
duced
from
Cro
pS
cie
nce.
Publis
hed
by
Cro
pS
cie
nce
Socie
tyof
Am
erica.
All
copyrights
reserv
ed.
2260 WWW.CROPS.ORG CROP SCIENCE, VOL. 47, NOVEMBER–DECEMBER 2007
Byrd, G.T., and P.A. May, II. 2000. Physiological comparisons
of switchgrass cultivars diff ering in transpiration effi ciency.
Crop Sci. 40:1271–1277.
Carmer, S.G., and R.D. Seif. 1963. Calculation of orthogonal
coeffi cients when treatments are unequally replicated and/or
unequally spaced. Agron. J. 55:387–389.
Casler, M.D. 1999. Spatial variation aff ects precision of perennial
cool-season forage grass trials. Agron. J. 91:75–81.
Casler, M.D. 2005. Ecotypic variation among switchgrass popula-
tions from the northern USA. Crop Sci. 45:388–398.
Casler, M.D., and A.R. Boe. 2003. Cultivar × environment inter-
actions in switchgrass. Crop Sci. 43:2226–2233.
Casler, M.D., D.R. Buxton, and K.P. Vogel. 2002. Genetic modi-
fi cation of lignin concentration aff ects fi tness of perennial
herbaceous plants. Theor. Appl. Genet. 104:127–131.
Casler, M.D., K.P. Vogel, C.M. Taliferro, and R.L. Wynia. 2004.
Latitudinal adaptation of switchgrass populations. Crop Sci.
44:293–303.
Cassida, K.A., J.P. Muir, M.A. Mussey, J.C. Read, B.C. Venuto,
and W.A. Ocumpaugh. 2005. Biomass yield and stand char-
acteristics of switchgrass in south central U.S. environments.
Crop Sci. 45:673–681.
Cathey, H.M. 1990. USDA plant hardiness zone map. USDA
Misc. Publ. No. 1475. Available at http://www.usna.usda.
gov/Hardzone/ushzmap.html (verifi ed 18 June 2007). U.S.
National Arboretum, USDA-ARS, Washington, DC.
Hopkins, A.A., and C.M. Taliaferro. 1997. Genetic variation
within switchgrass populations for acid soil tolerance. Crop
Sci. 37:1719–1722.
Hopkins, A.A., K.P. Vogel, K.J. Moore, K.D. Johnson, and I.T.
Carlson. 1995a. Genotype eff ects and genotype by environ-
ment interactions for traits of elite switchgrass populations.
Crop Sci. 35:125–132.
Hopkins, A.A., K.P. Vogel, K.J. Moore, K.D. Johnson, and I.T.
Carlson. 1995b. Genotypic variability and genotype × envi-
ronment interactions among switchgrass accessions from the
midwestern USA. Crop Sci. 35:565–571.
Hultquist, S.J., K.P. Vogel, D.J. Lee, K. Arumuganathan, and S.M.
Kaeppler. 1996. Chloroplast DNA and nuclear DNA content
variations among cultivars of switchgrass, Panicum virgatum L.
Crop Sci. 36:1049–1052.
Lee, D.K., and A. Boe. 2005. Biomass production of switchgrass in
central South Dakota. Crop Sci. 45:2583–2590.
Madakadze, I.C., B.E. Coulman, K.A. Stewart, P.R. Peterson, R.
Samson, and D.L. Smith. 1998. Phenology and tiller charac-
teristics of big bluestem and switchgrass cultivars in a short
growing season area. Crop Sci. 38:827–834.
Madakadze, I.C., K.A. Stewart, P.R. Peterson, B.E. Coulman, and
D.L. Smith. 1999. Switchgrass biomass and chemical compo-
sition for biofuel in eastern Canada. Agron. J. 91:696–701.
McMillan, C. 1959. The role of ecotypic variation in the distribu-
tion of the central grassland of North America. Ecol. Monogr.
29:285–308.
McMillan, C. 1964. Ecotypic diff erentiation within four North
American prairie grasses. I. Morphological variation within
transplanted community fractions. Am. J. Bot. 51:1119–1128.
McMillan, C. 1965. Ecotypic diff erences with four North Ameri-
can prairie grasses: II. Behavioral variation with transplanted
community fractions. Am. J. Bot. 52:55–65.
McMillan, C., and J. Weiler. 1959. Cytogeography of Panicum vir-
gatum in central North America. Am. J. Bot. 46:590–593.
Moore, K.J., L.E. Moser, K.P. Vogel, S.S. Waller, B.E. Johnson,
and J.F. Pedersen. 1991. Describing and quantifying growth
stages of perennial forage grasses. Agron. J. 83:1073–1077.
Newell, L.C. 1968a. Eff ects of strain source and management prac-
tice on forage yields of two warm-season prairie grasses. Crop
Sci. 8:205–210.
Newell, L.C. 1968b. Registration of Pathfi nder switchgrass. Crop
Sci. 8:516.
Nixon, E.S., and C. McMillan. 1964. The role of soil in the distribu-
tion of four grass species in Texas. Am. Midl. Nat. 71:114–140.
Paine, L.K., T.L. Peterson, D.J. Undersander, K.C. Rineer, G.A.
Bartelt, S.A. Temple, D.W. Sample, and R.M. Klemme. 1996.
Some ecological and socio-economic considerations for bio-
mass energy crop production. Biomass Bioenergy 10:231–242.
Perlack, R.D., L.L. Wright, A.F. Turhollow, R.L. Graham, B.J.
Stokes, and D.C. Erbach. 2005. Biomass as feedstock for a
bioenergy and bioproducts industry: The technical feasibility
of a billion-ton annual supply. Available at http://feedstock-
review.ornl.gov/pdf/billion_ton_vision.pdf (verifi ed 18 June
2007). USDOE and USDA, Oak Ridge, TN.
Redfearn, D.D., K.J. Moore, K.P. Vogel, S.S. Waller, and R.B.
Mitchell. 1997. Canopy architecture and morphology of
switchgrass populations diff ering in forage yield. Agron. J.
89:262–269.
Sanderson, M.A., P.R. Adler, A. Boateng, M.D. Casler, and G.
Sarath. 2006. Switchgrass for biomass feedstock in the USA.
Can. J. Plant Sci. 86:1315–1325.
Sanderson, M.A., R.L. Reed, S.B. McLaughlin, S.D. Wullschleger,
B.V. Conger, D.J. Parrish, D.D. Wolf, C.M. Taliaferro, A.A.
Hopkins, W.R. Ocumpaugh, M.A. Hussey, J.C. Read, and
C.R. Tischler. 1996. Switchgrass as a sustainable bioenergy
crop. Bioresour. Technol. 56:83–93.
Sanderson, M.A., R.L. Reed, W.L. Ocumpaugh, M.A. Hussey,
G. Van Esbroeck, J.C. Read, C.R. Tischler, and F.M. Hons.
1999. Switchgrass cultivars and germplasm for biomass feed-
stock production in Texas. Bioresour. Technol. 67:209–219.
Sanderson, M.A., and D.D. Wolf. 1995. Morphological devel-
opment of switchgrass in diverse environments. Agron. J.
87:908–915.
Smith, K.F., and M.D. Casler. 2004. The use of spatially adjusted
herbage yields during the analysis of perennial forage grass
trials across locations. Crop Sci. 44:56–62.
Steel, R.G.D., J.H. Torrie, and D.A. Dickey. 1996. Principles
and procedures of statistics: A biometrical approach. 3rd ed.
McGraw-Hill, New York.
Vogel, K.P. 1996. Energy production from forages (or Ameri-
can agriculture—Back to the future). J. Soil Water Conserv.
51:137–139.
Vogel, K.P. 2004. Switchgrass. p. 561–588. In L.E. Moser, B.L.
Burson, and L.E. Sollenberger (ed.) Warm-season (C4) grasses.
ASA, CSSA, and SSSA, Madison, WI.
Vogel, K.P., and R.A. Masters. 2001. Frequency grid: A simple
tool for measuring grassland establishment. J. Range Manage.
54:653–655.
Vogel, K.P., M.R. Schmer, and R.B. Mitchell. 2005. Plant adap-
tation regions: Ecological and climatic classifi cation of plant
materials. Range Ecol. Manage. 58:315–319.