lateral transport of soil carbon and land atmosphere co2 ... · lateral transport of soil carbon...
TRANSCRIPT
Lateral transport of soil carbon and land−atmosphereCO2 flux induced by water erosion in ChinaYao Yuea,b, Jinren Nia,1, Philippe Ciaisc, Shilong Piaod,e,f, Tao Wange,f, Mengtian Huangd, Alistair G. L. Borthwickg,Tianhong Lia, Yichu Wanga, Adrian Chappellh, and Kristof Van Oosti
aThe Key Laboratory of Water and Sediment Sciences, Ministry of Education, College of Environmental Sciences and Engineering, Peking University, Beijing100871, People’s Republic of China; bSchool of Water Resources and Hydropower Engineering, Wuhan University, Wuhan 430072, People’s Republic ofChina; cLaboratoire des Sciences du Climat et de l’Environnement, Institut Pierre Simon Laplace, Commissariat à l’Énergie Atomique et aux ÈnergiesAlternatives, CNRS, Université de Versailles Saint-Quentin-en-Yvelines, 91191 Gif-sur-Yvette, France; dDepartment of Ecology, Peking University, Beijing100871, People’s Republic of China; eKey Laboratory of Alpine Ecology and Biodiversity, Institute of Tibetan Plateau Research, Chinese Academy of Sciences,Beijing 100101, People’s Republic of China; fCAS Center for Excellence in Tibetan Plateau Earth Sciences, Chinese Academy of Sciences, Beijing 100101,People’s Republic of China; gSchool of Engineering, The University of Edinburgh, Edinburgh EH9 3JL, United Kingdom; hLand & Water, CommonwealthScientific and Industrial Research Organisation, Canberra, ACT 2601, Australia; and iEarth and Life Institute, Georges Lemaître Centre for Earth and ClimateResearch, Université Catholique de Louvain, B-1348 Louvain, Belgium
Edited by Donald E. Canfield, Institute of Biology and Nordic Center for Earth Evolution, University of Southern Denmark, Odense, Denmark, and approvedApril 28, 2016 (received for review November 25, 2015)
Soil erosion by water impacts soil organic carbon stocks and altersCO2 fluxes exchanged with the atmosphere. The role of erosion as anet sink or source of atmospheric CO2 remains highly debated, andlittle information is available at scales larger than small catchmentsor regions. This study attempts to quantify the lateral transport ofsoil carbon and consequent land−atmosphere CO2 fluxes at the scaleof China, where severe erosion has occurred for several decades.Based on the distribution of soil erosion rates derived from detailednational surveys and soil carbon inventories, here we show thatwater erosion in China displaced 180 ± 80 Mt C·y−1 of soil organiccarbon during the last two decades, and this resulted a net land sinkfor atmospheric CO2 of 45± 25 Mt C·y−1, equivalent to 8–37% of theterrestrial carbon sink previously assessed in China. Interestingly, the“hotspots,” largely distributed in mountainous regions in the mostintensive sink areas (>40 g C·m−2·y−1), occupy only 1.5% of the totalarea suffering water erosion, but contribute 19.3% to the nationalerosion-induced CO2 sink. The erosion-induced CO2 sink underwent aremarkable reduction of about 16% from the middle 1990s to theearly 2010s, due to diminishing erosion after the implementation oflarge-scale soil conservation programs. These findings demonstratethe necessity of including erosion-induced CO2 in the terrestrial bud-get, hence reducing the level of uncertainty.
land−atmosphere CO2 flux | soil carbon displacement | water erosion |national scale
Terrestrial ecosystems are a net sink of anthropogenic CO2globally (1, 2) but can be net sources or sinks regionally [e.g.,
Northeast Region of China (3)]. Knowledge of the distribution,magnitude, and variability of land carbon fluxes and underlyingprocesses is important both for improving model-based projec-tions of the carbon cycle and for designing ecosystem manage-ment options that effectively preserve carbon stocks and enhancecarbon sinks. Despite considerable efforts made by the researchcommunity, the mechanisms governing uptake or release of car-bon from land ecosystems are still poorly quantified (4).Soil erosion occurs naturally but is accelerated by human culti-
vation of the landscape, and modifies CO2 exchange (5) between thesoil and atmosphere. Soil erosion destroys the physical protection ofcarbon in soil aggregates and accelerates decomposition, inducing anet CO2 source. Continuous erosion over a long period can de-stabilize carbon in deeper soil horizons and trigger its decompositione.g., as conditions of temperature and moisture become more fa-vorable (6, 7). Soil erosion also decreases nutrient availability andreduces soil water holding capacity, affecting ecosystem productivity(8) with feedback to the ecosystem carbon balance. However, be-cause only a fraction of eroded carbon is lost to the atmosphere, therest may be lost to streams and rivers and eventually delivered tomarine ecosystems or deposited in the landscape. With the fine and
light soil particles preferentially delivered and associated with localminerals, carbon becomes more stable in the depositional area.Moreover, susceptibility and activation energy of organic matteralso alter due to changes in the pH and redox conditions of thedepositional environment, especially after a flood event. Hence,the decomposition rate is slower for microbial decomposition inthe original soil profile, and carbon can be stored in depositionareas (9, 10). Finally, if productivity does not collapse due to soilfertility loss, carbon lost through soil erosion dynamic replacementmay get replenished by litterfall, which creates a compensatorysink of atmospheric CO2 (11, 12). This sink is called hereafterthe dynamic replacement. To assess the net land−atmosphereCO2 flux resulting from erosion, the sum of these sources andsinks must be quantified separately using a consistent framework.Limited data from field measurements and model outputs for
small watersheds (0.1–800 km2) have suggested that the overall resultof these water erosion processes is a net CO2 sink (11, 13–16), withrate in the range 3–60 g C·m−2·y−1. These estimates were based on asmall set of watersheds that were not necessarily representative of allof the regions impacted by erosion. The balance between de-composition and deposition can be inferred from measurements(usually 137Cs and C in soil profiles of representative landscape ele-ments) at the scale of small watersheds (11), but estimates over largerregions must be drawn from mechanistic models and field surveys.
Significance
The role of soil erosion as a net sink or source of atmospheric CO2
remains highly debated. This work quantifies national-scaleland−atmosphere CO2 fluxes induced by soil erosion. Severewater erosion in China has caused displacement of 180 ± 80 MtC·y-1 of soil organic carbon during the last two decades, and theconsequent land−atmosphere CO2 flux from water erosion is anet CO2 sink of 45 ± 25 Mt C·y-1, equivalent to 8–37% of theterrestrial carbon sink previously assessed in China. This closes animportant gap concerning large-scale estimation of lateral andvertical CO2 fluxes from water erosion and highlights the im-portance of reducing uncertainty in assessing terrestrialcarbon balance.
Author contributions: J.N., P.C., S.P., and K.V.O. designed research; Y.Y. and J.N. performedresearch; J.N., P.C., and S.P. contributed new reagents/analytic tools; Y.Y., T.W., M.H., T.L.,and Y.W. analyzed data; and Y.Y., J.N., P.C., S.P., A.G.L.B., Y.W., and A.C. wrote the paper.
The authors declare no conflict of interest.
This article is a PNAS Direct Submission.
Freely available online through the PNAS open access option.1To whom correspondence should be addressed. Email: [email protected].
This article contains supporting information online at www.pnas.org/lookup/suppl/doi:10.1073/pnas.1523358113/-/DCSupplemental.
www.pnas.org/cgi/doi/10.1073/pnas.1523358113 PNAS Early Edition | 1 of 6
EART
H,A
TMOSP
HER
IC,
ANDPL
ANET
ARY
SCIENCE
S
Dow
nloa
ded
by g
uest
on
Dec
embe
r 25
, 201
9
The carbon balance of soils in China is impacted by soilerosion in many regions (17, 18). The aim here is to quantifythe horizontal carbon transport induced by water erosion andconsequent land−atmosphere CO2 fluxes in China during thelast ∼20 y. The case of China is an interesting “natural experi-ment” because of severe erosion in the 1980s, which was reducedsubstantially after implementation of national large-scale soilconservation programs in the 1990s (19).
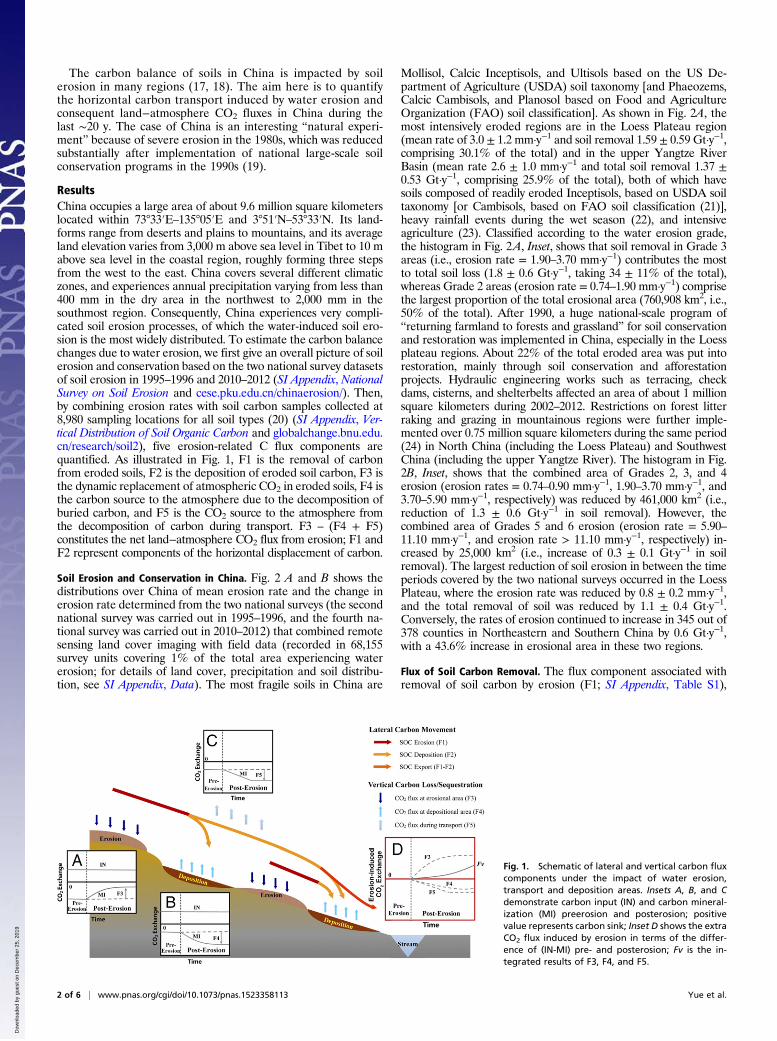
ResultsChina occupies a large area of about 9.6 million square kilometerslocated within 73°33′E–135°05′E and 3°51′N–53°33′N. Its land-forms range from deserts and plains to mountains, and its averageland elevation varies from 3,000 m above sea level in Tibet to 10 mabove sea level in the coastal region, roughly forming three stepsfrom the west to the east. China covers several different climaticzones, and experiences annual precipitation varying from less than400 mm in the dry area in the northwest to 2,000 mm in thesouthmost region. Consequently, China experiences very compli-cated soil erosion processes, of which the water-induced soil ero-sion is the most widely distributed. To estimate the carbon balancechanges due to water erosion, we first give an overall picture of soilerosion and conservation based on the two national survey datasetsof soil erosion in 1995–1996 and 2010–2012 (SI Appendix, NationalSurvey on Soil Erosion and cese.pku.edu.cn/chinaerosion/). Then,by combining erosion rates with soil carbon samples collected at8,980 sampling locations for all soil types (20) (SI Appendix, Ver-tical Distribution of Soil Organic Carbon and globalchange.bnu.edu.cn/research/soil2), five erosion-related C flux components arequantified. As illustrated in Fig. 1, F1 is the removal of carbonfrom eroded soils, F2 is the deposition of eroded soil carbon, F3 isthe dynamic replacement of atmospheric CO2 in eroded soils, F4 isthe carbon source to the atmosphere due to the decomposition ofburied carbon, and F5 is the CO2 source to the atmosphere fromthe decomposition of carbon during transport. F3 – (F4 + F5)constitutes the net land−atmosphere CO2 flux from erosion; F1 andF2 represent components of the horizontal displacement of carbon.
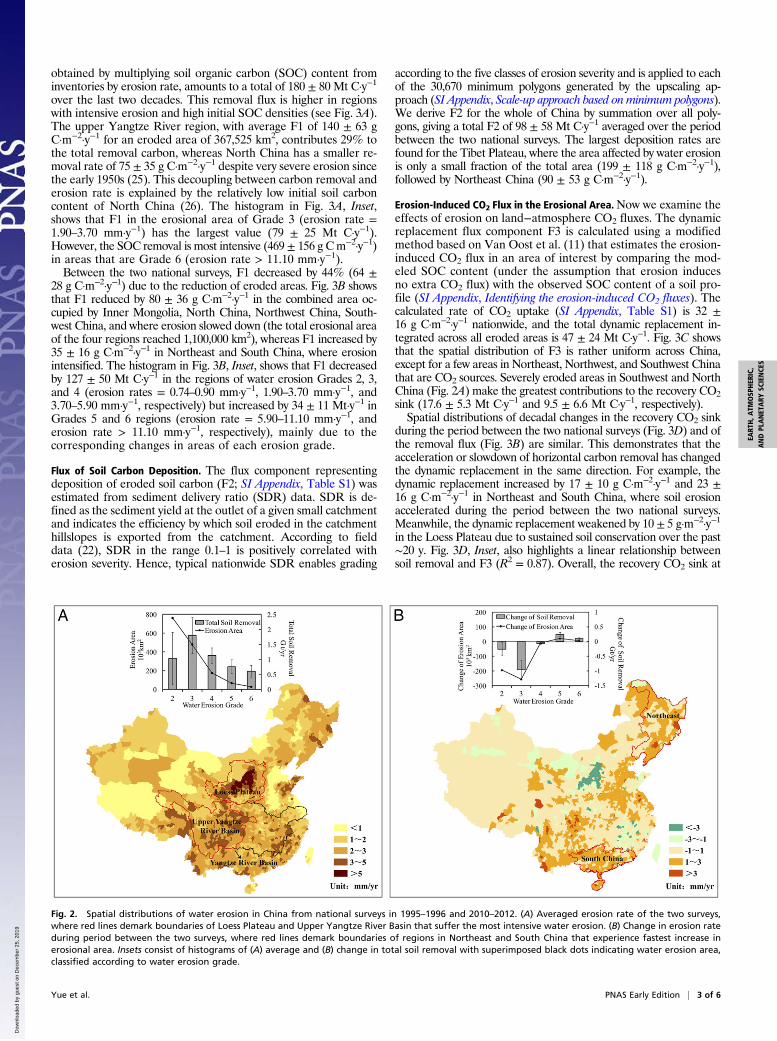
Soil Erosion and Conservation in China. Fig. 2 A and B shows thedistributions over China of mean erosion rate and the change inerosion rate determined from the two national surveys (the secondnational survey was carried out in 1995–1996, and the fourth na-tional survey was carried out in 2010–2012) that combined remotesensing land cover imaging with field data (recorded in 68,155survey units covering 1% of the total area experiencing watererosion; for details of land cover, precipitation and soil distribu-tion, see SI Appendix, Data). The most fragile soils in China are
Mollisol, Calcic Inceptisols, and Ultisols based on the US De-partment of Agriculture (USDA) soil taxonomy [and Phaeozems,Calcic Cambisols, and Planosol based on Food and AgricultureOrganization (FAO) soil classification]. As shown in Fig. 2A, themost intensively eroded regions are in the Loess Plateau region(mean rate of 3.0 ± 1.2 mm·y−1 and soil removal 1.59 ± 0.59 Gt·y−1,comprising 30.1% of the total) and in the upper Yangtze RiverBasin (mean rate 2.6 ± 1.0 mm·y−1 and total soil removal 1.37 ±0.53 Gt·y−1, comprising 25.9% of the total), both of which havesoils composed of readily eroded Inceptisols, based on USDA soiltaxonomy [or Cambisols, based on FAO soil classification (21)],heavy rainfall events during the wet season (22), and intensiveagriculture (23). Classified according to the water erosion grade,the histogram in Fig. 2A, Inset, shows that soil removal in Grade 3areas (i.e., erosion rate = 1.90–3.70 mm·y−1) contributes the mostto total soil loss (1.8 ± 0.6 Gt·y−1, taking 34 ± 11% of the total),whereas Grade 2 areas (erosion rate = 0.74–1.90 mm·y−1) comprisethe largest proportion of the total erosional area (760,908 km2, i.e.,50% of the total). After 1990, a huge national-scale program of“returning farmland to forests and grassland” for soil conservationand restoration was implemented in China, especially in the Loessplateau regions. About 22% of the total eroded area was put intorestoration, mainly through soil conservation and afforestationprojects. Hydraulic engineering works such as terracing, checkdams, cisterns, and shelterbelts affected an area of about 1 millionsquare kilometers during 2002–2012. Restrictions on forest litterraking and grazing in mountainous regions were further imple-mented over 0.75 million square kilometers during the same period(24) in North China (including the Loess Plateau) and SouthwestChina (including the upper Yangtze River). The histogram in Fig.2B, Inset, shows that the combined area of Grades 2, 3, and 4erosion (erosion rates = 0.74–0.90 mm·y−1, 1.90–3.70 mm·y−1, and3.70–5.90 mm·y−1, respectively) was reduced by 461,000 km2 (i.e.,reduction of 1.3 ± 0.6 Gt·y−1 in soil removal). However, thecombined area of Grades 5 and 6 erosion (erosion rate = 5.90–11.10 mm·y−1, and erosion rate > 11.10 mm·y−1, respectively) in-creased by 25,000 km2 (i.e., increase of 0.3 ± 0.1 Gt·y−1 in soilremoval). The largest reduction of soil erosion in between the timeperiods covered by the two national surveys occurred in the LoessPlateau, where the erosion rate was reduced by 0.8 ± 0.2 mm·y−1,and the total removal of soil was reduced by 1.1 ± 0.4 Gt·y−1.Conversely, the rates of erosion continued to increase in 345 out of378 counties in Northeastern and Southern China by 0.6 Gt·y−1,with a 43.6% increase in erosional area in these two regions.
Flux of Soil Carbon Removal. The flux component associated withremoval of soil carbon by erosion (F1; SI Appendix, Table S1),
Fig. 1. Schematic of lateral and vertical carbon fluxcomponents under the impact of water erosion,transport and deposition areas. Insets A, B, and Cdemonstrate carbon input (IN) and carbon mineral-ization (MI) preerosion and posterosion; positivevalue represents carbon sink; Inset D shows the extraCO2 flux induced by erosion in terms of the differ-ence of (IN-MI) pre- and posterosion; Fv is the in-tegrated results of F3, F4, and F5.
2 of 6 | www.pnas.org/cgi/doi/10.1073/pnas.1523358113 Yue et al.
Dow
nloa
ded
by g
uest
on
Dec
embe
r 25
, 201
9
obtained by multiplying soil organic carbon (SOC) content frominventories by erosion rate, amounts to a total of 180 ± 80 Mt C·y−1
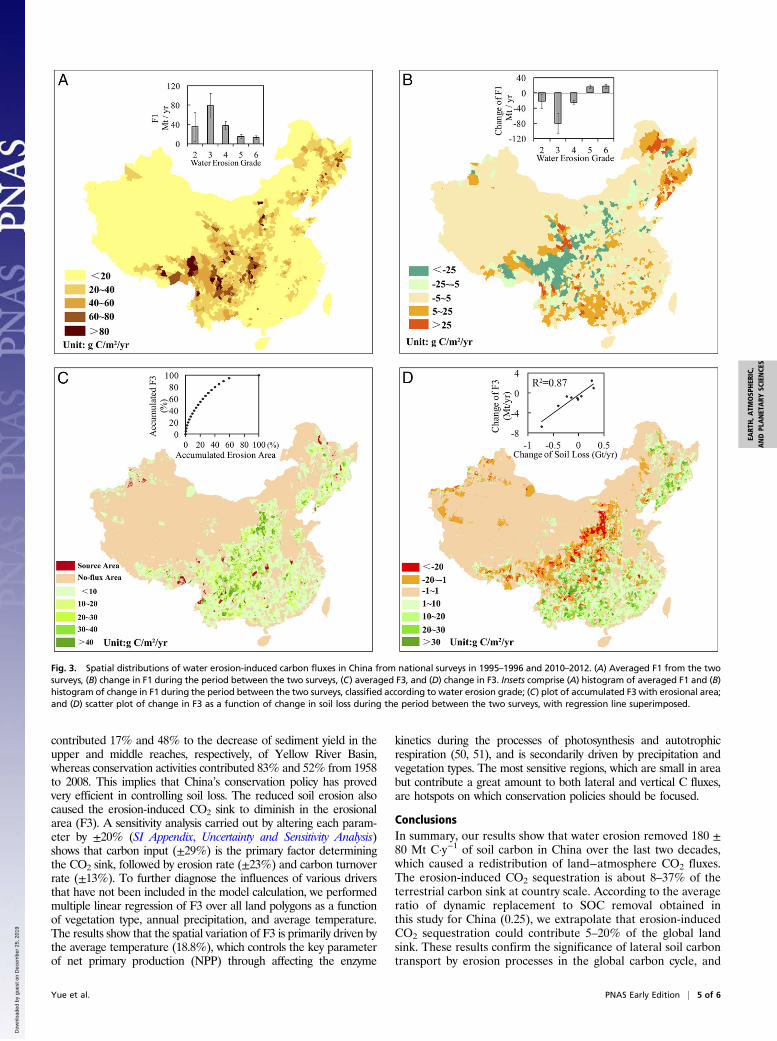
over the last two decades. This removal flux is higher in regionswith intensive erosion and high initial SOC densities (see Fig. 3A).The upper Yangtze River region, with average F1 of 140 ± 63 gC·m−2·y−1 for an eroded area of 367,525 km2, contributes 29% tothe total removal carbon, whereas North China has a smaller re-moval rate of 75 ± 35 g C·m−2·y−1 despite very severe erosion sincethe early 1950s (25). This decoupling between carbon removal anderosion rate is explained by the relatively low initial soil carboncontent of North China (26). The histogram in Fig. 3A, Inset,shows that F1 in the erosional area of Grade 3 (erosion rate =1.90–3.70 mm·y−1) has the largest value (79 ± 25 Mt C·y−1).However, the SOC removal is most intensive (469 ± 156 g Cm−2·y−1)in areas that are Grade 6 (erosion rate > 11.10 mm·y−1).Between the two national surveys, F1 decreased by 44% (64 ±
28 g C·m−2·y−1) due to the reduction of eroded areas. Fig. 3B showsthat F1 reduced by 80 ± 36 g C·m−2·y−1 in the combined area oc-cupied by Inner Mongolia, North China, Northwest China, South-west China, and where erosion slowed down (the total erosional areaof the four regions reached 1,100,000 km2), whereas F1 increased by35 ± 16 g C·m−2·y−1 in Northeast and South China, where erosionintensified. The histogram in Fig. 3B, Inset, shows that F1 decreasedby 127 ± 50 Mt C·y−1 in the regions of water erosion Grades 2, 3,and 4 (erosion rates = 0.74–0.90 mm·y−1, 1.90–3.70 mm·y−1, and3.70–5.90 mm·y−1, respectively) but increased by 34 ± 11 Mt·y−1 inGrades 5 and 6 regions (erosion rate = 5.90–11.10 mm·y−1, anderosion rate > 11.10 mm·y−1, respectively), mainly due to thecorresponding changes in areas of each erosion grade.
Flux of Soil Carbon Deposition. The flux component representingdeposition of eroded soil carbon (F2; SI Appendix, Table S1) wasestimated from sediment delivery ratio (SDR) data. SDR is de-fined as the sediment yield at the outlet of a given small catchmentand indicates the efficiency by which soil eroded in the catchmenthillslopes is exported from the catchment. According to fielddata (22), SDR in the range 0.1–1 is positively correlated witherosion severity. Hence, typical nationwide SDR enables grading
according to the five classes of erosion severity and is applied to eachof the 30,670 minimum polygons generated by the upscaling ap-proach (SI Appendix, Scale-up approach based on minimum polygons).We derive F2 for the whole of China by summation over all poly-gons, giving a total F2 of 98 ± 58 Mt C·y−1 averaged over the periodbetween the two national surveys. The largest deposition rates arefound for the Tibet Plateau, where the area affected by water erosionis only a small fraction of the total area (199 ± 118 g C·m−2·y−1),followed by Northeast China (90 ± 53 g C·m−2·y−1).
Erosion-Induced CO2 Flux in the Erosional Area.Now we examine theeffects of erosion on land−atmosphere CO2 fluxes. The dynamicreplacement flux component F3 is calculated using a modifiedmethod based on Van Oost et al. (11) that estimates the erosion-induced CO2 flux in an area of interest by comparing the mod-eled SOC content (under the assumption that erosion inducesno extra CO2 flux) with the observed SOC content of a soil pro-file (SI Appendix, Identifying the erosion-induced CO2 fluxes). Thecalculated rate of CO2 uptake (SI Appendix, Table S1) is 32 ±16 g C·m−2·y−1 nationwide, and the total dynamic replacement in-tegrated across all eroded areas is 47 ± 24 Mt C·y−1. Fig. 3C showsthat the spatial distribution of F3 is rather uniform across China,except for a few areas in Northeast, Northwest, and Southwest Chinathat are CO2 sources. Severely eroded areas in Southwest and NorthChina (Fig. 2A) make the greatest contributions to the recovery CO2sink (17.6 ± 5.3 Mt C·y−1 and 9.5 ± 6.6 Mt C·y−1, respectively).Spatial distributions of decadal changes in the recovery CO2 sink
during the period between the two national surveys (Fig. 3D) and ofthe removal flux (Fig. 3B) are similar. This demonstrates that theacceleration or slowdown of horizontal carbon removal has changedthe dynamic replacement in the same direction. For example, thedynamic replacement increased by 17 ± 10 g C·m−2·y−1 and 23 ±16 g C·m−2·y−1 in Northeast and South China, where soil erosionaccelerated during the period between the two national surveys.Meanwhile, the dynamic replacement weakened by 10 ± 5 g·m−2·y−1
in the Loess Plateau due to sustained soil conservation over the past∼20 y. Fig. 3D, Inset, also highlights a linear relationship betweensoil removal and F3 (R2 = 0.87). Overall, the recovery CO2 sink at
Fig. 2. Spatial distributions of water erosion in China from national surveys in 1995–1996 and 2010–2012. (A) Averaged erosion rate of the two surveys,where red lines demark boundaries of Loess Plateau and Upper Yangtze River Basin that suffer the most intensive water erosion. (B) Change in erosion rateduring period between the two surveys, where red lines demark boundaries of regions in Northeast and South China that experience fastest increase inerosional area. Insets consist of histograms of (A) average and (B) change in total soil removal with superimposed black dots indicating water erosion area,classified according to water erosion grade.
Yue et al. PNAS Early Edition | 3 of 6
EART
H,A
TMOSP
HER
IC,
ANDPL
ANET
ARY
SCIENCE
S
Dow
nloa
ded
by g
uest
on
Dec
embe
r 25
, 201
9
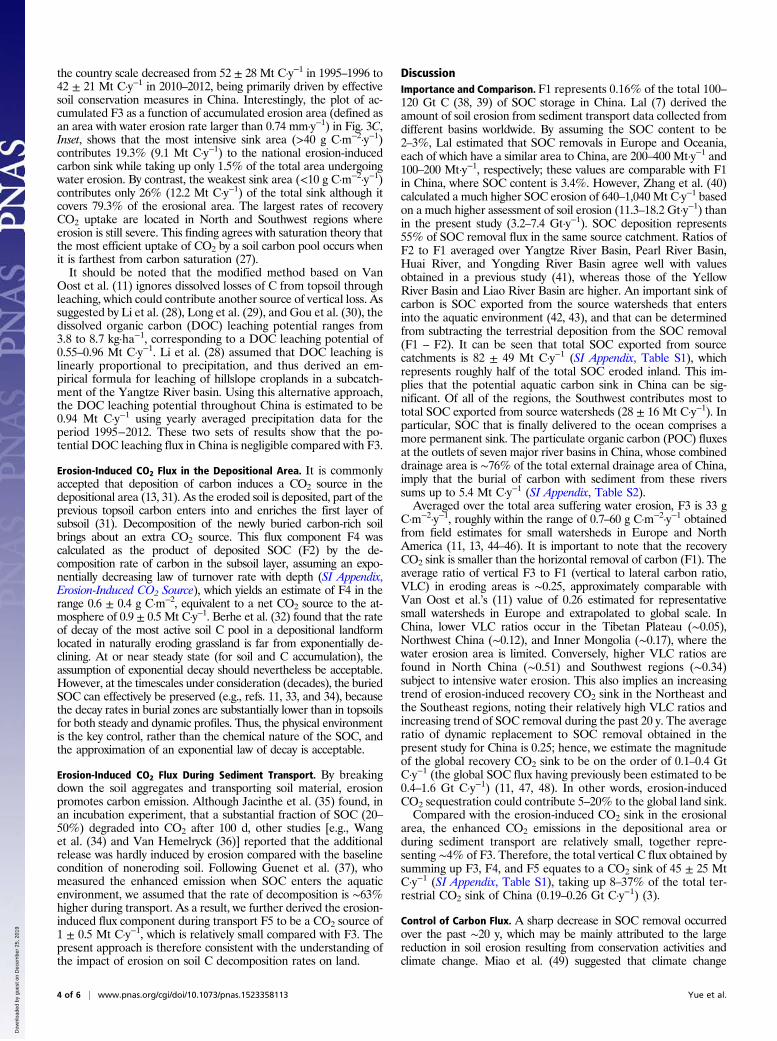
the country scale decreased from 52 ± 28 Mt C·y−1 in 1995–1996 to42 ± 21 Mt C·y−1 in 2010–2012, being primarily driven by effectivesoil conservation measures in China. Interestingly, the plot of ac-cumulated F3 as a function of accumulated erosion area (defined asan area with water erosion rate larger than 0.74 mm·y−1) in Fig. 3C,Inset, shows that the most intensive sink area (>40 g C·m−2·y−1)contributes 19.3% (9.1 Mt C·y−1) to the national erosion-inducedcarbon sink while taking up only 1.5% of the total area undergoingwater erosion. By contrast, the weakest sink area (<10 g C·m−2·y−1)contributes only 26% (12.2 Mt C·y−1) of the total sink although itcovers 79.3% of the erosional area. The largest rates of recoveryCO2 uptake are located in North and Southwest regions whereerosion is still severe. This finding agrees with saturation theory thatthe most efficient uptake of CO2 by a soil carbon pool occurs whenit is farthest from carbon saturation (27).It should be noted that the modified method based on Van
Oost et al. (11) ignores dissolved losses of C from topsoil throughleaching, which could contribute another source of vertical loss. Assuggested by Li et al. (28), Long et al. (29), and Gou et al. (30), thedissolved organic carbon (DOC) leaching potential ranges from3.8 to 8.7 kg·ha−1, corresponding to a DOC leaching potential of0.55–0.96 Mt C·y−1. Li et al. (28) assumed that DOC leaching islinearly proportional to precipitation, and thus derived an em-pirical formula for leaching of hillslope croplands in a subcatch-ment of the Yangtze River basin. Using this alternative approach,the DOC leaching potential throughout China is estimated to be0.94 Mt C·y−1 using yearly averaged precipitation data for theperiod 1995−2012. These two sets of results show that the po-tential DOC leaching flux in China is negligible compared with F3.
Erosion-Induced CO2 Flux in the Depositional Area. It is commonlyaccepted that deposition of carbon induces a CO2 source in thedepositional area (13, 31). As the eroded soil is deposited, part of theprevious topsoil carbon enters into and enriches the first layer ofsubsoil (31). Decomposition of the newly buried carbon-rich soilbrings about an extra CO2 source. This flux component F4 wascalculated as the product of deposited SOC (F2) by the de-composition rate of carbon in the subsoil layer, assuming an expo-nentially decreasing law of turnover rate with depth (SI Appendix,Erosion-Induced CO2 Source), which yields an estimate of F4 in therange 0.6 ± 0.4 g C·m−2, equivalent to a net CO2 source to the at-mosphere of 0.9 ± 0.5 Mt C·y−1. Berhe et al. (32) found that the rateof decay of the most active soil C pool in a depositional landformlocated in naturally eroding grassland is far from exponentially de-clining. At or near steady state (for soil and C accumulation), theassumption of exponential decay should nevertheless be acceptable.However, at the timescales under consideration (decades), the buriedSOC can effectively be preserved (e.g., refs. 11, 33, and 34), becausethe decay rates in burial zones are substantially lower than in topsoilsfor both steady and dynamic profiles. Thus, the physical environmentis the key control, rather than the chemical nature of the SOC, andthe approximation of an exponential law of decay is acceptable.
Erosion-Induced CO2 Flux During Sediment Transport. By breakingdown the soil aggregates and transporting soil material, erosionpromotes carbon emission. Although Jacinthe et al. (35) found, inan incubation experiment, that a substantial fraction of SOC (20–50%) degraded into CO2 after 100 d, other studies [e.g., Wanget al. (34) and Van Hemelryck (36)] reported that the additionalrelease was hardly induced by erosion compared with the baselinecondition of noneroding soil. Following Guenet et al. (37), whomeasured the enhanced emission when SOC enters the aquaticenvironment, we assumed that the rate of decomposition is ∼63%higher during transport. As a result, we further derived the erosion-induced flux component during transport F5 to be a CO2 source of1 ± 0.5 Mt C·y−1, which is relatively small compared with F3. Thepresent approach is therefore consistent with the understanding ofthe impact of erosion on soil C decomposition rates on land.
DiscussionImportance and Comparison. F1 represents 0.16% of the total 100–120 Gt C (38, 39) of SOC storage in China. Lal (7) derived theamount of soil erosion from sediment transport data collected fromdifferent basins worldwide. By assuming the SOC content to be2–3%, Lal estimated that SOC removals in Europe and Oceania,each of which have a similar area to China, are 200–400 Mt·y−1 and100–200 Mt·y−1, respectively; these values are comparable with F1in China, where SOC content is 3.4%. However, Zhang et al. (40)calculated a much higher SOC erosion of 640–1,040 Mt C·y−1 basedon a much higher assessment of soil erosion (11.3–18.2 Gt·y−1) thanin the present study (3.2–7.4 Gt·y−1). SOC deposition represents55% of SOC removal flux in the same source catchment. Ratios ofF2 to F1 averaged over Yangtze River Basin, Pearl River Basin,Huai River, and Yongding River Basin agree well with valuesobtained in a previous study (41), whereas those of the YellowRiver Basin and Liao River Basin are higher. An important sink ofcarbon is SOC exported from the source watersheds that entersinto the aquatic environment (42, 43), and that can be determinedfrom subtracting the terrestrial deposition from the SOC removal(F1 – F2). It can be seen that total SOC exported from sourcecatchments is 82 ± 49 Mt C·y−1 (SI Appendix, Table S1), whichrepresents roughly half of the total SOC eroded inland. This im-plies that the potential aquatic carbon sink in China can be sig-nificant. Of all of the regions, the Southwest contributes most tototal SOC exported from source watersheds (28 ± 16 Mt C·y−1). Inparticular, SOC that is finally delivered to the ocean comprises amore permanent sink. The particulate organic carbon (POC) fluxesat the outlets of seven major river basins in China, whose combineddrainage area is ∼76% of the total external drainage area of China,imply that the burial of carbon with sediment from these riverssums up to 5.4 Mt C·y−1 (SI Appendix, Table S2).Averaged over the total area suffering water erosion, F3 is 33 g
C·m−2·y−1, roughly within the range of 0.7–60 g C·m−2·y−1 obtainedfrom field estimates for small watersheds in Europe and NorthAmerica (11, 13, 44–46). It is important to note that the recoveryCO2 sink is smaller than the horizontal removal of carbon (F1). Theaverage ratio of vertical F3 to F1 (vertical to lateral carbon ratio,VLC) in eroding areas is ∼0.25, approximately comparable withVan Oost et al.’s (11) value of 0.26 estimated for representativesmall watersheds in Europe and extrapolated to global scale. InChina, lower VLC ratios occur in the Tibetan Plateau (∼0.05),Northwest China (∼0.12), and Inner Mongolia (∼0.17), where thewater erosion area is limited. Conversely, higher VLC ratios arefound in North China (∼0.51) and Southwest regions (∼0.34)subject to intensive water erosion. This also implies an increasingtrend of erosion-induced recovery CO2 sink in the Northeast andthe Southeast regions, noting their relatively high VLC ratios andincreasing trend of SOC removal during the past 20 y. The averageratio of dynamic replacement to SOC removal obtained in thepresent study for China is 0.25; hence, we estimate the magnitudeof the global recovery CO2 sink to be on the order of 0.1–0.4 GtC·y−1 (the global SOC flux having previously been estimated to be0.4–1.6 Gt C·y−1) (11, 47, 48). In other words, erosion-inducedCO2 sequestration could contribute 5–20% to the global land sink.Compared with the erosion-induced CO2 sink in the erosional
area, the enhanced CO2 emissions in the depositional area orduring sediment transport are relatively small, together repre-senting ∼4% of F3. Therefore, the total vertical C flux obtained bysumming up F3, F4, and F5 equates to a CO2 sink of 45 ± 25 MtC·y−1 (SI Appendix, Table S1), taking up 8–37% of the total ter-restrial CO2 sink of China (0.19–0.26 Gt C·y−1) (3).
Control of Carbon Flux. A sharp decrease in SOC removal occurredover the past ∼20 y, which may be mainly attributed to the largereduction in soil erosion resulting from conservation activities andclimate change. Miao et al. (49) suggested that climate change
4 of 6 | www.pnas.org/cgi/doi/10.1073/pnas.1523358113 Yue et al.
Dow
nloa
ded
by g
uest
on
Dec
embe
r 25
, 201
9
contributed 17% and 48% to the decrease of sediment yield in theupper and middle reaches, respectively, of Yellow River Basin,whereas conservation activities contributed 83% and 52% from 1958to 2008. This implies that China’s conservation policy has provedvery efficient in controlling soil loss. The reduced soil erosion alsocaused the erosion-induced CO2 sink to diminish in the erosionalarea (F3). A sensitivity analysis carried out by altering each param-eter by ±20% (SI Appendix, Uncertainty and Sensitivity Analysis)shows that carbon input (±29%) is the primary factor determiningthe CO2 sink, followed by erosion rate (±23%) and carbon turnoverrate (±13%). To further diagnose the influences of various driversthat have not been included in the model calculation, we performedmultiple linear regression of F3 over all land polygons as a functionof vegetation type, annual precipitation, and average temperature.The results show that the spatial variation of F3 is primarily driven bythe average temperature (18.8%), which controls the key parameterof net primary production (NPP) through affecting the enzyme
kinetics during the processes of photosynthesis and autotrophicrespiration (50, 51), and is secondarily driven by precipitation andvegetation types. The most sensitive regions, which are small in areabut contribute a great amount to both lateral and vertical C fluxes,are hotspots on which conservation policies should be focused.
ConclusionsIn summary, our results show that water erosion removed 180 ±80 Mt C·y−1 of soil carbon in China over the last two decades,which caused a redistribution of land−atmosphere CO2 fluxes.The erosion-induced CO2 sequestration is about 8–37% of theterrestrial carbon sink at country scale. According to the averageratio of dynamic replacement to SOC removal obtained inthis study for China (0.25), we extrapolate that erosion-inducedCO2 sequestration could contribute 5–20% of the global landsink. These results confirm the significance of lateral soil carbontransport by erosion processes in the global carbon cycle, and
Fig. 3. Spatial distributions of water erosion-induced carbon fluxes in China from national surveys in 1995–1996 and 2010–2012. (A) Averaged F1 from the twosurveys, (B) change in F1 during the period between the two surveys, (C) averaged F3, and (D) change in F3. Insets comprise (A) histogram of averaged F1 and (B)histogram of change in F1 during the period between the two surveys, classified according to water erosion grade; (C) plot of accumulated F3 with erosional area;and (D) scatter plot of change in F3 as a function of change in soil loss during the period between the two surveys, with regression line superimposed.
Yue et al. PNAS Early Edition | 5 of 6
EART
H,A
TMOSP
HER
IC,
ANDPL
ANET
ARY
SCIENCE
S
Dow
nloa
ded
by g
uest
on
Dec
embe
r 25
, 201
9
highlight the importance of reducing uncertainty in assessing theterrestrial carbon balance due to soil erosion.
MethodsThe lateral and vertical carbon fluxes induced by water erosion of soils are cal-culated based on national surveys (carried out in 1995–1996 and 2010–2012) onerosion rates and a national soil database containing 8,980 profiles, togetherwith NPP and carbon pool turnover rate data derived from 10 global carboncycle models. Furthermore, multiple regression analysis is undertaken based onlong series datasets on distributions of vegetation cover and climatic information(1995–2012) obtained from 675 gauging stations located throughout China.
Estimates of lateral SOC fluxes of erosion (F1), deposition (F2), and thedynamicreplacement at the erosional area (F3) were determined based on minimumpolygons generated by overlaying the data layers of erosion rate, soil carboncontent, NPP, and carbon pool turnover rate in ArcGIS. F1 was given by theproduct of erosion rate and SOC content in the eroded soil (SI Appendix, SOCerosion). F2 was determined by introducing the concept of sediment deliveryratio (SI Appendix, SOC deposition). F3 was assessed using a modified modelbased on Van Oost et al.’s method (11) (SI Appendix, Carbon Recovery at theEroded Area). These three fluxes were calculated and their values added up for
each polygon, and the total flux at country scale was obtained by summationover all polygons (SI Appendix, Scale-up approach based onminimum polygons).
Erosion-induced CO2 flux at the depositional area (F4) was estimatedas the CO2 emission from the newly buried carbon-rich topsoil (SI Ap-pendix, Erosion-Induced CO2 Source). Erosion-induced CO2 flux duringsediment transport (F5) was determined as the difference between CO2
emissions before and after erosion (SI Appendix, Enhanced Decomposi-tion of SOC).
ACKNOWLEDGMENTS. Discussions on the erosion-induced CO2 flux in thesediment transport process with Bertrand Guenet (Laboratoire des Sciencesdu Climat et l’Environnement, Centre National de la Recherche Scientifique,Commissariat à l’Énergie Atomique et aux Énergies Alternatives, Universitéde Versailles-Saint-Quentin-en-Yvelines) are particularly acknowledged. J.N.was supported by National Natural Science Foundation of China (Grant51379010) and the Collaborative Innovation Center for Regional Environ-mental Quality. K.V.O. was supported by BELSPO-PAI (P7-24). Datasets onsoil erosion were from National General Survey Program on Soil and WaterConservation (SBZX-SBPC-1001). The 137Cs and SOC data for model validationwere provided by Jianhui Zhang [Institute of Mountain Hazards and Envi-ronment, Chinese Academy of Sciences (CAS)] and Haiyan Fang (Institute ofGeographic Sciences and Natural Resources Research, CAS).
1. Le Quéré C, et al. (2009) Trends in the sources and sinks of carbon dioxide. Nat Geosci2:831–836.
2. Intergovernmental Panel on Climate Change (2013) Climate Change 2013: The PhysicalScience Basis. Contribution of Working Group I to the Fifth Assessment Report of theIntergovernmental Panel on Climate Change, eds Stocker TF, et al. (Cambridge UnivPress, New York).
3. Piao S, et al. (2009) The carbon balance of terrestrial ecosystems in China. Nature458(7241):1009–1013.
4. Intergovernmental Panel on Climate Change (2014) Climate Change 2014: SynthesisReport. Contribution of Working Groups I, II and III to the Fifth Assessment Report ofthe Intergovernmental Panel on Climate Change, eds Pachauri RK, et al. (IntergovPanel Clim Change, Geneva).
5. Berhe AA, Harte J, Harden JW, Torn MS (2007) The significance of the erosion-inducedterrestrial carbon sink. Bioscience 57(4):337–346.
6. Jacinthe PA, Lal R (2001) A mass balance approach to assess carbon dioxide evolutionduring erosional events. Land Degrad Dev 12(4):329–339.
7. Lal R (2003) Soil erosion and the global carbon budget. Environ Int 29(4):437–450.8. Fontaine S, et al. (2007) Stability of organic carbon in deep soil layers controlled by
fresh carbon supply. Nature 450(7167):277–280.9. Doetterl S, et al. (2016) Erosion, deposition and soil carbon: A review of process-level
controls, experimental tools and models to address C cycling in dynamic landscapes.Earth Sci Rev 154:102–122.
10. Berhe AA, Kleber M (2013) Erosion, deposition, and the persistence of soil organicmatter: Mechanistic considerations and problems with terminology. Earth SurfProcesses Landforms 38(8):908–912.
11. Van Oost K, et al. (2007) The impact of agricultural soil erosion on the global carboncycle. Science 318(5850):626–629.
12. Kirkels FMSA, Cammeraat LH, Kuhn NJ (2014) The fate of soil organic carbon uponerosion, transport and deposition in agricultural landscapes—A review of differentconcepts. Geomorphology 226:94–105.
13. Liu S, Bliss N, Sundquist E, Huntington TG (2003) Modeling carbon dynamics in veg-etation and soil under the impact of soil erosion and deposition. Global BiogeochemCycles 17(2):1074–1097.
14. Renwick WH, Smith SV, Sleezer RO, Buddemeier RW (2004) Comment on “Managingsoil carbon” (II). Science 305(5690):1567, and author reply (2004) 305(5690):1567.
15. Harden JW, et al. (2008) Soil erosion: Data say C sink. Science 320(5873):178–179.16. Quinton JN, Govers G, Van Oost K, Bardgett RD (2010) The impact of agricultural soil
erosion on biogeochemical cycling. Nat Geosci 3:311–314.17. Pan G, Xu XW, Smith P, Pan WN, Lal R (2010) An increase in topsoil SOC stock of
China’s croplands between 1985 and 2006 revealed by soil monitoring. Agric EcosystEnviron 136(1-2):133–138.
18. Stacy EM, Hart SC, Hunsaker CT, Johnson DW, Berhe AA (2015) Soil carbon and ni-trogen erosion in forested catchments: implications for erosion-induced terrestrialcarbon sequestration. Biogeosciences 12(16):4861–4874.
19. Miao CY, Ni JR, Borthwick AGL (2010) Recent changes of water discharge and sedi-ment load in the Yellow River basin, China. Prog Phys Geogr 34(4):541–561.
20. Shang Guan W, Dai YJ, Liu BY, Ye AZ, Yuan H (2012) A soil particle-size distributiondataset for regional land and climate modelling in China. Geoderma 171–172:85–91.
21. Shi XZ, et al. (2006) Cross-reference system for translating between genetic soilclassification of China and soil taxonomy. Soil Sci Soc Am J 70(1):78–83.
22. Jing K, Wang WZ, Zheng FL (2005) Soil Erosion and Environment in China (SciencePress, Beijing), Chinese.
23. Lal R (2002) Soil carbon sequestration in China through agricultural intensification, andrestoration of degraded and desertified ecosystems. Land Degrad Dev 13(6):469–478.
24. Ministry of Water Resources PRC, National Bureau of Statistics PRC (2013) Bulletin ofFirst National Census for Water (China Water & Power Press, Beijing).
25. Chen CQ (1992) Study on soil erosion using remote sensing technique in the LoessPlateau of the North Shaanxi Province. XVIIth ISPRS Congress (Int Soc PhotogrammRemote Sens, Washington, DC), pp 137–141.
26. Wang YQ, Zhang XC, Zhang JL, Li SJ (2009) Spatial variability of soil organic carbon ina watershed on the Loess Plateau. Pedosphere 19(4):486–495.
27. Stewart CE, Paustian K, Conant RT, Plante AF, Six J (2007) Soil carbon saturation:Concept, evidence and evaluation. Biogeochemistry 86(1):19–31.
28. Li TK, Zhu B, Wang XG, Kou CL (2013) Characteristics of dissolved organic carbonleaching from hillslope cropland of purple soil in the Sichuan Basin, China. J FoodAgric Environ 11(2):1522–1527.
29. Long GQ, Jiang YJ, Sun B (2015) Seasonal and inter-annual variation of leaching ofdissolved organic carbon and nitrogen under long-term manure application in anacidic clay soil in subtropical China. Soil Tillage Res 146(Part B):270–278.
30. Gou XL, et al. (2013) Effect of changes in seasonal freeze-thaw pattern on DOC lossfrom leaching in the alpine forest soil. J Soil Water Conserv 27(6):205–210.
31. Van Oost K, et al. (2005) Landscape-scale modeling of carbon cycling under the impact ofsoil redistribution: The role of tillage erosion. Global Biogeochem Cycles 19(4):GB4014.
32. Berhe AA, Harden JW, Torn MS, Harte J (2008) Linking soil organic matter dynamicsand erosion-induced terrestrial carbon sequestration at different landform positions.J Geophys Res 113(G4):4647–4664.
33. Van Oost K, et al. (2012) Legacy of human-induced C erosion and burial on soil-atmosphere C exchange. Proc Natl Acad Sci USA 109(47):19492–19497.
34. Wang Z, et al. (2014) The fate of buried organic carbon in colluvial soils: A long-termperspective. Biogeosciences 11(3):873–883.
35. Jacinthe PA, Lal R, Kimble JM (2001) Organic carbon storage and dynamics in croplandsand terrestrial deposits as influenced by subsurface tile drainage. Soil Sci 166(5):322–335.
36. Van Hemelryck H, Govers G, Van Oost K, Merckx R (2010) The effect of soil redistributionon soil organic carbon: An experimental study. Biogeosciences 7(12):3971–3986.
37. Guenet B, et al. (2014) Fast mineralization of land-born C in inland waters: First ex-perimental evidences of aquatic priming effect. Hydrobiologia 721(1):35–44.
38. Ni J (2001) Carbon storage in terrestrial ecosystems of China: Estimates at differentspatial resolutions and their responses to climate change. Clim Change 49(3):339–358.
39. Ni J (2013) Carbon storage in Chinese terrestrial ecosystems: Approaching a moreaccurate estimate. Clim Change 119(3):905–917.
40. Zhang H, et al. (2014) Inclusion of soil carbon lateral movement alters terrestrial carbonbudget in China. Sci Rep 4:7247.
41. Li ZG, Liu BZ (2006) Calculation on soil erosion amount of main river basin in China. SciSoil Water Conserv 4(2):1–6.
42. Stallard RF (1998) Terrestrial sedimentation and the carbon cycle: Coupling weath-ering and erosion to carbon burial. Global Biogeochem Cycles 12(2):231–257.
43. Smith SV, Sleezer RO, Renwick WH, Buddemeier RW (2005) Fates of eroded soil or-ganic carbon: Mississippi Basin case study. Ecol Appl 15(6):1929–1940.
44. Yoo K, et al. (2005) Erosion of upland hillslope soil organic carbon: Coupling field mea-surements with a sediment transport model. Global Biogeochem Cycles 19(3):1721–1730.
45. Harden JW, et al. (1999) Dynamic replacement and loss of soil carbon on erodingcropland. Global Biogeochem Cycles 13(4):885–901.
46. Billings SA, Buddemeier RW, Richter DD, Van Oost K, Bohling G (2010) A simplemethod for estimating the influence of eroding soil profiles on atmospheric CO2.Global Biogeochem Cycles 24(2):1–14.
47. Ito A (2007) Simulated impacts of climate and land-cover change on soil erosion andimplication for the carbon cycle. Geophys Res Lett 34(9):L09403.
48. Doetterl S, Van Oost K, Six J (2012) Towards constraining the magnitude of global agricul-tural sediment and soil organic carbon fluxes. Earth Surf Processes Landforms 37(6):642–655.
49. Miao CY, Ni JR, Borthwick AGL, Yang L (2011) A preliminary estimate of human andnatural contributions to the changes in water discharge and sediment load in theYellow River. Global Planet Change 76(3-4):196–205.
50. Bernacchi CJ, Singsaas EL, Pimentel C, Portis AR, Jr, Long SP (2001) Improved tem-perature response functions for models of Rubisco-limited photosynthesis. Plant CellEnviron 24(2):253–259.
51. Song WM, et al. (2015) Simulated rain addition modifies diurnal patterns and tem-perature sensitivities of autotrophic and heterotrophic soil respiration in an ariddesert ecosystem. Soil Biol Biochem 82:143–152.
6 of 6 | www.pnas.org/cgi/doi/10.1073/pnas.1523358113 Yue et al.
Dow
nloa
ded
by g
uest
on
Dec
embe
r 25
, 201
9