lasers in physics: second-harmonic spectroscopy j. i...
TRANSCRIPT
1
Lasers in Physics: Second-Harmonic Spectroscopy
J. I. Dadap and T. F. Heinz*
Department of Physics and Department of Electrical Engineering
Columbia University, 538 West 120th St.
New York, NY 10027
E-mail: [email protected]
Introduction
The demonstration of second-harmonic generation (SHG), one of the early experiments
with pulsed lasers, is considered to have marked the birth of the field of nonlinear optics. The
importance of second-harmonic generation, and the related phenomena of sum- and difference-
frequency generation, as methods for producing new frequencies of coherent radiation was
recognized immediately and has in no way diminished over the years. Associated with these
applications came an interest in the fundamental nature of the second-order nonlinear response
and some spectroscopic studies were undertaken with this motivation. This was a rather limited
activity; it did not constitute a general method of optical probing of materials. In contrast, the
third-order nonlinear optical interactions have given rise to a panoply of significant spectroscopic
measurement techniques, including, to name a few, coherent Raman spectroscopy, pump-probe
and other four-wave mixing measurements, two-photon absorption and hole burning
measurements, photon echoes, and Doppler-free spectroscopy.
A central factor in the lack of spectroscopic applications of the second-order nonlinear
response lies in a fundamental symmetry constraint. Unlike the third-order nonlinearity, which

2
is present in all materials, only materials lacking a center of inversion give rise to an (electric-
dipole) allowed second-order nonlinear response. As we demonstrate in this article, however, it
is just this property that makes SHG, as well as the sum-frequency generation process discussed
elsewhere in this encyclopedia, such a remarkable probe of surfaces and interfaces. For
centrosymmetric materials, the second-order nonlinear response is strong only at interfaces,
where just a monolayer or so of material contributes to the response. This yields a purely optical
probe (with incident and emitted photons) that gives an inherent surface sensitivity comparable
to the best electron spectroscopies, such as electron-diffraction, Auger electron spectroscopy,
photoemission spectroscopy, and scanning tunneling microscopy, the workhorses of surface
science. Neither linear nor third-order nonlinear optical measurements provide this inherent
interface sensitivity. The possibility of probing interfaces by purely optical means permits one to
take advantage of several important features of optical radiation. Perhaps most noteworthy is the
possibility of probing buried interfaces of every sort, from solid/solid to liquid/liquid, as well as
the more conventional cases of solid/vapor, liquid/vapor, and liquid/solid. In addition, laser-
based techniques offer unequalled capabilities for spectral or temporal resolution.
In this article, we present a brief overview of SH spectroscopy for the study of surfaces
and interfaces. The article is divided into two principal sections: an introductory section that
presents some of the fundamentals of SHG and the behavior at interfaces; and a discussion of the
different types of information that the method can yield, as illustrated by some representative
examples. A brief section on the experimental technique links these two parts.
Fundamentals of Surface SHG
Basic notions
3
Within the domain of classical optics, the response of a material to electromagnetic
radiation is described by an induced polarization P that varies linearly with the electric field
strength, E. This situation reflects the fact that strength of electric fields for light encountered
under conventional conditions is minute compared to that of the electric fields binding atoms and
solids together. The electric field binding an atom may estimated as Ea ~ 1 V/Å = 1010 V/m. To
reproduce this field strength by an electromagnetic wave requires an irradiance of Ia ~ 1017
W/m2, so the validity of this linear approximation in classical optics is well justified. The advent
of the laser, with its capability for producing light beams with very high optical power and
irradiance, has permitted us to probe and exploit the nonlinear response of materials, giving rise
to the field of nonlinear optics.
The next-order material response beyond the linear approximation consists of an induced
nonlinear source polarization P(2) = ε0χχχχ(2):EE that depends quadratically on the driving electric
field E, described by a second-order nonlinear susceptibility χχχχ(2). For excitation by a single laser
at a frequency ω, this response gives rise to SHG at a frequency of 2ω, as well as optical
rectification with a dc induced-polarization. For beams at two distinct frequencies of ω1 and ω2,
the processes of sum- or difference-frequency generation (SFG or DFG) become operative with
the production of the new frequencies of |ω1±ω2|. For a relationship of the given form, which
assumes only a spatially local quadratic dependence of the polarization on the driving electric
field, one can show that χχχχ(2) must vanish within any centrosymmetric medium. This is a direct
consequence of the fact that χχχχ(2) as a quantity describing a centrosymmetric medium should not
change under an inversion operation, while the quantities P(2) and E as polar vectors will change
sign. The interface specificity of the SHG technique for centrosymmetric media follows from

4
this general observation: Only at interfaces is the bulk symmetry broken and the SHG process
allowed.
Anharmonic oscillator model
Before we embark on our discussion of surface SHG, we first briefly consider a simple
classical model of SHG based on an anharmonic oscillator. Although this is not a realistic
treatment of the response of materials, it helps to illustrate the characteristic features of the
surface SHG process and its spectroscopic attributes. In the anharmonic oscillator model, the
medium is treated as a collection of electrons bound to fixed ion cores. While the usual Lorentz
model only includes the effect of a linear restoring force, to describe second-order response, we
generalize this description to include a leading-order anharmonic restoring force. For simplicity,
we consider motion of the anharmonic oscillator in one spatial dimension, in which case the
classical equation of motion for the displacement, x, of the electron can then be written as
)(2 2202
2
tEm
ebxx
dt
dx
dt
xd −=−++ ωγ . (1)
Here – e and m denote, respectively, the electron charge and mass, and E(t) is the optical driving
field. The (angular) frequency ω0 defines the resonance of the harmonic component of the
response, and γ represents a phenomenological damping rate for the oscillator. The nonlinear
restoring force corresponds to the term containing the parameter b, a material-dependent
constant. We are interested in the solution of this equation for a monochromatic driving field at
frequency ω with amplitude E(ω) which we write as
E(t) = E(ω)exp(−iωt)+c.c., (2)
An exact solution to Eq. (1) in the presence of this electric field is not possible. Let us,
however, consider a regime in which we do not excite the oscillator too strongly, and the effect
5
of the anharmonic term remains relatively small compared to the harmonic one. In this case, we
may solve the problem perturbatively in powers of the driving field. We find a linear response at
the fundamental frequency and a nonlinear response at the SH frequency, which we can write in
terms of the corresponding induced dipole moments p = − e x:
p(t) = p(1)(ω) exp(−iωt)+ p(2)(2ω) exp(−i2ωt) + c.c. (3)
We can then write the amplitudes for the harmonically varying dipole moments as
p(1)(ω)= α(1)(ω)E(ω), (4)
p(2)(2ω)= α(2)(2ω=ω+ω )E(ω)E(ω), (5)
where α(1), the linear polarizability, and α(2), the second-order polarizability (or first
hyperpolarizability) for SHG are given, respectively, by
)(
1)(
2)1(
ωωα
Dm
e= , (6)
)()2(
)/()2( 2
23)2(
ωωωωωα
DD
bme=+= . (7)
Here we have introduced the resonant response at the fundamental frequency by D(ω) ≡
γωωω i2220 −− , with a corresponding relation for the response D(2ω) at the SH frequency. A
similar derivation can, of course, be applied to obtain the corresponding material response for the
SFG or DFG processes.
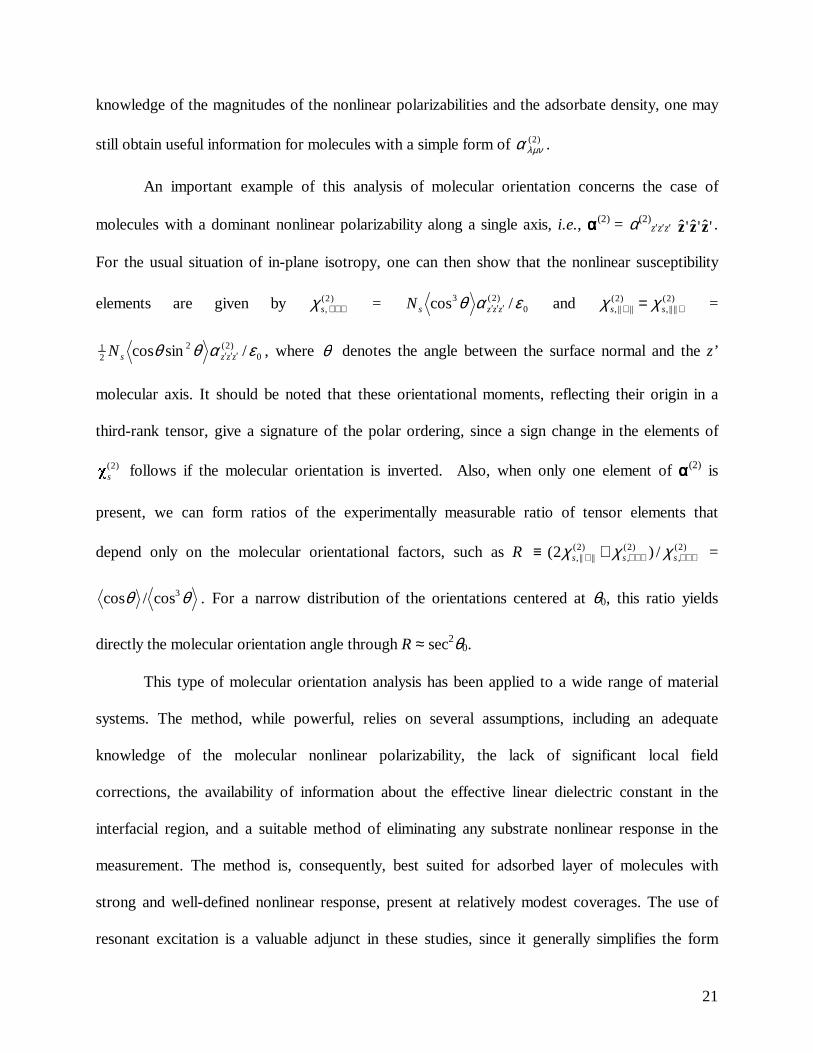
The spectral dependence of the polarizabilities α(1) and α(2) are illustrated in Fig. 1 for the
anharmonic oscillator model with a resonance frequency of ω0. In the linear case, one sees the
expected behavior of the loss, associated with the Im[α(1)], and dispersion associated with
Re[α(1)]. A single resonance in the linear response is seen for the driving frequency ω near the
oscillator frequency ω0. For the case of SHG, on the other hand, we observe both resonances
6
when the fundamental frequency ω ≈ ω0 and when the SH frequency 2ω ≈ ω0. In quantum
mechanical language introduced below, these peaks can be considered as arising, respectively,
from matching of the fundamental and second-harmonic photon energies with the transition
energy in the material.
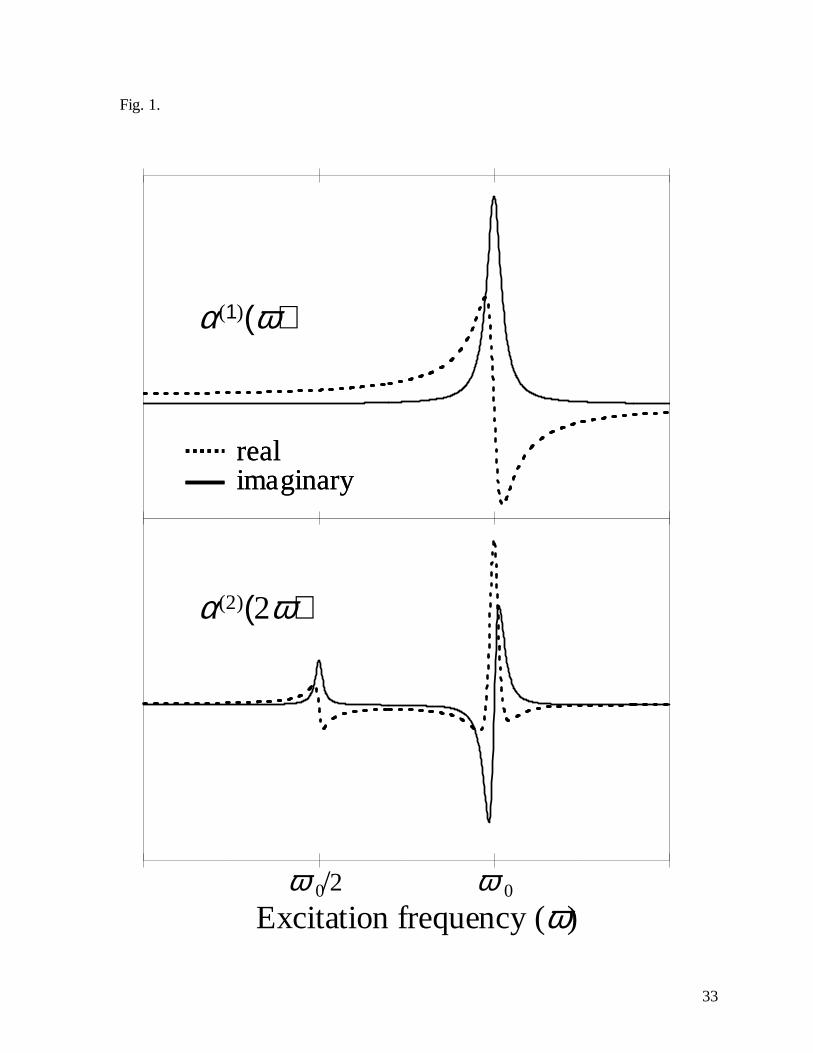
In SHG spectroscopy, one normally measures the SH power as a function of the laser
frequency. The SH field will scale with the nonlinear material response, i.e., with α(2)(2ω=ω+ω),
so that the SH power will be proportional to |α(2)(2ω=ω+ω)|2. Fig. 2 shows the corresponding
spectra in the vicinity of the second-harmonic resonance. An important aspect of this type of
spectroscopy, which is also present in other nonlinear spectroscopies, such as coherent Raman
measurements, is the role that may be played by a non-resonant background. This may arise
either from the off-resonant response of the system under study or from a coherent background
from another material. In either case, the effect can be described by adding a spectral flat
background response to the nonlinearity. Now when we detect the optical power, we then
measure a quantity proportional to |α(2)(2ω=ω+ω)+k|2, where k represents the nonresonant
background. The presence of k obviously elevates the baseline response near a resonance. In
addition, however, depending on the relative phase of k, this extra term can introduce significant
changes in the observed lineshapes. Fig. 2 illustrates this effect, which must always be borne in
mind in the interpretation of experimental spectra.
For the purposes of studies of surfaces and interfaces, the key property of second-order
nonlinear processes is the fact that they exhibit, for centrosymmetric bulk media, an inherent
interface specificity. This feature can be readily understood in the context of the nonlinear
oscillator model in which the SH polarization scales with the material parameter b. Since this
term is associated with a potential that varies as x3, it is clear that the value of the b parameter
7
can be taken as a measure of the material’s departure from inversion symmetry. At the interface,
such a term can be present, reflecting the inherent asymmetry at a boundary, while it must
necessarily be absent in the bulk of a centrosymmetric material.
Quantum-mechanical description of SHG
A correct description of SHG naturally requires a quantum mechanical treatment of the
material response to the optical field. For our present purposes, we consider a localized entity
with a nonlinear response, such as a non-centrosymmetric molecule at a surface. We consider
below how these individual units can be added together to yield the surface nonlinear response of
the material. Within this picture, we write the induced nonlinear dipole moment p(2) of each
molecule in terms of the driving electric field E as
p(2)(2ω) = αααα(2)(2ω=ω+ω ):E(ω)E(ω). (8)
This relation is simply the generalization of Eq. (5) to include a full 3-dimensional description,
where p(2) and E are vectors and the second-order nonlinear polarizability αααα(2) is a third-rank
tensor. The quantum mechanical description enters in how we relate the response function
αααα(2)(2ω=ω+ω ) to the underlying properties of the material.
We can obtain an expression for the second-order nonlinear polarizability by application
of second-order perturbation theory with the light-matter interaction treated as the perturbation.
Within the electric-dipole approximation, the interaction Hamiltonian can be taken as Hint=
−µµµµ⋅E(t), where µµµµ = −−−− er denotes the electric-dipole operator and E(t) the electric field of the
driving laser beam. Using the standard density-matrix formalism for second-order perturbation
theory, one calculates for the Cartesian components )2(ijkα of the tensor αααα(2) as
8
)0(
,,2
)2( ...))(2(
)()()(1)2( g
nng gngnngng
gnknnjgniijk ii
ρωωωω
µµµωωωα ∑
′ ′′
′′ +Γ+−Γ+−
−=+= h . (9)
In this expression, the letters g, n′, and n represent energy eigenstates g , n′ , and n of the
system, with )0(gρ corresponding to the thermal population for differing available ground states g.
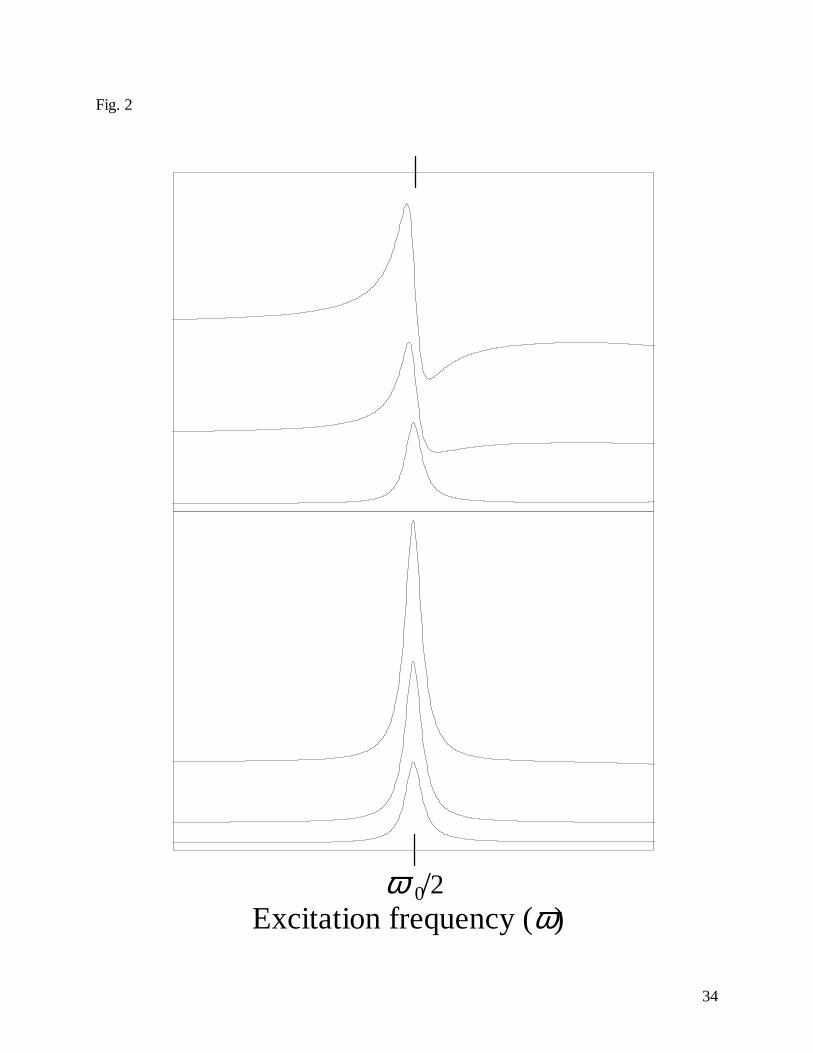
As illustrated in Fig. 3, the SHG process can be regarded as involving a series of three
transitions: two transitions associated with the absorption of two pump photons, each of energy ħω, and a transition associated with emission of a second-harmonic photon of energy 2ħω.
These transitions occur through the electric-dipole operator µµµµ and are characterized by the matrix
elements (µi)gn. In Eq. (9), the energy denominators involve the energy differences
gnng EE −≡ωh and widths ngΓh for transitions between eigenstates |nÚ and |gÚ, and similarly for
other combinations of states. In addition to the term indicated explicitly in Eq. (9), there are
several other very similar terms with different Cartesian coordinates in the matrix elements
and/or frequency denominators.
The frequency denominators in the eight terms of Eq. (9) introduce a resonant
enhancement in the nonlinearity when either the fundamental frequency ω or the SH frequency
2ω coincides with a transition from a ground state |gÚ to one of the intermediate states |n′Ú or |nÚ. Fig. 3a shows the situation for a non-resonant nonlinear response, while Figs. 3b and 3c
illustrate, respectively, single and two-photon resonances. The numerator in the perturbation
theory expression consists of products of the three dipole matrix elements of the form
(µi)gn(µj)nn′(µk)n′g. These terms reflect the structure and symmetry of the material that is built into
the third-rank tensor )2()2( ωωωα +=ijk .
9
The surface nonlinear response
As a model of the surface nonlinearity, let us consider a monolayer of oriented molecules.
The surface nonlinear response accessible to a macroscopic measurement is given, under the
neglect of local-field effects, simply by summing the response of the individual molecules. The
resulting surface nonlinear susceptibility tensor)2(,ijksχ connecting the induced nonlinear sheet
polarization to the driving field electric field can then be expressed as
)2(
0
)2(, λµννµλ α
εχ kji
sijks TTT
N= . (10)
Here Ns denotes the adsorbate surface density, )2(λµνα the nonlinear polarizability of the molecule
expressed in its own coordinate system, λiT the transformation tensor from the molecule’s
coordinate system to the laboratory frame, an ensemble average over the orientation of the
different molecules in the monolayer, and ε 0 = 8.85 × 10⁻¹² F/m the permittivity of free space.
This expression for the surface nonlinear susceptibility has been successful in describing
properties of adsorbed molecules, including their coverage, orientation, and spectroscopic
features.
For the surfaces of materials such as semiconductors or metals with delocalized
electronic states, a somewhat different formulation of the nonlinear response is appropriate. A
modified version of Eq. (9) can be obtained using the relevant band states. The underlying
concepts involved in the surface nonlinear response are, however, similar to those presented for
the molecular case.
Regardless of the details of the model describing the surface nonlinear susceptibility, its
tensor properties must reflect the symmetry of the interface. In that respect )2(, ijksχ is quite

10
analogous to the bulk nonlinear response, )2(ijkχ , in a non-centrosymmetric medium. In the
absence of any symmetry constraints, )2(sχ will exhibit 3×3×3 = 27 independent elements for SFG
and DFG. For SHG, the order of the last two indices has no significance, and the number of
independent elements is reduced to 18. If the surface exhibits a certain in-plane symmetry, then
the form of )2(sχ will be simplified correspondingly. For the common situation of an isotropic
surface, for example, SHG possesses 3 allowed elements of )2(sχ and may be denoted as )2(
, ⊥⊥⊥sχ ,
)2(||||,⊥sχ , )2(
||||, ⊥sχ = )2(||||, ⊥sχ , where ⊥ corresponds to the direction of the surface normal and || to an
in-plane direction. The nonvanishing elements of )2(sχ for other commonly encountered surface
symmetries are summarized in several textbooks and reviews listed below.
Radiation properties for surface SHG
In order to probe and extract information from interfaces through surface SHG, it is
necessary to understand how radiation interacts with the relevant media and gives rise to the
experimentally observable signals. Here we present the principal results for the usual case of a
spatially homogeneous planar interface. Non-planar and inhomogeneous geometries, which are
also of considerable interest, will be considered briefly under the heading of applications of the
SHG technique below.
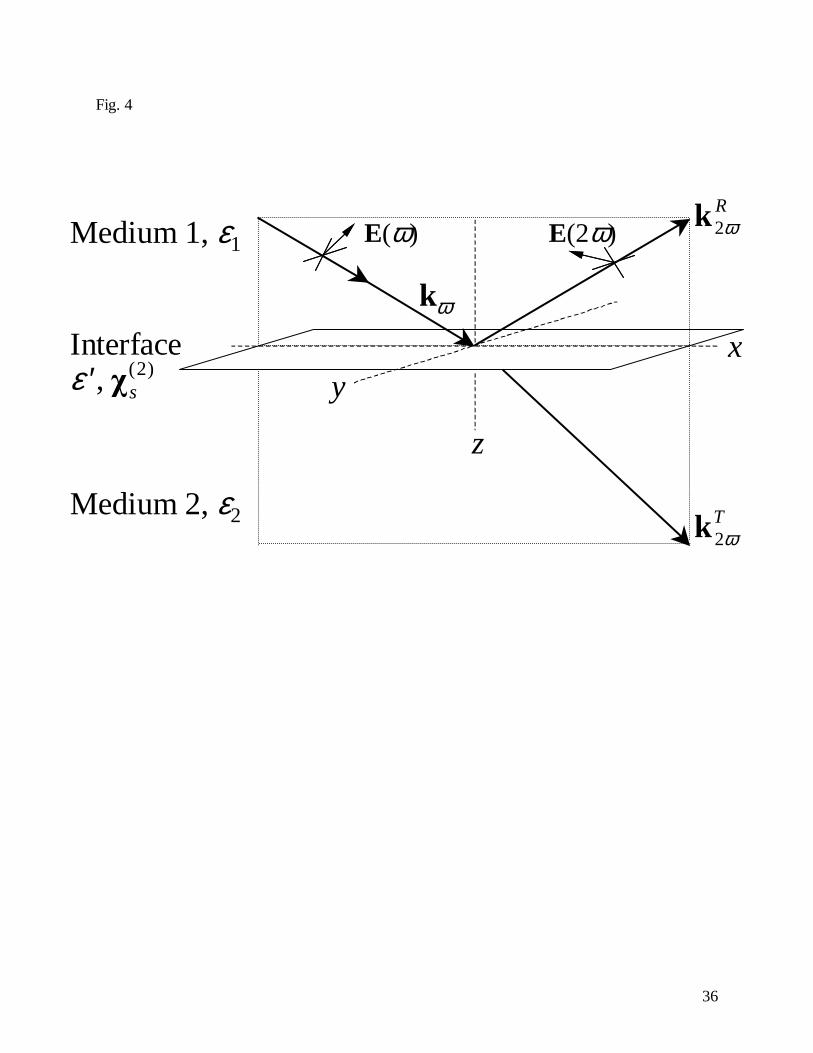
The SHG process is coherent in nature. Thus, for the planar geometry, a pump beam
impinging on the interface will give rise to a well-collimated SH radiation emerging in distinct
reflected and transmitted directions. To describe this situation in a more detailed fashion and
provide formulas for the radiation efficiency, we introduce a general description of SHG by a
planar interface excited by a plane wave, as shown in Fig. 3. The nonlinear response of the
11
interface described by the surface nonlinear susceptibility tensor )2(sχ is incorporated through a
nonlinear source polarization )2(P of
)()()(:)2()()2()2( )2(0
)2()2( zz ss δωωωωωεδωω EEχPP +=== (11)
localized at the interface (z = 0). In addition to the strong nonlinear response at the interface,
one must also generally consider the non-local nonlinear response of the bulk media. This
response is much weaker than the symmetry-allowed interfacial response, but is permitted even
in centrosymmetric materials. Since it is present in a much larger volume, however, its
cumulative effect, while generally weaker than the surface response, may be of comparable
magnitude. For simplicity, however, we neglect this constant background response in our
discussion in this article, but a complete discussion can be found in the referenced works. The
overall SH response is naturally also influenced by the linear optical properties of the
surrounding media. The two bulk media and the interfacial region are characterized, respectively,
by frequency-dependent dielectric functions ε1, ε2, and ε′, as shown in Fig. 3. Again for
simplicity, and in accordance with most applications, we take the linear response to be isotropic.
Fig. 3 shows the incoming pump radiation and the reflected and transmitted SH beams.
The directions of these beams are determined by conservation of the component of the
momentum parallel to the interface in the SHG process, i.e., 2kω,|| = R||,2ωk = T
||,2ωk . Thus the
reflected and transmitted beams both remain in the plane of incidence, with directions governed
by the so-called nonlinear Snell’s law. For bulk media without dispersion between the
frequencies of ω and 2ω, the reflected and transmitted beams simply maintain the same angle of
incidence as the pump beam. However, for dispersive bulk media, the directions of the beams
are, however, altered, as can be understood immediately from writing 2kω / k2ω = nω / n2ω, where
12
n denotes the refractive index of the medium. The surface SHG process does, nonetheless, differ
in an important respect. In contrast to the situation for bulk media, the interfacial region is of
negligible thickness, so phase shifts can obviously be disregarded. The issue of phase matching,
which is of great significance for SHG from bulk media, consequently does not enter into the
surface SHG problem.
By application of the Maxwell equations with the indicated nonlinear source polarization,
one can derive explicit expressions for the SH radiation in terms of the linear and nonlinear
response of the materials and the excitation conditions. For the case of the nonlinear reflection,
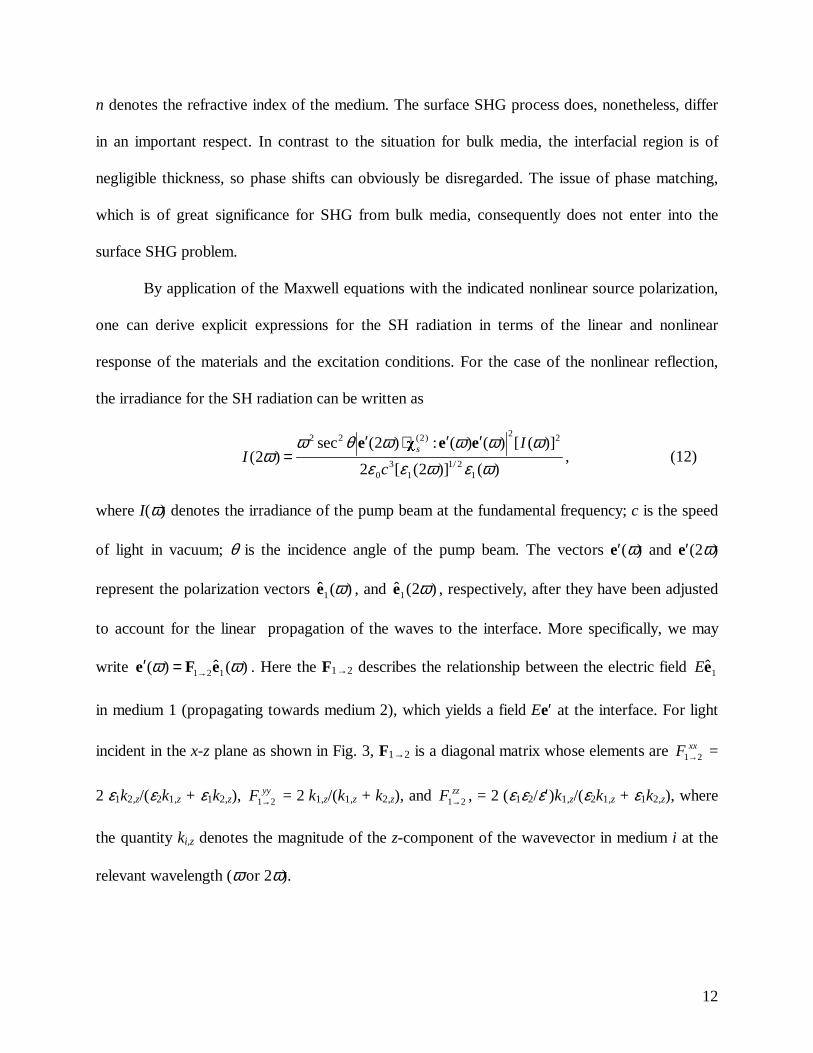
the irradiance for the SH radiation can be written as
)()]2([2
)]([)()(:)2(sec)2(
12/1
13
0
22)2(22
ωεωεεωωωωθω
ωc
II
s eeχe ′′⋅′= , (12)
where I(ω) denotes the irradiance of the pump beam at the fundamental frequency; c is the speed
of light in vacuum; θ is the incidence angle of the pump beam. The vectors e′(ω) and e′(2ω)
represent the polarization vectors )(ˆ1 ωe , and )2(ˆ1 ωe , respectively, after they have been adjusted
to account for the linear propagation of the waves to the interface. More specifically, we may
write )(ˆ)( 121 ωω eFe →=′ . Here the F1→2 describes the relationship between the electric field 1eE
in medium 1 (propagating towards medium 2), which yields a field Ee′ at the interface. For light
incident in the x-z plane as shown in Fig. 3, F1→2 is a diagonal matrix whose elements are xxF 21→ =
2 ε1k2,z/(ε2k1,z + ε1k2,z), yyF 21→ = 2 k1,z/(k1,z + k2,z), and zzF 21→ , = 2 (ε1ε2/ε′)k1,z/(ε2k1,z + ε1k2,z), where
the quantity ki,z denotes the magnitude of the z-component of the wavevector in medium i at the
relevant wavelength (ω or 2ω).
13
A few observations may be made about Eq. (12), which describes the relationship
between the typical experimental observables of the pump irradiance, I(ω), and the irradiance of
the emitted SH reflection, I(2ω), from the interface. First, one can immediately recognize the
quadratic relationship between the pump irradiance and the SH irradiance that is expected for a
second-order nonlinear optical effect. Second, the SH radiation is determined not only by the
nonlinear optical response, but by the linear optical properties of the relevant media.
Consequently, obtaining the surface nonlinear susceptibility tensor )2(sχ from experiment
requires knowledge or measurement of the linear response. (It should be noted, however, the
interfacial linear properties always enter into the response in a fixed manner and can be
incorporated into an effective surface nonlinear response.) The linear response can significantly
enhance or reduce the efficiency of the SHG process. The use of a total-internal reflection
geometry, for example, provides a significant enhancement in the SH radiation through the linear
optical response of the media. Third, while full knowledge of the linear and nonlinear response
will obviously allow one to predict the strength of the SH radiation for any conditions, a simple
measurement of the SH response does not permit one to determine )2(sχ , even if the linear optical
properties are known. The determination of the tensor )2(sχ requires probing the material with
different polarization states and/or angles of incidence. Protocols for making these measurements
have been discussed extensively in the literature. For the general case of a material with in-plane
anisotropy, such as the surface of a crystal, measurements of the response as the crystal is rotated
about its surface normal are also very useful in a complete determination of )2(sχ . Fourth, the
simple measurement of the SH intensity as assumed here obviously eliminates information about
the overall phase of the )2(sχ . This phase information is often of considerable interest and
14
importance. For example, if the response of the interface is dominated by an oriented molecular
monolayer, the sign of )2(sχ will be inverted if the monolayer is reflected through the plane of the
surface, i.e., the phase of )2(sχ yields information on the polar ordering of the layer. To obtain
such phase information, one must employ a scheme using interference with a known SH
reference. This approach, which is sketched briefly in the next section, is implemented quite
commonly in experiment.
Experimental Considerations
The merits of the SHG technique for selective probing of interfaces are clear. On the
other hand, one needs to be able to detect the optical signal associated with a second-order
nonlinear response of a material that arises from an effective thickness of just a monolayer or so.
Consequently, it is important to consider various factors that aid in optimizing the strength and
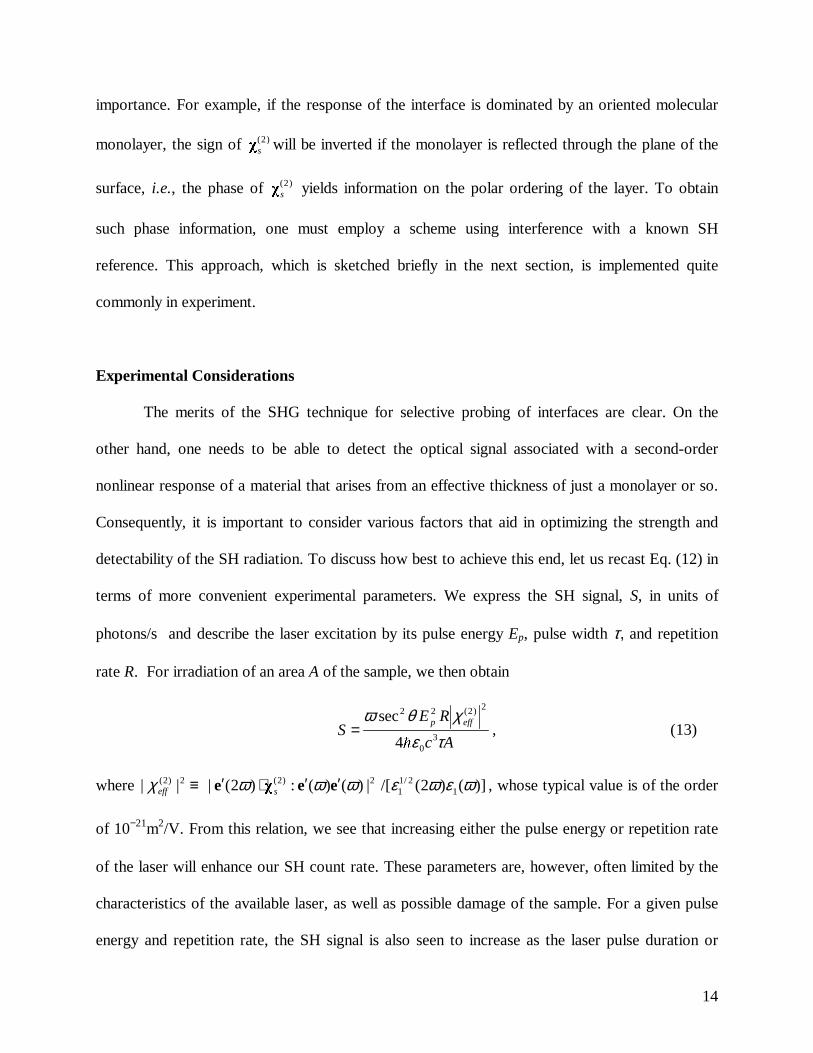
detectability of the SH radiation. To discuss how best to achieve this end, let us recast Eq. (12) in
terms of more convenient experimental parameters. We express the SH signal, S, in units of
photons/s and describe the laser excitation by its pulse energy Ep, pulse width τ, and repetition
rate R. For irradiation of an area A of the sample, we then obtain
Ac
RES
effp
τεχθω
30
2)2(22
4
sech= , (13)
where 2)2( || effχ ≡ )]()2(/[|)()(:)2(| 12/1
12)2( ωεωεωωω eeχe ′′⋅′ s , whose typical value is of the order
of 10−21m2/V. From this relation, we see that increasing either the pulse energy or repetition rate
of the laser will enhance our SH count rate. These parameters are, however, often limited by the
characteristics of the available laser, as well as possible damage of the sample. For a given pulse
energy and repetition rate, the SH signal is also seen to increase as the laser pulse duration or
15
sample area is decreased. In practice, adequate SH signals can generally be obtained from high
power Q-switched lasers (with nanosecond pulses) with a fairly large focal spot. A preferred
solution in most cases is, however, provided by modelocked lasers with high repetition rate and
pulses of sub-picosecond duration. Surface SH signals obtained, for example, using a
femtosecond modelocked Ti:sapphire oscillator, are typically in the range of 102 -106 photons/s.
Although these signals are relatively weak, they are easily detectable with photomultiplier tubes
(PMT) and appropriate electronics.
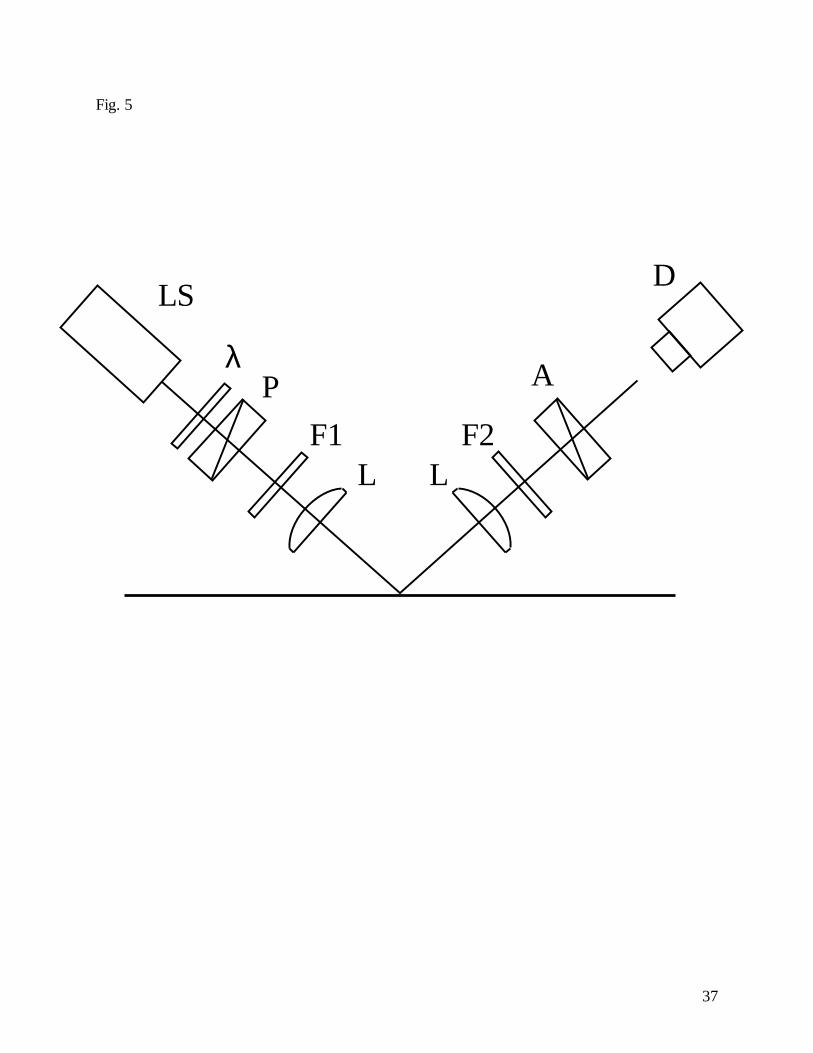
The basic arrangement for surface SHG measurements is shown in Fig. 5. It makes use of
the directionality and frequency selectivity of the SHG process not only to detect the desired
signal with high efficiency, but to discriminate strongly against background signals, including
the reflected laser beam. In the setup, irradiation of the sample involves a pulsed laser source,
LS; a halfwave plate, λ, and polarizer, P, for controlling the input polarization. Spectral control is
achieved with a filter F1 that passes the fundamental radiation in the pump beam, but rejects
other wavelengths, particularly spurious SH radiation arising from other optical components; and
a color filter F2 that passes SH, but rejects the reflected fundamental radiation. In addition, a
spectrometer is commonly employed to limit the detection bandwidth further. An analyzer A
serves to select the desired SH polarization. The SH signal is then measured by a high-quantum
efficiency detector and the signal is monitored by processing electronics, typically a photon
counter, a gated integrator, or a lock-in amplifier, depending on the strength of the signal and the
repetition rate of the laser. The laser source may be either of fixed wavelength or tunable for
spectroscopic measurements.
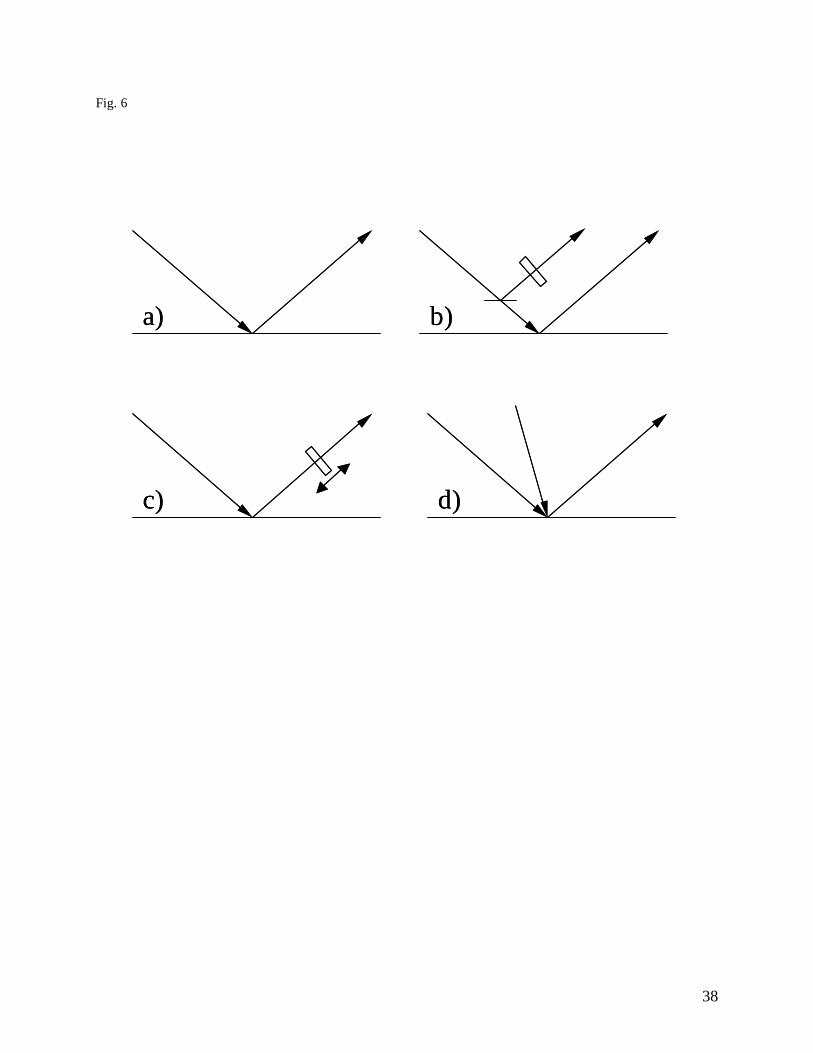
There are other important experimental configurations for surface SHG that extend
beyond the basic SH reflection geometry, shown schematically in Fig. 6a. A common
16
improvement (Fig. 6b) is the implementation of a SH reference in which a small fraction of the
pump radiation is directed into a crystal with a bulk second-order nonlinear response. This
approach provides a reference against which to compare the measured signal that compensates
appropriately for pulse-to-pulse variation in duration, energy, and spatial profile, as well as long-
term drifts. This type of normalization (against a material with a suitably flat spectral response)
is essential for spectroscopy measurements in which the laser frequency is scanned. In addition,
use of a calibrated reference is the best way of determining the surface nonlinear response in
absolute terms.
It may also be desirable to measure the phase of the signal. For this type of an
experiment, a reference field, Eref(2ω), of similar amplitude and known phase response is
generated along the path of the surface SH signal E(2ω) (Fig. 6c). The two collinear SH beams
of the same polarization interfere at the detector. The SH power scales as |Eref(2ω)+E(2ω)|2 =
|Eref|2 + 2ErefE
cosϕ + |E|2, where ϕ is the relative phase of the two fields. The relative phase ϕ
may be varied by translating a reference plate along the path of the beam and making use of the
dispersion of the ambient air or by inserting another control phase-shifting element. A variant of
this phase measurement method is the homodyne scheme in which the reference electric field
amplitude Eref(2ω) is significantly stronger than that of the signal amplitude E(2ω). The
measured SH power, then scales as |Eref|2 + 2ErefE
cosϕ, which yields a signal that varies linearly
with the desired SH field strength from the sample.
In the SHG technique, a short-pulse laser is used to interrogate the sample and thus the
measurement provides high time-resolution. To make use of this capability, we can add a pump
pulse to excite the sample away from equilibrium. This provides the opportunity to examine
ultrafast surface dynamics induced by excitation of the sample with a suitable pump laser pulse.
17
For such measurements (Fig. 6d), the pump pulse is generally derived from the same laser source
as the probe for the SHG measurement, although one or both of these pulses may undergo
frequency conversion before being applied to the surface. The critical element is that time
synchronism is maintained. The dynamics can then be followed by repeating the SHG
measurement at various time delays relative to pump excitation, as controlled by an optical delay
line. The ultimate time resolution of this technique is limited only by the duration of the laser
pulses and may be as short as a few femtoseconds with state-of-the-art modelocked lasers.
Applications of Surface SHG
The technique of surface SHG is extremely flexible in application, since it relies only on
basic symmetry properties for its remarkable surface or interface specificity. SHG measurements
can provide quite varied information about the interface, depending on the mode of application
of the technique and the material system under study. In this section, we attempt to illustrate the
principal types of measurements that can be performed with SHG and the information that can be
obtained thereby. For systems with molecular adsorbates, SHG studies can yield information on
the density and orientation of molecular species, and can typically do so in real time. For
crystalline surfaces, the symmetry and order of the surface can be examined through studies of
tensor properties of the surface nonlinear susceptibility. Spectroscopic studies of electronic
transitions are also of great value. These can be accomplished for both solids and molecular
systems through the same experimental approach of tuning the frequency of the laser source. In
all of these investigations, one can achieve very high time resolution, down into the femtosecond
range, by the use of pump-probe techniques. In addition, as we discuss below, SHG provides

18
interesting additional capabilities for systems with applied electric and magnetic fields. Finally,
the method permits one to probe spatially inhomogeneous systems.
In addition to this diverse range of information that can be provided by surface SHG
measurements, the technique is unique in the extremely wide range of material and chemical
systems to which it can be – and, indeed, has been – applied. These span the gamut from solids
under ultrahigh vacuum to solid/solid, solid/liquid, liquid/vapor, and even liquid/liquid
interfaces. Since our examples were drawn to illustrate the type of information obtainable, rather
than the range of material systems investigated, the reader is unfortunately obliged to refer to
other more detailed treatments of surface SHG measurements to appreciate fully this important
facet of the technique.
Adsorbate density
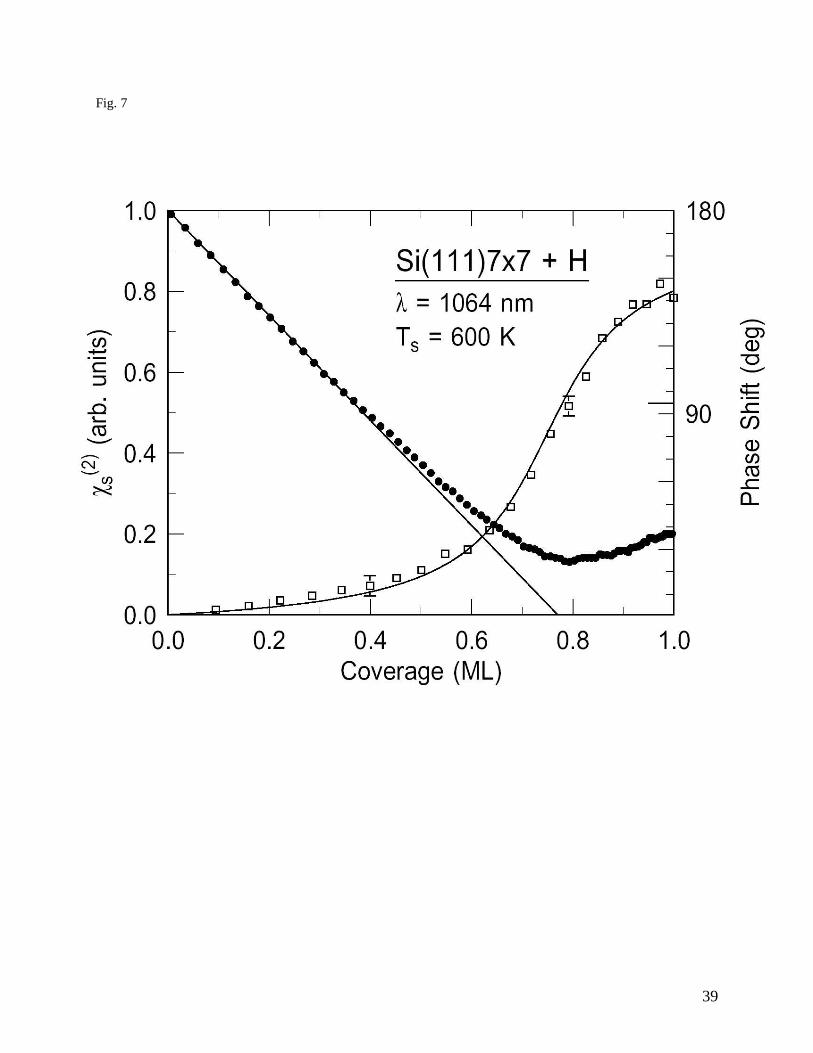
The remarkably high sensitivity of the SHG technique to the nature of the surface is
illustrated by the data in Fig. 7, which shows the dramatic change in the SH response from a
clean Si(111)-7x7 surface upon adsorption of atomic hydrogen. Indeed, it is possible to detect
well below 1% of a monolayer (ML) of adsorbed hydrogen. A useful point to note is that the
change in )2(sχ is linear with adsorbate density for modest values of the coverage, θ. Thus, it is
quite easy to obtain a relative gauge of the adsorbate coverage in this regime.
The behavior of the SH response to adsorbates at low coverages can often be described
by a simple linearized model of the surface nonlinear susceptibility of )2(sχ = )2(
2,)2(
1,)1( ssa θχχθ +− ,
where )2(,isχ (i = 1, 2) are complex quantities and a is a constant. This relation describes the
surface nonlinear susceptibility as arising from a contribution )2(1,sχ from the clean surface and a
19
contribution )2(2,sχ from a saturated monolayer (θ = 1) of the adsorbate. The term )2(
1,saθχ− then
represents the modification of the surface nonlinearity arising from interaction with the
adsorbate. For the case of hydrogen adsorption of Fig. 7, this is the dominant term, since
hydrogen atoms would have no nonlinearity on their own. In other systems, however, the
response can be considered as arising essentially from the nonlinear response of aligned
adsorbed molecules. The simple linearity of this relation of )2(sχ with adsorbate coverage
obviously neglects important effects such as adsorbate-adsorbate chemical interactions, as well
as local field effects and the possible influence of differing adsorption sites. All of these factors
have been considered in the literature. Nonetheless, the linearity of response with adsorbate
coverage is often found to be a good approximation, even for fairly high adsorbate coverages.
From the point of view of simply following adsorption dynamics with SHG, it is not, we note,
necessary to have any a priori knowledge of the relation between the adsorbate coverage and the
SH response. This relation can be established empirically in static measurements and then used
advantageously to follow the dynamics of surface processes.
Surface symmetry and molecular orientation
The surface SHG process is described by the third-rank tensor )2(sχ . The tensorial
properties of this response reflect the symmetry of the surface. Other than for a few cases of high
symmetry, such a third-rank tensor gives a distinct signature of surfaces with crystalline order
compared to surfaces, such as disordered ones, exhibiting effective in-plane isotropy. The form
of the )2(sχ tensor can be probed both by measurements that vary the polarization of the
fundamental and second-harmonic beams and by measurements in which the plane of incidence
20
is changed with respect to the orientation of the surface, generally by rotating the sample about
its normal with a fixed experimental geometry.
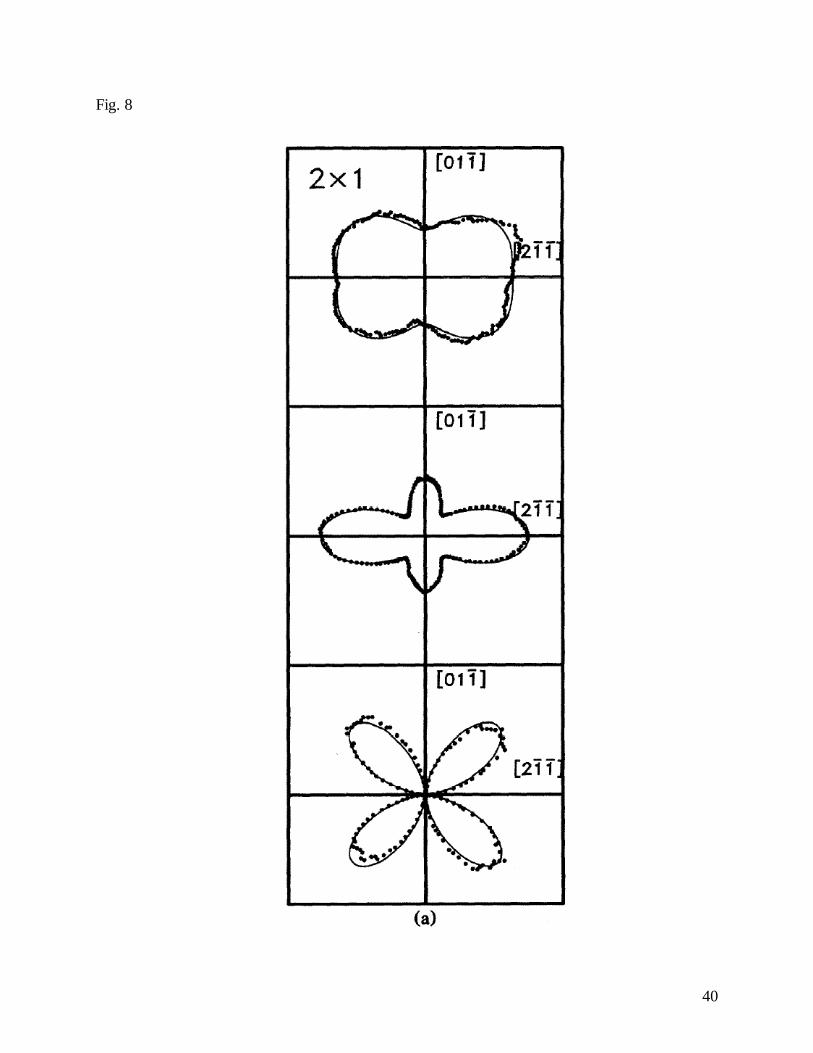
Fig. 8 illustrates the capability of surface SHG measurements to probe surface symmetry.
The figure shows SHG polarization dependence for a Si(111) surface cleaved in ultrahigh
vacuum. While the underlying bulk symmetry suggests that the surface might exhibit 3m
symmetry, the data clearly indicate that only a single mirror m plane is present. This lowered
symmetry corresponds to the metastable 2×1 reconstruction induced by the crystal cleavage. By
heating the sample, one can observe a phase transformation to the equilibrium 7×7 reconstruction
and the emergence of the corresponding 3m surface symmetry.
The analysis of surface or interface symmetry by SHG relies only on the form of the
nonlinear susceptibility tensor, i.e., which elements are independent and nonvanishing. Within
the context of a microscopic model of the surface response, however, the relative values of the
tensor elements of )2(sχ can also yield valuable information about the nature of the surface. This
approach has been developed extensively in the context of the analysis of molecular orientation
at surfaces. The basic notion behind this treatment relies on the knowledge of the microscopic
molecular nonlinear polarizability )2(λµνα and the measured surface nonlinear susceptibility )2(
, ijksχ
to infer information about the orientational average that relates these quantities. As discussed
above in conjunction with Eq. (10), under the neglect of local-field corrections, the relationship
between these two quantities involves the ensemble average of the coordinate transformation
tensor from the molecular to the laboratory coordinate systems νµλ kji TTT . Hence a knowledge
of the quantities )2(λµνα , Ns, and )2(
, ijksχ allows us to infer information about the orientational
distribution of the molecules as described by the quantity νµλ kji TTT . Even in the absence of
21
knowledge of the magnitudes of the nonlinear polarizabilities and the adsorbate density, one may
still obtain useful information for molecules with a simple form of )2(λµνα .
An important example of this analysis of molecular orientation concerns the case of
molecules with a dominant nonlinear polarizability along a single axis, i.e., αααα(2) = α(2)z′z′z′ 'ˆ'ˆ'ˆ zzz .
For the usual situation of in-plane isotropy, one can then show that the nonlinear susceptibility
elements are given by )2(, ⊥⊥⊥sχ = 0
)2(3 /cos εαθ zzzsN ′′′ and )2(||||,
)2(||||, ⊥⊥ = ss χχ =
0)2(2
21 /sincos εαθθ zzzsN ′′′ , where θ denotes the angle between the surface normal and the z’
molecular axis. It should be noted that these orientational moments, reflecting their origin in a
third-rank tensor, give a signature of the polar ordering, since a sign change in the elements of
)2(sχ follows if the molecular orientation is inverted. Also, when only one element of αααα(2) is
present, we can form ratios of the experimentally measurable ratio of tensor elements that
depend only on the molecular orientational factors, such as R ≡ )2(,
)2(,
)2(||||, /)2( ⊥⊥⊥⊥⊥⊥⊥ + sss χχχ =
θθ 3cos/cos . For a narrow distribution of the orientations centered at θ0, this ratio yields
directly the molecular orientation angle through R ≈ sec2θ0.
This type of molecular orientation analysis has been applied to a wide range of material
systems. The method, while powerful, relies on several assumptions, including an adequate
knowledge of the molecular nonlinear polarizability, the lack of significant local field
corrections, the availability of information about the effective linear dielectric constant in the
interfacial region, and a suitable method of eliminating any substrate nonlinear response in the
measurement. The method is, consequently, best suited for adsorbed layer of molecules with
strong and well-defined nonlinear response, present at relatively modest coverages. The use of
resonant excitation is a valuable adjunct in these studies, since it generally simplifies the form

22
and strengthens the molecular nonlinear response. An analogous approach to the analysis of
molecular orientation can be accomplished with infrared-visible sum-frequency generation.
These measurements often provide a superior method of analysis, since the molecular response
and its symmetry are better defined by resonant excitation of a molecular vibration.
Surface and interface spectroscopy
Surface SHG can be readily adapted to yield spectroscopic information on surface
transitions. As indicated above, both resonances at the fundamental and second-harmonic
frequencies are manifested in the SHG response. The examination of resonances at the SH
frequency is often convenient, since it permits the application of a relatively intense pump
radiation at a frequency well separated from that of the resonance. Such SHG spectroscopy
measurements have been widely applied to examine electronic transitions at surfaces and
interfaces of solids, as well as in adsorbed molecules under a wide variety of conditions.
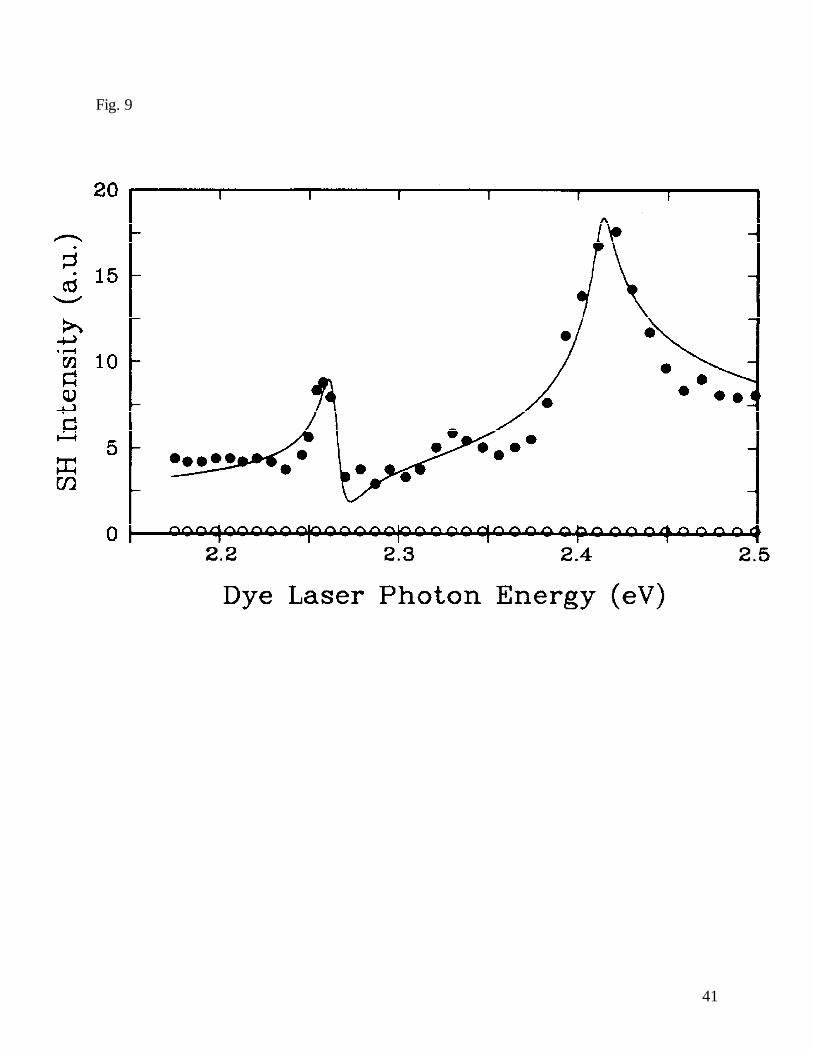
An example of SHG spectroscopy of electronic transitions at a buried solid/solid interface
is presented in Fig. 9. For the epitaxial CaF2/Si(111) interface, distinctive new electronic
transitions, associated with interface states, are observed that are absent from the response of
either of the bulk materials. These excitations occur in a spectral range where the bulk silicon
sample is highly absorbing, which would render the identification of the new interface transitions
very difficult using conventional linear optics. The buried nature of the interface naturally also
constrains application of conventional surface probing techniques involving electron irradiation
or emission. Two additional general observations are appropriate. First, the lineshape analysis for
such measurements must take into account the fact that the SHG response derives from both the
real and imaginary parts of )2(sχ , as we discussed above. Second, in the absence of any other

23
knowledge, SHG spectroscopic data contain an ambiguity about whether the resonances
correspond to the fundamental or SH photon energy. This ambiguity, however, can be resolved
in a straightforward fashion by complementing the SHG measurement with a sum-frequency
measurement in which one frequency is scanned and one is held fixed, as was demonstrated in
the study associated with Fig. 9.
Time-resolved measurements
One of the fascinating frontiers that can be addressed by SHG measurements is probing
the ultrafast dynamics of surfaces and interfaces by the pump-probe method. This possibility is
exemplified by a variety of studies ranging from the dynamics of laser-driven phase transitions,
charge-transfer, solvation, phonon dynamics, and orientational and torsional dynamics.
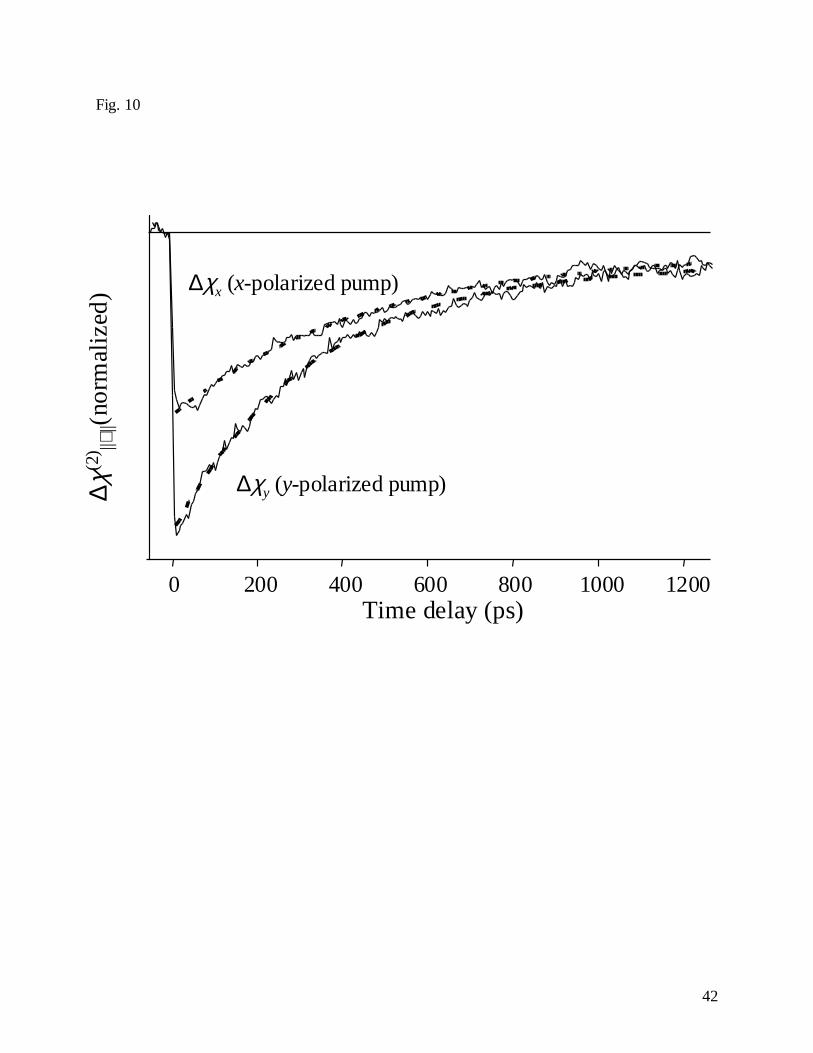
An example of applying time-resolved SHG to examine ultrafast molecular dynamics at
the liquid/vapor interface of water is presented in Fig. 10. In these studies, the rotational motion
of dye molecules at the interface, which probes the local environment, is followed in real time.
This is accomplished by photo-exciting the dye molecules at the interface. Because polarized
pump radiation is used, an anisotropic orientational distribution of excited-state molecules is
established. Since the excited molecules have a different SHG response, a change in the signal is
observed immediately. Subsequently, the anisotropic orientational distribution relaxes to the
equilibrium configuration. The time evolution of the rotational anisotropy is followed by
detecting the SH of a probe laser pulse as a function of the delay time. Through a comparison of
the results for different initial anisotropic distributions (produced by pump beams with differing
polarizations), one may deduce rates for both in-plane and out-of-plane orientational relaxation.

24
This example illustrates the possibilities of time-resolved SHG measurements for probing the
detailed dynamics of molecules at an interface on the ultrafast time scale.
Spatially-resolved measurements
Up to this point, our discussions have centered on spatially homogenous surfaces and
interfaces. Surface SHG has also been exploited to probe the lateral variation of inhomogeneous
surfaces with the micron to sub-micron resolution characteristic of optical microscopy
techniques. Spatial resolution may be achieved simply by detecting the nonlinear response with a
focused laser beam that is scanned across the surface. A large area of the surface may also be
illuminated and the emitted nonlinear radiation imaged. A wide range of applications of this
imaging capability has emerged, including the probing of biological materials, such as cells and
tissues, to probing spatially varying electric fields and magnetic domains. Within the biological
context, SH microscopy has recently become an active research direction. In these applications,
while probing with SHG typically senses non-centrosymmetric structures in bulk samples as
opposed to interfaces, most of the aspects of SHG presented in this article still apply. To further
improve the spatial resolution of SHG microscopy, researchers have also employed near-field
techniques for spatial resolutions below the diffraction limit.
Complementary approaches to the real-space imaging just described have also been
developed based on SH diffraction. In this scheme, periodically modulated surfaces are
established holographically on a surface by utilizing two interfering laser beams. In addition to
the reflected and transmitted SH beams, additional beams are then generated at well-defined
angles as dictated by the grating period. This approach has been used to monitor the relaxation of

25
a monolayer grating of adsorbates in time, which yields precise information on the rate of
adsorbate surface diffusion.
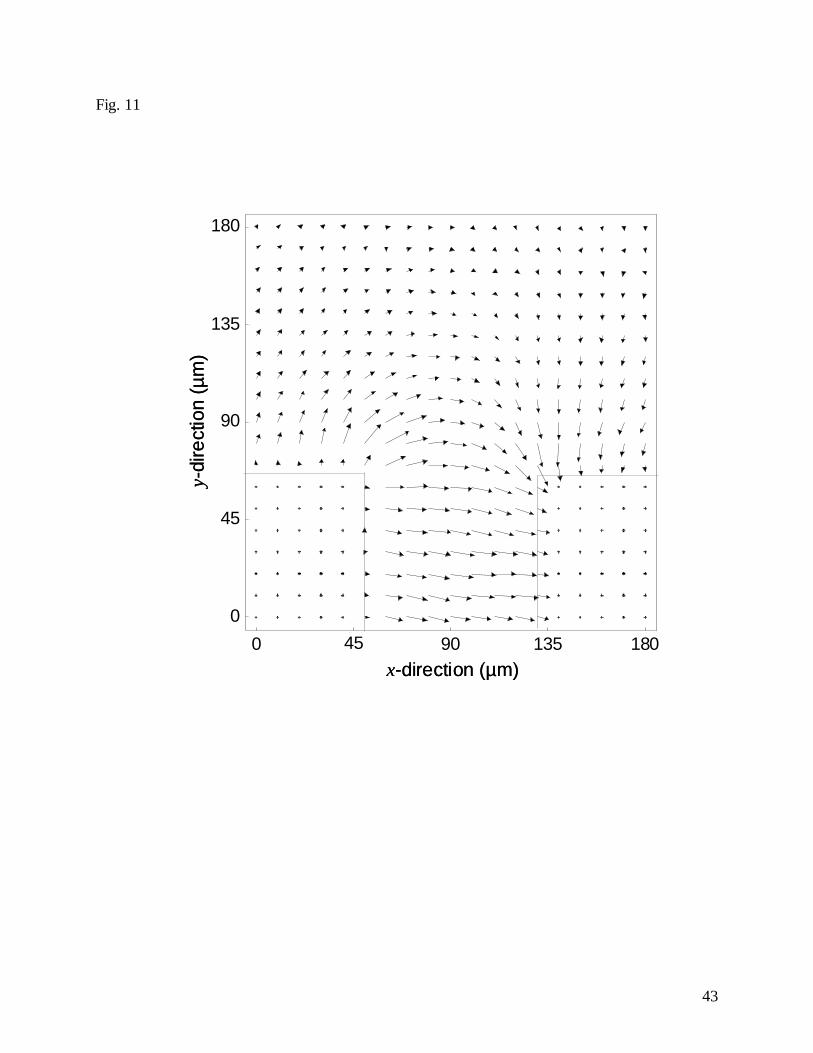
Probing electric fields at interfaces
For centrosymmetric media, the SHG process shows a high degree of sensitivity to the
presence of electric fields. This property follows from the fact that an applied electric field can
break the inversion symmetry, just as an interface does. The resulting process, termed electric
field-induced SHG (or EFISH), has been known for many years. From a phenomenological
standpoint, it can usually be described as a nonlinear response of the form P(3)(2ω) =
ε0χχχχ(3):E(ω)E(ω)E, where E is the electric-field being probed and E(ω) is the laser pump field.
Within the context of surfaces and interfaces, there are many circumstances where probing such
electric fields is of interest and importance. The SHG technique provides high sensitivity, good
spatial resolution, accessibility to buried interfaces, and, in the pump-probe implementation,
extremely high time resolution. In addition, with appropriate measurements of the polarization
dependence and homodyne detection, the full vector character of the electric field can be
determined.
The behavior of electric-field induced SHG is similar to that arising from the asymmetry
of an interface. Indeed, it is formally equivalent to the response of an interface provided that the
electric field is present in (or radiates from) a region of less than a wavelength’s thickness. The
applications of this measurement capability are quite diverse, ranging from studies of charging
and acid/base reactions at liquid/solid interfaces to probing fields in metal-oxide-semiconductor
structures and Schottky barriers to the measurement of freely-propagating terahertz radiation. In
Fig. 11, SHG with appropriate polarization control and homodyne detection scheme has been

26
applied to the measurement of the vector character of electric fields present in a dc-biased dipole
structure on silicon. By spatially scanning the laser beam, a two-dimensional electric field map
can be produced. In a pump/probe scheme, the same measurements can be made with
femtosecond time resolution.
Probing magnetization at interfaces
In contrast to the application of an external electric field (a polar vector), the presence of
an external magnetic field (an axial vector) does not break the inversion symmetry of a material.
Thus, SHG retains its interface selectivity for magnetic effects. SHG measurements, as an
interface specific probe, thus provide an excellent complement to the linear magneto-optical Kerr
effect (MOKE), which is sensitive to magnetic effects within the penetration depth of the light.
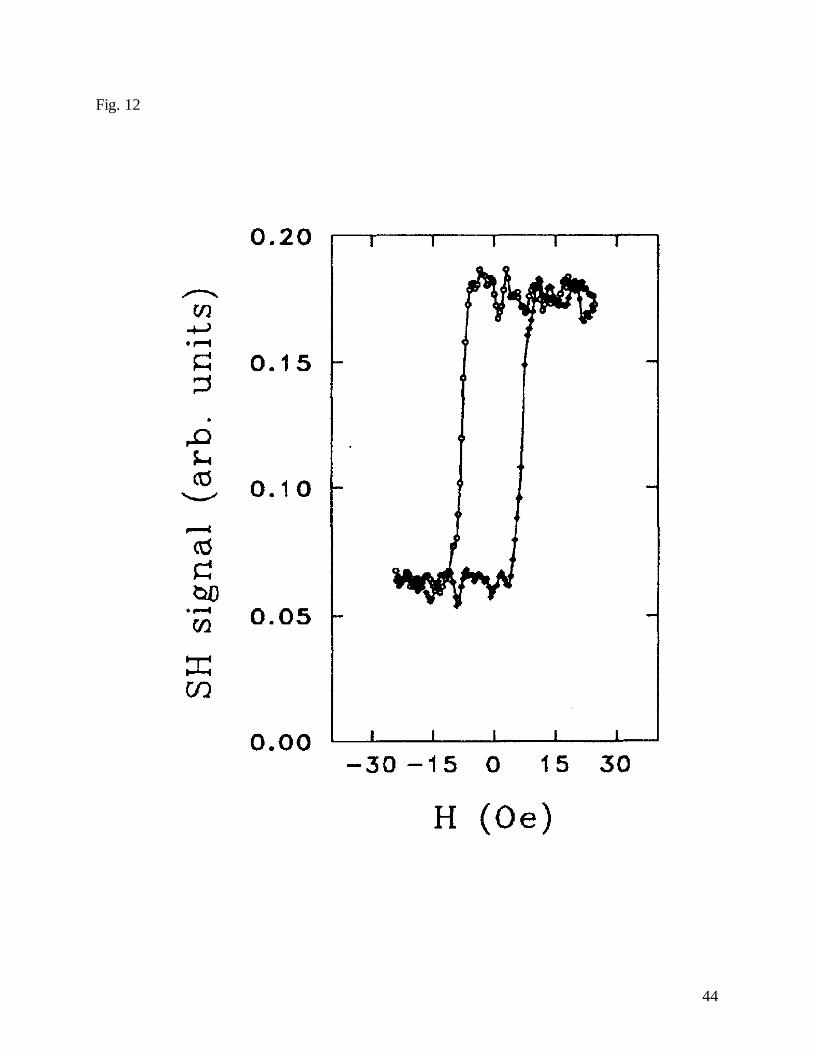
The ability of the SHG technique to sense the magnetization at a surface is illustrated in
Fig. 12 for a film of epitaxially-grown magnetic Co on nonmagnetic substrate Cu. A hysteresis
loop of the magnetization versus the strength of an applied magnetic field is shown, where the
magnetization is gauged from the SHG response. Through measurements of the response as a
function of the thickness of the magnetic film, the researchers demonstrated that the SH response
reflected the interface properties, rather than those of the bulk film.
Probing micro- and nanoscale structures
In addition to the microscopy studies described above that probe spatially
inhomogeneous surfaces, there has been considerable interest in SHG from a variety of strongly
textured surfaces and small particles. From the standpoint of the optical response of materials,
particular interest has been attached to studies of metallic surfaces with surface roughness. For

27
appropriate roughness of low-loss materials, such as silver, very significant local-field
enhancements can be achieved. Since these field enhancements enter into the strength of the SH
emission nonlinearly, overall enhancements in the SH power by several orders of magnitude
have been demonstrated. This provides both a useful method of study of such surface
enhancement effects and a scheme for amplifying the relatively weak surface nonlinear response.
Beyond these problems associated with roughened surfaces, considerable attention has
recently been directed towards the application of the SHG technique for probing micro- and
nano-scale particles. The fundamental principal of the interface selectivity of the SHG process
for such systems comprised of centrosymmetric materials remains unaltered. The interaction of
these particles with the radiation fields is, however, significantly modified. For the case of
particles of with dimensions of several optical wavelengths, the overall SHG signal strength may
be comparable to that from a corresponding area of a planar surface. The radiation pattern will,
of course, be strongly modified and will generally be diffuse in character. While this makes
detection (and background discrimination) somewhat more difficult than for the planar geometry,
many SHG measurements of surface and interface properties have been carried out in this
regime. As the particle size becomes progressively smaller, particles with overall inversion
symmetry begin to exhibit appreciable cancellation of the SH emission. Indeed, in the limit of
vanishing size, full cancellation is expected. This tendency is, however, offset by the increasing
surface-to-bulk ratio and the possibility of increasing the number of particles probed. It has been
demonstrated experimentally that the surfaces of particles in the nanometer length scale can
indeed be probed by SHG.
From the point of view of applications, this extension of the SHG technique to probe
micro- and nano-structured materials opens up a rich variety of new possibilities. Results have

28
been reported on metal and semiconductor nanoparticles in suspension, as well as on colloids of
minerals. In addition, liquid droplets have been investigated. Self-assembling structures such as
liposomes and vesicles have been examined. For these structures, many of the same capabilities
of SHG as demonstrated for the planar geometry, such as probing of adsorption and charging
effects, have been demonstrated. More uniquely, molecular transport through the liposome
membrane could also be observed and characterized. The possibility of extension of these
measurements to biological systems is of obvious interest and promise.
Concluding Remarks
In this article, we provided a brief review of surface SHG as a technique for interface-
specific probing of materials. In addition to discussing some of the fundamental ideas
underlying the method, we outlined the wide variety of information that may be obtained from
such measurements, ranging from surface symmetry and molecular ordering to interface
spectroscopy and ultrafast dynamics. While several aspects of the method have now become
quite well established, developments in widely available modelocked lasers with excellent
performance characteristics have greatly enhanced the ease of making surface SHG
measurements in a wide class of material systems. In addition, new developments and
applications of the method have continued to emerge apace. Of particular note in this regard are
applications to probe electric fields and magnetization at interfaces, as well as advances in the
use of the method for interface-specific probing of micro- and nanoscale structures. The sharp
increase in applications of SHG for probing systems of biological importance constitutes another
important development, and one with much promise for the future.

29
One of the authors (TFH) would like to acknowledge support for this work from the U.S.
Department of Energy, Office of Basic Energy Sciences, through the Catalysis Science Program.

30
Figure Captions
1. Real and imaginary components of the linear polarizability α(1)(ω) (top panel) and the
second-order nonlinear polarizability α(2)(2ω=ω+ω) (bottom panel) plotted versus frequency
according for the anharmonic oscillator model. For the SH response, the resonance features
at ω = ω0 and ω = ω0/2 correspond, respectively, to single-photon and two-photon
resonances.
2. SH spectra I(2ω) versus pump laser frequency ω corresponding to Fig. 1 in the vicinity of the
two-photon resonance, with and without the presence of a non-resonant (frequency-
independent) background: I(2ω) ~ |α(2)(2ω=ω+ω) + k|2, where k represents a constant
background and parametrized through k = m|α(2)(2ω=ω0)| and m is constant factor. Top
panel: m = 0, 0.5, 1 (bottom to top curves). Bottom panel: m = 0, 0.5i, i (bottom to top
curves). In the top panel, the upper two lineshapes were displaced vertically to distinguish
the three curves.
3. Quantum mechanical description of SHG process for the situations of a) nonresonant, b)
single-photon resonant, and c) two-photon resonant interactions. SHG occurs through
transition from the initial state electronic state g and a first intermediate staten′ , then to a
second intermediate state n , followed by a return to the initial state. The process is just a
parametric conversion of two photons at frequency ω into one photon at frequency 2ω.
4. Schematic representation of SHG at the interface between two centrosymmetric media. The
pump field E(ω) at frequency ω with corresponding wavevector kω is incident on the
interface from medium 1. The SH field E(2ω) at frequency 2ω is emitted in directions
described by the wavevectors kR2ω (reflected in medium 1) and kT
2ω (transmitted in medium
2). The linear dielectric constants of media 1, 2, and the interface are denoted, respectively,
by ε1, ε2, and ε′. The nonlinear response of the interface (z=0) is given by the surface
nonlinear susceptibility tensor )2(sχ .

31
5. Schematic representation of a basic surface experimental setup for surface SHG. It is
comprised of laser source (LS), halfwave plate (λ), polarizer (P), lenses (L), spectral filters
(F1, F2), analyzer (A), and detector (D).
6. Various schematic representations of different experimental schemes for surface SHG
measurements. Panel (a) represents the basic scheme as in Fig. 5. Panel (b) describes use of
separate SHG source as a reference for normalizing the surface SHG signals against laser
fluctuation and drift. Panel (c) represents the arrangement for a measurement of the phase of
the surface SHG signal by mixing the fields from the surface and an external source SH
radiation. Panel (d) describes the configuration for a time-resolved measurement using the
pump-probe scheme.
7. Dependence of the magnitude (full circles) and the phase (open squares) of the nonlinear
susceptibility )2(sχ for a Si(111)-7×7 surface as a function of the coverage of adsorbed atomic
hydrogen using a fundamental photon energy 1.17 eV. (After U. Höfer, Appl. Phys. A 63,
533 [1996].)
8. Polarization dependence of SHG for normal incidence excitation of the cleaved Si(111)-2×1
surface. The polar plot of the SH signal versus the pump polarization orientation is shown for
the case of no polarization analysis (top panel), for the SH analyzer along the ]112[
crystallographic direction of the surface (middle panel), and along the ]101[ direction (bottom
panel). The solid curves are fits to theory assuming that the surface has m symmetry (After T.
F. Heinz et al., Phys. Rev. Lett. 54, 63 [1985].)
9. SHG spectrum (solid dots) for the CaF2/Si(111) interface. For comparison, the open circles
represent the corresponding signals for the SiO2/Si(111) interface, which is seen to give a
very weak signal in this frequency range. The solid line is a theoretical fit based on a two-
dimensional direct transition of the interface states, together with an excitonic feature slightly
below the band gap. (After T. F. Heinz et al., Phys. Rev. Lett. 63, 644 [1989].)

32
10. Rotational relaxation of Coumarin 314 molecules at the air-water interface subsequent to
photoexcitation. The initial anisotropy in the molecular orientational distribution is created
by linearly-polarized pump radiation in two orthogonal directions in the surface. (After D.
Zimdars et al., J. Phys. Chem. B 103, 3425 [1999].)
11. Vector map of the electric field in Si-on-sapphire substrate as deduced by SHG
measurements. A voltage is imposed on the rectangular metallic electrodes, which are
separated by 80 µm. (After J. I. Dadap et al., Opt. Lett. 24 1059 [1999].)
12. SH response of a Co film on a Cu(001) substrate as a function of the applied magnetic field.
A hysteresis loop corresponding to the surface response is observed. (After H. A. Wierenga
et al., Phys. Rev. Lett. 74, 1462 [1995].)
33
Fig. 1.
α(1)(ω)
α(2)(2ω)
realimaginaryrealimaginary
ω 0ω 0 /2Excitation frequency (ω)
34
Fig. 2
Excitation frequency (ω)ω 0 /2
35
Fig. 3
g
n′
n
ω
ω 2ωω
ω
2ωω
ω
2ω
a) b) c)
36
Fig. 4
xy
z
E(ω) E(2ω)
kω
Medium 1, ε1
Medium 2, ε2
Interfaceε ′, )2(
sχ
Rω2k
Tω2k
37
Fig. 5
LS
λP
F1 L L
F2
A
D
38
Fig. 6
a) b)
c) d)
a) b)
c) d)
39
Fig. 7
40
Fig. 8
41
Fig. 9
42
Fig. 10
120010008006004002000
∆χy (y-polarized pump)
∆χx (x-polarized pump)
∆χ(2
) ||⊥||(
norm
aliz
ed)
Time delay (ps)
43
Fig. 11
0 45 90 135 180
0
45
90
135
180
y-di
rect
ion
(µm
)
x-direction (µm)0 45 90 135 180
0
45
90
135
180
y-di
rect
ion
(µm
)
x-direction (µm)
44
Fig. 12

45
REFERENCES
Books on surface second-harmonic generation
1. McGilp JF, Patterson CH, and Weaire DL eds. (1995) Epioptics: linear and nonlinear optical
spectroscopy of surfaces and interfaces. Berlin; New York: Springer.
2. Brevet PF (1997) Surface Second Harmonic Generation. Lausanne: Presses Polytechniques
et Universitaires Romandes.
3. Bennemann KH. ed. (1998) Nonlinear Optics in Metals. Oxford: Clarendon.
Books on nonlinear optics
1. Bloembergen N (1965) Nonlinear optics. New York: W.A. Benjamin.
2. Shen YR (1984) The Principles of Nonlinear Optics. New York: Wiley.
3. Butcher PN and Cotter D (1990) The Elements of Nonlinear Optics. Cambridge: Cambridge.
4. Prasad PN and Williams DJ (1991) Introduction to Nonlinear Optical Effects in Molecules
and Polymers. New York: Wiley.
5. Boyd RW (1992) Nonlinear Optics. New York: Academic.
Selected reviews on surface nonlinear optics
1. Richmond GL, Robinson JM, and Shannon VL (1988) “Second harmonic generation studies
of interfacial structure and dynamics,” Prog. Surf. Sci., 28, 1-70 .
2. Shen YR (1989) “Optical second harmonic-generation at interfaces,” Annu. Rev. Phys.
Chem., 40, 327-350.
3. Heinz TF (1991) “Second-order nonlinear optical effects at surfaces and interfaces,”
Nonlinear Surface Electromagnetic Phenomena, Ponath H-E and Stegeman GI eds.
Amsterdam: North Holland. pp. 353-416.
4. Corn RM and Higgins DA (1994) “Optical second-harmonic generation as a probe of
surface-chemistry,” Chem. Rev., 94, 107-125.
5. Reider GA and Heinz TF (1995) “Second-order nonlinear optical effects at surfaces and
interfaces: recent advances,” Photonic Probes of Surfaces, Halevi P ed. Amsterdam: Elsevier
pp. 413-478.
6. Liebsch A (1995) “Electronic excitations at metal surfaces,” Photonic Probes of Surfaces,
Halevi P ed. Amsterdam: Elsevier pp. 479-532.

46
7. McGilp JF (1995) “Optical characterisation of semiconductor surfaces and interfaces,” Prog.
Surf. Sci., 49, 1-106.
8. Eisenthal KB (1996) “Liquid interfaces probed by second-harmonic and sum-frequency
spectroscopy,” Chem. Rev., 96, 1343-1360.
9. Richmond GL (1997) “Vibrational spectroscopy of molecules at liquid/liquid interfaces,”
Anal. Chem., 69, A536-A543.
10. Lüpke G (1999) “Characterization of semiconductor interfaces by second-harmonic
generation,” Surf. Sci. Rep., 35, 75-161.
11. McGilp JF (1999) “Second-harmonic generation at semiconductor and metal surfaces,” Surf.
Rev. Lett., 6, 529-558.
12. Dadap JI and Heinz TF (2001) “Nonlinear Optical Spectroscopy of Surfaces and Interfaces,”
Encyclopedia of Chemical Physics and Physical Chemistry, eds. Moore JH and Spencer ND
Bristol: IOP, pp. 1089-1125.