landslide susceptibility mapping using logistic regression ... · landslide susceptibility mapping...
TRANSCRIPT
Landslide Susceptibility Mapping Using Logistic Regression in Garut District, West Java,
Indonesia
N. Lakmal Deshapriya1, Udhi Catur Nugroho2, Sesa Wiguna3, Manzul Hazarika1, Lal Samarakoon1 1Geoinformatics Center, Asian Institute of Technology, P.O. Box 4, Klong Luang, Pathumthani, Thailand
Email: [email protected] 2Centre of Remote Sensing Application, National Institute of Aeronautics and Space (LAPAN), Jl. Pemuda Persil
No.1 Jakarta 13220, Indonesia
Email: [email protected] 3Nasional Disaster Management Authority (BNPB), Graha BNPB - Jl. Pramuka Kav.38 Jakarta Timur 13120,
Indonesia
Email: [email protected]
KEY WORDS: Landslide, Susceptibility Mapping, Logistic Regression, Indonesia
ABSTRACT: Landslides are one of the major disasters that affect human settlements, especially in hilly regions. The
mapping of Landslide Susceptibility is an important aspect of the decision making process in order to reduce the
landslide’s effect on human settlements. In this paper, we discuss one of statistical approaches which is known as
Logistic Regression to map Landslide Susceptibility. This analysis was extended further to assess Population
Exposure to Land Slide Susceptibility using gridded population data. “Garut District” which is located in West Java,
Indonesia was used as a study area to demonstrate the applicability of this method. In this study area the Aspect,
Lithology and Slope was discover as most contributing factors to the Landslide Susceptibility. Additionally, the large
coefficient value of the “Distance from Fault” factor justify the fact that prominence of Seismically Induced
Landslides in this Study Area.
1. INTRODUCTION Landslides are complex geological phenomena. They have a significant impact on human settlements, especially in
hilly regions. Landslides mostly result from triggering events, like earthquakes, intense rainfall, and snow melt.
Besides triggering events, other factors can be responsible for the possibility of the occurrence of landslides in a
particular location, including geology, land cover, slope geometry, surface and subsurface hydrology, and the role of
people (Regmi et al., 2013). Assessment of the contributions from all these factors to determine the probability of a
landslide occurrence is known as landslide susceptibility mapping.
The mapping of the landslide susceptibility help decision makers to make proper decisions to minimize the damage
from landslides on humans and resources. Mainly there are 3 approaches to create landslide susceptibility maps: (1)
the deterministic approach, (2) the qualitative or heuristic approach, and (3) the probabilistic approach (Regmi et al.
2013). The deterministic approach is based on modelling the slope instability with physical equations based on slope
geometry, material, forces, etc. The qualitative / heuristic approach is based on expert judgement, which is a
subjective approach. The probabilistic approach, which we are using in this paper. uses the statistical relationship
between historical landslides with responsible factors in order to assess susceptibility.
There are many statistical methods in the literature for the the landslide susceptibility mapping including a neural
network, logistic regression, etc. Basically, all approaches use some kind of curve fitting methods. Logistic
Regression analysis is well known to be one of the most popular approaches which has been well explored in the
literature with respect to landslide susceptibility (Chen and Wang, 2007; Lee and Sambath, 2006; Lee and Pradhan,
2007).
The output values of logistic regression model maps are values from zero to one (Akbari et al., 2014). This property of
the logistic regression model make it ideal for the model’s probabilities of occurrence. Additionally, it is easy to
model and easy to understand the effect of the parameters, and it is available in many commonly used data analysis
software programs (MATLAB, R, SPSS, etc.) as a readymade tool. The model for logistic regression is explained
below;
𝑝 =𝑒𝑢
1 + 𝑒𝑢
where p is the output of the model which is the probability of a landslide occurrence, and u is the independent variable

which is a linear combination of the contributing factors (for example, the slope, geology, land cover, etc.). β1, β2, β3,
etc. are corresponding coefficients to each of the respective contributing factors which indicate their contribution to
landslide susceptibility. A graphical representation of the logistic regression is shown in Figure 1.
𝑢 = 𝛽0 + 𝛽1𝑥1 + 𝛽2𝑥2 + 𝛽3𝑥3 … …
Figure 1: Logistic Regression Model
Indonesia is a large country with a special location between the Pacific Ocean and the Indian Ocean, and it is on a
tectonic boundary. Due to this special location, Indonesia is prone to a large number of geological hazards and
hydro-meteorological hazards. Based on the Agency for Disaster Management, Indonesia, (BNPB) data
(dibi.bnpb.go.id), during the period from 2014 to 2015 there were 1,229 hazards, (30.9 % - landslides, 30.1% -
hurricanes and 28.8 % - floods). In this paper, logistic regression was applied in a district in Indonesia to map the
susceptibility to landslides which are a significant hazard in Indonesia. 2. STUDY AREA AND DATA USED
The study area for this analysis is Garut District which is located in West Java Province in Indonesia, with a
population of 2,585,423. It covers an area of 3,074.07 sq.km. and geographically it lies between 6°57′34″– 7°44′
57″ south latitude and 107°24′34″– 108°7′34″ east longitude (Wikipedia, 2016). According to the BNPB,
Garut District is one of the high risk districts for landslides in Indonesia.
Figure 2. Study Area (Garut District)
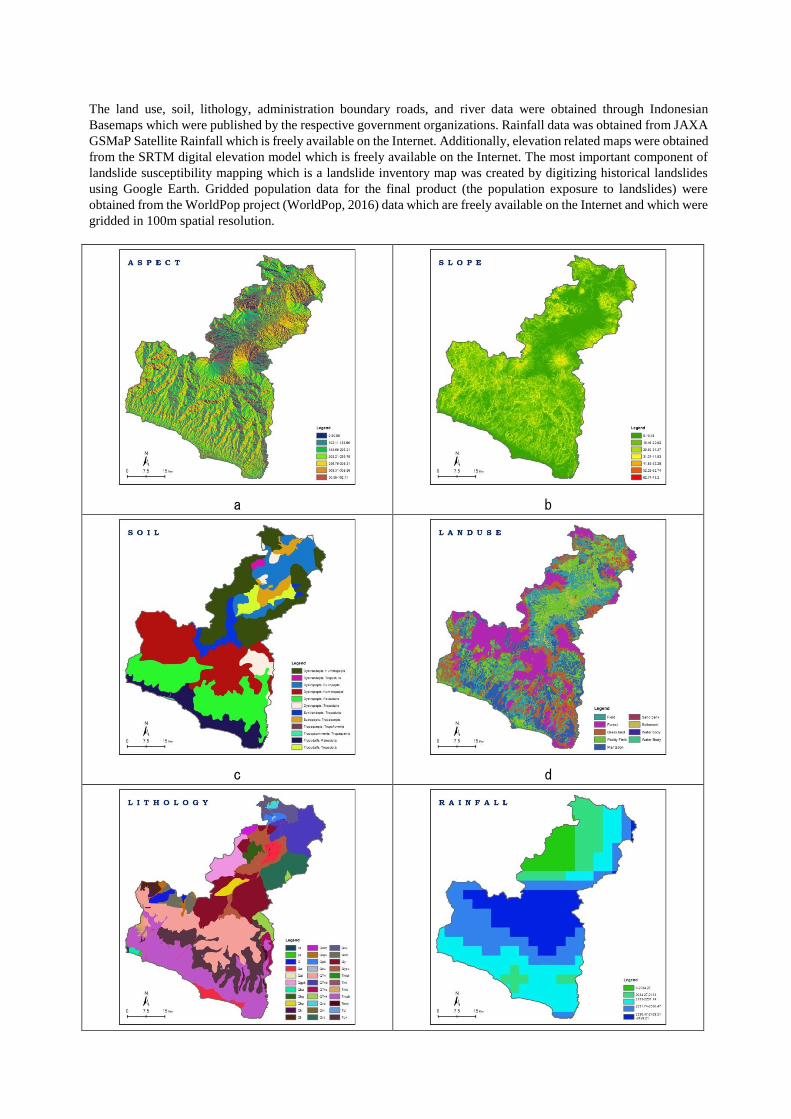
The land use, soil, lithology, administration boundary roads, and river data were obtained through Indonesian
Basemaps which were published by the respective government organizations. Rainfall data was obtained from JAXA
GSMaP Satellite Rainfall which is freely available on the Internet. Additionally, elevation related maps were obtained
from the SRTM digital elevation model which is freely available on the Internet. The most important component of
landslide susceptibility mapping which is a landslide inventory map was created by digitizing historical landslides
using Google Earth. Gridded population data for the final product (the population exposure to landslides) were
obtained from the WorldPop project (WorldPop, 2016) data which are freely available on the Internet and which were
gridded in 100m spatial resolution.
a
b
c
d
e f
g
h
i
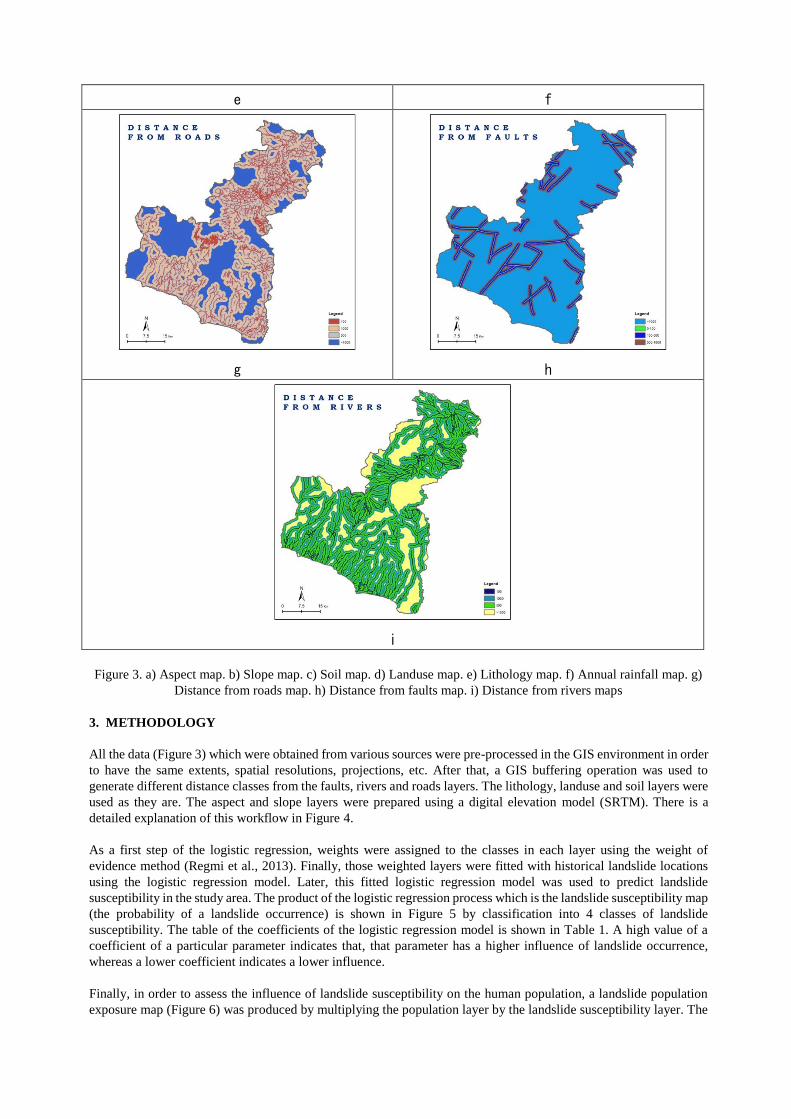
Figure 3. a) Aspect map. b) Slope map. c) Soil map. d) Landuse map. e) Lithology map. f) Annual rainfall map. g)
Distance from roads map. h) Distance from faults map. i) Distance from rivers maps
3. METHODOLOGY
All the data (Figure 3) which were obtained from various sources were pre-processed in the GIS environment in order
to have the same extents, spatial resolutions, projections, etc. After that, a GIS buffering operation was used to
generate different distance classes from the faults, rivers and roads layers. The lithology, landuse and soil layers were
used as they are. The aspect and slope layers were prepared using a digital elevation model (SRTM). There is a
detailed explanation of this workflow in Figure 4.
As a first step of the logistic regression, weights were assigned to the classes in each layer using the weight of
evidence method (Regmi et al., 2013). Finally, those weighted layers were fitted with historical landslide locations
using the logistic regression model. Later, this fitted logistic regression model was used to predict landslide
susceptibility in the study area. The product of the logistic regression process which is the landslide susceptibility map
(the probability of a landslide occurrence) is shown in Figure 5 by classification into 4 classes of landslide
susceptibility. The table of the coefficients of the logistic regression model is shown in Table 1. A high value of a
coefficient of a particular parameter indicates that, that parameter has a higher influence of landslide occurrence,
whereas a lower coefficient indicates a lower influence.
Finally, in order to assess the influence of landslide susceptibility on the human population, a landslide population
exposure map (Figure 6) was produced by multiplying the population layer by the landslide susceptibility layer. The

rationale behind that is that, if the population is low and the susceptibility is high, the impact of a landslide on the
population is less; and if the population is high and the susceptibility is high, the impact of a landslide is high, vice
versa.
Figure 4. Flow chart of landslide susceptibility mapping
4. RESULTS
Figure 5. Landslide susceptibility map of Garut District.
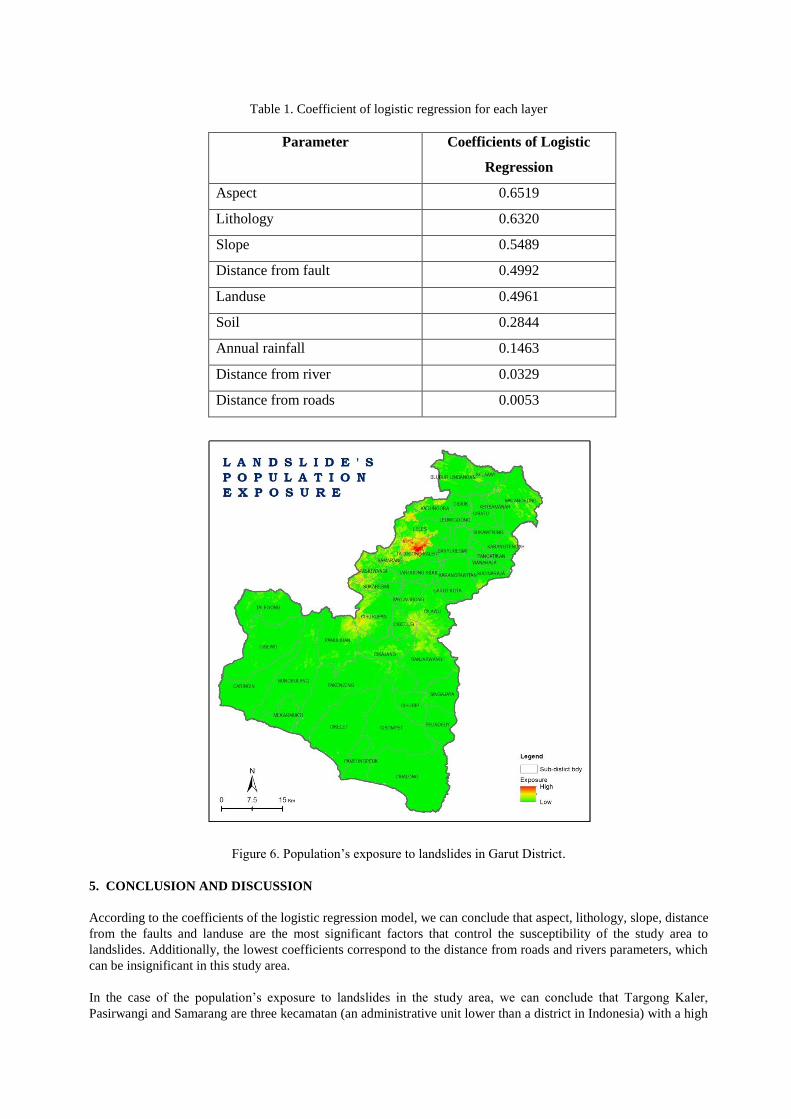
Table 1. Coefficient of logistic regression for each layer
Parameter Coefficients of Logistic
Regression
Aspect 0.6519
Lithology 0.6320
Slope 0.5489
Distance from fault 0.4992
Landuse 0.4961
Soil 0.2844
Annual rainfall 0.1463
Distance from river 0.0329
Distance from roads 0.0053
Figure 6. Population’s exposure to landslides in Garut District.
5. CONCLUSION AND DISCUSSION
According to the coefficients of the logistic regression model, we can conclude that aspect, lithology, slope, distance
from the faults and landuse are the most significant factors that control the susceptibility of the study area to
landslides. Additionally, the lowest coefficients correspond to the distance from roads and rivers parameters, which
can be insignificant in this study area.
In the case of the population’s exposure to landslides in the study area, we can conclude that Targong Kaler,
Pasirwangi and Samarang are three kecamatan (an administrative unit lower than a district in Indonesia) with a high
population exposure to landslides in Garut District.
Visual inspection of the results from the logistic regression model provides similar results to the map of potential
landslide zones produced by Indonesian government agencies. The high coefficient value for distance from faults in
the model is evidence that most of the landslides in the study area are seismically induced landslides rather than
rainfall induced landslides (there is a low coefficient for annual rainfall).
The inability to find a well distributed landslide inventory map is the main limitation of this study. However, in this
study area, we were able to digitize a significant number of landslides using Google Earth due to large scale and
frequently occurring landslides in the study area. Since, in order to statically represent all layers in the model, it’s
essential to have large number of landslide inventory data, distributed among all classes of all layers. If a study area
has low frequent and small scaled landslides, it will be very challenging to extract landslides from Google Earth. In
those cases, if available, use of country’s Disaster Agency’s historical landslide information is recommended.
In conclusion, we can conclude that logistic regression can be used as successful tool to map landslide susceptibility
in areas which have well distributed landslide inventory data with significantly less effort.
6. RECOMENDATION
As a recommendation, it is recommended that a well distributed landslide inventory map that can capture the
probability of landslide occurrences in different classes is essential for logistic regression analysis. In cases where an
adequate landslide inventory map is not available, it is better to rely on the deterministic approach (based on a
physical model) or the qualitative / heuristic approach (based on expert judgement) rather than on statistical
approaches.
ACKNOWLEDGEMENT
This research work has been financially supported by the Japan Aerospace Exploration Agency (JAXA) (Mini-project
2015-2016) and also with collaboration between the Geoinformatics Center, Asian Institute of Technology, Thailand,
the National Institute of Aeronautics and Space (LAPAN), Indonesia and the National Agency for Disaster
Management (BNPB), Indonesia.
REFERENCES
JAXA Global Rainfall Watch by JAXA GSMaP, Japan Aerospace Exploration Agency (JAXA), viewed 10 Sep 2016,
<http://sharaku.eorc.jaxa.jp/GSMaP/>
WorldPop - What is WorldPop?, GeoData Institute, University of Southampton, viewed 10 Sep 2016,
<http://www.worldpop.org.uk/>
Wikipedia. Garut Regency, viewed 10 Sep 2016, <https://en.wikipedia.org/wiki/Garut_Regency>
Regmi, N.R., Giardino, J.R., McDonald, E.V. and Vitek. J.D. (2013): A comparison of logistic regression-based
models of susceptibility to landslides in western Colorado, USA , Landslides (2014), vol. 11, pp. 247-262.
Chen, Z. and Wang, J. (2007): Landslide hazard mapping using logistic regression model in Mackenzie Valley,
Canada, Nat. Hazards, 42(1), 75-89.
Lee, S. and Sambath, T. (2006): Landslide susceptibility mapping in the Damrei Romel area, Cambodia using
frequency ratio and logistic regression models, Environ. Geol., 50(6), 847-855.
Lee, S. and Pradhan, B. (2007): Landslide hazard mapping at Selangor, Malaysia using frequency ratio and logistic
regression models, Landslides, 4, 33-41.
Akbari, A., Bin Mat Yahaya, F., Azamirad, M. and Fanodi. M. (2014): Landslide Susceptibility Mapping Using
Logistic Regression Analysis and GIS Tools, Electronic Journal of Geotechnical Engineering, Vol 19.