land use/cover changes, the environment and water resources in northeast china
TRANSCRIPT
Land Use/Cover Changes, the Environment andWater Resources in Northeast China
YANSUI LIU*
DAWEI WANG
Institute of Geographic Sciences and Natural ResourcesResearch, Chinese Academy of Sciences,Beijing 100101, China
JAY GAO
School of Geography and Environmental ScienceUniversity of AucklandPrivate Bag 92019,Auckland, New Zealand
WEI DENG
Northeast Institute of Geography and Agricultural Ecology,Chinese Academy of Sciences,Changchun 130021, China
ABSTRACT / Land use/cover in Northeast China wentthrough extensive changes during the 1990s. This report ex-plores the interaction between these changes and the envi-ronment, and the implication of these changes for rational
allocation of water resources. Two maps of land use/coverproduced from 1990 and 2000 Landsat TM satellite imageswere overlaid in ArcInfo to reveal changes in land cover. Re-sults indicate that farmland and grassland decreased by386,195 and 140,075 ha, respectively, while water, built-upareas, and woodland increased by 238,596, 194,231, and192,682 ha, respectively. These changes bore a mutual rela-tionship with the environmental change. On the one hand,climate warming made some of these changes (e.g., con-version of woodland and grassland to farmland) possible. Onthe other hand, the changed surface cover modified the localclimate. These changes, in turn, caused severeenvironmentaldegradation and increased flooding. The change betweendry field and rice paddy, in particular, raised severe implica-tions for the proper allocation of limited water resources in theNortheast. Efforts are needed to coordinate their rationalallocation to reap maximum and sustainable return over theentire area, not just in some localities. Results obtained in thisstudy should be of interest to the international audience ofEnvironmental Management in that they highlight the inter-active nature of human activities and the environment and theoff-site impact of these activities on the environment.
Land use/cover is a product of mutual interactionsbetween human economic activities and the naturalenvironment (Liu and Chen 2002). It results from thealteration of the earth’s surface by human beings. Withthe rapid rise in human population, such alternationsare taking place at unprecedented rates, magnitudes,and spatial scales (Turner and others. 1994). Human-induced changes in land use/cover form an importantcomponent of global environmental change. There-fore, it is important to study land use/cover and itschange.
Land use/cover change has received much atten-tion internationally. The International Geosphere-Biosphere Program and International Human Dimen-sions Program were launched in the mid-1990s to studyland use/cover change at the global scale. These pro-
grams aimed at understanding the main driving forcebehind the change (Verburge and others 1999), whichcould include climatic, biological, and socio-politicalforces (Reid and others 2000). Such an understandingis conducive to the maintenance of sustainable eco-nomic development.
Changes in land use/land cover can take place atvarious scales, such as in a coastal zone (Mas 1999), inan urban area (e.g., Shi and others 2000, Yang and Lo2002, Zhang and others 2002), or even within a districtin a city (Chen and others 2003). Changes at such amicro-scale may bear some relationship with the envi-ronment. Nevertheless, the relationship may not bedefinite and vary with the geographic location. Thisscale of changes hence falls outside the scope of thisstudy. Instead, we focus on changes at the regionalscale at which the impact of the changed environmenton land use/cover and the changed land cover on theenvironment is less subject to local variation.
The prerequisite of studying the interactions be-tween changes in land cover and the environment isto ascertain these changes. This task is ideallyaccomplished from multi-temporal satellite imagery
KEY WORDS: Land use/cover; Environmental change; Resourcesallocation; Northeast China
Published online September 27, 2005.
*Author to whom correspondence should be addressed; email: liuys@
igsnn.ac.cn
Environmental Management Vol. 36, No. 5, pp. 691–701 ª 2005 Springer Science+Business Media, Inc.
DOI: 10.1007/s00267-004-0285-5
data. Changes can be readily detected from overlayanalysis of land use/cover maps produced from mul-titemporal satellite images (Mas 1999, Hayes and Sa-der 2001, Kaufmann and Seto 2001, Petit and Lambin2001). The overlay analysis is efficiently accomplishedin a geographic information system (GIS) that is alsogood at visualizing and quantifying the detected re-sults (Newkirk and Wang 1990, Li 1997, Baban andYusof 2001, Gao and Deng 2002, Gautam and others2002).
Changes in land cover may be easily and accuratelydetected thanks to the use of modern informationacquisition technologies. Nevertheless, few researchershave attempted to link the detected change with envi-ronmental change in general, and climate change inparticular, systematically and comprehensively. Inexamining the relationship between land use and theenvironment, Lohmar and others (2002) found thatinsecure tenure may encourage farmers to expandfarming practices on environmentally sensitive land,causing soil erosion and overgrazing. Reid and others(2000) explored land cover changes from the com-bined effects of drought and migration, changes insettlement and land tenure policy, and changes in theseverity of livestock diseases. Lo and Yang (2002) ana-lyzed the causes of land use/cover changes from theperspectives of demography, socio-economic variables,and spatial proximity to established urban facilities.The role of the environment in the detected changeshence remains unexplored.
Similar to the environment, natural resources suchas water also have a role to play in land use/coverchanges at the regional scale. The relationship betweenwater resources consumption and regional land usehas been explored by a few researchers (Gan andothers 2003). Lahmer and others (2001) outlined amethod of assessing the influences of climate and re-gional land use changes. Their results, obtained in twomesoscale river basins, demonstrated that moderateland use changes result in only small changes of variouswater balance components.
This study aims to elucidate the interactive naturebetween changes in land use/cover caused by humanactivities and the environment (e.g., climate) inNortheast China in the 1990s. Specifically, the studyexplores the relationship of these identified changeswith natural resources (e.g., land and water). Thespecific objectives are: (1) to analyze the role of theenvironment in leading to the changes; (2) to elabo-rate on how the changed land use/cover has modifiedthe local environment in turn; and (3) to explore theimplications of the changes on the rational allocationof limited natural resources for sustainable agriculture.
Knowledge on the complex interactions among humanactivities, the environment, natural resources, andhazard will help to minimize the detrimental conse-quences of these changes that may not manifestimmediately after human activities. Such knowledgewill also help to make the exploitation of natural re-sources rational and sustainable.
This study is composed of seven sections. Followingthis introduction is a description of the study area.The data used in this study and their processing arecovered as well as the major land use/cover changesdetected and their relationship with the environment.The severe impacts of the detected changes on theenvironment and the implications the observedchanges have for rational allocation of water resourcesare discussed. Finally, this report ends with a conclu-sion section.
Study Area
The area that has been selected for study is North-east China, which includes three provinces: Heilongji-ang, Jilin, and Liaoning (Fig. 1). They have acombined territory of 791,800 km2, of which nearly30% is arable. Annual precipitation inside the studyarea varies widely from 480 mm in the west to 900 mmalong the east coast. This area has a boreal climate withan annual temperature of around 1–7�C. An importantreason for selecting this area to study is that its naturalenvironment is highly sensitive to climate warming dueto its latitude being 40�or higher.
Another reason for this selection is that NortheastChina underwent massive changes in land cover duringthe 1990s. Similar to the rest of China, the collectivefarming system was replaced by the household-basedindividual production system in the late 1970s to un-leash farmers� incentives for higher productivity andmore income. This decentralized decision-making inagricultural production afforded farmers more free-dom in looking after their own interest. However, asusers of the land (but not its owners) farmers still hadto honor grain production quotas imposed by thegovernment. Historically, the central government at-tached great importance to food self-sufficiency. Underthis policy, cropping land was increased through zeal-ous reclamation of grassland, marginal woodland, andeven fallow land. However, after market-oriented re-forms were introduced to the agrarian sector by thelate 1990s, Northeast-grown maize and soybean werenot so profitable as other crops in the market (Ai andAi 2002). Thus, each of the three provinces started todiversify its agricultural operation by growing rice.While correcting the legacy of the former planned
692 Liu and others

production, land use/cover underwent even morechanges accordingly on the regional scale. Suchchanges have caused severe shortage of water resourcesand raised the issue of how to allocate limited re-sources rationally to bring maximum return whileminimizing the adverse impact on the environment.
Methodology
Three kinds of data were used in this study: socio-economic, climate, and satellite data. Five categories ofsocioeconomic indicators (economic developedness,agricultural output, population, economic input, andefficiency of land output) were considered importantto land use/cover change in the Northeast after con-sultation with a panel of experts using the Delphimethod. Under each category, there are a varyingnumber of variables, the total of which amounts to 20.Such data were extracted from the Rural Area Statisti-
cal Yearbook for a total of 151 counties (RASIT 2001).Two sets of socioeconomic data were collected, one in1990 and another in 2000. Climate data recorded at 19weather stations evenly distributed throughout thestudy area were also collected. Included in these datawere annual temperature, monthly temperature inJuly, and July rainfall. All of them were recordedbetween 1970 and 2000. Only the monthly temperaturein July between 1991 and 2000 was analysed in thisstudy. Landsat TM and Enhanced TM Plus (ETM+)images recorded in 1990 and 2000 were collected fromthe ground receiving station in Beijing. About 58images were acquired to cover the entire study area inboth years. Their row number varied from 23 to 33 andpath number from 113 to 123. These images were re-corded during the June–September period when theimage differences among crops were maximal.
The false colour composites of TM bands 4, 3, and 2were visually interpreted to derive land use/cover
Figure 1. Location of the study area.
Land Use/Cover Changes in Northeast China 693
information through on-screen digitization accordingto a pre-determined classification scheme of six cate-gories of land covers present within the study area andtheir image characteristics. These covers were farm-land, woodland, grassland, built-up areas, water, andfallow land. Farmland refers to any land used for cul-tivation of crops, which may include rice, wheat, soy-beans, maize, and sugar beet. Woodland is defined asareas covered by either natural forest or by sparselypopulated saplings. Also included in this category arebushes and shrubs. Fallow land refers to any unusedland, including marshland, salinized land, sandy land,and barren land. Grassland is defined as any land usedfor grazing.
Prior to interpretation, the images were geometri-cally rectified to an accuracy of less than two pixels(about 50 m) in the PCI� image processing package(version 7.0). Two maps of six covers were producedfrom the respective satellite images. Farmland wasfurther mapped as dry fields and paddy at the sub-cate-gory level. Salinized land was also interpreted. Theaccuracy of these mapped covers was assessed through acombination of field visits and comparison with existingstatistics. Compared with the government statistics, thechange from farmland to woodland was detected at anaccuracy of 92.9%. The accuracy for change from farm-land to built-up areas was assessed in a similar manner. Itwas lower at 85%. Changes in land use/cover weremapped from overlaying two land use/cover maps ofrespective years in ArcInfo� (version 8.02). Thesechange maps were intersected with the administrativeboundary layer of the three provinces. The newly ob-tained results were quantitatively analyzed to calculateland use/cover changes by province.
The Environment and Land Cover Changes
Major Changes Detected
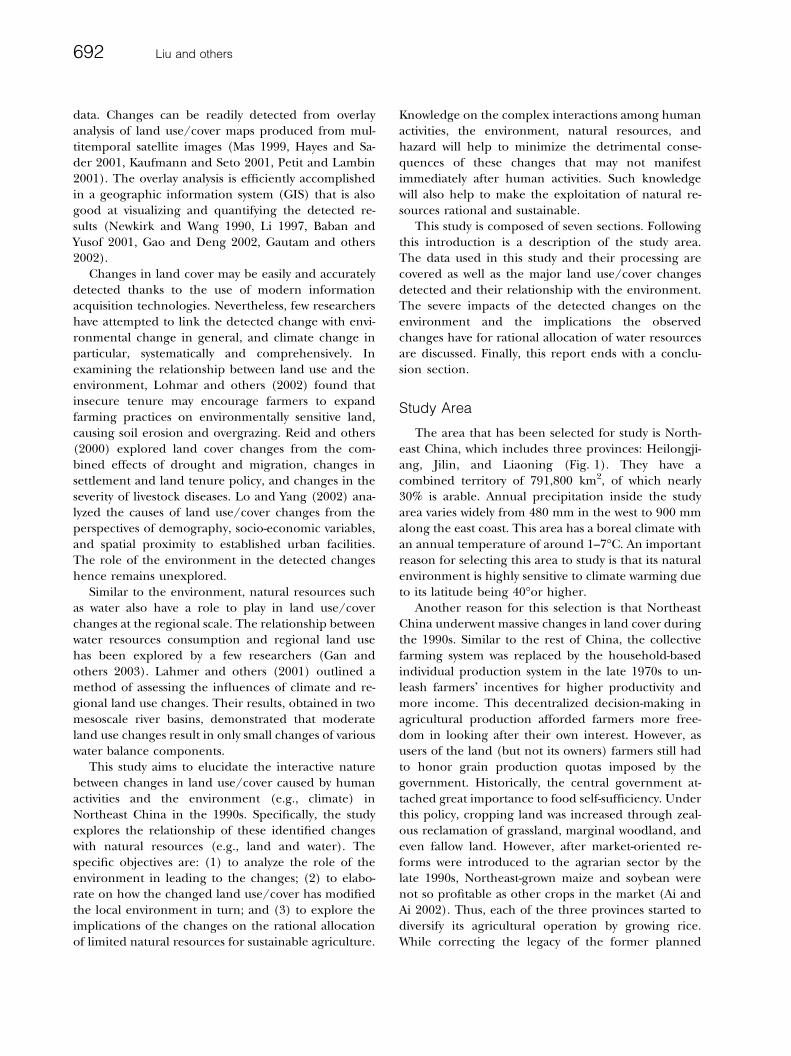
Of the detected land use/cover changes (Fig. 2),farmland experienced the most drastic decrease by1,021,576 ha (Table 1). Of this reduced farmland,524,160 ha were converted into woodland. The othertwo significant losses to farmland occurred in the formof conversion to water at 257,639 ha and to built-upareas at 178,361 ha. To a large extent, the loss infarmland was partially compensated for by the con-version of a large chunk of woodland (338,130 ha) inthe opposite direction. Another significant gain infarmland came from grassland at 229,545 ha.
Woodland is the cover that experienced the secondmost extensive change. On the one hand, 392,291 haof woodland were lost to other uses, mainly farming(86%). On the other hand, 524,160 ha of woodland
were created out of farmland, resulting in a net gain of192,683 ha. The third most drastic change is grasslandthat had a net loss of 140,075 ha due to its reclamationas farmland, even though 6,002 ha of fallow land werechanged to farmland. Consequently, fallow land expe-rienced a net decrease of 99,240 ha. Built-up and waterareas expanded by 194,231 ha and 238,596 ha,respectively. Water gained its acreage from all othercovers except urban, even though 85% of the increaseoriginated from farmland. Caution must be exercisedin interpreting this increase as water area in the regioncould fluctuate considerably from year to year. Apartfrom the construction of reservoirs, this increase is duelargely to the flooding in 1998. Therefore, it does notrepresent a genuine long-term trend of increasedavailability of water resources.
Role of Temperature in the Changes
The land use/cover changes identified previouslybear a mutually interactive relationship with the envi-ronment. One the one hand, climate warming hasmade some of the changes possible. On the other,these changes have modified the local environment inturn. The first issue is covered in this section. Thesecond issue will be covered in Modification of LocalClimate.
Figure 2. Spatial distribution of land use/cover changes,Results presented are based on the predominant changesdetected within 1 km2 grids (F: farmland; G: grassland; W:woodland; U: urban or built-up areas).
694 Liu and others
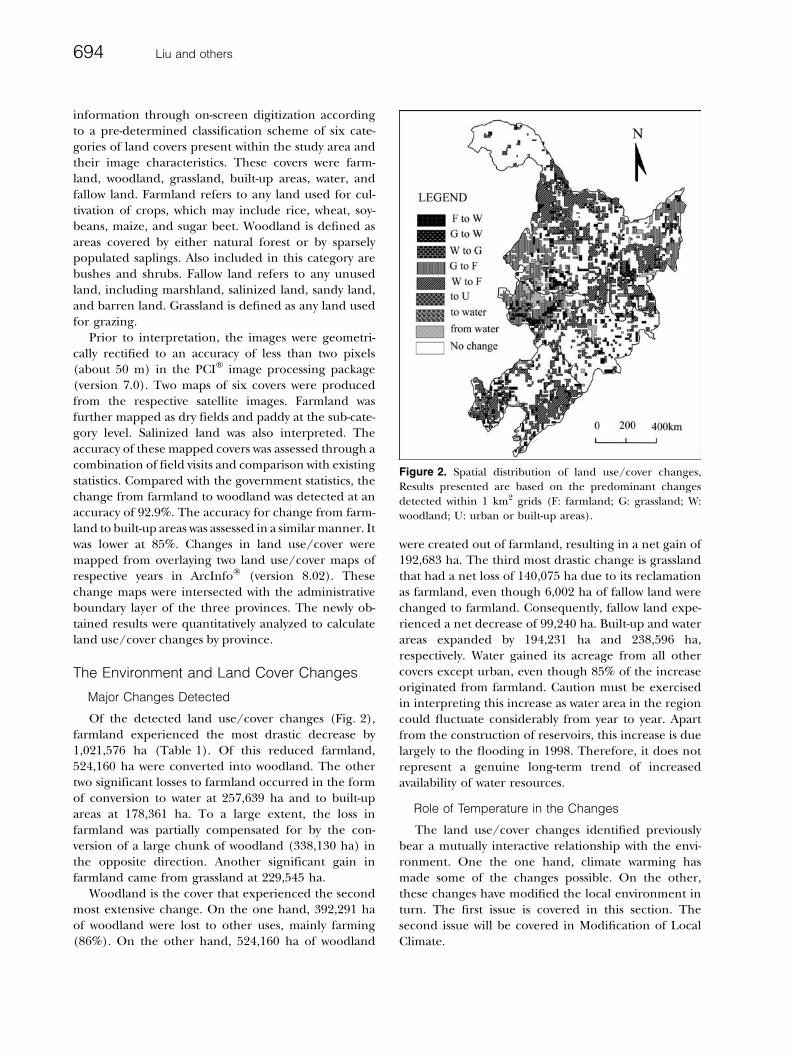
In the boreal Northeast, temperature is the mostcritical climatic variable that controls the latitudinaldistribution of crops. For instance, rice can only becultivated in places where annual temperature averagesno less than 1�C (Zhang and others 2003a). Reminis-cent of the global trend of climate warming, tempera-ture in Northeast China has risen steadily over the lastdecade as demonstrated by Figure 3. (This diagram,derived from 19 weather stations widely distributedthroughout the Northeast, indicates a definite trend ofwarming in the 1990s in spite of a wide yearly fluctua-tion. The following regression relationship wasestablished between average monthly July temperatureand year:
Temperature¼0:2198� year�416:27ðR2¼0:489Þ ð1Þ
Judging by the large R2 value of 0.489, this model israther accurate in indicating the rising trend in Julytemperature. Its slope of 0.2198 would translate into a
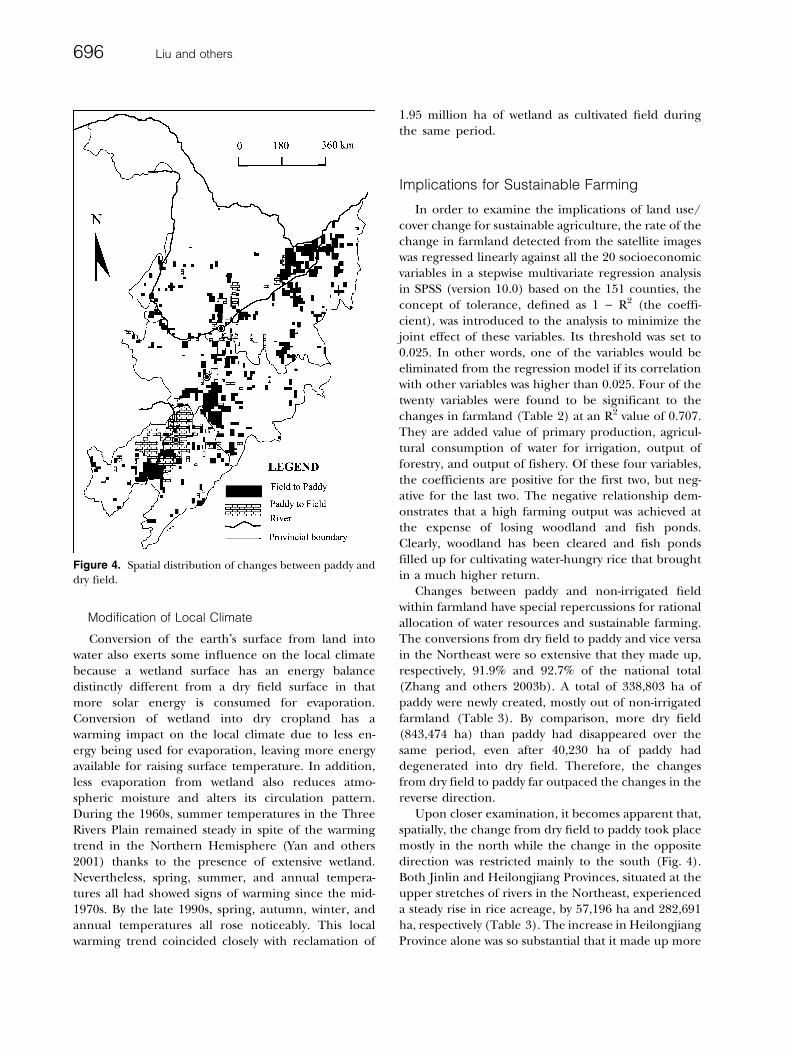
total rise of 2.20�C in July temperature during thedecade (1991–2000). Associated with this warmingtrend was the prolonged growing season, and thegradual northwards shift in the 1�C isotherm of meanannual temperature during the 1990s (Yang and Ding2002). Consequently, far more areas than ever beforehave a mean annual temperature of 1�C or higher.Such a rise in temperature enables cultivation of rice inmore northern areas than before. As a matter of fact,climate warming has created the potential for thenorthward expansion of paddy (Zhang and others2003b). This expansion accounts for the changes fromnon-irrigated dry fields into paddy in the northernprovinces of Heilongjiang and Jilin (Fig. 4). In addi-tion to rice, the rising temperature has also extendedthe northernmost growing limit for other crops. As aresult, previously fallow land or even grassland in theseprovinces has been reclaimed as farmland, resulting inthe disappearance of fallow land in these two provincesby nearly 50%.
Table 1. Matrix of land use/cover changes (unit: ha)
Land cover Farmland Woodland Grassland Built-up Water Fallow Decrease
Farmland — 524,160 55,801 178,361 257,639 5,615 1,021,576Woodland 338,130 — 6,142 8,435 9,290 30,294 392,291Grassland 229,545 24,833 — 7,442 22,468 41,006 325,294Built-up 0 2,702 0 — 0 0 2,702Water 61,703 2,138 888 0 — 1,058 65,788Fallow Land 6,002 31,141 122,388 2,695 14,987 — 177,213Increase 635,380 584,973 185,219 196,934 304,384 77,973 1,984,864Net Change )386,195 192,683 )140,075 194,231 238,596 )99,240 —
Across: original cover type of change (change from) in 1990; down: destination cover type of change (change to) in 2000
Figure 3. The rising trend of monthlymean temperature in July averagedfrom 19 weather stations during 1991–2000.
Land Use/Cover Changes in Northeast China 695
Modification of Local Climate
Conversion of the earth�s surface from land intowater also exerts some influence on the local climatebecause a wetland surface has an energy balancedistinctly different from a dry field surface in thatmore solar energy is consumed for evaporation.Conversion of wetland into dry cropland has awarming impact on the local climate due to less en-ergy being used for evaporation, leaving more energyavailable for raising surface temperature. In addition,less evaporation from wetland also reduces atmo-spheric moisture and alters its circulation pattern.During the 1960s, summer temperatures in the ThreeRivers Plain remained steady in spite of the warmingtrend in the Northern Hemisphere (Yan and others2001) thanks to the presence of extensive wetland.Nevertheless, spring, summer, and annual tempera-tures all had showed signs of warming since the mid-1970s. By the late 1990s, spring, autumn, winter, andannual temperatures all rose noticeably. This localwarming trend coincided closely with reclamation of
1.95 million ha of wetland as cultivated field duringthe same period.
Implications for Sustainable Farming
In order to examine the implications of land use/cover change for sustainable agriculture, the rate of thechange in farmland detected from the satellite imageswas regressed linearly against all the 20 socioeconomicvariables in a stepwise multivariate regression analysisin SPSS (version 10.0) based on the 151 counties, theconcept of tolerance, defined as 1 ) R2 (the coeffi-cient), was introduced to the analysis to minimize thejoint effect of these variables. Its threshold was set to0.025. In other words, one of the variables would beeliminated from the regression model if its correlationwith other variables was higher than 0.025. Four of thetwenty variables were found to be significant to thechanges in farmland (Table 2) at an R2 value of 0.707.They are added value of primary production, agricul-tural consumption of water for irrigation, output offorestry, and output of fishery. Of these four variables,the coefficients are positive for the first two, but neg-ative for the last two. The negative relationship dem-onstrates that a high farming output was achieved atthe expense of losing woodland and fish ponds.Clearly, woodland has been cleared and fish pondsfilled up for cultivating water-hungry rice that broughtin a much higher return.
Changes between paddy and non-irrigated fieldwithin farmland have special repercussions for rationalallocation of water resources and sustainable farming.The conversions from dry field to paddy and vice versain the Northeast were so extensive that they made up,respectively, 91.9% and 92.7% of the national total(Zhang and others 2003b). A total of 338,803 ha ofpaddy were newly created, mostly out of non-irrigatedfarmland (Table 3). By comparison, more dry field(843,474 ha) than paddy had disappeared over thesame period, even after 40,230 ha of paddy haddegenerated into dry field. Therefore, the changesfrom dry field to paddy far outpaced the changes in thereverse direction.
Upon closer examination, it becomes apparent that,spatially, the change from dry field to paddy took placemostly in the north while the change in the oppositedirection was restricted mainly to the south (Fig. 4).Both Jinlin and Heilongjiang Provinces, situated at theupper stretches of rivers in the Northeast, experienceda steady rise in rice acreage, by 57,196 ha and 282,691ha, respectively (Table 3). The increase in HeilongjiangProvince alone was so substantial that it made up more
Figure 4. Spatial distribution of changes between paddy anddry field.
696 Liu and others
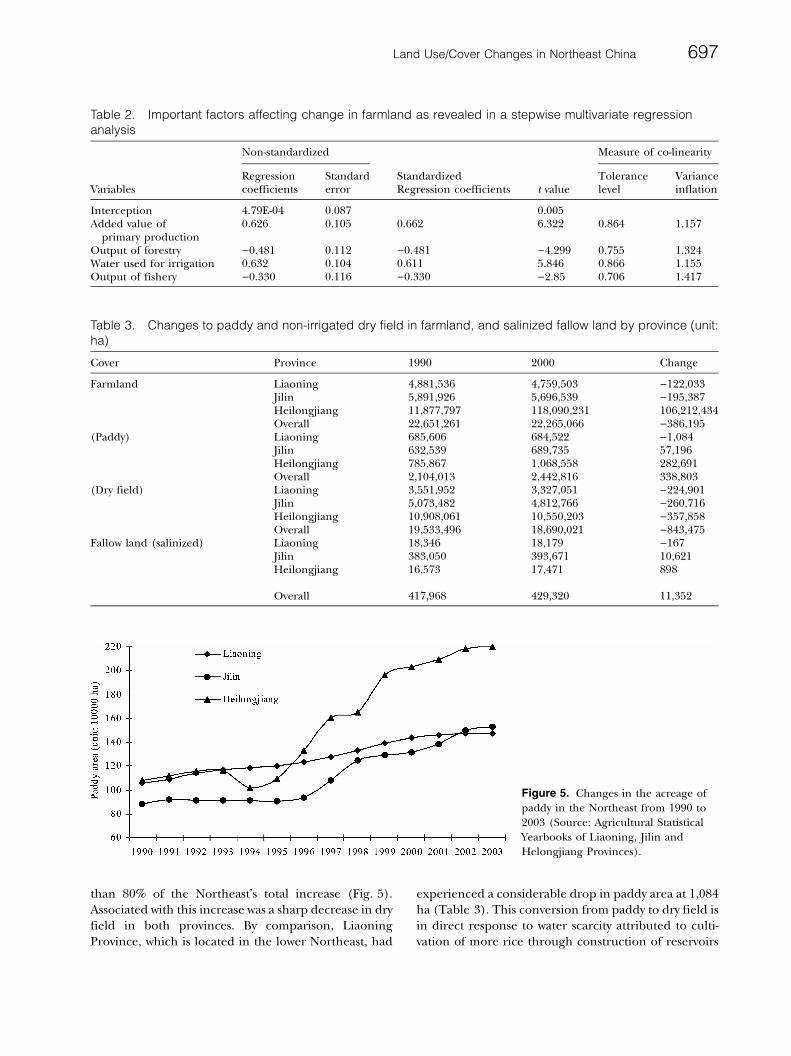
than 80% of the Northeast�s total increase (Fig. 5).Associated with this increase was a sharp decrease in dryfield in both provinces. By comparison, LiaoningProvince, which is located in the lower Northeast, had
experienced a considerable drop in paddy area at 1,084ha (Table 3). This conversion from paddy to dry field isin direct response to water scarcity attributed to culti-vation of more rice through construction of reservoirs
Table 2. Important factors affecting change in farmland as revealed in a stepwise multivariate regressionanalysis
Non-standardized Measure of co-linearity
VariablesRegressioncoefficients
Standarderror
StandardizedRegression coefficients t value
Tolerancelevel
Varianceinflation
Interception 4.79E-04 0.087 0.005Added value of
primary production0.626 0.105 0.662 6.322 0.864 1.157
Output of forestry )0.481 0.112 )0.481 )4.299 0.755 1.324Water used for irrigation 0.632 0.104 0.611 5.846 0.866 1.155Output of fishery )0.330 0.116 )0.330 )2.85 0.706 1.417
Table 3. Changes to paddy and non-irrigated dry field in farmland, and salinized fallow land by province (unit:ha)
Cover Province 1990 2000 Change
Farmland Liaoning 4,881,536 4,759,503 )122,033Jilin 5,891,926 5,696,539 )195,387Heilongjiang 11,877,797 118,090,231 106,212,434Overall 22,651,261 22,265,066 )386,195
(Paddy) Liaoning 685,606 684,522 )1,084Jilin 632,539 689,735 57,196Heilongjiang 785,867 1,068,558 282,691Overall 2,104,013 2,442,816 338,803
(Dry field) Liaoning 3,551,952 3,327,051 )224,901Jilin 5,073,482 4,812,766 )260,716Heilongjiang 10,908,061 10,550,203 )357,858Overall 19,533,496 18,690,021 )843,475
Fallow land (salinized) Liaoning 18,346 18,179 )167Jilin 383,050 393,671 10,621Heilongjiang 16,573 17,471 898
Overall 417,968 429,320 11,352
Figure 5. Changes in the acreage ofpaddy in the Northeast from 1990 to2003 (Source: Agricultural StatisticalYearbooks of Liaoning, Jilin andHelongjiang Provinces).
Land Use/Cover Changes in Northeast China 697
in the upper stretches of the Liao River and hence areduced channel discharge downstream. By the way, thepattern of increased paddy production upstream anddecreased downstream in this region is different fromthe ‘‘increase in water’’ area finding, confirming thatwater acreage�s increase was indeed temporal instead ofeventual.
The changes between paddy and dry field raisedsevere implications for the rational allocation of lim-ited water resources. Although rice can bring a muchhigher return than soybeans or maize, its cultivationconsumes as much as fifteen times more water (People�sDaily, 2 June 2002). Rapid expansion in rice acreagehas stretched the exploitation of water resources in theNortheast to their absolute limit. Farmers in someareas had to resort to using groundwater to irrigatetheir paddies, causing a decline in the groundwatertable (Sun and Qu 2002). Since total water resources inthe Northeast remain almost unchanged (except yearlyfluctuation), any increase in irrigation use in placescloser to water resources must lead to reduced wateravailability elsewhere. The drop in paddy cultivation inLiaoning Province during 1990–1995 was due partly toincreased usage of water by Inner Mongolia in theupper stretches of the Liao River. The response to re-verse this declining trend from Liaoning Province wasto construct more reservoirs. In light of the unchangedquantity of water resources, it is questionable whethersuch isolated provincial irrigation schemes can beviewed as successful.
Similarly, it also remains to be seen whether irri-gation of vast paddy using water from the Nen Riverin Heilongjiang Province is commendable. What iscertain is that the 1990s pace of converting dry fieldto paddy (Table 3) cannot continue unabated forthree reasons. First, the proportion of water used forirrigating farmland in this province has already sur-passed 60% of the total. By comparison, residentialand industrial uses have a much lower share thanagriculture, accounting for only 6% and 29% of thetotal, respectively (People�s Daily, 2 June 2002). Harbin,the capital city of Heilongjiang Province located inthe lower reaches of the Songhua River, faces a severewater shortage at the moment. A rapidly increasingurban population with an insatiable demand for morewater will eventually limit, if not reduce, its availabilityfor irrigation. Second, changes from non-irrigatedfield to paddy are further hampered by a high con-centration of heavy industries in the Northeast. Thesebig water consumers compete directly with agriculturefor access to the resources. Finally, even if there werean unconstrained supply of water, caution must stillbe exercised in using it for irrigation to the excess.
Irrigated paddy that has been reclaimed frommarshland could become salinized if not managedproperly.
Excessive exploitation of water resources has graveimplications for agricultural sustainability in theNortheast. Because of time constraints, it is too soon totell whether all the newly created paddies, eitherreclaimed from marshland or changed from dry field,can be cultivated at a sustainable level. Driven bymarket forces, farmers will be keener than ever tochange their dry field into paddy. Under such a cir-cumstance, it becomes increasingly critical to empha-size sustainable farming. Decentralization of decision-making holds each provincial government responsiblefor its own agricultural policy. However, all three pro-vincial governments must work out the maximumacreage of paddy that can be farmed sustainably for theamount of water available. In this way, each of themwill have an equal access to water resources regardlessof their distance from it. The problem of changing dryfield into paddy in the upper reaches of the Nen Riverwhile existent paddy in its lower reaches is forced torevert to dry field due to lack of water can be avoided.Apart from construction of irrigation projects, all pro-vincial governments should also be thinking ofrestructuring agricultural production to make it sus-tainable and increasing irrigation efficiency. Perhaps acharge should be levied for the use of water to preventit from being used inefficiently.
Environmental Consequences of Changes
Land Degradation
With a semiarid climate, the agropastoral inter-locked west of Northeast China is highly vulnerable toland degradation despite the establishment of a wind-break system known as ‘‘Green Great Wall’’ throughafforestation in the 1980s. Inadequate funding fromthe government meant that it was not adequatelymaintained in the 1990s (Qui and others 2003). Illegallogging for timber and firewood has severely reducedits effectiveness. Coincident with this worsened naturalenvironment was a decrease in grassland from 3.90million ha to 3.76 million ha during 1990–2000. Dur-ing the same period, 229,545 ha of grassland were re-claimed as farmland (Table 1), mostly in theagropastoral west. [Here tilled farmland with a de-nuded surface is much more prone to soil erosion andland degradation than grassland.] After land fertility isreduced to a certain level through removal of topsoil,farming becomes no longer viable, resulting in theabandonment of farmland. Abandonment of croplandin a dry season that has been reclaimed from grassland
698 Liu and others
in a wet season of an unusually high precipitation hascaused land to degrade at an accelerated rate (Liu andHuang 2002). Abandonment of farmland reclaimedfrom grassland fuels the advance of sand dunes that arecrawling eastwards from arid West China under theaction of predominantly northwesterly wind regime,threatening productive farmland in the hinterland ofthe Song-Liao Plain.
Apart from desertification, irrational changes inland use/cover (e.g., reclamation of marginal land asfarmland) have also resulted in an increase in salinizedland by 11,352 ha in the Northeast, 10,621 ha or 93.6%
of which are concentrated in Jilin Province (Table 3).In its western part, salinized land has been expandingat an annual rate of 2.1% during the 1990s (Qiu andothers 2003). Physiographically, up to 1.8 million ha ofsalinized land are distributed in the Songnen Plain.The majority of such newly salinized land is associatedwith changes of grassland to farmland through landreclamation (Li 2000). Stripping of superficial naturalvegetation accelerated evaporation during which salt iscarried to the surface from deep down. Salinization hasled to abandonment of reclaimed farmland in theworst case.
Increased Flooding
Flooding in the Northeast is restricted to the firstphysiographic zone of valleys and low-lying terraces, aswell as the catchment area of the Nen and SonghuaRivers. The catchment area within Jilin and Heilongji-ang Provinces is the most prone to flooding. In itscontemporary history, it was badly affected by two tor-rential floods, one in 1969 and another in 1989.However, severe flooding has become much morefrequent at an interval of two to three years since the1980s (Xu and others 2003), a period highly coincidingwith the warming trend shown in Figure 3. The worstever flooding in the recorded history occurred in 1998.This unprecedented calamity affected 17.33 millionpeople and inundated 330,000 ha of farmland. A largequantity of the flooded farmland was ruined by sedi-mentation of silt or reverted to marshland and lakesafter being waterlogged. In either case, the affectedfarmland had to be abandoned altogether.
To a large degree the increased frequency andmagnitude of flooding can be traced back to inap-propriate changes from fallow land and woodland tofarmland. The middle and lower stretches of the NenRiver have the highest concentration of wetland inChina, with 20,000 km2 of marshland and 3,000 km2
of lakes and ponds (Wang and others 2003). Recla-mation of marshland as paddy (i.e., conversion ofwater into paddy at 257 639 ha, Table 1) to boost
rice output is blamed for wetland reduction in theThree Rivers Plain. Such reclamation has drasticallyreduced the buffer zone for storm water, causingwater level in the River to rise sharply during heavyrainfall.
In the Northeast, a total of 338,130 ha of wood-land (e.g., established forest) have been convertedinto farmland (Table 1). Such a change has contrib-uted to flooding in that deforestation and destructionof vegetation severely alter rainwater distribution onland surface. Instead of percolating downward, mostof the rainwater enters a channel directly during arainfall event, carrying soil from denuded farmlandwith it. Consequently, silt deposits that have beenwashed down from the reclaimed farmland raised theriverbed substantially, debilitating the Nen andSonghua Rivers in coping with flooding. It may betrue that the loss in woodland was hugely compen-sated by a higher gain from farmland (524,160 ha). Itmust be pointed out that newly planted saplings donot provide the same protection of the underlyingsoil as the mature forest.
Conclusions
During the 1990s, widespread changes in land use/cover took place in Northeast China. Farmland, grass-land, and fallow land decreased by 386,195, 140,075,and 99,240 ha, respectively. By comparison, woodland,built-up areas, and water expanded by 192,682,194,231, and 238,596 ha, respectively. Changes tofarmland occurred in the form of conversion towoodland, water, and built-up areas. These changesbore an interactive relationship with the environment,especially climate change. On the one hand, climatewarming created a potential environment for grasslandand fallow land to be changed to farmland as morecrops could thrive in the warmer climate, and for dryfield to paddy. On the other hand, the changed surfacecover modified the local climate. These changes, inturn, have adversely influenced the local environmentby accelerating land degradation in the agropastoralinterlocked west, causing salinization in the SongnenPlain, and exacerbating flooding in the catchment areaof the Nen River.
Apart from the above changes, more changes tookplace between non-irrigated field and paddy at the sub-category level. In total, 338,803 ha of paddy were cre-ated out of dry fields most of which were located in thenorthern provinces of Heilongjiang and Jilin in theupper reach of rivers where water resources are rela-tively bountiful. However, insufficient water resourcesforced 40,230 ha of paddy, mostly in Liaoning Province
Land Use/Cover Changes in Northeast China 699
in the lower reach of the same rivers, to revert to dryfield. Such a massive expansion of paddy had severerepercussions for the rational allocation of water re-sources and sustainable farming. More efforts shouldbe directed at coordinating rational allocation of lim-ited water resources among the three provincial gov-ernments to avoid chaotic and conflicting changes inland cover so that a maximum return can be reapedfrom the land over the entire Northeast, not just insome localities.
The results obtained in this study should be ofinterest to the international audience of EnvironmentalManagement for two reasons. First, as managers of theenvironment they must be aware that human activitiesbear an interactive relationship with the environment.It is insufficient to pay attention to the impact of hu-man activities on the environment. In addition, we alsoneed to direct our attention to the overall environmentunder which certain human activities can take place.Second, environmental consequences of human activ-ities can take place at or near the site of action, but canbe felt thousands of kilometres away. When examiningthe potential impact of human activities, these off-siteeffects have to be taken into consideration as well. Inorder to achieve this goal, we must adopt a spatiallyholistic approach to the environmental or resourceallocation problem. Otherwise, it is almost impossibleto come up with a solution that is able to tackle theproblem properly and effectively.
AcknowledgmentsThis research received financial support from the
Key Knowledge Innovation Project Fund at the ChineseAcademy of Sciences (project number: KZCX1-SW-19-01), the National Natural Sciences Foundation ofChina (grant number: 40171007), as well as the KeyScience and Technology Project, Ministry of Land andResources (grant number: 20010102). Additionalfunding for this project came from the VisitingResearchers by Outstanding Overseas Scholar Fund atthe Institute of Geographic Sciences and Natural Re-sources Research, Chinese Academy of Sciences. Weare deeply indebted to Chuanjun Wu and Jiyuan Liu atthe Chinese Academy of Sciences for providing valu-able materials and insightful comments during thesuccessful completion of this study. The NortheastInstitute of Geography and Agricultural Ecology inChangchun offered assistance in carrying out the fieldwork of this study. We are grateful for the constructivecomments four anonymous reviewers provided on anearly version of the paper.
Literature Cited
Ai M., W. Ai. 2002. Thoughts on the use of water resourcesand the development of rice paddy. Hydrospere (shuili ti-andi). 2002(10):32–33 (in Chinese).
Baban, S. M. J., and K. W. Yusof. 2001. Mapping land use/cover distribution on a mountainous tropical island usingremote sensing and GIS. International Journal of RemoteSensing 22:1909–1918.
Chen, J., P. Gong, and C. He. 2003. Land-use/land-coverchange detection using improved change vector analysis.Photogrammetric Engineering and Remote Sensing 69:369–379.
Gan, H., Y. Liu, and X. Li. 2003. Analysis of the correlativitybetween regional land use change and water resourcesoptimal use. Journal of Nanjing Normal University (NaturalScience) 26:82–88 (in Chinese).
Gao, Z. Q., and X. Z. Deng. 2002. Analysis on spatial featuresof LUCC based on remote sensing and GIS in China.Chinese Geographical Science 12:107–113.
Gautam, A. P., E. L. Webb, and A. Eiumnoh. 2002. GISassessment of land use/land cover changes associated withcommunity forestry implementation in the Middle Hills ofNepal. Mountain Research and Development 22:63–69.
Hayes, D. J., and S. A. Sader. 2001. Comparison of change-detection techniques for monitoring tropical forest clear-ing and vegetation regrowth in a time series. Photogram-metric Engineering and Remote Sensing 67:1067–1075.
Kaufmann, R. K., and K. C. Seto. 2001. Change detection,accuracy, and bias in a sequential analysis of Landsat imageryin the Pearl River Delta, China: Econometric techniques.Agriculture Ecosystems and Environment 85:95–105.
Lahmer, W., B. Pfutzner, and A. Becker. 2001. Assessment ofland use and climate change impacts on the mesoscale.Physics and Chemistry of the Earth, Part B: Hydrology, Oceansand Atmosphere 26(7–8):565–575.
Li, X. 1997. Integration of remote sensing and GIS for moni-toring and evaluating agricultural land loss: a case study ofDongguan. Acta Geographica Sinica 52:279–287 (in Chinese).
Li, X. J. 2000. The Alkili-saline land and agricultural sus-tainable development of the Western Songnen plain inChina. Scientia Geographica Sinaca 20:51–55 (in Chinese).
Liu, X. N., and F. Huang. 2002. Analysis of the regional eco-environmental effect driven by LUCC. Journal of NortheastNormal University 34:87–93 (in Chinese).
Liu, Y. S., and B. M. Chen. 2002. The study framework of landuse/cover change based sustainable development in China.Geography Research 21:324–341 (in Chinese).
Lo, C. P., and X. Yang. 2002. Drivers of land-use/land-coverchanges and dynamic modeling for the Atlanta, Georgiametropolitan area. Photogrammetric Engineering and RemoteSensing 68:1073–1082.
Lohmar, B., A. Somwaru, and K. Wiebe. 2002. The ongoingreform of land tenure policies in China. Agricultural Out-look, September 2002, Economic research Service, USDA. p15–18.
Mas, J. F. 1999. Monitoring land-cover changes: A comparisonof change detection Techniques. International Journal ofRemote Sensing 20:139–152.
700 Liu and others
Newkirk, R. T., and F. Wang. 1990. A common knowledgedatabase for remote sensing and geographic information ina change-detection expert system. Environment and PlanningB: Planning and Design 17:395–404.
Petit, C., and E. F. Lambin. 2001. Integration of multi-sourceremote sensing data for land cover change detection.International Journal of Geographical Information Science15:785–803.
Qiu, S. W., B. Zhang, and Z. C. Wang. 2003. Status, featuresand management practices of land desertification in thewest of Jilin Province. Scientia Geographica Sinica 23:188–192(in Chinese).
RASIT, Rural Area Socioeconomic Investigation Team, StateStatistics Bureau. 2001. Rural Area Statistical Yearbook ofChina, China Statistics Press, Beijing (in Chinese).
Reid, R. S., R. L. Kruska, N. Muthui, A. Taye, S. Wotton, C. J.Wilson, and W. Mulatu. 2000. Land-use and land-coverdynamics in response to changes in climatic, biological andsocio-political forces; The case of southwestern Ethiopia.Landscape Ecology 15:339–355.
Shi, P. J., J. Chen, and Y. Z. Pan. 2000. Landuse changemechanism in Shenzhen City. Acta Geographica Sinica55:151–160 (in Chinese).
Sun, Y. F., and C. H. Qu. 2002. A few recommendations onchanging dry fields into rice paddy through irrigation usingwell waters. Modern Agriculture 2002(10):47–48 (in Chi-nese).
Turner II, B. L., W. B. Meyer, and D. L. Skole. 1994. Globalland use/land cover change: towards an integrated study.Ambio 23:91–95.
Verburge, P. H., G. H. J. De Koning, and K. Kok. 1999. Aspatial explicit allocation procedure for modelling the
pattern of land use change based upon actual land use.Ecological Modelling 116:45–61.
Wang, A. H., S. Q. Zhang, and B. Zhang. 2003. A study on thechange of spatial pattern of wetland in the Sanjiang Plain.Acto Ecologica Sinica 23:237–243 (in Chinese).
Xu, S. G., L. W. Dang, and Z. L. Mu. 2003. Environmentimpact analysis of Nen River�s severe flood in 1998.Journal of Dalian University of Technology 43:114–118 (inChinese).
Yan, M. H., W. Deng, and X. H. Ma. 2001. Climate variation inthe Sanjiang Plain disturbed by large scale reclamationduring the last 45 years. Acta Geographica Sinca 56:159–170(in Chinese).
Yang, J. P., and Y. J. Ding. 2002. Interdecadal fluctuation ofdry and wet climate boundaries in China in the past 50years. Journal of Geographical Sciences 12:397–404.
Yang, X., and C. P. Lo. 2002. Using a time series of satelliteimagery to detect land use and land cover changes in theAtlanta, Georgia metropolitan area. International Journal ofRemote Sensing 23:1775–1798.
Zhang, G. P., J. Y. Liu, and Z. X. Zhang. 2003a. Analysis ofdeforested land reclamation during the late 20th century inChina based on remote sensing and GIS. Geographical Re-search 22:221–226 (in Chinese).
Zhang, G. P., J. Y. Liu, and Z. X. Zhang. 2003b. Spatial tem-poral changes of cropland in China for the past 10 yearsbased on remote sensing. Acta Geographica Sinca 58:323–332(in Chinese).
Zhang, Q., J. Wang, and X. Peng. 2002. Urban built-up landchange detection with road density and spectral informa-tion from multi-temporal Landsat TM data. InternationalJournal of Remote Sensing 23:3057–3078.
Land Use/Cover Changes in Northeast China 701