land use land cover change analysis using multi temporal … · modeling and prediction of land use...
TRANSCRIPT

IJST © 2016– IJST Publications UK. All rights reserved. 309309309
International Journal of Science and Technology Volume 5 No. 7, July, 2016
Land use land cover change Analysis using Multi Temporal Landsat data in Gilgel Gibe, Omo Gibe Basin, Ethiopia
Wakjira Takala, Tamene Adugna and Dawud Tamam
School of Civil and Environmental Engineering, Jimma Institute of Technology, Jimma University, Jimma, Ethiopia.
ABSTRACT
Land use land cover change is the general term for human and natural modification of the earth’s terrestrial surface at a variety of spatial
and temporal scale. This change lends the need of knowing the type of change, when and where they occur with their extent and rates.
Hence, effective information regarding the environmental responses of land use land cover changes are important to hydrologists, land use
planners, watershed management and decision makers to formulate and implement effective and appropriate response strategies to
minimize the undesirable effects of future land use land cover change. Consequently, this study was aimed at assessing the land use land
cover changes of Gilgel Gibe catchment between 1987, 2001 and 2010. Particularly, the study have analyzed land use land cover changes
that were assumed to take place in the Catchment for the past 24years. The Land use maps of 1987, 2001 and 2010 were derived from
satellite images and processed using ERDAS Imagine 9.1 and ArcGIS10.1 software. Change detection analysis and accuracy assessment
was done after Image processing and classification with spatial analysis tools. The outcome of land cover change analysis shows an
increment of agricultural land from 54.51% to 56.54%, Urban and built up area from 2.22% to 4.06%, range land from 30.02% to 31.55%
while decreasing proportion of forest land from 12.82% to 7.63%, Water body from 0.42% to 0.22% for the recent period between 2001
and 2010. The accuracy assessment of land cover classification indicates an overall accuracy of 83.87%, 82.18%, 89.29% and kappa
coefficient of 0.7848, 0.7691, and 0.86 respectively for 1987, 2001 and 2010 map.
Key words: Environmental Response, ERDAS Imagine, Land Use Land Cover Change, Watershed Management
1. INTRODUCTION
The need of producing more food and maintaining ecosystem
services were undermining the environment by altering the
availability of different biophysical resources. The strong
relationship between land use and land cover from these systems
has contributed great concern to the basic planet characteristics
and process. Productivity of the land, diversity of plant and
animal species, hydrological cycles, ecological and
environmental conditions are some of the anxieties. This was
basically depending on the fact that, land use change is the
proximate cause of the land cover change (Sherbinin, 2002).
Expansion and intensification of agricultural lands, development
of urban areas and the need of extracting timber and other
products are accelerating over time to meet the needs of an
increasing population. Under such circumstance, handling the
land and water resources in achieving high productivity would
be difficult to be realized without degrading the resources. This
results in the land use land cover change leading to a decreased
availability of the products and services of the livelihood. The
severity of the dynamic land use changes as a result of population
increment, expansion of the agricultural sector and climatic
conditions were increasing in Ethiopia (Getachew and
Melesse,2012).
Despite a strong potential for increased agricultural productivity,
south-western Ethiopia is environmentally challenged mainly
due to resource degradation, soil erosion and nutrient depletions.
Gilgel Gibe catchment is one amongst such land resources which
are subjected to the land use land cover dynamics (Amsalu,
2010). The catchment is occupied and cultivated by large number
of smallholding farmers. Poor land management practices
coupled with the rugged topography, erosive rainfall regime in
the area and nutrient depletions posed major threats in the
catchment (Tefera, 2006). In addition, the increased demand of
resources by the alarmingly growing population has resulted in
biophysical resource degradations which would lead to a
decreased availability of different products and services for
human, livestock, agricultural production and damage to the
environment as well (Dereje, et al., 2009). As a result, the life
span of Gilgel Gibe Reservoir is under question unless the threats
are alleviated. Alleviating this multifaceted problems of the basin
requires proper, coherent and organized land developments for
which the land use land cover situation of the area was an input.
However, the quantitative data on the land use land cover change
and clear insight into the local contributions of the change in the
Gilgel Gibe catchment were absent. Therefore, the need of
scientific research in analyzing the LULC change evolution and
developing technical tools to quantify the extent of the change in
Gilgel Gibe basin were imperative. Systematic and careful
planning, the development of new patterns of land cover and land

International Journal of Science and Technology (IJST) – Volume 5 No. 7, July, 2016
IJST © 2016– IJST Publications UK. All rights reserved. 310310310
use can enhance the well-being of the community and ecosystem
(Millennium Ecosystem Assessment, 2005).
Modeling and prediction of land use change is essential to assess
the consequent environmental impacts of the LULCC event.
Simulation of plausible human influenced land use changes
following different scenarios may reveal strategic policies that
should be modified to improve the environmental effects of the
LULCC. Hence, the most important goals of catchment
modelling are to quantify and predict the effects of global change
at catchment scale, particularly for future water resource
development and extreme events (Houet and Hub ert-moy,2006).
The estimation and understanding of the land use land cover
Change requires accurate assessment of the type and direction of
changes occurring in the catchment through change detection
analysis of multi-temporal remotely sensed image. Various
quantification methods were used with the spatial data handling
capabilities of geographic information systems (GIS) to process
data. This was done by integrating ERDAS imagine 9.1 with Arc
GIS 10.1 to process, quantify and detect the land use land cover
changes. Finally, accuracy assessment was done to reveal
information on the status of land use classification.
2. DESCRIPTION OF THE STUDY AREA
The study area was situated on the upstream of the large Omo
Gibe basin in the South-Western part of Ethiopia, in Oromia
regional state at some 260km from Addis Ababa and about 70
km North-East of Jimma. Gilgel Gibe lies between 7o 19 07.15
and 8o1209.49 North latitudes and 36o3142.60 and
37o2516.05 East longitudes with the catchment area of 4225km2.The basin is generally characterized by high relief hills and mountains with an average elevation of about 1700m above mean sea level and by a wet climate with an average annual rainfall of about 1550 mm and an average temperature of 19oc.
Figure 1. Location map of Gilgel Gibe catchment
3. MATERIALS AND METHODS 3.1. Digital Elevation Model (DEM)
A digital elevation model (DEM) of 30m by 30m was
downloaded from the United States Geological Survey (USGS)
website by path and row search of the study area via a dataset of
a digital elevation of Shuttle Radar Topography Mission (STRM)
with 1 acre. A path-row search of 169_054, 169_055, 170_054
and 170_055 were mosaicked and used for delineation and
topographic characterization of the basin.

International Journal of Science and Technology (IJST) – Volume 5 No. 7, July, 2016
IJST © 2016– IJST Publications UK. All rights reserved. 311311311
3.2. Land use land cover data classification schemes
Based on the prior knowledge of the study area and additional
information from previous research, physical site observation
and interviewing the concerned body in the study area, five
different types of land use and land cover have been identified
for Gilgel Gibe catchment. These are forest lands, urban and built
up areas, range land, agricultural land and water body (table 1).
In this study land use land cover classification system developed
by Anderson, et al.,(1976) was used as basis of the classification.
Table 1: Land cover categories of Gilgel Gibe catchment
Land cover class Description
Forest land Areas covered with dense growth of trees that include: ever green forests, mixed forest land, deciduous forest lands. Plantations of indigenous specious of trees were also considered here.
Range land Sparsely located trees with brush and shrub form types, bushes, wood lands, mixed range lands and transitional forests(less dense forests) were included.
Agricultural land Areas used for crop cultivation (both annual and perennials), scattered rural settlements, some pastures and plantations around settlements. Sparsely located settlements were included here as it was difficult
to separate them from agricultural lands.
Urban and built up Residential, commercial and services, recreational sites, public installation, infrastructures. Due to their similar reflectance, bare lands were considered here.
Water body Rivers, streams, reservoirs
3.3. Site Observation
Site observation and field works by GPS was conducted on
selected weredas in the catchment to get a physical
characteristics and land use features of the catchment and for
ground truth verification of the mapped features and accuracy
assessment. Based on the result of previous study held in the
catchment by Kissi, 2010 and Tamene, et al., 2013, some parts
of Kersa wereda, Seka and Dimtu has required special attention
so as to know the factors deriving the changes. Information on
these areas were obtained through discussion with key informants
and group discussions. Elders who are longtime residents of
the areas and guards of the forests (on protected areas) were
selected for the study discussion. During the discussion and
interviews, the main focus were to obtain the past and present
trend of land use land cover information and the factors
contributing to the changes.
3.4. Landsat Images and Image Processing
For this study, two sets of Landsat TM imagery (for the period
of 1987 and 2010) and one set of ETM+ image (for the period of
2001) were obtained from Global Land Cover Facility (GLCF)
for the analysis of LULC change. Due to the presence of cloud
cover on the Landsat 1987 imagery from GLCF, it was replaced
with the data obtained from USGS only for 1987 data. Due to the
extent and quality concern, full images for a given year covering
the whole catchment is not available; as a result the Landsat
images were assembled around a given year as closely as
possible. To minimize the impacts of a seasonal variation in
vegetation pattern and distribution throughout a year, the
selection of dates of the acquired data were made as much as
possible in the same annual season of the acquired years. The
images were identified by the Landsat grid describing path (p)
and row(r) and consequently two paths and two rows were used
to get the Landsat images covering the whole catchment as
shown in table 2.

International Journal of Science and Technology (IJST) – Volume 5 No. 7, July, 2016
Table 2: TM and ETM+ satellite data characteristics
Index Sensor Path_Row Spatial resolution(m)
Acquisition date Producer Used bands
Around
1987
TM
169_054 30 30-12-1986 USGS 1-5,7
169_055 30 30-12-1986 USGS 1-5,7
170_054 30 06-01-1987 USGS 1-5,7
170_055 30 22-01-1987 USGS 1-5,7
Around
2001
ETM+
169_054 30,15 22-11-2000 GLCF 1-5,7,8
169_055 30,15 22-11-2000 GLCF 1-5,7,8
170_054 30,15 05-02-2001 GLCF 1-5,7,8
170_055 30,15 05-02-2001 GLCF 1-5,7,8
Around
2010
TM
169_054 30 27-11-2009 GLCF 1-5,7
169_055 30 30-01-2010 GLCF 1-5,7
170_054 30 05-11-2010 GLCF 1-5,7
170_055 30 05-11-2010 GLCF 1-5,7
*in the table above, spatial resolution of 15m is used for the panchromatic band 8.
Source: Author, 2015
Due to their low spatial resolution (120 and 60 m) the thermal
bands (band 6, bands 6.1 and 6.2) from TM and ETM+ were not
used in this study. For the ETM+, the 30 m multispectral image
was fused with the 15 m panchromatic band (band 8) using the
Principal Component Analysis (PCA) method found in ERDAS
to improve the visualization and interpretation of the image.
After completing the pre-processing of the image, to view,
discriminate and interpret the surface features of the study area
clearly for the future classification, all the input satellite images
were composed with the standard RGB “false color composition
(FCC)” of the satellite image for the study area. The choice of
band combinations were selected depending on the applicability
of each band as each band is a set of data file for specific portion
of the electromagnetic spectrum in identifying the features of the
study. The characteristics of each bands with their application is
tabulated as in table 3.
Table 3: TM and ETM+ bands, wavelength and application
Band Name Band width(µm) Application
1 Blue 0.45-0.515 -soil and vegetation discrimination
-bathymetry and coastal mapping -cultural/ urban features
2 Green 0.525-0.605 -green vegetation mapping and cultural/urban features
3 Red 0.63-0.69 -vegetated and non-vegetated mapping -cultural/urban features
4 NIR-1 0.75-0.90 -delineation of water body -soil moisture discrimination
5 MIR 1.55-1.75 Vegetation moisture discrimination
-soil moisture discrimination -differentiation of snow and ice
6 TIR 10.4-12.5 -vegetation and soil moisture analysis -thermal mapping
7 NIR-2 2.09-2.35 -discrimination of minerals and rocks -vegetation moisture analysis
8* Panchromatic 0.52-0.9 -on Landsat 7 only, has 15 m resolution, used to “sharpen” images
Source: Erdas field guide, 2010
IJST © 2016– IJST Publications UK. All rights reserved. 312

International Journal of Science and Technology (IJST) – Volume 5 No. 7, July, 2016
IJST © 2016– IJST Publications UK. All rights reserved. 313313313
Based on the above information, the following band
combinations were used to display images with the order of the
bands corresponding to the red, green, and blue (RGB) color
guns. Bands 3, 2, 1 create a true color composite and bands 4, 3,
2 create a false color composite for both Landsat TM and ETM+
of satellite imageries.
Landsat TM 1987 Landsat ETM+2001 Landsat TM 2010
Figure 2: Band combination of mosaicked images in FCC for Landsat TM and ETM+
Image of 1987 image of 2001 image of 2010
Figure 3: Band combination of AOI (subset) images in FCC for Landsat TM and ETM+
3.2 Image Classification
This operation has involved the investigation of multispectral
image and the application of statistically based decision rules to
determine the land cover identity of each pixel in an image. First,
pattern recognition with the enhanced image to sort certain
textures and colors into category based only on spectral radiances
were considered as spectral pattern recognitions classification
system. On the other hand decisions depending on geometric
shape, size and patterns of the image data was done. In the two
situation above, the determined classification system was aimed
to categorize all pixels in a digital image into a classes of land
cover. These category results are then used to produce thematic
maps of the land cover present in an image and produce statistical
summary of the areas covered by each land cover type.
The classification scheme has to have classes that can be used for
the study and discernible from the available data. For this
purpose Anderson, et al., 1976 classification scheme was applied
for the land use land cover classification.
There are two types of image classification systems: supervised
and unsupervised classification. Unsupervised classification uses
ISODATA (Iterative Self-Organizing Data Analysis Technique)
clustering method which applies spectral distance as in the
sequential method to classify pixels iteratively (ERDAS Field
Guide, 2010). Because the ISODATA method is iterative,
sometimes there exists miss classification of the land use. For
example, water body might be classified as forest land.

International Journal of Science and Technology (IJST) – Volume 5 No. 7, July, 2016
IJST © 2016– IJST Publications UK. All rights reserved. 314314314
Therefore, in this study unsupervised classification was used
only to generate and compare a basic set of classes, and then
supervised classification was used for further definition of the
classes and thematic map preparation.
For this study, the land cover map was produced based on the
pixel based supervised classification through the steps of: First,
selecting of the training sites which are typically representative
for the land cover classes. Training data sets were generated from
the processed and after sub-setting images with the aid of ground
truth. To make training sites clear and representative, personal
experience and the physiographical knowledge of the area were
supported with field works. In addition, image enhancement and
composition were applied for better discriminating the land cover
classes. Different color combinations were also applied to
identify the feature classes clearly.
With a Polygon sampling approaches a 120 training sites were
collected from each images (images of 1987, 2001 and 2010).
For a single class a minimum of 20 training sites were taken to
create signatures. After established training sites each training
sites were stored in signature editor and color desired for the
particular feature class. The extracted signatures were evaluated
using histogram technique and different trials were taken until
unimodal distributions of each band is achieved. Then, signatures
of the same class were merged by selecting all the signatures of
the each class. Finally, it is the cumulated (merged signature)
which the supervised classification has used for the land cover
map production.
To avoid the disturbance of the classes having nearly similar
reflectance, different band combination for each class were
compared. From the parametric and non-parametric decision
rules in supervised classification system, parametric decision
rule was selected as it depends on the statistical descriptors (mean
and covariance matrix) of the pixels assigned as a training sample
for the Land Cover class. Minimum distance and maximum
likelihood parametric classifiers were compared and the
maximum likelihood decision rule was selected as it results in a
better result for this study. Hence, maximum likelihood classifier
parametric rule found in the supervised classification of ERDAS
9.1 was used to reclassify each pixels on the basis of known
ground truth. The reclassified images was developed based on
the selected area of interest. Finally the AOI was extracted
from the images as vector data and its areal extent was derived
from the shape file.

International Journal of Science and Technology (IJST) – Volume 5 No. 7, July, 2016
IJST © 2016– IJST Publications UK. All rights reserved.
315315315
Landsat Imagery
TM Imagery of 1987 ETM+ Imagery of 2001 TM Imagery of 2010
Layer Stacking & Image Stretching
Mosaicking
(Scene combination)
Sub setting (Clipping the study area)
AOI Shape file
Image Fusion, Enhancement & Color Composition
Spatial & Spectral Enhancement
Algorithm Selection
Unsupervised Classification Supervised Classification
Ground Truth
Training site development
Signature Editor-AOI
Evaluation of training data
Histogram Matching
Editing Signiture
Applying decision rule
Parametric
Grouping All Spectral signature Class Recoding Land Class Assignment
Land use Land cover Map Color Selection
Land Use Land Cover
Change Detection Analysis
Ground Truth
Accuracy Assessments
Original Map

International Journal of Science and Technology (IJST) – Volume 5 No. 7, July, 2016
IJST © 2016– IJST Publications UK. All rights reserved.
316316316
Figure 4: Steps for the land use land cover classification
3.3 Accuracy Assessment
The process of doing an accuracy assessment involves generating
a set of points from the classified imagery and comparing the
positions of points whose location were determined by the
ground truth data and corresponding coordinates from the
original maps. Random selection of reference pixels were used
to reduce the biases of using same pixels for testing classification
that were used in training samples as they were the basis of the
classification.
Confusion matrix and kappa coefficients were used as a means
of evaluating image classification accuracy. The results of Kappa
coefficients were interpreted according to Anthony, et al.,(2005)
Kappa value characteristics. Kappa value greater than 0.8
denotes a strong agreement, value between 0.4 and 0.8 denotes a
moderate agreement and a value below 0.4 represent poor
agreement.
Steps followed to evaluate the accuracy assessment were:
1. Reference data were collected by GPS from the field
through careful site visiting and reviewing study documents on the area. In addition, google earth was
used to collect ground truth for land use class
assessment.
2. The collected reference data were then, compared to
the classified map with the class types assigned from
the reference data. At this stage the original imagery
(before undergoing preprocessing phase) were used for
classification result comparison.
3. In this study a sample size of 113,101 and 93 points were collected for Landsat images of 1987, 2001 and 2010 through systematic sampling.
4. Finally, the data were summarized and quantified by using error matrix and kappa coefficient.
4. RESULT AND DISCUSSION 4.1. Land Use Land Cover Maps
The study from the ground truth data and classified Landsat
images of 1987, 2001 and 2010 has revealed that, the catchment
has undergone numerous land use and land cover changes over
time. Figure 5, 6 and 7 shows the land use land cover map of
Gilgel Gibe catchment for the period of 1987, 2001 and 2010
respectively.
Figure 5: Classified land use and land cover map of Gilgel Gibe basin in 1987

International Journal of Science and Technology (IJST) – Volume 5 No. 7, July, 2016
IJST © 2016– IJST Publications UK. All rights reserved. 317317317
Figure 6: Classified land use and land cover map of Gilgel Gibe basin in 2001
Figure 7: Classified land use and land cover map of Gilgel Gibe basin in 2010
Due to the creation of the Gilgel Gibe I reservoir in 1996, the
coverage of water body has increased in the catchment for the
LULC study of 2010. When the coverage percent of the land
cover types are compared with the results of 1987 and 2001, the
increment in water body would lead in to unreasonable result.
There fore the surface area of the reservoir has required special
consideration in order not to lead in wrong conclusion for the
change of water body.
As there exists a LULCC in the surface area of the reservoir, the
reservoir area was separated from the whole catchment for a
particular analysis. Independent LULC maps were prepared to
the reservoir areas of the water body for 1987,2001 and 2010
sepaeately. Then, the area was substracted from the whole
catchment for change detaction analysis in study area.

International Journal of Science and Technology (IJST) – Volume 5 No. 7, July, 2016
IJST © 2016– IJST Publications UK. All rights reserved. 318318318
To avoid the effect of varying land use map preparation for the
whole catchment and the reservoir area, the follwing technique
was developed. First, map of the whole catchment was prepared
for the study periods of 1987, 2001 and 2010. From the map
result of 2010, shape file for the reservoir area was prepared by
digitizing surface area of the water body. This shape file was then
used to subset the reservoir area for 2010, 2001 and 1987 maps.
) b)
The areal coverage of landcover types was quantified for the
resrvoir area. Finally, the reservoir area was substracted from the
whole catchment for change detaction analysis. The figure 8
below shows the land use maps of the reservoir area for
1987,2001 and 2010 respectively.
A
C)
Figure 8: A, B, C: Land use land cover map of the reservoir area of 1987, 2001 and 2010 period respectively.

International Journal of Science and Technology (IJST) – Volume 5 No. 7, July, 2016
IJST © 2016– IJST Publications UK. All rights reserved. 319319319
LULC Class
categorie s
1987 2001 2010
Area(ha )
% Area(ha )
% Area(ha )
%
Agricultu ral land
223626. 78
54.3 7
224374. 36
54.5 1
232553. 28
56.5 4
Forest land
39824.8 6
9.68 52781.1 58
12.8 2
31383.2 4
7.63
Urban and built up
6666.3 1.62 9131.76 29
2.22 16700.8 4.06
Water body
2924.43 0.71 1729.42 5
0.42 893.01 0.22
Range land
138251. 25
33.6 1
123576. 92
30.0 2
129763. 23
31.5 5
Total 411293. 62
100 411593. 63
100 411293. 56
100
Are
a(H
a)
The result of the land use land cover change and the actual percentages
covered by the classes in the catchment shown in table 4 below was
developed by excluding the area of the reservoir.
Table 4: Land use land cover change percentages
The distribution of the LULC change was summarized as in
figure 9 below. This was important for the development of
LULCC scenario. The result indicates agricultural land and
urban and built up area has shown continues increment. Whereas,
water body is getting decline throughout the study period (over 23 years). This could be resulted from the need of an increasing population to get the resources. Resources like water and land are finite, whereas the need to use these resources are increasing from time to time. In addition to their limited existence, human and natural process are imposing pressure on the resources. As a result, the coverage of these fresh resources are getting diminished. On the other way, population growth persuades land
use changes through the use of more land for cultivation reducing
the land occupied with natural ecosystems. An increase of urban
areas would be as a result of migration of population from rural
to the urban areas.
This indicates, unless the mode of utilizing and handling of the
resources are changed, we loss the resources in short period with
which sustainable development would not be achieved. This
would necessitates human intervention at different level
(governmental and non-governmental involvements), for proper
utilization of the resources without damaging the resources so
that the future generations will get it.
250000
200000
150000
100000
50000
1987
2001
2010
0
Forest Land Urban and Built Up Range Land Agricultural Land Water Body
Land Use Categories
Figure 9: Land use land cover distribution of 1987, 2001 and 2010
From the study result, there is a significant LULCC in the
catchment where, agricultural land covered 54.37% in 1987 has
increased to 54.51% in 2001 and increased to 56.54% in 2010.
Even though, it shows an increment in both cases, the rate of an
increment is different (the latter is at a greater rate). This
increment could be related to a high population demand for
different cultivation practices. The area covered by urban and
built up has shown a maximum rate of increment. This could be
attributed to the increase in population that has increased the
need for built up lands and infrastructure (road, and urban areas)
developments in the catchment. The forest land has shown an
increment from 9.68% in 1987 to 12.82% in 2001 whereas, the
range land has shown a decrement from 33.61% in 1987 to
30.02% in 2001. The result of the ground truth and interview
analysis has shown that the reason of an increment was due to
the conversion of range land especially shrub lands to forest in
2001. On the other hand from 2001 to 2010 forest cover has
decreased from 12.82% to 7.63%. This could be brought due to
the cutting of forests for the increased need of an agricultural land
and the need of urban and built up expansions. Water body has
shown a decreasing rate of 0.71% to 0.42% for 1987 and 2001
periods and from 0.42% to 0.22% in 2010. The range land has
increased for the period of 2001 to 2010, this could be due to the
plantations of Ethiopian millennium at different areas especially
International Journal of Science and Technology (IJST) – Volume 5 No. 7, July, 2016
IJST © 2016– IJST Publications UK. All rights reserved. 320320320
Per
cen
tage
of
LULC
Ch
ange
in Bada Buna, limmu, kersa, Seka and forests are converted to
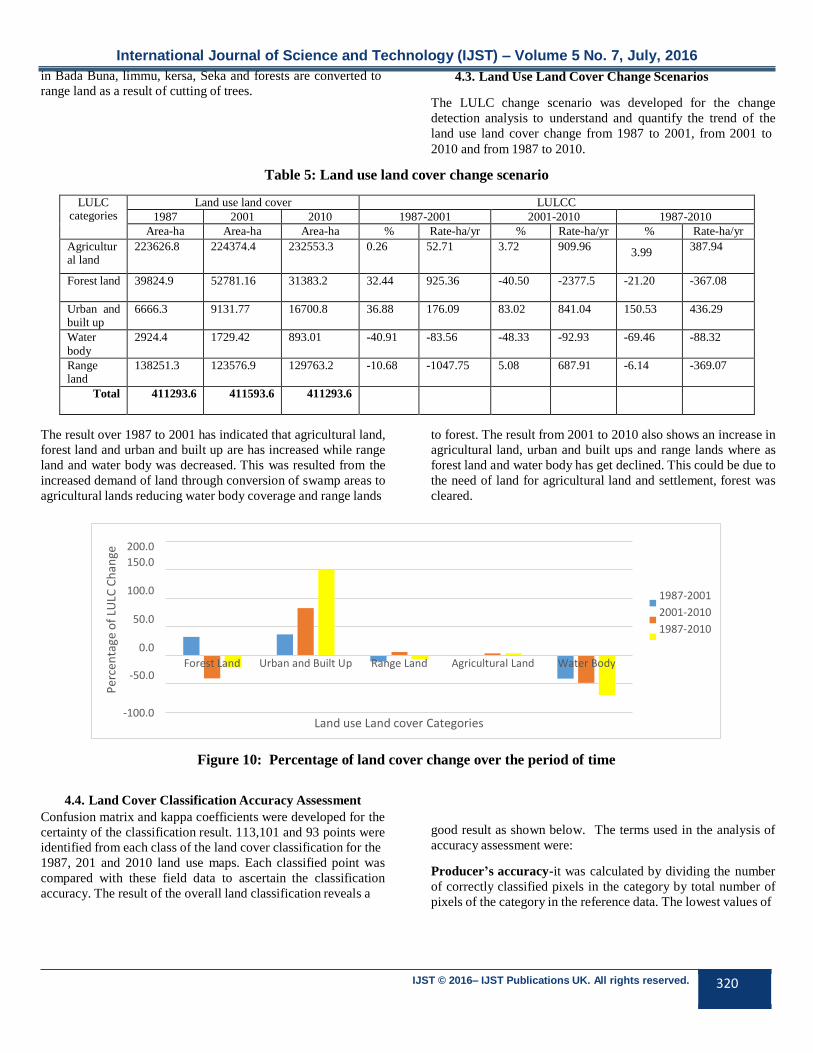
range land as a result of cutting of trees. 4.3. Land Use Land Cover Change Scenarios
The LULC change scenario was developed for the change
detection analysis to understand and quantify the trend of the
land use land cover change from 1987 to 2001, from 2001 to
2010 and from 1987 to 2010.
Table 5: Land use land cover change scenario
LULC categories
Land use land cover LULCC
1987 2001 2010 1987-2001 2001-2010 1987-2010
Area-ha Area-ha Area-ha % Rate-ha/yr % Rate-ha/yr % Rate-ha/yr
Agricultur al land
223626.8 224374.4 232553.3 0.26 52.71 3.72 909.96 3.99
387.94
Forest land 39824.9 52781.16 31383.2 32.44 925.36 -40.50 -2377.5 -21.20 -367.08
Urban and built up
6666.3 9131.77 16700.8 36.88 176.09 83.02 841.04 150.53 436.29
Water
body
2924.4 1729.42 893.01 -40.91 -83.56 -48.33 -92.93 -69.46 -88.32
Range land
138251.3 123576.9 129763.2 -10.68 -1047.75 5.08 687.91 -6.14 -369.07
Total 411293.6 411593.6 411293.6
The result over 1987 to 2001 has indicated that agricultural land,
forest land and urban and built up are has increased while range
land and water body was decreased. This was resulted from the
increased demand of land through conversion of swamp areas to
agricultural lands reducing water body coverage and range lands
to forest. The result from 2001 to 2010 also shows an increase in
agricultural land, urban and built ups and range lands where as
forest land and water body has get declined. This could be due to
the need of land for agricultural land and settlement, forest was
cleared.
200.0
150.0
100.0
50.0
0.0
-50.0
Forest Land Urban and Built Up Range Land Agricultural Land Water Body
1987-2001
2001-2010
1987-2010
-100.0
Land use Land cover Categories
Figure 10: Percentage of land cover change over the period of time
4.4. Land Cover Classification Accuracy Assessment
Confusion matrix and kappa coefficients were developed for the
certainty of the classification result. 113,101 and 93 points were
identified from each class of the land cover classification for the
1987, 201 and 2010 land use maps. Each classified point was
compared with these field data to ascertain the classification
accuracy. The result of the overall land classification reveals a
good result as shown below. The terms used in the analysis of
accuracy assessment were:
Producer’s accuracy-it was calculated by dividing the number
of correctly classified pixels in the category by total number of
pixels of the category in the reference data. The lowest values of

International Journal of Science and Technology (IJST) – Volume 5 No. 7, July, 2016
IJST © 2016– IJST Publications UK. All rights reserved. 321321321
the producer’s accuracy was resulted from misclassification due
to the spectral similarity of the land cover classes. Swampy lands
with forest land, agricultural land with range lands were some
among these.
Overall accuracy- it was calculated by dividing the total number
of correct pixels by the total number of pixels in the confusion
matrix. From the result, the application of the map will determine
the level of the accuracy to accept.
User’s accuracy-it is the ratio of pixels correctly belonging to a
class (diagonal portion) and the total number of pixels assigned
to the same class by the row total.
Kappa coefficient-it describes the proportionate reduction in
error generated by the classification process compared with the
error of a completely random classifications. For example 0.8657
kappa index implies that the classification process is avoiding 86.57 percent of the errors that a completely random classification would generate.
Table 6: Confusion matrix and kappa index of the 1987 land use classification
Reference data
Cla
ssif
icat
ion
dat
a
Al Fl Rl Ua Wb Total User’s accuracy Kappa index
Al 31 0 2 5 1 39 79.49% 0.6821
Fl 1 15 2 1 1 20 75% 0.7019
Rl 1 0 16 0 0 17 94.12% 0.9240
Ua 0 0 0 4 0 4 100% 1.000
Wb 0 0 1 0 12 13 92.31% 0.9094
Total 33 15 21 10 14 93
Producer’s accuracy
93.94%
100%
76.2%
40%
85.7%
Overall accuracy
83.87%
0.7848
Note: Al-agricultural land; Fl-forestland; Rl-range land; Ua-urban and built up; Wb-water body
Table 7: Confusion matrix and kappa index of the 2001 land use classification
Reference data
Cla
ssif
icat
ion
dat
a
Al Fl Rl Ua Wb Total User’s accuracy Kappa index
Al 29 0 2 5 0 36 80.56% 0.7154
Fl 1 18 5 0 1 25 72% 0.6509
Rl 1 2 14 0 0 17 82.35% 0.7772
Ua 0 0 0 11 0 11 100 1.000
Wb 1 0 0 0 11 12 91.67% 0.9094
Total 32 20 21 16 12 101
Producer’s
accuracy
90.6%
90%
66.7%
68.75%
91.7%
Overall accuracy
82.18%
0.7691
Note: Al-agricultural land; Fl-forestland; Rl-range land; Ua-urban and built up; Wb-water body

International Journal of Science and Technology (IJST) – Volume 5 No. 7, July, 2016
IJST © 2016– IJST Publications UK. All rights reserved. 322322322
Al Fl Rl Ua Wb Total User’s accuracy
Al 15 0 0 1 0 16 93.75%
Fl 0 24 2 0 1 27 88.89%
Rl 3 1 21 0 1 26 80.77%
Ua 2 0 0 20 0 22 90.91%
Wb 1 0 0 0 20 21 95.24%
Total 21 25 23 21 22 112
ucer’s uracy
71.4%
96%
91.3%
95.24%
90.9%
Overall accuracy
89.29%
Cla
ssif
icat
ion
dat
a
Table 8: Confusion matrix and kappa index of the 2010 land use classification
Reference data
Kappa index
0.9231
0.8570
0.7580
0.8881
0.9407
Prod acc
Note: Al-agricultural land; Fl-forestland; Rl-range land; Ua-urban and built up; Wb-water body
0.8657
5. CONCLUSION The advancement of computational power and the availability of
spatial and temporal data has made GIS and remote sensing being
attractive tools to examine and analyze how the LULC process
of the catchment takes place. Particularly, in this study ERDAS
Imagine was found to be useful tool for investigating land use
land cover dynamics at various spatial and temporal scales.
The result of land use land cover dynamics shows that
agricultural land and urban and built up area is getting increased
for the study period. Whereas water body and forests are getting
decreased for the recent study period (2001 to 2010). This
increment is contributing to the increased runoff which disturbs
the ecological functioning of the area.
Accuracy assessment of land use classification by confusion
matrix and kappa index shows, an overall accuracy of 83.87%,
82.18%, 89.29% and kappa coefficient 0.7848, 0.7691, 0.86
respectively for 1987, 2001 and 2010 map. The result indicates
the availability of data for recent map is accurately mapped than
the others.
The study acknowledges that the out looks into future sustainable
land and water resources of Gilgel Gibe catchment shall depend
on the spatial planning of land use with the objective of
optimizing the environmental benefit through surface runoff
control, erosion protection, flood protection and water
availability. Therefore, educating the community the effect the
unplanned land use practices had on the environment, natural
resources and ecosystem is of paramount importance for the
catchment management.
Acknowledgement
Above all I give thanks to the Almighty God, without whom
nothing is possible and through whom I have been able to achieve
all that I have to date. I extend my gratitude and appreciation to
my advisor Dr.-Ing Tamene Adugna (PhD) and Co-advisor Ato
Dawud Tamam (MSc) for their continual support and guidance
along the development of this work. I am grateful for their
professional discussions and suggestions that helped me to
develop a scientific understanding of the subject.
I wish to extend my gratitude to Ato Alemu Mosisa (MSc). His
comment and criticism were a valuable asset in the completion
of this study. Thanks to staff members of Hydraulic and Water
Resources Engineering Department, especially, ato Andualem
Shugute (MSc) and Shimellis Asefu (MSc).
Finally I would like to express my love and appreciation to my
family for their unconditional support of all my endeavors.
REFERENCES`
Amsalu, N. (2010). The Sustainable Use of Soil Resources of
Gilgel Gibe Dam Catchment. Jimma University, Jimma,
ethiopia.
Anthony J. Viera, Md; Joanne M. Garrett, (2005).
Understanding Interobserver Agreement:The Kappa Statistic.
Belete Berhanu, Assefa M. Melesse B, Yilma Seleshi . (2013).
GIS-Based Hydrological Zones And Soil Geo-Database Of
Ethiopia. Catena, 104, 21-31.
De Sherbinin, A. (2002). Land-Use And Land-Cover Change, A
CIESIN Thematic Guide, Center for International Earth Science
Information Network of Columbia University Palisades.
International Journal of Science and Technology (IJST) – Volume 5 No. 7, July, 2016
IJST © 2016– IJST Publications UK. All rights reserved. 323323323
Dereje Bekele,Jemal Abafita,Kefelegn Getahun,Abraham
Bantirgu,Ayalew Talema,Kitessa Hundera. (2010). Assessement
of Land Degradation in Selected Villages of Gilgel Gibe
Catchment, Jimma Zone, Southwest Ethiopia. A PRA Report.
ERDAS Field Guide, (2010). USA: ERDAS Inc.Norcross, Ga
30092-2500
Haile E. Getachew and Assefa M. Melesse. (2012). The Impact
of Land Use Change on the Hydrology of the Angereb
Watershed, Ethiopia. International Journal of Water Sciences
1,4.
James R. Anderson, Ernest E. Hardy, John T. Roach, And
Richard E. Witmer. (1976). A Land Use and Land Cover
Classification System for Use With Remote Sensor Data. U. S.
Geological Survey Professional Paper, 964.
Kissi, E. (2010). Rainfall-Runoff Dynamics and Sediment
Source and Yield in Gilgel Gibe Catchment. PHE , Ethiopia
Consortium.
Millennium Ecosystem Assessment. (2005). Millennium
Ecosystem Assessment, Ecosystems and Human Well-Being.
General Synthesis,Millennium Ecosystem Assessment Series,
Island Press.
Tamene Adugna, Fokke Saathoff, Yilma Seleshi, Alemayehu
Gebissa (2013). Evaluating the Effectiveness of Best
Management Practices in Gilgel Gibe Basin Watershed-Ethiopia.
Journal of Civil Engineering And Architecture, 7(10),1240-
1252.
Tefera, B. (2006). People and Dams: Environmental and Socio-
Economic Changes Induced By a Reservoir in Fincha’a
Watershed, West Ethiopia. Wageningen University.
Thomas Houet, Laurence Hub Ert-Moy (2006). Modeling and
Projecting Land-Use and Land-Cover Changes With Cellular
Automaton in Considering Landscape Trajectories. Earsele
proceedings, European Association of Remote Sensing
Laboratories, 5 (1), 63-76.
Woldeamlak Bewket and Geert Sterk. (2005). Dynamics in Land
Cover and Its Effect on Stream Flow in the Chemoga Watershed,
Blue Nile Basin, Ethiopia. Hydrological Processes, 19, 445–458.