land-use impact on soil carbon, nitrogen, neutral sugar composition and related chemical properties...
TRANSCRIPT

Soil Science and Plant Nutrition (2008) 54, 321–331 doi: 10.1111/j.1747-0765.2007.00244.x
© 2008 Japanese Society of Soil Science and Plant Nutrition
Blackwell Publishing LtdORIGINAL ARTICLESoil C and sugar composition in a degraded UltisolORIGINAL ARTICLE
Land-use impact on soil carbon, nitrogen, neutral sugar composition and related chemical properties in a degraded Ultisol in Leyte, Philippines
Ian Ausa NAVARRETE1 and Kiyoshi TSUTSUKI2
1United Graduate School of Agricultural Sciences, Iwate University, Iwate 020-8550 and 2Laboratory of Environmental Soil Science, Obihiro University of Agriculture and Veterinary Medicine, Inada-cho 080-8555, Japan
Abstract
Over the past several decades, the conversion of native forest to agricultural land use has accelerated andfeatured in the development of Philippine landscapes. This study evaluated the effect of land-use change onsoil carbon, nitrogen, neutral sugar composition and other related soil chemical properties in a degradedsoil (Typic Hapludult) in Leyte, Philippines. Using a space-for-time substitution (paired-area) approach, soilsamples were collected and examined from secondary forest (SF), mahogany plantation (MP), rainforesta-tion farming (RF), coffee plantation (CP) and grassland (GR) of comparable geology, parent material, soiltype and climate. Soil pH, exchangeable Ca and Mg, and cation exchange capacity (CEC) tended to behigher after the conversion of deforested cultivated land into MP and RF land-use types. In contrast, landconversion decreased the soil carbon, nitrogen and carbohydrate-C in the order of SF, MP, CP, RF and GR,and the decrease was more marked in RF and GR sites that had been under intensive cultivation for a longperiod of time. Arabinose and xylose (mainly of plant origin) constituted the major non-cellulosic neutralsugar and represented 31–54% of the total soil carbohydrate-C. Soil carbohydrate-C content contributed2–8% of the total soil organic carbon because of rapid decomposition of sugars. This suggests an adverseeffect of land-use change leading to degradation of soil quality. The results of this study suggest that underthe humid tropical climate of the Philippines, high temperature and favorable moisture enhanced the carbo-hydrate decomposition and, thus, affected the content and composition of neutral sugar in the soil.
Key words: degraded soil, gas chromatography, land use, neutral sugar, Ultisol.
INTRODUCTION
Over the past century (Garrity et al. 1993), land-usechange has featured in the development of Philippinelandscapes, and has apparently contributed to the wide-spread occurrence of degraded land across the country(Asio 1996). Prior to the 1900s, the country had anestimated 70% primary forest, but the acreage ofprimary forest had decreased markedly to 22% of thetotal country area towards the end of this last century.In Leyte Island, where our study was conducted, 45%of the primary forest was lost between 1969 and 1984
(Forest Management Bureau 1988), resulting in aconsiderable loss of biodiversity (Langenberger et al.2006).
Soil organic matter (SOM) is important in the main-tenance of soil fertility, but its dynamics and compositionare influenced by land-use changes and managementpractices. Despite a growing body of research on landuse, the effect of land-use change on SOM dynamicsappears fragmentary and sometimes contradictory.Although Nye and Greenland (1964) and Detwiler(1986) reported substantial SOM depletion after defor-estation, Sanchez (1976) argued that land-use changeseldom resulted in SOM depletion. Murty et al. (2002)reported that conversion of forest to cultivated landgenerally lead to the loss of soil carbon, although themagnitude of the changes depends on the confoundinginfluence of bulk density change. The loss of SOM isalso influenced by other factors, such as land-use type,
Correspondence: I. A. NAVARRETE, United Graduate Schoolof Agricultural Sciences, Iwate University, Iwate 020-8550,Japan. Email: [email protected] 6 June 2007.Accepted for publication 27 November 2007.
322 I. A. Navarrete and K. Tsutsuki
© 2008 Japanese Society of Soil Science and Plant Nutrition
climate and initial carbon content (Lugo and Brown1993), management practices and time after land con-version (Nye and Greenland 1964). Depending on theusage and soil management, land-use change could haveeither a positive (e.g. increase in soil pH, exchangeablebases) or negative (e.g. loss of SOM by erosion) impacton the soil ecosystem and does not always result in adecline in soil fertility (Lugo and Brown 1993; Sanchez1976; Stevenson 1994).
The pool of soil carbohydrate accounts for a smallportion (5–25%) of the total SOM (Cheshire 1979;Stevenson 1994). Nevertheless, it is recognized thatthis macromolecule influences a number of biological,physical and chemical processes occurring in the soil(Cheshire 1979). Although they are less resistant todecomposition, Cheshire (1979) and Murayama (1984)noted that some fractions that are associated withthe soil mineral matrix are resistant to biodegradation(Tsutsuki and Kuwatsuka 1989) and, therefore, con-tribute to a recalcitrant organic carbon pool (Kiemand Kögel-Knabner 2003). Guggenberger et al. (1994)reported that neutral sugar composition reflects SOMdynamics and can be considered to be a sensitive indicatorto elucidate the effect of land-use change. Althoughseveral studies documented the impact of land-usechange on soil carbohydrates (Guggenberger et al. 1994;
Nacro et al. 2005; Trouve et al. 1996), very few studiesreported on rainforestation using native tree species ornative forest conversion to agriculture.
Whether or not changes in land use lead to SOMdepletion and subsequently to soil degradation remaininconsistent or poorly understood. The aim of thepresent study was to elucidate changes in soil carbon,nitrogen, neutral sugar composition and other relatedsoil chemical properties as influenced by land-usechange in the humid tropical Leyte Island, Philippines.This paper reports for the first time the neutral sugarcontent of soils in the Philippines.
MATERIALS AND METHODS
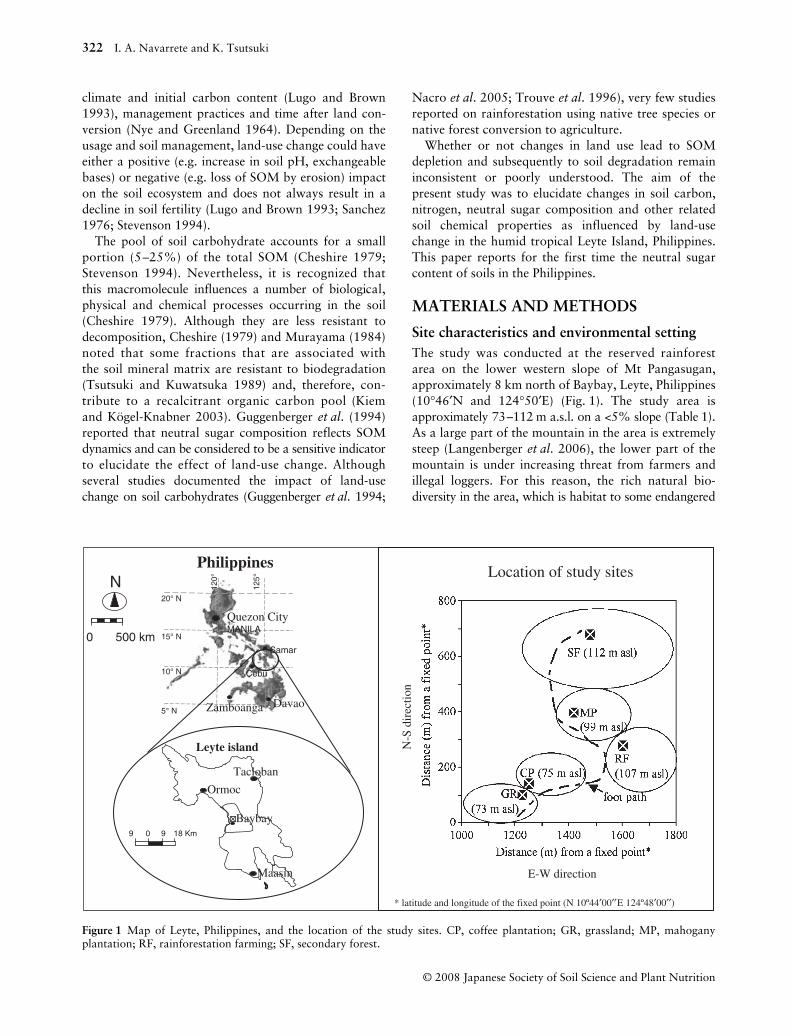
Site characteristics and environmental settingThe study was conducted at the reserved rainforestarea on the lower western slope of Mt Pangasugan,approximately 8 km north of Baybay, Leyte, Philippines(10°46′N and 124°50′E) (Fig. 1). The study area isapproximately 73–112 m a.s.l. on a <5% slope (Table 1).As a large part of the mountain in the area is extremelysteep (Langenberger et al. 2006), the lower part of themountain is under increasing threat from farmers andillegal loggers. For this reason, the rich natural bio-diversity in the area, which is habitat to some endangered
Figure 1 Map of Leyte, Philippines, and the location of the study sites. CP, coffee plantation; GR, grassland; MP, mahoganyplantation; RF, rainforestation farming; SF, secondary forest.
Soil C and sugar composition in a degraded Ultisol 323
© 2008 Japanese Society of Soil Science and Plant Nutrition
floral and faunal species, is increasingly under threat(Langenberger et al. 2006). The soil is classified as TypicHapludult (Soil Taxonomy) or Haplic Alisol (Foodand Agriculture Organization System) derived fromandesitic pyroclastic materials of late Quaternary(probably Holocene to upper Pleistocene) origin (Asio1996). The climate is humid tropical monsoon with anannual rainfall of 2600 mm and an average annual airtemperature of 27°C. The difference between the coldest(December) and the warmest month (April) is between2 and 3°C (Jahn and Asio 1998). In a short period,from April to May, the precipitation drops below 100 mmper month, which corresponds to the average monthlypotential evapotranspiration. Detailed information onthe vegetation at the study site is given in Langenbergeret al. (2006).
Research approach, site selection and samplingThe space-for-time substitution approach (e.g. Veldkampet al. 2003) or paired-area approach (e.g. Murty et al.
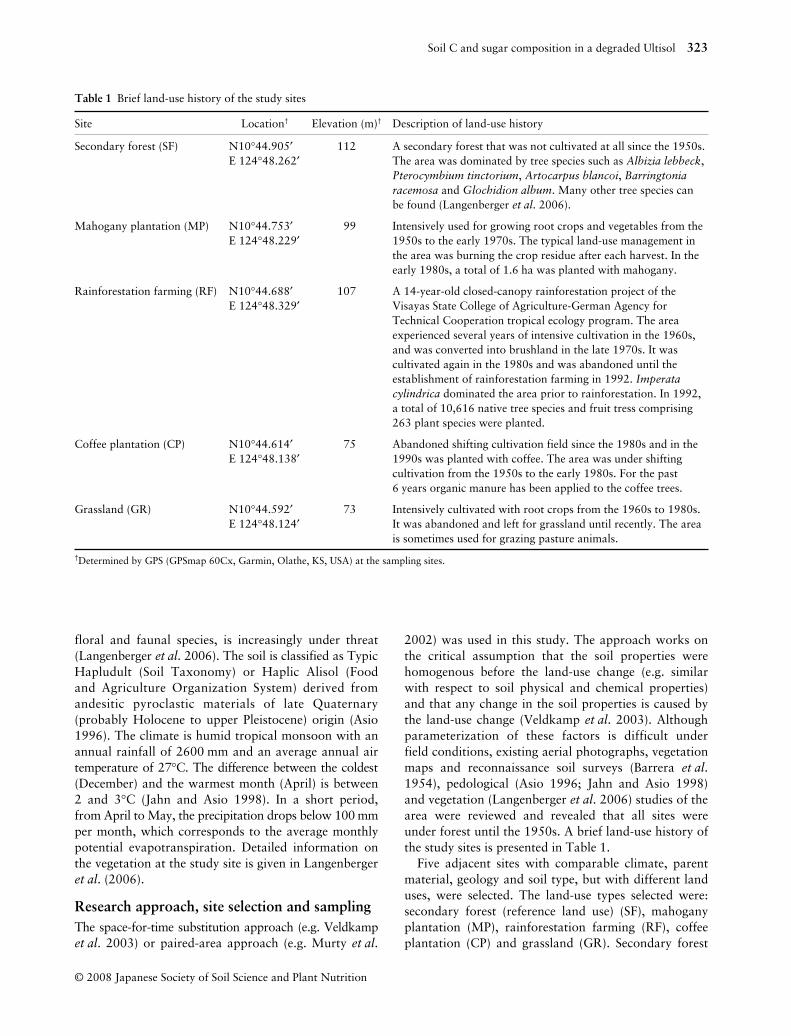
2002) was used in this study. The approach works onthe critical assumption that the soil properties werehomogenous before the land-use change (e.g. similarwith respect to soil physical and chemical properties)and that any change in the soil properties is caused bythe land-use change (Veldkamp et al. 2003). Althoughparameterization of these factors is difficult underfield conditions, existing aerial photographs, vegetationmaps and reconnaissance soil surveys (Barrera et al.1954), pedological (Asio 1996; Jahn and Asio 1998)and vegetation (Langenberger et al. 2006) studies of thearea were reviewed and revealed that all sites wereunder forest until the 1950s. A brief land-use history ofthe study sites is presented in Table 1.
Five adjacent sites with comparable climate, parentmaterial, geology and soil type, but with different landuses, were selected. The land-use types selected were:secondary forest (reference land use) (SF), mahoganyplantation (MP), rainforestation farming (RF), coffeeplantation (CP) and grassland (GR). Secondary forest
Table 1 Brief land-use history of the study sites
Site Location† Elevation (m)† Description of land-use history
Secondary forest (SF) N10°44.905′ E 124°48.262′
112 A secondary forest that was not cultivated at all since the 1950s. The area was dominated by tree species such as Albizia lebbeck, Pterocymbium tinctorium, Artocarpus blancoi, Barringtonia racemosa and Glochidion album. Many other tree species can be found (Langenberger et al. 2006).
Mahogany plantation (MP) N10°44.753′E 124°48.229′
99 Intensively used for growing root crops and vegetables from the 1950s to the early 1970s. The typical land-use management in the area was burning the crop residue after each harvest. In the early 1980s, a total of 1.6 ha was planted with mahogany.
Rainforestation farming (RF) N10°44.688′E 124°48.329′
107 A 14-year-old closed-canopy rainforestation project of the Visayas State College of Agriculture-German Agency for Technical Cooperation tropical ecology program. The area experienced several years of intensive cultivation in the 1960s, and was converted into brushland in the late 1970s. It was cultivated again in the 1980s and was abandoned until the establishment of rainforestation farming in 1992. Imperata cylindrica dominated the area prior to rainforestation. In 1992, a total of 10,616 native tree species and fruit tress comprising 263 plant species were planted.
Coffee plantation (CP) N10°44.614′E 124°48.138′
75 Abandoned shifting cultivation field since the 1980s and in the 1990s was planted with coffee. The area was under shifting cultivation from the 1950s to the early 1980s. For the past 6 years organic manure has been applied to the coffee trees.
Grassland (GR) N10°44.592′E 124°48.124′
73 Intensively cultivated with root crops from the 1960s to 1980s. It was abandoned and left for grassland until recently. The area is sometimes used for grazing pasture animals.
†Determined by GPS (GPSmap 60Cx, Garmin, Olathe, KS, USA) at the sampling sites.
324 I. A. Navarrete and K. Tsutsuki
© 2008 Japanese Society of Soil Science and Plant Nutrition
was selected because it was difficult to find native forestat elevations below 250 m a.s.l. because of anthro-pogenic perturbation (Langenberger et al. 2006). Soilsampling was carried out in August (summer season)2004. To make a reliable assessment among the selectedsites, uniform sampling depths of 0–20, 20–40 and 40–60 cm were adapted and a uniform depth increment of20 cm was used to achieve higher resolution in thechanges in soil properties among the study sites. Fromeach site, 10–15 subsampling plots were selected ran-domly in the field and soil samples were collected fromthese plots using a soil auger and subsequently mixed.At each site, a representative soil profile was excavatedmanually and the characteristics of the soil horizonswere described according to standard procedures (datanot shown).
Soil physicochemical analysisAll analyses were conducted on air-dried samplespassed through a 2-mm sieve. Particle size distributionwas done by wet sieving and using pipette methods. Thesoil pH (H2O) was determined using a soil : solutionsuspension of 1:2.5. The total carbon and nitrogencontents were analyzed by dry combustion using aC/N analyzer (Vario-EL III; Elementar AnalysensystemGmbH, Hanau, Germany). Available P was extractedusing 0.03 mol L–1 NH4F in 0.1 mol L–1 HCl (Bray 2method) with a soil/extraction ratio of 1:20 (Shoji et al.1964) and using the method of Murphy and Riley forcolor development. Cation exchange capacity (CEC)was determined using the Schollenberger method. Fivegrams of air-dried soil was equilibrated using 1 mol L–1
NH4OAc at pH 7, washed with 80% ethanol, andextracted again with 10% KCl. The exchangeable bases(Ca, Mg, K and Na) were quantified using atomicabsorption spectroscopy (Z-5010, Hitachi, Tokyo,Japan). The extracted NH4
+ in the 1 mol L–1 KCl solu-tion was determined using the steam distillation methodand the CEC values were calculated.
Preparation of sugar derivatives and analytical methods by capillary gas chromatographyPrior to the gas chromatograph analysis, soil carbohy-drates were hydrolyzed into their monomers. Neutralsugar was released using a two-step acid (H2SO4)hydrolysis according to the procedure described byOades et al. (1970). One gram of finely ground soil(<50 μm) was placed in a 50-mL amber bottle with aTeflon-lined screw cap and 20 mL of 2.5 mol L–1 H2SO4
was added and hydrolyzed for 20 min at 100°C in atightly closed bottle. The solution was centrifuged at15,000 g and the supernatant solution was collected.The precipitate was washed with 20 mL of distilledwater and was centrifuged again. The supernatant and
the washed extracts were combined and designated asnon-cellulosic neutral sugar hydrolysate. The residue ofthe non-cellulosic neutral sugar extraction was freeze-dried and 1 mL of 13 mol L–1 H2SO4 was added and leftfor 16 h at room temperature. Twenty-five milliliters ofdistilled water was added and heated for 5 h at 100°C.The supernatant was obtained by centrifugation andthe residue was washed with 25 mL distilled water. Thesupernatant and the washed solutions were combinedand were designated as cellulosic neutral sugar hydro-lysate. One milliliter of 5 μg mL–1 myo-inositol was addedto the hydrolysate as an internal standard. The hydro-lysate solutions were passed through Amberlite XAD-7HP (Organo, Tokyo, Japan) packed in a plastic column(10 mL) and were neutralized with Ba(OH)2, filtered(Advantec No. 131 filter paper) and evaporated todryness by freeze-drying. Neutral sugar was dissolved in0.1 mL of 1 mol L–1 ammonia and reduced with 1 mLof sodium borohydride (NaBH4) (2 g in 100 mL ofdimethylsulphoxide) and left for 90 min at 40°C. Afterthe reaction, the excess NaBH4 was decomposed bythe addition of 18 mol L–1 acetic acid (0.1 mL). Thereduced neutral sugar fraction was purified furtherby passing through a 10-mL plastic column containingDowex (HCR-W2) cation exchange resin (MuromachiTechnos, Tokyo, Japan) in H+ form, and was freeze-dried. The freeze-dried sample was treated with 10 mLof methanol and 1 mL of acetic acid and was evaporatedby rotary evaporator to remove boric acid (repeated threetimes). For acetylation, 0.2 mL of 1-methylimidazoleand 2 mL of acetic acid anhydride were added (Blakeneyet al. 1983) and the solution was mixed. After 20 min atroom temperature, 5 mL of distilled water was added todecompose excess acetic anhydride. After cooling, 2 mLof dichloromethane was added and the mixture wasagitated. After the two phases had separated, the lowerphase was collected. This extraction was repeated threetimes. The combined dichloromethane extract wastreated with anhydrous Na2SO4 (approximately 3 g) toremove the excess water. The alditol-acetate derivativesof hydrolyzed neutral sugar monomers were analyzedusing a Shimadzu (GC-14B) capillary gas chromato-graph (Shimadzu, Kyoto, Japan) equipped with a flameionization detector. The used column was ChrompackCP-Sil 43CB (0.25 mm × 25 m; 0.20 μm film). The columntemperature was raised from 195 to 225°C at a rate of6°C min–1 then held at 225°C for 11 min; the tempera-tures at the injector and detector ports were 270 and300°C, respectively. The alditol-acetate derivatives wereidentified based on their respective retention time bycomparing the chromatogram of the standard mixtureand the unknown, both containing the internal standard,myo-inositol. All analyses were run in duplicate andmean values are reported. The coefficient of variation
Soil C and sugar composition in a degraded Ultisol 325
© 2008 Japanese Society of Soil Science and Plant Nutrition
among the replicates was <12% of the mean of the twoexperimental replicates.
Statistical analysisPrincipal component analysis (PCA) was carried outusing the JMP Program (Version 6, SAS Institute, Cary,NC, USA). Prior to PCA analysis, the non-cellulosic andcellulosic neutral sugars were expressed as a percentageto the summed total of the non-cellulosic and cellulosicneutral sugars, respectively. The obtained values fol-lowed a normal distribution, which was confirmed bythe shape of the histogram plot and the normal quantileplot using the above statistical software. The first andsecond principal components accounted for 63% of thetotal variance and the relevant components reportedwere those whose eigenvalues were equal to or higherthan 0.30.
RESULTS
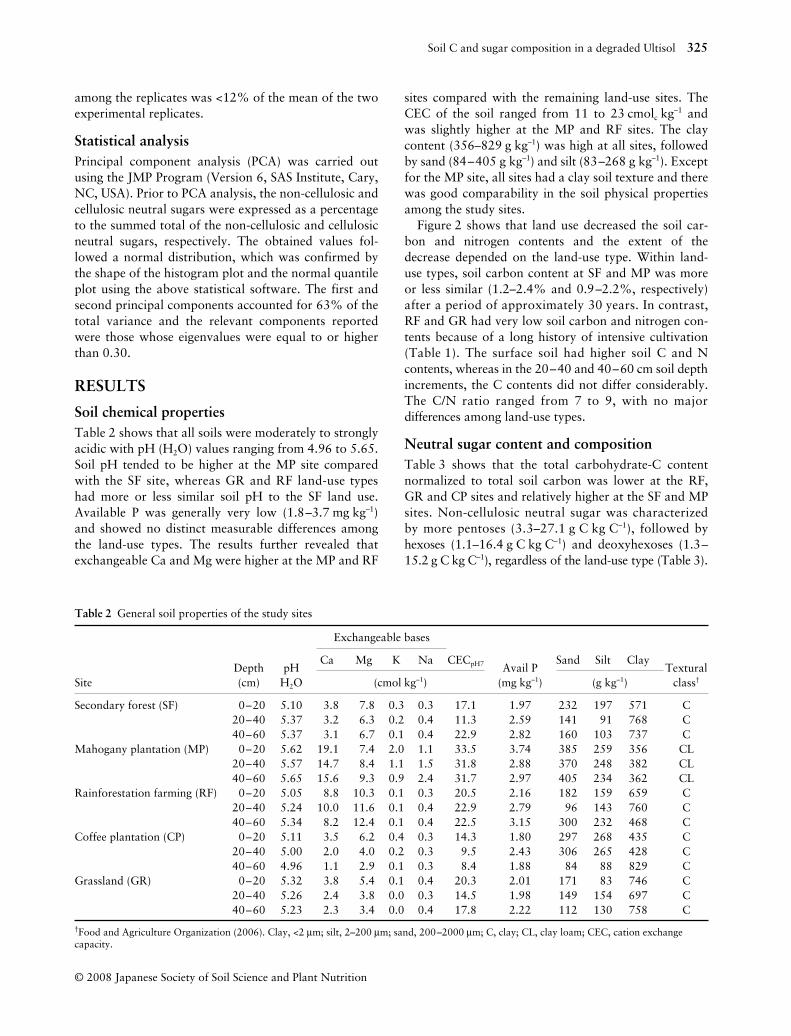
Soil chemical propertiesTable 2 shows that all soils were moderately to stronglyacidic with pH (H2O) values ranging from 4.96 to 5.65.Soil pH tended to be higher at the MP site comparedwith the SF site, whereas GR and RF land-use typeshad more or less similar soil pH to the SF land use.Available P was generally very low (1.8–3.7 mg kg–1)and showed no distinct measurable differences amongthe land-use types. The results further revealed thatexchangeable Ca and Mg were higher at the MP and RF
sites compared with the remaining land-use sites. TheCEC of the soil ranged from 11 to 23 cmolc kg–1 andwas slightly higher at the MP and RF sites. The claycontent (356–829 g kg–1) was high at all sites, followedby sand (84–405 g kg–1) and silt (83–268 g kg–1). Exceptfor the MP site, all sites had a clay soil texture and therewas good comparability in the soil physical propertiesamong the study sites.
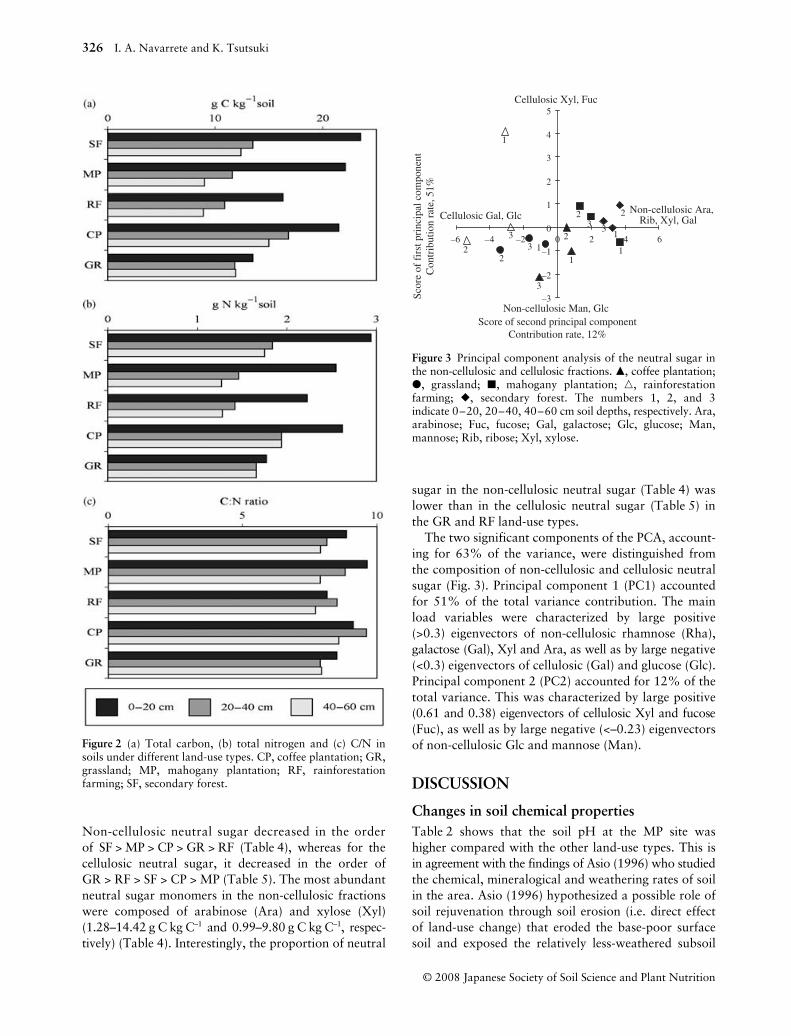
Figure 2 shows that land use decreased the soil car-bon and nitrogen contents and the extent of thedecrease depended on the land-use type. Within land-use types, soil carbon content at SF and MP was moreor less similar (1.2–2.4% and 0.9–2.2%, respectively)after a period of approximately 30 years. In contrast,RF and GR had very low soil carbon and nitrogen con-tents because of a long history of intensive cultivation(Table 1). The surface soil had higher soil C and Ncontents, whereas in the 20–40 and 40–60 cm soil depthincrements, the C contents did not differ considerably.The C/N ratio ranged from 7 to 9, with no majordifferences among land-use types.
Neutral sugar content and compositionTable 3 shows that the total carbohydrate-C contentnormalized to total soil carbon was lower at the RF,GR and CP sites and relatively higher at the SF and MPsites. Non-cellulosic neutral sugar was characterizedby more pentoses (3.3–27.1 g C kg C–1), followed byhexoses (1.1–16.4 g C kg C–1) and deoxyhexoses (1.3–15.2 g C kg C–1), regardless of the land-use type (Table 3).
Table 2 General soil properties of the study sites
SiteDepth (cm)
pH H2O
Exchangeable bases
Avail P (mg kg–1)
Sand Silt ClayTextural
class†
Ca Mg K Na CECpH7
(cmol kg–1) (g kg–1)
Secondary forest (SF) 0–20 5.10 3.8 7.8 0.3 0.3 17.1 1.97 232 197 571 C20–40 5.37 3.2 6.3 0.2 0.4 11.3 2.59 141 91 768 C40–60 5.37 3.1 6.7 0.1 0.4 22.9 2.82 160 103 737 C
Mahogany plantation (MP) 0–20 5.62 19.1 7.4 2.0 1.1 33.5 3.74 385 259 356 CL20–40 5.57 14.7 8.4 1.1 1.5 31.8 2.88 370 248 382 CL40–60 5.65 15.6 9.3 0.9 2.4 31.7 2.97 405 234 362 CL
Rainforestation farming (RF) 0–20 5.05 8.8 10.3 0.1 0.3 20.5 2.16 182 159 659 C20–40 5.24 10.0 11.6 0.1 0.4 22.9 2.79 96 143 760 C40–60 5.34 8.2 12.4 0.1 0.4 22.5 3.15 300 232 468 C
Coffee plantation (CP) 0–20 5.11 3.5 6.2 0.4 0.3 14.3 1.80 297 268 435 C20–40 5.00 2.0 4.0 0.2 0.3 9.5 2.43 306 265 428 C40–60 4.96 1.1 2.9 0.1 0.3 8.4 1.88 84 88 829 C
Grassland (GR) 0–20 5.32 3.8 5.4 0.1 0.4 20.3 2.01 171 83 746 C20–40 5.26 2.4 3.8 0.0 0.3 14.5 1.98 149 154 697 C40–60 5.23 2.3 3.4 0.0 0.4 17.8 2.22 112 130 758 C
†Food and Agriculture Organization (2006). Clay, <2 μm; silt, 2–200 μm; sand, 200–2000 μm; C, clay; CL, clay loam; CEC, cation exchange capacity.
326 I. A. Navarrete and K. Tsutsuki
© 2008 Japanese Society of Soil Science and Plant Nutrition
Non-cellulosic neutral sugar decreased in the orderof SF > MP > CP > GR > RF (Table 4), whereas for thecellulosic neutral sugar, it decreased in the order ofGR > RF > SF > CP > MP (Table 5). The most abundantneutral sugar monomers in the non-cellulosic fractionswere composed of arabinose (Ara) and xylose (Xyl)(1.28–14.42 g C kg C–1 and 0.99–9.80 g C kg C–1, respec-tively) (Table 4). Interestingly, the proportion of neutral
sugar in the non-cellulosic neutral sugar (Table 4) waslower than in the cellulosic neutral sugar (Table 5) inthe GR and RF land-use types.
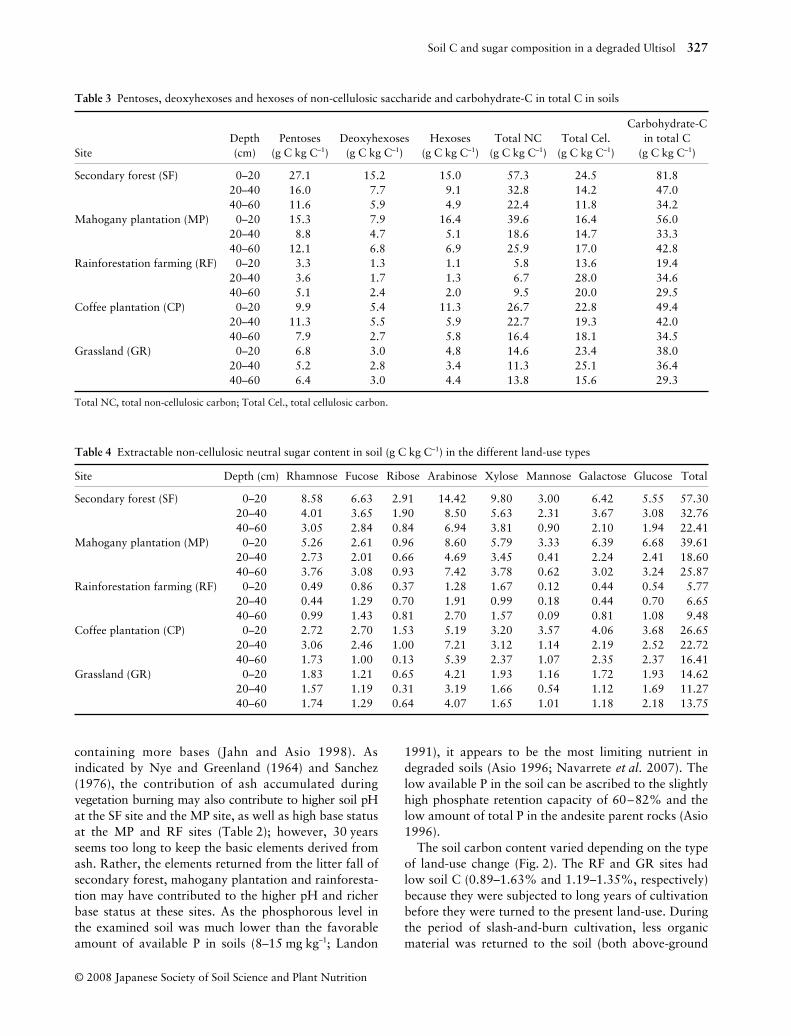
The two significant components of the PCA, account-ing for 63% of the variance, were distinguished fromthe composition of non-cellulosic and cellulosic neutralsugar (Fig. 3). Principal component 1 (PC1) accountedfor 51% of the total variance contribution. The mainload variables were characterized by large positive(>0.3) eigenvectors of non-cellulosic rhamnose (Rha),galactose (Gal), Xyl and Ara, as well as by large negative(<0.3) eigenvectors of cellulosic (Gal) and glucose (Glc).Principal component 2 (PC2) accounted for 12% of thetotal variance. This was characterized by large positive(0.61 and 0.38) eigenvectors of cellulosic Xyl and fucose(Fuc), as well as by large negative (<–0.23) eigenvectorsof non-cellulosic Glc and mannose (Man).
DISCUSSION
Changes in soil chemical propertiesTable 2 shows that the soil pH at the MP site washigher compared with the other land-use types. This isin agreement with the findings of Asio (1996) who studiedthe chemical, mineralogical and weathering rates of soilin the area. Asio (1996) hypothesized a possible role ofsoil rejuvenation through soil erosion (i.e. direct effectof land-use change) that eroded the base-poor surfacesoil and exposed the relatively less-weathered subsoil
Figure 2 (a) Total carbon, (b) total nitrogen and (c) C/N insoils under different land-use types. CP, coffee plantation; GR,grassland; MP, mahogany plantation; RF, rainforestationfarming; SF, secondary forest.
Figure 3 Principal component analysis of the neutral sugar inthe non-cellulosic and cellulosic fractions. �, coffee plantation;�, grassland; �, mahogany plantation; �, rainforestationfarming; �, secondary forest. The numbers 1, 2, and 3indicate 0–20, 20–40, 40–60 cm soil depths, respectively. Ara,arabinose; Fuc, fucose; Gal, galactose; Glc, glucose; Man,mannose; Rib, ribose; Xyl, xylose.
Soil C and sugar composition in a degraded Ultisol 327
© 2008 Japanese Society of Soil Science and Plant Nutrition
containing more bases (Jahn and Asio 1998). Asindicated by Nye and Greenland (1964) and Sanchez(1976), the contribution of ash accumulated duringvegetation burning may also contribute to higher soil pHat the SF site and the MP site, as well as high base statusat the MP and RF sites (Table 2); however, 30 yearsseems too long to keep the basic elements derived fromash. Rather, the elements returned from the litter fall ofsecondary forest, mahogany plantation and rainforesta-tion may have contributed to the higher pH and richerbase status at these sites. As the phosphorous level inthe examined soil was much lower than the favorableamount of available P in soils (8–15 mg kg–1; Landon
1991), it appears to be the most limiting nutrient indegraded soils (Asio 1996; Navarrete et al. 2007). Thelow available P in the soil can be ascribed to the slightlyhigh phosphate retention capacity of 60–82% and thelow amount of total P in the andesite parent rocks (Asio1996).
The soil carbon content varied depending on the typeof land-use change (Fig. 2). The RF and GR sites hadlow soil C (0.89–1.63% and 1.19–1.35%, respectively)because they were subjected to long years of cultivationbefore they were turned to the present land-use. Duringthe period of slash-and-burn cultivation, less organicmaterial was returned to the soil (both above-ground
Table 3 Pentoses, deoxyhexoses and hexoses of non-cellulosic saccharide and carbohydrate-C in total C in soils
Table 4 Extractable non-cellulosic neutral sugar content in soil (g C kg C–1) in the different land-use types
SiteDepth (cm)
Pentoses(g C kg C–1)
Deoxyhexoses (g C kg C–1)
Hexoses (g C kg C–1)
Total NC (g C kg C–1)
Total Cel.(g C kg C–1)
Carbohydrate-C in total C
(g C kg C–1)
Secondary forest (SF) 0–20 27.1 15.2 15.0 57.3 24.5 81.820–40 16.0 7.7 9.1 32.8 14.2 47.040–60 11.6 5.9 4.9 22.4 11.8 34.2
Mahogany plantation (MP) 0–20 15.3 7.9 16.4 39.6 16.4 56.020–40 8.8 4.7 5.1 18.6 14.7 33.340–60 12.1 6.8 6.9 25.9 17.0 42.8
Rainforestation farming (RF) 0–20 3.3 1.3 1.1 5.8 13.6 19.420–40 3.6 1.7 1.3 6.7 28.0 34.640–60 5.1 2.4 2.0 9.5 20.0 29.5
Coffee plantation (CP) 0–20 9.9 5.4 11.3 26.7 22.8 49.420–40 11.3 5.5 5.9 22.7 19.3 42.040–60 7.9 2.7 5.8 16.4 18.1 34.5
Grassland (GR) 0–20 6.8 3.0 4.8 14.6 23.4 38.020–40 5.2 2.8 3.4 11.3 25.1 36.440–60 6.4 3.0 4.4 13.8 15.6 29.3
Total NC, total non-cellulosic carbon; Total Cel., total cellulosic carbon.
Site Depth (cm) Rhamnose Fucose Ribose Arabinose Xylose Mannose Galactose Glucose Total
Secondary forest (SF) 0–20 8.58 6.63 2.91 14.42 9.80 3.00 6.42 5.55 57.3020–40 4.01 3.65 1.90 8.50 5.63 2.31 3.67 3.08 32.7640–60 3.05 2.84 0.84 6.94 3.81 0.90 2.10 1.94 22.41
Mahogany plantation (MP) 0–20 5.26 2.61 0.96 8.60 5.79 3.33 6.39 6.68 39.6120–40 2.73 2.01 0.66 4.69 3.45 0.41 2.24 2.41 18.6040–60 3.76 3.08 0.93 7.42 3.78 0.62 3.02 3.24 25.87
Rainforestation farming (RF) 0–20 0.49 0.86 0.37 1.28 1.67 0.12 0.44 0.54 5.7720–40 0.44 1.29 0.70 1.91 0.99 0.18 0.44 0.70 6.6540–60 0.99 1.43 0.81 2.70 1.57 0.09 0.81 1.08 9.48
Coffee plantation (CP) 0–20 2.72 2.70 1.53 5.19 3.20 3.57 4.06 3.68 26.6520–40 3.06 2.46 1.00 7.21 3.12 1.14 2.19 2.52 22.7240–60 1.73 1.00 0.13 5.39 2.37 1.07 2.35 2.37 16.41
Grassland (GR) 0–20 1.83 1.21 0.65 4.21 1.93 1.16 1.72 1.93 14.6220–40 1.57 1.19 0.31 3.19 1.66 0.54 1.12 1.69 11.2740–60 1.74 1.29 0.64 4.07 1.65 1.01 1.18 2.18 13.75
328 I. A. Navarrete and K. Tsutsuki
© 2008 Japanese Society of Soil Science and Plant Nutrition
and below-ground biomass), carbon was mineralizedfaster under humid tropical conditions, and erosion ofthe surface soil was assumed to take place at these sites.The periodic addition of organic fertilizer at the CP sitemight have caused the slightly higher soil carbon (1.5–2.1%). Interestingly, the soil carbon level under the MPsite was approaching an equilibrium condition withreference to the soil carbon level at the SF site (Fig. 2),indicating that a period of approximately 30 years wasenough to recover the organic carbon level in the soil.This conforms to the reports of Detwiler (1986) andBrown and Lugo (1990) who reported that at least35 years was needed before the soil carbon level undersecondary forest approached a steady state level. Brownand Lugo (1990) cited studies in Puerto Rico thatrevealed that a 50-year-old mahogany plantation hadhigh rates of litterfall and higher litter standing stock,which explained the high recovery of organic C in soil.Soil carbon content in the deeper soil was higher at CPcompared with the other sites, probably because of thetranslocation of organic matter via bioturbation byearthworms and termites, which was observed duringthe soil profile description.
Changes in neutral sugar content and compositionThe soil carbohydrate-C content was affected byland-use change and ranged from 2 to 8% of the totalsoil organic carbon (Table 3). These values were muchlower than the reported literature values of 5–20% forvarious soils in temperate zones (Amelung et al. 1999;Cheshire 1979; Guggenberger et al. 1994; Stevenson1994) and in tropical zones (e.g. Nacro et al. 2005),suggesting the degraded nature of SOM as a result ofland-use changes. Indeed, very low carbohydrate-C in
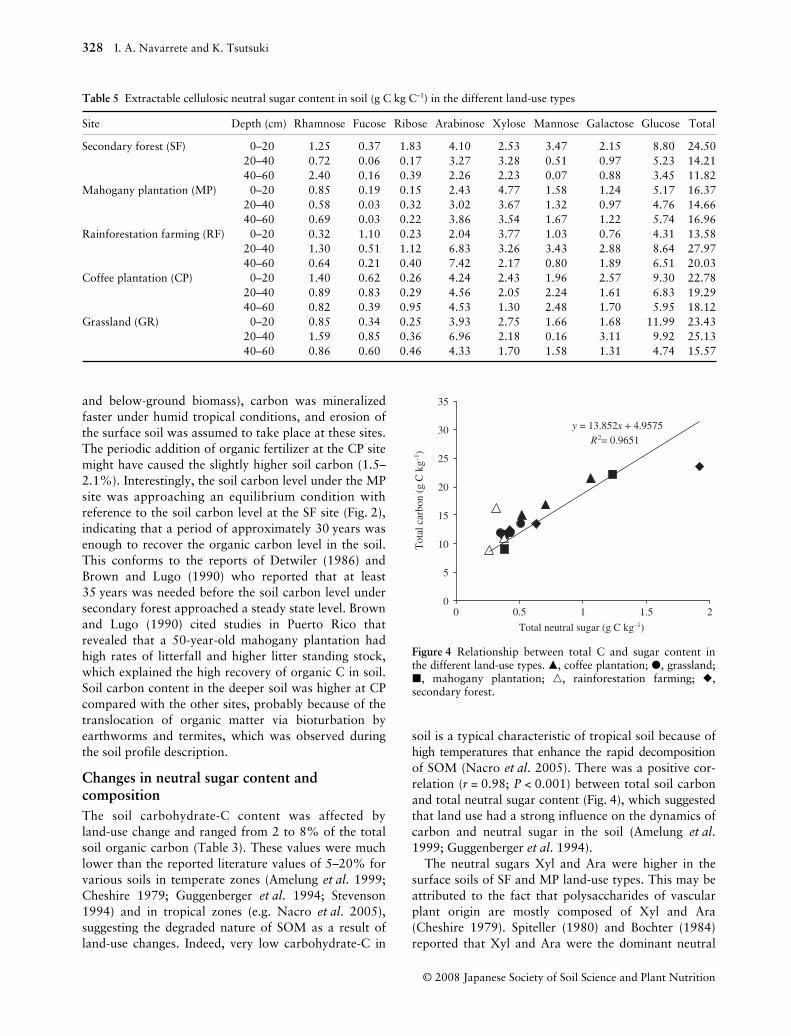
soil is a typical characteristic of tropical soil because ofhigh temperatures that enhance the rapid decompositionof SOM (Nacro et al. 2005). There was a positive cor-relation (r = 0.98; P < 0.001) between total soil carbonand total neutral sugar content (Fig. 4), which suggestedthat land use had a strong influence on the dynamics ofcarbon and neutral sugar in the soil (Amelung et al.1999; Guggenberger et al. 1994).
The neutral sugars Xyl and Ara were higher in thesurface soils of SF and MP land-use types. This may beattributed to the fact that polysaccharides of vascularplant origin are mostly composed of Xyl and Ara(Cheshire 1979). Spiteller (1980) and Bochter (1984)reported that Xyl and Ara were the dominant neutral
Table 5 Extractable cellulosic neutral sugar content in soil (g C kg C–1) in the different land-use types
Site Depth (cm) Rhamnose Fucose Ribose Arabinose Xylose Mannose Galactose Glucose Total
Secondary forest (SF) 0–20 1.25 0.37 1.83 4.10 2.53 3.47 2.15 8.80 24.5020–40 0.72 0.06 0.17 3.27 3.28 0.51 0.97 5.23 14.2140–60 2.40 0.16 0.39 2.26 2.23 0.07 0.88 3.45 11.82
Mahogany plantation (MP) 0–20 0.85 0.19 0.15 2.43 4.77 1.58 1.24 5.17 16.3720–40 0.58 0.03 0.32 3.02 3.67 1.32 0.97 4.76 14.6640–60 0.69 0.03 0.22 3.86 3.54 1.67 1.22 5.74 16.96
Rainforestation farming (RF) 0–20 0.32 1.10 0.23 2.04 3.77 1.03 0.76 4.31 13.5820–40 1.30 0.51 1.12 6.83 3.26 3.43 2.88 8.64 27.9740–60 0.64 0.21 0.40 7.42 2.17 0.80 1.89 6.51 20.03
Coffee plantation (CP) 0–20 1.40 0.62 0.26 4.24 2.43 1.96 2.57 9.30 22.7820–40 0.89 0.83 0.29 4.56 2.05 2.24 1.61 6.83 19.2940–60 0.82 0.39 0.95 4.53 1.30 2.48 1.70 5.95 18.12
Grassland (GR) 0–20 0.85 0.34 0.25 3.93 2.75 1.66 1.68 11.99 23.4320–40 1.59 0.85 0.36 6.96 2.18 0.16 3.11 9.92 25.1340–60 0.86 0.60 0.46 4.33 1.70 1.58 1.31 4.74 15.57
Figure 4 Relationship between total C and sugar content inthe different land-use types. �, coffee plantation; �, grassland;�, mahogany plantation; �, rainforestation farming; �,secondary forest.

Soil C and sugar composition in a degraded Ultisol 329
© 2008 Japanese Society of Soil Science and Plant Nutrition
sugars, particularly in the O-horizon in soil. Trouveet al. (1996) suggested that Xyl is a good marker inelucidating vegetation inheritance. The high Xyl andAra contents are considered to be derived directly fromthe litters of secondary forests and mahogany trees,respectively. The small contribution of non-cellulosicneutral sugar content in GR land use can be ascribed tothe fast decomposition of grasses and low net primaryproduction of grassland. In contrast, the influence ofrainforestation in RF land use was smaller because ofthe shorter time (10–14 years) since the trees has beenestablished compared with the length of time under SFand MP land-use types. The higher cellulosic neutralsugar in the RF and GF land-use types relative to thenon-cellulosic neutral sugar (compare Tables 3 and 4)indicates that cellulosic sugar was more refractory thannon-cellulosic neutral sugar, although it appears to besite specific to these areas. Tsutsuki and Kuwatsuka(1989) and Kiem and Kögel-Knabner (2003) reportedthat some fraction of the carbohydrates is subjected tolong-term stabilization by interaction with soil mineralsand hence very stable in the soil.
The influence of land use on non-cellulosic andcellulosic neutral sugar composition was clear fromthe PCA data (Fig. 3). To summarize the tendency, PC1increased with the contribution of non-cellulosic neutralsugar (Ara, ribose [Rib], Xyl and Gal) and decreasedwith the contribution of cellulosic neutral sugar (Galand Glc). In contrast, PC2 seemed to increase with thecontribution of relatively stable neutral sugars derivedfrom wood (cellulosic xylose) and decrease with thecontribution of microbial neutral sugar (non-cellulosicGlc and Man).
The SF and MP land uses showed a similar trend withhigher PC1 values with larger non-cellulosic neutralsugar (Ara, Rib, Xyl and Gal) reflecting a large input ofplant residue into the soil. The depletion of non-cellulosic neutral sugar and the enrichment of morestable cellulosic sugar (Gal and Glc) in the RF and GRland uses may still inherit the adverse effect of land-usechange leading to the deterioration of soil quality, whichoccurred during the period of shifting cultivation. In thecase of the RF site, PC2 values were high in the surfacesoil because of high cellulosic Xyl and Fuc coming fromthe present tree vegetation and low PC1 values with alarger contribution of cellulosic Gal and Glc in the deeperhorizon. In contrast, the effect of land-use change at theCP site was intermediate because the area had not beenused intensively for cultivation previously (Table 1). Ingeneral, the PC1–PC2 plots showed that neutral sugarcompositions tended to shift from right to (lower) left,indicating that non-cellulosic, plant-derived neutralsugars degrade preferentially and/or are enriched withnewly formed microbe-derived, non-cellulosic sugars.
The relative contribution of microbial-derived andplant-derived carbohydrates in soil can be estimated bycalculating the mass ratios of neutral sugar monomers,except for Glc, which originates from both microbialand plant products. Pentoses such as Xyl and Ara aremainly of plant origin, whereas hexoses such as Man,Gal, and to a lesser extent Rha and Fuc, are partiallyderived from microbial origin (Cheshire 1979; Oades1984). Remarkably, Rib is the least abundant neutralsugar and its presence reflects microbial rather thanplant origin. Therefore, the molar ratios of [(Man + Gal)/(Ara + Xyl)] (Oades 1984) and [(Fuc + Rham)/(Ara + Xyl)](Murayama 1984) serve as an indicator of the source ofsugars. According to Oades (1984), the [(Man + Gal)/(Ara + Xyl)] ratio is > 2 for microbe-derived neutral sugarand < 0.5 for plant-derived neutral sugar. Table 6shows a higher [(Man + Gal)/(Ara + Xyl)] ratio (0.19–0.91) in the non-cellulosic neutral sugar, suggestingenrichment of microbe-derived neutral sugar. Undersilvicultural and agricultural land use, the ratio of[(Man + Gal)/(Ara + Xyl)] tended to be higher in thesurface horizon at the MP and CP sites, suggesting alarger contribution of microbial sugar. The [(Rha + Fuc)/(Ara + Xyl)] values were also high and suggested thatthe neutral sugar was of microbial origin (Murayama1984). These results were consistent with the datafrom the PCA (Fig. 3). This implies that under humidtropical conditions, high microbial activities in soilcoupled with high temperatures and favorable moistureconditions resulted in the rapid decomposition ofneutral sugars.
ConclusionFrom the results of the present study, forest conversioninto secondary land uses decreased the carbon, nitrogenand neutral sugar contents in the soil. These parametersshowed a tendency to recover at the SF and MP sites,but the decrease was more marked at the RF and GRsites, which had been used for intensive cultivation for alonger period. Within land-use type, the differences insoil carbon, nitrogen and neutral sugar compositioncould be attributed to differences in the vegetationcover, the amount of organic matter added to the soil,differences in past land use and the succeeding soil man-agement after land use. Soil carbohydrate-C content asa proportion of the total soil organic carbon was verylow (2–8%) and indicated rapid decomposition of neu-tral sugar. The results of this study suggested that bothland-use change and the humid tropical conditions inthe Philippines influenced the content and compositionof neutral sugar and accelerated any changes. Additionalstudies are necessary to understand the effect of land-use change on the neutral sugar composition in variousdegraded soils in the Philippines.
330 I. A. Navarrete and K. Tsutsuki
© 2008 Japanese Society of Soil Science and Plant Nutrition
ACKNOWLEDGMENTS
The senior author thanks the Ministry of Education,Science, Sports and Culture of Japan for scholarshipsupport. Professor Victor Asio, Professor Renzo Kondoand Mr Rey Navarrete are thanked for their assistancewith the soil sampling and Dr Masayuki Tani and MsChihiro Mizota are thanked for their analytical support.
REFERENCESAmelung W, Flach KW, Zech W 1999: Neutral and acidic
sugars in particle-size fractions as influenced by climate.Soil Sci. Soc. Am. J., 63, 865–873.
Asio VB 1996: Characteristics, weathering, formation, anddegradation of soils from volcanic rocks in Leyte,Philippines. Hohenheimer Bodenkundliche Hefte, vol. 33,Stuttgart, Germany.
Barrera A, Aristorenas I, Tingzon J 1954: Soil Survey of LeyteProvince, Philippines. Department of Agriculture andNatural Resources, Manila.
Blakeney AB, Harris PJ, Henry RJ, Stone BA 1983: A simpleand rapid preparation of alditol acetates for monosaccha-ride analysis. Carbohydr. Res., 113, 291–299.
Bochter R 1984: Determination of cellulosic and non-cellulosicneutral sugars in soil hydrolysates by the help of highperformance thin-layer chromatography. Z. Pflanszen-ernähr. Bodenk., 147, 203–209 (in German).
Brown S, Lugo AE 1990: Effects of forest clearing and succes-sion on the carbon and nitrogen content of soils in PuertoRico and US Virgin Islands. Plant Soil, 124, 53–64.
Cheshire MV 1979: Nature and Origin of Carbohydrates inSoils. Academic Press, London.
Detwiler RP 1986: Land use change and the global carboncycle: the role of tropical soils. Biogeochem, 2, 67–93.
Food and Agriculture Organization 2006: Guidelines for SoilDescription, 3rd edn. Food and Agriculture Organization,Rome.
Forest Management Bureau 1988: Natural Forest Resourcesof the Philippines. Philippine–German Forest ResourcesInventory Project, Manila.
Garrity DP, Kummer DM, Guiang ES 1993: The Philippines.In Sustainable Agriculture and the Environment in theHumid Tropics. Ed. Committee on Sustainable Agricultureand the Environment in the Humid Tropics, NationalResearch Council, pp. 549–624, National Academy Press,Washington.
Guggenberger G, Christensen BT, Zech W 1994: Land useeffects on the composition of organic matter in particle-size separates of soils: I. Lignin and carbohydrate signa-ture. Eur. J. Soil Sci., 45, 449–458.
Jahn R, Asio VB 1998: Soils of the tropical forests of Leyte,Philippines-I. Weathering, soil characteristics, classification,and site qualities. In Soils of Tropical Forest Ecosystems.Eds A Schulte and D Ruhiyat, pp. 29–36, Springer-Verlag,Berlin.
Kiem R, Kögel-Knabner I 2003: Contribution of lignin andpolysaccharides to the refractory carbon pool in C-depleted arable soils. Soil Biol. Biochem., 35, 101–118.
Landon JR 1991: Booker Tropical Soil Manual. LongmanScientific and Technical, London.
Langenberger G, Martin K, Sauerborn J 2006: Vascular plantspecies inventory of a Philippine lowland rain forest andits conservation value. Biodivers. Conserv., 15, 1271–1301.
Lugo AE, Brown S 1993: Management of tropical soils assinks or sources of atmospheric carbon. Plant Soil, 149,27–41.
Table 6 Comparative ratios of non-cellulosic neutral sugar in the different land-use types
SiteDepth (cm)
(Man + Gal) (Rha + Fuc)
(Man/Xyl)(Xyl + Ara) (Xyl + Ara)
Secondary forest (SF) 0–20 0.39 0.63 0.3020–40 0.42 0.54 0.4140–60 0.28 0.55 0.24
Mahogany plantation (MP) 0–20 0.68 0.55 0.5820–40 0.33 0.58 0.1240–60 0.32 0.61 0.16
Rainforestation farming (RF) 0–20 0.19 0.46 0.0720–40 0.22 0.60 0.1940–60 0.21 0.57 0.06
Coffee plantation (CP) 0–20 0.91 0.65 1.1120–40 0.32 0.53 0.3640–60 0.44 0.35 0.45
Grassland (GR) 0–20 0.47 0.45 0.6020–40 0.34 0.57 0.3340–60 0.38 0.53 0.60
Ara, arabinose; Fuc, fucose; Gal, galactose; Man, mannose; Rha, rhamnose; Xyl, xylose.
Soil C and sugar composition in a degraded Ultisol 331
© 2008 Japanese Society of Soil Science and Plant Nutrition
Murayama S 1984: Changes in monosaccharide compositionduring the decomposition of straws under field con-ditions. Soil Sci. Plant Nutr., 30, 367–381.
Murty D, Kirschbaum MUF, Mcmurtie RS, Mcgilvray H2002: Does conversion of forest to agricultural landchange soil carbon and nitrogen? A review of the litera-ture. Global Change Biol., 8, 105–123.
Nacro HB, Larré-Larrouy MC, Feller C, Abbadie L 2005:Hydrolysable carbohydrate in tropical soils underadjacent forest and savanna vegetation in Lamto, Côted’Ivoire. Aust. J. Soil Res., 43, 705–711.
Navarrete IA, Asio VB, Jahn R, Tsutsuki K 2007: Characteris-tics and genesis of two highly weathered soils in Samar,Philippines. Aust. J. Soil Res., 45, 153–163.
Nye PH, Greenland DJ 1964: Changes in the soil after clearingtropical forest. Plant Soil, 21, 101–112.
Oades JM 1984: Soil organic matter and structural stability:Mechanisms and implications for management. PlantSoil, 76, 319–337.
Oades JM, Kirkman MA, Wagner GH 1970: The use of gas–liquid chromatography for the determination of sugarsextracted from soils by sulfuric acid. Soil Sci. Soc. Am.Proc., 34, 230–235.
Sanchez PA 1976: Properties and Management of Soils in theTropics. John Wiley & Sons, New York.
Shoji S, Miyake M, Takeuchi Y 1964: Comparisons of variousdetermination methods of available phosphate (Part 2).Bull. Hokkaido Agric. Exp. Stn, 84, 32–39 (in Japanese).
Spiteller M 1980: Capillary gas chromatographic determina-tion of sugars from different soils. Z. Pflanszenernähr.Bodenk., 143, 720–729 (in German).
Stevenson FJ 1994: Humus Chemistry: Genesis, Compositions,Reactions, 2nd edn. John Wiley & Sons, New York.
Trouve C, Disnar JR, Mariotti A, Guillet B 1996: Changes inthe amount and distribution of neutral monosaccharidesof savanna soils under plantation of Pinus and Eucalyptusin the Congo. Eur. J. Soil Sci., 47, 51–59.
Tsutsuki K, Kuwatsuka S 1989: Degradation and stabilizationof humus on buried volcanic ash soils. I. Humus com-position, molecular size distribution of humic acids, andsugars composition of soils. Soil Sci. Plant Nutr., 35,207–216.
Veldkamp E, Becker A, Schwendenmann L, Clark DA,Schulte-Bisping H 2003: Substantial labile carbon stocksand microbial activity in deeply weathered soils below atropical wet forest. Global Change Biol., 9, 1171–1184.