land use effects on soil carbon fractions in the southeastern united states. ii. changes in soil...
TRANSCRIPT
Biol Fertil Soils (2004) 40: 194–200DOI 10.1007/s00374-004-0754-2
ORIGINAL PAPER
Richard T. Conant . Johan Six . Keith Paustian
Land use effects on soil carbon fractions in the southeasternUnited States. II. changes in soil carbon fractions along a forestto pasture chronosequence
Received: 25 September 2003 / Revised: 23 March 2004 / Accepted: 25 March 2004 / Published online: 3 June 2004# Springer-Verlag 2004
Abstract Since land use change can have significantimpacts on regional biogeochemistry, we investigated howconversion of forest and cultivation to pasture impact soilC and N cycling. In addition to examining total soil C, weisolated soil physiochemical C fractions in order tounderstand the mechanisms by which soil C is sequesteredor lost. Total soil C did not change significantly over timefollowing conversion from forest, though coarse (250–2,000 μm) particulate organic matter C increased by afactor of 6 immediately after conversion. Aggregate meanweight diameter was reduced by about 50% after conver-sion, but values were like those under forest after 8 yearsunder pasture. Samples collected from a long-term pasturethat was converted from annual cultivation more than 50years ago revealed that some soil physical propertiesnegatively impacted by cultivation were very slow torecover. Finally, our results indicate that soil macroag-gregates turn over more rapidly under pasture than underforest and are less efficient at stabilizing soil C, whereasmicroaggregates from pasture soils stabilize a largerconcentration of C than forest microaggregates. Sinceconversion from forest to pasture has a minimal impact ontotal soil C content in the Piedmont region of Virginia,United States, a simple C stock accounting system coulduse the same base soil C stock value for either type of landuse. However, since the effects of forest to pastureconversion are a function of grassland managementfollowing conversion, assessments of C sequestrationrates require activity data on the extent of variousgrassland management practices.
Keywords Forest to pasture conversion . Soil carbon .Carbon fractions
Introduction
Between 1982 and 1997 nearly two million hectares offorested land was converted to pasture or hayland in thesoutheastern United States (Florida, Georgia, Kentucky,Mississippi, North Carolina, South Carolina, Tennessee,and Virginia; USDA 2002). This is substantially more landthan was converted from forest to cropland (650 kha) andslightly more than the amount of land converted fromcropland into forest (1.7 mha) and is, thus, one of the moresubstantial land use changes in the region. As has beendemonstrated elsewhere (Houghton et al. 1999), land usechanges can have significant impacts on nutrient cyclingin soil.
Previous research suggests that soil C changes inresponse to conversion from forest to pasture are variable.For example, based on meta-analysis of global data, Guoand Gifford (2002) concluded that forest to pastureconversion leads to increases in soil C stocks of about8%, on average. Yet Murty et al. (2002) found thatconversion could lead to large C losses (as much as 50%of C stocks) or net sequestration (as much as 160%increase). They concluded that variability in soil organic C(SOC) response to forest to pasture conversion may be afunction of management; C is more likely to besequestered in cases where C inputs to soil in the newlycreated pasture are not impacted by removal by grazing orlow soil fertility (Murty et al. 2002), but decreases in soilC are more likely if C inputs to the soil are small.
Organic matter is stabilized in the soil by associationwith silt and clay particles, within microaggregates andmacroaggregates, which physically protect soil C fromdecomposition, and through chemical resistance to de-composition. Altering soil physicochemical properties sothat one or more of these protective attributes is increased,should lead to increases in soil C if C inputs do notdecrease. Also, the form in which C is sequestered will
R. T. Conant (*) . J. Six . K. PaustianNatural Resource Ecology Laboratory, Colorado StateUniversity,Fort Collins, CO, 80523-1499, USAe-mail: [email protected]
J. SixDepartment of Agronomy and Range Science, University ofCalifornia,Davis, CA, 95616, USA
have implications for long-term stability of that C. Toevaluate how management impacts different pools ofvarying stability, physical fractionation techniques can beused to isolate different soil C components (Canadell et al.1996; Haynes 2000; Six et al. 2002a). Furthermore, byisolating SOC fractions that change more rapidly than totalSOC in response to changes in land use or management,the detection limit for SOC changes is augmented.Additionally, physical fractionation based on aggregateand particle size fractions can be used to better understandnot only C dynamics under different land use practices butother ecosystem processes and mechanisms as well (Six etal. 2002a).
Our overall research objectives were to investigate: (1)how total soil C changes in response to conversion fromforest to pasture; (2) how aggregation changes over timefollowing conversion; (3) whether changes in aggregationimpact soil C stabilization; (4) the impacts of conversionon particulate organic matter (POM); and (5) the impactson stabilization of C by association with silt and clayparticles. In this paper, we address these questions for atemperate deciduous forest to pasture conversion chron-osequence in Virginia, United States. Understanding howthese SOC fractions behave in response to changes in landuse will aid in assessing sources and sinks of C associatedwith pasture establishment and management.
Materials and methods
Soil samples were collected from four sites along a forest to pastureconversion chronosequence in Virginia, United States (Table 1). Allsites were located within the same farm (38.07°N, 78.11°W). Slope,aspect, soil texture, and soil series (Nason silt loam; TypicHapludult) were uniform across sites, ensuring that land use historywas the primary factor influencing soil C content. All sites but onewere converted to pasture in the same manner with tree harvestfollowed by consolidation, burning, and burial of slash material, andseeding of orchard grass (Dactylis glomerata) and clover (Trifoliumrepens); one site was cultivated before being converted to pasture(>50 years before sampling). Four sites across the chronosequencewere identified ranging from forest to 2, 14, and 49 years afterconversion (Table 1). The oldest trees on the forested site were 25years old at the time of sampling though the site was likely underforest for much longer (B. Wayson, personal communication). Theforest was composed of mixed-deciduous species including beech(Fagus sp.), maple (Acer sp.), and oak (Quercus sp.).Fields with different land use histories were intensively sampled
in order to detect differences between sites and also to enablemeasurement of changes in soil C over time with resampling in thefuture. Our sampling scheme was based on that used by theCanadian Prairie Soil Carbon Project (Ellert et al. 2001, 2002).Within each field three “microsites,” each consisting of six regularly
aligned soil cores, were sampled in early spring of 1999. Micrositeswere always oriented in the same direction, the location of thenortheastern-most core was measured using differential GPS(Magellan, San Dimas, Calif.), and a relocatable Skotchmark EMSmagnetic ball marker (3M Corporation, Austin, Tex.) was buried at1 m depth to enable future relocation and resampling.A Giddings hydraulic soil coring rig was used to collect 6.5-cm-
diameter soil cores to a depth of 50 cm. Soil samples were split intofour segments (0–10, 10–20, and 20–50 cm), returned to thelaboratory, and weighed. Surface litter and above-ground vegetationwere separated and quantified. Samples were passed through an 8-mm mesh sieve by gently breaking the soil along planes of leastresistance; all visible root material was removed by hand pickingduring the 8-mm sieving. Soils were then air-dried and compositedby depth within each microsite (i.e., composites consisted of soilfrom six individual cores). Bulk density was calculated usingvolume of sample collected and the weight of soil in the sample;fresh sample weight was corrected for soil moisture and root androck content. Composited samples were then sieved to pass a 2-mmsieve, oven-dried at 60° for 72 h, and ground to fine powder using aball mill (Cianflone Scientific Instruments, Pittsburgh, Pa.). TotalPOM and soil texture were determined according to methodsoutlined in Conant et al. (2003).The method (Fig. 1) for isolation of the free light fraction (LF),
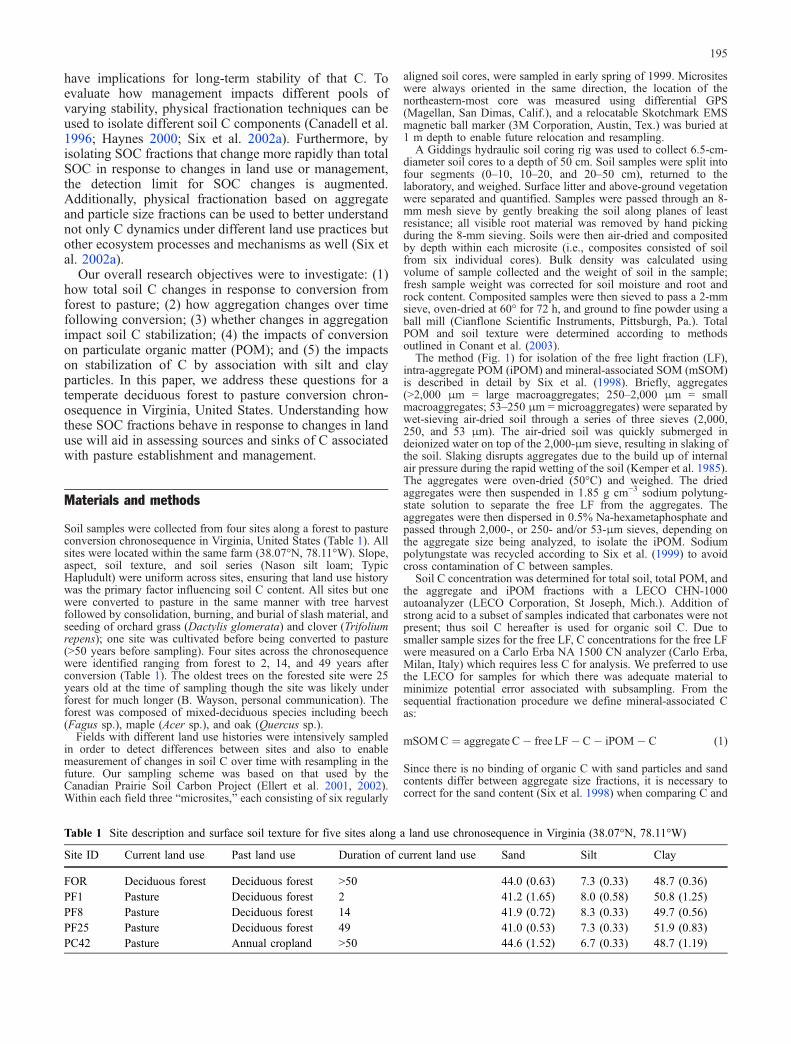
intra-aggregate POM (iPOM) and mineral-associated SOM (mSOM)is described in detail by Six et al. (1998). Briefly, aggregates(>2,000 μm = large macroaggregates; 250–2,000 μm = smallmacroaggregates; 53–250 μm = microaggregates) were separated bywet-sieving air-dried soil through a series of three sieves (2,000,250, and 53 μm). The air-dried soil was quickly submerged indeionized water on top of the 2,000-μm sieve, resulting in slaking ofthe soil. Slaking disrupts aggregates due to the build up of internalair pressure during the rapid wetting of the soil (Kemper et al. 1985).The aggregates were oven-dried (50°C) and weighed. The driedaggregates were then suspended in 1.85 g cm−3 sodium polytung-state solution to separate the free LF from the aggregates. Theaggregates were then dispersed in 0.5% Na-hexametaphosphate andpassed through 2,000-, or 250- and/or 53-μm sieves, depending onthe aggregate size being analyzed, to isolate the iPOM. Sodiumpolytungstate was recycled according to Six et al. (1999) to avoidcross contamination of C between samples.Soil C concentration was determined for total soil, total POM, and
the aggregate and iPOM fractions with a LECO CHN-1000autoanalyzer (LECO Corporation, St Joseph, Mich.). Addition ofstrong acid to a subset of samples indicated that carbonates were notpresent; thus soil C hereafter is used for organic soil C. Due tosmaller sample sizes for the free LF, C concentrations for the free LFwere measured on a Carlo Erba NA 1500 CN analyzer (Carlo Erba,Milan, Italy) which requires less C for analysis. We preferred to usethe LECO for samples for which there was adequate material tominimize potential error associated with subsampling. From thesequential fractionation procedure we define mineral-associated Cas:
mSOMC ¼ aggregate C� free LF� C� iPOM� C (1)
Since there is no binding of organic C with sand particles and sandcontents differ between aggregate size fractions, it is necessary tocorrect for the sand content (Six et al. 1998) when comparing C and
Table 1 Site description and surface soil texture for five sites along a land use chronosequence in Virginia (38.07°N, 78.11°W)
Site ID Current land use Past land use Duration of current land use Sand Silt Clay
FOR Deciduous forest Deciduous forest >50 44.0 (0.63) 7.3 (0.33) 48.7 (0.36)PF1 Pasture Deciduous forest 2 41.2 (1.65) 8.0 (0.58) 50.8 (1.25)PF8 Pasture Deciduous forest 14 41.9 (0.72) 8.3 (0.33) 49.7 (0.56)PF25 Pasture Deciduous forest 49 41.0 (0.53) 7.3 (0.33) 51.9 (0.83)PC42 Pasture Annual cropland >50 44.6 (1.52) 6.7 (0.33) 48.7 (1.19)
195
N concentrations of iPOM, and aggregate size fractions. Sandfree Cconcentrations were calculated with the following formula:
sandfree C½ �fraction ¼ C½ �fraction= 1� sand proportion½ �fraction� �
(2)
Planned-comparison analysis of variance with Scheffe’s meanscomparison test was used to test for treatment effects on total soil Cand POM-C fractions at all five sites. Bulked soil from eachmicrosite served as one treatment replicate. Statistical analyses werecarried out at all depths and for values summed for the top 50 cm.All statistical tests were performed with SAS (SAS 1985) anddifferences are considered significant when P <0.05.
Results
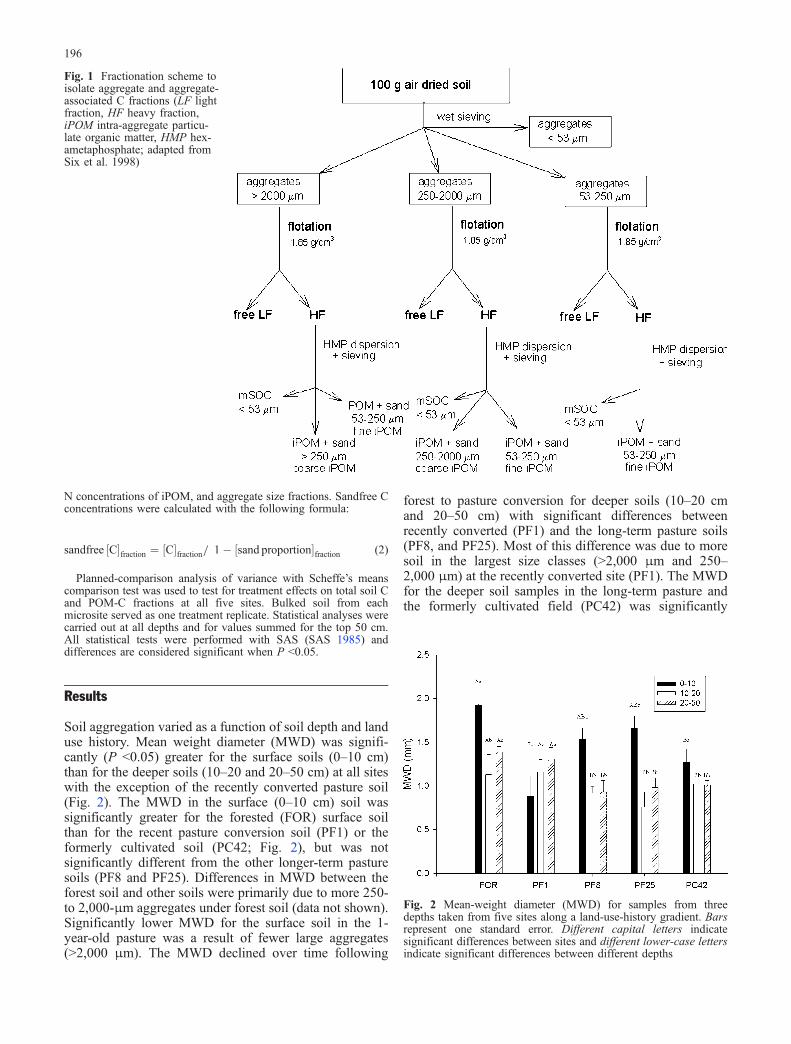
Soil aggregation varied as a function of soil depth and landuse history. Mean weight diameter (MWD) was signifi-cantly (P <0.05) greater for the surface soils (0–10 cm)than for the deeper soils (10–20 and 20–50 cm) at all siteswith the exception of the recently converted pasture soil(Fig. 2). The MWD in the surface (0–10 cm) soil wassignificantly greater for the forested (FOR) surface soilthan for the recent pasture conversion soil (PF1) or theformerly cultivated soil (PC42; Fig. 2), but was notsignificantly different from the other longer-term pasturesoils (PF8 and PF25). Differences in MWD between theforest soil and other soils were primarily due to more 250-to 2,000-μm aggregates under forest soil (data not shown).Significantly lower MWD for the surface soil in the 1-year-old pasture was a result of fewer large aggregates(>2,000 μm). The MWD declined over time following
forest to pasture conversion for deeper soils (10–20 cmand 20–50 cm) with significant differences betweenrecently converted (PF1) and the long-term pasture soils(PF8, and PF25). Most of this difference was due to moresoil in the largest size classes (>2,000 μm and 250–2,000 μm) at the recently converted site (PF1). The MWDfor the deeper soil samples in the long-term pasture andthe formerly cultivated field (PC42) was significantly
Fig. 1 Fractionation scheme toisolate aggregate and aggregate-associated C fractions (LF lightfraction, HF heavy fraction,iPOM intra-aggregate particu-late organic matter, HMP hex-ametaphosphate; adapted fromSix et al. 1998)
Fig. 2 Mean-weight diameter (MWD) for samples from threedepths taken from five sites along a land-use-history gradient. Barsrepresent one standard error. Different capital letters indicatesignificant differences between sites and different lower-case lettersindicate significant differences between different depths
196
lower than that under the forest or recently convertedpasture (FOR and PF1) soils (Fig. 2).
Total profile (0–50 cm) soil C content was notsignificantly different between soils under the variousland use histories (see Table 2). Likewise soil C contentswithin the different depth increments were not signifi-cantly different for different management treatments, withthe exception that the deepest soil increment (20–50 cm)for the recently converted pasture soils (PF1 and PF8) wassignificantly lower than soil C content for the other landuse histories (Table 2). Contents of POM C did not differbetween sites for any of the three depth increments. Theproportion of total C in the POM fraction (not shown) forsurface (0–10 cm) soils was significantly greater underforest (37.4%) than for the other treatments, while for thedeepest depth increment (20–50 cm) the proportion wassignificantly lower under forest (4.8%), long-term pasture(7.7%), and long-term cultivation (8.5%) than under recentforest to pasture conversions (PF1=16.0% andPF8=17.1%). Total column (0–50 cm) POM C was alarger portion of total column C for recently convertedpastures (PF1=26.3% and PF8=24.7%) than for the othersites.
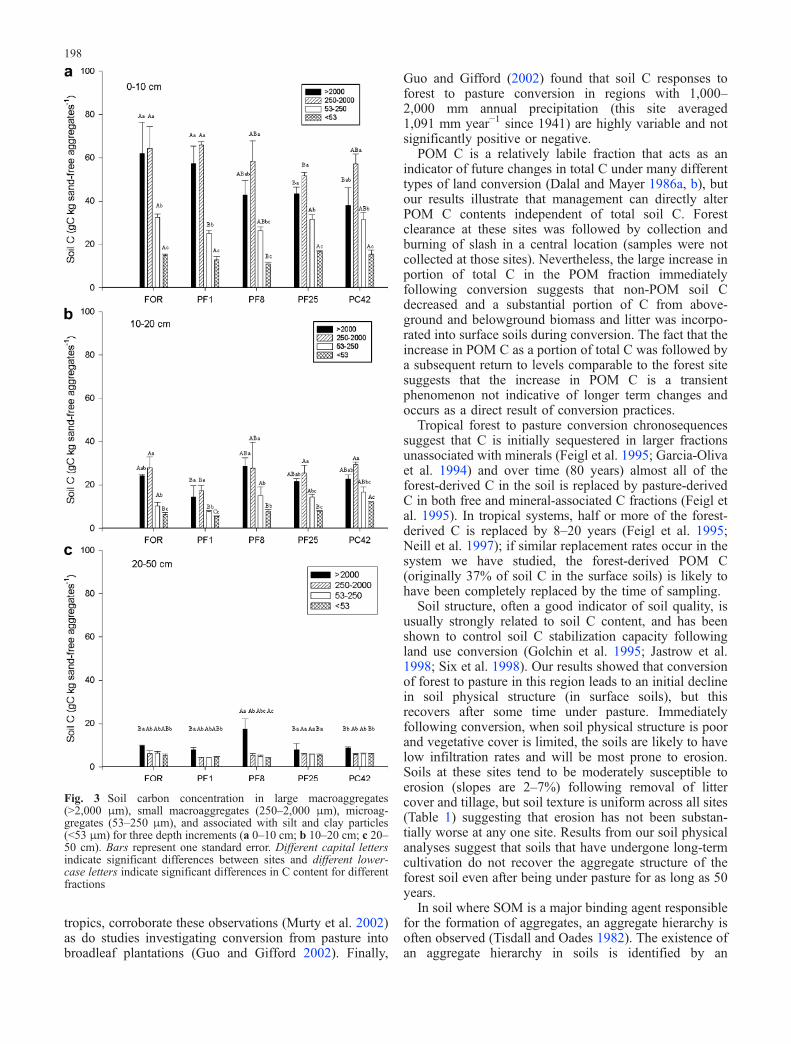
For the surface layer at all sites, soil C content wasgreatest within the macroaggregates (250–2,000 and>2,000 μm; Fig. 3a). Lowest C concentrations werefound in the non-aggregated fraction (silt plus clay,<53 μm). A similar pattern, but with less differentiationbetween size fractions was found for the 0- to 20-cmincrement (Fig. 3b). In the surface soils (0–10 cm) soil Cconcentration for the largest aggregate size classes (>2,000and 250–2,000 μm) tended to decrease slightly over timesince pasture conversion while that in the next size class(53–250 μm) decreased initially and then increased overtime (Fig. 3a). Trends with changes in time sinceconversion were less apparent for either of the deeperdepth increments (10–20 or 20–50 cm; Fig. 3b, c), but soilC concentrations decreased slightly for smaller fractions(<53 and 53–250 μm) at the site recently converted fromforest to pasture for the 10- to 20-cm increment (Fig. 3b).Soil C concentrations for the deepest samples (20–50 cm)were significantly greater for the largest size class(>2,000 μm) than for the other three size classes. Soil Cconcentration decreased significantly with depth incrementfor all size classes from all management histories.
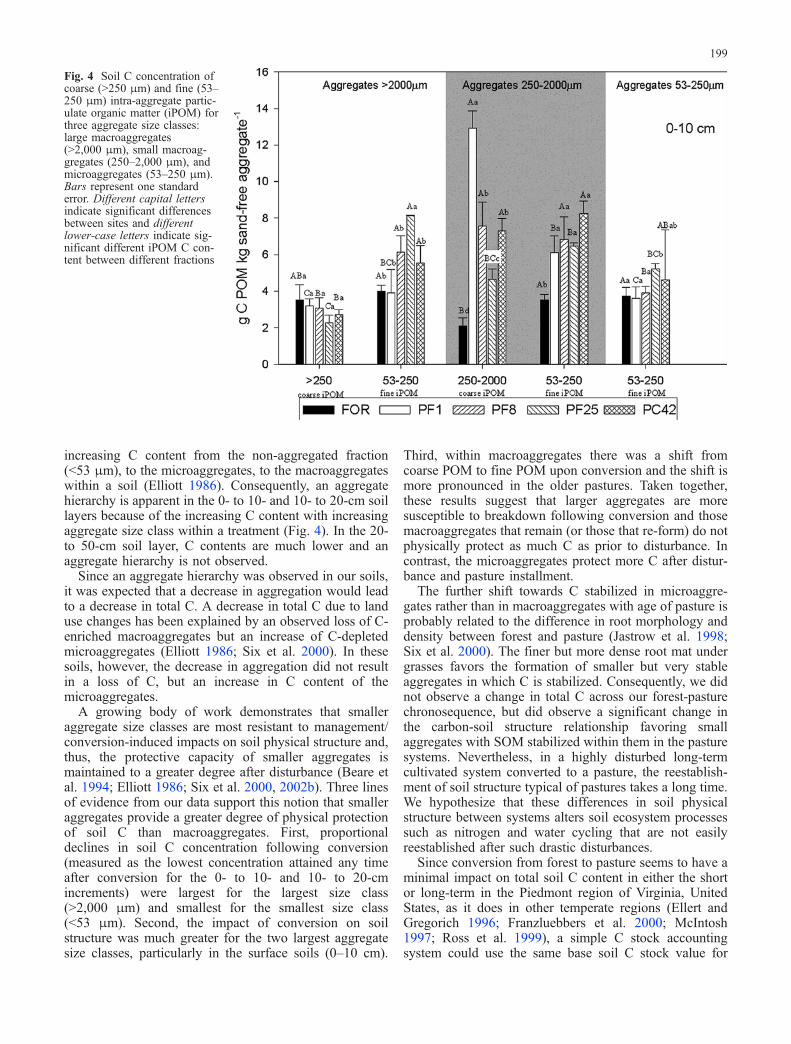
Intra-particulate organic matter fractions (iPOM) largerthan 250 μm (coarse iPOM) found within the largestmacroaggregate size class (>2,000 μm) of the surface soillayer (0–10 cm) averaged C concentrations of 2.8 g C kg
soil−1 that were not significantly different between any ofthe land-use-history treatments (Fig. 4). Carbon concen-tration in smaller iPOM fractions (fine iPOM; 53–250 μm)within large macroaggregates (>2,000 μm) did not changeimmediately after conversion, but increased significantlywith time under pasture (Fig. 4). Carbon concentration forfine iPOM fractions (53–250 μm) within smaller macro-aggregates (250–2,000 μm) was significantly greater thanthat for coarse iPOM fractions (250–2,000 μm) for the twooldest pasture sites and for the cultivated site (Fig. 4).Within smaller macroaggregates (250–2,000 μm), iPOMC concentrations for all pasture sites were significantlygreater than that of the forest site for both fine and coarseiPOM (Fig. 4). For coarse iPOM (250–2,000 μm) withinthe small macroaggregates (250–2,000 μm), the site mostrecently converted from forest to pasture had significantlyhigher coarse iPOM C than the other sites, while the oldestforest to pasture conversion site had lower C concentra-tions than the other pasture sites (Fig. 4). Within thesmallest aggregate size class (53–250 μm) the long-termpasture site had higher fine iPOM C concentration thanany of the land use treatments other than the formerlycultivated pasture site.
Discussion
Our results from well-managed temperate pastures (i.e.,fertilized, grass/legume pastures that are rotationallygrazed at moderate stocking rates) demonstrate that soilC contents are likely to be maintained, but not increased,following conversion from forest to pasture. Conversionfrom forest to pasture in the Piedmont region of Virginiaresults in the short-term loss of small amounts of soil C(9.1% and 11.3% over 2 and 14 years, respectively) that iseventually regained over time and may increase slightly(4% increase in soil C over 42 years) if the land remains inwell-managed pasture. Like other forest to pastureconversion studies in temperate regions, changes in soilC content are small relative to total soil C content (Ellertand Gregorich 1996; Franzluebbers et al. 2000; McIntosh1997; Ross et al. 1999). Soil C content before conversion,conversion procedures (i.e., treatment of slash, disturbanceto the soil, etc.), and management following conversionare likely to be important factors controlling whetherconversion leads to net C loss, net C sequestration, or nochange (Fearnside and Barbosa 1998; Garcia-Oliva et al.1994; Murty et al. 2002). Other published forest to pasturechronosequence studies, which are largely restricted to the
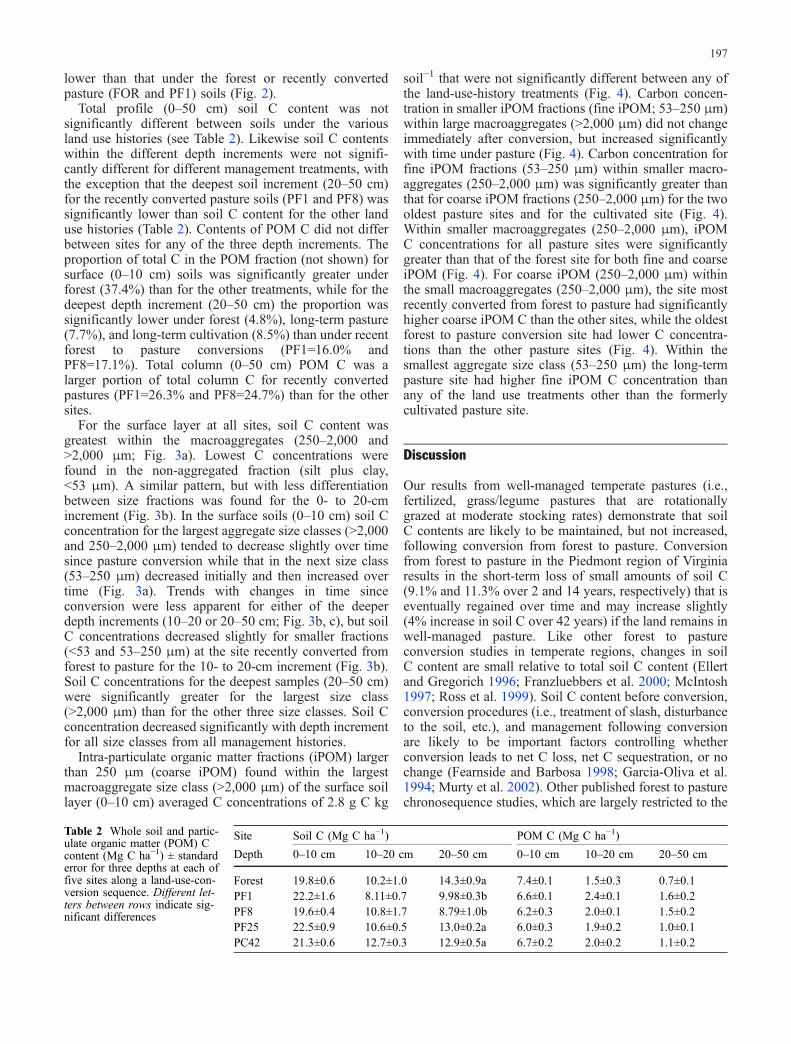
Table 2 Whole soil and partic-ulate organic matter (POM) Ccontent (Mg C ha−1) ± standarderror for three depths at each offive sites along a land-use-con-version sequence. Different let-ters between rows indicate sig-nificant differences
Site Soil C (Mg C ha−1) POM C (Mg C ha−1)
Depth 0–10 cm 10–20 cm 20–50 cm 0–10 cm 10–20 cm 20–50 cm
Forest 19.8±0.6 10.2±1.0 14.3±0.9a 7.4±0.1 1.5±0.3 0.7±0.1PF1 22.2±1.6 8.11±0.7 9.98±0.3b 6.6±0.1 2.4±0.1 1.6±0.2PF8 19.6±0.4 10.8±1.7 8.79±1.0b 6.2±0.3 2.0±0.1 1.5±0.2PF25 22.5±0.9 10.6±0.5 13.0±0.2a 6.0±0.3 1.9±0.2 1.0±0.1PC42 21.3±0.6 12.7±0.3 12.9±0.5a 6.7±0.2 2.0±0.2 1.1±0.2
197
tropics, corroborate these observations (Murty et al. 2002)as do studies investigating conversion from pasture intobroadleaf plantations (Guo and Gifford 2002). Finally,
Guo and Gifford (2002) found that soil C responses toforest to pasture conversion in regions with 1,000–2,000 mm annual precipitation (this site averaged1,091 mm year−1 since 1941) are highly variable and notsignificantly positive or negative.
POM C is a relatively labile fraction that acts as anindicator of future changes in total C under many differenttypes of land conversion (Dalal and Mayer 1986a, b), butour results illustrate that management can directly alterPOM C contents independent of total soil C. Forestclearance at these sites was followed by collection andburning of slash in a central location (samples were notcollected at those sites). Nevertheless, the large increase inportion of total C in the POM fraction immediatelyfollowing conversion suggests that non-POM soil Cdecreased and a substantial portion of C from above-ground and belowground biomass and litter was incorpo-rated into surface soils during conversion. The fact that theincrease in POM C as a portion of total C was followed bya subsequent return to levels comparable to the forest sitesuggests that the increase in POM C is a transientphenomenon not indicative of longer term changes andoccurs as a direct result of conversion practices.
Tropical forest to pasture conversion chronosequencessuggest that C is initially sequestered in larger fractionsunassociated with minerals (Feigl et al. 1995; Garcia-Olivaet al. 1994) and over time (80 years) almost all of theforest-derived C in the soil is replaced by pasture-derivedC in both free and mineral-associated C fractions (Feigl etal. 1995). In tropical systems, half or more of the forest-derived C is replaced by 8–20 years (Feigl et al. 1995;Neill et al. 1997); if similar replacement rates occur in thesystem we have studied, the forest-derived POM C(originally 37% of soil C in the surface soils) is likely tohave been completely replaced by the time of sampling.
Soil structure, often a good indicator of soil quality, isusually strongly related to soil C content, and has beenshown to control soil C stabilization capacity followingland use conversion (Golchin et al. 1995; Jastrow et al.1998; Six et al. 1998). Our results showed that conversionof forest to pasture in this region leads to an initial declinein soil physical structure (in surface soils), but thisrecovers after some time under pasture. Immediatelyfollowing conversion, when soil physical structure is poorand vegetative cover is limited, the soils are likely to havelow infiltration rates and will be most prone to erosion.Soils at these sites tend to be moderately susceptible toerosion (slopes are 2–7%) following removal of littercover and tillage, but soil texture is uniform across all sites(Table 1) suggesting that erosion has not been substan-tially worse at any one site. Results from our soil physicalanalyses suggest that soils that have undergone long-termcultivation do not recover the aggregate structure of theforest soil even after being under pasture for as long as 50years.
In soil where SOM is a major binding agent responsiblefor the formation of aggregates, an aggregate hierarchy isoften observed (Tisdall and Oades 1982). The existence ofan aggregate hierarchy in soils is identified by an
Fig. 3 Soil carbon concentration in large macroaggregates(>2,000 μm), small macroaggregates (250–2,000 μm), microag-gregates (53–250 μm), and associated with silt and clay particles(<53 μm) for three depth increments (a 0–10 cm; b 10–20 cm; c 20–50 cm). Bars represent one standard error. Different capital lettersindicate significant differences between sites and different lower-case letters indicate significant differences in C content for differentfractions
198
increasing C content from the non-aggregated fraction(<53 μm), to the microaggregates, to the macroaggregateswithin a soil (Elliott 1986). Consequently, an aggregatehierarchy is apparent in the 0- to 10- and 10- to 20-cm soillayers because of the increasing C content with increasingaggregate size class within a treatment (Fig. 4). In the 20-to 50-cm soil layer, C contents are much lower and anaggregate hierarchy is not observed.
Since an aggregate hierarchy was observed in our soils,it was expected that a decrease in aggregation would leadto a decrease in total C. A decrease in total C due to landuse changes has been explained by an observed loss of C-enriched macroaggregates but an increase of C-depletedmicroaggregates (Elliott 1986; Six et al. 2000). In thesesoils, however, the decrease in aggregation did not resultin a loss of C, but an increase in C content of themicroaggregates.
A growing body of work demonstrates that smalleraggregate size classes are most resistant to management/conversion-induced impacts on soil physical structure and,thus, the protective capacity of smaller aggregates ismaintained to a greater degree after disturbance (Beare etal. 1994; Elliott 1986; Six et al. 2000, 2002b). Three linesof evidence from our data support this notion that smalleraggregates provide a greater degree of physical protectionof soil C than macroaggregates. First, proportionaldeclines in soil C concentration following conversion(measured as the lowest concentration attained any timeafter conversion for the 0- to 10- and 10- to 20-cmincrements) were largest for the largest size class(>2,000 μm) and smallest for the smallest size class(<53 μm). Second, the impact of conversion on soilstructure was much greater for the two largest aggregatesize classes, particularly in the surface soils (0–10 cm).
Third, within macroaggregates there was a shift fromcoarse POM to fine POM upon conversion and the shift ismore pronounced in the older pastures. Taken together,these results suggest that larger aggregates are moresusceptible to breakdown following conversion and thosemacroaggregates that remain (or those that re-form) do notphysically protect as much C as prior to disturbance. Incontrast, the microaggregates protect more C after distur-bance and pasture installment.
The further shift towards C stabilized in microaggre-gates rather than in macroaggregates with age of pasture isprobably related to the difference in root morphology anddensity between forest and pasture (Jastrow et al. 1998;Six et al. 2000). The finer but more dense root mat undergrasses favors the formation of smaller but very stableaggregates in which C is stabilized. Consequently, we didnot observe a change in total C across our forest-pasturechronosequence, but did observe a significant change inthe carbon-soil structure relationship favoring smallaggregates with SOM stabilized within them in the pasturesystems. Nevertheless, in a highly disturbed long-termcultivated system converted to a pasture, the reestablish-ment of soil structure typical of pastures takes a long time.We hypothesize that these differences in soil physicalstructure between systems alters soil ecosystem processessuch as nitrogen and water cycling that are not easilyreestablished after such drastic disturbances.
Since conversion from forest to pasture seems to have aminimal impact on total soil C content in either the shortor long-term in the Piedmont region of Virginia, UnitedStates, as it does in other temperate regions (Ellert andGregorich 1996; Franzluebbers et al. 2000; McIntosh1997; Ross et al. 1999), a simple C stock accountingsystem could use the same base soil C stock value for
Fig. 4 Soil C concentration ofcoarse (>250 μm) and fine (53–250 μm) intra-aggregate partic-ulate organic matter (iPOM) forthree aggregate size classes:large macroaggregates(>2,000 μm), small macroag-gregates (250–2,000 μm), andmicroaggregates (53–250 μm).Bars represent one standarderror. Different capital lettersindicate significant differencesbetween sites and differentlower-case letters indicate sig-nificant different iPOM C con-tent between different fractions
199
either type of land use (Houghton et al. 1997). However,since the effects of conversion from forest to pasture are afunction of grassland management following conversion(Conant et al. 2003), assessments of C sequestration rates(either current or potential) require activity data on theextent of various grassland management practices.
Acknowledgements We wish to thank Nasheed Smith, Jen Carter,and Sarah Moculeski for assistance in processing and analyzing soilsamples. Thanks also to Billy Wayson for graciously allowing us tocollect soil samples in his pastures and forest and providing detailedland use history for the sites. Glenn Johnson was instrumental inidentifying a producer willing to participate in our study. Thanks toJim Hammons, Mark Alley, and the Department of Crop and SoilEnvironmental Sciences at Virginia Polytechnic Institute and StateUniversity for field assistance and use of their Giddings rig. LouisW. Heidel, and Jim Sawyer assisted with collection of soil samples.This research was funded by grant 826499-01-0 from theEnvironmental Protection Agency and by grant DE-FG03-00ER62997 from the Department of Energy. Alain Plante and oneanonymous reviewer provided useful comments on an earlierversion of this manuscript.
References
Beare MH, Cabrera ML, Hendrix PF, Coleman DC (1994)Aggregate-protected and unprotected organic matter pools inconventional- and no-tillage soils. Soil Sci Soc Am J 58:787–795
Canadell JG, Pitelka LF, Ingram JSI (1996) The effects of elevatedCO2 on plant-soil carbon below-ground: a summary andsynthesis. Plant Soil 187:391–400
Conant RT, Six J, Paustian K (2003) Land use effects on soil carbonfractions in the southeastern United States. I. Managementintensive versus extensive grazing. Biol Fertil Soils 38:386–392
Dalal RC, Mayer RJ (1986a) Long-term trends in fertility of soilsunder continuous cultivation and cereal cropping in SouthernQueensland. III. Distribution and kinetics of soil organic carbonin particle-size fractions. Aust J Soil Res 24:281–292
Dalal RC, Mayer RJ (1986b) Long-term trends in fertility of soilsunder continuous cultivation and cereal cropping in SouthernQueensland. IV. Loss of organic carbon from different densityfunctions. Aust J Soil Res 24:301–309
Ellert BH, Gregorich EG (1996) Storage of carbon, nitrogen, andphosphorous in cultivated and adjacent forested soils ofOntario. Soil Sci 161:587–603
Ellert BH, Janzen HH, McConkey BG (2001) Measuring andcomparing soil carbon storage. In: Lal R, Kimble JM, FollettRF, Stewart BA (eds) Assessment methods for soil carbon.CRC, Boca Raton, Fla., pp 131–146
Ellert BH, Janzen HH, Eritz T (2002) Assessment of a method tomeasure temporal change in soil carbon storage. Soil Sci SocAm J 66:1687–1695
Elliott ET (1986) Aggregate structure and carbon, nitrogen, andphosphorus in native and cultivated soils. Soil Sci Soc Am J50:627–633
Fearnside PM, Barbosa RI (1998) Soil carbon changes fromconversion of forest to pasture in Brazilian Amazonia. ForEcol Manage 108:147–166
Feigl BJ, Melillo J, Cerri CC (1995) Changes in the origin andquality of soil organic matter after pasture introduction inRondonia (Brazil). Plant Soil 175:21–29
Franzluebbers AJ, Stuedmann JA, Schomberg HH, Wilkinson SR(2000) Soil organic C and N pools under long-term pasturemanagement in the Southern Piedmont USA. Soil BiolBiochem 32:469–478
Garcia-Oliva F, Casar I, Morales P, Maass JM (1994) Forest-to-pasture conversion influences on soil organic carbon dynamicsin a tropical deciduous forest. Oecologia 99:392–396
Golchin A, Clarke P, Oades JM, Skjemstad JO (1995) The effects ofcultivation on the composition of organic matter and structuralstability of soils. Aust J Soil Res 33:975–993
Guo LB, Gifford RM (2002) Soil carbon stocks and land usechange: a meta analysis. Global Change Biol 8:345–360
Haynes RJ (2000) Labile organic matter as an indicator of organicmatter quality in arable and pastoral soils in New Zealand. SoilBiol Biochem 32:211–219
Houghton JT, Meira Filho LG, Lim B, Treanton K, Marmaty I,Bonduki Y, Griggs DJ, Callander BA (1997) Revised 1996IPCC guidelines for national greenhouse gas inventories. UKMeteorological Office, Bracknell
Houghton RA, Hackler JL, Lawrence KT (1999) The U.S. carbonbudget: contributions from land-use change. Science 285:574–578
Jastrow JD, Miller RM, Lussenhop J (1998) Contributions ofinteracting biological mechanisms to soil aggregate stabiliza-tion in restored prairie. Soil Biol Biochem 30:905–916
Kemper WD, Rosenau R, Nelson S (1985) Gas displacement andaggregate stability of soils. Soil Sci Soc Am J 49:25–28
McIntosh PD (1997) Nutrient changes in tussock grasslands, SouthIsland, New Zealand. R Swed Acad Sci 26:147–151
Murty D, Kirschbaum MUF, McMurtrie RE, McGilvray H (2002)Does conversion of forest to agricultural land changes soilcarbon and nitrogen? A review of the literature. Global ChangeBiol 8:105–123
Neill C, Melillo JM, Steudler PA, Cerri CC, Moraes JFLd, PiccoloMC, Brito M (1997) Soil carbon and nitrogen stocks followingforest clearing for pasture in the Southwestern BrazilianAmazon. Ecol Appl 7:1216–1225
Ross DJ, Tate KR, Scott NA, Feltham CW (1999) Land-use change:effects on soil carbon, nitrogen and phosphorous pools andfluxes in three adjacent ecosystems. Soil Biol Biochem 31:803–813
SAS (1985) SAS user’s guide: statistics version, 5th edn. SASInstitute, Cary
Six J, Elliott ET, Paustian K, Doran JW (1998) Aggregation and soilorganic matter accumulation in cultivated and native grasslandsoils. Soil Sci Soc Am J 62:1367–1377
Six J, Elliott ET, Paustian K (1999) Aggregate and soil organicmatter dynamics under conventional and no-tillage systems.Soil Sci Soc Am J 63:1350–1358
Six J, Elliott ET, Paustian K (2000) Soil macroaggregate turnoverand microaggregate formation: a mechanism for C sequestra-tion under no-tillage agriculture. Soil Biol Biochem 32:2099–2103
Six J, Callewaert P, Lenders S, Degryze S, Paustian K, Morris SJ,Gregorich EG, Paul EA (2002a) Measuring and understandingcarbon storage in afforested soils by physical fractionation. SoilSci Soc Am J 66:1981–1987
Six J, Conant RT, Paul EA, Paustian K (2002b) Stabilizationmechanisms of soil organic matter: implications for C-satura-tion of soils. Plant Soil 241:155–176
Tisdall JM, Oades JM (1982) Organic-matter and water-stableaggregates in soils. J Soil Sci 33:141–163
USDA (2002) National resources inventory digital data. NaturalResource Conservation Service, Washington, D.C.
200