land use, agronomic management and water quality in a small northern italian watershed
TRANSCRIPT
Agriculture, Ecosystems and Environment 87 (2001) 1–12
Land use, agronomic management and waterquality in a small Northern Italian watershed
Ciro Gardi∗Department of Environmental Science, University of Parma, Viale delle Scienze 33a, 43100 Parma, Italy
Received 3 September 1999; received in revised form 19 May 2000; accepted 18 September 2000
Abstract
European union (EU) agricultural policy has induced significant changes in crop rotations, especially in marginal areas. Theevaluation of the impact on water quality induced by this new agronomic framework is presented in this paper. The discharge,the sediment content and the concentrations of herbicides and nitrates in the Centonara creek, draining a hilly watershednear Bologna, were measured from October 1994 to September 1996. A geographic information system (GIS) and the cropsimulation model CropSyst were used to characterize the relationships between cropping systems, land use, pedological andmorphological properties of the watershed as well as nitrate losses. Hydrological results showed that the Centonara creek dis-charge was characterized by low base flows and by fast increments during flooding. Herbicide concentrations were above the EU0.1 �g l−1 limit on several occasions, whereas nitrate concentrations were always below the 50 mg l−1 limit established by EUfor drinking waters. It was estimated that more than 30% of the nitrogen input in the watershed is due to atmospheric depositions.
The purpose of GIS was to subdivide the watershed in 86 “agronomically homogeneous areas”, which were then utilized asthe basis for the application of CropSyst. Simulations obtained by the model showed that the greatest leaching losses of nitrateswere higher than 10 kg ha−1 yr−1 exclusively in the agronomically homogeneous areas characterized by coarser textured soils.Overall nitrate and herbicide losses were low, mainly due to the differentiation of the cropping systems in the watershed.The combined use of GIS and CropSyst enabled the characterization of the environmental vulnerability in relation to theland use in the watershed by means of pedologic cartography, land use maps and meteorological data. In particular, erosionand herbicide losses were higher in sloping areas planted with spring–summer crops. The increase in row crops cultivations,determined by EU agricultural policy, represents the main impact on water quality of the investigated area. © 2001 ElsevierScience B.V. All rights reserved.
Keywords: Watershed; Water quality; Crop simulation model; GIS; Land use; Northern Italy
1. Introduction
The environmental impact of agricultural activ-ities is becoming a serious problem, especially inindustrialized countries. Eutrophication problems, forinstance, caused by high concentration of nutrients
∗ Tel.: +39-521-905692; fax: +39-521-905696.E-mail address: [email protected] (C. Gardi).
in waters, represent one of the possible environmen-tal impacts of agriculture and animal husbandry. InItaly, in the Northern Adriatic Sea, algal blooms haveassumed the dimension of an ecological catastrophesince 1988 (AA.VV., 1997).
Connections between agriculture and water qual-ity have been described as both obvious and elusive(Braden and Uchtmann, 1985). Nitrogen, especiallyin nitrate form, represents one of the most important
0167-8809/01/$ – see front matter © 2001 Elsevier Science B.V. All rights reserved.PII: S0167 -8809 (00 )00291 -7
2 C. Gardi / Agriculture, Ecosystems and Environment 87 (2001) 1–12
factors in water quality degradation; nitrate lossesfrom agricultural areas are generally larger than lossesfrom natural ecosystems. Owens (1994) reportedin drainage waters from agricultural areas, nitratelosses ranging between 0.7 and 120 kg ha−1 yr−1 andNO3 concentrations between 2.9 and 195 mg l−1. InFriuli (Italy) trials, nitrate losses in drainage watersranged between 2 and 40 kg ha−1 yr−1 (Pasti et al.,1995). Range lands, and in general permanent grass-lands, have a high absorption capacity for nitrate,even when annually fertilized; however when theseareas receive large amounts of nitrogen fertilizer(200–450 kg N ha−1 yr−1), they can produce high ni-trate losses (Steenvoorden et al., 1986; van Burgh,1986). Nitrate losses in surface runoff water are gen-erally more limited. Burwell et al. (1975) reportedfor arable lands nitrate runoff losses ranging between1 and 3.7 kg ha−1 yr−1, lower than nitrogen rainfallinput (mostly nitrate).
Environmental dispersion of chemicals used inagriculture, such as herbicides, is also an importantfactor affecting water quality. Herbicide concentra-tions in water often exceed the limits for drinking wa-ter. Runoff events occurring in 2–4 weeks followingthe application date can result in very high losses andconcentration peaks (Glotfelty et al., 1984; Bowmanet al., 1994).
In an effort to understand how water quality isaffected by agricultural activity, drainage waters of asmall watershed were analyzed over a 2-year period.An objective of this study was to investigate dynam-ics of nitrate and herbicides concentrations in water,and to understand relations between physical charac-teristics of watershed, agronomic practices and waterquality. Another objective was to apply GIS and a cropsimulation models in order to characterize the water-shed and to demonstrate environmentally vulnerableareas.
2. Materials and methods
2.1. Study area
The Centonara watershed is located on the firstNorthern Apennine relief, east of Bologna (lat.44◦28′N, long. 11◦28′E). The watershed area is 273 haand elevation ranges between 84 and 354 m a.s.l.
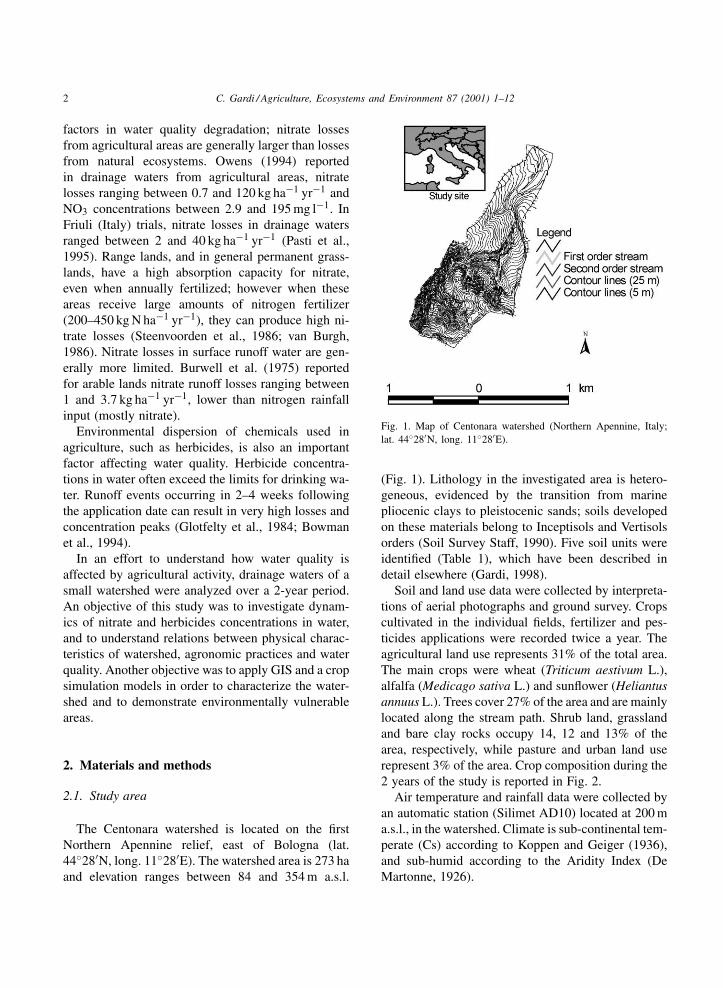
Fig. 1. Map of Centonara watershed (Northern Apennine, Italy;lat. 44◦28′N, long. 11◦28′E).
(Fig. 1). Lithology in the investigated area is hetero-geneous, evidenced by the transition from marinepliocenic clays to pleistocenic sands; soils developedon these materials belong to Inceptisols and Vertisolsorders (Soil Survey Staff, 1990). Five soil units wereidentified (Table 1), which have been described indetail elsewhere (Gardi, 1998).
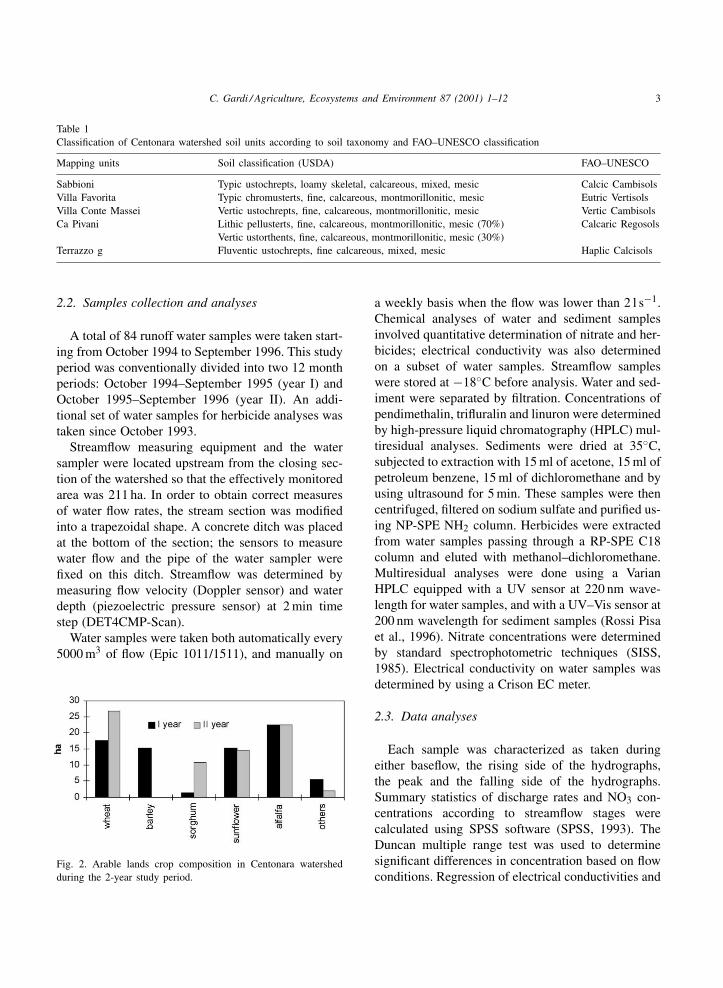
Soil and land use data were collected by interpreta-tions of aerial photographs and ground survey. Cropscultivated in the individual fields, fertilizer and pes-ticides applications were recorded twice a year. Theagricultural land use represents 31% of the total area.The main crops were wheat (Triticum aestivum L.),alfalfa (Medicago sativa L.) and sunflower (Heliantusannuus L.). Trees cover 27% of the area and are mainlylocated along the stream path. Shrub land, grasslandand bare clay rocks occupy 14, 12 and 13% of thearea, respectively, while pasture and urban land userepresent 3% of the area. Crop composition during the2 years of the study is reported in Fig. 2.
Air temperature and rainfall data were collected byan automatic station (Silimet AD10) located at 200 ma.s.l., in the watershed. Climate is sub-continental tem-perate (Cs) according to Koppen and Geiger (1936),and sub-humid according to the Aridity Index (DeMartonne, 1926).
C. Gardi / Agriculture, Ecosystems and Environment 87 (2001) 1–12 3
Table 1Classification of Centonara watershed soil units according to soil taxonomy and FAO–UNESCO classification
Mapping units Soil classification (USDA) FAO–UNESCO
Sabbioni Typic ustochrepts, loamy skeletal, calcareous, mixed, mesic Calcic CambisolsVilla Favorita Typic chromusterts, fine, calcareous, montmorillonitic, mesic Eutric VertisolsVilla Conte Massei Vertic ustochrepts, fine, calcareous, montmorillonitic, mesic Vertic CambisolsCa Pivani Lithic pellusterts, fine, calcareous, montmorillonitic, mesic (70%)
Vertic ustorthents, fine, calcareous, montmorillonitic, mesic (30%)Calcaric Regosols
Terrazzo g Fluventic ustochrepts, fine calcareous, mixed, mesic Haplic Calcisols
2.2. Samples collection and analyses
A total of 84 runoff water samples were taken start-ing from October 1994 to September 1996. This studyperiod was conventionally divided into two 12 monthperiods: October 1994–September 1995 (year I) andOctober 1995–September 1996 (year II). An addi-tional set of water samples for herbicide analyses wastaken since October 1993.
Streamflow measuring equipment and the watersampler were located upstream from the closing sec-tion of the watershed so that the effectively monitoredarea was 211 ha. In order to obtain correct measuresof water flow rates, the stream section was modifiedinto a trapezoidal shape. A concrete ditch was placedat the bottom of the section; the sensors to measurewater flow and the pipe of the water sampler werefixed on this ditch. Streamflow was determined bymeasuring flow velocity (Doppler sensor) and waterdepth (piezoelectric pressure sensor) at 2 min timestep (DET4CMP-Scan).
Water samples were taken both automatically every5000 m3 of flow (Epic 1011/1511), and manually on
Fig. 2. Arable lands crop composition in Centonara watershedduring the 2-year study period.
a weekly basis when the flow was lower than 2 l s−1.Chemical analyses of water and sediment samplesinvolved quantitative determination of nitrate and her-bicides; electrical conductivity was also determinedon a subset of water samples. Streamflow sampleswere stored at −18◦C before analysis. Water and sed-iment were separated by filtration. Concentrations ofpendimethalin, trifluralin and linuron were determinedby high-pressure liquid chromatography (HPLC) mul-tiresidual analyses. Sediments were dried at 35◦C,subjected to extraction with 15 ml of acetone, 15 ml ofpetroleum benzene, 15 ml of dichloromethane and byusing ultrasound for 5 min. These samples were thencentrifuged, filtered on sodium sulfate and purified us-ing NP-SPE NH2 column. Herbicides were extractedfrom water samples passing through a RP-SPE C18column and eluted with methanol–dichloromethane.Multiresidual analyses were done using a VarianHPLC equipped with a UV sensor at 220 nm wave-length for water samples, and with a UV–Vis sensor at200 nm wavelength for sediment samples (Rossi Pisaet al., 1996). Nitrate concentrations were determinedby standard spectrophotometric techniques (SISS,1985). Electrical conductivity on water samples wasdetermined by using a Crison EC meter.
2.3. Data analyses
Each sample was characterized as taken duringeither baseflow, the rising side of the hydrographs,the peak and the falling side of the hydrographs.Summary statistics of discharge rates and NO3 con-centrations according to streamflow stages werecalculated using SPSS software (SPSS, 1993). TheDuncan multiple range test was used to determinesignificant differences in concentration based on flowconditions. Regression of electrical conductivities and
4 C. Gardi / Agriculture, Ecosystems and Environment 87 (2001) 1–12
nitrate concentrations on discharge rates were alsocalculated.
2.4. Geographical information system (GIS)
A GIS of the watershed was conducted using Au-toCAD and ArcCAD, ArcInfo, while the spatial anal-yses were done using ArcView. First step in the GISanalysis was the acquisition of the existing maps inAutoCAD by digitizing. Attribution of a label to eachfeature and creation of topology were done using Ar-cCAD, while the creation of digital elevation model
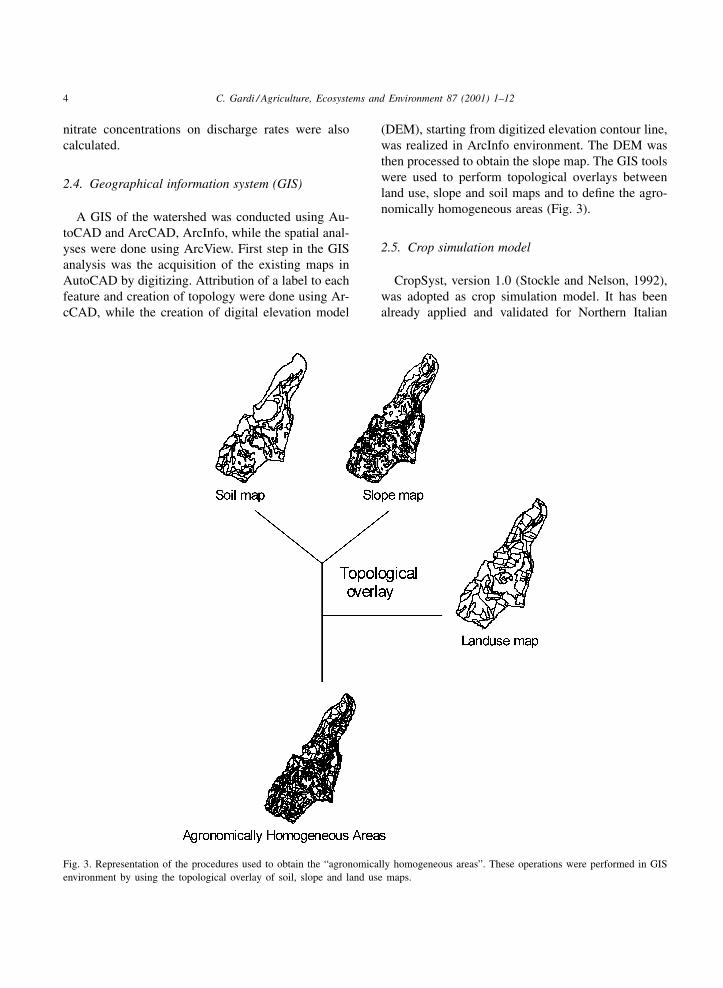
Fig. 3. Representation of the procedures used to obtain the “agronomically homogeneous areas”. These operations were performed in GISenvironment by using the topological overlay of soil, slope and land use maps.
(DEM), starting from digitized elevation contour line,was realized in ArcInfo environment. The DEM wasthen processed to obtain the slope map. The GIS toolswere used to perform topological overlays betweenland use, slope and soil maps and to define the agro-nomically homogeneous areas (Fig. 3).
2.5. Crop simulation model
CropSyst, version 1.0 (Stockle and Nelson, 1992),was adopted as crop simulation model. It has beenalready applied and validated for Northern Italian
C. Gardi / Agriculture, Ecosystems and Environment 87 (2001) 1–12 5
agricultural areas by Donatelli et al. (1997). Simu-lations were run for the entire agricultural area. Theinputs for the model were different sets for eachcombination of soil, slope, land use, managementpractices, whereas one meteorological data set wasapplied for the watershed. The GIS data base was usedas data input. Potential evapotranspiration (ETP) wascalculated according to the Priestley–Taylor equationusing minimum and maximum air temperature andprecipitation data and estimating solar radiation andvapor pressure deficit from air temperature.
A total of 172 simulations, corresponding to 86agronomically homogeneous areas for 2 years wererun. The GIS data base was linked to CropSyst byusing ArcInfo Cooperator, a computer program de-veloped at the Washington State University (Stockle,1994).
3. Results and discussion
3.1. Nitrogen and pesticides inputs
Table 2 reports the estimated inputs of N into the wa-tershed. The N inputs associated with wet and dry at-mospheric deposition were estimated by interpolation
Table 2Nitrogen inputs in Centonara watershed; in this inventory chemicalfertilizers, manures, animal grazing dejections, alfalfa symbioticfixation and atmospheric deposition were considered
Nitrogen inputs kg N kg N ha−1 Period
Nitrogen fertilizer 600 2.8 October 1994Nitrogen fertilizer 1000 4.7 January–February 1995Nitrogen fertilizer 4350 20.7 March–May 1995Nitrogen fertilizer 6875 32.6 March–May 1996Grazing animalsa 768 3.6 Year IGrazing animalsa 768 3.6 Year IIManure 750 3.6 Year IManure 500 2.4 Year IIBiologic fixationb 1340 6.4 Year IBiologic fixationb 1350 6.4 Year IIAtmospheric
depositionsc3726 17.7 Year I
Atmosphericdepositionsc
4106 19.5 Year II
a Estimated values from animal load (10 horses).b Estimated values considering a net nitrogen fixation of
60 kg alfalfa ha−1.c Estimated values from Mosello and Marchetto (1996) data.
Table 3Herbicides input in Centonara watershed obtained by farmers in-terviews based on the active ingredients
Herbicides kg a.i. kg a.i. ha−1 Period
Trifluralin 24.3 0.115 10/10/1994Trifluralin 14.6 0.069 15/10/1995Linuron 6.4 0.030 17/03/1994Linuron 13.5 0.064 10/10/1994Linuron 6.2 0.029 23/03/1995Linuron 7.8 0.037 15/10/1995Linuron 7.3 0.035 25/03/1996Pendimethalin 16.6 0.079 17/03/1994Pendimethalin 14.9 0.071 23/03/1995Pendimethalin 17.6 0.083 25/03/1996Mecoprop 6.3 0.030 15/10/1995Bromoxinil 1.8 0.008 15/10/1995Ioxinil 1.7 0.008 15/10/1995Metolachlor 1.7 0.008 3/04/1995Terbuthilazine 0.8 0.004 3/04/1995
of data published by Mosello and Marchetto (1996).According to this data, the average concentration ofNO3 and NH4 in rainfall were 4 and 1.5 mg l−1, re-spectively. The contribution of these sources of N inthe watershed accounted for 30 and 31% of total Ninputs for the first and second year, respectively. Bi-ological N fixation in the watershed was estimatedconsidering only the alfalfa area and a net input of60 kg ha−1 yr−1 (Brady and Weil, 1996). Fertilizer andmanure N inputs were obtained by field surveys andfarmers interviews. Eight herbicides were used in thewatershed, but only linuron, pendimethalin and triflu-ralin reached 50 g ha−1 yr−1 as reported in Table 3.
3.2. Hydrology
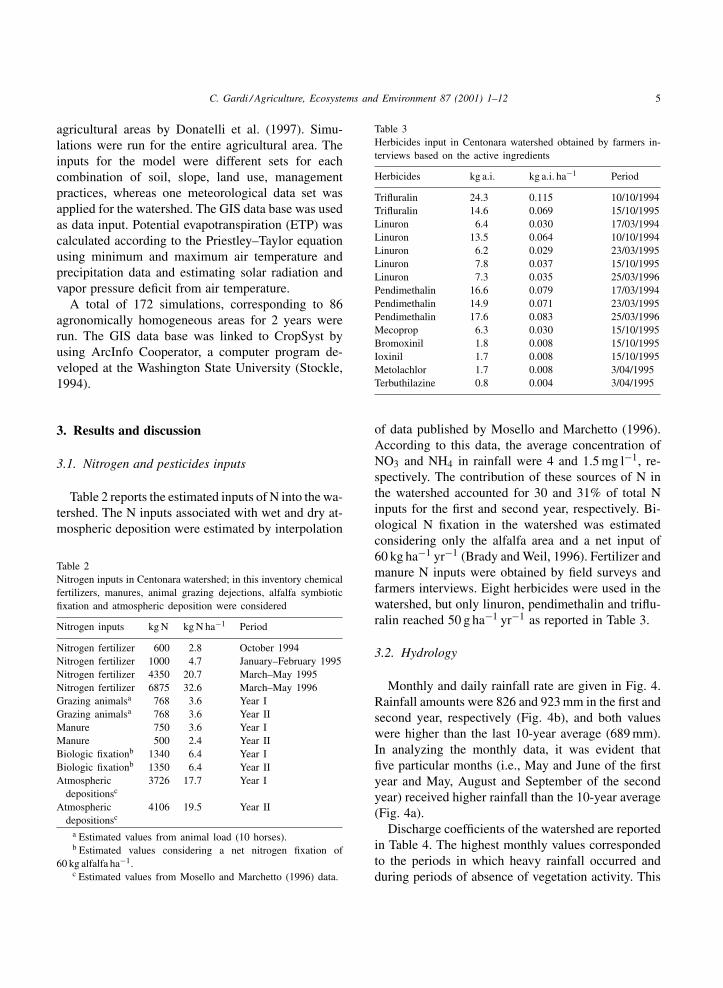
Monthly and daily rainfall rate are given in Fig. 4.Rainfall amounts were 826 and 923 mm in the first andsecond year, respectively (Fig. 4b), and both valueswere higher than the last 10-year average (689 mm).In analyzing the monthly data, it was evident thatfive particular months (i.e., May and June of the firstyear and May, August and September of the secondyear) received higher rainfall than the 10-year average(Fig. 4a).
Discharge coefficients of the watershed are reportedin Table 4. The highest monthly values correspondedto the periods in which heavy rainfall occurred andduring periods of absence of vegetation activity. This
6 C. Gardi / Agriculture, Ecosystems and Environment 87 (2001) 1–12
Fig. 4. Graphical representation of rainfall and discharge rate. (a)Comparison of monthly rainfall data for years I, II and the 10years average (1988–1997). (b) Daily rainfall. (c) Hydrographs ofCentonara creek.
last aspect, in particular, is indicated also by theCurve Number approach (SCS-USDA, 1972). Totaldischarges were 229 and 328 mm for the years I andII, respectively, corresponding to discharge coefficientof 0.28 and 0.44 (Fig. 4c). These values agree withHydrological National Service discharge coefficientsfor watersheds with similar characteristics and in thesame region. In contrast, research conducted on ex-perimental watersheds world wide indicate extremelyvariable discharge coefficients, mainly due to climaticconditions. Jawson et al. (1982) measured a 0.03discharge coefficient (370 mm rainfall and 10 mmdischarge) for a pasture watershed in Idaho (USA),while Caporali et al. (1981) found a 0.73 discharge
coefficient (2054 mm rainfall and 1500 mm discharge)in a forested watershed in Northern Apennines.
The analysis of hydrographs showed that the hy-drologic regime of Centonara creek was perennial, al-though it is characterized by extremely low dischargerates during dry periods and by abrupt rises of dis-charges during flood events. The flood events were de-termined essentially by runoff water; discharge ratescan be larger than 2 m3 s−1 and one of these events cancontribute more than 20% of the total yearly discharge.It is important to note that in 13% of watershed areapliocenic clays are present which are characterized byvery low permeability and the absence of any vege-tation cover (Rossi Pisa et al., 1996). Almost all therainfall on this area generates runoff with very shortconcentration time and discharge coefficients close to1. The average concentration time in the watershedranges between 60 and 70 min.
3.3. Water quality
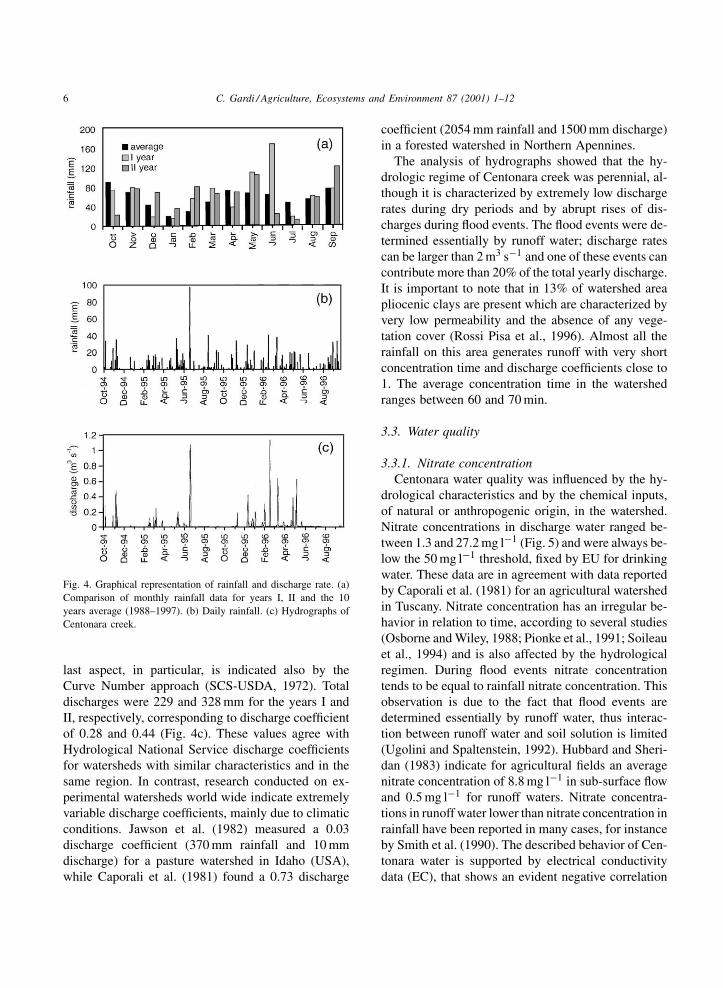
3.3.1. Nitrate concentrationCentonara water quality was influenced by the hy-
drological characteristics and by the chemical inputs,of natural or anthropogenic origin, in the watershed.Nitrate concentrations in discharge water ranged be-tween 1.3 and 27.2 mg l−1 (Fig. 5) and were always be-low the 50 mg l−1 threshold, fixed by EU for drinkingwater. These data are in agreement with data reportedby Caporali et al. (1981) for an agricultural watershedin Tuscany. Nitrate concentration has an irregular be-havior in relation to time, according to several studies(Osborne and Wiley, 1988; Pionke et al., 1991; Soileauet al., 1994) and is also affected by the hydrologicalregimen. During flood events nitrate concentrationtends to be equal to rainfall nitrate concentration. Thisobservation is due to the fact that flood events aredetermined essentially by runoff water, thus interac-tion between runoff water and soil solution is limited(Ugolini and Spaltenstein, 1992). Hubbard and Sheri-dan (1983) indicate for agricultural fields an averagenitrate concentration of 8.8 mg l−1 in sub-surface flowand 0.5 mg l−1 for runoff waters. Nitrate concentra-tions in runoff water lower than nitrate concentration inrainfall have been reported in many cases, for instanceby Smith et al. (1990). The described behavior of Cen-tonara water is supported by electrical conductivitydata (EC), that shows an evident negative correlation
C. Gardi / Agriculture, Ecosystems and Environment 87 (2001) 1–12 7
Table 4Monthly discharge coefficients of Centonara creek were calculated as the ratio between rainfall and discharge
Month and year Rainfall (mm) Discharge (m3) Discharge (mm) Discharge coefficients
October 1994 75.0 39534 18.7 0.25November 1994 79.6 78311 37.1 0.47December 1994 19.4 4926 2.3 0.12January 1995 15.6 2945 1.4 0.09February 1995 56.5 26622 12.6 0.22March 1995 77.4 62367 29.6 0.38April 1995 38.0 2215 1.1 0.03May 1995 109.6 61483 29.1 0.27June 1995 167.2 181028 85.8 0.51July 1995 17.8 7409 3.5 0.20August 1995 61.2 10167 4.8 0.08September 1995 75.6 6814 3.2 0.04October 1995 23.8 6808 3.2 0.14November 1995 77.0 23715 11.2 0.15December 1995 69.4 94540 44.8 0.65January 1996 36.4 64726 30.7 0.84February 1996 81.2 152818 72.4 0.89March 1996 67.0 101574 48.1 0.72April 1996 69.8 44452 21.1 0.30May 1996 105.2 171000 81.0 0.77June 1996 24.0 14804 7.0 0.29July 1996 11.8 7985 3.8 0.32August 1996 59.2 4080 1.9 0.03September 1996 121.4 5245 2.4 0.02
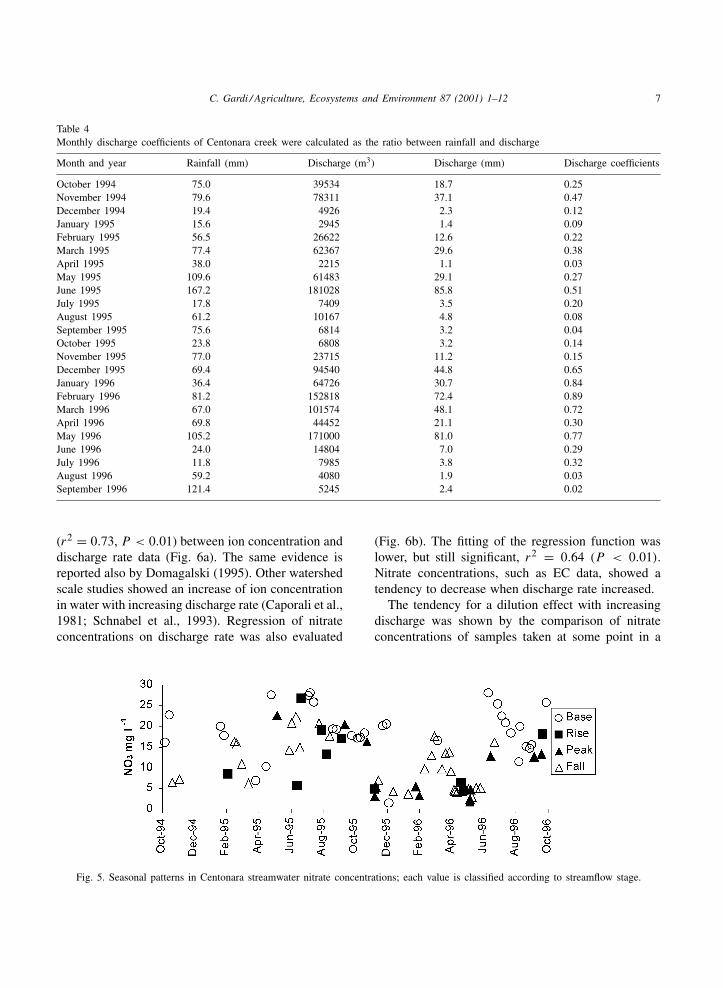
(r2 = 0.73, P < 0.01) between ion concentration anddischarge rate data (Fig. 6a). The same evidence isreported also by Domagalski (1995). Other watershedscale studies showed an increase of ion concentrationin water with increasing discharge rate (Caporali et al.,1981; Schnabel et al., 1993). Regression of nitrateconcentrations on discharge rate was also evaluated
Fig. 5. Seasonal patterns in Centonara streamwater nitrate concentrations; each value is classified according to streamflow stage.
(Fig. 6b). The fitting of the regression function waslower, but still significant, r2 = 0.64 (P < 0.01).Nitrate concentrations, such as EC data, showed atendency to decrease when discharge rate increased.
The tendency for a dilution effect with increasingdischarge was shown by the comparison of nitrateconcentrations of samples taken at some point in a
8 C. Gardi / Agriculture, Ecosystems and Environment 87 (2001) 1–12
Fig. 6. (a) Regression of water electric conductivities on dischargerates based on 54 samples. (b) Regression of water nitrate con-centrations on discharge rates based on 22 samples.
storm event (rising, falling or peak) with baseflow ni-trate concentrations (Table 5). The trend towards di-lution or concentration depends on the pedological,lithological and hydrological characteristics of the in-vestigated area. In areas characterized by soil withhigh permeability, where the sub-flow contribution tothe total discharge is important, the main effect willbe concentration, whereas in areas with low perme-able soils the dilution effect will be prevalent. It wasestimated that flood events of Centonara creek con-tributed for more than 90% of total annual discharge.
Table 5Summary of results of Centonara creek flow stages and nitrateconcentrations and discharge rate
Flow stage NO3 (mg l−1) Discharge (m3 h−1)
Mean S.D.a N Mean S.D. N
Base 19.6 Ab 5.7 29 7.2 A 4.5 29Rise 12.4 B 7.3 11 257.9 AB 767.8 11Peak 9.2 B 7.5 12 430.0 B 370.1 12Fall 10.5 B 5.9 32 40.3 B 56.6 32
a Standard deviation.b Means followed by the same letter are not significantly dif-
ferent at the 0.01 level based on Duncan’s multiple range test.
By integrating discharge and nitrate concentrationdata, nitrate losses in Centonara creek were calculatedas 30.3 and 28.0 kg N-NO3 ha−1 yr−1 for years I andII of the experiments, respectively. These values are inagreement with data published by Keeney and De Luca(1993), Taylor et al. (1992), Hayward et al. (1993)relative to north American and European watersheds,whereas Caporali et al. (1981) in the Era basin (CentralItaly) found larger values.
From the comparison between N inputs in the wa-tershed and measured losses it was calculated that ni-trate losses accounted for 11 and 8% (year I and II)of total N inputs (fertilizers, manure, atmospheric de-position, legumes fixation).
3.3.2. Herbicide concentrationOver the entire period of the experiment herbicide
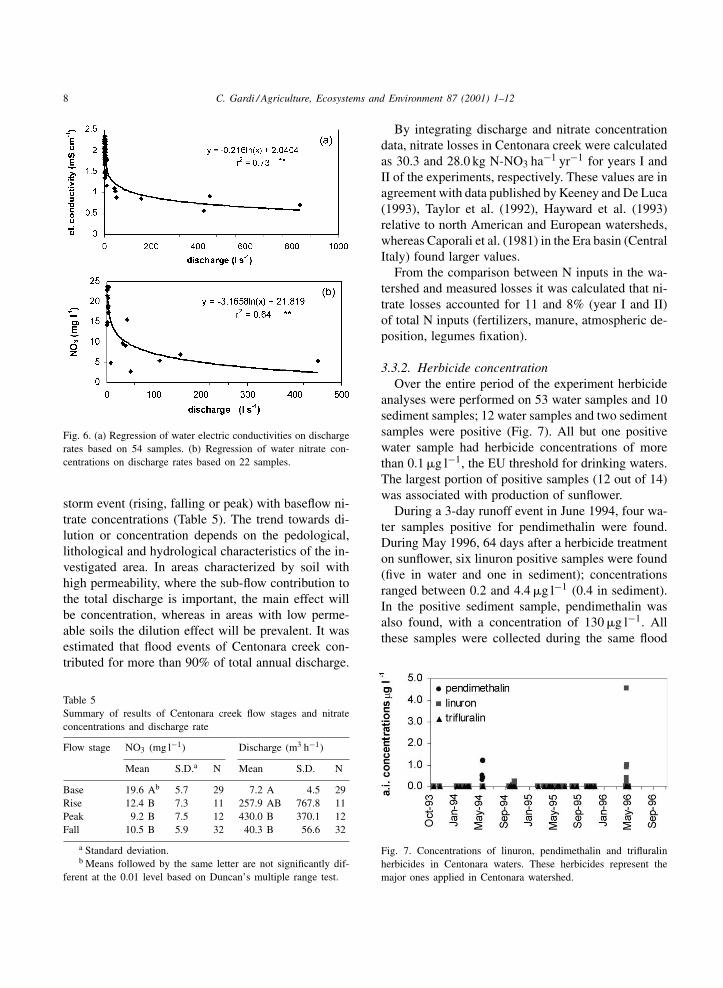
analyses were performed on 53 water samples and 10sediment samples; 12 water samples and two sedimentsamples were positive (Fig. 7). All but one positivewater sample had herbicide concentrations of morethan 0.1 �g l−1, the EU threshold for drinking waters.The largest portion of positive samples (12 out of 14)was associated with production of sunflower.
During a 3-day runoff event in June 1994, four wa-ter samples positive for pendimethalin were found.During May 1996, 64 days after a herbicide treatmenton sunflower, six linuron positive samples were found(five in water and one in sediment); concentrationsranged between 0.2 and 4.4 �g l−1 (0.4 in sediment).In the positive sediment sample, pendimethalin wasalso found, with a concentration of 130 �g l−1. Allthese samples were collected during the same flood
Fig. 7. Concentrations of linuron, pendimethalin and trifluralinherbicides in Centonara waters. These herbicides represent themajor ones applied in Centonara watershed.
C. Gardi / Agriculture, Ecosystems and Environment 87 (2001) 1–12 9
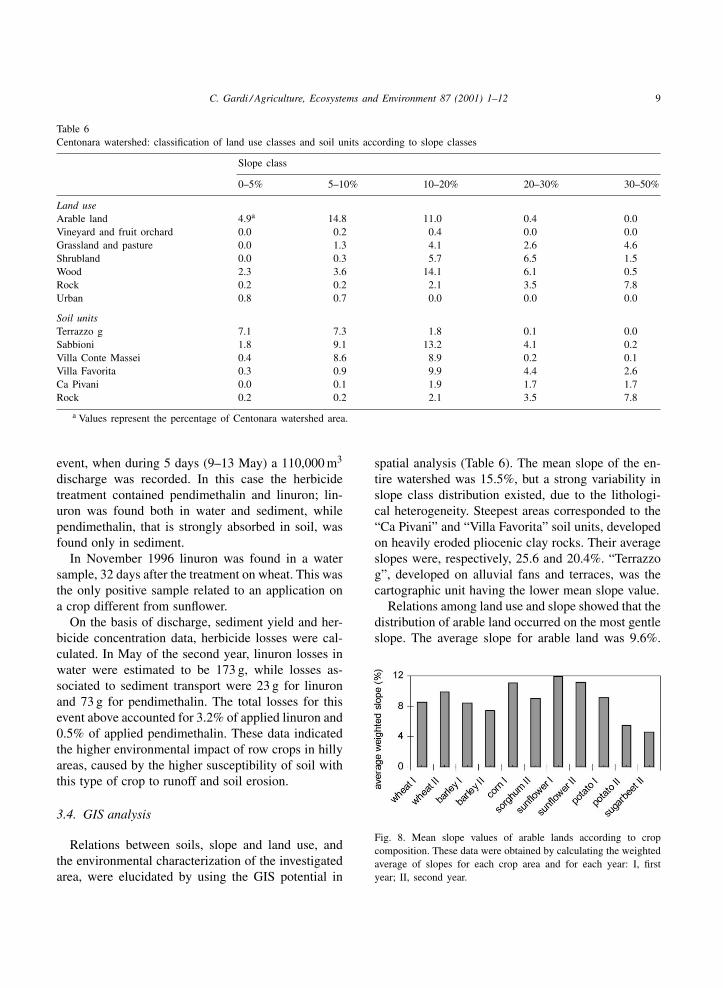
Table 6Centonara watershed: classification of land use classes and soil units according to slope classes
Slope class
0–5% 5–10% 10–20% 20–30% 30–50%
Land useArable land 4.9a 14.8 11.0 0.4 0.0Vineyard and fruit orchard 0.0 0.2 0.4 0.0 0.0Grassland and pasture 0.0 1.3 4.1 2.6 4.6Shrubland 0.0 0.3 5.7 6.5 1.5Wood 2.3 3.6 14.1 6.1 0.5Rock 0.2 0.2 2.1 3.5 7.8Urban 0.8 0.7 0.0 0.0 0.0
Soil unitsTerrazzo g 7.1 7.3 1.8 0.1 0.0Sabbioni 1.8 9.1 13.2 4.1 0.2Villa Conte Massei 0.4 8.6 8.9 0.2 0.1Villa Favorita 0.3 0.9 9.9 4.4 2.6Ca Pivani 0.0 0.1 1.9 1.7 1.7Rock 0.2 0.2 2.1 3.5 7.8
a Values represent the percentage of Centonara watershed area.
event, when during 5 days (9–13 May) a 110,000 m3
discharge was recorded. In this case the herbicidetreatment contained pendimethalin and linuron; lin-uron was found both in water and sediment, whilependimethalin, that is strongly absorbed in soil, wasfound only in sediment.
In November 1996 linuron was found in a watersample, 32 days after the treatment on wheat. This wasthe only positive sample related to an application ona crop different from sunflower.
On the basis of discharge, sediment yield and her-bicide concentration data, herbicide losses were cal-culated. In May of the second year, linuron losses inwater were estimated to be 173 g, while losses as-sociated to sediment transport were 23 g for linuronand 73 g for pendimethalin. The total losses for thisevent above accounted for 3.2% of applied linuron and0.5% of applied pendimethalin. These data indicatedthe higher environmental impact of row crops in hillyareas, caused by the higher susceptibility of soil withthis type of crop to runoff and soil erosion.
3.4. GIS analysis
Relations between soils, slope and land use, andthe environmental characterization of the investigatedarea, were elucidated by using the GIS potential in
spatial analysis (Table 6). The mean slope of the en-tire watershed was 15.5%, but a strong variability inslope class distribution existed, due to the lithologi-cal heterogeneity. Steepest areas corresponded to the“Ca Pivani” and “Villa Favorita” soil units, developedon heavily eroded pliocenic clay rocks. Their averageslopes were, respectively, 25.6 and 20.4%. “Terrazzog”, developed on alluvial fans and terraces, was thecartographic unit having the lower mean slope value.
Relations among land use and slope showed that thedistribution of arable land occurred on the most gentleslope. The average slope for arable land was 9.6%.
Fig. 8. Mean slope values of arable lands according to cropcomposition. These data were obtained by calculating the weightedaverage of slopes for each crop area and for each year: I, firstyear; II, second year.
10 C. Gardi / Agriculture, Ecosystems and Environment 87 (2001) 1–12
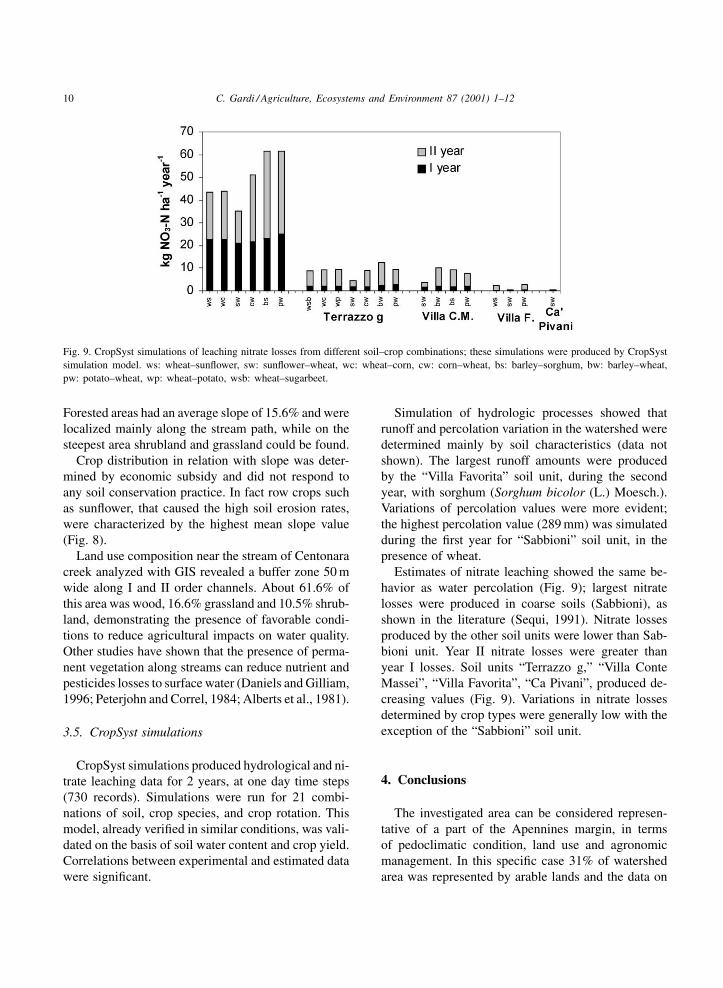
Fig. 9. CropSyst simulations of leaching nitrate losses from different soil–crop combinations; these simulations were produced by CropSystsimulation model. ws: wheat–sunflower, sw: sunflower–wheat, wc: wheat–corn, cw: corn–wheat, bs: barley–sorghum, bw: barley–wheat,pw: potato–wheat, wp: wheat–potato, wsb: wheat–sugarbeet.
Forested areas had an average slope of 15.6% and werelocalized mainly along the stream path, while on thesteepest area shrubland and grassland could be found.
Crop distribution in relation with slope was deter-mined by economic subsidy and did not respond toany soil conservation practice. In fact row crops suchas sunflower, that caused the high soil erosion rates,were characterized by the highest mean slope value(Fig. 8).
Land use composition near the stream of Centonaracreek analyzed with GIS revealed a buffer zone 50 mwide along I and II order channels. About 61.6% ofthis area was wood, 16.6% grassland and 10.5% shrub-land, demonstrating the presence of favorable condi-tions to reduce agricultural impacts on water quality.Other studies have shown that the presence of perma-nent vegetation along streams can reduce nutrient andpesticides losses to surface water (Daniels and Gilliam,1996; Peterjohn and Correl, 1984; Alberts et al., 1981).
3.5. CropSyst simulations
CropSyst simulations produced hydrological and ni-trate leaching data for 2 years, at one day time steps(730 records). Simulations were run for 21 combi-nations of soil, crop species, and crop rotation. Thismodel, already verified in similar conditions, was vali-dated on the basis of soil water content and crop yield.Correlations between experimental and estimated datawere significant.
Simulation of hydrologic processes showed thatrunoff and percolation variation in the watershed weredetermined mainly by soil characteristics (data notshown). The largest runoff amounts were producedby the “Villa Favorita” soil unit, during the secondyear, with sorghum (Sorghum bicolor (L.) Moesch.).Variations of percolation values were more evident;the highest percolation value (289 mm) was simulatedduring the first year for “Sabbioni” soil unit, in thepresence of wheat.
Estimates of nitrate leaching showed the same be-havior as water percolation (Fig. 9); largest nitratelosses were produced in coarse soils (Sabbioni), asshown in the literature (Sequi, 1991). Nitrate lossesproduced by the other soil units were lower than Sab-bioni unit. Year II nitrate losses were greater thanyear I losses. Soil units “Terrazzo g,” “Villa ConteMassei”, “Villa Favorita”, “Ca Pivani”, produced de-creasing values (Fig. 9). Variations in nitrate lossesdetermined by crop types were generally low with theexception of the “Sabbioni” soil unit.
4. Conclusions
The investigated area can be considered represen-tative of a part of the Apennines margin, in termsof pedoclimatic condition, land use and agronomicmanagement. In this specific case 31% of watershedarea was represented by arable lands and the data on
C. Gardi / Agriculture, Ecosystems and Environment 87 (2001) 1–12 11
water quality showed that the nitrate threshold fixed byEU for drinking water was never exceeded. From theavailable data, any relation between nitrate concen-tration and agronomic practices could not be found.
The estimated analysis of N inputs in the watershedrevealed the important contribution of wet and dryatmospheric deposition of NO3 and NH4 (Mosello andMarchetto, 1996). In the Centonara watershed, whereonly a portion of the area was subjected to fertilization,the atmospheric depositions represented 30% of totalN inputs. Statistical analyses on NO3 concentrationdata showed a significant dilution trend in Centonarawatershed.
Herbicides concentration exceeded the EU fixedthreshold in all positive water samples, associatedwith large rainfall events that occurred within 2months after herbicide application. However, the dif-ferentiation in crops and agronomic management andthe presence of permanent vegetation along I and IIorder streams probably reduced herbicide concentra-tions in water. The results of this study showed thenegative impact of row crops on water quality: 80%of herbicides positive samples derive from pesticidesapplication on these crops.
The combined application of GIS and crop simu-lation model showed where agricultural activity canproduce most severe environmental impacts. Accord-ing to crop model simulations, nitrate leaching from“Sabbioni” soil unit (33% of arable land) correspondedto 73% of total arable land nitrate losses.
Acknowledgements
The author expresses his gratitude to Dr. ElenaMaestri for comment and suggestions and to the Ciba,Basel, Suisse, for their financial support.
References
AA.VV., 1997. Eutrofizzazione del mare Adriatico: stato evolutivoe provvedimenti per la riduzione dei carichi inquinanti — lineestrategiche d’intervento. Internal Report. Autorità di bacino delFiume Po, Parma.
Alberts, E.E., Neibling, W.H., Moldenhauer, W.C., 1981. Transportof sediment nitrogen and phosphorus in runoff through cornstalkresidue strips. Soil Sci. Soc. Am. J. 45, 1177–1184.
Bowman, B.T., Wall, G.J., King, D.J., 1994. Transport of herbicidesand nutrients in surface runoff from corn cropland in southernOntario. Can. J. Soil Sci. 74, 59–66.
Braden, J.B., Uchtmann, D.L., 1985. Agricultural nonpointpollution control: an assessment. J. Soil Water Conserv. 40,23–26.
Brady, N.C., Weil, R.R., 1996. The Nature and Properties of Soils.Prentice-Hall, Upper Saddle River, NJ.
Burwell, R.E., Timmons, D.R., Holt, R.F., 1975. Nutrient transportin surface runoff as influenced by soil cover and seasonalperiod. Soil Sci. Soc. Am. Proc. 39, 523–528.
Caporali, F., Nannipieri, P., Pedrazzini, F., 1981. Nitrogen contentsof streams draining an agricultural and a forested watershed inCentral Italy. J. Environ. Qual. 10, 72–76.
Daniels, R.B., Gilliam, J.W., 1996. Sediment and chemical loadreduction by grass and riparian filters. Soil Sci. Soc. Am. J.60, 246–251.
De Martonne, E., 1926. Une nouvelle fonction climatologique:l’indice d’aridité. La Meteorologie 2, 449–459.
Domagalski, J.L., 1995. Nonpoint sources of pesticides in the SanJoaquin River, California: input from winter storms, 1992–1993.US Geological Survey, Open-file Report, 95-165. Sacramento,CA.
Donatelli, M., Stockle, C.O., Ceotto, E., Rinaldi, M., 1997.CropSyst validation for cropping systems at two locations ofnorthern and southern Italy. Eur. J. Agron. 1–2, 35–45.
Gardi, C., 1998. Influenza della gestione agronomica delle coltureerbacee sulla qualità delle acque in un bacino pedecollinare.Ph.D. Thesis. Dipartimento di Agronomia, Università degliStudi di Bologna.
Glotfelty, D.E., Taylor, A.W., Isensee, A.R., Jersey, J., Glenn, S.,1984. Atrazine and simazine movement to Wye River Estuary.J. Environ. Qual. 13, 115–121.
Hayward, J., Foy, R.H., Gibson, C.E., 1993. Nitrogen andphosphorus budgets in the Erne system, 1974–1989. In:Proceedings of the Royal Irish Academy on Biology andEnvironment, Section B, Vol. 93, pp. 34–44.
Hubbard, R.K., Sheridan, J.M., 1983. Water and nitrate-nitrogenlosses from a small, Upland, Costal plain watershed. J. Environ.Qual. 12, 291–295.
Jawson, M.D., Elliot, L.F., Saxton, K.E., Fortier, D.H., 1982. Theeffect of cattle grazing on nutrient losses in a pacific northwestsetting. J. Environ. Qual. 11, 628–631.
Keeney, D.R., De Luca, T.H., 1993. Des Moines River nitrate inrelation to watershed agricultural practices: 1945 versus 1980.J. Environ. Qual. 22, 267–272.
Koppen, W., Geiger, R., 1936. Handbuch der Klimatologie, Bd 1.Teil C, Berlin.
Mosello, R., Marchetto, A., 1996. Chemistry of atmospheric wetdeposition in Italy: results from a five-year study. Ambio 25,21–25.
Osborne, L.L., Wiley, M.J., 1988. Empirical relationships betweenland use/cover and stream water quality in an agriculturalwatershed. J. Environ. Mgmt. 26, 9–27.
Owens, L.B., 1994. Impacts of N management on water quality.In: Soil Process and Water Quality (Advances in Soil Sciences).Lewis Publishers, Boca Raton, FL, pp. 137–162.
12 C. Gardi / Agriculture, Ecosystems and Environment 87 (2001) 1–12
Pasti, C., Montagner, O., Furlan, L., 1995. Giudizio positivo sulleacque di scolo agricole. L’Informatore Agrario 19, 37–46.
Peterjohn, W.T., Correl, D.L., 1984. Nutrient dynamics in anagricultural watershed: observations on the role of a riparianforest. Ecology 65, 1466–1475.
Pionke, H.B., Urban, J.B., Gburek, W.J., Rogowski, A.S., Schnabel,R.R., 1991. Sampling groundwater in a northeastern USwatershed. Water Res. 23, 1034–1037.
Rossi Pisa, P., Vicari, A., Gardi, C., Catizone, P., 1996. Ilbacino idrografico come unità di indagine territoriale. Rivistadi Agronomia 3, 401–407.
Schnabel, R.R., Urban, J.B., Gburek, W.J., 1993. Hydrologiccontrols in nitrate, sulphate, and chloride concentrations. J.Environ. Qual. 22, 589–596.
SCS-USDA, 1972. National Engineering Handbook, Section 4,Hydrology. SCS-USDA, Washington, DC.
Sequi, P., 1991. Il ciclo dell’azoto nei suoli naturali e coltivati. In:Azoto Agricoltura Ambiente. Federchimica, Bologna.
SISS, 1985. Metodi normalizzati di analisi del suolo. In: SocietàItaliana della Scienza del Suolo. Edagricole, Bologna.
Smith, S.J., Schepers, J.S., Porter, L.K., 1990. Assessing andmanaging agricultural nitrogen losses to the environment. In:Stewart, B.A. (Ed.), Advances in Soil Science. Springer, NewYork, pp. 1–43.
Soileau, J.M., Touchton, J.T., Hajek, B.F., Yoo, K.H., 1994.Sediment, nitrogen and phosphorus runoff with conventional-and conservation-tillage cotton in a small watershed. J. SoilWater Conserv. 49, 82–89.
Soil Survey Staff, 1990. Keys to Soil Taxonomy. SMSS TechnicalMonograph n. 19, Virginia Polytechnic Institute and StateUniversity.
SPSS, 1993. SPSS for Windows. Base System User’s Guide,Release 6.0. SPSS, Inc., Chicago, IL.
Steenvoorden, J.H.A.M., Fonck, H., Oosteron, H.P., 1986. Lossesof nitrogen from intensive grassland systems by leaching andsurface runoff. In: van der Meer, H.G., Ryden, J.C., Ennik,G.C. (Eds.), Nitrogen Fluxes in Intensive Grassland Systems.Martinus Nijhoff, Dordrecht, pp. 85–97.
Stockle, C.O., 1994. GIS and Simulation Technologies forAssessing Cropping Systems Management in Dry Environ-ments. World Wide Web Publication, Department of BiologicalSystems Engineering, Washington State University, Pullman,WA.
Stockle, C.O., Nelson, R., 1992. CropSyst User’s Manual.Department of Biological Systems Engineering, WashingtonState University, Pullman, WA.
Taylor, R., Bogacka, T., Zelechowska, A., 1992. Nitrogen leachingfrom the north Poland river watersheds. In: Proceedings ofthe Nitrogen and Agriculture International Workshop, Vol. 1,pp. 114–119.
Ugolini, F.C., Spaltenstein, H., 1992. Pedosphere. In: GlobalBiogeochemical Cycles. Academic Press, London.
van Burg, P.F.J., 1986. The status of agriculture in westernEurope and some implication for the consumption of nitrogen,pp. 1–27. The World Fertilizer Conference, Amsterdam, April20–30.