land and soil degradation - plant … · web viewthe severity of soil degradation, rate of soil...
TRANSCRIPT
Chapter 6: Soil Degradation
Gerry Garland, Timm Hoffman & Simon Todd
6.1 Soil Degradation in South Africa: an Overview
6.1.1 Is Soil Degradation Important?
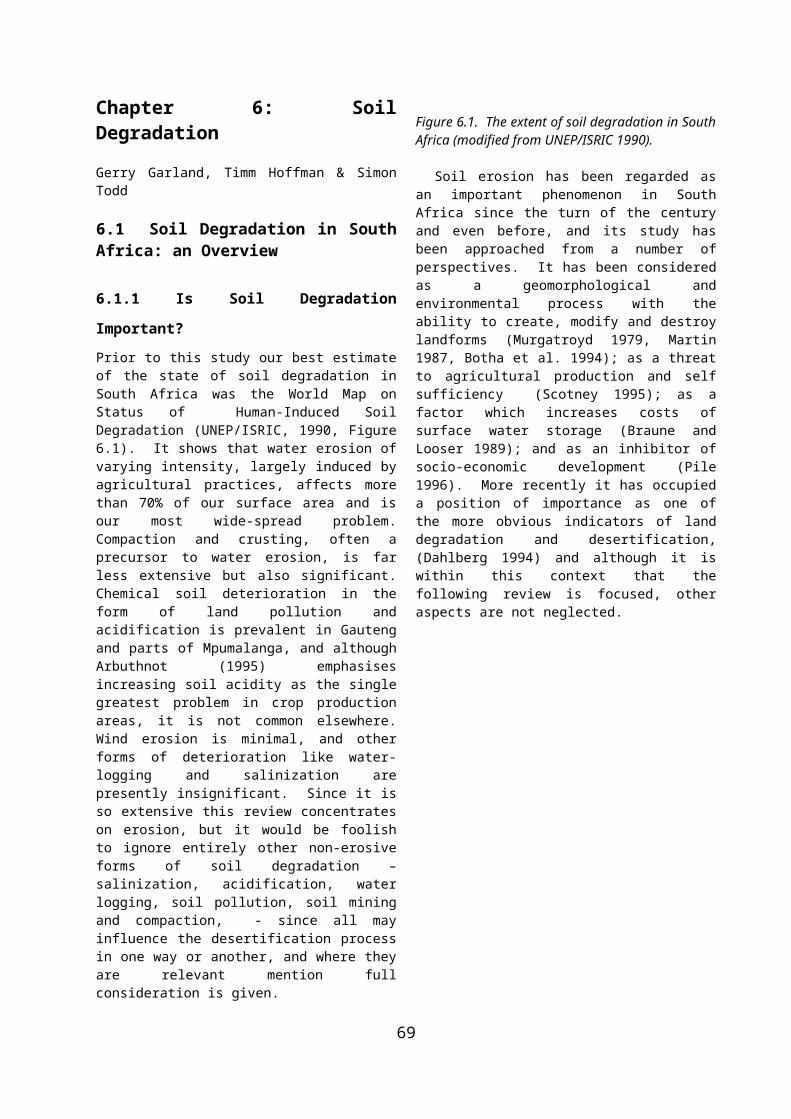
Prior to this study our best estimate of the state of soil degradation in South Africa was the World Map on Status of Human-Induced Soil Degradation (UNEP/ISRIC, 1990, Figure 6.1). It shows that water erosion of varying intensity, largely induced by agricultural practices, affects more than 70% of our surface area and is our most wide-spread problem. Compaction and crusting, often a precursor to water erosion, is far less extensive but also significant. Chemical soil deterioration in the form of land pollution and acidification is prevalent in Gauteng and parts of Mpumalanga, and although Arbuthnot (1995) emphasises increasing soil acidity as the single greatest problem in crop production areas, it is not common elsewhere. Wind erosion is minimal, and other forms of deterioration like water-logging and salinization are presently insignificant. Since it is so extensive this review concentrates on erosion, but it would be foolish to ignore entirely other non-erosive forms of soil degradation – salinization, acidification, water logging, soil pollution, soil mining and compaction, - since all may influence the desertification process in one way or another, and where they are relevant mention full consideration is given.
Figure 6.1. The extent of soil degradation in South Africa (modified from UNEP/ISRIC 1990).
Soil erosion has been regarded as an important phenomenon in South Africa since the turn of the century and even before, and its study has been approached from a number of perspectives. It has been considered as a geomorphological and environmental process with the ability to create, modify and destroy landforms (Murgatroyd 1979, Martin 1987, Botha et al. 1994); as a threat to agricultural production and self
sufficiency (Scotney 1995); as a factor which increases costs of surface water storage (Braune and Looser 1989); and as an inhibitor of socio-economic development (Pile 1996). More recently it has occupied a position of importance as one of the more obvious indicators of land degradation and desertification, (Dahlberg 1994) and although it is within this context that the following review is focused, other aspects are not neglected.
Whether degradation of soil is important or not is a matter of debate and perspective rather than fact. Simon (1981 p81, in Blaikie 1985) claimed that “Of course arable land in some places is going out of cultivation because of erosion and other destructive forces. But taken as a whole, the amount of arable land in the world is increasing year by year.” The point is well taken, but within national boundaries soil and land are finite resources and irreplaceable in the short to medium term. Any reduction in their quantity or quality inevitably means that the reserves become depleted, in much the same way as happens with fossil fuels and other minerals. Continued long term exploitation without replacement is not sustainable. This is well recognised in South Africa, and although agricultural production in the country has increased almost 200% in the last 20 years (Cooper 1996) any perusal of popular local literature will uncover powerful, apocalyptic and often misguided statements on erosion. General Smuts in 1936 noted that “….erosion is the biggest problem confronting the country, bigger than any politics.” (in: Beinart 1984 p68). Jacks (1939) claimed that “…..soil erosion strikes at the very roots of South Africa’s existence, and is the most urgent problem facing the country at the present time.” During 1966 a headline in the “Star” newspaper propounded the view that “Erosion threatens the very future of SA”. The same article went on to say that “soil erosion and veld deterioration are insidious evils creeping in unseen like a thief at night and robbing us of our national wealth” (The Star, 1966, p8). Uncritical acceptance of such statements can lead to only one conclusion, that soil erosion is very important indeed.
Nevertheless, although rates of national and continental soil erosion are virtually impossible to measure accurately, and notoriously difficult even to estimate, scientific assessments suggest that the situation may not be quite as severe as indicated in popular literature. Notwithstanding Annandale’s (1998) comments on the poor accuracy of mean annual sediment yield assessment techniques (see later), the most quoted South African estimates - Midgley’s (1952) figure of 363 million tonnes (3t ha-1yr-1), Schwartz and Pullen’s (1966) value of 233 million tonnes (1,9t ha-1 yr-1) and Rooseboom’s 1976 estimate of 100-150 million tonnes (0,82-1,22t ha-1 yr-1) are based on the sediment yield of main rivers. Other published values, such as the 500 million tonnes (4,1t ha-1 yr-1) annually suggested by Van Rensburg (1992) and the 400 million tonnes (3,3t ha-1 yr-1) by Huntley et al. (1989) are less reliable in that the authors fail to explain clearly the basis of calculation.
69
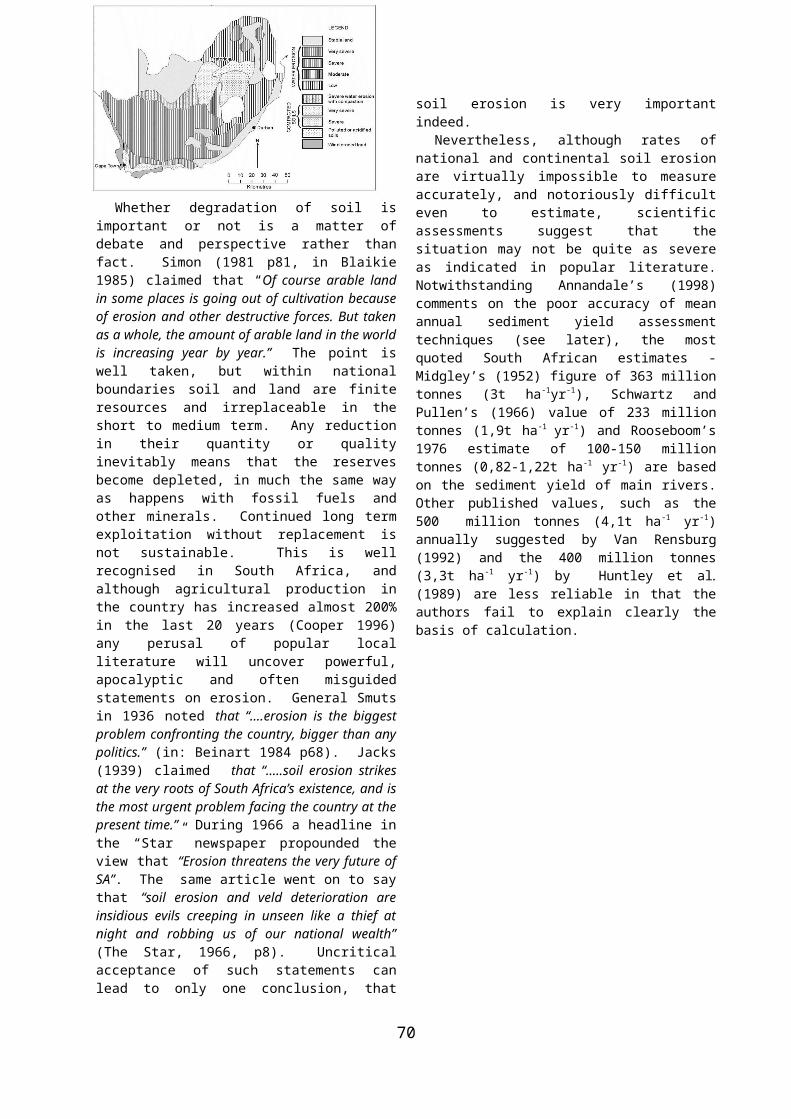
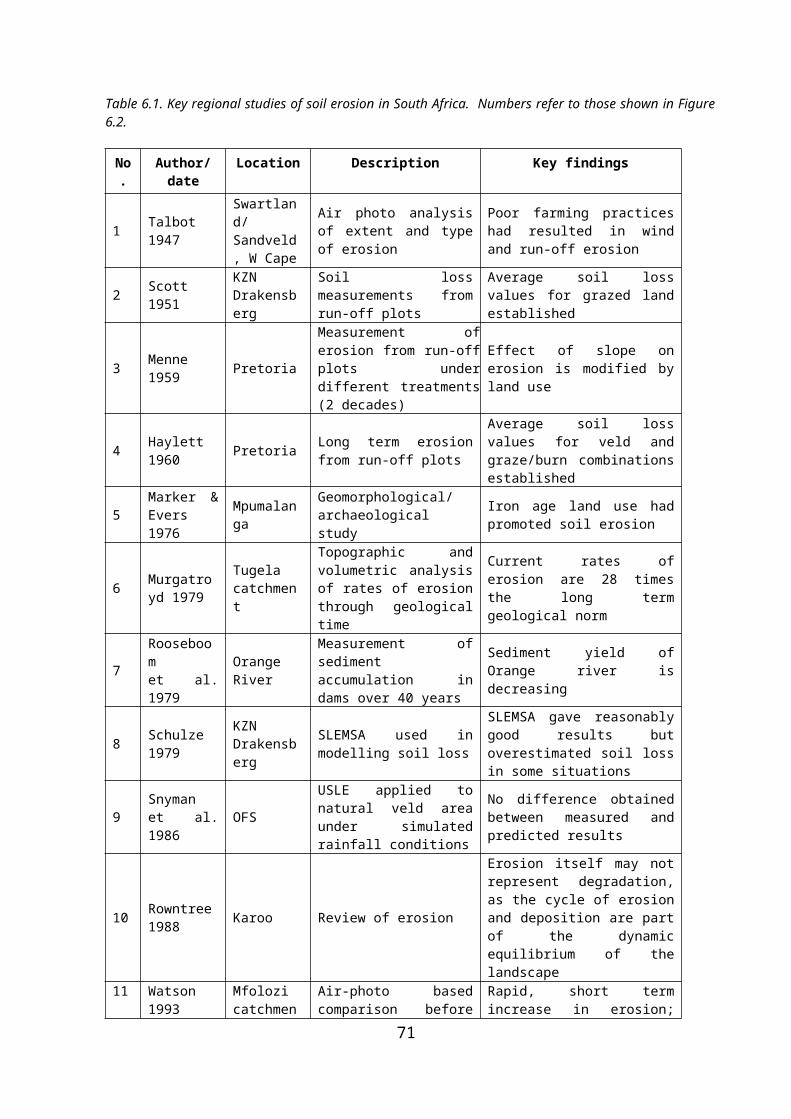
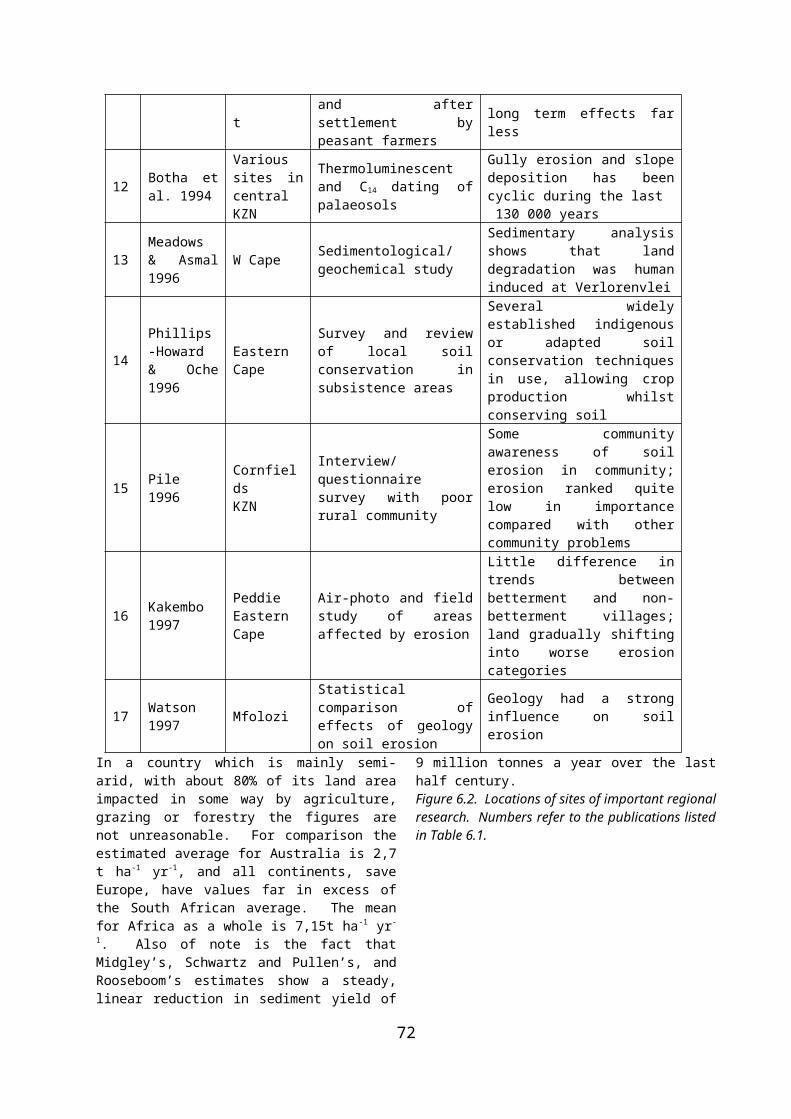
Table 6.1. Key regional studies of soil erosion in South Africa. Numbers refer to those shown in Figure 6.2.
No. Author/date Location Description Key findings
1 Talbot 1947Swartland/ Sandveld, W Cape
Air photo analysis of extent and type of erosion
Poor farming practices had resulted in wind and run-off erosion
2 Scott 1951 KZN Drakensberg
Soil loss measurements from run-off plots
Average soil loss values for grazed land established
3 Menne 1959 PretoriaMeasurement of erosion from run-off plots under different treatments (2 decades)
Effect of slope on erosion is modified by land use
4 Haylett 1960 Pretoria Long term erosion from run-off plots
Average soil loss values for veld and graze/burn combinations established
5 Marker & Evers 1976 Mpumalanga Geomorphological/
archaeological studyIron age land use had promoted soil erosion
6 Murgatroyd 1979
Tugela catchment
Topographic and volumetric analysis of rates of erosion through geological time
Current rates of erosion are 28 times the long term geological norm
7 Rooseboomet al. 1979
Orange River
Measurement of sediment accumulation in dams over 40 years
Sediment yield of Orange river is decreasing
8 Schulze 1979
KZN Drakensberg
SLEMSA used in modelling soil loss
SLEMSA gave reasonably good results but overestimated soil loss in some situations
9 Snyman et al. 1986 OFS
USLE applied to natural veld area under simulated rainfall conditions
No difference obtained between measured and predicted results
10 Rowntree 1988 Karoo Review of erosion
Erosion itself may not represent degradation, as the cycle of erosion and deposition are part of the dynamic equilibrium of the landscape
11 Watson 1993
Mfolozi catchment
Air-photo based comparison before and after settlement by peasant farmers
Rapid, short term increase in erosion; long term effects far less
12 Botha et al. 1994
Various sites in central KZN
Thermoluminescent and C14
dating of palaeosols
Gully erosion and slope deposition has been cyclic during the last 130 000 years
13 Meadows & Asmal 1996 W Cape Sedimentological/
geochemical study
Sedimentary analysis shows that land degradation was human induced at Verlorenvlei
14Phillips-Howard & Oche 1996
Eastern Cape
Survey and review of local soil conservation in subsistence areas
Several widely established indigenous or adapted soil conservation techniques in use, allowing crop production whilst conserving soil
15 Pile 1996 CornfieldsKZN
Interview/questionnaire survey with poor rural community
Some community awareness of soil erosion in community; erosion ranked quite low in importance compared with other community problems
16 Kakembo 1997
Peddie Eastern Cape
Air-photo and field study of areas affected by erosion
Little difference in trends between betterment and non-betterment villages; land gradually shifting into worse erosion categories
17 Watson 1997 Mfolozi
Statistical comparison of effects of geology on soil erosion
Geology had a strong influence on soil erosion
70
In a country which is mainly semi-arid, with about 80% of its land area impacted in some way by agriculture, grazing or forestry the figures are not unreasonable. For comparison the estimated average for Australia is 2,7 t ha-
1 yr-1, and all continents, save Europe, have values far in excess of the South African average. The mean for Africa as a whole is 7,15t ha-1 yr-1. Also of note is the fact that Midgley’s, Schwartz and Pullen’s, and Rooseboom’s estimates show a steady, linear reduction in sediment yield of 9 million tonnes a year over the last half century.Figure 6.2. Locations of sites of important regional research. Numbers refer to the publications listed in Table 6.1.
None of the sediment yield values can be verified against independent data, but whatever their accuracy, they can only account for the total sediment quantity, including river bank and bed material, transported through fluvial systems. Material eroded and redeposited within catchment boundaries, but not transported by rivers, is excluded, and indications are that differences between sediment yield and soil loss figures could be very high indeed. Measurements by Scott and Schulze (1991) and Scott and Van Wyk (1992) for example suggest that "at a site" soil loss within a catchment could be up to 5 times greater than sediment yield from the same catchment over the same period. Soil loss and sediment yield values are clearly not comparable, although they probably bear a stable relationship to each other.
The foregoing implies that in terms of simple soil loss per unit area, erosion in South Africa may not be as important as many would have us believe. Yet there are other ways of viewing it. For example, Huntley et al. (1989) claim that soil is currently being eroded at a rate about 30 times greater than new soil is formed. Global indications of the economic costs of land degradation are gradually being backed up by South African evidence (see later) to confirm that there are strong, long term financial incentives for conserving soil and preventing degradation.
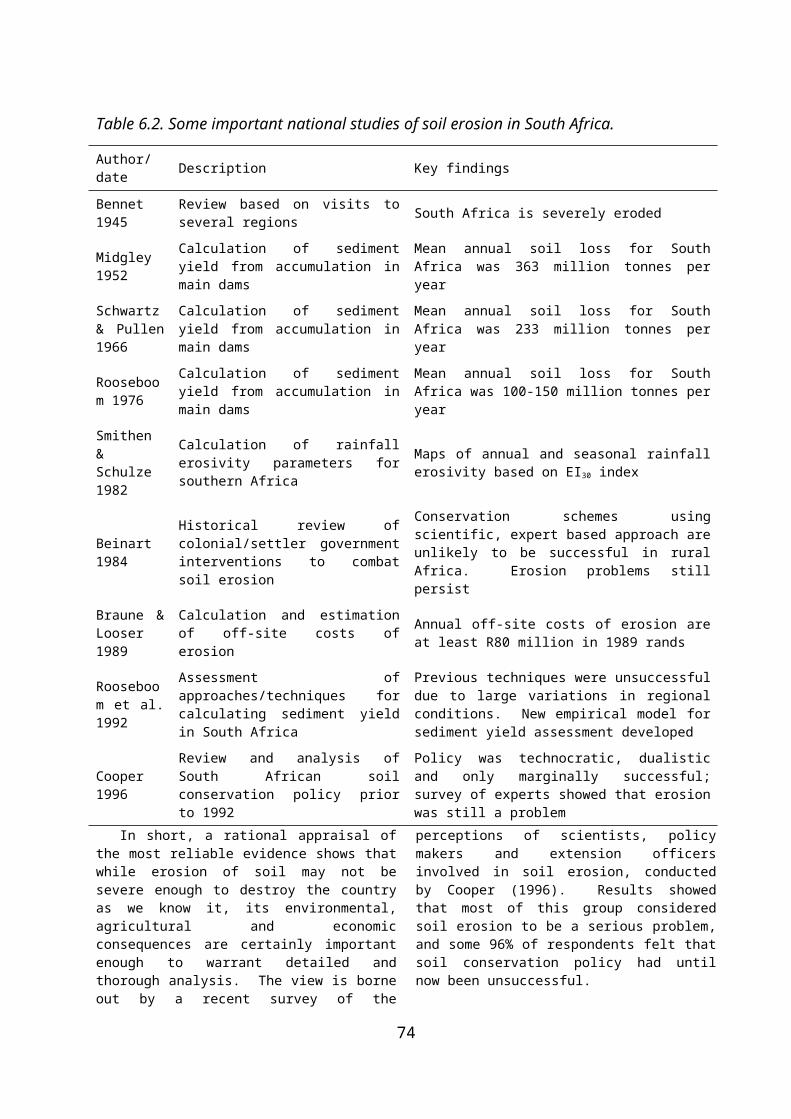
Table 6.2. Some important national studies of soil erosion in South Africa.
Author/date Description Key findings
Bennet 1945 Review based on visits to several regions South Africa is severely eroded
Midgley 1952
Calculation of sediment yield from accumulation in main dams
Mean annual soil loss for South Africa was 363 million tonnes per year
Schwartz & Pullen 1966
Calculation of sediment yield from accumulation in main dams
Mean annual soil loss for South Africa was 233 million tonnes per year
Rooseboom 1976
Calculation of sediment yield from accumulation in main dams
Mean annual soil loss for South Africa was 100-150 million tonnes per year
Smithen & Schulze 1982
Calculation of rainfall erosivity parameters for southern Africa
Maps of annual and seasonal rainfall erosivity based on EI30 index
71
Beinart 1984
Historical review of colonial/settler government interventions to combat soil erosion
Conservation schemes using scientific, expert based approach are unlikely to be successful in rural Africa. Erosion problems still persist
Braune & Looser 1989
Calculation and estimation of off-site costs of erosion
Annual off-site costs of erosion are at least R80 million in 1989 rands
Rooseboom et al. 1992
Assessment of approaches/techniques for calculating sediment yield in South Africa
Previous techniques were unsuccessful due to large variations in regional conditions. New empirical model for sediment yield assessment developed
Cooper 1996
Review and analysis of South African soil conservation policy prior to 1992
Policy was technocratic, dualistic and only marginally successful; survey of experts showed that erosion was still a problem
In short, a rational appraisal of the most reliable evidence shows that while erosion of soil may not be severe enough to destroy the country as we know it, its environmental, agricultural and economic consequences are certainly important enough to warrant detailed and thorough analysis. The view is borne out by a recent survey of the perceptions of scientists, policy makers and extension officers involved in soil erosion, conducted by Cooper (1996). Results showed that most of this group considered soil erosion to be a serious problem, and some 96% of respondents felt that soil conservation policy had until now been unsuccessful.
6.1.2 Soil Degradation as an Agricultural and Development Issue
Until recently attempts to deal with erosion in South Africa followed an identifiable pattern. A perceived agricultural crisis - perhaps a drought, or a report on a chronically eroded area by a colonial or agricultural administrator - stimulated scientific review and research, the results of which were used to develop technical or agronomic solutions, and in some cases to formulate legislation. In this way a significant body of technical knowledge, legislation, policy and government intervention strategies was built up in the years following the turn of the century.
An outgrowth of this was the production of a number of scholarly and scientific reviews of erosion, especially from the end of the 1930’s, under the influence of growing North American and world-wide concern for soil degradation (Table 6.1, Figure 6.2, Table 6.2). They included global surveys in which South Africa received adverse mention (Jacks & Whyte 1939, Bennett 1939), as well as works dealing only with South Africa (Bennett 1945, Ross 1963, Penzhorn 1972, The Ciskei Commission 1980, and others). Typically they were produced by earth or agricultural scientists and administrators. In one way or another all subscribed to the view that South Africa’s soils were sensitive and fragile, that climate and topography predisposed the country to soil erosion, but that by far the most influential factor in land degradation was poor farming and land husbandry by both commercial settler agriculturalists and subsistence farmers. Most also pointed to a powerful causative link between erosion and desertification.
There is no doubt that all such work had a massive influence on public awareness, at least in the more privileged white community. Ross (1967 p19) noted that “Before 1939 these matters [erosion and desiccation] were considered seriously by only a small minority of farmers and a very small percentage of townspeople. By the end of 1945, however, an overwhelming majority of the white population, urban as well as rural, was clamouring for urgent action to be taken to secure the rehabilitation of areas damaged by soil erosion and generally to ensure the conservation and rational utilisation of the agricultural resources of the country.”
It was not until the 1980’s that, in common with global trends and prompted by a slowly changing political climate, attention turned to the socio-economic and political conditions controlling land use. One of the first such studies was Beinart’s (1984) historical analysis of state intervention in attempts to control soil erosion in South Africa, Nyasaland (now Malawi) and Rhodesia (now Zimbabwe and Zambia). His ground breaking work together with growing acceptance of the notion that poor rural communities should be, if not masters of their own conservation destiny, then at least have some influence over it, stimulated research aimed at providing conservation planners and policy makers with a far deeper understanding of the rural socio-economic conditions which form the backdrop of their ministrations. Subsequently, attempts to understand indigenous conservation and soil knowledge (Phillips-Howard & Oche 1996, Critchley & Netshikovhela 1997), perceptions of erosion held by local communities (Brincate & Hanvey 1996, Pile 1996) and policy considerations (Stocking & Garland 1995, Cooper 1996), with a view to their incorporation in soil conservation strategies, have encouraged this shift in emphasis.
As South Africa marches to the new millennium, moves towards land restitution and redistribution gain pace. There is an ever-present need to increase food production in order to maintain agricultural self-sufficiency in the face of a rapidly growing population, and continual loss of agricultural land to other purposes. Continuing technical and social research on soil degradation should be able to build upon the platform of the past to provide a strong knowledge and information
72
base for the development of soil conservation policy in a democratic environment. It will certainly be needed.
6.2 Effects of Soil Degradation
6.2.1 Some General Effects
In general terms the effects of soil degradation are widely quoted in literature, and at worst can, according to some authors (e.g. Hyams 1952) cause the collapse of whole civilisations. At a more mundane level the principle effects are impoverishment of the soil, causing greater susceptibility to droughts and making agricultural production more difficult and expensive; silting of water storage reservoirs such that they become uneconomic to operate; silting of harbours, rivers and estuaries; and the modification of both land- and water-based ecosystems. Some of the results of soil degradation are considered below.
6.2.2 Plant Growth and Biodiversity
Since most forms of soil degradation modify physical and chemical soil characteristics it is reasonable to expect that persistent and long term degradation of most types will affect both the plant species which can survive in an area, and their rate of growth. Thornes (1985) showed that erosion significantly reduced plant growth and successional recovery through losses in nutrients and organic matter, and much foreign work documents declines in crop yield as erosion progresses. In South Africa Scotney (1995) has pointed out that wheat yields in the Western Cape were increased by up to 60% by breaking up surface crusting on soils, but other than this, easily available local data on both agricultural and biodioversity effects seem to be almost non-existent.
6.2.3 Reservoir Siltation, Eutrophication and River Ecosystems
One obvious and well-documented result of erosion is reservoir siltation. Paucity of fresh-water resources means that South Africa has to utilise almost every possible suitable site for dam construction. Many dams are located in catchments, which are eroding rapidly, and they act as traps or sinks for eroded material. Regular reservoir surveys on most large dams show the extent of the problem. In KZN Hazelmere dam has lost more that 25% of its original design capacity since its completion in 1975 (Russow & Garland 1998). Inanda Dam in the early 1990’s was accumulating 3,5 million tonnes of material per year (1,3% of storage capacity) (Department of Water Affairs 1990). Data from other provinces shows similar trends, and this prompted Braune and Looser (1989) to assess the situation nation-wide (Table 6.3).
Eutrophication – the enrichment of water systems and lakes with plant nutrients, often resulting in over-abundant increase in algae or aquatic plants (Bruwer 1979) - often accompanies sedimentation caused by soil erosion. Phosphates from fertilisers as well as some chemicals from informal settlements and urban areas are the main
culprits. A number of South African studies have considered chemical inflows into dams and the situation was summarised by Grobler and Silberbauer (1984), who noted that South Africa had a number of hypertrophic lakes, and management of inflows was therefore critical in maintaining water supply. Detailed studies in several catchments, among them work by Simpson (1991) on some KZN rivers, Chutter (1989) and Chutter and Roussouw (1991) on the much-studied Hartebeesport Dam, make essentially the same points.
Sediment entering stream channels can in extreme cases control primary production and therefore the functioning of river ecosystems. This is the case in the Vaal river, for instance (Chutter 1970), and in an exhaustive review Davies et al. (1993) emphasise the role of eroded sediment in South African river ecosystems.
6.2.4 Effects on Estuaries
South Africa has 343 coastal estuaries (Heydorn 1989) which, unless they are regularly flushed by high dis-charges of tributary rivers or strong tidal currents, are inevitably sites of sediment accumulation. This is a nat-ural process and unless for some reason sedimentation and water quality indicators show an increasing trend in the medium to long term, estuaries tend to maintain a physical and ecological balance. The Department of Environmental Affairs and Tourism (1997) reports that many estuaries located between the Great Fish River (Eastern Cape) and the Mozambique border are in some way degraded through accumulation of catchment-de-rived sediment. The Nahoon and Quinira estuaries near East London are examples of this (Wiseman et al. 1993) and many east coast estuaries have demonstrated long term sediment accumulation trends (Begg 1978, 1984). Literature shows, however, that other estuaries have also been affected by sediment inflows. Barker (1985) and Allanson et al. (1988) ascribed influences in turbid-ity in Swartvlei on the southern Cape coast to inland catchment erosion, and the same conclusion was reached for the Diep River mouth west of George (Grindley & Dudley 1988).
6.2.5 Sustainable Land Use Practices and Food Security
Annually, agriculture loses some 34 thousand ha of land to other kinds of development and to forestry (Arbuthnot 1995). Losses to soil erosion, acidification, salinization and compaction are not documented but must increase this total. Since estimated reserves of land which is potentially arable but as yet not used for this purpose stand at 1,3 million ha (Scotney 1995) it is likely that within about 30 years, losses of arable land will exceed any remaining potential to cultivate new land.
Consideration of this against current population growth rates means that by the year 2050 only about 0,2 ha per capita of arable land will be available. This is far less than accepted international norms, and according to
73
Scotney (1995) will have the effect of reducing South Africa’s chances of ever achieving food security.
Nationally, in the absence of affordable technological developments, which could maintain or enhance production despite land losses, this will certainly affect agricultural sustainability. At the local level, subsistence agriculture can sometimes work out ways of sustaining itself in the face of declining production, providing systems are flexible and there are alternative sources of income to tide communities through bad times. For Africa as a whole this theme is well-addressed by Reij et al. (1996). Commercial agriculture becomes unsustainable when input costs consistently exceed income. A good indicator of this is agricultural debt, which in South Africa reached crisis proportions in the mid-1980’s, causing the Government to provide large subsidies to the commercial farming sector (Cooper 1996). Based on this alone one could argue that South African commercial agriculture is already unsustainable. The question is, how much of this is due to soil degradation? The answer is that we really do not know.
6.2.6 Economic Implications
Perhaps the most telling evidence for the importance of soil degradation is economic. Amelioration of soil
Table 6.3. Regional assessment of loss of water storage capacity in South Africa (from Braune and Looser 1989)
Region Present total storage capacity (Mm3 )
Storage loss1 (Mm3 )
Mean storage loss rate2 (% year –1 )
Western Transvaal 1009 70 0.33Eastern Transvaal 2892 27 0.18Vaal River 8083 400 0.31Orange River 9290 378 0.41Western Cape 2280 69 0.43Eastern Cape 1511 280 0.46Natal 4843 103 0.33Total 29908 1327 0.35
1 Only where resurveys are available.2 Diversion type structures with high sedimentation rates not included in the mean.
acidity, caused by acid rain in Mpumalanga, will cost in the region of R25 million annually, not including losses to livestock, corrosion and veld deterioration (Scotney 1995). Mitchell (1993) used experimental figures from Cedara Agricultural Research Station to show that annual costs accruing from the loss of soil Nitrogen, Phosphorous and Potassium would be counted in billions rather than millions of rands. Later Scotney (1995) supported this contention, estimating national annual losses through erosion of the same nutrients as 30 000 tonnes, 26 400 tonnes and 363 000 tonnes respectively. Replacement costs for these would exceed R1,5 billion rands annually. Staggering though these figures are, Laker (1993) contends that the worst consequence of soil erosion is the selective removal of organic matter and clay minerals, reducing water retention capacity of the soil.
Although almost impossible to value in rands and cents, the main consequence of this is that while rainfall variability certainly exacerbates the problems, many low yields and crop failures are often the result of diminished water storage capacity in the soil. Drought, floods and desertification, frequently blamed for reduced soil productivity, are at least partly related to soil degradation brought about by erosion.
Off-site costs may also be significant. Braune and Looser’s (1989) assessment of costs of sedimentation in reservoirs, sediment deposition on croplands and sediment damage to infrastructure was 90 million rands (equal to about R200 million in 1999 rands). To this may be added the costs dealing with eutrophication in reservoirs. A detailed analysis by Bruwer (1979) showed that whilst it was impossible to calculate costs associated with nutrient
74
and algal removal on a national basis they were certainly considerable.
6.3 Government interventions and societal response
Almost all available documentary evidence makes it clear that previous South African Governments were convinced that soil degradation is a long term problem which must be addressed in some way and that the cur-rent government is of like mind (Association of Soil Conservation Engineering Technology (1996)).
One response to the acceptance of erosion as a problem was a surge of scientific measurement and research from the 1940’s onward. Run-off plot and catchment experimentation became popular, and truly seminal work of the highest quality enhanced scientific understanding of the erosion process and the factors that influence it (see Table 6.1). Another was the promulgation of legislation aimed at controlling soil loss. The Forest and Veld Conservation Act of 1946, the Soil Conservation Act of 1969, and the Conservation of Agricultural Resources Act of 1983 and the Environment Conservation Act of 1989 provided the basis for legal control of soil erosion in white-owned areas. Of these the first, although legally applicable to all land in South Africa, was never applied in black areas, and the others had no legal validity in homelands. In these areas, legislative provision pertaining to soil conservation was under the auspices of the Native Administration Act of 1927, the Bantu Homelands Constitution Act of 1971, legislation formulated by individual homelands governments, and certain proclamations by the State President, the most notable of which were Proclamation 116 of 1949, and the Betterment Areas Proclamation R196 of 1967 (Cooper 1996).
A third response was in the form of government or quasi-government initiatives to enhance awareness and to actively promote soil conservation. Here we may include the creation of organisations such as the National Veld Trust, whose main role was educational, the Southern African Regional Commission for Conservation, and Utilisation of Soil (SARCCUS), created to co-ordinate conservation activities across national and homeland boundaries in southern Africa, as well as the establishment of regional Soil Conservation Committees. Financial support for soil conservation works was also implemented, and by 1990 some 303 million rands had been spent by the government on soil conservation schemes (Scotney & McPhee 1990), mainly in white commercial farming areas.
In black areas Betterment planning was one of the main interventions intended to bring soil erosion under control. Prior to World War II Betterment Schemes consisted mainly of implementing mechanical and engineering solutions to conservation problems. Subsequent to this, they moved towards establishing a completely new settlement pattern in rural areas, moving people, usually against their will, into local
concentrated residential settlements, allowing full time farmers access to economic farming units. Most agree that betterment as a strategy for rural upliftment has failed: “Betterment has thus affected a fundamental transformation of people’s physical, economic and social environment, generally leaving people worse off than before” (de Wet 1990 p.441). Its success in combating erosion is also highly questionable (Whisken 1991; Kakembo 1997). (See photos 6.1-6.3).
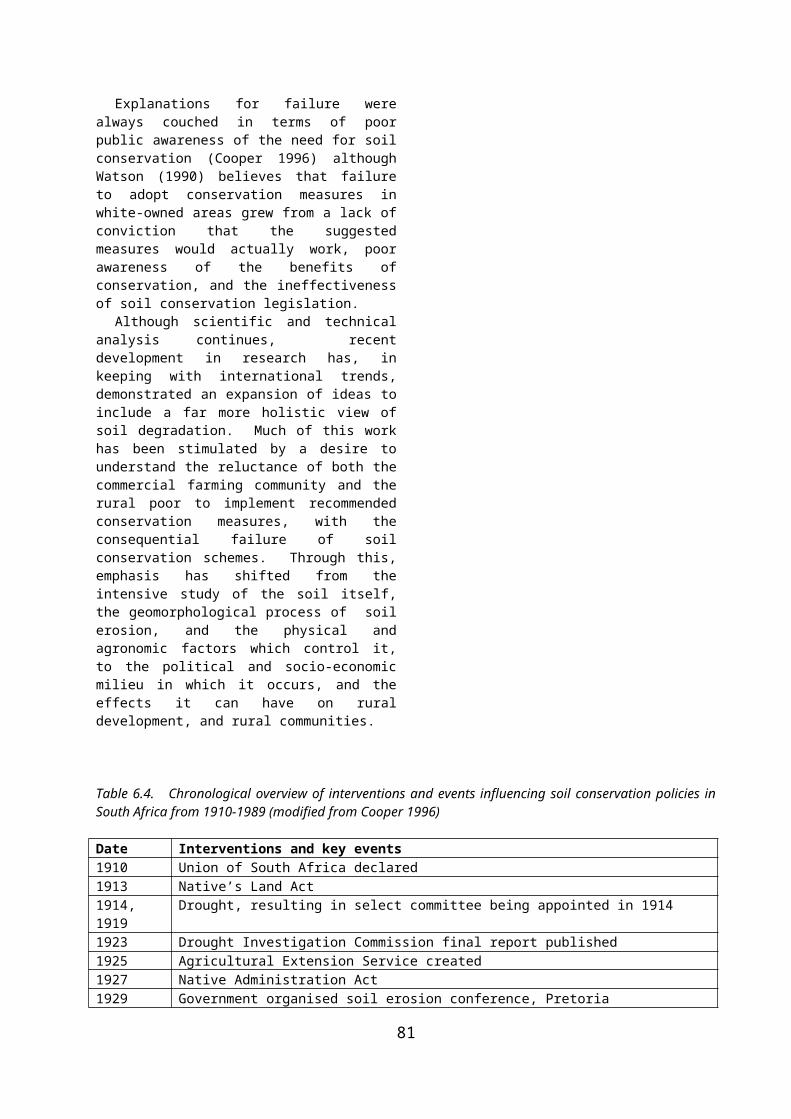
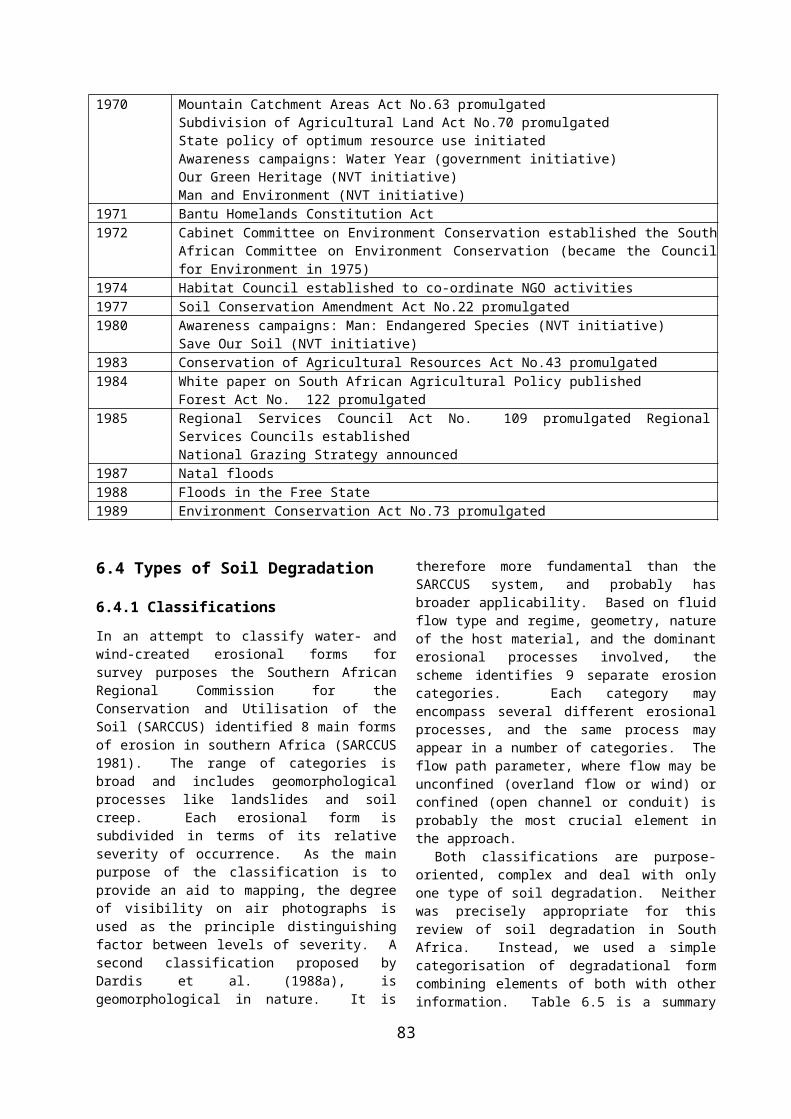
A comprehensive picture of government and other interventions and other relevant events is given in Table 6.4. It paints a picture of undoubted concern, but also one of failure in that as each successive Act of Parliament was perceived to be ineffective, an amendment or a new Act was eventually promulgated to take its place.
75
Explanations for failure were always couched in terms of poor public awareness of the need for soil conservation (Cooper 1996) although Watson (1990) believes that failure to adopt conservation measures in white-owned areas grew from a lack of conviction that the suggested measures would actually work, poor awareness of the benefits of conservation, and the ineffectiveness of soil conservation legislation.
Although scientific and technical analysis continues, recent development in research has, in keeping with international trends, demonstrated an expansion of ideas to include a far more holistic view of soil degradation. Much of this work has been stimulated by a desire to understand the reluctance of both the commercial farming community and the rural poor to implement recommended conservation measures, with the consequential failure of soil conservation schemes. Through this, emphasis has shifted from the intensive study of the soil itself, the geomorphological process of soil erosion, and the physical and agronomic factors which control it, to the political and socio-economic milieu in which it occurs, and the effects it can have on rural development, and rural communities.
Table 6.4. Chronological overview of interventions and events influencing soil conservation policies in South Africa from 1910-1989 (modified from Cooper 1996)
Date Interventions and key events1910 Union of South Africa declared1913 Native’s Land Act1914, 1919 Drought, resulting in select committee being appointed in 19141923 Drought Investigation Commission final report published1925 Agricultural Extension Service created1927 Native Administration Act1929 Government organised soil erosion conference, Pretoria1929-32 Economic depression1930 Soil Erosion Advisory Council established; first financial aid schemes implemented1933 First soil erosion schemes implemented; field surveys and agroeconomic surveys conducted as part
of schemes1933-34 Drought1934 Drakensberg Conservation Area proclaimed1936 Native’s Trust and Land Act1939 Outbreak of World War II1941 Forest and Veld Conservation Act promulgated1943 Departmental Committee for the Reconstruction of Agriculture appointed
National Veld Trust (NVT), an NGO, was establishedSocial and Economic Planning Council appointedLand Bank Act No. 13 promulgated
1945 Tabling in parliament of White Paper on Agricultural Policy NVT Model Bill and Explanatory Memorandum tabled in parliament
1946 Soil Conservation Act No.45 promulgated Division of Soil Conservation and Extension established to administer the Act
1948 Prevailing drought conditionsAppointment of the Desert Encroachment CommitteeFodder Bank Scheme establishedFormation of Southern African Regional Commission for the Conservation and Utilisation of the Soil (SARCCUS)
76
Table 6.4 Continued…1949 Proclamation 1161950’s Green Cross Campaign1956 Commission of Inquiry into European Occupancy of Rural Areas appointed1960-61 Drought peaked
Drought feeding patterns investigation1966 Veld Reclamation Scheme established (concluded 1973)1966 Land Tenure Act No.32 promulgated1967 Soil Conservation Act amended by Act 15 of 1967
Festival of the Soil campaign (government initiative)Environment Planning Act promulgatedBetterment Areas Proclamation R196
1968 Forest Act No.72 promulgatedNational conference involving delegates from Organised Agriculture and other farming bodies
1969 Soil Conservation Act No.76 promulgatedStock Reduction Scheme establishedFirst soil classification scheme (binomial for South Africa) published
1970 Mountain Catchment Areas Act No.63 promulgatedSubdivision of Agricultural Land Act No.70 promulgatedState policy of optimum resource use initiatedAwareness campaigns: Water Year (government initiative)Our Green Heritage (NVT initiative)Man and Environment (NVT initiative)
1971 Bantu Homelands Constitution Act1972 Cabinet Committee on Environment Conservation established the South African Committee on
Environment Conservation (became the Council for Environment in 1975)1974 Habitat Council established to co-ordinate NGO activities1977 Soil Conservation Amendment Act No.22 promulgated1980 Awareness campaigns: Man: Endangered Species (NVT initiative)
Save Our Soil (NVT initiative)1983 Conservation of Agricultural Resources Act No.43 promulgated1984 White paper on South African Agricultural Policy published
Forest Act No. 122 promulgated1985 Regional Services Council Act No. 109 promulgated Regional Services Councils established
National Grazing Strategy announced1987 Natal floods1988 Floods in the Free State1989 Environment Conservation Act No.73 promulgated
6.4 Types of Soil Degradation
6.4.1 ClassificationsIn an attempt to classify water- and wind-created erosional forms for survey purposes the Southern African Regional Commission for the Conservation and Utilisation of the Soil (SARCCUS) identified 8 main forms of erosion in southern Africa (SARCCUS 1981). The range of categories is broad and includes geomorphological processes like landslides and soil creep. Each erosional form is subdivided in terms of its relative severity of occurrence. As the main purpose of the classification is to provide an aid to mapping, the degree of visibility on air photographs is used as the principle distinguishing factor between levels of severity. A second classification proposed by Dardis et al. (1988a), is geomorphological in nature. It is therefore more fundamental than the SARCCUS system, and probably
has broader applicability. Based on fluid flow type and regime, geometry, nature of the host material, and the dominant erosional processes involved, the scheme identifies 9 separate erosion categories. Each category may encompass several different erosional processes, and the same process may appear in a number of categories. The flow path parameter, where flow may be unconfined (overland flow or wind) or confined (open channel or conduit) is probably the most crucial element in the approach.
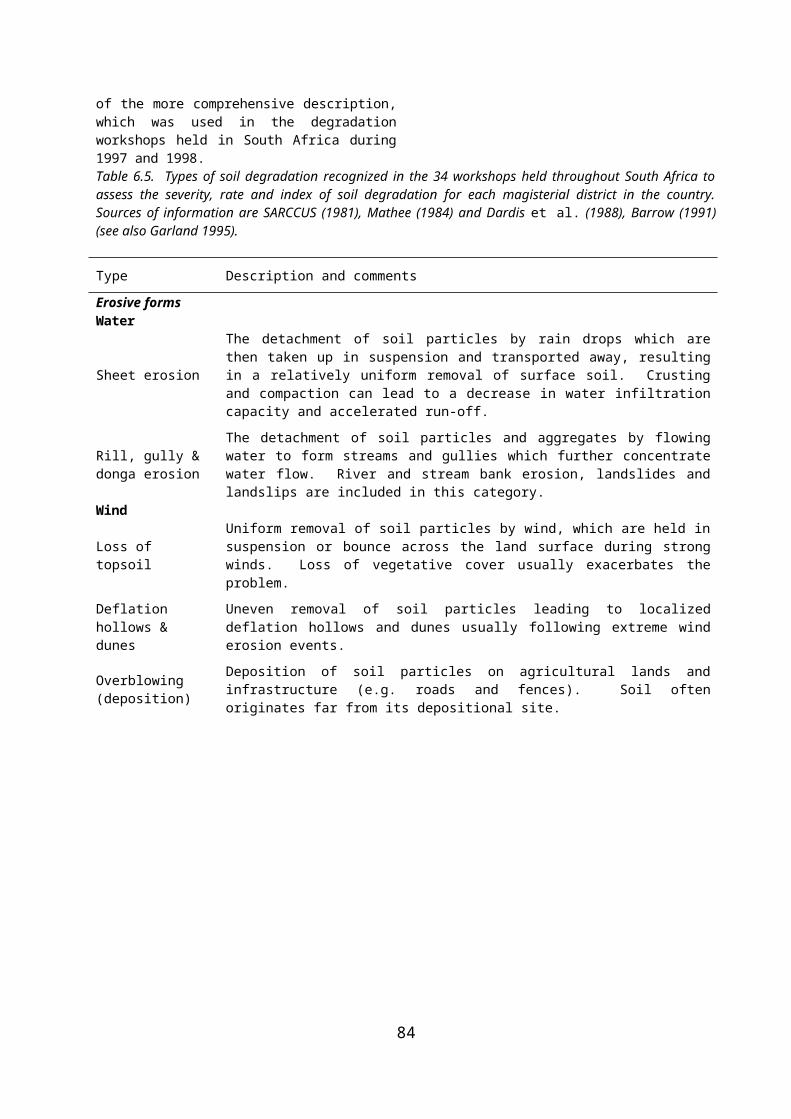
Both classifications are purpose-oriented, complex and deal with only one type of soil degradation. Neither was precisely appropriate for this review of soil degradation in South Africa. Instead, we used a simple categorisation of degradational form combining elements of both with other information. Table 6.5 is a summary of the more comprehensive description, which was used in the degradation workshops held in South Africa during 1997 and 1998.
77
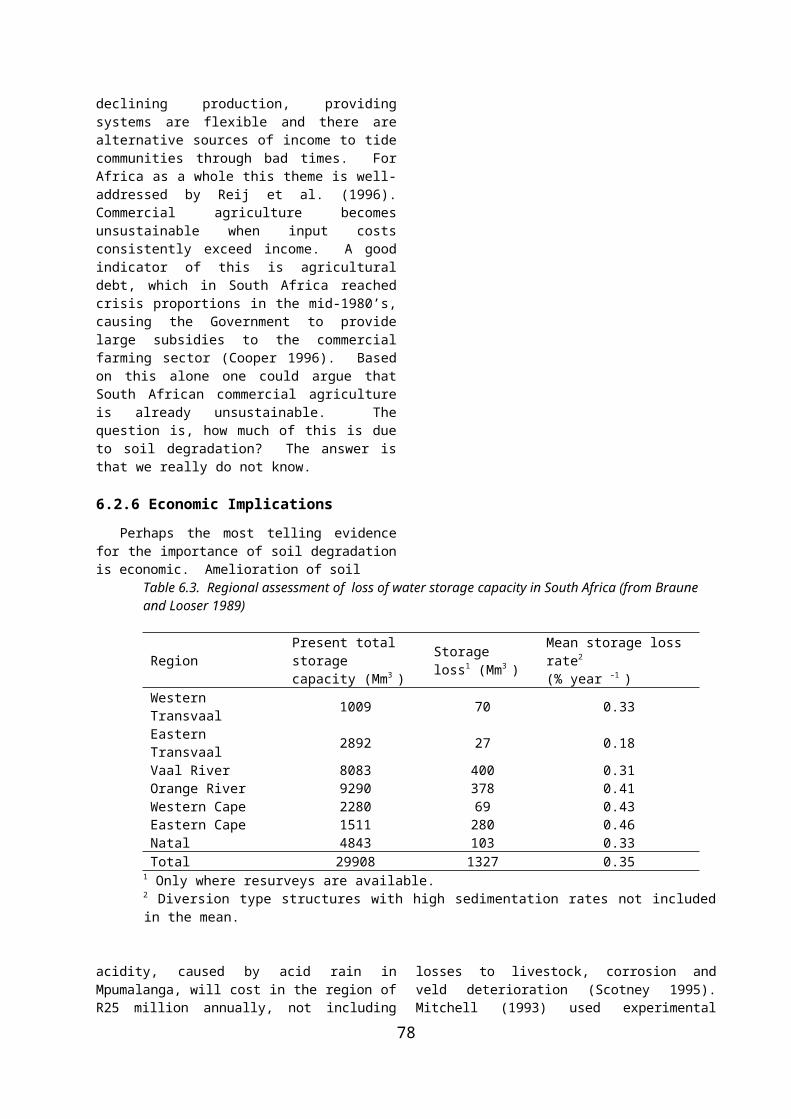
Table 6.5. Types of soil degradation recognized in the 34 workshops held throughout South Africa to assess the severity, rate and index of soil degradation for each magisterial district in the country. Sources of information are SARCCUS (1981), Mathee (1984) and Dardis et al. (1988), Barrow (1991) (see also Garland 1995).
Type Description and comments
Erosive formsWater
Sheet erosionThe detachment of soil particles by rain drops which are then taken up in suspension and transported away, resulting in a relatively uniform removal of surface soil. Crusting and compaction can lead to a decrease in water infiltration capacity and accelerated run-off.
Rill, gully & donga erosion
The detachment of soil particles and aggregates by flowing water to form streams and gullies which further concentrate water flow. River and stream bank erosion, landslides and landslips are included in this category.
Wind
Loss of topsoilUniform removal of soil particles by wind, which are held in suspension or bounce across the land surface during strong winds. Loss of vegetative cover usually exacerbates the problem.
Deflation hollows & dunes
Uneven removal of soil particles leading to localized deflation hollows and dunes usually following extreme wind erosion events.
Overblowing (deposition)
Deposition of soil particles on agricultural lands and infrastructure (e.g. roads and fences). Soil often originates far from its depositional site.
78
Non-erosive forms
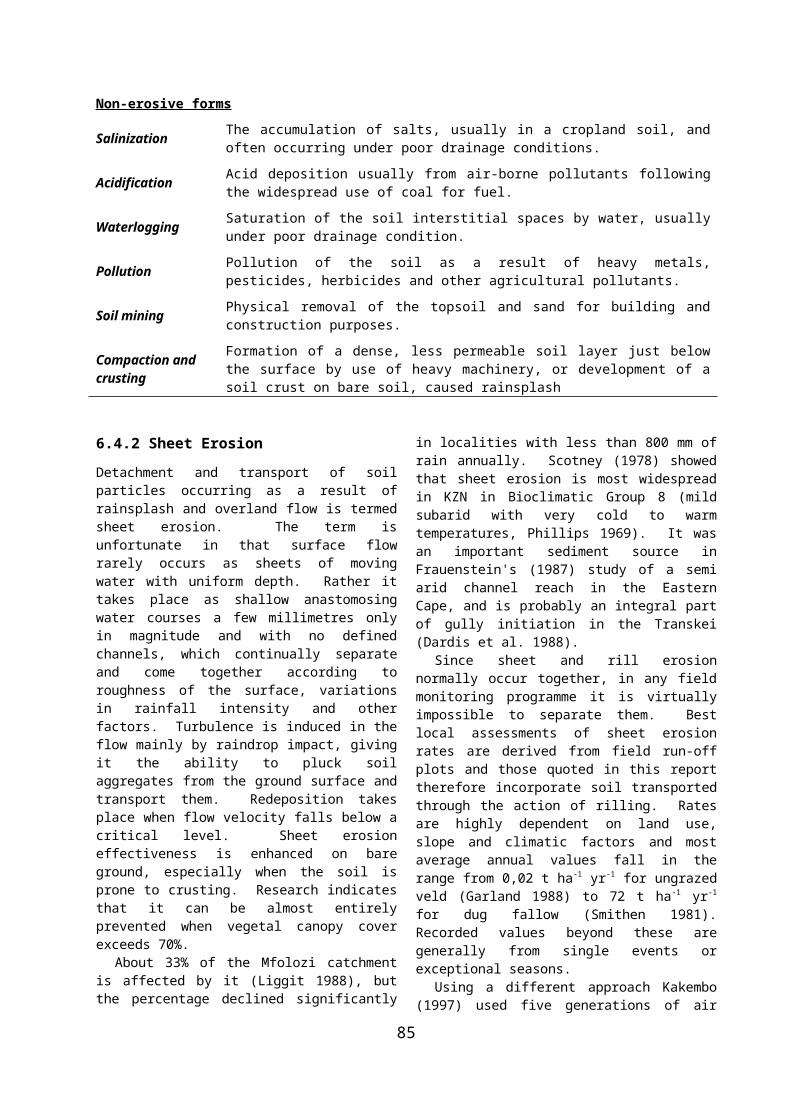
Salinization The accumulation of salts, usually in a cropland soil, and often occurring under poor drainage conditions.
Acidification Acid deposition usually from air-borne pollutants following the widespread use of coal for fuel.
Waterlogging Saturation of the soil interstitial spaces by water, usually under poor drainage condition.
Pollution Pollution of the soil as a result of heavy metals, pesticides, herbicides and other agricultural pollutants.
Soil mining Physical removal of the topsoil and sand for building and construction purposes.
Compaction and crusting
Formation of a dense, less permeable soil layer just below the surface by use of heavy machinery, or development of a soil crust on bare soil, caused rainsplash
6.4.2 Sheet ErosionDetachment and transport of soil particles occurring as a result of rainsplash and overland flow is termed sheet erosion. The term is unfortunate in that surface flow rarely occurs as sheets of moving water with uniform depth. Rather it takes place as shallow anastomosing water courses a few millimetres only in magnitude and with no defined channels, which continually separate and come together according to roughness of the surface, variations in rainfall intensity and other factors. Turbulence is induced in the flow mainly by raindrop impact, giving it the ability to pluck soil aggregates from the ground surface and transport them. Redeposition takes place when flow velocity falls below a critical level. Sheet erosion effectiveness is enhanced on bare ground, especially when the soil is prone to crusting. Research indicates that it can be almost entirely prevented when vegetal canopy cover exceeds 70%.
About 33% of the Mfolozi catchment is affected by it (Liggit 1988), but the percentage declined significantly in localities with less than 800 mm of rain annually. Scotney (1978) showed that sheet erosion is most widespread in KZN in Bioclimatic Group 8 (mild subarid with very cold to warm temperatures, Phillips 1969). It was an important sediment source in Frauenstein's (1987) study of a semi arid channel reach in the Eastern Cape, and is probably an integral part of gully initiation in the Transkei (Dardis et al. 1988).
Since sheet and rill erosion normally occur together, in any field monitoring programme it is virtually impossible to separate them. Best local assessments of sheet erosion rates are derived from field run-off plots and those quoted in this report therefore incorporate soil transported through the action of rilling. Rates are highly dependent on land use, slope and climatic factors and most average annual values fall in the range from 0,02 t ha-1 yr-1 for ungrazed veld (Garland 1988) to 72 t ha-1 yr-1 for dug fallow (Smithen 1981). Recorded values beyond these are generally from single events or exceptional seasons.
Using a different approach Kakembo (1997) used five generations of air photos from the Peddie district in the Eastern Cape, taken between 1938 and 1988 to show that land affected by sheet erosion only had decreased by 9%
and 13% of total land respectively, at both traditional villages and those established under the Betterment scheme, but this was compensated for by increases in other, more severe forms of erosion.
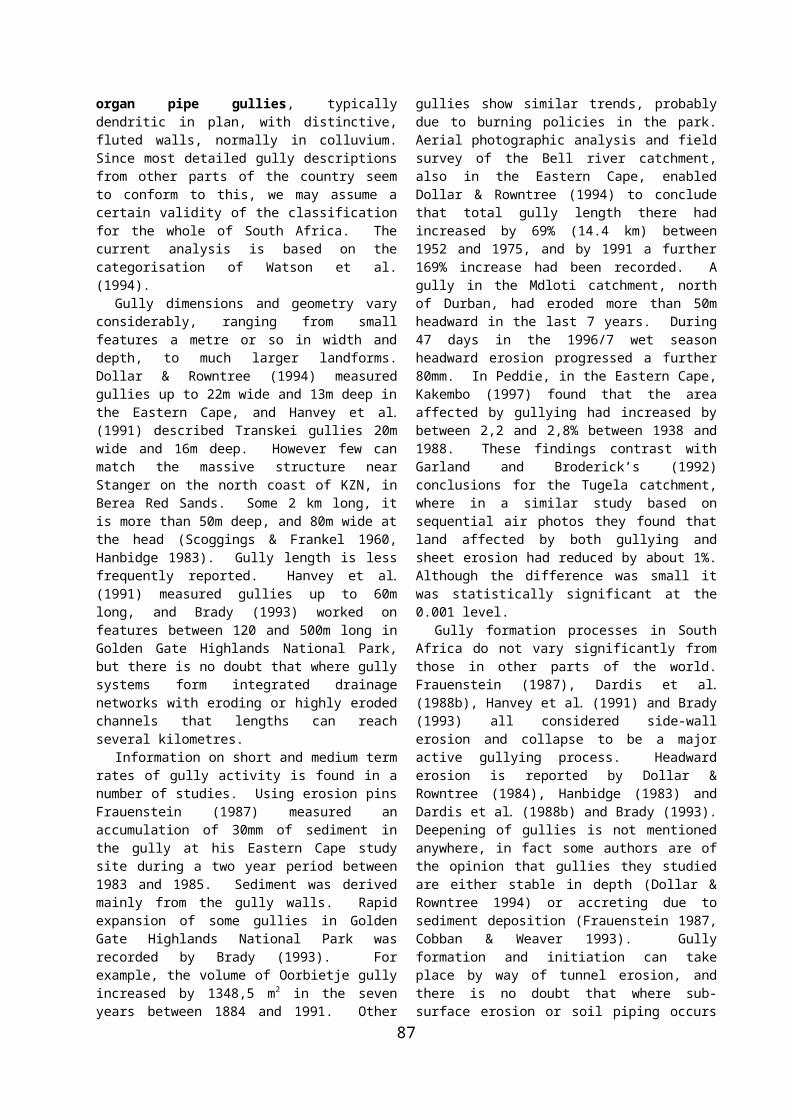
6.4.3 Rill, Gully and Donga Erosion
Rills are micro-channels which occupy some transitional position between sheet and gully erosion. They are essentially ephemeral - a set created by one rainstorm could be completely obliterated by the next, and replaced by a new rill group entirely unrelated to the first (Morgan 1995). They are rarely more than a few millimetres wide or deep, although “master rills” – slightly bigger features which persist for a number of storms – can grow larger and eventually become gullies. In most South African literature many features described as rills are in fact master rills or small gullies. For example in the SARCCUS (1981) categorisation of erosion, "moderate" "severe" and "very severe" rills may be up to 0,5m wide, and could be evident on air photos.
Rill erosion has generally received limited attention from the South African research community. Several South African workers describe the fluting in organ pipe gullies as rills, although they may be several centimetres wide and deep and could certainly not be washed away by a single rainstorm unless the whole gully bank collapsed. For the purposes of this study both ephemeral and master rills are included in this category.
Although no values indicating rates of erosion from master rills are known, erosion from ephemeral rills may be impressive. Morgan (1995) quotes studies from Belgium, the Czech Republic and the UK in which rills accounted for 20-70% of soil movement on hillsides. There is no comparable data for South Africa, as rill and sheet erosion has always been measured together, and the results cannot be separated. However, Kakembo’s (1997) sequential aerial photographic study from Peddie shows that the area of land affected by rill and sheetwash simultaneously had increased by some 12-13% of the total area between 1938 and 1988. Over the same time period terrain affected by severe rill and gully erosion together had increased by between 2% and 6%.
79
The terms “gully” and donga are synonymous, the latter being a southern African vernacular word for the former. They are amongst the most easily observed and widespread erosional forms in the country, and are always considered to be an indication of very severe soil loss. For this reason they have been well studied and much South African information exists.
Gullies are "...relatively permanent steep-sided water courses which experience ephemeral flows during rainstorms" (Morgan 1995 p.19). Other characteristics which help to distinguish gullies from different types of channel are high depth-width ratios, smooth concave upwards long profiles, large sediment loads and erratic hydraulic behaviour.
Lack of a clear definition often means South African literature on gullies can be confusing, especially since the term is sometimes used for integrated sections of ephemeral channel networks which happen to be eroding rapidly, but are not true gullies according to Morgan’s (1995) definition. However Watson et al. (1984) identified two dominant gully forms in KZN: ravine gullies which are linear, flat-walled channels in soil, colluvium and weathered bedrock; and organ pipe gullies, typically dendritic in plan, with distinctive, fluted walls, normally in colluvium. Since most detailed gully descriptions from other parts of the country seem to conform to this, we may assume a certain validity of the classification for the whole of South Africa. The current analysis is based on the categorisation of Watson et al. (1994).
Gully dimensions and geometry vary considerably, ranging from small features a metre or so in width and depth, to much larger landforms. Dollar & Rowntree (1994) measured gullies up to 22m wide and 13m deep in the Eastern Cape, and Hanvey et al. (1991) described Transkei gullies 20m wide and 16m deep. However few can match the massive structure near Stanger on the north coast of KZN, in Berea Red Sands. Some 2 km long, it is more than 50m deep, and 80m wide at the head (Scoggings & Frankel 1960, Hanbidge 1983). Gully length is less frequently reported. Hanvey et al. (1991) measured gullies up to 60m long, and Brady (1993) worked on features between 120 and 500m long in Golden Gate Highlands National Park, but there is no doubt that where gully systems form integrated drainage networks with eroding or highly eroded channels that lengths can reach several kilometres.
Information on short and medium term rates of gully activity is found in a number of studies. Using erosion pins Frauenstein (1987) measured an accumulation of 30mm of sediment in the gully at his Eastern Cape study site during a two year period between 1983 and 1985. Sediment was derived mainly from the gully walls. Rapid expansion of some gullies in Golden Gate Highlands National Park was recorded by Brady (1993). For example, the volume of Oorbietje gully increased by 1348,5 m2 in the seven years between 1884 and 1991. Other gullies show similar trends, probably due to burning policies in the park. Aerial photographic analysis and field survey of the Bell river catchment, also in the
Eastern Cape, enabled Dollar & Rowntree (1994) to conclude that total gully length there had increased by 69% (14.4 km) between 1952 and 1975, and by 1991 a further 169% increase had been recorded. A gully in the Mdloti catchment, north of Durban, had eroded more than 50m headward in the last 7 years. During 47 days in the 1996/7 wet season headward erosion progressed a further 80mm. In Peddie, in the Eastern Cape, Kakembo (1997) found that the area affected by gullying had increased by between 2,2 and 2,8% between 1938 and 1988. These findings contrast with Garland and Broderick’s (1992) conclusions for the Tugela catchment, where in a similar study based on sequential air photos they found that land affected by both gullying and sheet erosion had reduced by about 1%. Although the difference was small it was statistically significant at the 0.001 level.
Gully formation processes in South Africa do not vary significantly from those in other parts of the world. Frauenstein (1987), Dardis et al. (1988b), Hanvey et al. (1991) and Brady (1993) all considered side-wall erosion and collapse to be a major active gullying process. Headward erosion is reported by Dollar & Rowntree (1984), Hanbidge (1983) and Dardis et al. (1988b) and Brady (1993). Deepening of gullies is not mentioned anywhere, in fact some authors are of the opinion that gullies they studied are either stable in depth (Dollar & Rowntree 1994) or accreting due to sediment deposition (Frauenstein 1987, Cobban & Weaver 1993). Gully formation and initiation can take place by way of tunnel erosion, and there is no doubt that where sub-surface erosion or soil piping occurs many surface gully systems are the result of collapsed soil pipes (Beckedahl 1998).
Soil and lithological characteristics exercise much control on whether gullies occur or not. In KZN and the Eastern Cape most gullies form on transported colluvial or alluvial sediments. Botha et al. (1994) cite the importance of the Quaternary Masotchini Formation, a thick layer of colluvium, as host to most of KZN’s gully systems, with in situ soils being in general far less susceptible. Nevertheless some untransported soils and weak bedrock do support gullies. In the Transkei, many gullies are located on Beaufort mudstones (Dardis et al. 1988b), and both Berjack et al. (1986) and Liggit (1988) working in KZN found that in their respective study areas, soils underlain by Dwyka Tillite were the worst affected. A site 20 km SE of Barberton Dardis & Beckedahl (1988b) described gullies up to 3 m deep in quartzitic sandstones. Since in places these disappeared upslope below regolith they concluded that the gullies could have been formed by tunnelling at the regolith/bedrock interface.
Little is written about the physical and chemical soil properties governing gully formation, but Dardis & Beckedahl (1991) pointed out that bedrock-incised gullies form over a considerable range of rock mass strength, with rock mass strength indices varying from 40 to 69 in gullies they measured.
Slope also seems to be quite critical. King (1951) observed that gullies tended to form on the lowermost, gentler slopes or pediments of hillsides, a fact corroborated by Cobban and Weaver (1993) in the Eastern
80
Cape, where gullies were well established below a break of slope where gradient reduced from 20o to 5o. Liggit (1988) found an inverse relationship between gradient and gully frequency, claimed that 10o (16%) was a critical slope value in parts of KZN. Below this value gully occurrence increased markedly, although land use practices also controlled by slope could have affected this. Further, spatial position in the landscape, and slope characteristics determine run-off types, and these in turn largely control the processes which operate in gullies (Brady 1993).
The influence of South African climates on gullying is not widely researched. Most gully studies are from summer or year round rainfall areas, although both Talbot (1947) and Meadows & Meades (1995) discuss gullies in the Swartland, in the winter rainfall area of the Western Cape Province. In KZN gullies are most common in areas dominated by Bioclimatic Group 8 (Phillips 1969: mild subarid with very cold to warm temperatures) (Scotney 1978). Only Liggit (1988) has considered mean annual rainfall as an influential factor, noting that in some areas of KZN gullying decreases significantly where mean annual rainfall exceeds 800 mm.
Land use is certainly important, and can dominate over all other influences. Hanvey et al. (1991) propose that the activities of Iron Age hunter-gatherers may have exacerbated gully development in some areas, and certain KZN studies indicate that gullied lands are more common in subsistence farming than commercial farming areas. Berjak et al. (1986) found that only 2% of Dwyka Tillite, the most susceptible lithology, was eroded in commercial farming areas, compared to 21% in subsistence farming areas. Talbot (1947) argued that Swartland gullying was largely attributable to agricultural mismanagement, and this was taken a stage further by Meadows and Meades (1995) who believed that the land tenure system dominant in the Swartland influenced land use and was therefore the driving factor. Garland (1987) discussed the role of paths and tracks in creating gullies, and the Transkei boasts several examples of gullies formed by inadequate dispersal of storm water run-off from tarred and gravel roads (Dardis et al. 1988b), a factor also cited by Russow and Garland (1997) in the Mdloti catchment gullies they studied.
Brady (1993) is the only researcher to consider vegetal burning as an influential factor in gully development. She considered the indiscriminate veld burning policy at Golden Gate Highlands National Park to be a contributory factor in rapid gully expansion there over the last 39 years.` In summary, unwise land use can cause the inception of gullies at almost any site where sufficient depth of soil or weak bedrock exists. Soil piping also results in the formation of open gullies, and Brady (1993) describes a gully triggered by mass movement in Golden Gate Highlands National Park. But beyond this, the foregoing review points to certain more general patterns in the available research evidence. When not caused by extreme situations like mass movements, paths or road drainage, South African gullies tend to be located on footsteps with gradients less than 10o, typically on unconsolidated
colluvial or alluvial materials. Once these materials are stripped, weak underlying bedrock is also incised. In the long term, gully erosion is clearly a cyclic phenomenon, with identifiable periods of erosion and infilling, although different parts of the country may reach different stages at different times. The cause of these erosion/deposition cycles could be linked with land use or may be related to climatic changes and natural variations in vegetal cover. A number of reports recount aggradation of gully floors, and no South African research describes gully deepening, except in situations controlled entirely by local land use factors. This implies that many gullies have attained a base line, and that any erosional activities are largely confined to headward erosion and width expansion. This in turn could indicate that the country is entering a natural period of deposition and infilling, bank and headward erosion having the effect of reducing immediate gradients until an equilibrium is attained.
6.4.4 Loss of Topsoil by Wind
The transport of soil by wind is dependent on the relationship between near ground wind velocity, and the size distribution of soil particles or aggregates. In any calculation of critical wind velocities, wind measurement must be made within 0,2m of the ground surface to have any validity. Since the size of natural soil particles and aggregates is highly variable, there is no single critical velocity at which soil becomes available for transport. Instead, an empirical relationship between velocity and particle size has been developed and graphically expressed by Savat (1982) (Figure 6.3). This shows that in dry conditions soil particles and aggregates between about 50 and 400 microns are the most susceptible, in that they are moved at the lowest near ground wind velocities. Once entrained by wind, soil particles may travel long distances, often several kilometres as suspended load in air, or shorter distance through saltation – a process which consists of a series of hops or jumps in a downwind direction. Yet larger particles or aggregates simply role along the ground. Vegetal cover even when quite sparse, can reduce wind erosion potential considerably, but where vegetation is removed, both wind and soil characteristics are the factors which determine where, within the country, wind erosion is most likely to occur.
81
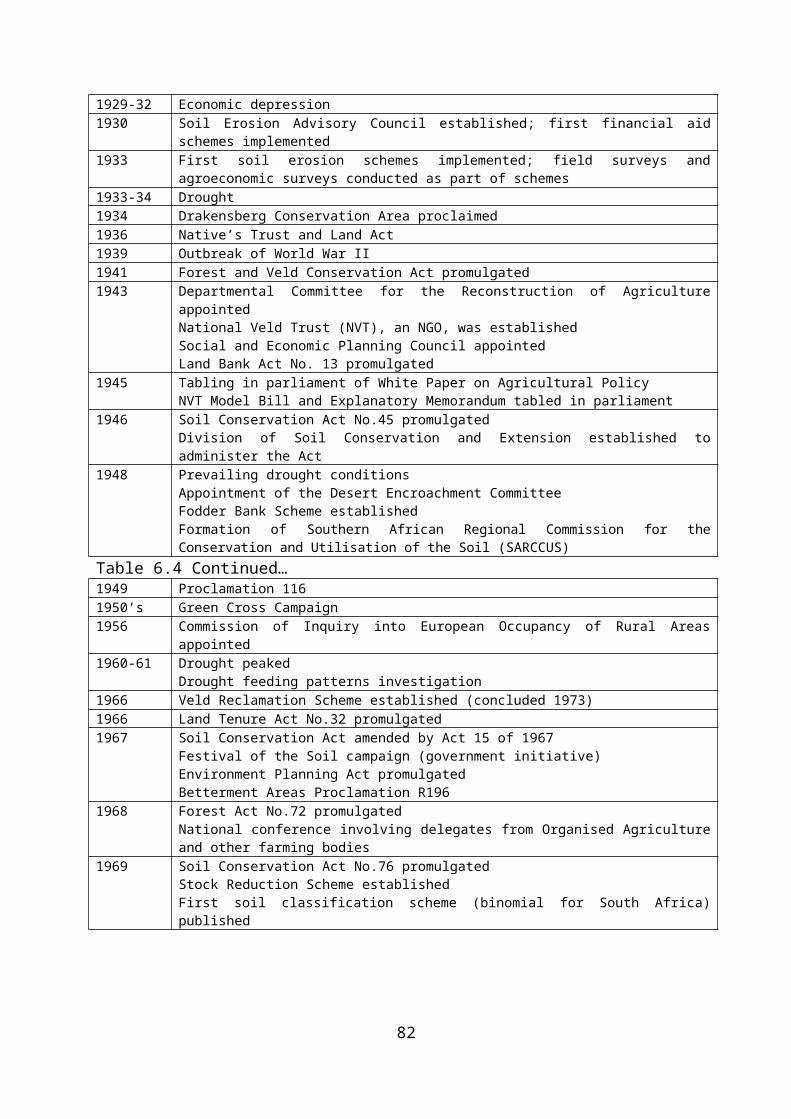
Figure 6.3. Critical shear velocities of wind required to bring soil particles of specific diameters into motion (after Savat (1982), and modified from Morgan (1995)).
Wind erosion has been observed in many areas of South Africa, and in total about 2,2 million ha of land is subject to erosion by wind (Du Plessis 1985). There are few regions which are entirely unaffected. Van der Westhuizen (1986) estimated that soil loss through wind action could be as high as 60 t ha-1 yr-1 in some areas under conventional tillage practices. On the basis of wind speed and frequency, Schoeman et al. (undated) tentatively declared the north-west of the country, with highest recorded speeds and frequencies, to be most susceptible, and KZN and Eastern Transvaal the least. Despite this Scotney (undated) observed that wind in parts of KZN is sufficient to cause soil transport, and that most wind-induced soil loss takes place when soil moisture is low and winds at their highest, between July and October.
Soil properties are equally critical, but few studies have taken this into account. Schoeman et al.'s (undated) conclusion, that 25 million out of 75 million ha in the north west are sensitive to wind erosion, is partly based on soil characteristics. Scotney (undated) used silt/clay and moisture content to determine which KZN soils were likely to be subject to wind action. Mesotrophic and dystrophic soils with <15% clay in the B horizon are the most likely to be eroded, and these include Avalon, Estcourt, Fernwood, Glencoe and Hutton forms. Others with susceptible particle size distributions were excluded because of high moisture content for much of the year.
In an early report Talbot (1947) commented on soil deterioration due to wind erosion in the Sandveld, Cape Province, Roux & Opperman (1986) described problems of shifting sand in Namaqualand and Karoo, and Hanvey et al. (1991) described wind activity in sand dunes at Molombo Point, Transkei. In Hallward's (1988) more detailed study of the Western Cape, wind erosion sites were mapped on air photos, and interviews with agricultural extension officers indicated that wind erosion in the region was most severe in areas around Prieska, Colesburg, Burgersdorp, Beaufort West, and Steytlerville. Farmers considered wind erosion to be less of a problem
than the extension officers did. In a later study Morel (1997), in reappraising Talbot’s (1947) previous work, noted that some 205 000 ha of arable and grazing land in the Sandveld and Swartland regions were subject to wind erosion of varying severity, but that the situation had improved since 1947.
6.4.5 Deflation Hollows and Dunes
Where wind erosion is severe and persistent, deflation hollows may develop. These are basin-shaped depressions of varying sizes, but rarely greater that a few hundreds of metres across, where all wind-erodible soil is has been removed. They may stabilise when remaining soil is too coarse to be transported by wind, or when they become deep enough to intersect a permanent or seasonal water table. There are few reports of deflation hollows in South African literature, and it is likely that if they do occur in the country, that they are mainly restricted to true desert areas.
Eroded soil may build up into dunes. Most dunes in South Africa are coastal, or have formed in deserts. They are composed of sand rather than soil, and are really only minimally related to soil erosion in the commonly accepted sense of the term.
6.4.6 Overblowing
When a large quantity of eroded soil is redeposited after a wind storm it can land on buildings and infrastructure, crops, or productive agricultural fields. It can also block streams and drainage lines and cause other damage. Since overblowing is largely unreported in South African literature, it is likely that it only occurs after exceptional wind erosion events, and its effect is local and probably short-lived. Nevertheless, should overblowing increase in any particular region, it may be taken as a sign of increasing desertification. For that reason it is included in this study.
6.4.7 SalinizationAccumulation of various salts takes place naturally in many, mainly semi-arid areas. The soil solution takes up soluble salts from bedrock, the atmosphere and other sources during wet periods, In dry seasons the solution is brought to the soil surface where the moisture evaporates, so that the salts gradually concentrate, and are eventually precipitated out in the upper horizons of the soil.
A number of human activities, mostly related to irrigation and water supply, increase rates of salinization in soils, and the phenomenon has been known for at least 2000 years (Goudie 1990). In South Africa most anthropogenic salinity problems are the result of irrigation. Irrigation water dissolves soluble salts on its downward passage through the soil, but moves towards the surface during hot periods, where concentration and ultimate precipitation takes place. Corrective treatment is possible but costly. Scotney (1995) notes that some 130000 ha of South African soils have suffered in some way from human-induced soil salinization, and in some
82
irrigation schemes more that 30 % of soils may be degraded in this way.
6.4.8 Acidification
Although soil acidification is a natural process – the result of leaching by rainwater – in most environments it progresses slowly. In recent years the rate of soil acidification has increased in some places for a number of reasons. Acid rain and acidic atmospheric fall out from polluted air are two important sources. In addition certain plants, such as legumes and forest as well as some fertilisers, for example ammonium sulphate may result in falling soil pH.
South Africa has a vast area of naturally acidic soils. Some 5 million ha are extremely acid, with pH values below 4,5. Another 11 million ha are classified as acidic. There is now evidence of falling pH values in previously non-acidic soils in both the Drakensberg region (from fertiliser application) and Mpumalanga Province (from acid rain) (Scotney 1995).
6.4.9 Waterlogging
Consistent waterlogging in soils can lead to excessive leaching, washing transportable nutrients down the soil profile, and may create anaerobic, acidic conditions, which severely restrict plant growth. Since it is not re-ported in South African literature, except in association with salinization (e.g. Scotney 1995), it must be con-cluded at this stage that it is not an important form of soil degradation in the country.
6.4.10 Soil Pollution
Solid waste and effluent, the sources of most soil pollution, are being increasingly disposed of in the soil. It is also known that additions of ammonia-based fertilisers can lead to aluminium toxicity in some soils. Heavy metals may be particularly toxic to plant growth and are found in waste products from industry and agriculture as well as urban run-off. Natural background values for soil chemicals are generally not available in South Africa, and adherence to international standards is often not appropriate, as the natural occurrence of some microelements in some South African soils is higher than critical levels established in European countries, for example (Arbuthnot 1995).
Scotney (1995) estimates that roughly 31 000 ha of South African soils are severely degraded by pollution.
6.4.11 Soil MiningTopsoil has long been used for construction purposes in South Africa, mainly for making huts and for surfacing dirt roads, both normally in rural areas. This is a component of soil use which seems to have been completely unstudied, although a single rural hut may require several tonnes of soil during building, and will have to be rebuilt after a few years. Sand-winning is another form of degradation. Land based sand-winning
has a number of adverse environmental effects (see Strydom 1997), but in the current context the most important of these is the general lack of land rehabilitation after the deposit is mined out.
6.4.12 Compaction and Crusting
In their normal state, lower soil horizons are naturally compacted by the mass of overburden above them. Since this is in direct proportion to the weight of the overlying material topsoil, where most agricultural and biological activity takes place, production is relatively unaffected, so natural soil compaction, unlike natural acidity or salinity is rarely a problem. However, the use of heavy machinery and the act of ploughing both result in soil compaction to a layer about 300mm below the soil surface, to the degree that infiltration capacity and soil drainage are impaired, and the compacted layer becomes too dense and hard to allow root penetration by seedlings.
Crusting occurs when the kinetic energy of intense rain falling on bare soil is mobilised to release fine soil particles and wash them into surface pores, effectively sealing the soil surface. This takes place on fine soils with poor aggregate stability. Compaction may reduce crop yields very significantly indeed (Scotney 1995), and certainly enhances rates of run-off and soil erosion (Goudie 1990). Its severity is enhanced when the depth of ploughing is invariable in the long term.
Scotney (1995) reports that in South Africa agricultural compaction is most severe on about 2 million ha of fine sandy soils with less that 15% clay in the B horizon.
6.5 Causes and Controlling Factors of Soil Degradation
6.5.1 The Political and Socio-economic Setting
“The central question [about soil degradation] to ask is why certain land-uses take place. Why are no soil conserving practices a part of the on-going development and change of land-use practices, and why are adaptations to conserve the soil not sometimes made? The answer to these questions lies in the political-economic context in which land users find themselves.” (Blaikie 1985 p. 32)
Ramokgopa (1996) suggests that traditional land tenure structures, in which communal tenure is the corner stone, can account for at least some of the degradation, but others have claimed that much of the answer lies in the social and spatial engineering caused by colonial and subsequent apartheid land allocation policies (see also chapter 9.2). It is well known that the 1913 Land Act compelled the African population, who at that time comprised 67,7% of the total to live and acquire land in an area which constituted 7,3% of the total area of the country (Cooper 1996). Subsequent legislation entrenched this. Large scale population movements into these, often agriculturally marginal
83
areas (but see chapter 3), resulted in land use which was frequently inappropriate. The rate of population growth in some of these areas was also extraordinary. The population of QwaQwa, one of the smallest regions, grew from 23 000 to 158 000 in a decade (Wilson 1991). Overstocking was common, and of necessity, steep slopes had to be cultivated.
A growing body of research shows that the inhabitants of these marginal and overcrowded areas knew that their actions were degrading land, but were completely unable to prevent it. Phillips-Howard and Oche (1996) described several indigenous soil and water conservation techniques and local adaptations of “expert” methods in the Transkei. Many residents of Cornfields, KZN understood both the causes of erosion on their land and knew of ways to control it. However, they were unable to increase land holdings to reduce population density, and lacked both power and finance to implement conservation measures (Pile 1996). Wilson (1991 p.36) speaks of “a direct and symbiotic relationship between human poverty and ecological destruction.” Nowhere is this more true than in rural South Africa.
It is within this context that Beinart’s study (1984) becomes relevant. His thesis was that colonial and settler conservationist thinking gave rise to a conservation system reliant on centralised planning, contrived against a background of capitalist social relationships in which the role of the scientific expert was paramount. Such practice assumed a social vacuum and was inappropriate in African society. It was completely insensitive to rural social relationships, and often required moving people from ancestral homelands to areas deemed more suitable for agricultural activity. It failed to accept that technical and engineering solutions to soil erosion are not socially neutral, and the social and spatial disruption they cause requires intolerable changes in traditional life styles. This meant that government-inspired conservation interventions soon became associated with the broader political agenda of apartheid and its attendant objectives. In South Africa the result tended to be mass opposition from rural communities rather than effective on-site soil conservation. This, coupled with the fact that allocated land parcels were often far too small to sustain the size of the population crammed in to them, meant that there has been little success in reducing erosion in these areas – “Not only do the problems of soil erosion still persist, but also the methods of dealing with them. Though the content of “development” has been much broadened, colonial ideas and techniques have remained an important part of the developer’s baggage” (Beinart 1984 p.83).
The controversial role of Betterment planning, evolved in the 1930’s, and further developed after the Second World War, aimed at improved conservation in rural African areas, was a case in point, in that it often seemed to create rather than solve land degradation problems. Under such schemes land was apportioned for different uses and fenced off, thereby removing
flexibility from the land use pattern. Not only this, but the approach encouraged movement of people into residential areas, and left many people economically worse off than they were before. Soil erosion frequently became more intense and widespread under betterment schemes than it had been before (de Wet 1990, Whisken 1991).
The balance of the land, held in the main by white commercial farmers, although obviously not overpopulated was beset by other pressures and problems. The perceived need for national self-sufficiency in food production, in the face of increasing agricultural input costs, led to huge escalations in farm debt. In such cases short term economic survival became far more important to farmers that investing in soil conservation structures which could show no profit in the short to medium term. The need to survive, together with the desire to profit, resulted in poor land use decisions, which resulted in significant soil degradation. Wilson (1991) noted that white-owned farms in the Cape Midlands and eastern Karoo were overstocked by between 27 and 36% during the 1980’s. Irrigating unsuitable soils has caused extensive salinization of topsoils at Douglas, Pongola, Mkuze and Vaalhartz (Scotney 1995).
84
Betterment and soil erosion in Herschel District
Photo 6.1. In the foreground are the ruins of the Mpapmbo family homestead. M Zandisile Mpambo is pointing across the severely eroded Emaqolwaneni valley, which was used primarily for crops. In 1963, as part of a betterment planning process, his family was moved across the valley and settled in Entsimekweni village. The valley was rezoned as grazing land, the rills and gullies which were present, began to deepen and widen. The valley bottom was perceived by the inhabitants to be “confiscated land” and they took lit -tle responsibility for its conservation.
Photo 6.2. This field once supported a productive maize, sorghum or wheat crop, which was cultivated by the Mpambo family, whose homestead was situated close by. Contours and small anti-erosion works, were maintained by individual households, sometimes with the assistance of local agricultural officials. Following the rezoning of the area for grazing and the relocation of people into Entsimekweni village the croplands were abandoned, resulting in increased erosion on the croplands, as well as along footpaths that serviced the area at the time. The donga at the base of the Cave Sandstone ridge was once a sled trail (see Photo 6.3).
85
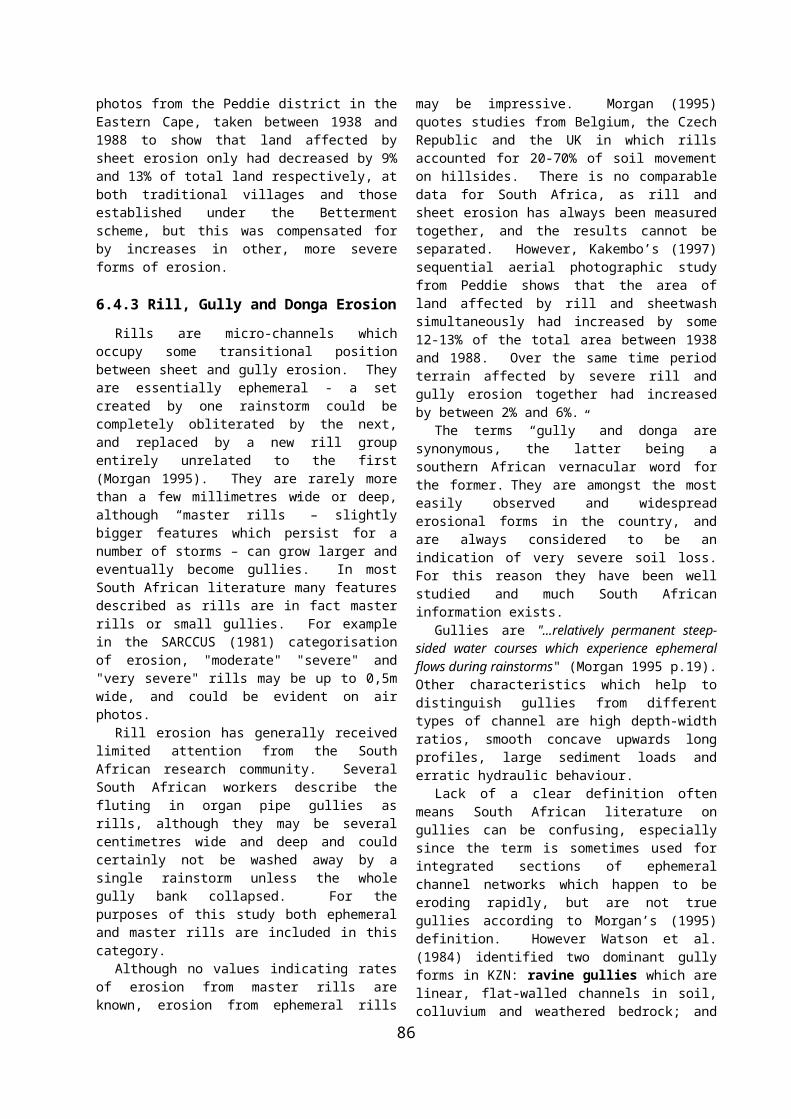
Photo 6.3. As a young boy Mr Mpambo used to drive his cattle and sled along a footpath that has now eroded to form a 10 m deep by 20 m wide donga..
6.5.2 Land useAgricultural practices may have been affecting South African soil losses for hundreds of years. Late Iron Age settlements (from 1400 -1800 AD) in the Lydenburg valley (Eastern Transvaal) were certainly, and Early Iron Age sites, possibly, associated with accelerated soil erosion, although in most cases deep gullies post-dated the settlements. Erosion was attributable to land use, in particular, arable cropping and stock grazing (Marker & Evers 1976).
Land use certainly influences soil losses, and there is abundant research, which makes this point clearly. Barker (1985) found that much sediment input into the Swartvlei river was attributable to intense land use in the lower catchment. Land use was also a critical determinant of suspended load in two adjacent, physically similar catchments in Zululand (Kelbe et al. 1992). Here a highly populated catchment which included significant amounts of land under plantation, subsistence agriculture and sugar cane, had suspended sediment yield values on average 3,8 times more than the second, predominantly forested catchment which was maintained as a nature reserve.
But this does not mean to say that forestry per se is a conservative form of land use. Grey and Jacobs (unpublished notes) measured large increases in sediment production and gully erosion from headwall and channel bank retreat caused by forestry skid road construction and use in the southern Cape. Removal of leached A and F horizons to expose erodible sub-soils were the main cause, and other forestry harvesting practices also resulted in increased soil loss. Preparing land for tree planting also causes erosion. In the KZN Midlands site preparation by ripping, complete preparation (including ploughing and
harrowing), and pitting all resulted in substantial increases in soil loss, and rates up to 7,1 t ha-1 yr-1 were recorded (Moerdyk 1991).
A great deal of South African experimental research effort has been directed towards assessing the influence on erosion of some of the most important local crops and the techniques used in their cultivation. Maize and sugar cane are by far the best researched, although wheat, various hay and fodder crops, pineapples, wattle, grapes, cassava, tobacco, banana and chicory have all received some attention. Land used for recreational hiking, as well as land in nature reserves accommodating large game animals, has also received some study. Notable omissions, which appear to lack much serious analysis include fruit orchards, most vegetables, subsistence farming and heavily or overgrazed land. Most research data has been obtained from run-off plots, and it is important to realise that extrapolation from plots to catchment and regional scales is problematic, and direct proportional conversions will undoubtedly result in over-estimations (Stocking 1987). This should be kept in mind when considering data presented below.
Since soil losses from undisturbed veld are thought to approach natural rates, many studies take that land condition as the "best case" benchmark, and measured values range from 0,02 t ha-1 yr-1 (Garland 1988) to 0,75 t ha-1 yr-1 (Haylett 1960). The variation is accounted for by local slope, rainfall and soil conditions. Some burn/graze treatments also fall within this range. Annually burned but ungrazed veld in the Drakensberg for example, suffered soil losses ranging from 0,18 t ha-1 yr-1 (Van Wyk 1986) to 0,5 t ha-1 yr-1 (Scott 1951, Garland 1988). Values for grazed land ranged from 0,6 t ha-1 yr-1 (Scott 1951) to 1,7 t ha-1 yr-1 (Haylett 1960), and Smithen (1981)
86
and (Haylett 1960) measured rates for graze/burn combinations of 1 t ha-1 yr-1 and 2,8 t ha-1 yr-1 respectively. Such soil losses are slight, being at least an order of magnitude less than those from most other agricultural land uses for which information is available.
The "worst case" extreme is represented by bare land in various conditions from completely undisturbed to tilled and treated with fertiliser. Haylett (1960) recorded a figure of 28,1 t ha-1 yr-1 for undisturbed bare ground, and between 9,8 and 25,1 t ha-1 yr-1 for bare dug land. Smithen (1981) quotes a value of 72 t ha-1 yr-1 for bare dug fallow land in the former Transvaal. Average annual soil losses on bare weed-free plots with 9% slopes at Cedara Research Station, KZN, ranged between 23 and 200 t ha-1 (Dept Agriculture 1991). Soil losses from a small fallow catchment at La Mercy in KZN reached 115 t ha-1 yr-1 in 1981, but the long-term average for the same catchment was much less (Platford & Thomas 1985).
Bare ground losses can be reduced by good management. Triennial addition of organic matter and plant residue to bare tilled plots in the former Transvaal reduced erosion by up to 30% (Menne 1959). Lang (1984) studied effects of 0-75% cover of maize stover on soil loss and run-off from otherwise bare erosion plots under simulated rainfall at 63,5 mm/hr. To keep soil loss at less than 2 t ha-1 yr-1 the minimum ground cover needed was 30%. Cattle could be grazed on maize residue for up to 220,8 animal grazing days without reducing ground cover below 30%. Evidence therefore shows that tilling or digging a bare plot can either increase or decrease soil losses, depending on local conditions and whether any form of fertiliser or cover is added.
With few exceptions, soil losses from agricultural land uses fall between the extremes of 3 t ha -1 yr-1 (the maximum for grazed burned veld) and 72 t ha-1 yr-1
(maximum for bare dug ground). Those exceptions are some bare fallow treatments in KZN with losses up to 200 t ha-1 yr-1, wattle where brushwood was burned after harvesting, which eroded at the rate of 113,7 t ha-1 yr-1
(Sherry 1959), and ridged pineapple cultivation which, although no absolute rates are given, according to McPhee et al. (1984), showed soil losses 300% greater than bare plots. At the lower end of the scale, sugar cane is probably the most conservative of all commercial crops, followed by some sown pasture varieties. Of crops offering poor protection, maize, with measured values commonly around 25 t ha-1 yr-1, but on occasion attaining more than 60 t ha-1 yr-1 (Smithen 1981), is probably the worst.
Although different crops offer different levels of soil protection, soil loss values for the same crop may vary immensely when different agronomic techniques are used. Smithen (unpublished data) showed that depending on time of ploughing, stover cover, till regime (no till, reduced till and full till) and plant population, the crop cover factor used in the Universal Soil Loss Equation (C), varied from 0,11 to 0,86 for maize. Use of simulated rainfall on run-off plots on various soils, with slopes between 1 and 16% demonstrated that mulch tillage in wheat and maize reduced soil losses by up to 30% and
26% respectively on a single storm basis (McPhee et al. 1984). Maher (1990) noted that crop cover and general management practices are far more influential in determining soil losses under sugar cane than conservation structures.
In summary, despite difficulties in direct comparison caused by differences in measurement techniques, length of measurement period, data presentation, crop management and local conditions, and although there is no usable information whatever on a number of crops, a crude, comparative classification, in terms of effects of a few South African crops on soil loss is possible. Highest losses of tens of tonnes ha-1 yr-1 may be expected from bare ground. Maize, pineapples and cassava with erosion rates between about 5 and 60 t ha-1 yr-1 depending on natural environment and growth conditions, are the most susceptible crops. Significantly less soil loss can be expected from sugar cane, wheat, bananas, and some legume and hay crops. Low but detectable erosion results from sown pasture, controlled grazing and wilderness recreational uses, whilst soil losses from natural veld are extremely low.
Some non-agricultural land uses which accelerate erosion include rural and informal settlements (Watson 1991, Makhanya 1993) and recreational walking and hiking (Garland 1988, Sumner 1995). The literature also shows that erosion may be reduced by conservation measures. Whitmore (1959) noted that in a 4300 km2
semi-arid catchment in Eastern Cape Province extensive mechanical and agricultural conservation works led to a reduction in sediment yield, this being directly attributable to a reduction in run-off which resulted from the conservation practices.
The controversial subject of vegetation burning, either as accidental bush and forest fires, or for veld treatment, is also known to affect erosion, and many (for example Scott 1981) are happy to attribute much excessive soil loss to burning practices. Since fire strips canopy and basal vegetal cover, leaving an unprotected soil surface, the contention is logical, and there is certainly scientific evidence to support it. After an accidental fire in a Drakensberg Pine plantation, Van Wyk (1986) measured soil losses of 37 t ha-1 yr-1 in an area where hardly any erosion had occurred previously, and Sherry (1959) observed massive soil losses due to burning of trash after wattle harvesting in KZN. Scott and Schulze (1991) measured soil losses from a burned Eucalyptus plot in KZN which at 52 t ha-1 were two orders of magnitude greater than adjacent unburned areas. Levyns (1924) noted that one of the adverse affects of controlled burning in Signal Hill (Cape Town) was accelerated soil loss due to winter rains falling on unprotected terrain.
But other investigations suggest that vegetal burning has a very limited effect on erosion. Van Wyk (1980) measured a trivial increase in sediment yield after burning in small Cape fynbos catchments from almost zero under natural vegetation to 0,006 t ha-1. Watson's (1983) study in experimental catchments at Cathedral Peak indicated no increases in sediment yield after burning, and Garland's (1987) experimental plots at Kamberg, Drakensberg,
87
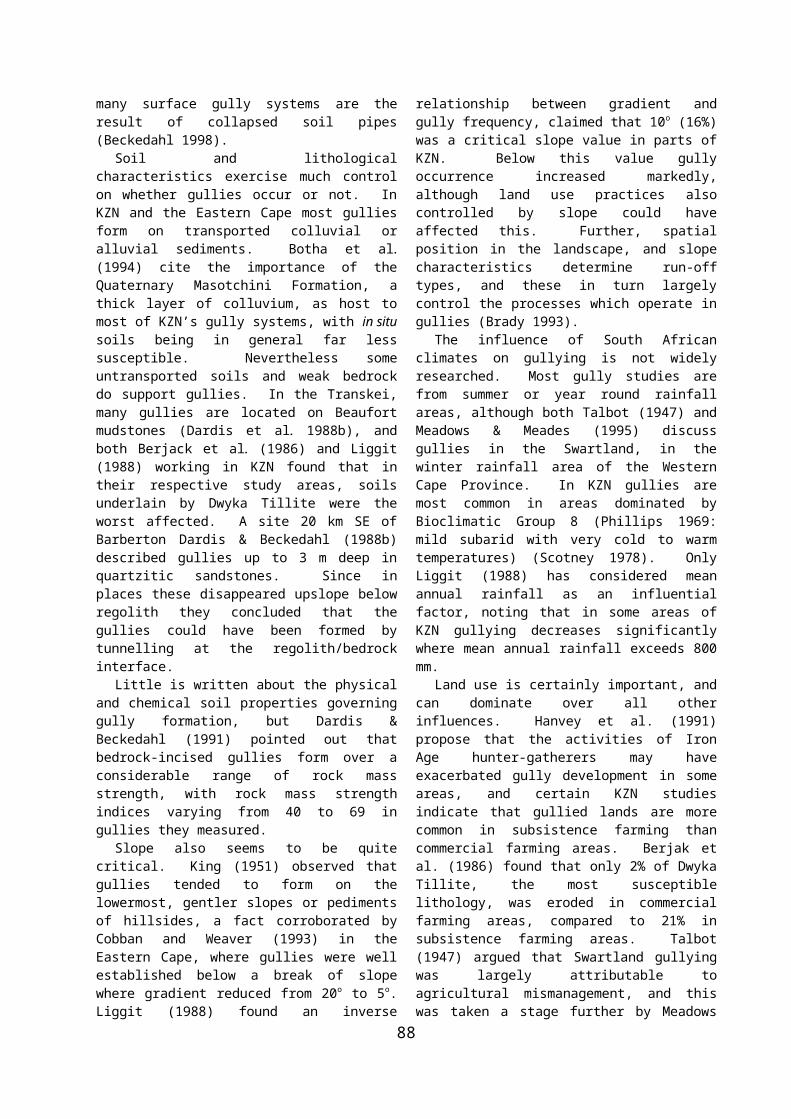
showed that soil losses caused by burning alone were insignificant, although erosion from footpaths in burned grassland is many times greater than that from tracks in unburned areas. Plot studies at Pretoria indicated that burning did not encourage losses except in years of heavy rainfall, and even then only some 3 t ha-1 yr-1 of erosion occurred (Thompson 1937).
Timing of burns with respect to season may well be critical in determining whether soil loss is accelerated or not. This was certainly the case at Golden Gate National Park, which receives summer rainfall, where Bird (1996) found winter burning during the dry season enhanced soil loss when compared with spring burns, set at the start of the wet season.
Scott and Van Wyk's (1992) study of Swartboskloof catchment (Western Cape) revealed no increase due to burning in total sediment yield, although soil losses from plots within the catchment increased significantly. Scott and Schulze (1991) noted a similar effect in a burned Eucalyptus fastigata plantation in the Drakensberg foothills in KZN, and in each case the discrepancy was attributed to storage of eroded soils by riparian vegetation, preventing it from reaching the stream channel.
Despite the fact that Bird’s (1996) experimental study at Golden Gate Highlands National Park demonstrated that grassland fires are generally not hot enough to effect soil properties, other work shows that fire can affect some of the soil properties which determine erodibility, and the discrepancy is probably due to variation in the fundamental properties of soil over which burning takes place. Cass et al. (1984), in reviewing the effects of fire on soil characteristics, quoted studies to show that regular burning had reduced organic matter content by up to 8% in Transvaal sandy soils, although other work in KZN found no difference in organic matter content between burned and unburned soil. Aggregate stability appeared to be unaffected by fire, but infiltration capacities in regularly burned grassland fell from 30 to 1,3 mm day-1. Watson and Poulter (1987) recorded clear differences in K factor measurements made before and after vegetal burning in the Drakensberg. Soil wettability and water repellency can affect soil losses as they influence overland flow generation, and both properties can be significantly affected by vegetal burning. Evidence for reduced wettability and increased water repellency after wild fires is presented by Scott and Van Wyk (1990). The degree to which water repellency was induced depended to a great extent on temperature of the burn and the nature of available fuel.
The way that vegetal burning affects South African soil losses is obviously closely linked to other factors, and at this stage it is impossible to draw confident conclusions. The timing of burns with respect to heavy rainfall seems to be important, but equally, the condition and properties of the soil surface, and whether at any particular site they are modifiable by burning or not, is crucial. Very organic soils, or those which have the potential to become water-repellent at high temperatures may be the most likely to erode after fire. Local evidence points to the conclusion that accidental burns at sites
previously protected from fire for several decades, especially forested areas, are more likely to suffer catastrophic soil losses. Grassland in which regular fires, every few years or so, have been a natural ecological process for hundreds, or even thousands of years, do not seem to be particularly susceptible to large, burn-induced soil losses, perhaps because the soils have evolved under fire conditions, and have therefore found an equilibrium with the process.
6.5.3 Soil CharacteristicsInternational work shows unequivocally that soil properties are highly influential in determining whether degradation occurs at all, and if it does, then in what quantities. Soil chemistry, particle size distribution and structure all play a role in determining soil susceptibility to non-erosive degradation, but the bulk of information deals with soil erosion.
Soil erodibility - the susceptibility of soil to erosion - is a critical parameter in soil loss analysis. Yet it is a complex variable, not only because it depends on other soil characteristics, but also because it varies with time and other conditions. For example, soils became more erodible with time under ridged pineapple cultivation in the Eastern Cape, since this method of cultivation changed the values of certain soil properties (Boucher 1991).
On the basis of laboratory experiments conducted in the early 1950's Bosazza (1953) believed that erodibility by water was dependent on organic matter content, and the balance between kaolinite, illite and montmorillonite in the soil.
In various ways others have suggested that soil chemistry, insofar as it controls dispersiblity, is a significant factor. Variations in sediment yield between sub-catchments of the Orange river were due to the presence of sodic soils and valley fills in higher sediment-producing regions west of Lesotho (Rooseboom and Harmes 1979). Van Rheede van Oudtshorn (1986, 1988) believed excessive soil erosion in the Bossieslaagte basin, east of Aliwal North, was due to dispersiblity caused by the presence of monovalent cations of sodium, potassium, and magnesium, in association with the divalent cations of calcium in the soil. Stern's (1991) laboratory study of erodibility in kaolinitic and illitic soils showed that addition of phosphogypsum reduced soil losses from most kaolinitic soil types, but the effect was most pronounced on dispersible soils.
Soil texture is recognised as important in some instances. Coarser, sandy soils were more permeable and less erodible than others in the Orange catchment (Rooseboom & Harmes 1979), and Smithen (undated) observed that parent material in South Africa affects soil texture, and therefore erodibility. For example, soils on Eastern Transvaal basalts and rhyolites are coarser and, therefore, less erodible than Orange Free State soils formed on Karoo sediments.
Although local researchers have not succeeded in developing a soil erodibility index for South African conditions, some have worked with Wischmeier and
88
Smith's (1978) K factor. Watson & Poulter (1987) used measured data from run-off plots to compare a number of established erodibility indices with field erodibility of some Drakensberg soils. They concluded that the K factor, as determined by Wischmeier and Smith's (1978) nomograph, was a better predictor of field erodibility than aggregate stability measured in two different ways - % water stable aggregates >3,5 mm, and the water drop test. For many South African soils K factor values reduce below the surface (Smithen, undated b), and soils become more resistant to erosion with depth. In KZN, Platford (1982) actually measured K values by re-calculating soil loss figures from bare fallow run-off plots under simulated rainfall. On comparing the results with predictions derived from the Wischmeier nomograph he found fairly good correspondence, with only the Cartref and Bonheim Series showing wide, unexplained discrepancies.
Rooseboom et al. (1992) developed a simplified erodibility map of the whole country based on particle size distributions (Figure 6.4). Analysis of dam sediments showed that main contributors to sediment yields were clay, silt and very fine sand fractions. Using this as the main criterion they extracted the requisite information from unpublished work by Verster (1991) and a series of published and unpublished land type maps prepared by the Soil and Irrigation Research Institute, Pretoria.
Figure 6.4. Relative soil erodibility categories for South Africa (after Rooseboom et al. 1992).
6.5.4 Slope
Despite being mentioned in passing by many researchers, slope/soil loss relationships have not formed a major research focus in South African work. We have been content to accept the almost universal dictum that erosion increases with slope length and gradient, yet the small amount of local analysis that has taken place suggests that it is not quite so simple. For example King (1951), Liggit (1988) and Cobban and Weaver (1993) all found gullying to occur below, rather than above critical slope angles, and it was rarely evident on gradients greater than 10o
(15%).
Experimental work shows that the influence of slope is complex, and is strongly interrelated with land treatment and ground cover. Snyman and Van Rensburg (1986) found slope steepness to be irrelevant in determining soil losses from simulated rainfall under various successional stages of natural veld vegetation, but Menne’s (1959) conclusions were different. He reported results from two sets of run-off plot experiments, one at 2,4o (3,75%) and the other at 4,4o (7%). The effect of slope on soil loss varied immensely with land use and vegetation cover. Slope increases had almost no effect on erosion from bare, untilled ground, sown grass, and grazed pasture with a winter burn. However, on bare tilled ground, and bare tilled with added organic matter the effect was enormous, and soil loss in each case increased by a factor in excess of 300, although slope had only doubled. Fertilised maize also suffered significant increases. When vegetal cover is dense the explanation is obvious, since thick vegetation will protect the surface under almost any circumstances, but it is more difficult to understand why bare, untilled ground should suffer no significant effect, yet erosion on tilled land is greatly influenced by gradient. Menne explains this by increased potential for particle transport by rainsplash once the ground surface is broken up by tilling. Stern (1991) observed that crusting or seal development, common after rainfall in certain soils only offered protection on gentle slopes. Steep slopes were subject to seal removal and subsequent erosion.
6.5.5 RainfallA large quantity of South African run-off plot data has accumulated in the country over the last 50 years or so, and many projects have monitored natural rainfall as one of the main variables. Notwithstanding this, reports or published information concerning fundamental research on the links between rainfall and soil losses are few in number, and although some work has linked soil losses to certain rainfall parameters in specific situations (for example Barker 1985, Garland 1988) no serious effort has been made to develop a national or regional rainfall erosivity index. South Africans have generally been content to accept existing indices as satisfactory.
Smithen and Schulze (1981) found the EI30 index (Wischmeier & Smith 1978) to be significantly correlated at the 0.01 level with soil losses from a number of weed-free bare fallow plots in the Orange Free State and Pretoria, and most organisations and research institutions agree that it is a fair reflection of the rainfall-soil loss relationship in the country. However there are other indications that it may be inappropriate in some circumstances. Schieber (1983) showed that distribution of EI30 values did not correspond to the location of erosion in parts of the Karoo and the KZN Midlands, one reason being that the index does not include all rainfall in all events. Run-off plot data from Kamberg, in the Drakensberg, led Garland (1987) to conclude that EI30
could not predict soil losses from burnt grasslands, and Weaver (1989) found a negative correlation between EI30
89
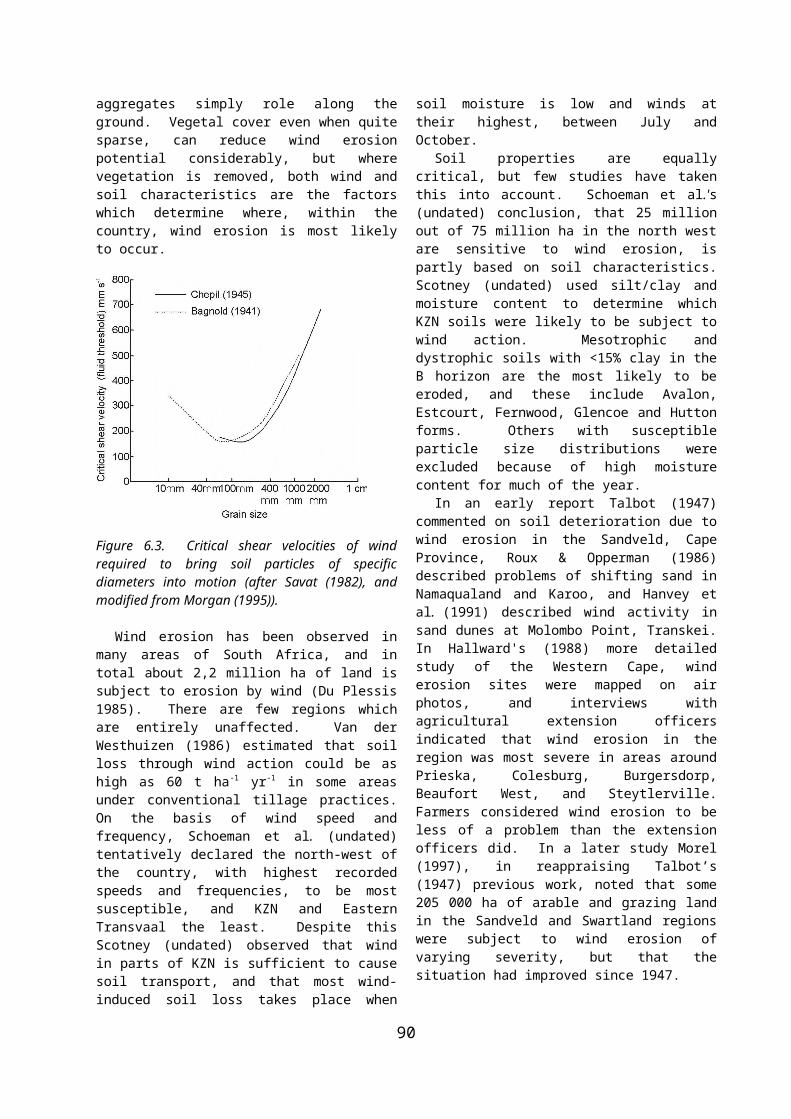
erosivity and erosion severity in the Ciskei, possibly due to the stronger influence of other variables like soil quality, or to the influence of extreme events.
The calculation of EI30 for the whole country is hampered by sparse distribution of rainfall stations, especially those which can record hourly intensity. However Smithen (1981) found that the index was statistically related to daily rainfall totals, and was able to develop a series of iso-erodent maps for the country based on estimated rather than measured EI30 values (Figure 6.5). South African erosivity is quite low by world standards, highest mean annual erosivity (>500 units yr-1) being recorded in the eastern Northern Province and
Mpumalanga and parts of KZN. Large sections of the Free State, Northern Cape, Gauteng and the North West have annual amounts of less than 250.
Figure 6.5. Mean annual rainfall erosivity for the
whole country, based on EI30 units (after Smithen & Schulze 1982).
Figure 6.6. Annual erosivity for the whole country, for the period November 1994 to October 1996, based on the REI units for the whole country (modified from Seuffert et al. 1999).
Although Weaver (1989) felt that extreme rainfall events with long return periods could be important, the role is difficult to assess from local work. Looser (1985) considered erosional responses to Cyclone Demoina - an extreme event, which occurred in 1984, in the Mfolozi catchment, KZN. Comparative air photo analysis showed that although river bank erosion had taken place during the ensuing flooding, only two out of four study areas showed increased land surface erosion.
Most recently, Seuffert et al. (1999) developed the REI (rainfall erosivity index) for South Africa. Testing of the EI30 and other existing indices against their own erosion map of the country, they showed that none reflected accurately the occurrence of erosion. They created a single index, which incorporated all structural elements of rainstorms hitherto used separately in the
other indices. This performed well when compared with their national erosion map. From this they mapped the REI for the whole country (Figure 6.6)
Figure 6.7. Distribution of sediment yield (after Rooseboom 1978).
Figure 6.8. Average rates of denudation (after Le Roux 1990).
90
Nevertheless a note of caution in interpreting these results should be introduced here. In the most recent work available on national sediment yields Annandale (1988) and Rooseboom et al. (1992) concluded that any quantitative sediment yield map of the whole country would contain inaccuracies, due to the geographic diversity and the restricted availability of input data. Garland (1995) has recently summarised erosion activity in South Africa using general patterns from other studies (see figures 6.7, 6.8 & 6.9).
During the last two years Seuffert et al. (1999) stereoscopically interpreted a sample of 600 aerial photographs of scales between 1:30 000 and 1: 60 000 of the whole country, and after a ground-truthing exercise produced national maps of linear (gully) erosion, diffuse (surface) erosion and total erosion (Figure 6.10). The erosion distribution they depict is broadly similar to that obtained by other methodologies described above, although discrepencies are evident at a more detailed level.
Figure 6.9. Regions of high and low erosional activity (From Garland 1995, based on Rooseboom’s (1978) map of sediment yields (figure 6.7), and Le Roux’s (1990) map of denudation (figure 6.8)).
Figure 6.10. Total erosion over South Africa. Mapping units represent the total percentage of eroded land present on sample air photos (modified from Seuffert et al. 1999).6.6 Agricultural Extension Officers’ Per-ceptions of Soil Degradation: Workshop Results
6.6.1 A General Appraisal
What follows are the results of 34 workshops held throughout South Africa during 1997 and 1998. More than 450 participants, mostly agricultural extension officers and resource conservation technicians were asked about their perceptions of soil degradation in South Africa. The methodology, used in the workshops, is described in detail in Chapter 2.
The main types of soil degradation considered in the workshops are shown earlier in Table 6.5. They include both erosive and non-erosive forms of soil degradation. During the workshops with the agricultural extension officers and resource conservation technicians, participants were asked to assess each land use type in terms of the main types of soil degradation affecting them. Their perceptions are reflected in Figure 6.11. For the croplands, sheet erosion and to a lesser extent, rill, gully and donga erosion was the dominant form of soil degradation, especially in the northern and eastern parts of the country (Figure 6.11). The loss of topsoil through wind erosion was perceived as a problem of the croplands in Namaqualand and in the more central parts of South Africa where overblowing also occurred in a few districts. Salinization occurred predominantly in croplands in the more arid western parts of the country, while in only a few scattered districts in Mpumalanga was it suggested that acidification was the most important soil degradation problem of the district.
Sheet erosion is the most important form of soil degradation on the grazing lands in the country, occurring in a wide band from the southwest to the northeast (Figure 6.11). Rill, gully and donga erosion is the most important type of soil degradation on the grazing lands of the eastern parts of the country, especially along the escarpment and coastal plain, while wind erosion occurs predominantly in the northwestern parts of South Africa. Extreme wind erosion results in overblowing in the Vryburg district of the North West Province.
Although the participants felt relatively poorly qualified to judge the main types of soil degradation in commercial forest plantations and conservation areas their results reflect the same patterns that are evident for the grazing lands (Figure 6.11).
The main types of soil degradation in the settlement areas are again sheet erosion, rill, gully and donga erosion and wind erosion, and the same broad patterns apply as for the grazing lands (Figure 6.11). There are, however, many more districts in which insignificant levels of soil degradation occur. This is exclusively in the commercial magisterial districts as nearly all of the
91
settlement areas in the communal districts reflect some measure of soil degradation. Soil mining, for building and construction purposes, is perceived as the most important form of soil degradation in the settlement areas of Boshof in the Free State.
There are a wide range of soil degradation types on lands demarcated as “Other” (Figure 6.11). This category refers predominantly to mining sites and participants felt that water, wind, and non-erosive forms of soil erosion are all important in these areas. Soil degradation resulting from soil pollution, in the magisterial districts of Ventersdorp, Brits and Mankwe, is especially alarming.
6.6.2 Occurrence and Extent of the ProblemThe methodology used in assessing the occurrence and extent of soil degradation in South Africa during the course of the 34 consultative workshops has already been outlined in Chapter 2. In Figures 6.12-6.17 the severity of soil degradation (a combined measure of the degree and extent of soil degradation), the rate of soil degradation and an index of soil degradation (calculated as the severity plus the rate multiplied by the % area of each land use type) for each of six land use types are shown. The results are further summarized for each province and for commercial and communal districts separately in Tables 6.6-6.8. Several non-parametric Mann-Whitney U-tests were performed to test for significant differences in ranked scores for the severity, rate and soil degradation index between commercial and communal areas.
For the croplands, the severity of soil degradation is highest in the Northern Province, the North West Province and KwaZulu-Natal and lowest in the Western Cape (Table 6.6; Figure 6.12). The severity of cropland soil degradation was significantly higher for communal areas than for commercial areas (n = 367, z = -4.1, p<0.0001). Rates of degradation on the croplands are perceived to be decreasing in the Free State, Gauteng and the Western Cape, staying the same in KwaZulu-Natal, Mpumalanga and the Northern Cape and increasing in the Northern Province, the North West Province and in the Eastern Cape (Table 6.7; Figure 6.12). There is a dramatic and highly significant difference in the rate of degradation between commercial and communal areas (n = 367, z = -11.2; p<0.0001. Cropland soil degradation is generally perceived to be decreasing in the commercial areas and increasing in the communal areas. The main reasons provided for the decrease in the rate of cropland soil degradation are: Department of Agriculture staff have played an
active role in planning farms and educating farmers about best practices over many years and the results in the commercial areas have paid off;
State subsidies for soil conservation works have improved land use practices;
The Agricultural Resources Conservation Act of 1983 has been applied very strictly in some
provinces with relative success in the commercial areas but not in the communal areas;
Active farmer study groups which enable farmers to learn from and educate each other and improve general management expertise levels;
Better cultivation methods including contour ploughing, minimum tillage, soil preparation and mulch tillage, run-off control, better irrigation methods, including drip irrigation;
Abandonment of croplands as a result of economic considerations, degraded underground water resources, and urbanisation trends;
Increased rates of cropland soil degradation were explained by workshop participants as resulting from: Absence of soil conservation works and run-off
control. Poor maintenance of conservation structures;
Poor cultivation practices such as land being abandoned or left exposed for lengthy periods following ploughing or harvesting, over-irrigation and water-logging, persistent monoculture, lack of equipment and training, absence of grass strips, shallow ploughing;
Incorrect selection of sites for cultivation, often on steep slopes or highly erodible soils, next to dongas;
Historical role of betterment planning often exacerbated the problem as people were generally not consulted about the suggested changes;
No regulation or law enforcement where “The freedom of destruction prevails”.
The soil degradation index for South Africa’s cropland areas is highest for the Northern Province, the Eastern Cape and the North West Province and lowest for the Western Cape, the Northern Cape and the Free State (Table 6.8, Figure 6.12). The soil degradation index for croplands was significantly higher in communal areas than commercial areas (n = 367; z = -10.4; p<0.0001) and differed by a factor of nearly four between the two land tenure systems.
92
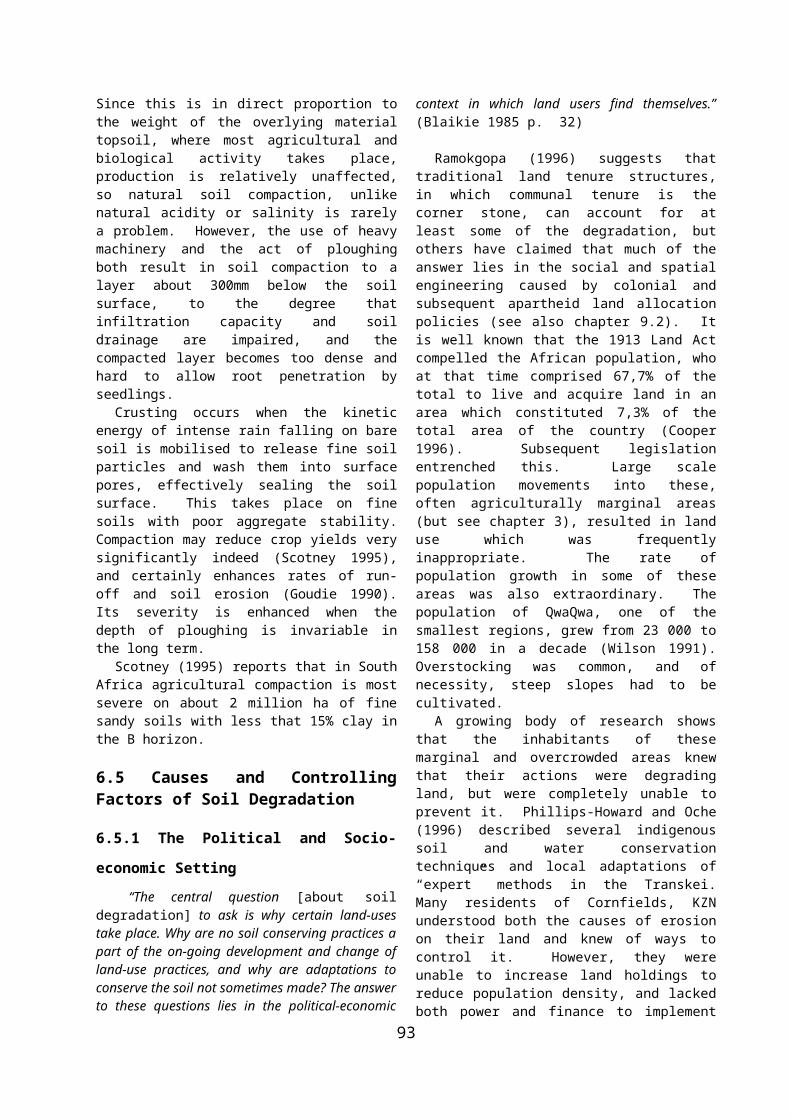
Figure 6.11. The main type of soil degradation in the croplands (top), rangelands or veld (middle) and commercial forest areas (bottom).
93
Soil Degradation on CroplandsAcidificationOverblowingWind ErosionInsignificantSalinizationRill, Gully, Donga ErosionSheet Erosion
Soil Degradation on VeldOverblowingWind ErosionInsignificantRIll, Gully, Donga ErosionSheet Erosion
Soil Degradation on ForestryInsignificantRill, Gully, Donga ErosionSheet Erosion
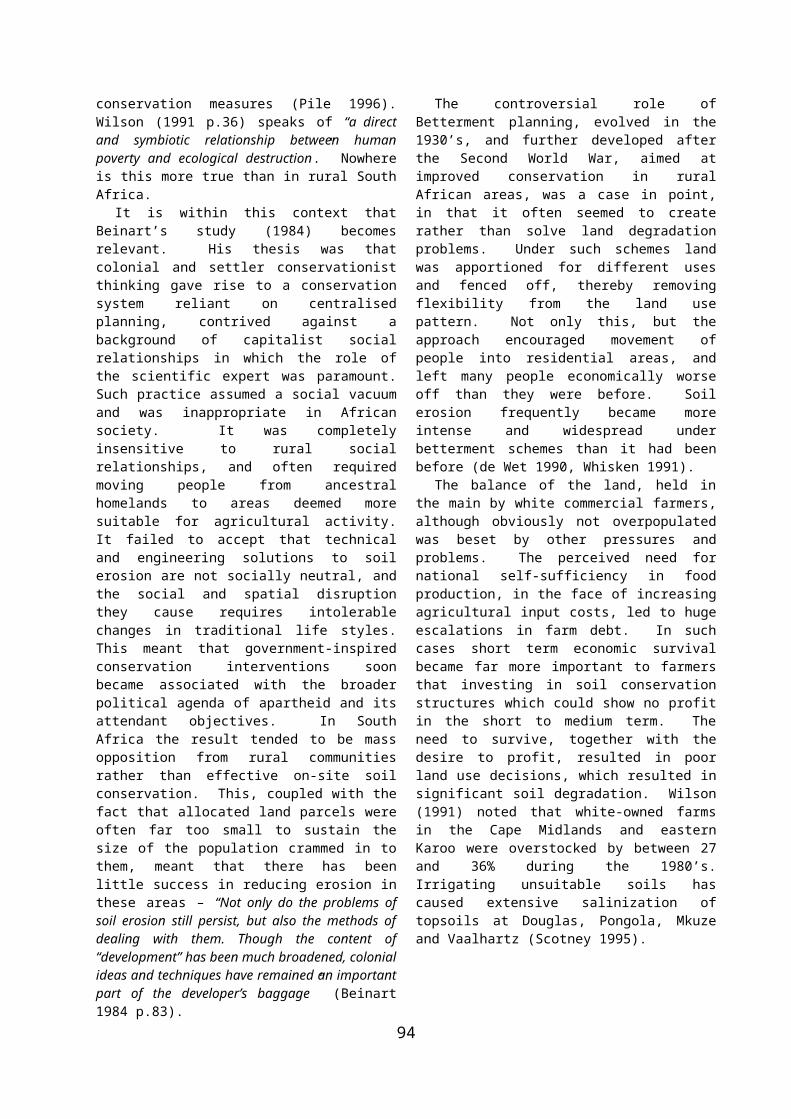
Figure 6.11 (continued). The main type of soil degradation in conservation areas (top), settlements (middle) and “other” land use types (bottom).
94
Soil Degradation on Conservation AreasWind ErosionInsignificantRill, Gully, Donga ErosionSheet Erosion
Soil Degradation on SettlementsWind ErosionInsignificantSoil MiningRill, Gully, Donga ErosionSheet Erosion
Soil Degradation on OtherOverblowingWind ErosionInsignificantSoil PollutionRill, Gully, Donga ErosionSheet Erosion
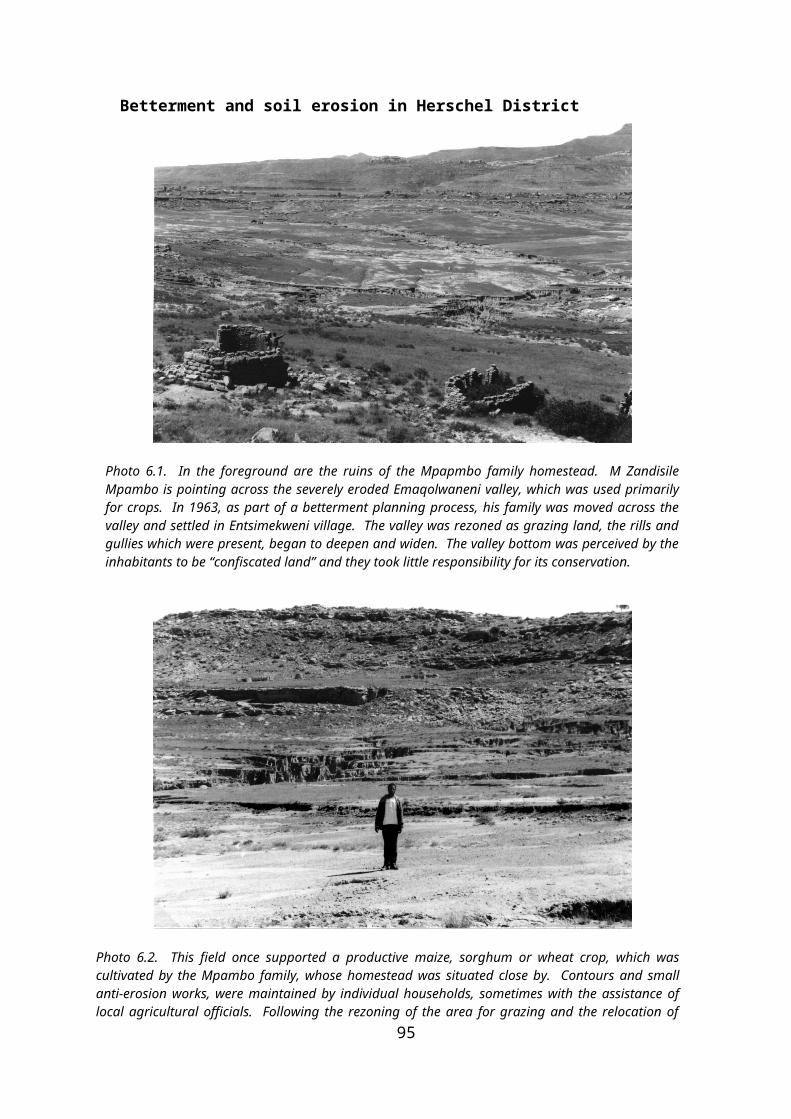
Table 6.6. The mean values for each province and for commercial and communal areas for the severity (degree and extent) of soil degradation in each Land Use Type (N=367 magisterial districts). The information is based on the perceptions of Agricultural Extension Officers and Resource Conservation Technicians gathered during a series of 34 consultative workshops held during 1997 and 1998. Values range from 0 (no erosion), 1 (least severe) to 4 (most severe) (see Chapter 2).
Province Number of magisterial
districtsThe severity of soil degradation for each Land Use Type
Croplands Veld Forests Conservation Settlements Other
Eastern Cape 78 1.3 1.6 0.2 0.1 1.1 0.0Free State 51 1.3 1.4 0.0 0.2 1.1 0.1Gauteng 22 1.3 0.9 0.0 0.3 1.0 1.0KwaZulu-Natal 51 1.5 2.0 0.8 0.5 1.5 0.2Mpumalanga 30 1.4 1.2 0.5 0.3 1.0 0.7Northern Cape 26 1.3 1.3 0.0 0.2 1.2 0.4Northern Province 39 1.6 1.7 0.1 0.6 1.8 0.4North West 28 1.7 1.3 0.0 0.5 1.5 0.9Western Cape 42 1.2 1.2 0.2 0.5 0.5 0.2
Commercial districts1 262 1.3 1.3 0.2 0.3 0.9 0.4Communal districts 105 1.6 1.9 0.3 0.3 1.8 0.1
1 A district is considered commercial if more than 50 % of its area is managed under a commercial land tenure system and communal if more than 50 % of its area is managed under a communal land tenure system. This convention is used for all tables in this chapter.
Table 6.7. The mean values for each province and for commercial and communal areas for the rate of soil degradation in each Land Use Type (N=367 magisterial districts). The information is derived from a series of consultative workshops held during 1997 and 1998. The rate of degradation ranges from –2 (moderately decreasing) to +2 (moderately increasing) (see Chapter 3) and concerns the period 1987-1997.
ProvinceNumber of magisterial
districtsThe rate of soil degradation for each Land Use Type
Croplands Veld Forests Conservation Settlements Other
Eastern Cape 78 0.6 0.6 0.2 0.0 0.7 0.0Free State 51 -1.0 -0.6 0.0 -0.1 0.2 -0.1Gauteng 22 -0.1 0.1 0.0 0.0 0.0 0.0KwaZulu-Natal 51 0.0 0.9 0.1 -0.2 0.6 0.0Mpumalanga 30 0.0 0.1 0.2 -0.1 0.3 -0.1Northern Cape 26 0.0 -0.5 0.0 -0.2 0.7 0.0Northern Province 39 0.3 1.0 -0.1 -0.1 0.9 0.0North West 28 0.8 0.0 0.0 -0.3 0.9 -0.1Western Cape 42 -0.2 -0.1 0.0 -0.2 0.2 0.2
-0.7Commercial districts 262 -0.4 -0.2 0.0 -0.1 0.3 -0.01Communal districts 105 0.9 1.3 0.1 -0.1 1.1 0.01
95
Table 6.8. The mean values for each province and for commercial and communal areas for the index of soil degradation calculated as the severity plus the rate multiplied by the % area of each Land Use Type (N = 367 each magisterial districts). The information is derived from a series of consultative workshops held during 1997 and 1998.
ProvinceNumber of magisterial districts
An index of soil degradation for each Land Use Type and the total for each province
Cropland Veld Forests Conserv. Settlements Other Total
Eastern Cape 78 50 116 3 0 31 0 200Free State 51 4 36 0 1 6 1 48Gauteng 22 31 24 0 1 50 8 112KwaZulu-Natal 51 28 181 14 2 29 0 254Mpumalanga 30 38 56 14 13 20 2 143Northern Cape 26 7 80 0 1 2 0 90Northern Province 39 59 144 1 2 47 1 254North West 28 44 72 0 1 29 2 148Western Cape 42 14 56 1 1 3 2 77
Commercial districts 262 17 68 4 2 9 1 102Communal districts 105 67 159 4 1 60 1 292
The severity of soil degradation in the veld or grazing lands was highest in KwaZulu-Natal, the Northern Province and the Eastern Cape and lowest in Mpumalanga, Gauteng and the Western Cape (Table 6.6, Figure 6.13). It was also significantly higher in communal areas than commercial areas (n = 367, z = -6.8, p<0.0001).
In general, the rate of soil degradation in the veld was perceived to be decreasing in the Free State, the Northern Cape and the Western Cape and increasing in most other provinces, especially in the Northern Province, KwaZulu-Natal and the Eastern Cape (Table 6.7, Figure 6.13). There were highly significant differences between commercial and communal areas (n = 367; z = -12.6; p<0.0001) where the rate of soil degradation on the veld is perceived as being an order of magnitude greater. The most important reasons given for there being a decrease in the rate of soil degradation on the grazing lands over the last 10 years were: Stock numbers have been reduced to bring them in
line with carrying capacity estimates and extension workers have been involved in the accurate assessment of individual farms;
Various state schemes such as the grass conversion scheme, the stock reduction scheme and the drought subsidy scheme, have benefited the veld;
Higher amount of rainfall over the last 10 years has improved vegetative cover and reduced run-off and soil erosion;
Better education and agricultural extension programmes as well as farmer study groups and Soil Conservation Committees have raised the level of soil and veld conservation awareness;
Improved veld management programmes including longer resting cycles, rotational grazing systems,
and increased planted pasture area which has reduced the pressure on the veld;
Farm size has increased which has facilitated lower stocking rates;
An improvement in the meat price over much of this period has meant that commercial farmers have been able to survive with fewer animals;
A shift to “farming” with wild animals has been beneficial for the levels of soil degradation on the grazing lands;
The main reasons provided for the increased levels of soil degradation in several (usually communal) magisterial districts were: An overestimation of the carrying capacity of the
region resulting in loss of vegetative cover and increased soil erosion;
Increase in stock numbers because more people require more livestock. People are investing retrenchment packages from the mines in livestock;
A shift in animal breed (e.g. from karakul to dorper) has exacerbated the impact of grazing and increased soil erosion levels;
Poor education programmes concerning natural resource management;
No infrastructure and neglect or destruction of existing infrastructure, especially fencing;
Inappropriate veld management programmes such as incorrect burning regimes;
Footpaths from rural villages up mountain paths cause erosion channels;
Deforestation on the grazing lands has increased levels of soil erosion
Isolated recent flooding events have led to localized problems.
96

97
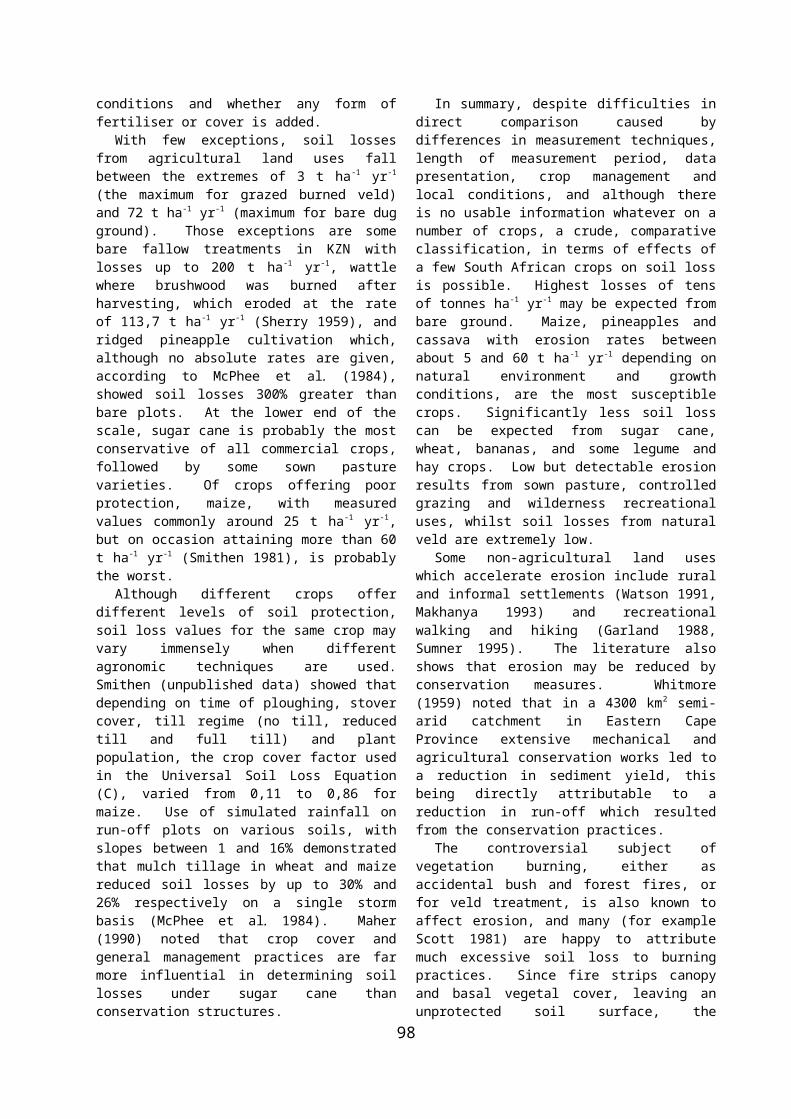
Figure 6.12. The severity of soil degradation, rate of soil degradation and an index of soil degradation for the croplands of South Africa.
98
SeverityInsignificantLightModerateSevere
RateModerately DecreasingSlowly DecreasingNo ChangeSlowly IncreasingModerately Increasing
Soil Degradation Index in Croplands-2 - -1 Std. Deviation-1 - 0 Std. Deviation0 - 1 Std. Deviation> 1 Std. Deviation
Figure 6.13. The severity of soil degradation, rate of soil degradation and an index of soil degradation for the grazing lands or veld of South Africa.
99
SeverityInsignificantLightModerateSevere
RateModerately DecreasingSlowly DecreasingNo ChangeSlowly IncreasingModerately Increasing
Soil Degradation Index in Veld Areas-2 - -1 Std. Deviation-1 - 0 Std. Deviation0 - 1 Std. Deviation> 1 Std. Deviation

The soil degradation index for the grazing lands is highest for KwaZulu-Natal, the Northern Province and the Eastern Cape and lowest for Gauteng, the Free State and the Western Cape (Table 6.8, Figure 6.13). However, in isolated areas in the Western Cape, especially in the Little Karoo, soil degradation appears particularly high. There is also a broad band stretching from Jansenville magisterial district in the south east to Gordonia in the north west, in which soil degradation appears significantly higher than the mean value. Although the severity of degradation appears light, the rate of degradation is increasing here. This has resulted in a relatively high soil degradation index on the grazing lands of these districts. Isolated magisterial districts in the North West Province, the Free State, Mpumalanga, and Gauteng also possess relatively high levels of soil degradation on the veld. These areas were usually in the communal districts. In general, levels of soil degradation were more than twice as high in the communal than in the commercial magisterial districts (n = 367; z = -9.4; p<0.0001).
Workshop participants felt that relative to most other land use types, the severity of soil degradation in the commercial forestry plantations and conservation areas and state lands was low (Table 6.6). It was significantly higher for forestry plantations in magisterial districts managed under a communal land tenure system (n = 367; z = -2.2; p<0.05) but not for conservation areas and state lands (n = 367; z = -1.3; p = 0.178) (Figure 6.14 & Figure 6.15).
The rate of soil degradation in these two land use types was also perceived generally to be little different from zero (Table 6.7; Figure 6.14 & Figure 6.15). There were no significant differences between commercial and communal areas for forestry (n = 367; z = -0.7, p = 0.479) and conservation areas (n = 367; z = -0.9, p = 0.3931)
The soil degradation index for the forestry and conservation areas is greatest for KwaZulu-Natal, Mpumalanga and to a lesser extent the Eastern Cape (Table 6.8; Figure 6.14 & Figure 6.15). There were no significant differences between the commercial and communal areas for forest (n = 367; z = -1.2; p = 0.2185) and for conservation areas (n = 367; z = -1.3; p = 0.2025).
The severity of soil degradation in the settlement areas was highest for the Northern Province, the North West Province and KwaZulu-Natal and lowest for the Western Cape (Table 6.6, Figure 6.16). Isolated districts in the Eastern Cape and Mpumalanga also possess moderate to high levels of soil degradation. The severity of soil degradation in communal areas was twice that for commercial districts (n = 367; z = -9.3; p<0.0001).
The rate of soil degradation in the settlement areas is perceived to have increased in all of the provinces except Gauteng where it appears not to have changed over the last 10 years (Table 6.7, Figure 6.16). There was an order of magnitude difference between the commercial and communal areas (n = 367; z = -9.1;
p<0.0001). The most important reasons provided by workshop participants for a decrease in the rate of soil degradation in the settlement areas were: Better town planning and coordinated layout of
settlement areas leading to better run-off control and drainage systems;
Improved individual responsibility around the issue of soil degradation (e.g. planting of trees and grass in individual homesteads, repair of dongas and eroding footpaths within settlement areas)
Increases in the rate of soil degradation in the settlement areas were perceived to result from: Large influx of people to peri-urban areas where
large-scaled, unplanned settlements have occurred. This results in increased footpath erosion where humans and livestock create footpaths up and down slopes. Also, poor drainage and increased run-off leads to increased erosion, especially downstream where water accumulates;
When settlement planning has occurred it is often uncoordinated between government departments. Poorly controlled run-off and increased erosion levels can result.
Poor management of settlement areas and poor maintenance of existing infrastructure such as roads;
Deforestation in and around the settlements; The explosion in the building industry in and
around settlement areas means that people remove large quantities of top soil without any environmental or rehabilitation plans.
The soil degradation index is highest for settlement areas in Gauteng, the Northern Province and the Eastern Cape, especially in the former Transkei and Ciskei regions (Table 6.8, Figure 6.16). Isolated districts have significant problems in the North West Province and KwaZulu-Natal. The soil degradation index in the settlements is more than five times greater in the communal areas than in the commercial areas (n = 367; z = -12.8; p<0.0001).
Soil degradation in areas designated as “other” land use types generally refers to soil degradation in the mining areas. Compared to the three dominant land use types in the country (croplands, veld, and settlements), the severity of soil degradation in “other” was relatively low (Table 6.6, Figure 6.17). However, isolated districts in several provinces are cause for concern. The severity of degradation in this land use category was significantly higher in commercial, as opposed to communal magisterial districts (n = 367; z = -3.1; p<0.001).
Although there were isolated districts where the rate of degradation was perceived to have increased over the last 10 years, overall, the rate of degradation has decreased (Table 6.7, Figure 6.17). There were no significant differences between commercial and communal areas (n = 367; z = -1.4; p = 0.1496).
100
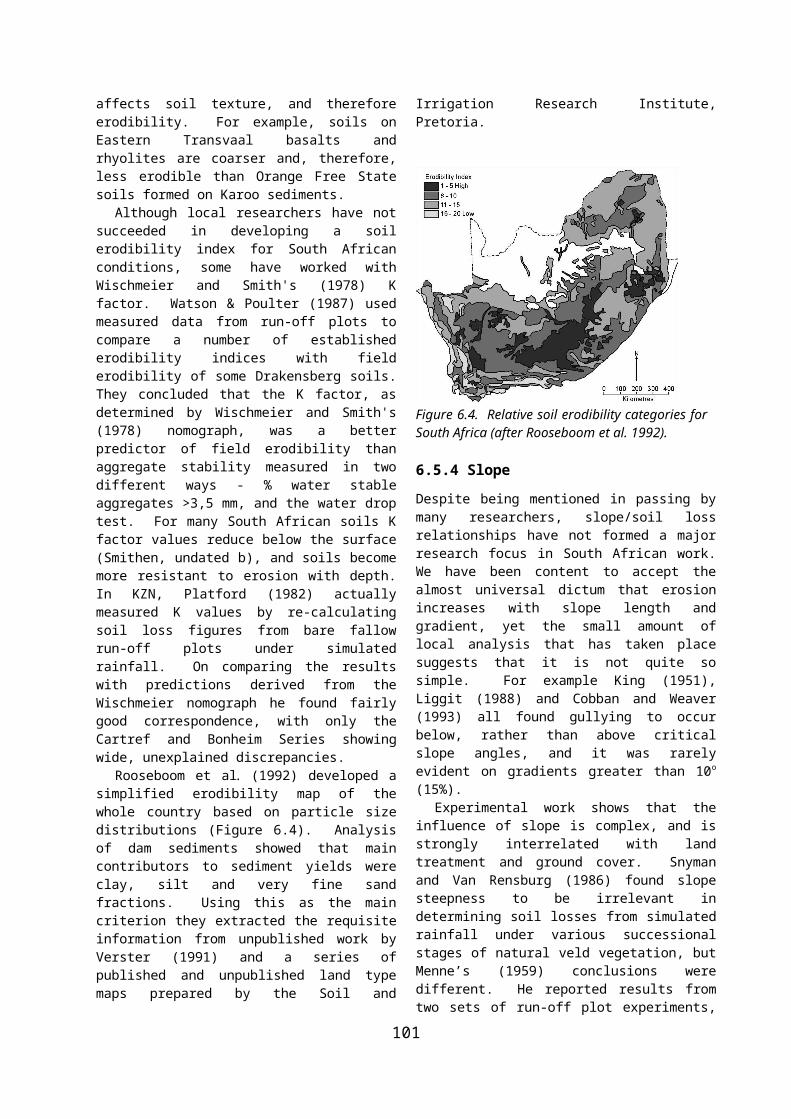
101
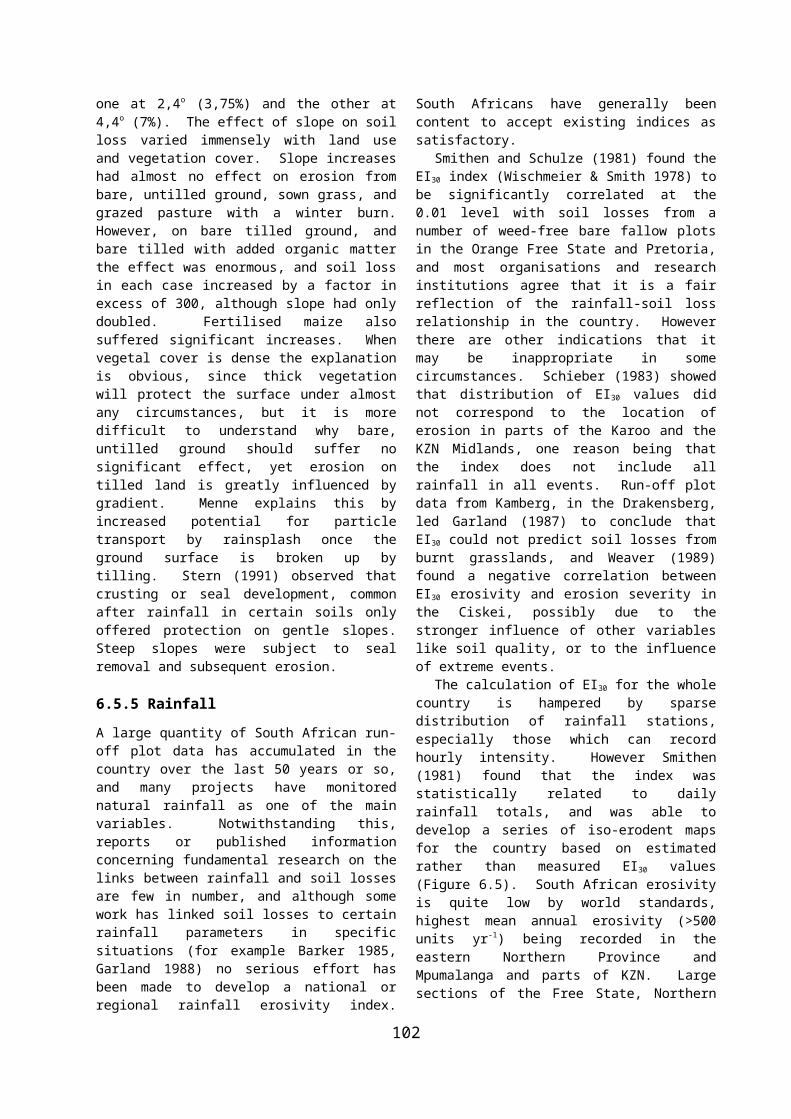
Figure 6.14. The severity of soil degradation, rate of soil degradation and an index of soil degradation for the commercial forestry areas of South Africa.
102
InsignificantLightModerate
Severity
RateSlowly DecreasingNo ChangeSlowly IncreasingModerately Increasing
Soil Degradation Index in Forestry Areas-1 - 0 Std. Deviation0 - 1 Std. Deviation> 1 Std. Deviation
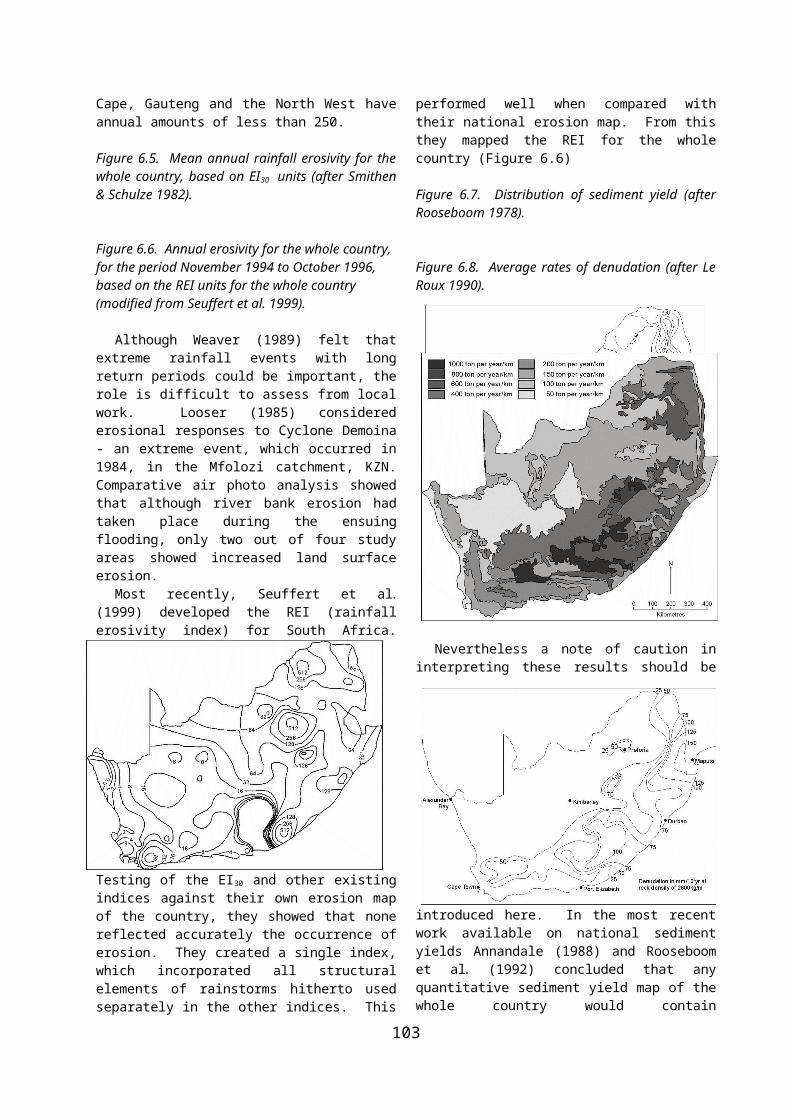
103
SeverityInsignificantLightModerateSevere
RateModerately DecreasingSlowly DecreasingNo ChangeSlowly IncreasingModerately Increasing
Soil Degradation Index in Conservation Areas-1 - 0 Std. Deviation0 - 1 Std. Deviation> 1 Std. Deviation
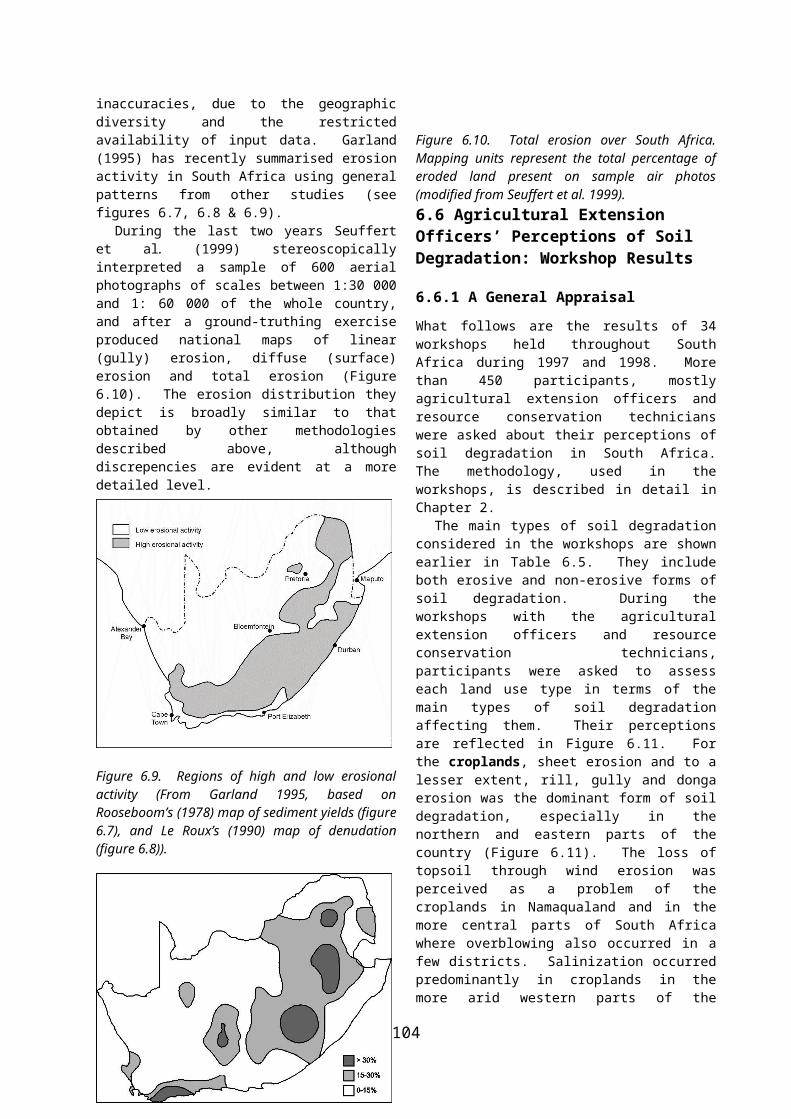
Figure 6.15. The severity of soil degradation, rate of soil degradation and an index of soil degradation for the conservation areas of South Africa.
104
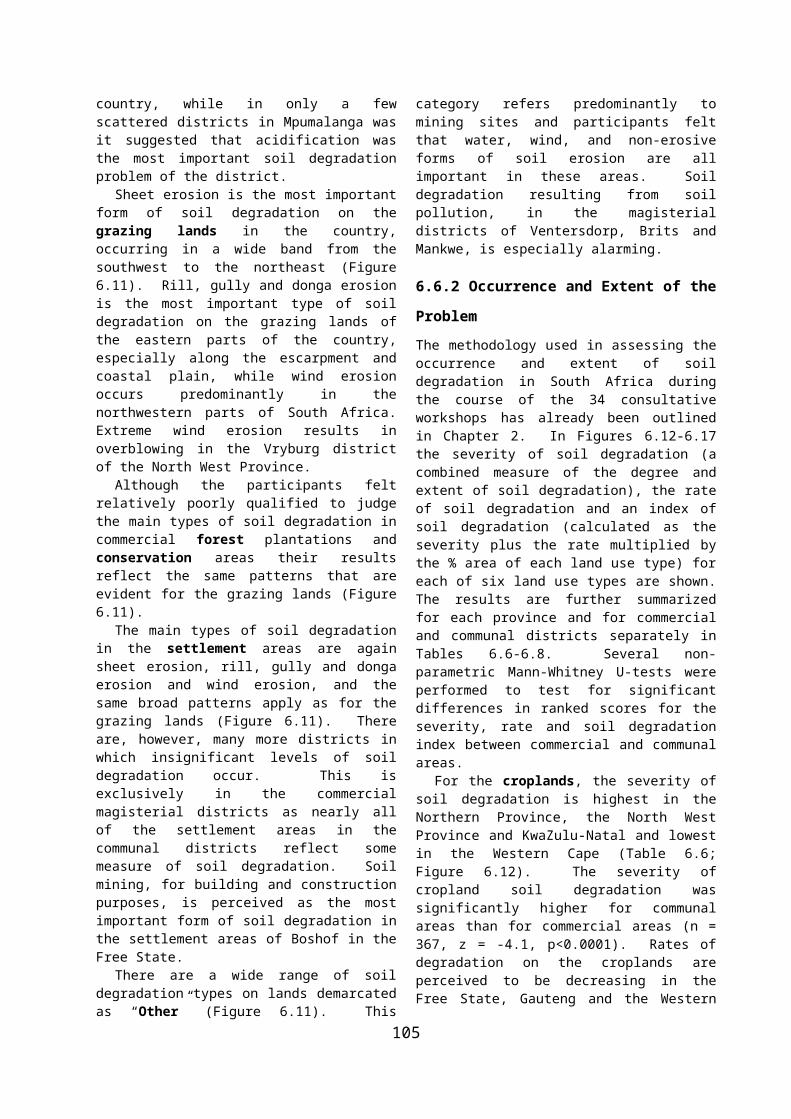
105
SeverityInsignificantLightModerateSevere
RateSlowly DecreasingNo ChangeSlowly IncreasingModerately Increasing
Soil Degradation Index in Settlements-1 - 0 Std. Deviation0 - 1 Std. Deviation> 1 Std. Deviation
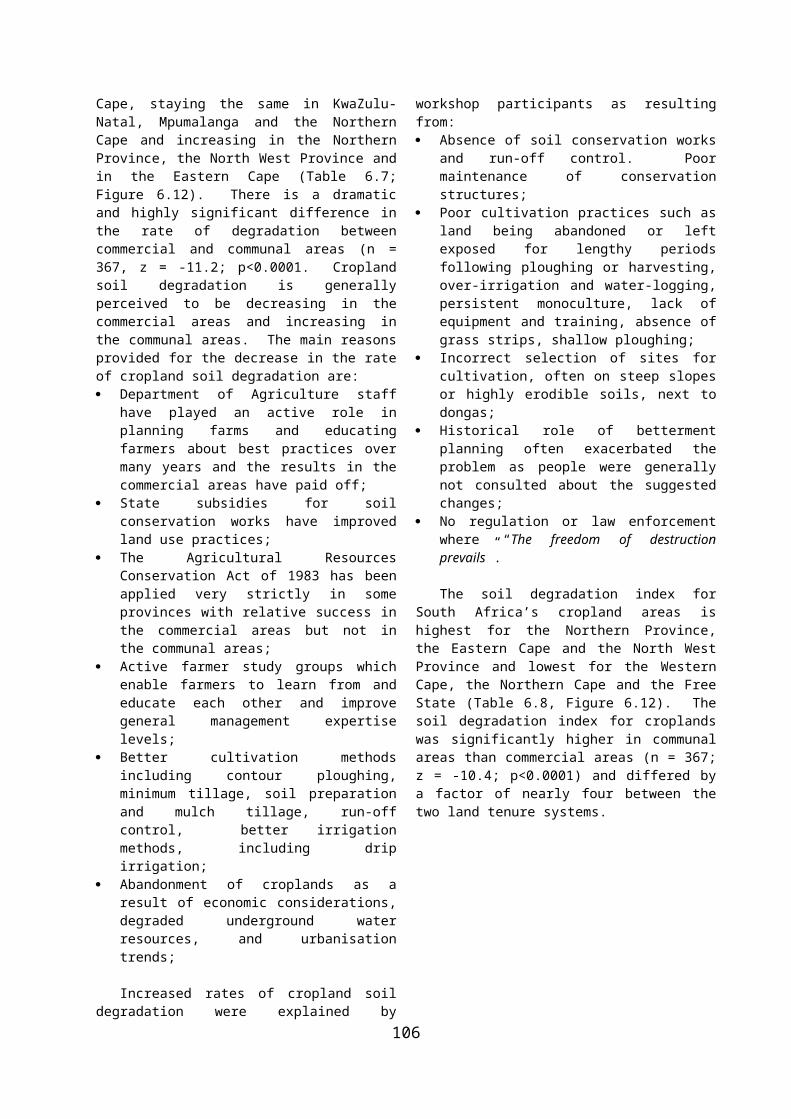
Figure 6.16. The severity of soil degradation, rate of soil degradation and an index of soil degradation for the settlement areas of South Africa.
106
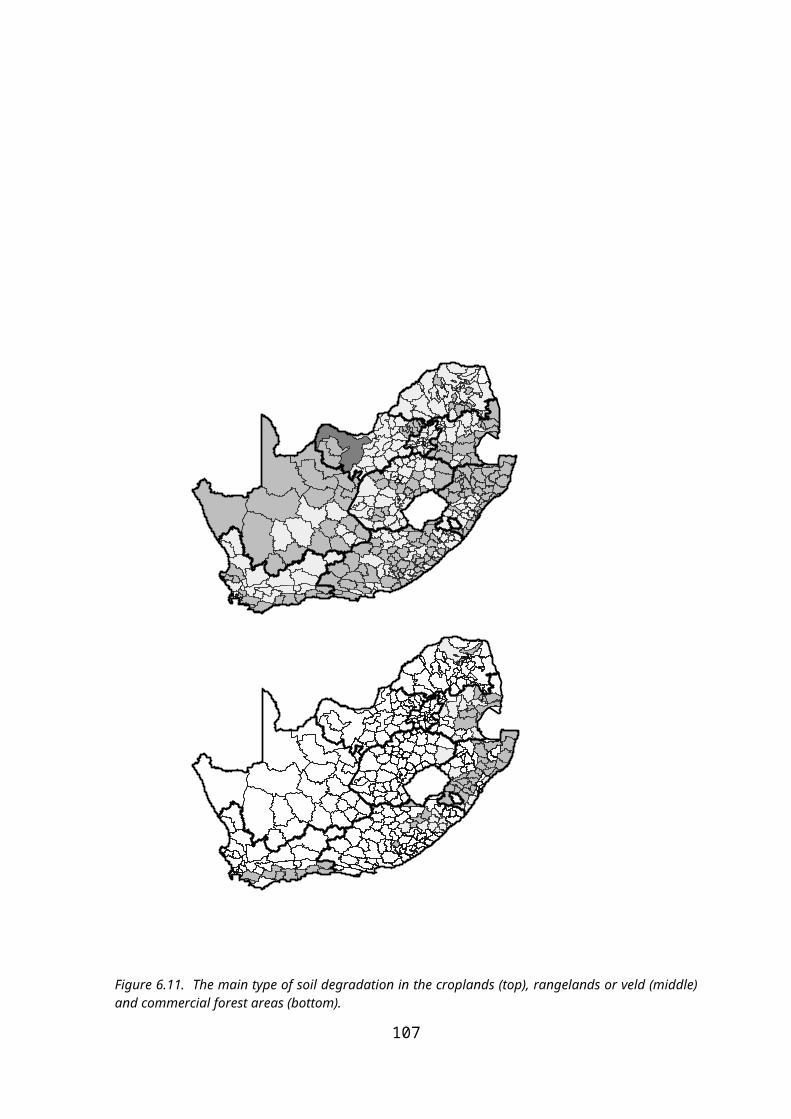
Figure 6.17. The severity of soil degradation, rate of soil degradation and an index of soil degradation for “other” land use types in South Africa.
107
SeverityInsignificantLightModerateSevere
RateModerately DecreasingSlowly DecreasingNo ChangeSlowly IncreasingModerately Increasing
Soil Degradation in Other Areas-1 - 0 Std. Deviation0 - 1 Std. Deviation> 1 Std. Deviation

Although highest for Gauteng, the soil degradation index for “other” was generally very low (Table 6.8, Figure 6.17)..
The total soil degradation index for each province and for commercial and communal districts is shown in Table 6.8. The information is also shown graphically for each magisterial district in Figure 6.18 and is expressed as the standard deviation above and below the mean.
When considered across all land use types, it is clear that soil degradation is perceived as more of a problem in KwaZulu-Natal, the Northern Province and the Eastern Cape, and as less of a problem in the Free State, the Western Cape and the Northern Cape (Table 6.8). There is an almost three fold difference between commercial and communal areas, with the total soil degradation index values being significantly higher in communal areas (n = 367; z = -12.3; p<0.0001). A broad band of magisterial districts in the central uplands of KwaZulu-Natal appears most degraded while areas on the south east coast are also perceived to exhibit high levels of soil degradation.
The eastern part of the Northern Province, consisting predominantly of the former homelands or self-governing territories also deviate significantly from the mean. Three main areas in the eastern Cape appear to have the highest levels of soil degradation. These are in the upland areas and some central coastal districts of the former Transkei, the coastal districts of the former Ciskei and Hewu near Queenstown and finally, in the western commercial magisterial districts around Graaff-Reinet, Jansenville and Somerset East comprised predominantly of dwarf karoo shrublands. Isolated magisterial districts in most of the other provinces are also perceived to exhibit relatively high levels of soil degradation. Districts with commercial as well as communal land tenure systems are represented here. The relationship between the soil degradation index and a set of 31 variables incorporating biophysical, climatic and socio-economic factors is developed further in Chapter 10.
Figure 6.18. The total soil degradation index for each magisterial district of South Africa calculated as the severity plus the rate multiplied by the % area of each Land Use Type and summed for all LUTs. The data are expressed as one or two standard deviations above and below the mean value of 156 (median = 115) and values range from –97 to 650.
108
Soil Degradation Index-2 - -1 Std. Deviation-1 - 0 Std. Deviation0 - 1 Std. Deviation1 - 2 Std. Deviation
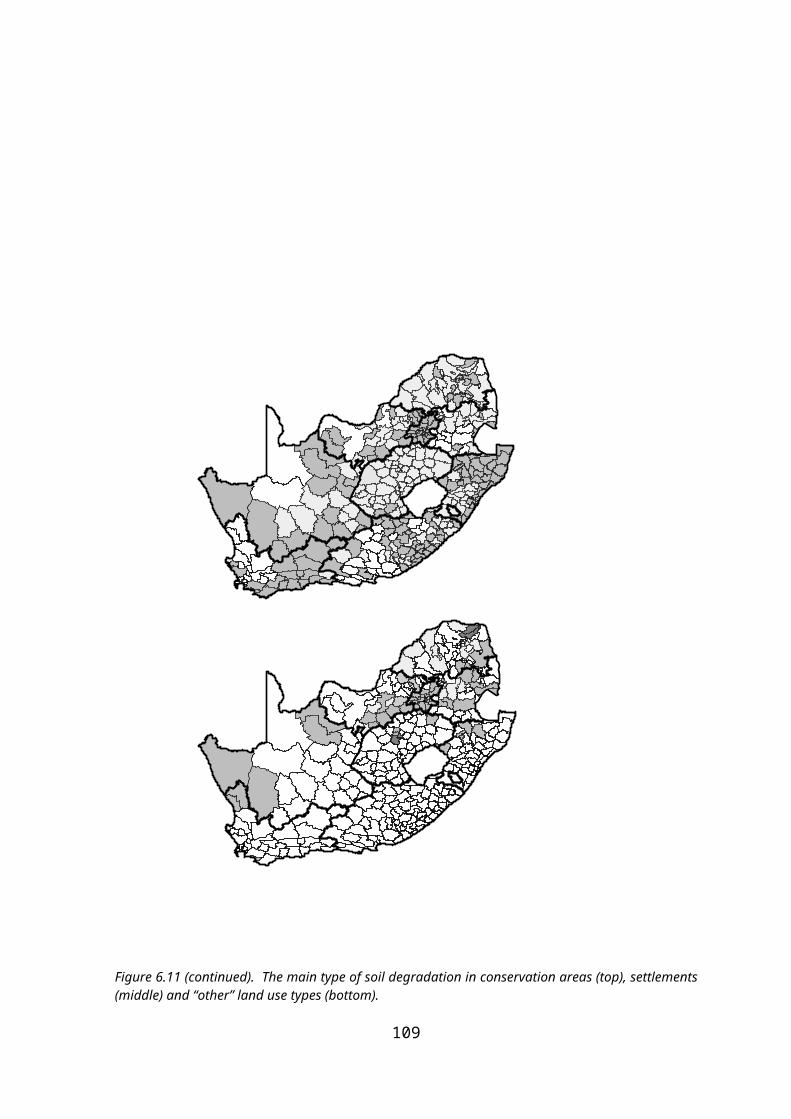
6.7 Agriculture versus science: grounds for a perceptual comparison?
The workshops with agricultural extension officers have indicated points of similarity and difference in scientific and agricultural perceptions of soil degradation. There can be little doubt that thorough exploration of these through detailed comparison, although beyond the scope of this study, would yield much useful information.
For example, our understanding of the distribution of soil degradation, always a contentious issue, would certainly benefit from further comparative analysis. The results of the degradation workshops held during this study provide new information which will be invaluable in assessing the degradation problem (Figure 6.18) , but this report also presents two corresponding sets of scientific cognitions. Figure 6.9 shows the regions of high and low erosional activity based on sediment yield estimations derived from dam sedimentation rates, and Figure 6.10 depicts regional erosional severity from interpretation of a broad sample of aerial photographs.
Although visual comparison shows a very general correspondence between the three maps – the summer rainfall area in the east of the country, with far higher mean annual rainfall, is more degraded and eroded than the drier west – the detail is vastly different. Not only do the two scientific maps vary significantly from each other at several sites, but the extension officer’s perceptions diverge from both. The scientific maps also tend to smooth over land use differences while perceptions of agricultural officers emphasise the impacts of different land use practices. They often describe communal areas as islands of degradation within a less degraded matrix of commercial areas.
How reliable then are the data derived from the perceptions of agricultural extension officers? In one comparative analysis, at a regional level of scale, significant correspondence was obtained between more empirically derived measures of soil erosion and the total soil degradation index (as defined in this study) for a magisterial district (Figure 6.19). Hill et al. (1985) used aerial photographs to measure the extent of soil erosion in each of 28 magisterial districts in the former Transkei. The soil degradation index values, derived from the workshops held in the Eastern Cape, were significantly correlated with these values (y = 6.59x+170.21; R2 = 0.386; p < 0.001).
Some of the reasons for the apparent lack of congruency between Figures 6.9, 6.10 and 6.18 may be obvious. The perceptual map is far more recent than the data on which the erosion maps is based, and includes other forms of degradation. Scientific and agricultural viewpoints of what exactly constitutes degraded land may differ. Other reasons for the discrepancies are less
clear and could only be discovered through a thorough comparative analysis.
Figure 6.19. Relationship for 28 magisterial districts in the former Transkei of the Eastern Cape, between the % area of a magisterial district that was measured as being eroded from an analysis of aerial photographs (Loxton et al. 1985) and the Soil Degradation Index derived from a several workshops in the province.
Additional points of importance that might be addressed are perceptual congruence or discord between the two groups on
degradation trends importance of relative types of degradation influence of government policy influence of land use success/failure of soil conservation measures differences in degradation between commercial and
communal areas Such an analysis would certainly build on preceding scientific and perceptual work to provide a powerful basis for policy development and strategic initiatives.
109
0
100
200
300
400
500
0 10 20 30 40
% area of the magisterial district eroded
Soil
Deg
rada
tion
Inde
x
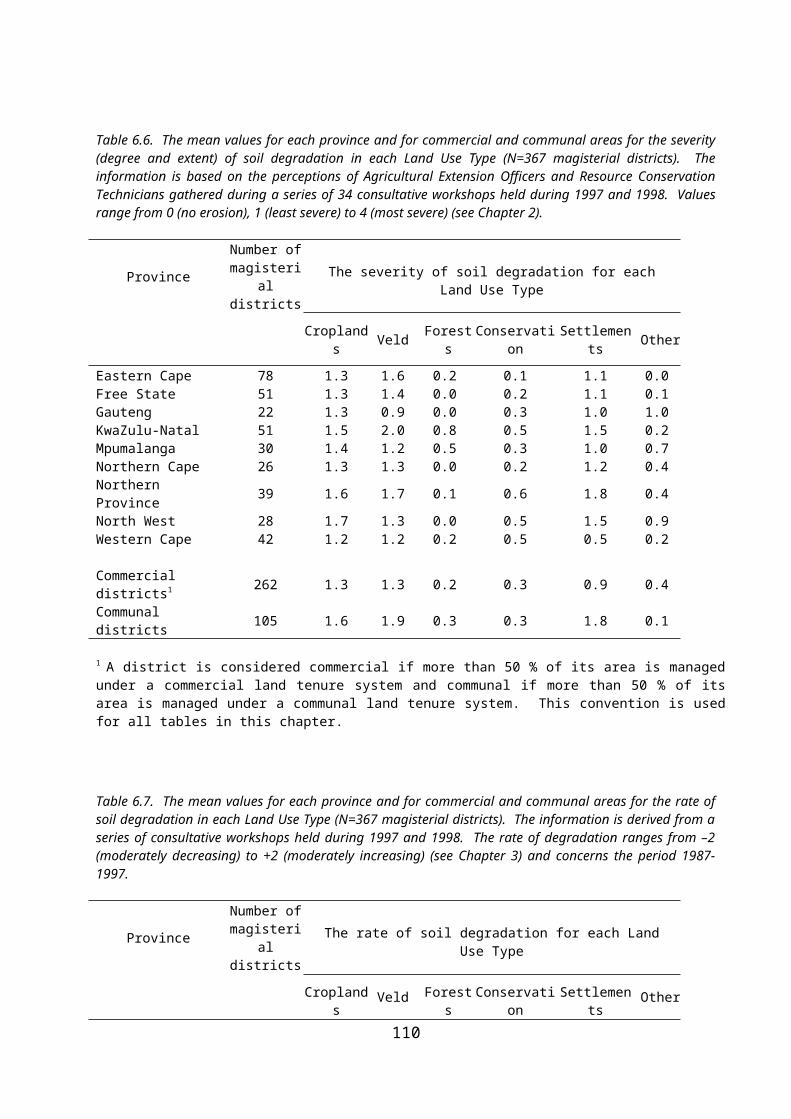
Case study photo essay
Photo 6.4. Erosion physically reduces the area that can be used for croplands as this picture near Entsimakweni village, Herschel district shows.
Photo 6.5. Small rills and gullies can enlarge very quickly if not controlled, especially on old crop -lands. This valley was used for cropping in the 1950s and was rezoned as a grazing land under the Bet-terment Planning Act. Entsimekweni village, Herschel district.
110
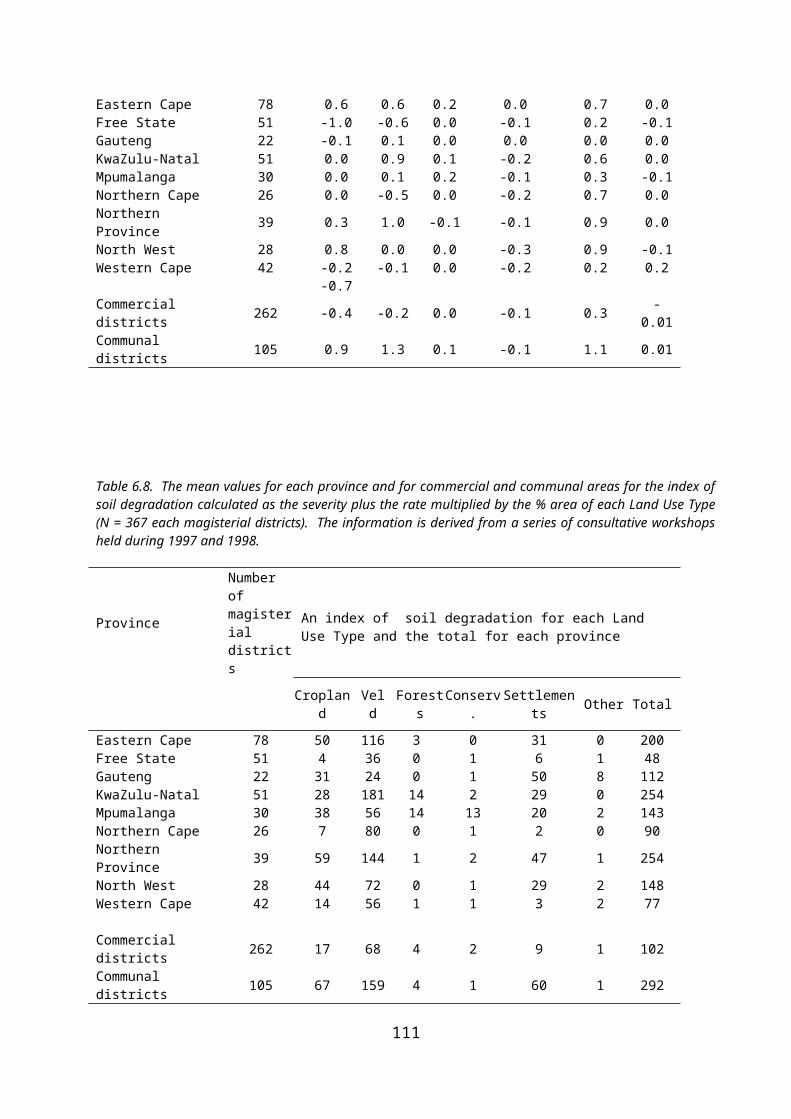
Photo 6.6. Soil erosion is a serious problem in and around many settlements within the communal areas of South Africa. Run-off from roads and footpaths is a major cause of the high erosion rates. Pelendaba village, Herschel district.
Photo 6.7. Uncontrolled run-off from roads often increases soil erosion as this eroded pediment, down slope from a gravel road indicates. Despite the severe loss of topsoil and vegetation cover, the area is unfenced and continues to be utilized by livestock. Cornfields, near Escourt, KwaZulu-Natal.
111
Photo 6.8. Large areas of KwaZulu-Natal possess highly erodible soils such as these blue shales near Weenen, which have been eroded to bed-rock in places. Scattered trees and shrubs comprised mostly of Acacia karroo, A. tortilis, Vitex rehmaniana, and Codia rudis remain. Sheep, goats and cattle continue to graze the sparse vegetation that occurs in isolated patches.
Photo 6.9. Severe soil erosion is by no means confined to the communal areas, as this extensively eroded pediment on Highland Sourveld of a commercial farm near Middlerest, KwaZulu-Natal shows.
112
Photo 6.9. Dongas can be fixed using relatively simple technologies. In this example in the foreground, villagers have planted kikuyu and Sisal plants (Agave americana) to stabilize a donga that was more than 3 m deep only four years ago. The active loss of soil via this erosion channel has been checked. The same cannot be said of the dongas on the hill in the background. Sunduza village, Herschel district.
113