lake anna fisheries management report anna fisheries management report . popular format ... fish...
TRANSCRIPT

Lake Anna Fisheries Management Report
Popular Format
Federal Aid Project - F111R
March 2016
John Odenkirk, Fisheries Biologist
Virginia Department of Game and Inland Fisheries
1320 Belman Road
Fredericksburg, VA 22401

Background/stocking/regulations
Lake Anna is a 9,600-acre impoundment owned by the Dominion Virginia Power
Company (Dominion). The reservoir spans Louisa, Spotsylvania and Orange counties
and serves as cooling water for the two-unit North Anna Nuclear Power Station.
Dominion has recently filed paperwork and initiated environmental studies needed to add
an additional reactor to the site. The Nuclear Regulatory Commission (NRC) is currently
reviewing Dominion’s combined license application (COLA) to construct and operate
North Anna Unit 3 (NA3). Dominion is anticipating that NRC will issue the combined
license (COL) in 2017. Dominion will not make a decision regarding the construction of
NA3 until after the COL is issued. The 3,400-acre Waste Heat Treatment Facility
(WHTF) aka “the hot side” has no formal public access and thus is not managed by
VDGIF and not covered in this report.
Fish stocking began in 1972 with introductions of Largemouth Bass, Bluegill,
Redear Sunfish and Channel Catfish. Subsequent stockings of Redear Sunfish, Channel
Catfish, Walleye, Striped Bass and Largemouth Bass (both Florida and northern
subspecies) were made. Threadfin Shad and Blueback Herring were successfully
introduced in the 1980s. Striped Bass and Walleye were usually stocked annually until
2007 when Walleye stocking was discontinued due to reprioritization of VDGIF’s
Walleye production and low return to creel. Most recently, hybrid Striped Bass (hatchery
cross between male White Bass and female Striped Bass) were stocked in 2014, and
saugeye (hatchery cross between male Sauger and female Walleye) were stocked in 2013.
Both of these stockings were one-time experimental events but will likely be repeated.
More information on these fish is available later in the report. Thus, the only stockings
2

during the past 15 years were Striped Bass, Walleye and hybrids thereof (Table 1).
Stocking rates and locations were variable in attempts determine optimum stocking rates
for Lake Anna. Typically, at least three mid to upper lake sites (boat ramps) were used
annually for pelagic predator stockings. Stocking evaluations are included below as part
of a species-by-species summary of fish population status.
A 20” minimum length limit and a four per day creel limit regulate Striped Bass
and hybrid Striped Bass harvest (in aggregate), while saugeye harvest is regulated by a
five per day creel and 18” minimum size. A 12-15 inch slot length limit on Largemouth
Bass was rescinded in 2005 due to extraordinarily high voluntary release rates of
Largemouth Bass, and there is currently no restriction beyond standard state regulation
governing bass creel (5 per day with no size limit). All other species are covered by
standard state regulations
(http://www.dgif.virginia.gov/fishing/regulations/creelandlengthlimits.pdf).
Creel surveys
The most recent creel survey (a survey where anglers are interviewed about their
fishing habits, preferences and success rates) was conducted in 2010, and another is
planned for 2018. The 2010 survey estimated annual fishing pressure at 13.7 hours/acre
(131,482 boat angler hours) which was remarkably similar to the 2005 estimate (12.8
hours/acre). This rate was considered moderate for a large reservoir and was below a
previous Lake Anna sample (24 hours/acre in 2000); however, the 2000 survey was
conducted during a drought year when lack of inclement weather likely increased fishing
pressure. Additionally, all surveys were conducted during daylight hours from
3

established boat access points. Thus; fishing effort originating from private/HOA ramps,
nighttime effort, and shore angling were not recorded resulting in an underestimate of
true fishing pressure.
Preferred species selected by anglers in 2010 included Largemouth Bass (66%
compared with 62% in 2005), Striped Bass (20% compared with 22% in 2005), crappie
(8% compared with 15% in 2005) and catfish (5% compared to 1% in 2005). Dominant
species caught in 2010 were Largemouth Bass (37,543 or 48%), Black Crappie (18,930
or 24%), and Striped Bass (10,232 or 13%), but an extraordinary number of largemouth
bass were released (99.7%). Thus, dominant species harvested were black crappie (8085
or 64%), Striped Bass (2782 or 22%), and catfish (1407 or 11%). Catfish species were
not recorded, but it is likely the dominant portion of this category was Channel Catfish
with some White Catfish and bullheads contributing. The composition of anglers and
their harvest appeared to change little at Lake Anna between 2000 and 2015.
Aquatic vegetation
The aquatic weed Hydrilla verticillata became established in Lake Anna during
the late 1980s, and abundance increased rapidly from 96 acres in 1990 to 832 acres in
1994. Sterile (triploid) Grass Carp (N=6185) were stocked into Virginia Power’s Waste
Heat Treatment Facility (WHTF) by Dominion in 1994 to control Hydrilla. The WHTF
is separated from Lake Anna by three dikes, and thermal effluent enters the lake via
gravity flow under the third dike. All Grass Carp stocked in the WHTF were marked
with coded wire micro tags. No carp were stocked in Lake Anna. Tagged Grass Carp
began to appear in Lake Anna a short time after the stocking of the WHTF obviously
4

having negotiated the gravity feed beneath the third dike. Hydrilla abundance declined
rapidly in Lake Anna and in the WHTF during the following years. However, weather
conditions during 1995 were suboptimal for aquatic macrophyte growth, and it is likely
that the combination of these climactic conditions and foraging by carp reduced, and
finally eliminated, Hydrilla and other submersed aquatic vegetation (SAV) from Lake
Anna. Aquatic plants are generally considered desirable in an aquatic system, although
optimum coverage density is a controversial subject somewhat site specific and based on
user activity preferences. It has taken years for the grass carp population to decline
through natural mortality, and only recently have small amounts of SAV begun to emerge
including not only Hydrilla but Southern Naiad and Chara as well (the latter being a type
of algae mimicking a vascular plant). However, due to the wide range of competing
interests among Lake Anna property owners and users and variation in appreciation of
the value of SAV, an additional Grass Carp stocking (N=510) is planned for 2016
(mostly to the WHTF). Also during the past two decades, water willow Justicia
americana (an emergent aquatic plant) has substantially increased in abundance along the
shorelines of the mid-lake region. It is believed the addition of both SAV and emergent
vegetation has had a positive impact on the Largemouth Bass population.
Fish Sampling
Historically, rotenone sampling at Lake Anna was conducted every three years to
generate species composition and biomass estimates. This sampling involved the
application of piscicide to four coves, and collected data were used to evaluate forage
abundance (Gizzard Shad, Threadfin Shad, and Blueback Herring) for stocked predators
5

and monitor overall fish community composition. However, due to extremely high
variances in biomass estimates, heavy shoreline development (with the potential for
public relations problems) and intensive manpower requirements; rotenone use at Lake
Anna was discontinued after 1995. Increased gill netting with larger, multi-panel nets
was determined to be an adequate replacement for community structure and forage
evaluation while providing the needed data for predator stocking evaluation. Current
annual sampling includes spring electrofishing for Largemouth Bass in the upper, middle
and lower portion of the reservoir. Upper lake electrofishing is conducted on Pamunky
Creek (above Terry’s Run); middle lake sampling is conducted in the vicinity of the splits
(to Stubbs Bridge on Pamunky Creek and Route 719 on the North Anna River); and
lower lake sampling is conducted between the Dam and Dike II. Gill net surveys are
stratified by upper and lower lake (using Route 208 as the boundary), and specific sites
are selected based on a random block design. A total of 36 net nights of effort are
conducted annually (one net set overnight is one net night). Gill nets are 200 X 8 feet
and have eight different 25-foot panels that allow the sampling of most sizes of fish
present in the lake. Typically, with either gear; fish are measured for total length and
weight and released. However, ear stones (otoliths) may occasionally be removed from
fish to determine exact age. This information is crucial when evaluating certain
population parameters and determining stocking success.
Largemouth Bass
Largemouth bass mean electrofishing catch rate (CPUE, or number caught per
hour of electrofishing) for all size groups increased or remained stable over the past 15
6

years, and all groups were at record levels within the past few years (Table 2, Figure 1).
Size groups of Largemouth Bass are universally defined as fingerling (under 8 inches),
stock (at least 8 inches), quality (at least 12 inches), preferred (at least 15 inches), and
memorable (at least 20 inches). Stock-size fish are generally considered mature (or
nearly so) and recruited to the population. CPUE trends of stock-size, quality-size,
preferred-size and total bass for the last 15 years had significant linear increases
suggesting abundance of these size groups increased. Data points undulated in cyclical
fashion around these trend lines, but overall increases were statistically significant.
CPUE trends of fingerling and memorable-size bass increased, but linear trends were not
statistically significant likely due to higher variability. Catch variability was low for
most size categories of bass but was high for fingerling and memorable categories. This
was probably due to: 1) fingerling and memorable size categories were least abundant (in
samples), so small changes in catch rates had large influence on relative abundance
within the sample, and 2) these size categories were reduced by actual bias (there simply
are not that many memorable fish in the population) or sampling bias (it is often harder to
catch juvenile fish with electrofishing gear even though they may be, in fact, the most
abundant size group in the population). These data suggest Lake Anna is a stable system
(compared with other southeastern U.S. reservoirs) that produces consistent year classes
(or cohorts) of bass from year-to-year and is becoming more productive over time based
on increases in fish size and abundance.
CPUE was usually higher in the middle lake than in the upper or lower portions,
although in 2015 differences were not significant. This was likely due to a productivity
gradient (expected in a large tributary storage impoundment), as biomass is usually much
7

higher at upstream locations - combined with abundance of aquatic vegetation in the mid
and lower lake. Essentially, the mid lake region seemed to blend the best of both
extremes of Lake Anna (the upper eutrophic vs. the lower oligotrophic) providing a
“perfect overlap” of adequate nutrients and habitat. Anglers are advised to target the mid-
lake region especially in spring for bass quantity and quality.
Largemouth Bass structural indices (PSD and RSDs) paralleled catch rates and
suggested population size structure shifted gradually upwards - towards larger individuals
(Table 3). PSD (proportional stock density) is an index that describes the size structure
of a population and may be used in context of predator/prey relationships to determine
balance within a fish community. Simply - the larger the number; the larger the
proportion of big fish in a population. PSD for Largemouth Bass is determined by the
ratio of the number of bass that are greater than eight inches but also greater than 12
inches. Similarly, RSD-P (relative stock density of preferred bass) is a ratio of the
number of bass that are greater than eight inches but also greater than 15 inches. These
indices suggested the population had adequate (and increasing) numbers of large bass and
that number of “true trophies” as a proportion of the population was greatest recently
(2014).
Otoliths have not been collected from bass since 2002. Otoliths from a subset of
bass collected during electrofishing were removed in 1999-2002 to evaluate growth and
mortality. Bass growth rates were above average for young fish, as fish reached 7.2
inches, 10.6 inches and 13.1 inches by their first, second and third years. However,
growth slowed in the upper portion of, and just over, the slot (since removed). A typical
bass reached 15 inches at 4.4 years and averaged only about one inch per year until age
8

eight or nine. Evidence suggested that bass at Lake Anna were stockpiling and stunting,
albeit at a more desirable size than typically occurs. Growth patterns required a bass
about ten years (at a conservative minimum) to reach citation length (22 inches). Based
on growth curves, it’s more likely that citation bass were at least 12 years old unless other
factors were at work (e.g., forage and growth variability). Fish up to age 13 were
collected. Otoliths will again be collected if substantial changes occur to the size
structure of the population, catch rates of certain groups change, or management
philosophy dictates a necessity for more recent biological descriptors.
Total annual mortality (the percentage of the bass population that dies each year
from all causes) was 27% for fish aged 2-12 based on a catch curve of bass sampled in
2002. While these estimates assume constant recruitment (equal production of young
fish from year-to-year), they are low and support current and previous findings that the
population is lightly exploited. Total annual mortality is composed of natural and fishing
mortality. Estimates of annual natural mortality were similar to the rates listed above (for
total mortality) and thus further suggested fishing mortality was very low.
Relative Weights (Wr, a measure to describe the plumpness or well-being of a
fish) were highest in upper lake bass and declined down lake. The lowest Wr values
were from lower lake fish.
Stomachs taken from fish sacrificed for otoliths were analyzed, and 61% were
empty. Bass that had stomach contents ate fish (35%), artificial lures (2%), crayfish
(1%) and insects (1%). Many consumed fish were unidentifiable, but the following were
observed in decreasing abundance: Bluegill, White Perch and Threadfin Shad. It is likely
that many of the unidentifiable items were shad (either Gizzard or Threadfin).
9
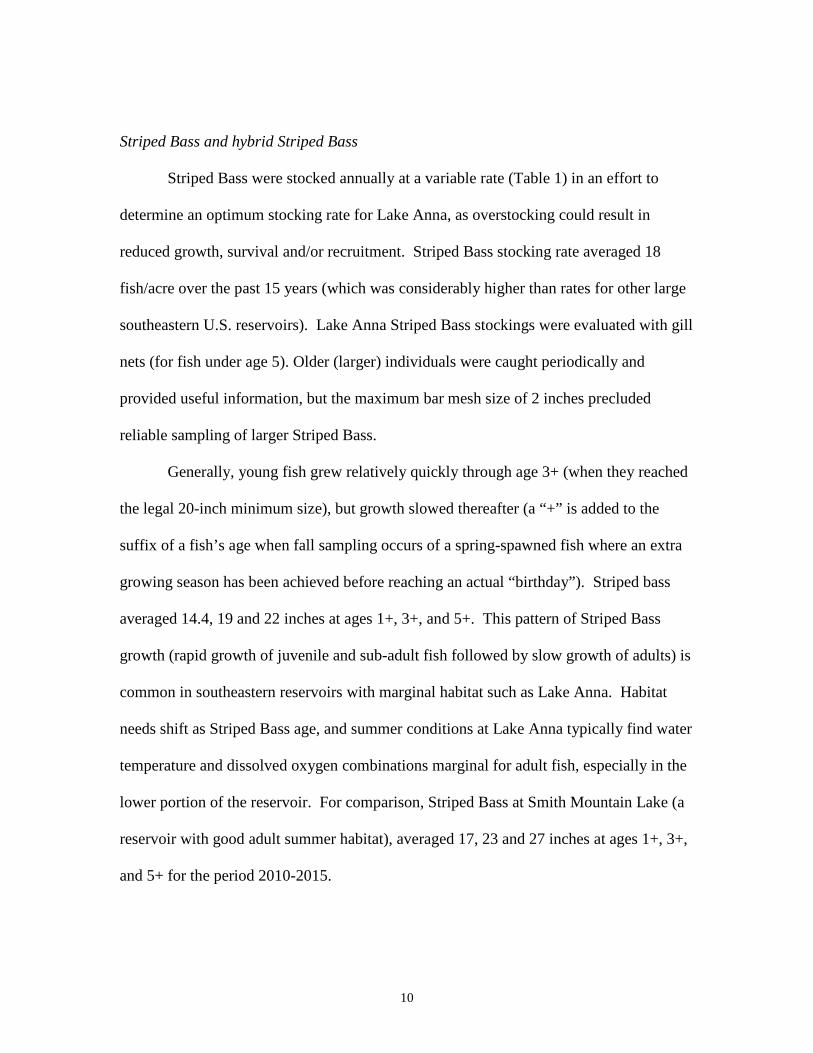
Striped Bass and hybrid Striped Bass
Striped Bass were stocked annually at a variable rate (Table 1) in an effort to
determine an optimum stocking rate for Lake Anna, as overstocking could result in
reduced growth, survival and/or recruitment. Striped Bass stocking rate averaged 18
fish/acre over the past 15 years (which was considerably higher than rates for other large
southeastern U.S. reservoirs). Lake Anna Striped Bass stockings were evaluated with gill
nets (for fish under age 5). Older (larger) individuals were caught periodically and
provided useful information, but the maximum bar mesh size of 2 inches precluded
reliable sampling of larger Striped Bass.
Generally, young fish grew relatively quickly through age 3+ (when they reached
the legal 20-inch minimum size), but growth slowed thereafter (a “+” is added to the
suffix of a fish’s age when fall sampling occurs of a spring-spawned fish where an extra
growing season has been achieved before reaching an actual “birthday”). Striped bass
averaged 14.4, 19 and 22 inches at ages 1+, 3+, and 5+. This pattern of Striped Bass
growth (rapid growth of juvenile and sub-adult fish followed by slow growth of adults) is
common in southeastern reservoirs with marginal habitat such as Lake Anna. Habitat
needs shift as Striped Bass age, and summer conditions at Lake Anna typically find water
temperature and dissolved oxygen combinations marginal for adult fish, especially in the
lower portion of the reservoir. For comparison, Striped Bass at Smith Mountain Lake (a
reservoir with good adult summer habitat), averaged 17, 23 and 27 inches at ages 1+, 3+,
and 5+ for the period 2010-2015.
10

Efforts to correlate number of fish stocked with abundance finally met with some
success given an enhanced dataset. Stocking rates between 5 and 32 fish per acre were
used in an effort to establish the best striped bass stocking rate for Lake Anna (more fish
are not always better, and excessive stocking can lead to increased competition, lower
body mass during the first winter and subsequent poor recruitment). Findings still
suggested that the number of striped bass recruiting to the population is based, at least in
part, on other variables (likely environmental effects or forage abundance, such as
zooplankton, at time of stocking). Good relationships were observed between stocking
density and catch of juveniles (and other age groups) suggesting stocking rate does help
determine ultimate fish density and that those numbers are persistent over time. Some of
the strongest year classes were derived from variable stocking rates (10-32/acre), and the
best stocking rate for Lake Anna may be within the window of 15-20 fish per acre.
Analysis will continue to better define the correct allotment.
Cohort based mortality estimates (the practice of looking at mortality rate of each
year class over time rather than looking at the population as a whole, since rates can be
different based on abundance or number stocked) were calculated for each striped bass
year class with ample data. These estimates provided the total annual mortality rate –
that is, the percentage of the year class that died each year from all causes. Essentially,
each stocking was considered a subgroup, and these groups were followed through time
to see how they survived. The oldest year classes had the most data points (or years of
catch-per-unit-effort data) and provided the best relationships. Out of nine datasets, eight
produced significant regressions with total annual mortality between 24 - 40% (average
11

34%) suggesting overall mortality rate for striped bass at Lake Anna is moderate to low
(for an “exploited” fish stock).
Relative abundance of striped bass in Lake Anna was estimated by catch rate or catch
per unit effort (CPUE). This was simply the number of striped bass caught per net night
of effort. Since new netting protocols were established in 1997, CPUE for striped bass in
gill nets has ranged from 3.0 (1998) to 9.6 (2012). The 13-year striped bass average
CPUE was 5.2 (Table 4), and catch in 2015 was 3.1. However, Striped Bass hybrids
were stocked in 2014 on a one-year experimental basis. (It is likely hybrids will perform
better in marginal habitat conditions in Lake Anna. Stocking could be repeated pending
lack of emigration, desirable growth, and contribution to the fishery.) The addition of
hybrid catch to Striped Bass catch in 2015 brought cumulative catch to near average.
Most Striped Bass were caught in the upper portion of the reservoir. The North Anna
River from Rose Valley upstream past Christopher Run and the Pamunky River from
Jetts Island upstream to Terry’s Run (and into Terry’s Run upstream to the bridge) were
typically very productive locations during December netting. Fishing success in 2016
and 2017 should be good with the excellent 2012 year class and above average 2011 year
class (combined with hybrids reaching legal size).
Walleye/Saugeye
Walleye were historically stocked annually at Lake Anna through 2006 (Table 1).
However, as a result of a statewide walleye study and recommendations by the DGIF
Walleye Committee; stockings were discontinued due to lack of angler interest (based on
12

creel surveys), unexplained recruitment failures (detailed in previous reports), and
declining gill net catch.
Saugeye were stocked in 2013 at a rate of 10/acre as part of an experiment to
determine if this hybrid would be better suited Lake Anna’s habitat than pure Walleye.
This one-time trial is currently being evaluated, but based on early samples it is likely
future saugeye stockings will occur.
Black Crappie
Black Crappie were evaluated with experimental gill nets 1997-2015. It was
assumed nets sampled the entire population without bias. Otoliths were removed from a
subsample of fish captured in 2015 (N=194) to revisit estimates of growth and mortality,
as abundance had been dropping significantly through time. Ironically, catch rate in 2015
set a modern record. Otoliths were last removed from this species in 2002. Crappie were
the third most abundant fish in nets behind White Perch and Gizzard Shad. Despite equal
effort, most crappie (93%) were caught in the upper portion of the lake in a familiar
pattern likely based purely on productivity and habitat. Mean CPUE (catch per unit
effort) in gill nets averaged 8.6 fish per net night between 2003 and 2015 with 2015
producing the highest (13.2). Three years were tied for the lowest (6.3) as recently as
2013 (Table 4).
Black crappie size structure has usually been excellent at Lake Anna and appeared
to peak during the period 2006-2008 when average size was largest and there were more
10”+ fish in surveys than other years. Crappie fisheries are notoriously cyclic and
undulate more than most populations due to dramatic year class shifts. High overall
13

catch in 2015 combined with good size distribution (including younger fish) suggested
this population may once again be on the rise at Lake Anna.
Crappie growth, measured in 2015 from 200 randomly selected otoliths, was
slower than when last measured (2002) and highly variable. For example, age-3+ fish
averaged only 7.6” (compared with 8.3” in 2002). Age-2+ fish in 2015 ranged in size
from less than 6” to 12” demonstrating the uselessness of guessing a fish’s age based on
its length. Fish up to age 11+ were captured, and mortality rate was calculated to be only
18% which is low for a “meat” fishery. Based on these parameters (slow growth and low
mortality), it is unlikely a restrictive harvest regulation would improve the already decent
size structure of this fishery. Lately, it seems to have been more a matter of having
adequate numbers of fish present rather than poor size structure, and this issue appears
solved with an excellent 2013 year class followed by an above average spawn in 2014.
Black Crappie angling in 2016 should be better than that experienced for the past several
years.
Catfish
Catfish populations were evaluated with experimental gill nets in 1997-2015. The
five species caught (in decreasing abundance) were Channel Catfish, White Catfish,
Yellow Bullhead, Brown Bullhead and Blue Catfish; however, only the former two
contributed significantly to overall biomass. Channel Catfish were the fourth most
prevalent species taken in gill nets. Channel and White Catfish CPUE (catch per unit
effort) fluctuated during the period with no apparent trend within or between species.
Highest CPUE occurred in 2010 for channel catfish (7.7 fish per net night) and 2005 for
14

white catfish (4.9 per net night), but lowest CPUE occurred in 1997 for channel catfish
(2.3 per net night) and in 2002 for white catfish (1.5 per net night).
Channel Catfish (like most fish) were more abundant in the upper portion of the
reservoir, as exactly two-thirds of fish sampled over the study period were from above
Route 208. Fish were also significantly larger up lake averaging 15” – two inches longer
than lower lake fish.
Several small Blue Catfish have been caught in net surveys over the past decades
with a curious pattern. Single fish were caught in 1997, 1998, 2004 and 2008 (all less
than 12 inches). Then, in 2015; three additional small Blue Catfish were caught. Their
origin is unknown, as no stocking records exist for this species in Lake Anna; however,
blue catfish were stocked in the Lake Anna watershed (Lake Orange) during the 1980s.
It is possible a small self-sustaining population exists in Lake Anna, but it is unusual that
abundance has remained low and no larger fish were observed. Typically, this species
rapidly colonizes new water in a highly prolific fashion (e.g., Buggs Island Lake).
Forage
The forage base (members of the shad and herring family or clupeidae) includes
Gizzard and Threadfin Shad and Blueback Herring at Lake Anna. Most of the forage
biomass is composed of Gizzard Shad, although Blueback Herring have been a challenge
to effectively assess, and Threadfin Shad abundance is cyclic (or, more cyclic than the
others) – based largely on minimum water temperatures, as this species has the proclivity
to “winter kill”, although it has been many years since a winter shad kill was reported at
Lake Anna.
15

Estimates of Gizzard Shad biomass from historical rotenone samples ranged from
near 100 to over 300 lbs/acre, while gill net CPUE (catch per unit effort) varied from a
low of about 5 (2014) to over 22 (2010) and averaged 12.7 fish per net night. Gizzard
Shad abundance has also been cyclic, with low catch rates typically followed within a
year to two by high catch rates. Catch rate of Gizzard Shad in 2015 (13.8 per net night)
was above average, and most shad (90% of 496 fish) were caught in the upper lake.
Threadfin Shad abundance, based on gill net catch rate, remained below average
since a record catch in 2010. Blueback Herring, a favorite live bait of striper anglers,
were finally above average in 2015 net samples after a four-year stretch of low catches
(prior peak was also 2010). However, this was the one forage species evenly distributed
throughout the lake. Catch rates for all clupeids can be highly variable due to schooling
tendencies, and fish with lower abundance (Threadfin Shad and Blueback Herring) can
be harder to reliably sample than other fish.
Other Species
Lake Anna is home to many other species – some of various recreational
importance including Redear Sunfish and White Perch and others important ecologically
such as Creek Chubsucker and White Sucker. Net surveys in 2015 produced the highest
White Perch catch rate since study began (over 24 fish per net night), and it seems
abundance of this species is trending higher.
Habitats are variable throughout the lake, and species abundance can be sporadic.
For example, Chain Pickerel (a native top level predator and sport fish) prefer slow
moving coastal plain systems where tannins from leaf litter frequently stain the water and
16

reduce pH to a level lower than typically found in the piedmont. Contrary Creek, while
suffering from acid mine drainage, offers a unique habitat in Lake Anna and supports a
thriving Chain Pickerel population. These species are sampled periodically in gill nets,
and their abundance can be gauged by catch per unit effort or number caught per net
night (Table 4).
17

Table 1. Pelagic predator fingerling stocking in Lake Anna for the preceding 15 years (numbers rounded to the nearest thousand; STB = striped bass, WAE = walleye; underlined numbers represent all or mostly fry).
2001 2002 2003 2004 2005 2006 2007 2008 2009 2010 2011 2012 2013 2014 2015
STB 48 199 210 90 155 304 240 192 202 148 268 296 101 1491 48
/ac 5 21 22 9 16 32 25 20 21 15 28 31 11 161 5
WAE 240 243 228 98 1600 623 0 0 0 0 0 0 962 0 0
/ac 25 25 24 10 167 65 0 0 0 0 0 0 102 0 0 12/3 hybrid Striped Bass; 2saugeye
Table 2. Mean electrofishing catch per unit effort (CPUE) of various size groups of largemouth bass at Lake Anna for the preceding 15 years with averages. Fingerlings are less than eight inches, stock are at least 8 inches, quality are at least 12 inches, preferred are at least 15 inches, and memorable are at least 20 inches.
Size 2001 2002 2003 2004 2005 2006 2007 2008 2009 2010 2011 2012 2013 2014 2015 Ave
Fing 7 10 11 8 9 8 10 6 4 8 10 12 14* 9 7 9 Stk 60 49 58 42 65 78 78 58 67 59 82 81 84 90* 68 68 Qual 45 32 40 33 40 59 55 41 52 43 61 56 56 66* 48 48 Pref 25 14 19 14 26 29 26 21 28 24 39* 31 28 39* 28 26 Mem 2 1 1 1 4 2 2 2 2 1 3 3 2 5* 3 2 Tot 67 59 69 50 74 86 88 64 71 68 92 93 98 99* 75 77
*record catch for period of record (22 years) Table 3. Largemouth bass structural indices from electrofishing surveys at Lake Anna for the preceding 15 years with averages (PSD=proportional stock density, RSD=relative stock density; see narrative for explanation).
Index 2001 2002 2003 2004 2005 2006 2007 2008 2009 2010 2011 2012 2013 2014 2015 Ave
PSD 75 65 69 80* 61 76 71 71 77 73 75 69 67 73 70 71 RSDP 42 29 32 35 40 37 33 36 42 41 48* 38 33 44 42 38 RSDM 4 2 2 1 3 3 3 3 3 2 4 3 3 6* 4 3
*record index for period of record (22 years)

Table 4. Catch per unit effort (number of fish per net night) for 32 fish species (including two hybrids) sampled at Lake Anna for the previous 13 years with gill nets ranked by mean abundance. Species 2003 2004 2005 2006 2007 2008 2009 2010 2011 2012 2013 2014 2015 Mean
Gizzard Shad 22.2 6.1 11.3 15.2 9.4 7.7 19.8 22.5 14.3 8.9 8.7 4.9 13.8 12.7 White Perch 10.4 13.5 11.7 7.8 5.2 12.2 10.3 18.7 10.6 11.3 6.1 14.0 24.1 12.0 B. Crappie 6.3 11.4 10.0 10.7 7.1 7.4 10.1 7.2 6.3 7.6 6.3 7.9 13.2 8.6 Channel Cat 5.5 4.5 6.2 4.0 5.3 4.6 6.5 7.7 6.2 6.7 4.4 5.4 7.1 5.7 Striped Bass1 3.9 4.0 3.3 5.9 4.3 7.6 5.2 6.7 5.5 9.6 5.4 3.4 3.1 5.2 Threadfin 7.3 2.6 0.9 1.6 3.6 8.3 4.1 15.1 1.6 3.7 1.7 2.5 3.3 4.3 W. Catfish 2.2 3.2 4.9 3.2 3.0 3.6 2.0 2.7 3.6 3.7 2.4 2.8 2.8 3.1 Largemouth 1.3 1.3 2.2 1.4 1.3 1.8 0.9 1.9 1.1 2.6 1.8 1.5 0.7 1.5 Blueback 4.3 0.2 0.2 0.4 0.6 0.7 3.8 1.6 0.2 0.2 0.5 0.3 1.5 1.1 Walleye1 2.0 1.5 0.9 0.4 0.1 0.3 0.2 0.2 White Sucker 0.2 0.2 0.4 0.7 0.3 0.6 0.3 0.2 0.6 1.3 1.1 0.3 0.7 0.5 Bluegill 0.6 0.4 0.7 0.2 0.4 0.3 0.4 0.8 0.8 0.6 0.3 0.7 0.5 0.5 Redear 0.2 0.2 0.6 0.7 0.8 0.4 0.3 0.3 0.6 0.4 0.2 0.4 0.3 0.4 Spot. Shiner 0.5 0.2 0.1 0.1 0.1 0.1 0.3 0.1 0.1 0.1 0.1 0.3 0.2 B. Bullhead 0.1 0.2 0.2 0.1 0.1 0.2 0.3 0.1 0.2 0.9 0.1 0.1 0.3 0.2 C. Carp 0.1 0.2 0.3 0.2 0.1 0.2 0.3 0.4 0.4 0.3 0.1 0.2 0.2 C.chubsucker 0.1 0.1 0.2 0.1 0.1 0.1 0.1 0.2 0.4 0.2 0.1 0.1 0.1 Y. Bullhead 0.1 0.1 0.1 0.2 0.1 0.1 0.1 0.1 C. Pickerel 0.1 0.1 0.1 0.1 0.1 0.1 0.1 0.1 Quillback 0.1 0.2 0.1 0.1 0.5 0.2 0.1 0.1 0.3 0.1 0.5 0.1 0.1 Yellow Perch 0.1 0.1 0.1 0.1 0.1 0.1 0.1 0.1 0.1 0.1 0.1 G. Shiner 0.1 0.1 0.1 0.1 0.1 0.1 0.1 Redbreast 0.1 0.1 0.1 0.1 0.1 0.1 0.1 0.1 Warmouth 0.1 0.1 0.1 0.1 0.1 0.1 0.1 0.1 0.1 Blue Catfish 0.1 0.1 0.1 0.1 G. Sunfish 0.1 0.1 0.1 0.1 S. Redhorse 0.1 0.2 0.1 0.1 0.3 0.4 0.3 0.5 0.6 0.5 0.2 N. hogsucker 0.1 0.1 Grass Carp 0.1 0.1 0.1 Fallfish 0.2 0.1 Saugeye1 0.3 1.5 0.7 STB hybrid1 0.8 1.4 1population maintained exclusively through stocking
19
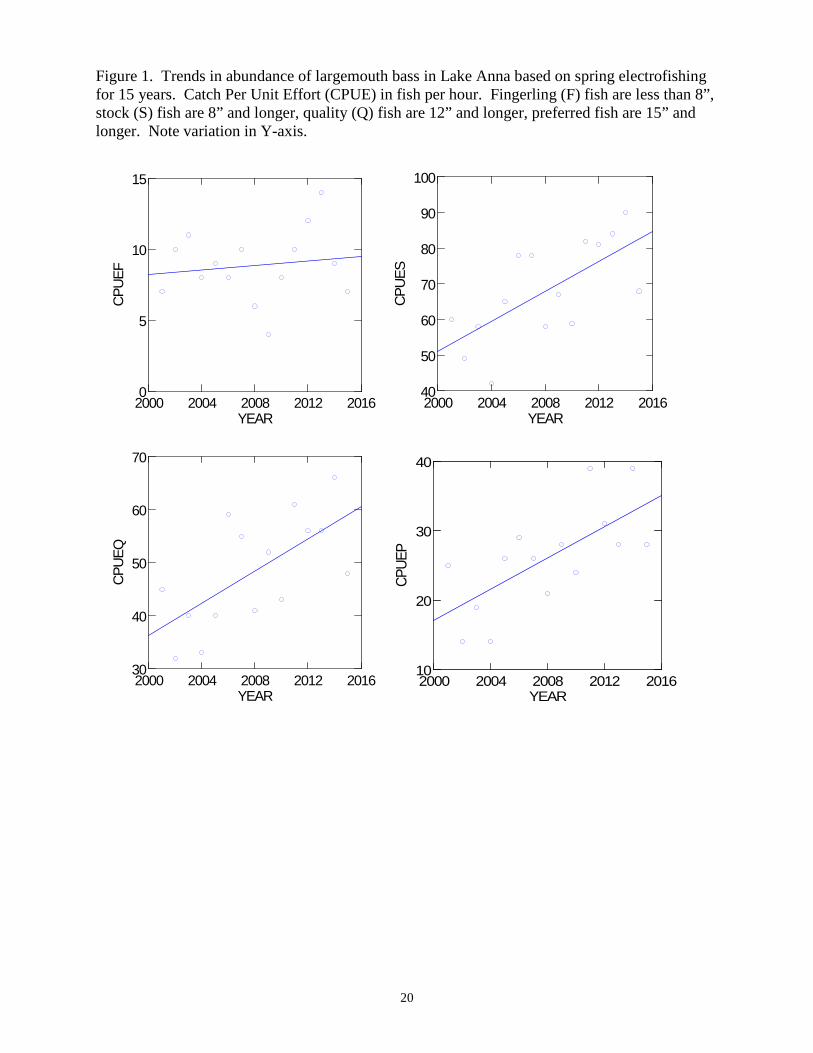
Figure 1. Trends in abundance of largemouth bass in Lake Anna based on spring electrofishing for 15 years. Catch Per Unit Effort (CPUE) in fish per hour. Fingerling (F) fish are less than 8”, stock (S) fish are 8” and longer, quality (Q) fish are 12” and longer, preferred fish are 15” and longer. Note variation in Y-axis.
2000 2004 2008 2012 2016YEAR
0
5
10
15
CPUE
F
2000 2004 2008 2012 2016YEAR
40
50
60
70
80
90
100
CPUE
S
2000 2004 2008 2012 2016YEAR
30
40
50
60
70
CPUE
Q
2000 2004 2008 2012 2016YEAR
10
20
30
40
CPUE
P
20

Figure 1. (Continued) Trends in abundance of largemouth bass in Lake Anna based on spring electrofishing for 15 years. Catch Per Unit Effort (CPUE) in fish per hour. Memorable (M) fish are 20’ and longer. Total (T) catch is final chart. Note variation in Y-axis.
2000 2004 2008 2012 2016YEAR
0
1
2
3
4
5
6
CPUE
M
2000 2004 2008 2012 2016YEAR
40
50
60
70
80
90
100
CPUE
T
21

22