labour force participation of married women, us 1860-2010
TRANSCRIPT
Labour force participation of married women: The United States, 1860-2010
Richard Zijdeman (IISH)
Valencia, SpainAula 5, NIVEL 0March 31, 2016
H-7 The causes and consequences of women’s empowerment
Introduction
Post WW II research shows major increase in FLFP
• So, when did it start?
• How did this change occur?– many hypotheses on change in FLFP
• Level of economic development (GDP)• Reputation (social status)
FLFP = Female Labour Force participation
U-shape female labour force function
• U-shaped relation between country’s level of development and FLFP:– Higher at lower and higher levels of development– Lower at mediocre levels of development
Left side of U-shape
• Rise in income, due to expanded markets or introduction of new technology– barriers preventing women (social custom,
employer preference)• Reduction in the relative price of home
produced goods• Decrease in the demand for women in
agriculture
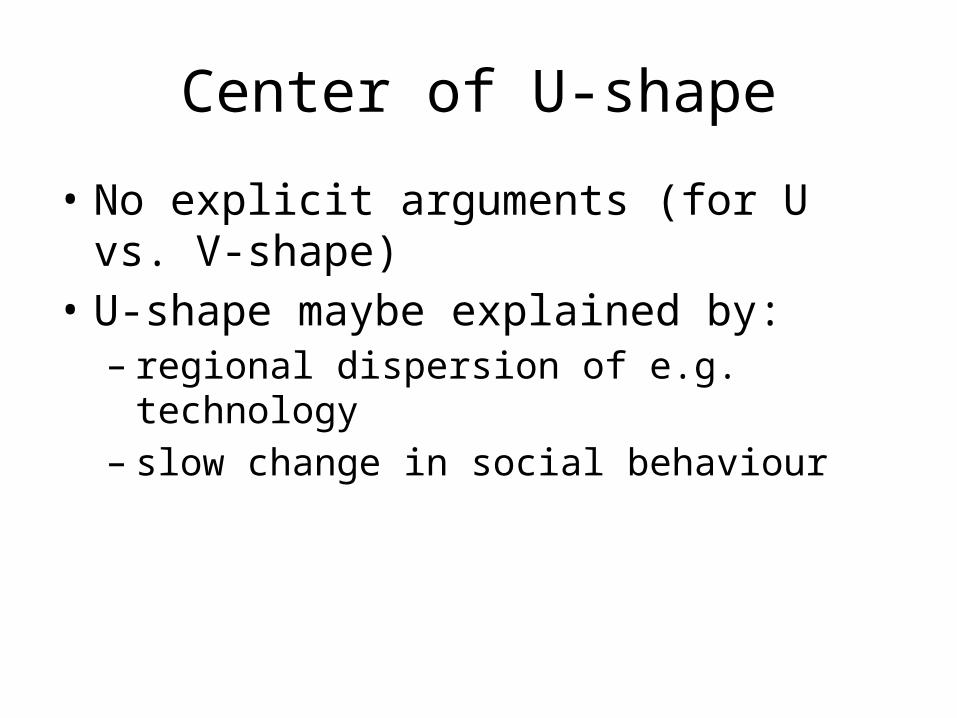
Center of U-shape
• No explicit arguments (for U vs. V-shape)• U-shape maybe explained by:– regional dispersion of e.g. technology – slow change in social behaviour
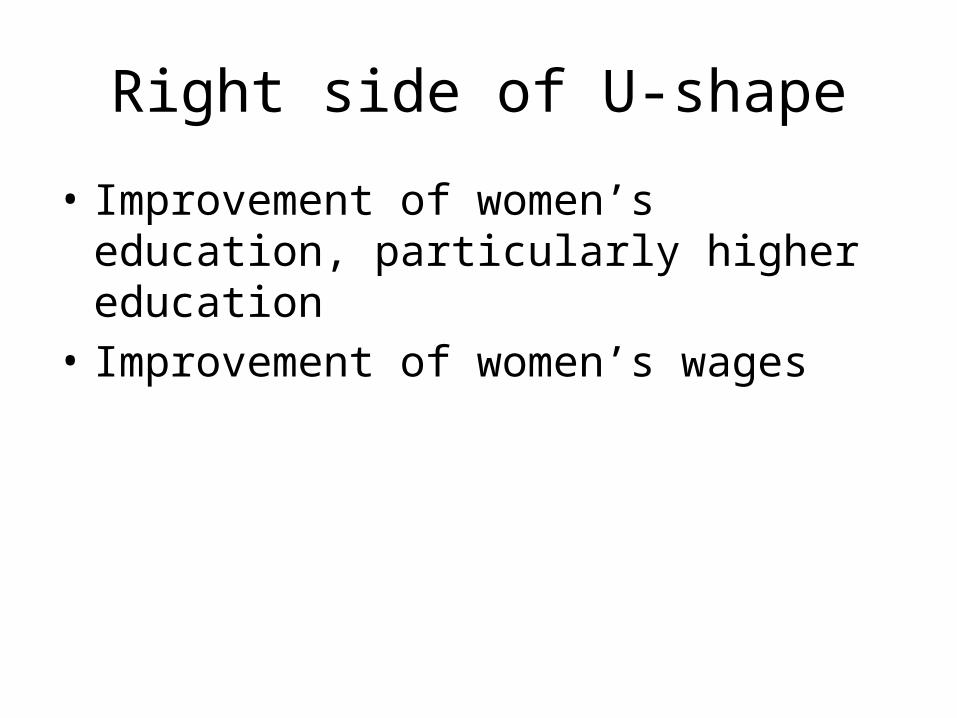
Right side of U-shape
• Improvement of women’s education, particularly higher education
• Improvement of women’s wages

More in-depth on reputation
Formal barriers:- e.g. marriage bars
Informal barriers:– Employer preference– Social norms or stigmas

Within-family-competition
Within-family-competition– Disruptive rivalry between partners (Parsons ’49,
’54, also see Oppenheimer ’77)– The higher the husband’s status, the bigger the
range of non-rivalrous jobs (lower and mediocre)
Ergo: the higher a husband’s occupational status, the higher the probability of FLFP
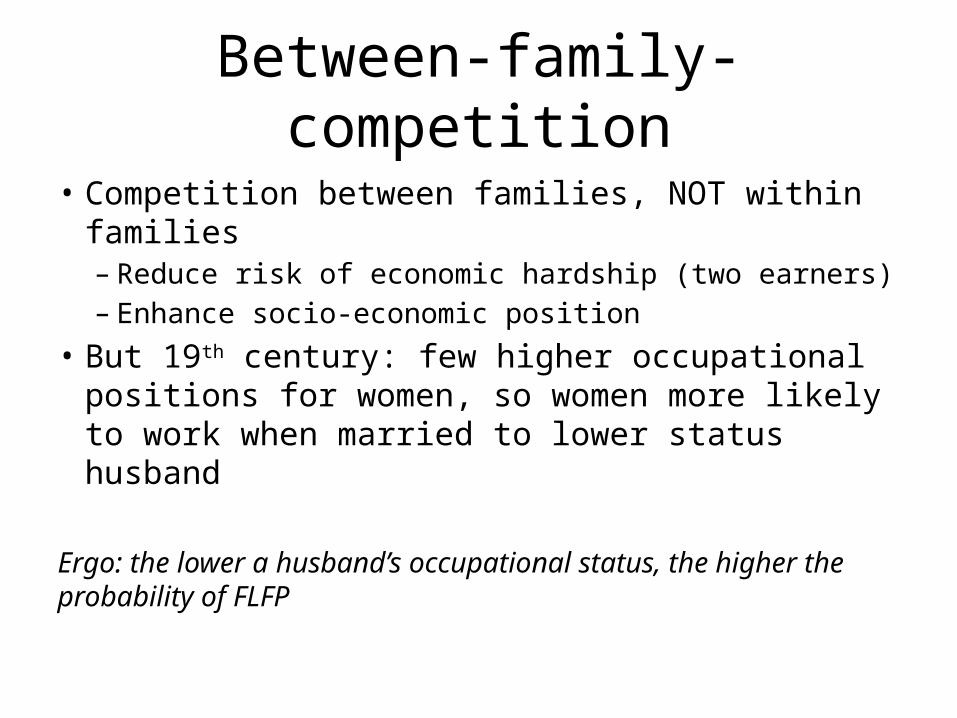
Between-family-competition
• Competition between families, NOT within families – Reduce risk of economic hardship (two earners)– Enhance socio-economic position
• But 19th century: few higher occupational positions for women, so women more likely to work when married to lower status husband
Ergo: the lower a husband’s occupational status, the higher the probability of FLFP
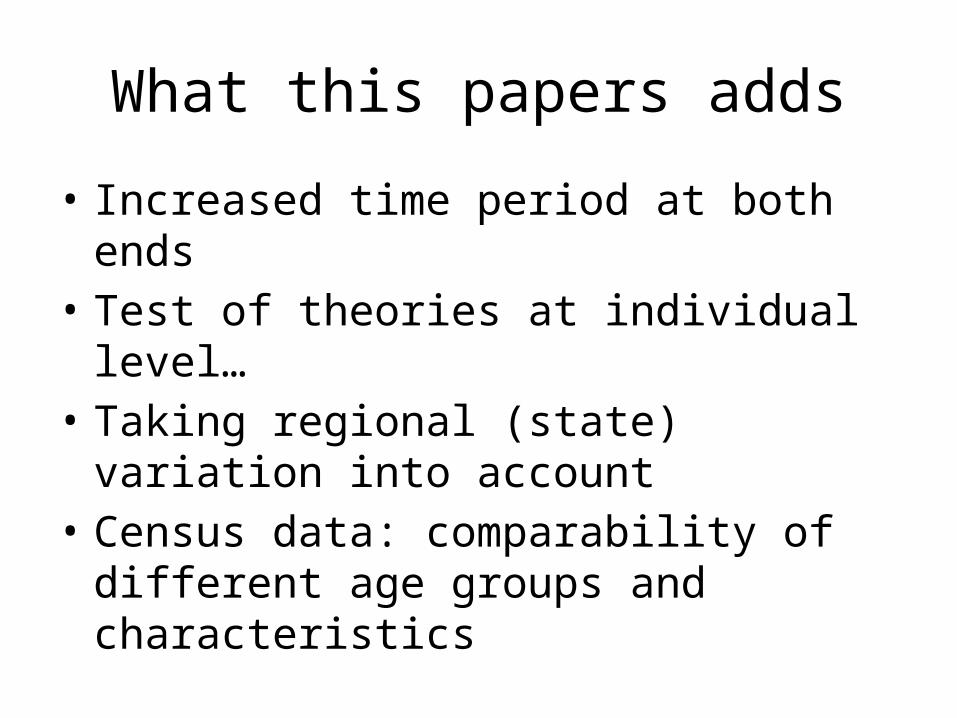
What this papers adds
• Increased time period at both ends• Test of theories at individual level…• Taking regional (state) variation into account• Census data: comparability of different age
groups and characteristics

Data
• IPUMS USA census data 1860-2000– 1, 5 or 10 per cent samples– 1970 excluded (for now)
• 2010 + 2013: American Community Survey• married women whose husband is in the
household at time of the census• N = 11,773,133• NHGIS: for total population at state level• GDP in GK dollars from CLIO-INFRA
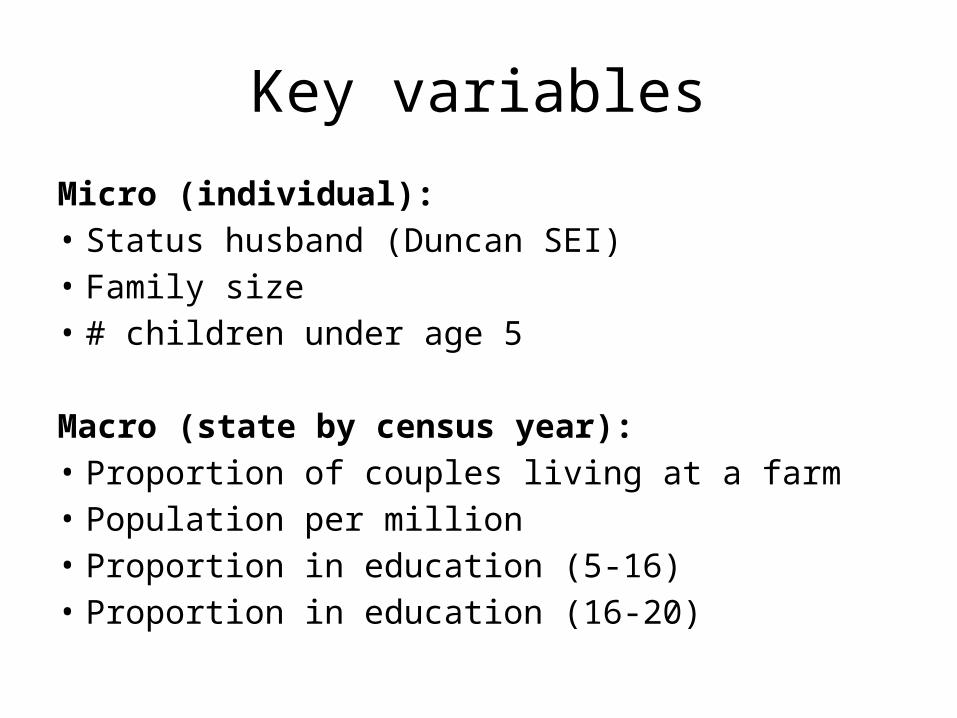
Key variables
Micro (individual):• Status husband (Duncan SEI)• Family size• # children under age 5
Macro (state by census year):• Proportion of couples living at a farm• Population per million• Proportion in education (5-16)• Proportion in education (16-20)

Methods
• Hierarchical generalized linear model (binomial)– Nested observations– Clustering of observations within states and time
• LME4 package in R

Descriptive results
• Regional variation in FLFP• U-shaped curve between GDP and FLFP?
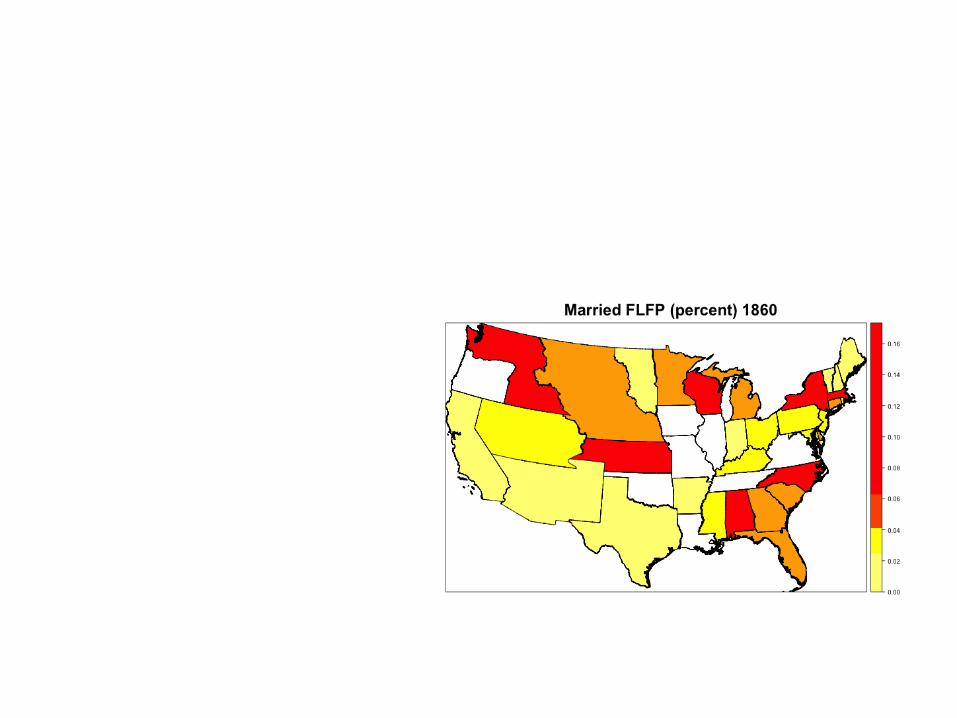

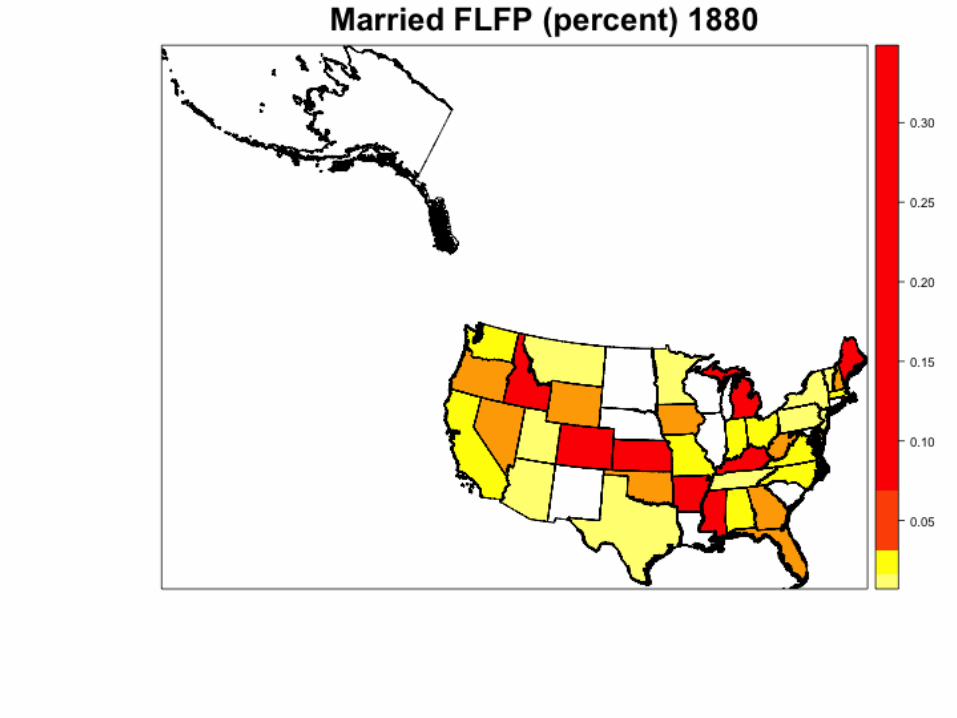
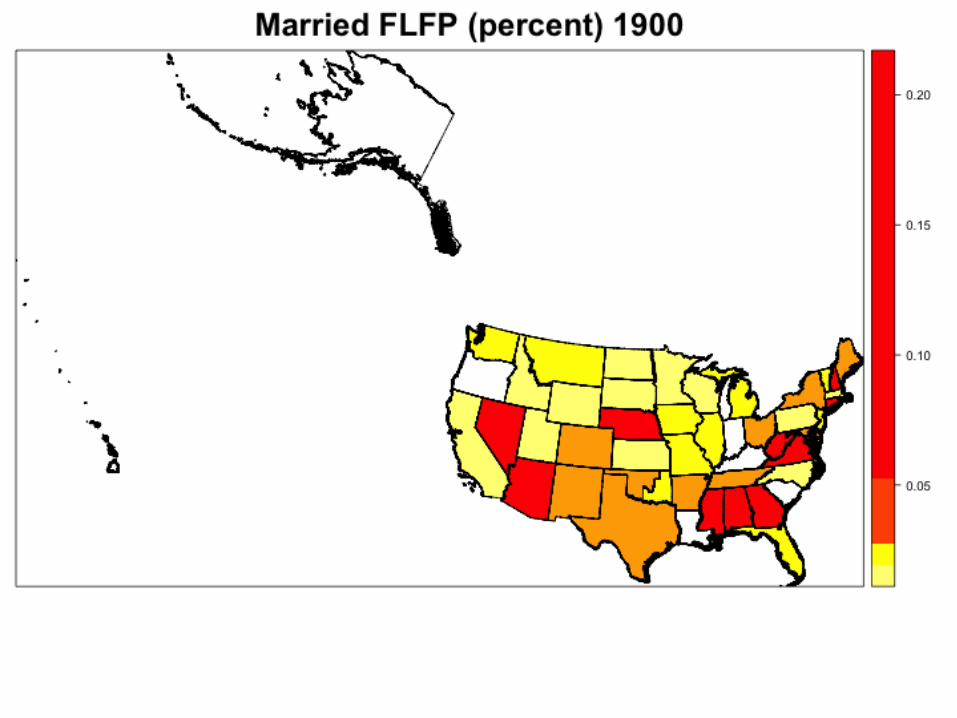

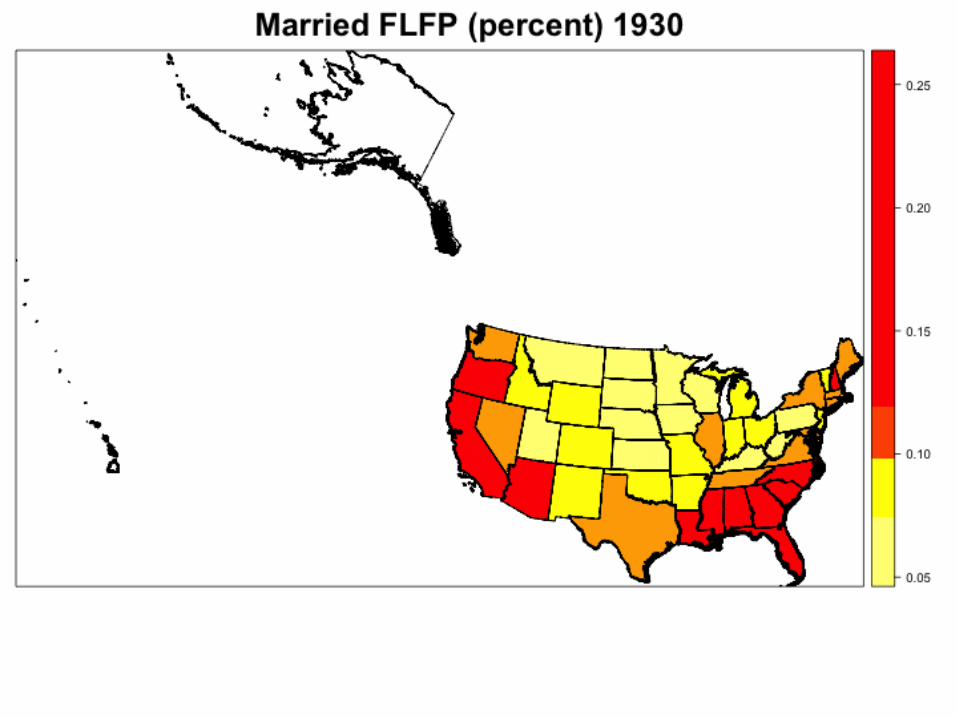
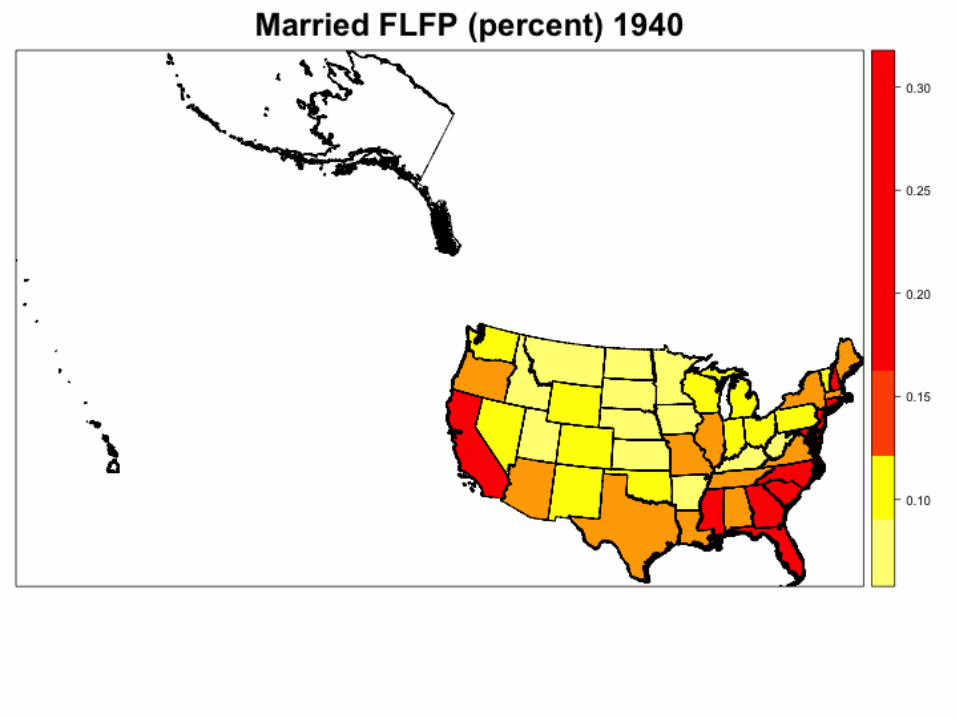
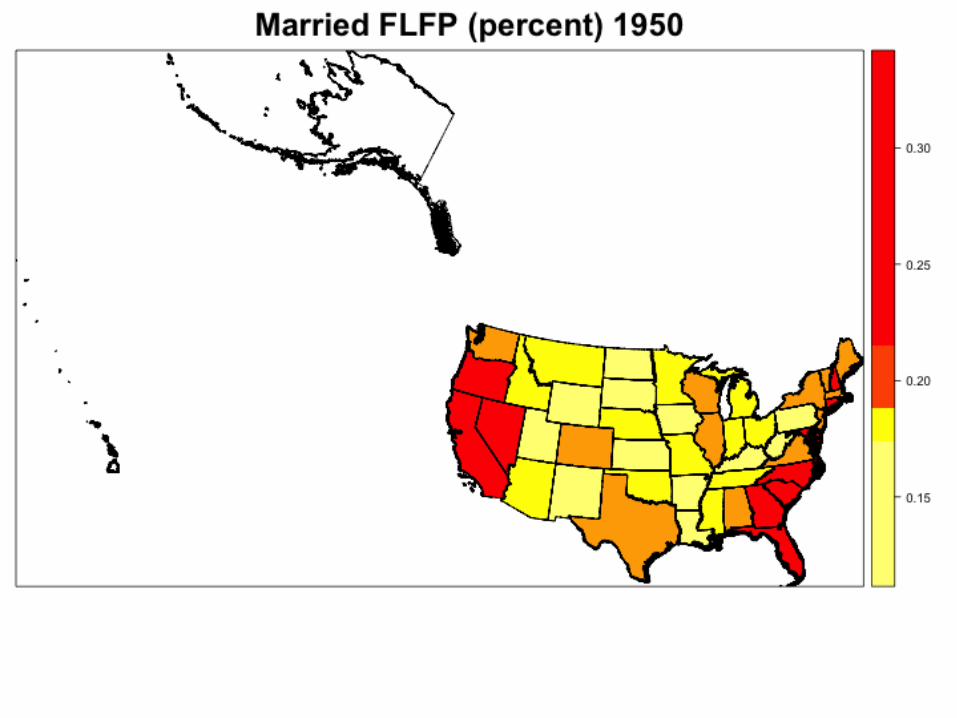

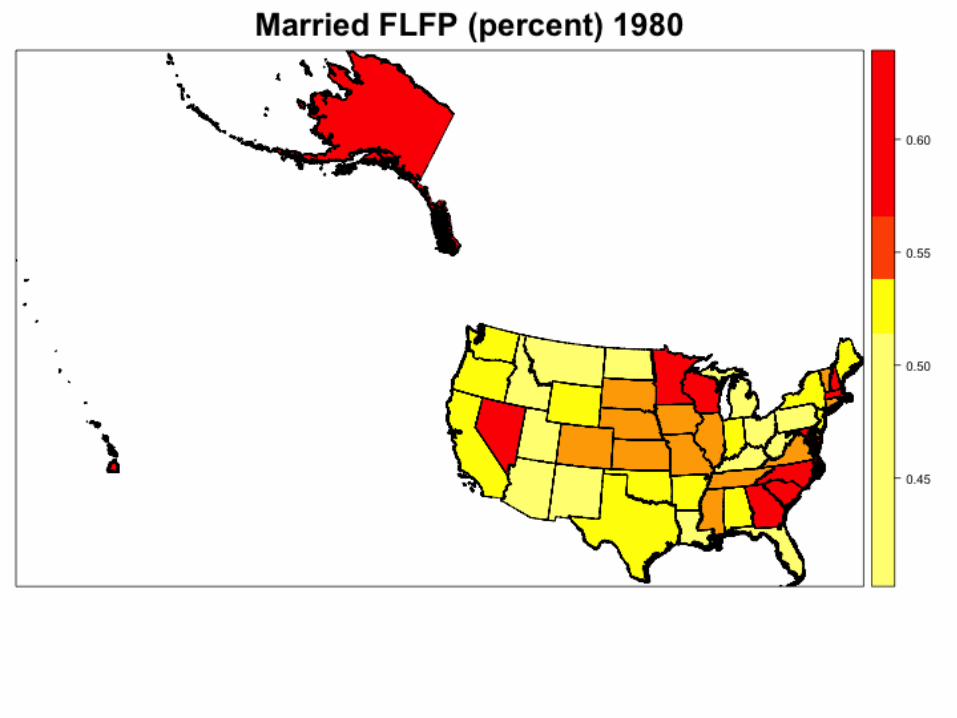
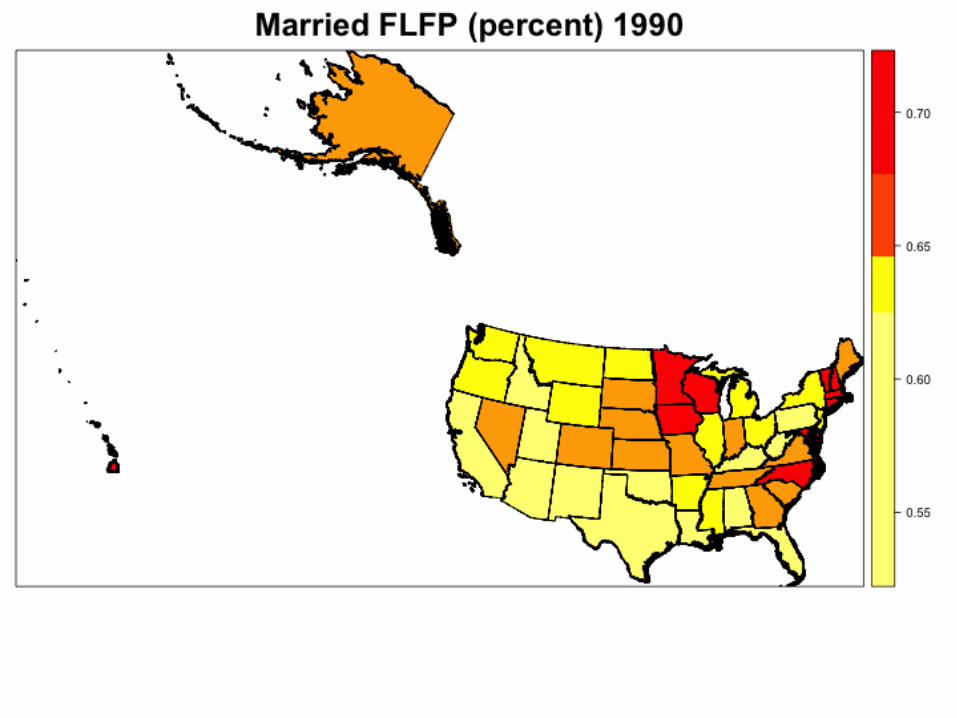
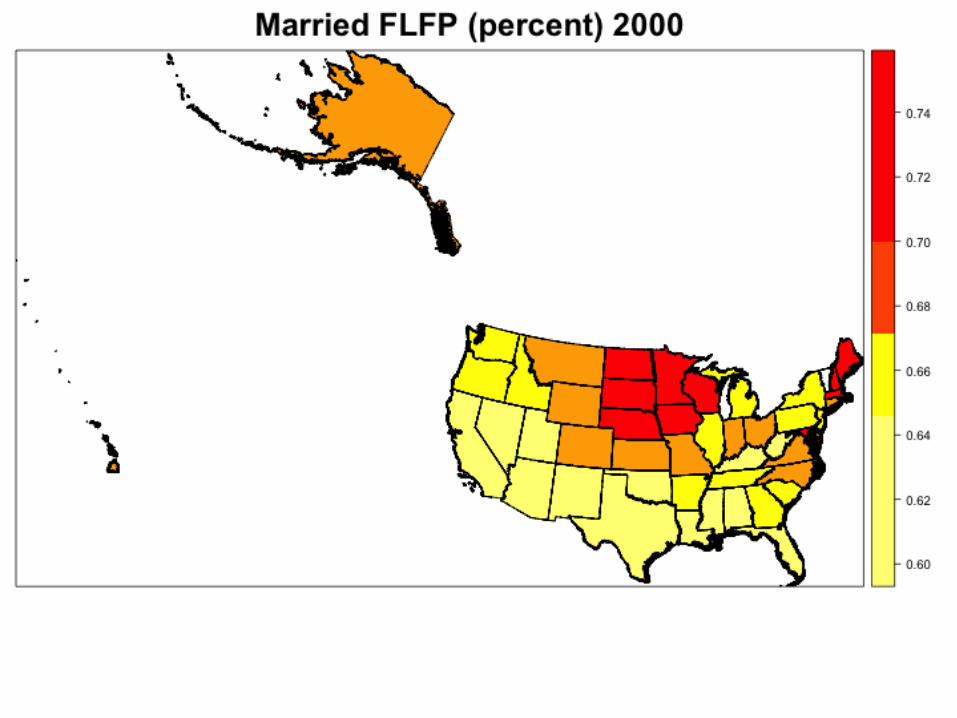
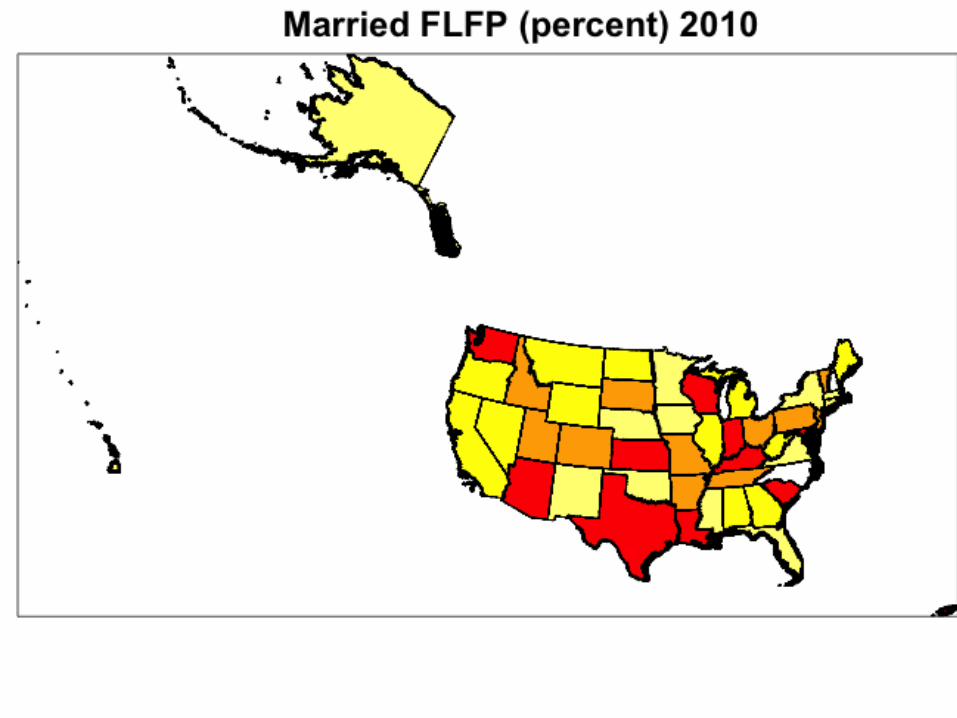
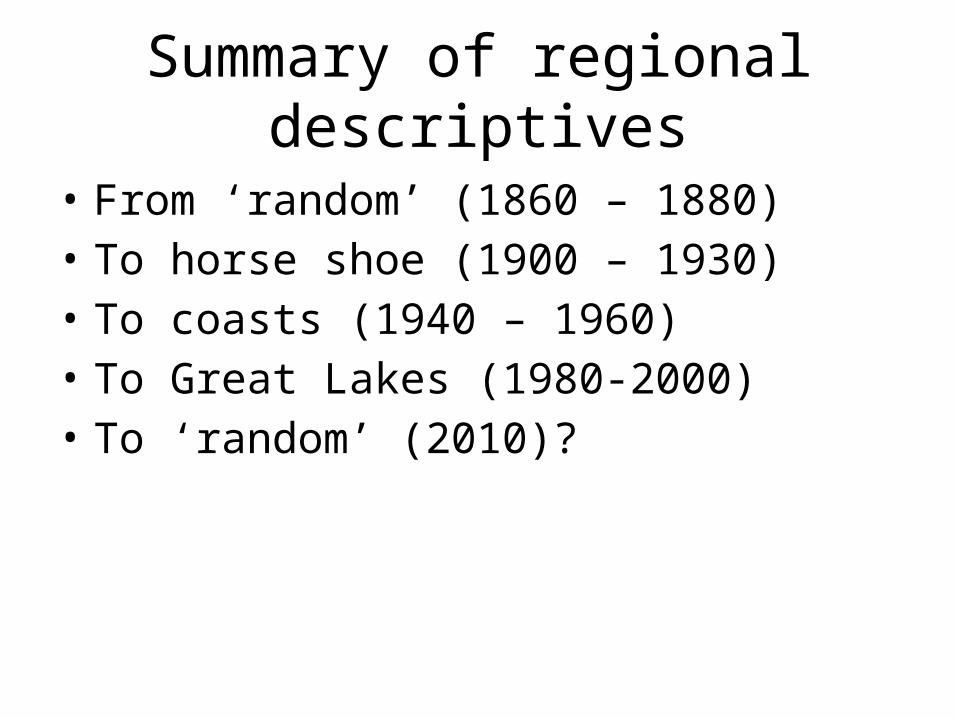
Summary of regional descriptives
• From ‘random’ (1860 – 1880)• To horse shoe (1900 – 1930)• To coasts (1940 – 1960)• To Great Lakes (1980-2000)• To ‘random’ (2010)?
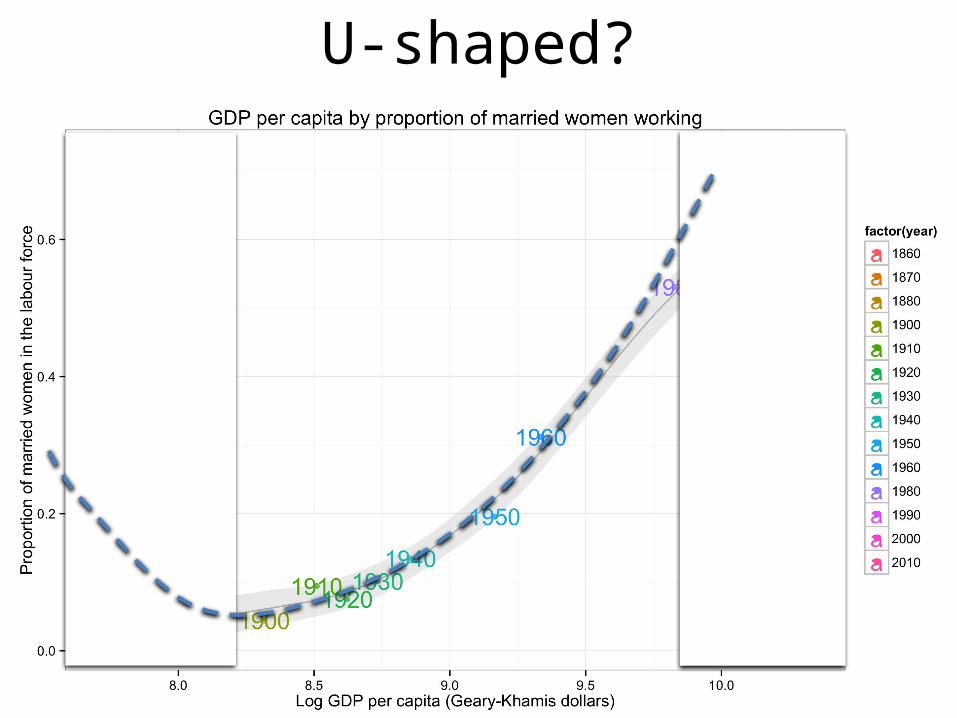
U-shaped?
Explanatory results
Model with just time and cubic time effect:• Non-linear effect indeed• Bottom of U at 1820, not 1920 (Goldin 1994)
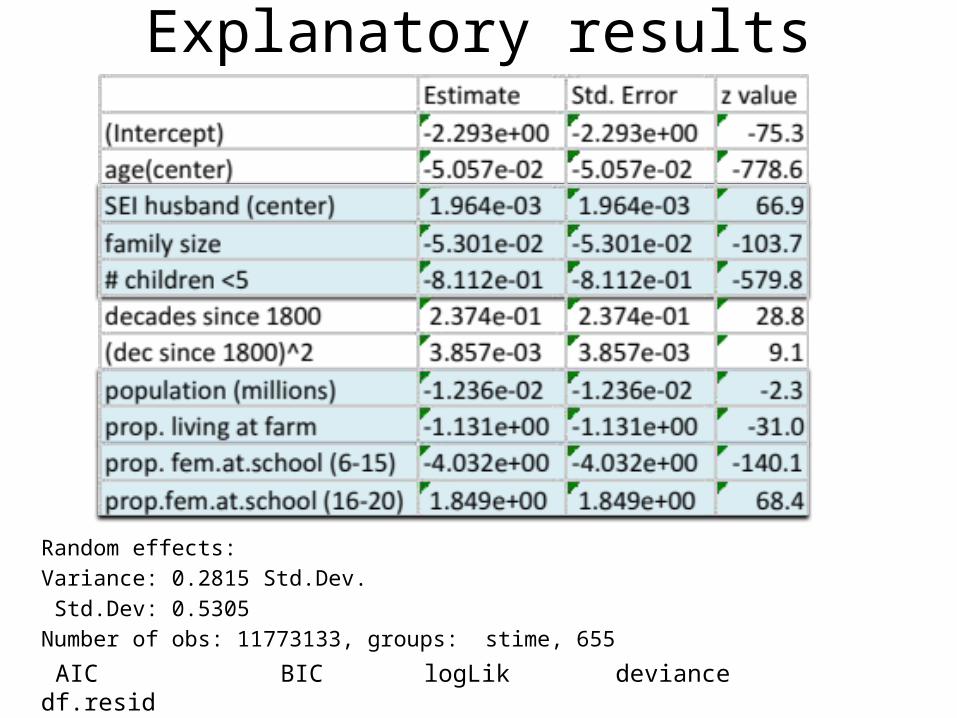
Explanatory results
Random effects:Variance: 0.2815 Std.Dev. Std.Dev: 0.5305 Number of obs: 11773133, groups: stime, 655
AIC BIC logLik deviance df.resid 11742052 11742224 -5871014 11742028 11773121

Conclusions
• On national level no evidence for U-shape• Mechanisms underlying the U-shape appear
to be correct though:– Inverse relation between FLFP and agriculture– Increased FLFP with higher secondary education• but: ‘white collar work’ or ‘cultural indicator’
– Inconclusive results for within or between family status hypotheses
Caveats
• Different definitions of and instructions on ‘being in the labor force’ over time– starting age– e.g. 1910 census data
• So far rather imprecise measures: – e.g. no sectorial information used
• No information on income -> SSHA 2016