laboratory study and prediction of calcium sulphate ... · laboratory study and prediction of...
TRANSCRIPT
62 The Open Petroleum Engineering Journal, 2008, 1, 62-73
1874-8341/08 2008 Bentham Open
Open Access
Laboratory Study and Prediction of Calcium Sulphate at High-Salinity Formation Water
Amer Badr Bin Merdhah* and Abu Azam Mohd Yassin
Faculty of Chemical and Natural Resources Engineering, Universiti Teknologi Malaysia, 81310 Skudai, Johor,
Malaysia
Abstract: Scale formation is one of the most serious oil field problems that inflict water injection systems primarily when
two incompatible waters are involved. Two waters are incompatible if they interact chemically and precipitate minerals
when mixed. This study was conducted to investigate the permeability reduction caused by deposition of calcium sulphate
in sandstone cores from mixing of injected sea water and formation water that contained high concentration of calcium
ion at various temperatures (50 - 80°C) and differential pressures (100 - 200 psig). The solubility of calcium sulphate
scale formed and how its solubility was affected by changes in salinity and temperatures (40 - 90°C) were also studied.
The morphology and particle size of scaling crystals formed as shown by Scanning Electron Microscopy (SEM) were also
presented. The results showed that a large extent of permeability reduction caused by calcium sulphate that deposited on
the rock pore surface. The rock permeability decline indicates the influence of the concentration of calcium ions. At
higher temperatures, the deposition of CaSO4 scale increases since the solubility of CaSO4 scale decreases with increasing
temperature. The deposition of CaSO4 scale during flow of injection waters into porous media was shown by Scanning
Electron Microscopy (SEM) micrographs. The results were utilized to build a general reaction rate equation to predict
CaSO4 deposition in sandstone cores for a given temperature, brine super-saturation and differential pressures.
Keywords: Scale deposition, scale solubility, concentration of calcium ion, temperature and pressure effects.
INTRODUCTION
Secondary recovery is one of the activities used to im-prove oil recovery. We have several method used in secon-dary recovery. For example, water and gas flooding. The injection of water or gas into the oil-bearing reservoir is to increase the recovery factor and to maintain the reservoir pressure. In water flooding, the injected water will react with both the water already in the pore space of the rock (forma-tion water) and with the mineral in the rock itself. This reac-tion will create scale formation.
Sulphate scale may result from changes in temperature and/ or pressure while water flow from one location to an-other, but the major cause of sulphate scaling is the chemical incompatibility between the injected water, with high con-centration of sulphate ion and formation waters, with high concentrations of calcium, barium and strontium ions.
Scale can occur at /or downstream of any point in the production system, at which super-saturation is generated. Super-saturation can be generated in single water by chang-ing the pressure and temperature conditions or by mixing two incompatible waters. Changes in temperature, pressure, pH, and CO2/H2S partial pressure could also contribute in forming a scale [1, 2].
A number of scale prediction models, all based on ther-modynamic consideration, have been developed [3, 4]. In such models, the scaling tendency or potential of the brine is estimated from its mineral composition and flow parameters
*Address correspondence to this author at the Faculty of Chemical and
Natural Resources Engineering, Universiti Teknologi Malaysia, 81310
Skudai, Johor, Malaysia; E-mail: [email protected]
through computing the solubility of the scaling mineral at the brine’s conditions. The degree of super-saturation is then used to estimate the potential amount of scale that the brine can ultimately precipitate. However, such thermodynamic models do not provide the rate at which the scale will be precipitated. For this, the reaction kinetics of scale formation must be considered.
Due to the limited availability of reaction kinetics data in the literature, especially for calcium sulphate precipitation within porous media, this study was conducted to measure and model the rate of this reaction. Since this was intended to be the first in a series of progressively elaborate studies, investigation was focused on the brine’s concentration and flow conditions rather than the porous medium.
SCALE DEPOSITION MECHANISMS
Scale deposition is one of the most serious oil field prob-lems that inflict water injection systems primarily when two incompatible waters are involved. Scale deposition can occur from one type of water because of super-saturation with scale-forming salts attributable to changes in the physical conditions under which the water exists. Scale also deposited in down-hole pumps, tubing, casing flow-lines, heater treaters, tanks and other production equipment and facilities. Scale can occur near the downstream of any point in the production system where super-saturation is generated. Super-saturation can be generated in water by changing the pressure and temperature conditions or by mixing two incompatible waters. The most common oilfield scales deposited are calcium carbonate, cal-cium sulphate, strontium sulphate and barium sulphate. Scale also can deposit when two incompatible waters are mixed and super-saturation is reached [5-10].
Prediction of Calcium Sulphate at High-Salinity Formation Water The Open Petroleum Engineering Journal, 2008, Volume 1 63
OILFIELD SCALE TYPES
The most common oilfield scales are listed in Table 1, along with the primary variables that affect their solubility [2]. These scales are sulfates such as calcium sulphate (anhy-drite, gypsum), barium sulphate (barite), and strontium sul-phate (celestite) and calcium carbonate. Other less common scales have also been reported such as iron oxides, iron sul-fides and iron carbonate.
WHERE DOES OILFIELD SCALE FORM?
The scaling reaction depends on there being adequate concentrations of sulphate ions in the injected seawater, and barium, strontium and calcium divalent cations in the forma-tion brine to generate sulphate scale or on there being enough bicarbonate and calcium ions to generate carbonate scale.
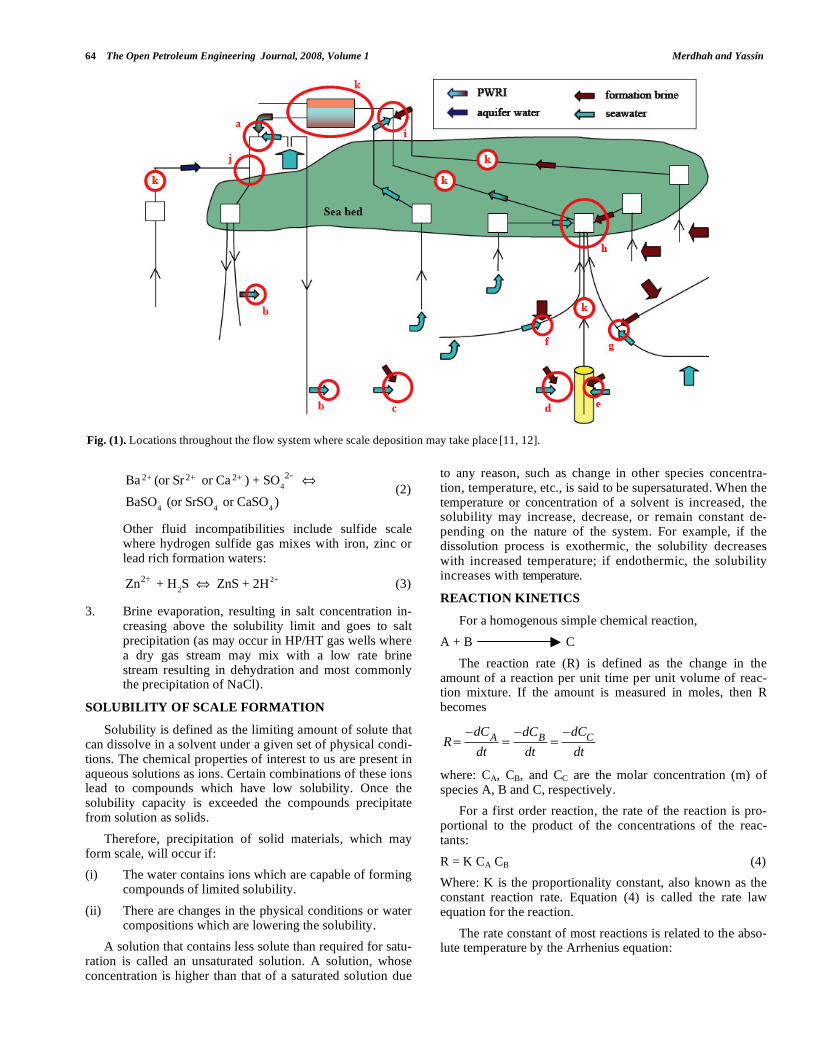
Therefore scale precipitation may occur wherever there is mixing of incompatible brines, or there are changes in the physical condition such as pressure decline. An overview of all the possible scale formation environments for seawater, aquifer, natural depletion and produced water re-injection is presented in Fig. (1) [11, 12].
a) Because injection, for example if seawater injection is supplement by produced water re-injection (PWRI).
b) Around the injection well, as injection brine enters the reservoir, contacting formation brine.
c) Deep in formation, due to displacement of formation brine by injected brine, or due to meeting flow paths.
d) As injection brine and formation brine converge to-wards the production well, but beyond the radius of a squeeze treatment.
e) As injection brine and formation brine converge to-wards the production well, and within the radius of a squeeze treatment.
f) In the completed interval of a production well, as one brine enters the completion, while other brine is fol-lowing up the tubing from a lower section, or as fluid pressure decreases.
g) At the junction of a multilateral well, where one branch is producing single brine and the other branch is producing incompatible brine.
h) At a sub-sea manifold, where one well is producing single brine and another well is producing different brine.
i) At the surface facilities, where one production stream is flowing one brine and another production stream is flowing another brine.
j) During aquifer water production and processing for re-injection could lead to scale formation within self-scaling brine or mixing with incompatible formation brine.
k) During pressure reduction and/or an increase in tem-perature within any down-hole tube or surface proc-essing equipment, leading to the evolution of CO2 and to the generation of carbonate and sulfide scale if the suitable ions are present. Temperature reductions could lead to the formation of halite scales if the brine was close to saturation under reservoir conditions.
Oilfield scales are inorganic crystalline deposits that form as a result of the precipitation of solids from brines present in the reservoir and production flow system. The precipita-tion of these solids occurs as the result of changes in the ionic composition, pH, pressure and temperature of the brine. There are three principal mechanisms by which scales form in both offshore and onshore oil field system [11, 13, 14]:
1. Decrease in pressure and/or increase in temperature of a brine, goes to a reduction in the solubility of the salt (most commonly these lead to precipitation of car-bonate scales, such as CaCO3).
Ca (HCO
3)
2 CaCO
3 + CO
2+ H
2O (1)
2. Mixing of two incompatible brines (most commonly formation water rich in cations such as barium, cal-cium and/or strontium, mixing with sulphate rich seawater, goes to the precipitation of sulphate scales, such as BaSO4).
Table 1. Most Common Oilfield Scales
Name Chemical Formula Primary Variables
Calcium Carbonate CaCO3 Partial pressure of CO2, temperature, total dissolved salts, pH
Calcium Sulfate:
Gypsum
Hemihydrate
Anhydrite
CaSO4.2H2O
CaSO4.H2O
CaSO4
Temperature, total dissolved salts, pressure
Barium Sulfate BaSO4 Temperature, pressure
Strontium Sulfate SrSO4 Temperature, pressure, total dissolved salts
Iron Compounds:
Ferrous Carbonate
Ferrous Sulfide
Ferrous Hydroxide
Ferrous Hydroxide
FeCO3
FeS
Fe(OH)2
Fe(OH)3
Corrosion, dissolved gases, pH
64 The Open Petroleum Engineering Journal, 2008, Volume 1 Merdhah and Yassin
Ba 2+ (or Sr 2+ or Ca 2+ ) + SO4
2-
BaSO4 (or SrSO
4 or CaSO
4)
(2)
Other fluid incompatibilities include sulfide scale where hydrogen sulfide gas mixes with iron, zinc or lead rich formation waters:
Zn2+ + H
2S ZnS + 2H2+
(3)
3. Brine evaporation, resulting in salt concentration in-creasing above the solubility limit and goes to salt precipitation (as may occur in HP/HT gas wells where a dry gas stream may mix with a low rate brine stream resulting in dehydration and most commonly the precipitation of NaCl).
SOLUBILITY OF SCALE FORMATION
Solubility is defined as the limiting amount of solute that can dissolve in a solvent under a given set of physical condi-tions. The chemical properties of interest to us are present in aqueous solutions as ions. Certain combinations of these ions lead to compounds which have low solubility. Once the solubility capacity is exceeded the compounds precipitate from solution as solids.
Therefore, precipitation of solid materials, which may form scale, will occur if:
(i) The water contains ions which are capable of forming compounds of limited solubility.
(ii) There are changes in the physical conditions or water compositions which are lowering the solubility.
A solution that contains less solute than required for satu-ration is called an unsaturated solution. A solution, whose concentration is higher than that of a saturated solution due
to any reason, such as change in other species concentra-tion, temperature, etc., is said to be supersaturated. When the temperature or concentration of a solvent is increased, the solubility may increase, decrease, or remain constant de-pending on the nature of the system. For example, if the dissolution process is exothermic, the solubility decreases with increased temperature; if endothermic, the solubility increases with temperature.
REACTION KINETICS
For a homogenous simple chemical reaction,
A + B C
The reaction rate (R) is defined as the change in the amount of a reaction per unit time per unit volume of reac-tion mixture. If the amount is measured in moles, then R becomes
R=
dCA
dt=
dCB
dt=
dCC
dt
where: CA, CB, and CC are the molar concentration (m) of species A, B and C, respectively.
For a first order reaction, the rate of the reaction is pro-portional to the product of the concentrations of the reac-tants:
R = K CA CB (4)
Where: K is the proportionality constant, also known as the constant reaction rate. Equation (4) is called the rate law equation for the reaction.
The rate constant of most reactions is related to the abso-lute temperature by the Arrhenius equation:
Fig. (1). Locations throughout the flow system where scale deposition may take place [11, 12].
Prediction of Calcium Sulphate at High-Salinity Formation Water The Open Petroleum Engineering Journal, 2008, Volume 1 65
K = Ae
EA
RT (5)
Where,
A: frequency factor
EA: reaction activation energy, J/mole
R: Universal gas constant = 8.314 J mole-1
K-1
T: absolute temperature, ºK.
If the Arrhenius equation applies, a plot of ln K versus 1/T should given a straight line of slope (-E/R) and intercept ln A. The frequency factor could depend on temperature, pressure and ionic strength of the solution.
FOR CaSO4 PRECIPITATION REACTION
Ca++
+ SO4-- CaSO4
Many rate laws have been proposed in the literature [15, 16]. But we used one of the rate laws was:
K = R Ksp / C
Ca C
SO4 (6)
Where:
K: kinetic rate constant (m. min-1
)
R: rate of the CaSO4 precipitation reaction (m. min-1
)
CCa, CSO4: average steady-state concentrations of the ions across the core (m)
Ksp: solubility product of CaSO4 in solution under the condi-tions of the reaction.
MATERIALS AND METHODS
Core Material
In all flooding experiments, sandstone cores from Malay-sia with 3inch length and of diameter 1inch with average porosity of 34% and of absolute permeability varied from 12.32 – 13.87 md. No oil was present in the cores. All the cores were cleaned using methanol in Soxhlet extractor and dried in a Memmert Universal Oven at 100°C for overnight before use.
Brines
The ionic compositions of synthetic formation water and water injection (Angsi and Barton seawaters) are given in Table 2. Note the formation water has calcium ion, and the sea water contains sulphate ion. It is clear that the mixing of these waters can lead to calcium sulphates precipitation.
Seven salts used for the preparation of synthetic forma-tion water and water injections, the description of these salts are as follow:
1. Sodium Chloride grade (AR) NaCl (M.Wt. = 58.44 g/mol, 99.8% purity) supplied by QReCTM.
2. Potassium Sulfate K2SO4 (M.Wt. = 174.25 g/mol, 99% purity) supplied by BHD chemicals Ltd Pool England.
3. Magnesium Chloride MgCl2.6H2O (M.Wt. = 203.30 g/mol, 98% purity) supplied by R&M Chemicals.
4. Calcium Chloride (dihydrate) grade (AR) CaCl2.2H2O (M.Wt. = 147.02 g/mol, 78% purity) supplied by QReCTM.
5. Sodium Bicarbonate NaHCO3 (M.Wt. = 84.01 g/mol, 99.5% purity) supplied by GCE Laboratory Chemi-cals.
6. Strontium Chloride (6-hydrate) SrCl2.6H2O (M.Wt. = 266.62 g/mol, 99% purity) supplied by GCE Labora-tory Chemicals.
7. Barium Chloride (dihydrate) grade (AR) BaCl2.2H2O (M.Wt. = 244.28 g/mol, 99% purity) supplied by QReCTM.
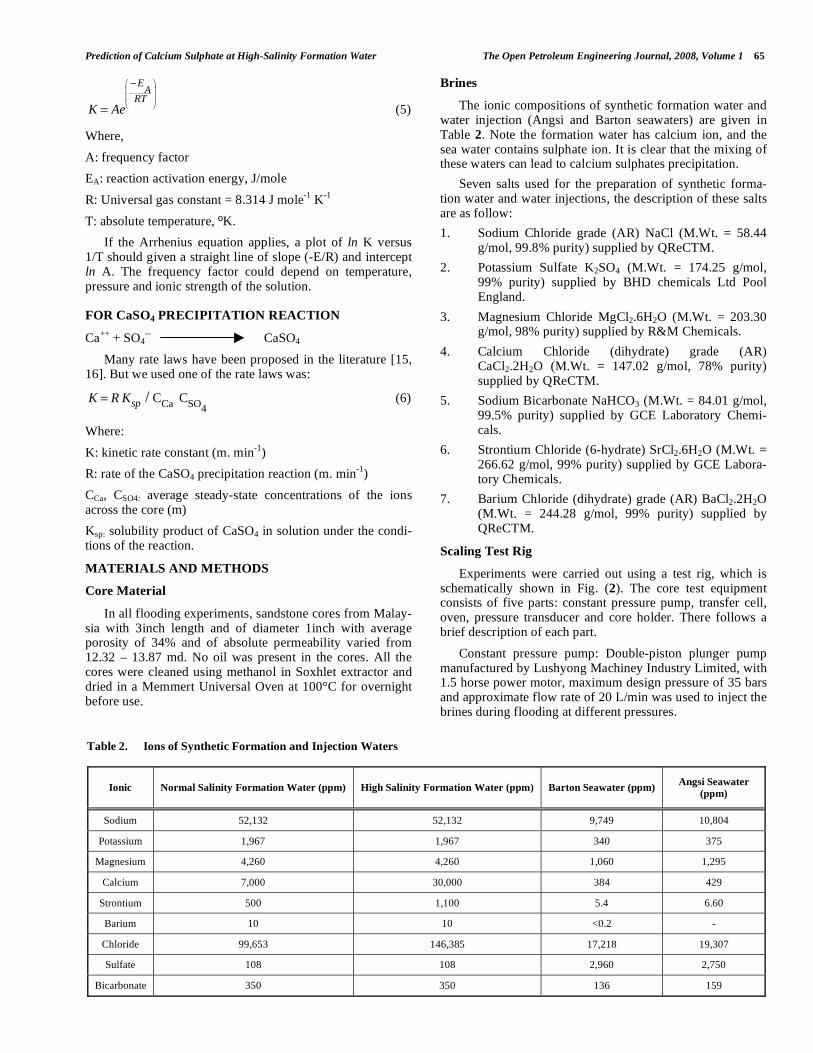
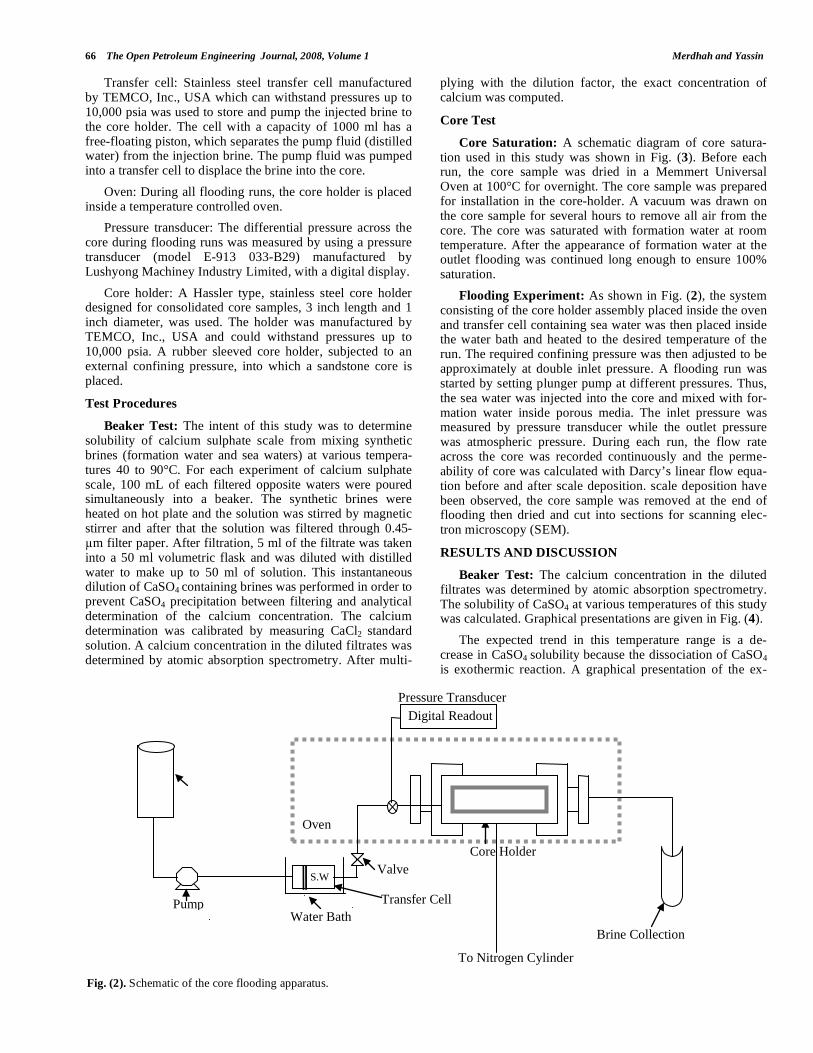
Scaling Test Rig
Experiments were carried out using a test rig, which is schematically shown in Fig. (2). The core test equipment consists of five parts: constant pressure pump, transfer cell, oven, pressure transducer and core holder. There follows a brief description of each part.
Constant pressure pump: Double-piston plunger pump manufactured by Lushyong Machiney Industry Limited, with 1.5 horse power motor, maximum design pressure of 35 bars and approximate flow rate of 20 L/min was used to inject the brines during flooding at different pressures.
Table 2. Ions of Synthetic Formation and Injection Waters
Ionic Normal Salinity Formation Water (ppm) High Salinity Formation Water (ppm) Barton Seawater (ppm) Angsi Seawater
(ppm)
Sodium 52,132 52,132 9,749 10,804
Potassium 1,967 1,967 340 375
Magnesium 4,260 4,260 1,060 1,295
Calcium 7,000 30,000 384 429
Strontium 500 1,100 5.4 6.60
Barium 10 10 <0.2 -
Chloride 99,653 146,385 17,218 19,307
Sulfate 108 108 2,960 2,750
Bicarbonate 350 350 136 159
66 The Open Petroleum Engineering Journal, 2008, Volume 1 Merdhah and Yassin
Transfer cell: Stainless steel transfer cell manufactured by TEMCO, Inc., USA which can withstand pressures up to 10,000 psia was used to store and pump the injected brine to the core holder. The cell with a capacity of 1000 ml has a free-floating piston, which separates the pump fluid (distilled water) from the injection brine. The pump fluid was pumped into a transfer cell to displace the brine into the core.
Oven: During all flooding runs, the core holder is placed inside a temperature controlled oven.
Pressure transducer: The differential pressure across the core during flooding runs was measured by using a pressure transducer (model E-913 033-B29) manufactured by Lushyong Machiney Industry Limited, with a digital display.
Core holder: A Hassler type, stainless steel core holder designed for consolidated core samples, 3 inch length and 1 inch diameter, was used. The holder was manufactured by TEMCO, Inc., USA and could withstand pressures up to 10,000 psia. A rubber sleeved core holder, subjected to an external confining pressure, into which a sandstone core is placed.
Test Procedures
Beaker Test: The intent of this study was to determine solubility of calcium sulphate scale from mixing synthetic brines (formation water and sea waters) at various tempera-tures 40 to 90°C. For each experiment of calcium sulphate scale, 100 mL of each filtered opposite waters were poured simultaneously into a beaker. The synthetic brines were heated on hot plate and the solution was stirred by magnetic stirrer and after that the solution was filtered through 0.45-
m filter paper. After filtration, 5 ml of the filtrate was taken into a 50 ml volumetric flask and was diluted with distilled water to make up to 50 ml of solution. This instantaneous dilution of CaSO4 containing brines was performed in order to prevent CaSO4 precipitation between filtering and analytical determination of the calcium concentration. The calcium determination was calibrated by measuring CaCl2 standard solution. A calcium concentration in the diluted filtrates was determined by atomic absorption spectrometry. After multi-
plying with the dilution factor, the exact concentration of calcium was computed.
Core Test
Core Saturation: A schematic diagram of core satura-tion used in this study was shown in Fig. (3). Before each run, the core sample was dried in a Memmert Universal Oven at 100°C for overnight. The core sample was prepared for installation in the core-holder. A vacuum was drawn on the core sample for several hours to remove all air from the core. The core was saturated with formation water at room temperature. After the appearance of formation water at the outlet flooding was continued long enough to ensure 100% saturation.
Flooding Experiment: As shown in Fig. (2), the system consisting of the core holder assembly placed inside the oven and transfer cell containing sea water was then placed inside the water bath and heated to the desired temperature of the run. The required confining pressure was then adjusted to be approximately at double inlet pressure. A flooding run was started by setting plunger pump at different pressures. Thus, the sea water was injected into the core and mixed with for-mation water inside porous media. The inlet pressure was measured by pressure transducer while the outlet pressure was atmospheric pressure. During each run, the flow rate across the core was recorded continuously and the perme-ability of core was calculated with Darcy’s linear flow equa-tion before and after scale deposition. scale deposition have been observed, the core sample was removed at the end of flooding then dried and cut into sections for scanning elec-tron microscopy (SEM).
RESULTS AND DISCUSSION
Beaker Test: The calcium concentration in the diluted filtrates was determined by atomic absorption spectrometry. The solubility of CaSO4 at various temperatures of this study was calculated. Graphical presentations are given in Fig. (4).
The expected trend in this temperature range is a de-crease in CaSO4 solubility because the dissociation of CaSO4 is exothermic reaction. A graphical presentation of the ex-
Fig. (2). Schematic of the core flooding apparatus.
Core Holder
Oven
Transfer Cell
To Nitrogen Cylinder
S.W
Water Bath Pump
Water Tank
Valve
Brine Collection
Digital Readout
Pressure Transducer

Prediction of Calcium Sulphate at High-Salinity Formation Water The Open Petroleum Engineering Journal, 2008, Volume 1 67
perimental results (Fig. 4) illustrates this trend in these ex-periments. The sulfate ion content in the sea water brine was reacted with calcium ion during heating. The more precipita-tion of CaSO4 results from the presence of a large concentra-tion of calcium ion as compare to less precipitation at normal concentrations of calcium ion.
3000
6000
9000
12000
15000
18000
21000
24000
27000
0 20 40 60 80 100
Temperature (oC)
So
lub
ility o
f C
aS
O4 (
ppm
)
Ca = 30000 ppm
Ca = 7000 ppm
Fig. (4). CaSO4 solubility is dependent on temperature.
Core Test
The main objective of this part of the investigation is to build a general reaction rate equation to predict CaSO4 depo-sition in sandstone cores and study permeability reduction caused by CaSO4 scale deposition in porous media.
During each run, the flow rate across the core was re-corded continuously and the permeability of core was calcu-lated using Darcy’s linear- flow equation. The flow rate de-creased during the experiments only when a super-saturated solution was flowing through the cores. This confirms that the decrease of flow rate is due to precipitation of the cal-cium sulphate inside the core with the consequent reduction in its permeability and porosity. In the following, extend of permeability damage and the results for various tempera-tures, differential pressure, and super-saturation are dis-cussed:
Extend of permeability reduction: Extend of perme-ability reduction caused by CaSO4 scaling in the rock pores varied in different situations. Fig. (5a) shows the permeability change of a less damaged core at temperature (50°C) and differential pressure (100 psig); Fig. (5b) shows that of a
severely damaged core after CaSO4 scaling at temperature (80°C) and differential pressure (200 psig). About 4% - 14% permeability reduction is observed in Fig. (5a), but more than 15% - 23% initial permeability reduction could occur in a heavily scaled core, as Fig. (5b) indicates. The reduction in permeability is possibly caused by crystals blocking the pore throats as shown in the SEM view of Fig. (12). The amount of precipitation varied within the sandstone cores, there being more scale near the formation water inlets and least scale was observed furthest from the inlet parts.
(a)
0.75
0.8
0.85
0.9
0.95
1
0 20 40 60 80 100 120
Time (min)
Pe
rme
ab
ility r
atio
(K
d/k
i)
High salinity
Normal salinity
(b)
0.75
0.8
0.85
0.9
0.95
1
0 20 40 60 80 100 120
Time (min)
Pe
rme
ab
ility r
atio
(K
d/k
i)
High salinity
Normal salinity
Fig. (5). Variation of permeability ratio as a function of time show-
ing the effect of concentration at (a) 100 psig and 50°C (b) 200 psig
and 80°C.
Fig. (3). Schematic of the core saturation apparatus.
ΔP = 100 psig T = 50 °C
ΔP = 200 psig T = 80 °C
68 The Open Petroleum Engineering Journal, 2008, Volume 1 Merdhah and Yassin
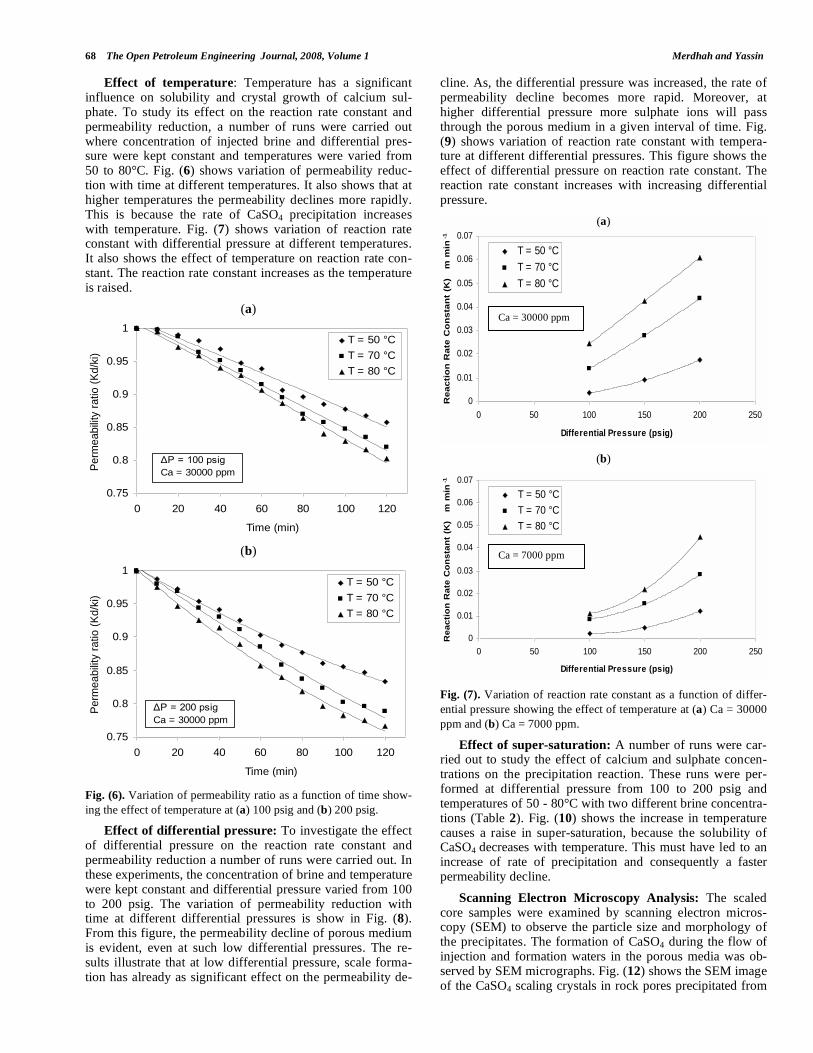
Effect of temperature: Temperature has a significant influence on solubility and crystal growth of calcium sul-phate. To study its effect on the reaction rate constant and permeability reduction, a number of runs were carried out where concentration of injected brine and differential pres-sure were kept constant and temperatures were varied from 50 to 80°C. Fig. (6) shows variation of permeability reduc-tion with time at different temperatures. It also shows that at higher temperatures the permeability declines more rapidly. This is because the rate of CaSO4 precipitation increases with temperature. Fig. (7) shows variation of reaction rate constant with differential pressure at different temperatures. It also shows the effect of temperature on reaction rate con-stant. The reaction rate constant increases as the temperature is raised.
(a)
0.75
0.8
0.85
0.9
0.95
1
0 20 40 60 80 100 120
Time (min)
Pe
rme
ab
ility r
atio
(K
d/k
i)
T = 50 °C
T = 70 °C
T = 80 °C
(b)
0.75
0.8
0.85
0.9
0.95
1
0 20 40 60 80 100 120
Time (min)
Pe
rme
ab
ility r
atio
(K
d/k
i)
T = 50 °C
T = 70 °C
T = 80 °C
Fig. (6). Variation of permeability ratio as a function of time show-
ing the effect of temperature at (a) 100 psig and (b) 200 psig.
Effect of differential pressure: To investigate the effect of differential pressure on the reaction rate constant and permeability reduction a number of runs were carried out. In these experiments, the concentration of brine and temperature were kept constant and differential pressure varied from 100 to 200 psig. The variation of permeability reduction with time at different differential pressures is show in Fig. (8). From this figure, the permeability decline of porous medium is evident, even at such low differential pressures. The re-sults illustrate that at low differential pressure, scale forma-tion has already as significant effect on the permeability de-
cline. As, the differential pressure was increased, the rate of permeability decline becomes more rapid. Moreover, at higher differential pressure more sulphate ions will pass through the porous medium in a given interval of time. Fig. (9) shows variation of reaction rate constant with tempera-ture at different differential pressures. This figure shows the effect of differential pressure on reaction rate constant. The reaction rate constant increases with increasing differential pressure.
(a)
0
0.01
0.02
0.03
0.04
0.05
0.06
0.07
0 50 100 150 200 250
Differential Pressure (psig)
Re
ac
tio
n R
ate
Co
ns
tan
t (K
)
m m
in-1
T = 50 °C
T = 70 °C
T = 80 °C
(b)
0
0.01
0.02
0.03
0.04
0.05
0.06
0.07
0 50 100 150 200 250
Differential Pressure (psig)
Re
ac
tio
n R
ate
Co
ns
tan
t (K
)
m m
in-1
T = 50 °C
T = 70 °C
T = 80 °C
Fig. (7). Variation of reaction rate constant as a function of differ-
ential pressure showing the effect of temperature at (a) Ca = 30000
ppm and (b) Ca = 7000 ppm.
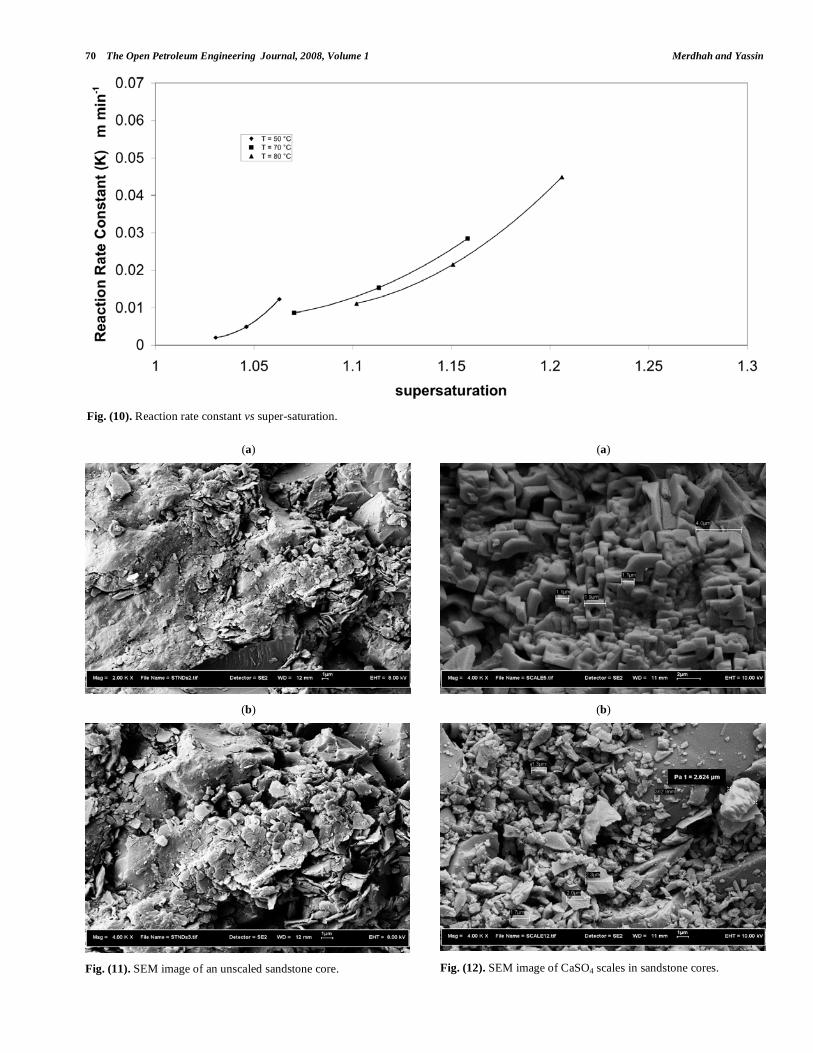
Effect of super-saturation: A number of runs were car-ried out to study the effect of calcium and sulphate concen-trations on the precipitation reaction. These runs were per-formed at differential pressure from 100 to 200 psig and temperatures of 50 - 80°C with two different brine concentra-tions (Table 2). Fig. (10) shows the increase in temperature causes a raise in super-saturation, because the solubility of CaSO4 decreases with temperature. This must have led to an increase of rate of precipitation and consequently a faster permeability decline.
Scanning Electron Microscopy Analysis: The scaled core samples were examined by scanning electron micros-copy (SEM) to observe the particle size and morphology of the precipitates. The formation of CaSO4 during the flow of injection and formation waters in the porous media was ob-served by SEM micrographs. Fig. (12) shows the SEM image of the CaSO4 scaling crystals in rock pores precipitated from
Ca = 30000 ppm
Ca = 7000 ppm
ΔP = 100 psig Ca = 30000 ppm
ΔP = 200 psig Ca = 30000 ppm

Prediction of Calcium Sulphate at High-Salinity Formation Water The Open Petroleum Engineering Journal, 2008, Volume 1 69
mixed seawater with formation water inside the cores. The average size of CaSO4 crystals precipitated from mixed brines was about 1.8 m.
(a)
0.75
0.8
0.85
0.9
0.95
1
0 20 40 60 80 100 120
Time (min)
Pe
rme
ab
ility r
atio
(K
d/k
i)
T = 50 °C
Ca = 30000 ppm
(b)
0.75
0.8
0.85
0.9
0.95
1
0 20 40 60 80 100 120Time (min)
Pe
rme
ab
ility r
atio
(K
d/k
i)
P = 100 psig
P = 150 psig
P = 200 psig
T = 80 °C
Ca = 30000 ppm
Fig. (8). Variation of permeability ratio as a function of time show-
ing the effect of differential pressure at (a) 50°C and (b) 80°C.
In all core tests, the abundance of scale reduced signifi-cantly from the front of the core to the rear indicating that scale formation in the porous media was rapid with the ob-servation that the flow rate decreased soon after two incom-patible waters were mixed into a core.
In general, Fig. (12) indicates that the front sections of a core suffered considerable greater scaling damage. The rea-son the scaling decreased downstream of a core is clear, most of the scaling ions had deposited within the front sections as soon as they were mixed and left few ions to precipitate from the flow stream in the rear sections. Fig. (11) shows a SEM image of an unscaled core samples.
Rate Constant (K) Calculations
Since calcium concentration profile across the core is not available, the average reaction rate across the core is calcu-lated by:
Rate (R) = -d C
Ca
dt=
CCa
t=
CCa out
CCa in
t=
CCa in
CCa out
t
(m min-1
)
t is the residence time of the brine in the core as given by:
t =Vp
Q
Where,
Q: brine injection flow rate (ml/min)
Vp: pore volume of the core sample (ml)
A total of 8 runs were performed and given the following data of run 3 for example:
CCa = 0.00224 m and t = 0.57668 min. Thus
R=
0.00224
0.57668 = 0.00389 m min-1
(a)
0
0.01
0.02
0.03
0.04
0.05
0.06
0.07
320 325 330 335 340 345 350 355 360
Temperature (K)
Re
ac
tio
n R
ate
Co
ns
tan
t (K
)
m m
in-1
P = 200 psig
P = 150 psig
P = 100 psig
(b)
0
0.01
0.02
0.03
0.04
0.05
0.06
0.07
320 325 330 335 340 345 350 355 360
Temperature (K)
Re
ac
tio
n R
ate
Co
ns
tan
t (K
)
m m
in-1
P = 200 psig
P = 150 psig
P = 100 psig
Fig. (9). Variation of reaction rate constant as a function of tempera-
ture showing the effect of differential pressure at (a) Ca = 30000 ppm
and (b) Ca = 7000 ppm.
To compute the reaction rate constant for run 3, a rate law is employed; however, with average values of CCa, CSO4, and Ksp as demonstrated below using Equ. 6:
K = R Ksp / C
Ca C
SO4
Where,
CCa, CSO4: average steady-state concentrations of the ions across the core (m).
Ksp: solubility product of CaSO4 in solution under the condi-tions of the reaction (m).
Ca = 7000 ppm
Ca = 30000 ppm
ΔP = 100 psigΔP = 150 psigΔP = 200 psig
ΔΔ
Δ
ΔΔΔ
ΔΔΔ
70 The Open Petroleum Engineering Journal, 2008, Volume 1 Merdhah and Yassin
(a)
(b)
Fig. (11). SEM image of an unscaled sandstone core.
(a)
(b)
Fig. (12). SEM image of CaSO4 scales in sandstone cores.
Fig. (10). Reaction rate constant vs super-saturation.
Prediction of Calcium Sulphate at High-Salinity Formation Water The Open Petroleum Engineering Journal, 2008, Volume 1 71
Given the following data for run 3:
CCa = (30000 + 29910.21)/ 2 = 29955.11 PPM = 0.74888 m
CSO4= (2855 + 2640)/ 2 = 2747.50 PPM = 0.02865 m (outlet value estimated from material balance)
Ksp = [Ca2+
] [SO42-
] = 0.74776 * 0.02753 = 0.02058 m2
The reaction rate constant becomes K = 0.00373 m min-1
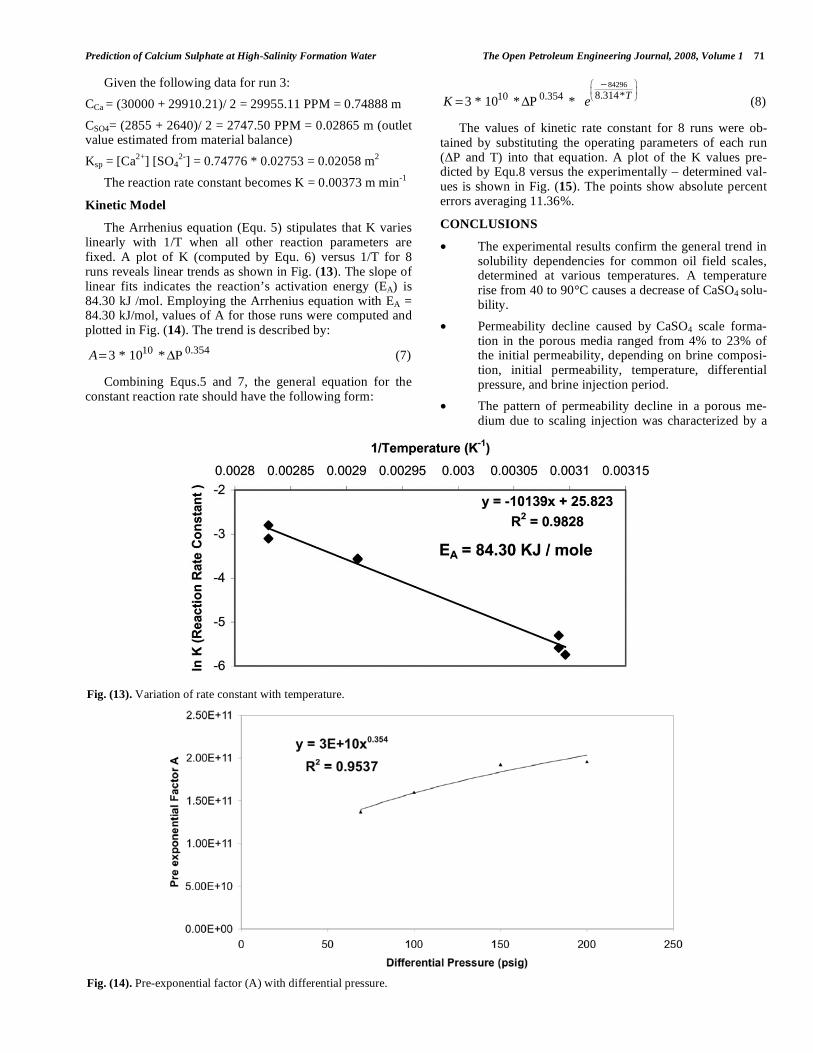
Kinetic Model
The Arrhenius equation (Equ. 5) stipulates that K varies linearly with 1/T when all other reaction parameters are fixed. A plot of K (computed by Equ. 6) versus 1/T for 8 runs reveals linear trends as shown in Fig. (13). The slope of linear fits indicates the reaction’s activation energy (EA) is 84.30 kJ /mol. Employing the Arrhenius equation with EA = 84.30 kJ/mol, values of A for those runs were computed and plotted in Fig. (14). The trend is described by:
A= 3 * 1010 * P
0.354 (7)
Combining Equs.5 and 7, the general equation for the constant reaction rate should have the following form:
K = 3 * 1010 * P
0.354* e
84296
8.314*T (8)
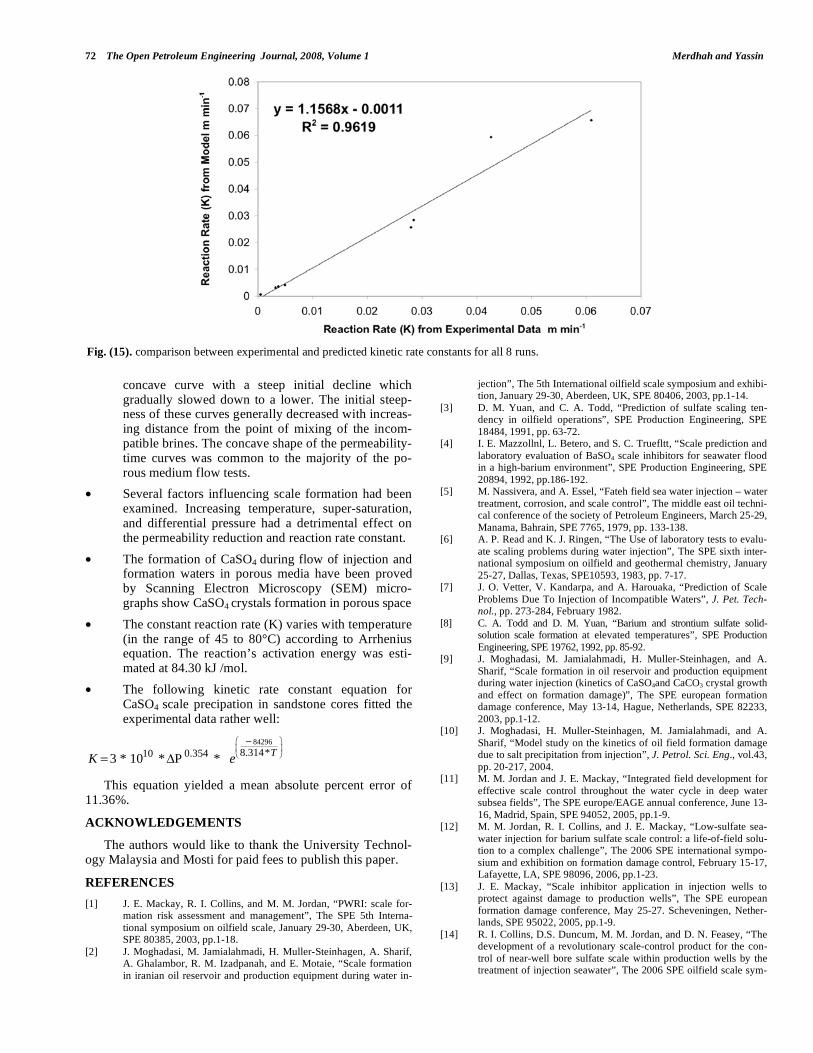
The values of kinetic rate constant for 8 runs were ob-tained by substituting the operating parameters of each run ( P and T) into that equation. A plot of the K values pre-dicted by Equ.8 versus the experimentally – determined val-ues is shown in Fig. (15). The points show absolute percent errors averaging 11.36%.
CONCLUSIONS
• The experimental results confirm the general trend in solubility dependencies for common oil field scales, determined at various temperatures. A temperature rise from 40 to 90°C causes a decrease of CaSO4 solu-bility.
• Permeability decline caused by CaSO4 scale forma-tion in the porous media ranged from 4% to 23% of the initial permeability, depending on brine composi-tion, initial permeability, temperature, differential pressure, and brine injection period.
• The pattern of permeability decline in a porous me-dium due to scaling injection was characterized by a
Fig. (13). Variation of rate constant with temperature.
Fig. (14). Pre-exponential factor (A) with differential pressure.
72 The Open Petroleum Engineering Journal, 2008, Volume 1 Merdhah and Yassin
concave curve with a steep initial decline which gradually slowed down to a lower. The initial steep-ness of these curves generally decreased with increas-ing distance from the point of mixing of the incom-patible brines. The concave shape of the permeability-time curves was common to the majority of the po-rous medium flow tests.
• Several factors influencing scale formation had been examined. Increasing temperature, super-saturation, and differential pressure had a detrimental effect on the permeability reduction and reaction rate constant.
• The formation of CaSO4 during flow of injection and formation waters in porous media have been proved by Scanning Electron Microscopy (SEM) micro-graphs show CaSO4 crystals formation in porous space
• The constant reaction rate (K) varies with temperature (in the range of 45 to 80°C) according to Arrhenius equation. The reaction’s activation energy was esti-mated at 84.30 kJ /mol.
• The following kinetic rate constant equation for CaSO4 scale precipation in sandstone cores fitted the experimental data rather well:
K = 3 * 1010 * P
0.354* e
84296
8.314*T
This equation yielded a mean absolute percent error of 11.36%.
ACKNOWLEDGEMENTS
The authors would like to thank the University Technol-ogy Malaysia and Mosti for paid fees to publish this paper.
REFERENCES
[1] J. E. Mackay, R. I. Collins, and M. M. Jordan, “PWRI: scale for-mation risk assessment and management”, The SPE 5th Interna-
tional symposium on oilfield scale, January 29-30, Aberdeen, UK, SPE 80385, 2003, pp.1-18.
[2] J. Moghadasi, M. Jamialahmadi, H. Muller-Steinhagen, A. Sharif, A. Ghalambor, R. M. Izadpanah, and E. Motaie, “Scale formation
in iranian oil reservoir and production equipment during water in-
jection”, The 5th International oilfield scale symposium and exhibi-tion, January 29-30, Aberdeen, UK, SPE 80406, 2003, pp.1-14.
[3] D. M. Yuan, and C. A. Todd, “Prediction of sulfate scaling ten-dency in oilfield operations”, SPE Production Engineering, SPE
18484, 1991, pp. 63-72. [4] I. E. Mazzollnl, L. Betero, and S. C. Truefltt, “Scale prediction and
laboratory evaluation of BaSO4 scale inhibitors for seawater flood in a high-barium environment”, SPE Production Engineering, SPE
20894, 1992, pp.186-192. [5] M. Nassivera, and A. Essel, “Fateh field sea water injection – water
treatment, corrosion, and scale control”, The middle east oil techni-cal conference of the society of Petroleum Engineers, March 25-29,
Manama, Bahrain, SPE 7765, 1979, pp. 133-138. [6] A. P. Read and K. J. Ringen, “The Use of laboratory tests to evalu-
ate scaling problems during water injection”, The SPE sixth inter-national symposium on oilfield and geothermal chemistry, January
25-27, Dallas, Texas, SPE10593, 1983, pp. 7-17. [7] J. O. Vetter, V. Kandarpa, and A. Harouaka, “Prediction of Scale
Problems Due To Injection of Incompatible Waters”, J. Pet. Tech-nol., pp. 273-284, February 1982.
[8] C. A. Todd and D. M. Yuan, “Barium and strontium sulfate solid-solution scale formation at elevated temperatures”, SPE Production
Engineering, SPE 19762, 1992, pp. 85-92. [9] J. Moghadasi, M. Jamialahmadi, H. Muller-Steinhagen, and A.
Sharif, “Scale formation in oil reservoir and production equipment during water injection (kinetics of CaSO4and CaCO3 crystal growth
and effect on formation damage)”, The SPE european formation damage conference, May 13-14, Hague, Netherlands, SPE 82233,
2003, pp.1-12. [10] J. Moghadasi, H. Muller-Steinhagen, M. Jamialahmadi, and A.
Sharif, “Model study on the kinetics of oil field formation damage due to salt precipitation from injection”, J. Petrol. Sci. Eng., vol.43,
pp. 20-217, 2004. [11] M. M. Jordan and J. E. Mackay, “Integrated field development for
effective scale control throughout the water cycle in deep water subsea fields”, The SPE europe/EAGE annual conference, June 13-
16, Madrid, Spain, SPE 94052, 2005, pp.1-9. [12] M. M. Jordan, R. I. Collins, and J. E. Mackay, “Low-sulfate sea-
water injection for barium sulfate scale control: a life-of-field solu-tion to a complex challenge”, The 2006 SPE international sympo-
sium and exhibition on formation damage control, February 15-17, Lafayette, LA, SPE 98096, 2006, pp.1-23.
[13] J. E. Mackay, “Scale inhibitor application in injection wells to protect against damage to production wells”, The SPE european
formation damage conference, May 25-27. Scheveningen, Nether-lands, SPE 95022, 2005, pp.1-9.
[14] R. I. Collins, D.S. Duncum, M. M. Jordan, and D. N. Feasey, “The development of a revolutionary scale-control product for the con-
trol of near-well bore sulfate scale within production wells by the treatment of injection seawater”, The 2006 SPE oilfield scale sym-
Fig. (15). comparison between experimental and predicted kinetic rate constants for all 8 runs.
Prediction of Calcium Sulphate at High-Salinity Formation Water The Open Petroleum Engineering Journal, 2008, Volume 1 73
posium, 31 May- 1 June, Aberdeen, UK, SPE 100357, 2006, pp.1-
20. [15] P. G. Bedrikovistsky, R. P. Lopes, F. F. Rosario, M. C. Bezerra,
and E. A. Lima, “Oilfield scaling- part 1: mathematical and labora-tory modelling”, The SPE Latin American and Caribbean petro-
leum engineering conference., April 27-30, Trinidad, West Indies, SPE 81127, 2003, pp. 1-13.
[16] P. G. Bedrikovistsky, R. P. Lopes, F. F. Rosario, M. C. Bezerra,
and E. A. Lima, “Barium sulphate oilfield scaling: mathematical and laboratory modelling”, The SPE 6th international symposium
on oilfield scale, May 26-27, Aberdeen, UK, SPE 87457, 2004, pp. 1-13.
Received: September 1, 2008 Revised: September 20, 2008 Accepted: October 7, 2008
© Merdhah and Yassin; Licensee Bentham Open.
This is an open access article licensed under the terms of the Creative Commons Attribution Non-Commercial License (http://creativecommons.org/licenses/by-nc/3.0/) which permits unrestricted, non-commercial use, distribution and reproduction in any medium, provided the work is properly cited.