laboratory calibration of time-domain reflectometry and analysis of soil water content in korea ltpp...
TRANSCRIPT
KSCE Journal of Civil Engineering (2010) 14(4):503-511DOI 10.1007/s12205-010-0503-z
− 503 −
www.springer.com/12205
Highway Engineering
Laboratory Calibration of Time-Domain Reflectometry and Analysis ofSoil Water Content in Korea LTPP Sections
Booil Kim*
Received July, 30, 2009/Revised October 26, 2009/Accepted November 4, 2009
···································································································································································································································
Abstract
The water content of pavement substructure can exert a great influence on the pavement performance. Recently, TDR (Time-Domain Reflectometry) probe has been used to measure the water content of pavement substructure in the field. The accuracy ofTDR probe in the measurement of water content generally depends on the type, particle size, density, and temperature of the material,necessitating the need for the laboratory calibration of the TDR measurement. This study carried out the laboratory calibration ofTDR probe (CS616) for water content of subbase and subgrade material in Korea LTPP (Long Term Pavement Performance)sections. Calibration equations for the TDR probe were then developed based on the laboratory tests, and verified by checking thewater content of the soil obtained from the field. Additionally, from the analysis of two year field data in Korea LTPP, it was foundthat the TDR probe was capable of verifying the freezing, unfrozen water, and matric suction present in pavement structure. Keywords: TDR probe calibration, soil water content, Korea LTPP
···································································································································································································································
1. Introduction
The water content of substructure in pavement can exert agreat influence on the performance of pavement. The increase ofwater content in substructure causes a severe deterioration ofpavement structure by expansion of soil and decreasing itsbearing capacity. In addition, one of important factors in pave-ment deterioration is the frost heaving in winter season and theloss of bearing capacity during thawing season. TDR (Time-Domain Reflectometry) probe is one of the effective methods forcontinually monitoring the water content of pavement substruc-ture non-destructively in the field. However, TDR probe canresult in measurement variability due to the type of the soil, parti-cle size, compaction density, and temperature, necessitating acalibration test. Thus, USA LTPP has developed a calibrationequation through laboratory calibration test and field verification.
This study carried out laboratory calibration tests of TDRprobe (CS616) for the subgrade material and subbase material ofKorea LTPP sections. Based on the experimental results, a cali-bration equation is suggested. The verification of the calibrationequation was performed by checking the water content of soil inthe field at the time of laying the TDR probe under the ground.Additionally, an analysis of two year water content data in KoreaLTPP was carried out with respect to the occurrence of frostheaving, the amount of unfrozen water, and the change of matricsuction.
2. TDR Probe for Water Content
When an insulator is placed in an electric field, there is aphenomenon of an electric charge being left on the surface. Theinsulator with this phenomenon is called a dielectric material.The dielectric material does not have a free electron on its orbit.However, when the proton and electron are skewed from itsnormal orbit, it manifests a little polarity, and the degree ofpolarity is standardized by the moment of the electric dipole.
The dielectric constant is the ratio of electricity capacity of thecase of a dielectric material put in between two electrodes to thecase of a dielectric material not put in between two electrodes(more precisely speaking, in vacuum). The dielectric constant ofwater is about 80, and that of dried soil varies between 3~8depending on the electric conductivity and density of soil. Thus,the principle of TDR probe is based on this difference indielectric constant between water and soil.
The principle of TDR probe is again based on the travel timeof electromagnetic wave emitted from a material of electricdiscontinuity. Dielectric constant is computed from the traveltime of electromagnetic wave and the length of waveguide.When the travel time varies in accordance with the change inelectric characteristics of materials around the wave guide, thedielectric constant will also vary. The speed of electromagneticwave traveling through the waveguide in the soil, v, can beexpressed as in Eq. (1).
*Member, Senior Researcher, Korea Institute of Construction Technology, Goyang 411-712, Korea (E-mail: [email protected])

Booil Kim
− 504 − KSCE Journal of Civil Engineering
(1)
Where, c = speed of light in vacuum (3×10⁸ m/s)Ka = dielectric constant
From Eq. (1), the dielectric constant can be represented as inEq. (2) below.
(2)
Where, t = travel time of electromagnetic wave measured by aTDR probe (sec)
L = length of TDR waveguide (m)
Davis and Chudobiak (1975) developed a method to measurethe dielectric constant of soil using TDR. Topp et al. (1980) sug-gested a general relationship to determine the VWC (VolumetricWater Content) by measuring the dielectric constant Ka.However, it had a limitation in that it did not consider the density,property and salt content of the soil. The relational equation assuggested by Topp et al. (1980) follows:
(3)
A LTPP-Seasonal Monitoring Program (SMP) of the USAinstalled measuring sensors in 64 sections out of 3,000 LTPPsections to evaluate the environmental status of pavement (Jiangand Tayabji, 1999). The 64 sections were selected by consideringthe pavement pattern and thickness, subgrade type, weather con-ditions, etc. Especially, a TDR probe was employed to measurethe water content of granular layer material and subgrade layer.A calibration equation of TDR probe was suggested for aggre-gate type and dielectric constant in measuring the water content.It is shown as in Eqs. (4) and (5) below:
Third-Order Polynomial Ka Model: (4)
Fine-Gradation Model:
(5)
Where, a0~a10 =regression coefficients, Ka =dielectric constant,G112 =percent passing 1.5 inch sieve, G12 =percent passing 0.5inch sieve, No4=percent passing No.4 sieve, No10=percentpassing No.10 sieve, No200=percent passing No.200 sieve, PL=Plastic limit, LL=Liquid limit
Virginia Smart Road was also installed with CS610 and CS615TDR probe, and calibration equations were suggested for electri-city conductivity of the soil through the laboratory calibrationexperiment. Comparing the data of CS610 and CS615, no signi-ficant difference was noted. Thus, CS615 was recommended, forit does not require an interface device and the output is a type ofperiod (Diefenderfer et al., 2000).
CS616 TDR probe, which was manufactured by Campbell
Scientific in the USA, was used in this study. This TDR probe isan upgraded product from its earlier models, CS610 and CS615,which have been used in LTPP of the USA and other test roads.CS616 TDR probe consists of a circuit board and two stainlesssteel rods connected to the board. The high speed electro-magnetic components of the circuit board are arranged by abistable multivibrator. The output signal of the multivibrator isconnected to the rod used as a waveguide. The signal travel timethrough the rod depends on the dielectric constant of the materialssurrounding the rod, and the dielectric constant depends on thewater content of the material in return.
The output signal through CS616 TDR probe is produced in asquare wave-form with a wave length of ±0.7 volts, and theoutput value is periodic. Its periodic time is 15 microseconds and41 microseconds in the air and water, respectively. Using thisdifference, a heuristic equation between the periodic value andwater content is established. From this equation, the watercontent of soil can be predicted. However, it is generallysuggested that calibration test should be performed for the soilbefore applying it in the field. This is because TDR probe isgreatly influenced by the material characteristics.
3. Materials and Experiments
Three sections, A, B, and C, among Korea LTPP sections wereselected to carry out calibration experiments for TDR probe onthe subgrade and subbase materials. The results of soil tests areshown in Table 1.
There is no regulation or specification regarding the calibra-tion experiment for TDR probe in Korea. Thus, after investiga-tion of the calibration experiment procedures applied in othercountries (Diefenderfer, Al-qadi and Loulizi, 2000), we established
v cKa
---------=
KactL----⎝ ⎠⎛ ⎞
2
=
VWC 5.3 2–×10– 2.92 2–×10 Ka+ 5.5 4–×10 Ka2– 4.3 6–×10 Ka
3+=
VWC a0 a1Ka a2Ka2 a3Ka
3+ + +=
VWC a0 a1Ka a2Ka2 a3Ka
3 a4G112 a5G12 a6No4+ + + + + +=a7No10 a8No200 a9PL a10LL+ + + +
Table 1. Results of Soil Tests of Subgrade and Subbase Material
Subgrade material
Soil Properties A section B section C section
Density (g/cm3) 2.747 2.656 2.635
Maximum Size (mm) 19 19 19
Unified Classification System SM SW SW
Optimum Water Content (%) 12.1 11.38 9.23
Maximum Dry Unit Weight (g/cm3) 1.971 1.926 1.910
CBR (%) 14.4 9.23 12.06
Subbase material
Soil Properties A section B section C section
Density (g/cm3) 2.640 2.701 2.740
Maximum Size (mm) 37.5 37.5 37.5
Unified Classification System GW GW GW
Optimum Water Content (%) 6.3 6.3 5.25
Maximum Dry Unit Weight (g/cm3) 2.181 2.208 2.146
CBR (%) 43 38 35
Laboratory Calibration of Time-Domain Reflectometry and Analysis of Soil Water Content in Korea LTPP Sections
Vol. 14, No. 4 / July 2010 − 505 −
a laboratory calibration experiment procedure appropriate forKorean situation. The laboratory calibration experimental pro-cedure is as follows.1. A box of 0.60 m×0.60 m×0.30 m (m=meters) dimension is
made. (The box must be made not of metal but of wood only.This is because the rod of the TDR probe functions like anantenna and can exert an influence on the data measured byTDR probe. The box dimension (0.60 m×0.60 m×0.30 m)should be exceed by 9 inches, as recommended by TDR probemanufacturer’s manual (Campbell Scientific, Inc., 2002)
2. The weights of Soil and water are measured depending onwater ratio, and then they are mixed.
3. The mixed soil is put in the wooden box and compacted inthree layers using a compacting board.
4. Two or three measuring probes for water content is installed inthe second layer.
5. When the soil filling is finished, the measuring probe isconnected to a data logger. Then, TDR probe output is mea-sured.
6. After measurement, the soil in the upper layer of the box isremoved. Then, soil is sampled.
7. The sampled soil is then weighed and dried. Then the driedsoil is weighed again.
This weighing procedure follows KS (Korean Industrial Stan-dards) F 2306 (Korean Agency for Technology and Standards,2000). This study carried out a laboratory calibration experimentof the TDR probe by varying the gravimetric water ratio ofsubgrade and subbase material between 0%~18% and 0%~8% atA, B and C sections in Korea LTPP, respectively.
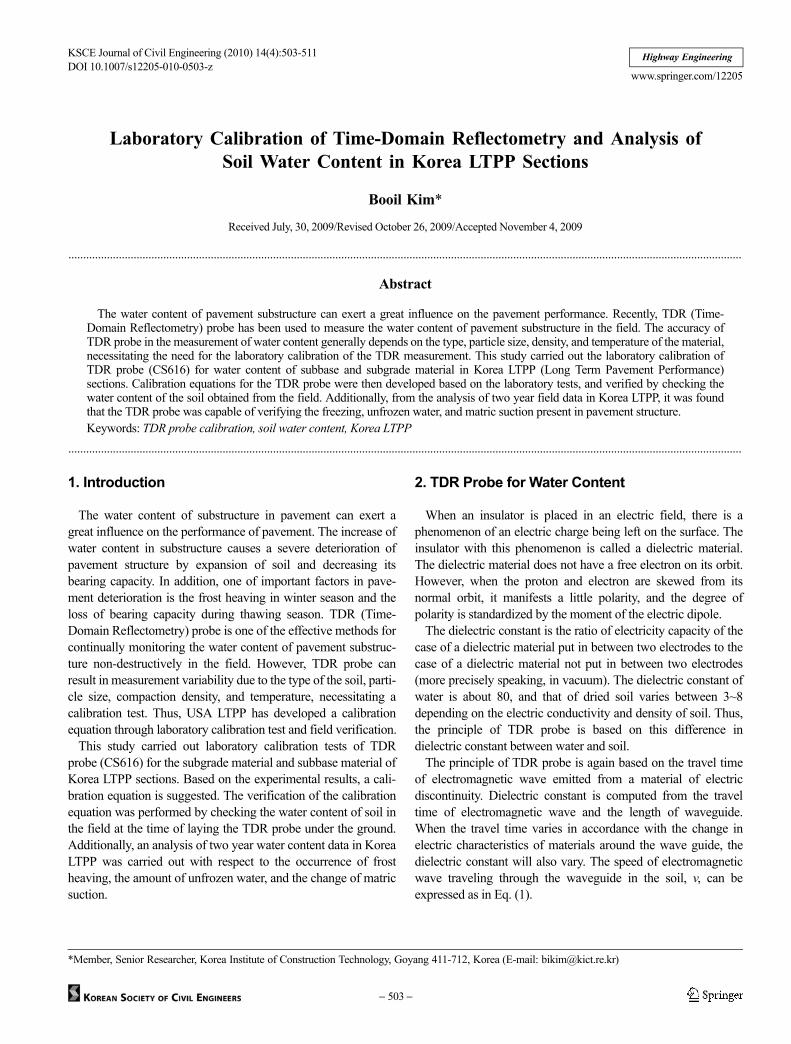
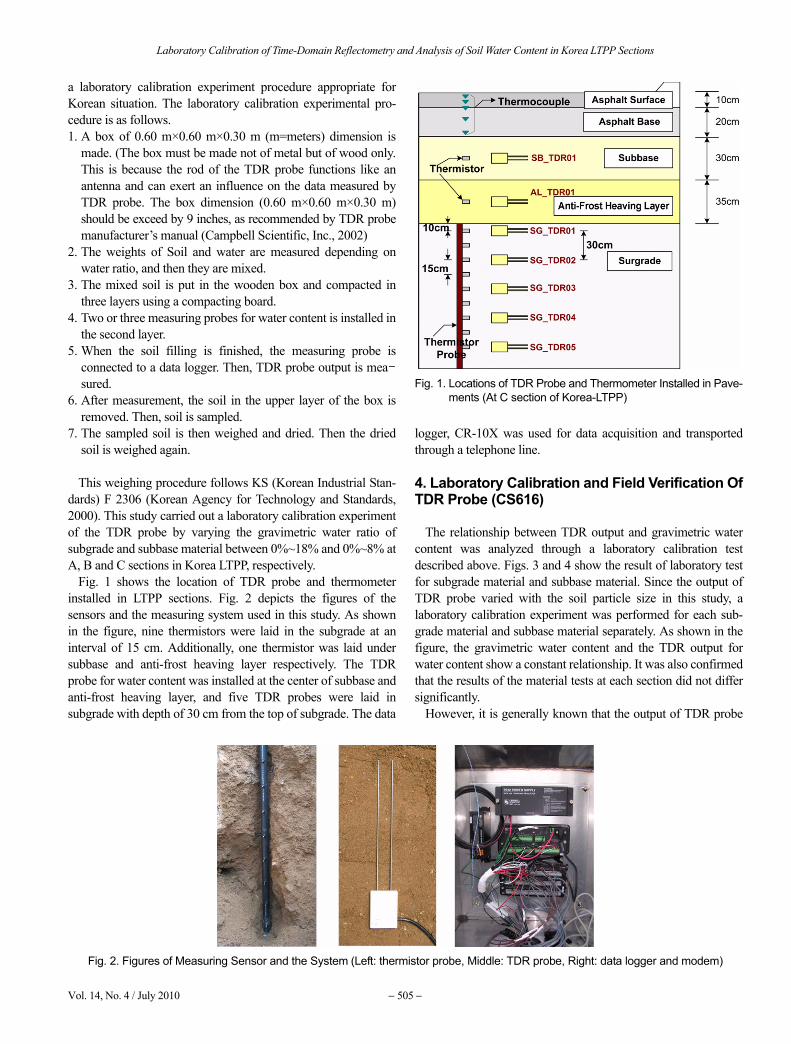
Fig. 1 shows the location of TDR probe and thermometerinstalled in LTPP sections. Fig. 2 depicts the figures of thesensors and the measuring system used in this study. As shownin the figure, nine thermistors were laid in the subgrade at aninterval of 15 cm. Additionally, one thermistor was laid undersubbase and anti-frost heaving layer respectively. The TDRprobe for water content was installed at the center of subbase andanti-frost heaving layer, and five TDR probes were laid insubgrade with depth of 30 cm from the top of subgrade. The data
logger, CR-10X was used for data acquisition and transportedthrough a telephone line.
4. Laboratory Calibration and Field Verification OfTDR Probe (CS616)
The relationship between TDR output and gravimetric watercontent was analyzed through a laboratory calibration testdescribed above. Figs. 3 and 4 show the result of laboratory testfor subgrade material and subbase material. Since the output ofTDR probe varied with the soil particle size in this study, alaboratory calibration experiment was performed for each sub-grade material and subbase material separately. As shown in thefigure, the gravimetric water content and the TDR output forwater content show a constant relationship. It was also confirmedthat the results of the material tests at each section did not differsignificantly.
However, it is generally known that the output of TDR probe
Fig. 1. Locations of TDR Probe and Thermometer Installed in Pave-ments (At C section of Korea-LTPP)
Fig. 2. Figures of Measuring Sensor and the System (Left: thermistor probe, Middle: TDR probe, Right: data logger and modem)

Booil Kim
− 506 − KSCE Journal of Civil Engineering
Fig. 3. Relationship between Output Values of the TDR Probe and Gravimetric Water Content (Subgrade material)
Fig. 4. Relationship between Output Values of the TDR Probe and Gravimetric Water Content (Subbase material)
Fig. 5. Relationship between the Output of the TDR Probe and Gravimetric Water Content by the Degree of Compaction
Laboratory Calibration of Time-Domain Reflectometry and Analysis of Soil Water Content in Korea LTPP Sections
Vol. 14, No. 4 / July 2010 − 507 −
increases as the compaction density increases due to the decreaseof air void in the soil. Fig. 5 is a clear evidence of this concept.TDR output was increased as more compacted at the samegravimetric water content. These facts imply that TDR outputshould be converted to volumetric water content to consider thechange of density of soil. Converting gravimetric water contentto volumetric water content can be done by compaction test.That is, gravimetric water content denotes the ratio of the soilparticle mass to mass of water and can be expressed as follows.
(6)
Where, ωg = gravimetric water contentmwater, msoil = weight of water, weight of soil (g)
mwet, mdry = weight of wet soil, weight of dry soil (g)
Volumetric water content can be calculated by multiplying dryweight of soil to its gravimetric water content and is expressed asfollows.
(7)
Where, ω v = volumetric water contentVwater, Vsoil = volume of water, volume of soil (cm3)
γ water = unit weight of water (g/cm3)γ d(soil) = unit weight of dry soil (g/cm3)
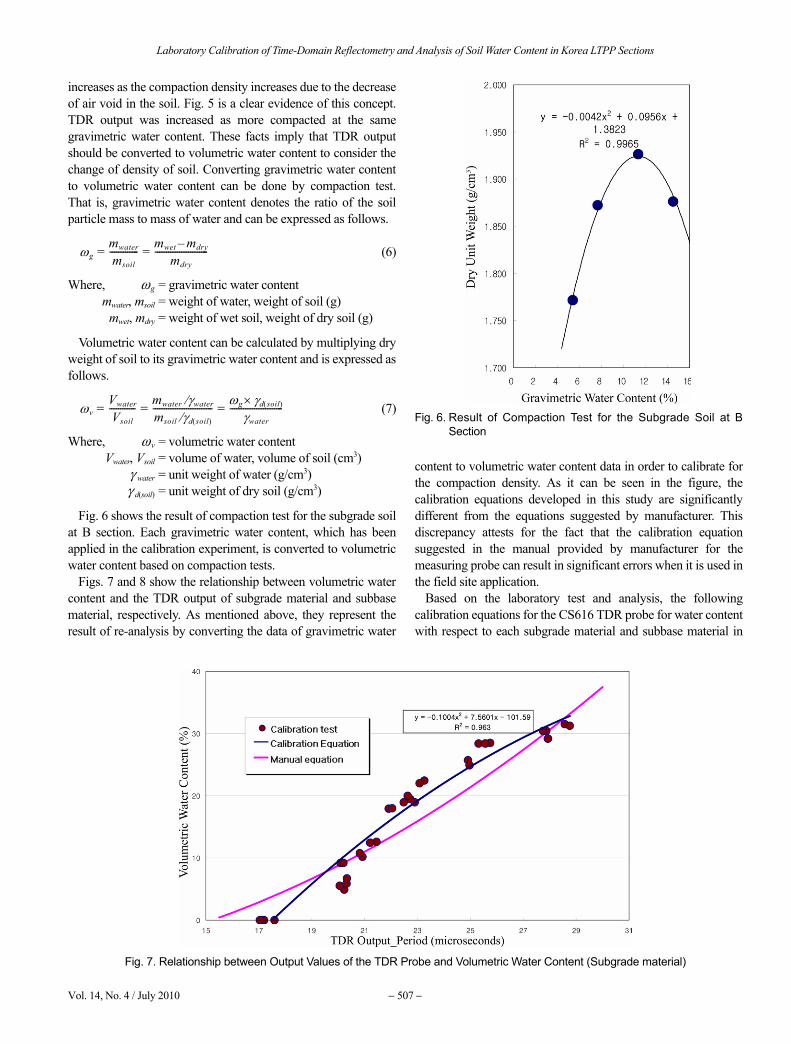
Fig. 6 shows the result of compaction test for the subgrade soilat B section. Each gravimetric water content, which has beenapplied in the calibration experiment, is converted to volumetricwater content based on compaction tests.
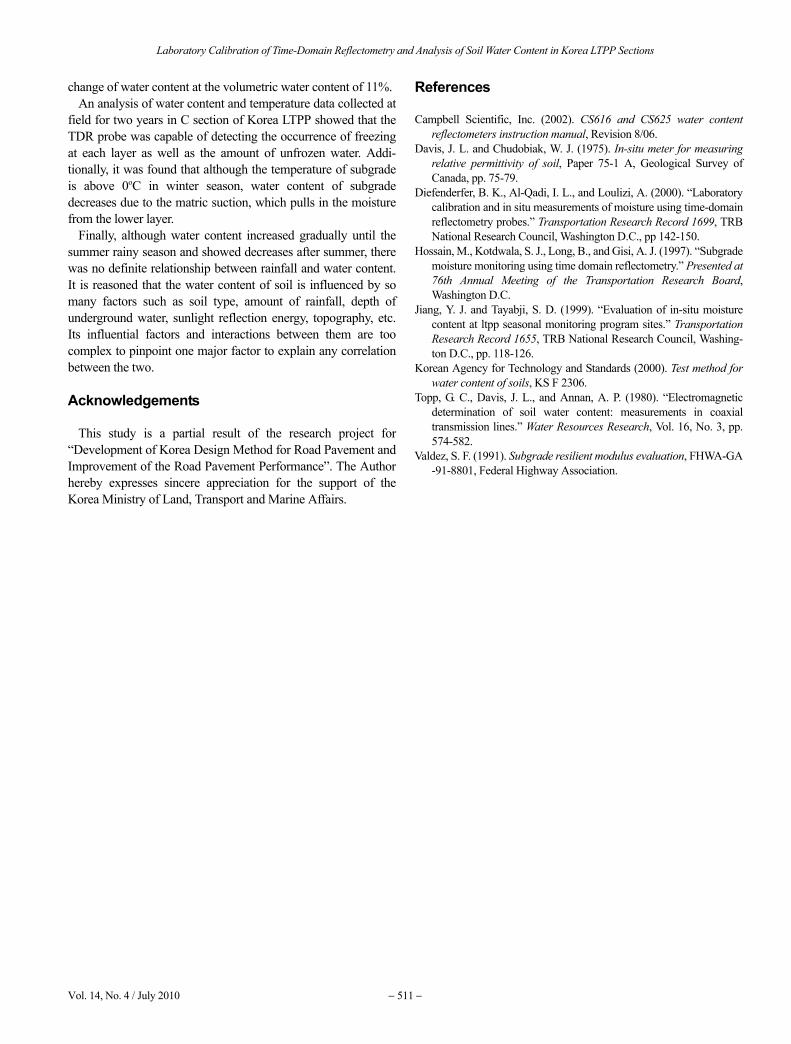
Figs. 7 and 8 show the relationship between volumetric watercontent and the TDR output of subgrade material and subbasematerial, respectively. As mentioned above, they represent theresult of re-analysis by converting the data of gravimetric water
content to volumetric water content data in order to calibrate forthe compaction density. As it can be seen in the figure, thecalibration equations developed in this study are significantlydifferent from the equations suggested by manufacturer. Thisdiscrepancy attests for the fact that the calibration equationsuggested in the manual provided by manufacturer for themeasuring probe can result in significant errors when it is used inthe field site application.
Based on the laboratory test and analysis, the followingcalibration equations for the CS616 TDR probe for water contentwith respect to each subgrade material and subbase material in
ωgmwater
msoil------------- mwet mdry–
mdry------------------------= =
ωvVwater
Vsoil------------ mwater γwater⁄
msoil γd soil( )⁄--------------------------- ωg γd soil( )×
γwater------------------------= = =
Fig. 6. Result of Compaction Test for the Subgrade Soil at BSection
Fig. 7. Relationship between Output Values of the TDR Probe and Volumetric Water Content (Subgrade material)

Booil Kim
− 508 − KSCE Journal of Civil Engineering
Korea LTPP were suggested.
Subgrade material: (8)Subbase material: (9)
Where, VWC = Volumetric Water ContentT = the output value of CS616 TDR probe, perio-
dic time (microseconds)
In order to verify the calibration equation suggested in thisstudy, the gravimetric water content of the material at eachinstallation location of the TDR probe at A and B section waschecked. The data of TDR probe was then also measured.Gravimetric water content was converted to volumetric watercontent by multiplying the maximum density of the soil obtainedat the site. Fig. 9 compares the calibration equation suggested inthis study and the measured volumetric water content. Althoughthere is a slight deviation as shown in the figure, they appear to
be in good agreement.Fig. 10 shows the change of TDR output measured at laboratory
with the change of temperature. There is no significant change ofTDR output (0.4 microseconds) at the temperature range of5oC~25oC. On the other hand, if the TDR output is predictedusing the temperature correction equation as suggested in theCS616 manual, the change of predicted output at the sametemperature range would have resulted in 1.5 times bigger thanthat of TDR output measured. Nevertheless, it appears that achange in temperature has no influence in a change of watercontent. It should be noted that the result of temperature analysisis only the result for the case of volumetric water content of 11%.And as the water content increases, the change of TDR outputwith temperature is expected to increase as well. Thus, a furtheranalysis for various water contents is required.
In addition, as the temperature drops below 0oC, the TDRoutput measured at laboratory decreases dramatically. This isconstrued to be the phenomenon of the moisture in the soil being
VWC 0.1004T2– 7.5601T 101.59–+=VWC 0.1919T2– 10.199T 118.14–+=
Fig. 8. Relationship between Output Values of the TDR Probe and Volumetric Water Content (Subbase Material)
Fig. 9. Comparison between Calibration Equation and Field Data

Laboratory Calibration of Time-Domain Reflectometry and Analysis of Soil Water Content in Korea LTPP Sections
Vol. 14, No. 4 / July 2010 − 509 −
frozen to form an ice crystal. And this result signifies that TDRprobe can be used to detect the freezing of soil in addition tomeasuring its water content.
5. Analysis of Field Data
Fig. 11 shows the water content and atmospheric temperaturemeasured for two years in C section. The water content mea-sured was computed using the calibration equation suggested inthis study. As shown in Fig. 11, period a and b, the water contentdrops significantly as the air temperature drops below 0oC at andperiods in winter at which the moisture in the anti-frost heavingand subbase layer changes into a ice crystal. Additionally, even iffreezing is manifested, unfrozen water still exists. And TDRprobe indicates about 7% water content at the subbase layer dueto the influence of this unfrozen water. Fig. 12 shows thetemperature of subbase, anti-frost heaving layer and subgrade
measured for the same period of time C section. In Fig. 12,temperatures of subgrade and anti-frost heaving layer are above0oC, and the water content of subgrade at and periods in Fig. 11decreases. This result appears that the decrease of water contentof subgrade is due to the matric suction (suction caused by thepressure difference between air and water in the pavementmaterial). This matric suction then pulls in the moisture from thelower layer and decreases the water content of subgrade.
Fig. 13 exhibits the comparison of rainfall and water content atC section during March to October. Water content increasesgradually until the summer rainy season and shows decreasingafter the summer. However, no definite relationship could bediscerned between rainfall and water content. In the past, manyresearchers tried to elucidate the correlation between rainfall andwater content on the subgrade layer. Some of them calculated thecorrelational coefficient directly (Valdez, 1991; Hossain et al.,1997). However, they concluded that the relationship between
Fig. 10. Relationship between Output Values of the TDR Probe and Temperature
Fig. 11. Change in Water Content at Multiple Pavement Depths and Air Temperature at C Section

Booil Kim
− 510 − KSCE Journal of Civil Engineering
them was not clear. It is reasoned that water content of soil isinfluenced by so many factors including the soil type, rainfall,depth of underground water, sunlight reflection energy, topography,etc. Its influential factors and interaction between them are socomplex that it is hard to pinpoint one major factor to explainany correlation. And also these factors were not included in thisstudy since they did not exist in the Korea LTPP.
6. Conclusions
Calibration equations for CS616 TDR probe were developedto determine water content in Korea LTPP sections. The calibra-
tion equations for subgrade and subbase materials were pre-sented in Eqs. (8) and (9), respectively.
Comparing the water content obtained from the calibrationequation suggested in this study with water contents measured atfield, they were in good agreement. Thus, it could be claimedthat these calibration equations were good for the field appli-cation in Korea LTPP.
Temperature sensitivity test of the TDR probe showed that theTDR output predicted using the temperature correction equationas suggested in the CS616 manual would have resulted in abigger change than that of TDR output measured. Nevertheless,it appeared that a change in temperature has no influence in a
Fig. 12. Change in Temperature at Multiple Pavement Depths of C Section
Fig. 13. Comparison of Water Contents and Precipitation Data
Laboratory Calibration of Time-Domain Reflectometry and Analysis of Soil Water Content in Korea LTPP Sections
Vol. 14, No. 4 / July 2010 − 511 −
change of water content at the volumetric water content of 11%. An analysis of water content and temperature data collected at
field for two years in C section of Korea LTPP showed that theTDR probe was capable of detecting the occurrence of freezingat each layer as well as the amount of unfrozen water. Addi-tionally, it was found that although the temperature of subgradeis above 0oC in winter season, water content of subgradedecreases due to the matric suction, which pulls in the moisturefrom the lower layer.
Finally, although water content increased gradually until thesummer rainy season and showed decreases after summer, therewas no definite relationship between rainfall and water content.It is reasoned that the water content of soil is influenced by somany factors such as soil type, amount of rainfall, depth ofunderground water, sunlight reflection energy, topography, etc.Its influential factors and interactions between them are toocomplex to pinpoint one major factor to explain any correlationbetween the two.
Acknowledgements
This study is a partial result of the research project for“Development of Korea Design Method for Road Pavement andImprovement of the Road Pavement Performance”. The Authorhereby expresses sincere appreciation for the support of theKorea Ministry of Land, Transport and Marine Affairs.
References
Campbell Scientific, Inc. (2002). CS616 and CS625 water contentreflectometers instruction manual, Revision 8/06.
Davis, J. L. and Chudobiak, W. J. (1975). In-situ meter for measuringrelative permittivity of soil, Paper 75-1 A, Geological Survey ofCanada, pp. 75-79.
Diefenderfer, B. K., Al-Qadi, I. L., and Loulizi, A. (2000). “Laboratorycalibration and in situ measurements of moisture using time-domainreflectometry probes.” Transportation Research Record 1699, TRBNational Research Council, Washington D.C., pp 142-150.
Hossain, M., Kotdwala, S. J., Long, B., and Gisi, A. J. (1997). “Subgrademoisture monitoring using time domain reflectometry.” Presented at76th Annual Meeting of the Transportation Research Board,Washington D.C.
Jiang, Y. J. and Tayabji, S. D. (1999). “Evaluation of in-situ moisturecontent at ltpp seasonal monitoring program sites.” TransportationResearch Record 1655, TRB National Research Council, Washing-ton D.C., pp. 118-126.
Korean Agency for Technology and Standards (2000). Test method forwater content of soils, KS F 2306.
Topp, G. C., Davis, J. L., and Annan, A. P. (1980). “Electromagneticdetermination of soil water content: measurements in coaxialtransmission lines.” Water Resources Research, Vol. 16, No. 3, pp.574-582.
Valdez, S. F. (1991). Subgrade resilient modulus evaluation, FHWA-GA-91-8801, Federal Highway Association.