labetalol pharmacokinetics in hypertension during pregnancy james h. fischer, pharm.d., fccp may 17,...
TRANSCRIPT

Labetalol Pharmacokinetics in Hypertension During Pregnancy
James H. Fischer, Pharm.D., FCCP
May 17, 2011

Pregnancy: Therapeutic Challenges
• Determine:– whether physiologic changes impact PKs of drug– what are consequences for drug administration
• PK changes tend to be dynamic and unpredictable• Conditions requiring continuous therapy become
particularly challenging– diabetes, epilepsy, hypertension
Anderson 2005
Hypertension in Pregnancy
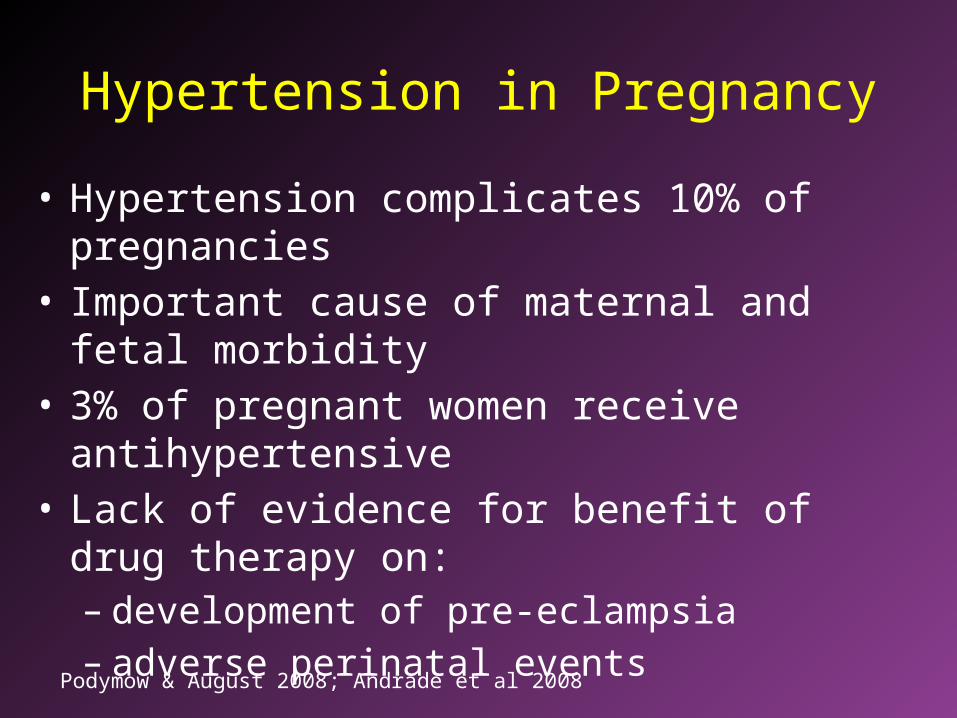
• Hypertension complicates 10% of pregnancies• Important cause of maternal and fetal morbidity • 3% of pregnant women receive antihypertensive• Lack of evidence for benefit of drug therapy on:
– development of pre-eclampsia– adverse perinatal events
Podymow & August 2008; Andrade et al 2008
Hypertension in Pregnancy
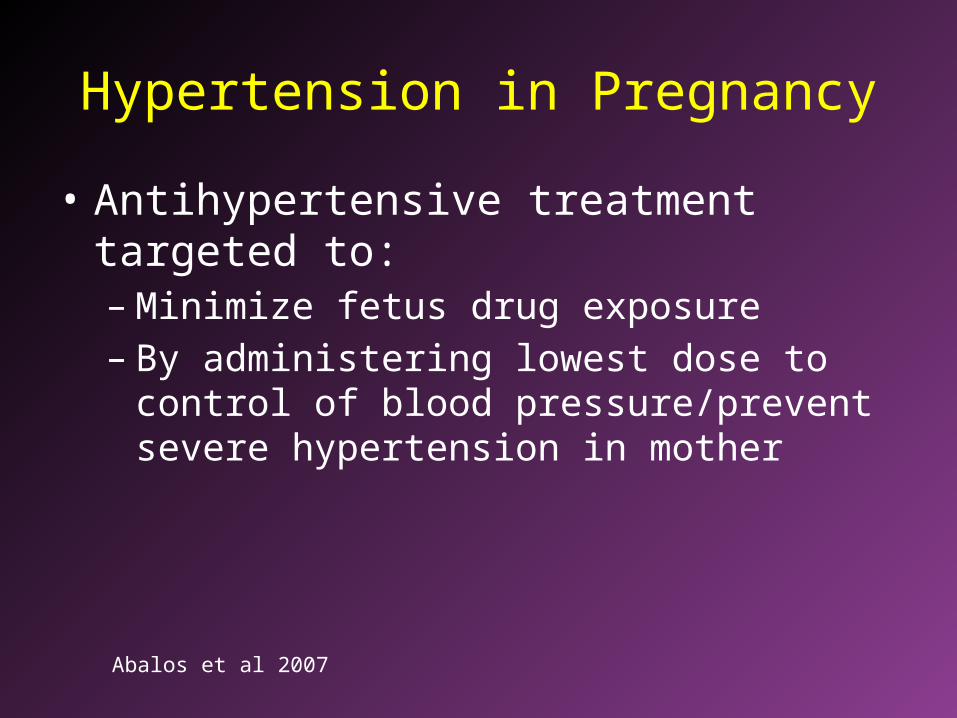
• Antihypertensive treatment targeted to: – Minimize fetus drug exposure– By administering lowest dose to control of blood
pressure/prevent severe hypertension in mother
Abalos et al 2007

Labetalol Treatment of Hypertension During Pregnancy
• α-1 and β adrenergic receptor antagonist • First/ second line agent for treating
hypertension during pregnancy• PK properties:
– Systemic availability: approximately 20-50%– Widely distributes into tissues– 50-60% bound to plasma proteins– Eliminated mainly by hepatic metabolism
• Glucuronidation via UGT 1A1 and 2B7
Goa 1989; Jeong et al 2008
Effect of Pregnancy on Labetalol Pharmacokinetics
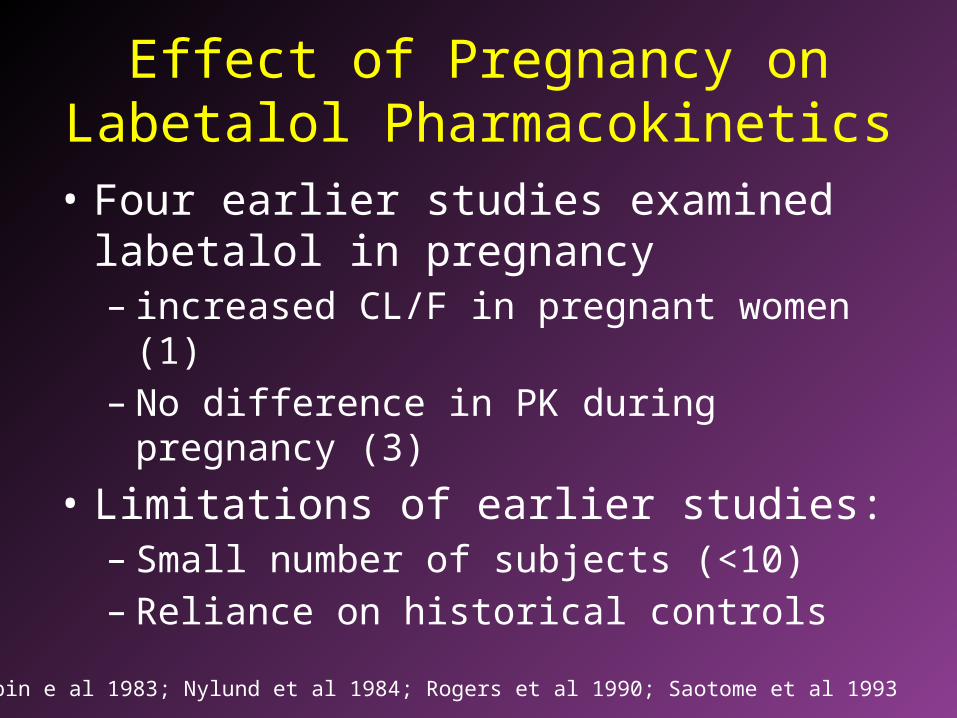
• Four earlier studies examined labetalol in pregnancy– increased CL/F in pregnant women (1) – No difference in PK during pregnancy (3)
• Limitations of earlier studies:– Small number of subjects (<10)– Reliance on historical controls
Rubin e al 1983; Nylund et al 1984; Rogers et al 1990; Saotome et al 1993

Objectives
• Compare pharmacokinetics of oral labetalol during and after pregnancy in women being treated for hypertension
• Identify any demographic or clinical factors influencing the variability in labetalol disposition in pregnancy

Rationale for Population PK Approach
• Less restrictive design components– unbalanced designs– sparse sampling
• Obtain informative PK information – population representative of patients– reduces impact of research on medical care

Research Team• Co-Principal Investigator
Gloria Sarto, M.D., Ph.D.
• UIC Co-InvestigatorsLoraine Endres, M.D.
Patricia Fischer, R.N.
Stacie Geller, Ph.D.
Jennifer Hardman, Pharm.D.
Hyunyoung Jeong, Pharm.D., Ph.D.
Sarah Kilpatrick, M.D.
Keith Rodvold, Pharm.D.
• UW Co-InvestigatorsThomas Jenkins, M.D.
Lori Wollett, R.N.
• FDAMargaret Miller, Ph.D.
Methods: Subjects
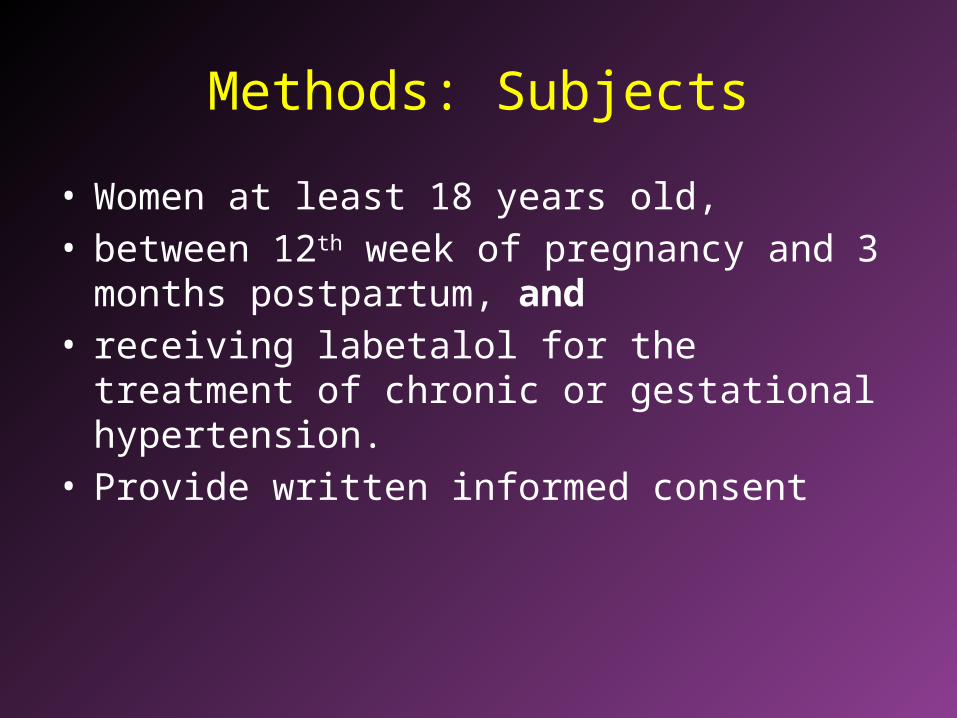
• Women at least 18 years old, • between 12th week of pregnancy and 3 months
postpartum, and• receiving labetalol for the treatment of chronic or
gestational hypertension.• Provide written informed consent
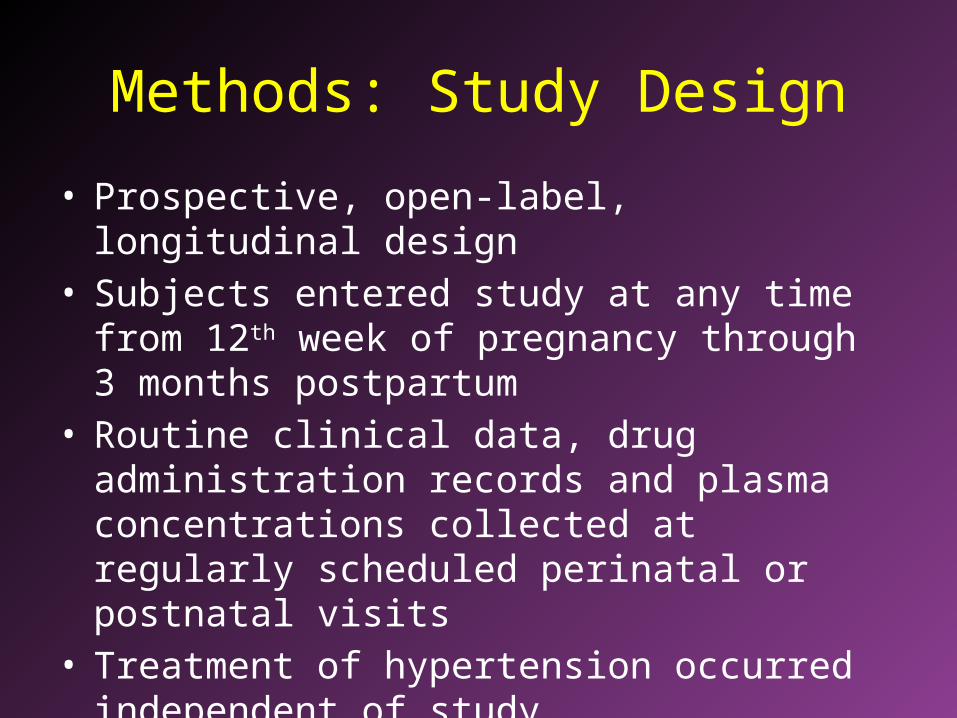
Methods: Study Design
• Prospective, open-label, longitudinal design• Subjects entered study at any time from 12th
week of pregnancy through 3 months postpartum
• Routine clinical data, drug administration records and plasma concentrations collected at regularly scheduled perinatal or postnatal visits
• Treatment of hypertension occurred independent of study
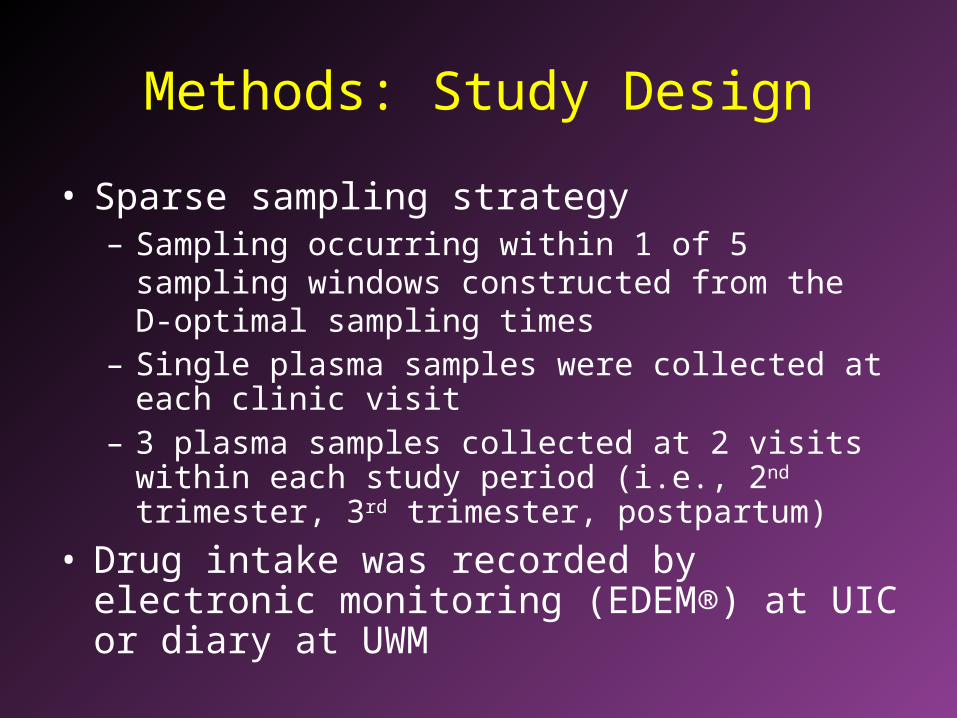
Methods: Study Design
• Sparse sampling strategy – Sampling occurring within 1 of 5 sampling windows
constructed from the D-optimal sampling times– Single plasma samples were collected at each clinic
visit– 3 plasma samples collected at 2 visits within each
study period (i.e., 2nd trimester, 3rd trimester, postpartum)
• Drug intake was recorded by electronic monitoring (EDEM®) at UIC or diary at UWM
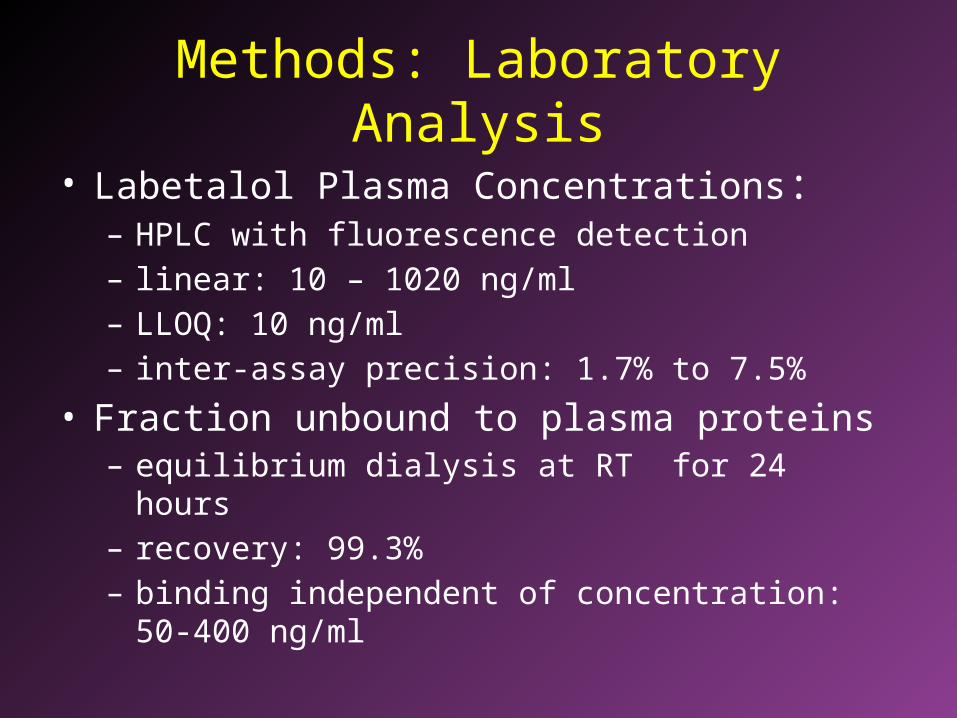
Methods: Laboratory Analysis
• Labetalol Plasma Concentrations:– HPLC with fluorescence detection– linear: 10 – 1020 ng/ml– LLOQ: 10 ng/ml– inter-assay precision: 1.7% to 7.5%
• Fraction unbound to plasma proteins– equilibrium dialysis at RT for 24 hours– recovery: 99.3%– binding independent of concentration: 50-400 ng/ml
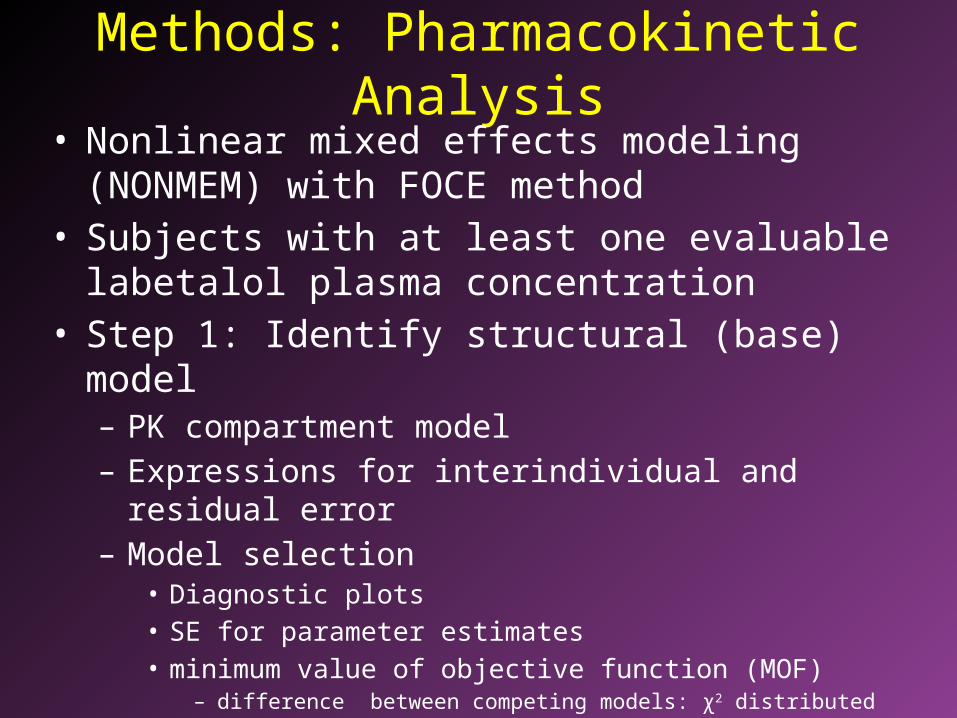
Methods: Pharmacokinetic Analysis• Nonlinear mixed effects modeling (NONMEM)
with FOCE method • Subjects with at least one evaluable labetalol
plasma concentration• Step 1: Identify structural (base) model
– PK compartment model– Expressions for interindividual and residual error– Model selection
• Diagnostic plots• SE for parameter estimates• minimum value of objective function (MOF)
– difference between competing models: χ2 distributed

Methods: Pharmacokinetic Analysis
• Step 2: Covariate Analysis– Graphical/GAM screening (S-Plus)– Added alone to structural model– Stepwise forward addition (p<0.05) - backward
deletion (p<0.005)

Covariates• Body Size Measures
total body weightlean body weight
(Janmahasatian et al 2005)
body mass indexbody surface area
• Categorical Variablespregnancy statusethnicitystudy sitetype of hypertensionconcurrent medicationsrenal/hepatic diseasecompliance monitoring
• Continuous Variablesagegestational agecreatinine clearanceserum albuminα-1 acid glycoproteinASTtotal bilirubin labetalol dose
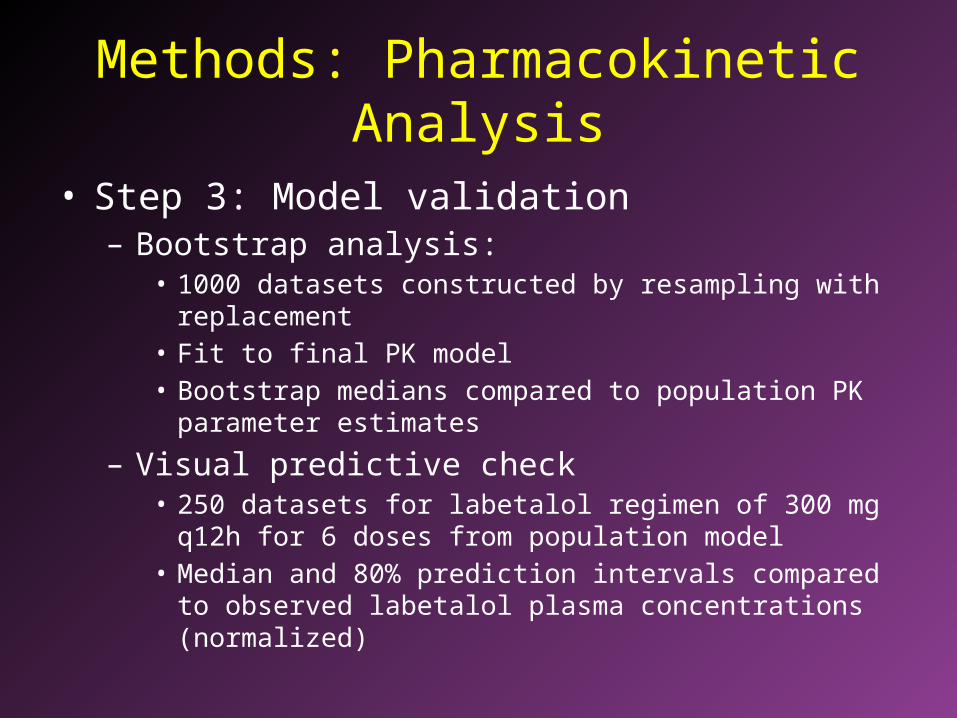
Methods: Pharmacokinetic Analysis
• Step 3: Model validation– Bootstrap analysis:
• 1000 datasets constructed by resampling with replacement• Fit to final PK model• Bootstrap medians compared to population PK parameter
estimates
– Visual predictive check• 250 datasets for labetalol regimen of 300 mg q12h for 6
doses from population model• Median and 80% prediction intervals compared to observed
labetalol plasma concentrations (normalized)
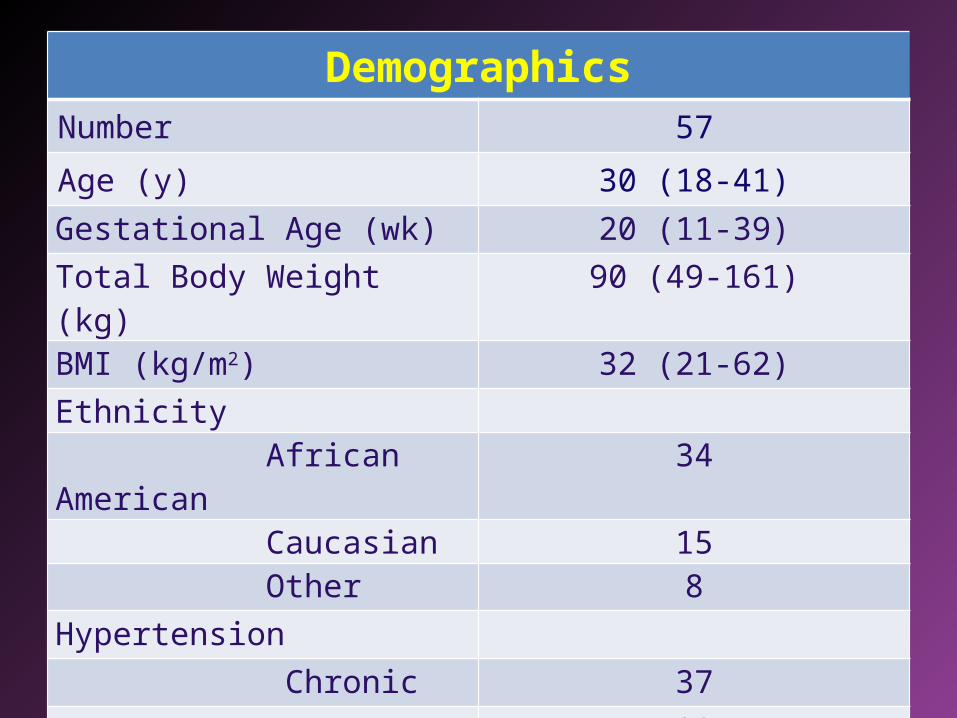
DemographicsDemographics
Number 57Age (y) 30 (18-41)Gestational Age (wk) 20 (11-39)Total Body Weight (kg) 90 (49-161)BMI (kg/m2) 32 (21-62)Ethnicity African American 34 Caucasian 15 Other 8Hypertension Chronic 37 Gestational 20
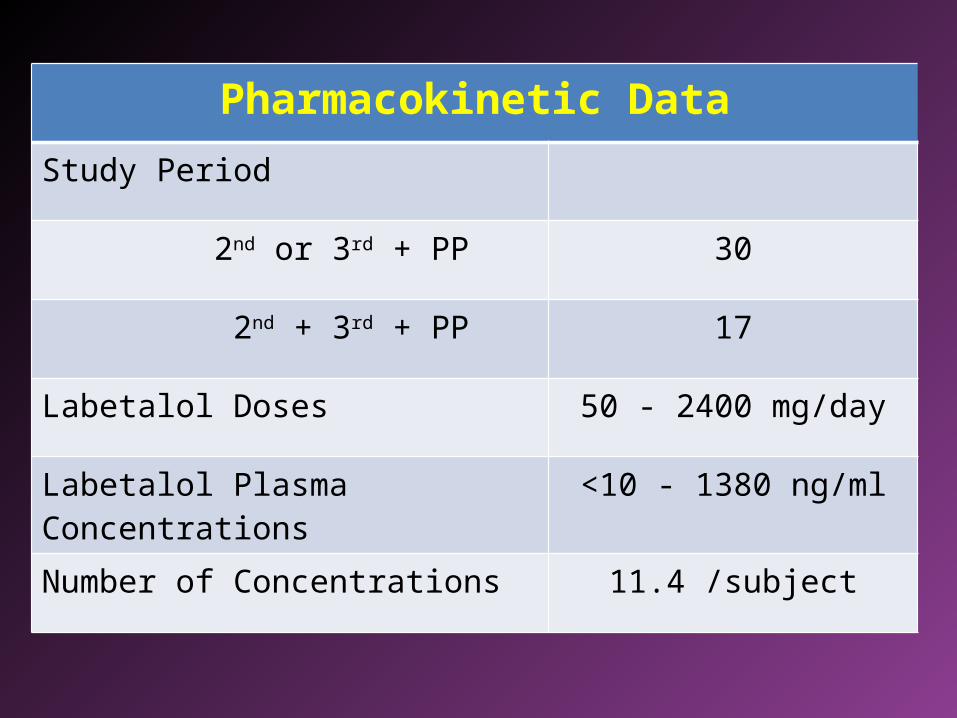
Pharmacokinetic Data
Study Period
2nd or 3rd + PP 30
2nd + 3rd + PP 17
Labetalol Doses 50 - 2400 mg/day
Labetalol Plasma Concentrations <10 - 1380 ng/ml
Number of Concentrations 11.4 /subject

Structural Model
• Two-Compartment PK model
• Inter-individual variability (IIV)– exponential error– full variance-covariance matrix
• Residual variability– proportional error
Vcka
VpCLD
CL

One- versus Two-Compartment
Predicted Labetalol Plasma Concentration (ng/ml)
0 200 400 600 800 1000 1200 1400Observ
ed L
abeta
lol P
lasm
a C
on
centr
ation (
ng/m
l)
0
200
400
600
800
1000
1200
1400
Predicted Labetalol Plasma Concentration (ng/ml)
0 200 400 600 800 1000 1200 1400Observ
ed L
abeta
lol P
lasm
a C
on
centr
ation (
ng/m
l)
0
200
400
600
800
1000
1200
1400
One-Compartment
Two-Compartment
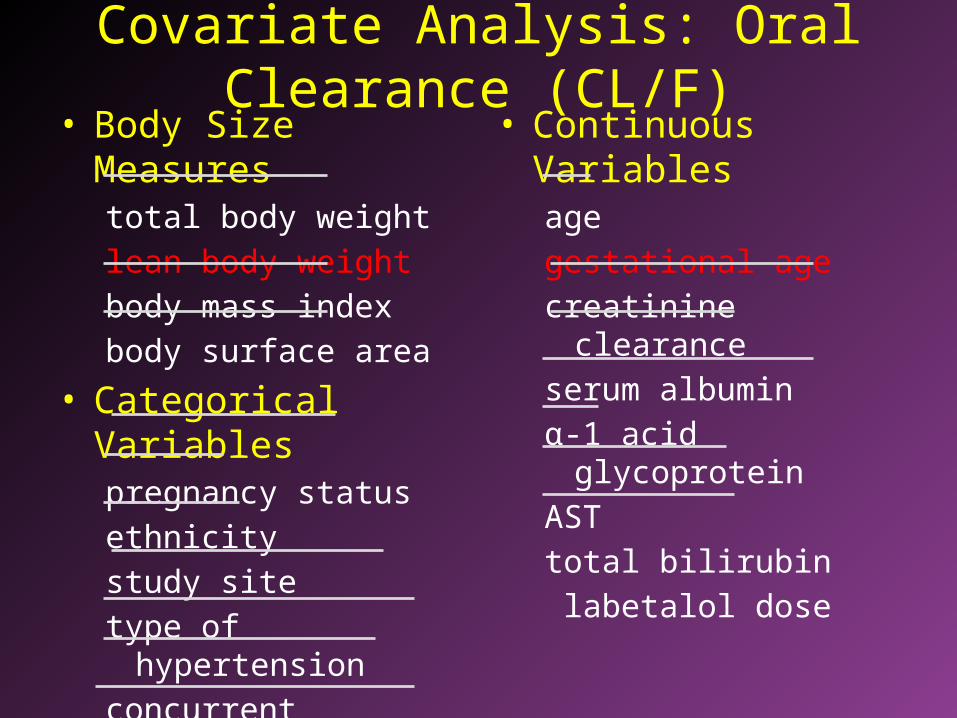
Covariate Analysis: Oral Clearance (CL/F)• Body Size Measures
total body weightlean body weightbody mass indexbody surface area
• Categorical Variablespregnancy statusethnicitystudy sitetype of hypertensionconcurrent medicationsrenal/hepatic diseasecompliance monitoring
• Continuous Variablesagegestational agecreatinine clearanceserum albuminα-1 acid glycoproteinASTtotal bilirubin labetalol dose
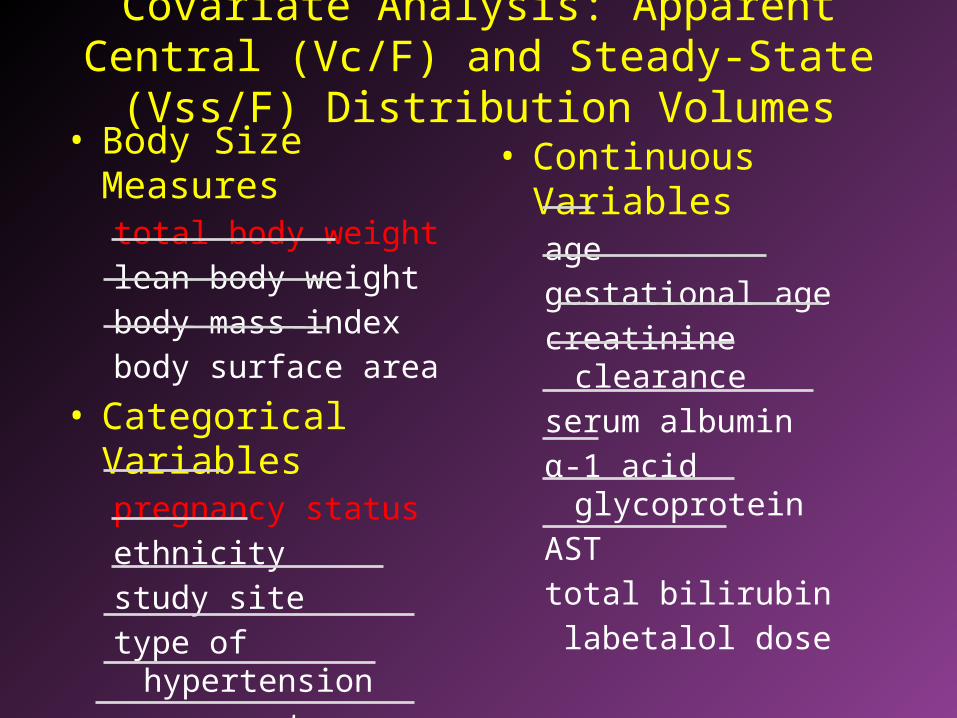
Covariate Analysis: Apparent Central (Vc/F) and Steady-State (Vss/F) Distribution Volumes
• Body Size Measurestotal body weightlean body weightbody mass indexbody surface area
• Categorical Variablespregnancy statusethnicitystudy sitetype of hypertensionconcurrent medicationsrenal/hepatic diseasecompliance monitoring
• Continuous Variablesagegestational agecreatinine clearanceserum albuminα-1 acid glycoproteinASTtotal bilirubin labetalol dose
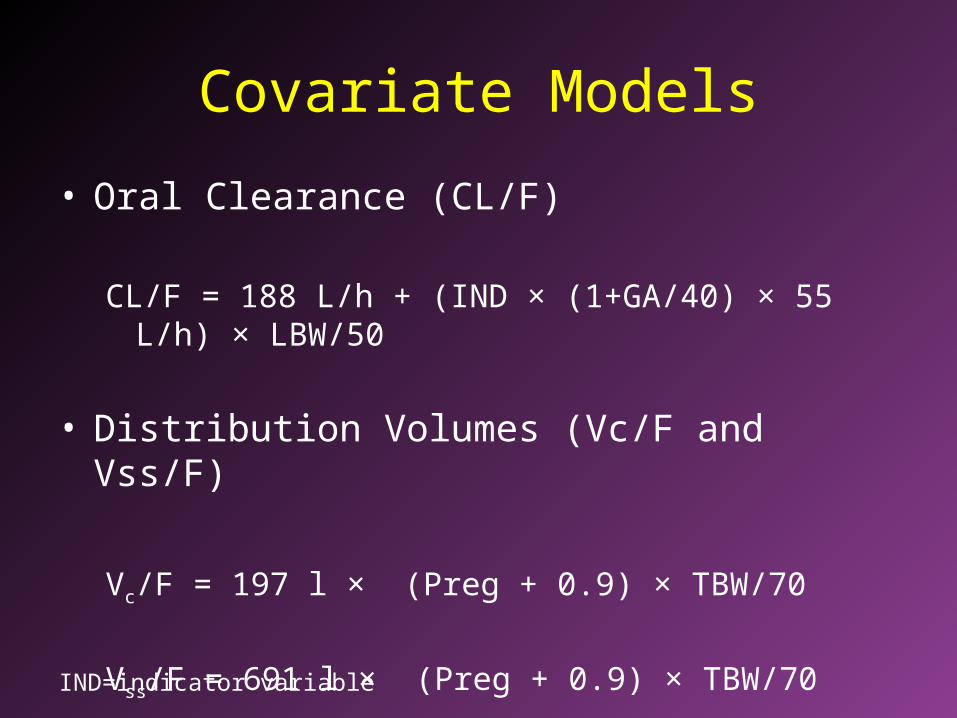
Covariate Models
• Oral Clearance (CL/F)
CL/F = 188 L/h + (IND × (1+GA/40) × 55 L/h) × LBW/50
• Distribution Volumes (Vc/F and Vss/F)
Vc/F = 197 l × (Preg + 0.9) × TBW/70
Vss/F = 691 l × (Preg + 0.9) × TBW/70
IND=indicator variable
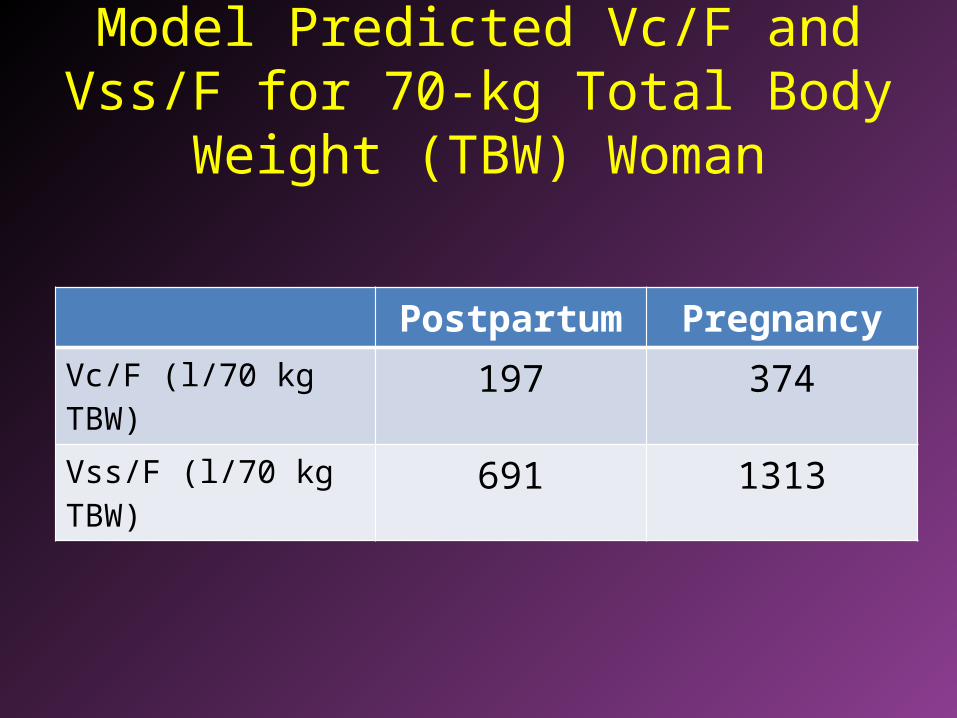
Model Predicted Vc/F and Vss/F for 70-kg Total Body Weight (TBW) Woman
Postpartum Pregnancy
Vc/F (l/70 kg TBW) 197 374
Vss/F (l/70 kg TBW) 691 1313

Model Predicted CL/F for a 50-kg Lean Body Weight (LBW) Woman
Gestational Age (weeks)
0 12 24 36
Lab
etal
ol O
ral C
lear
ance
(l/h
)
100
200
300
400
Post-Partum Pregnancy
188 l/h
258 l/h
296 l/h
Post-Partum
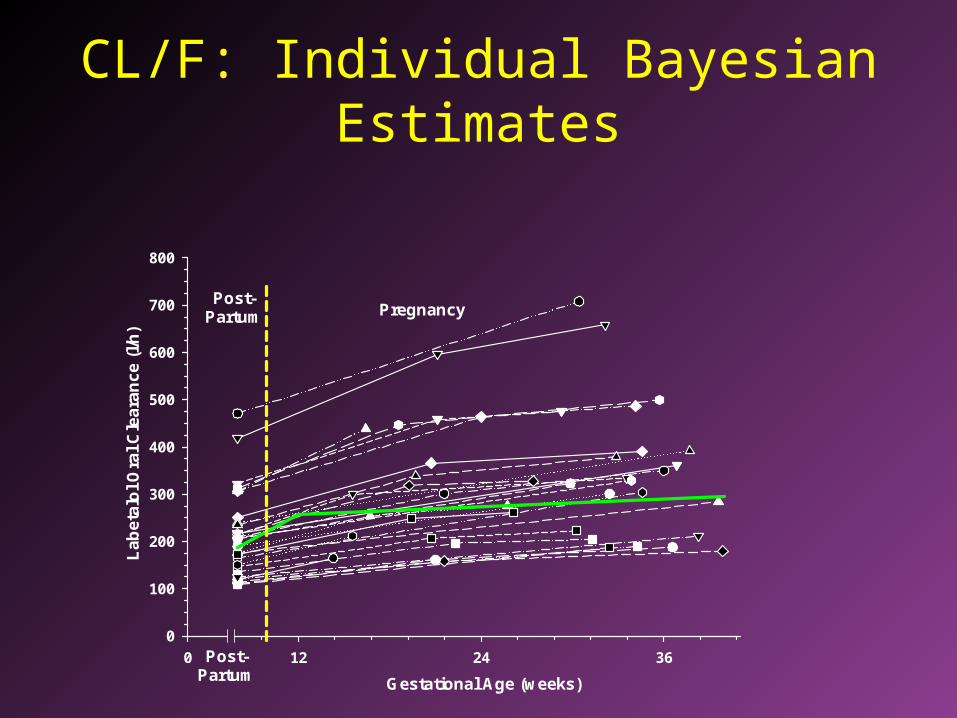
CL/F: Individual Bayesian Estimates
Gestational Age (weeks)
0 12 24 36
La
be
talo
l O
ral C
lea
ran
ce
(l/h
)
0
100
200
300
400
500
600
700
800
Post-Partum Pregnancy
Post-Partum

CL/F during Pregnancy Standardized by Postpartum CL/F
Gestational Age (weeks)
0 10 20 30 40
Pre
gnan
cy t
o P
ostp
artu
m R
atio
of
Labe
talo
l Ora
l Cle
aran
ce
0.0
1.0
1.5
2.0
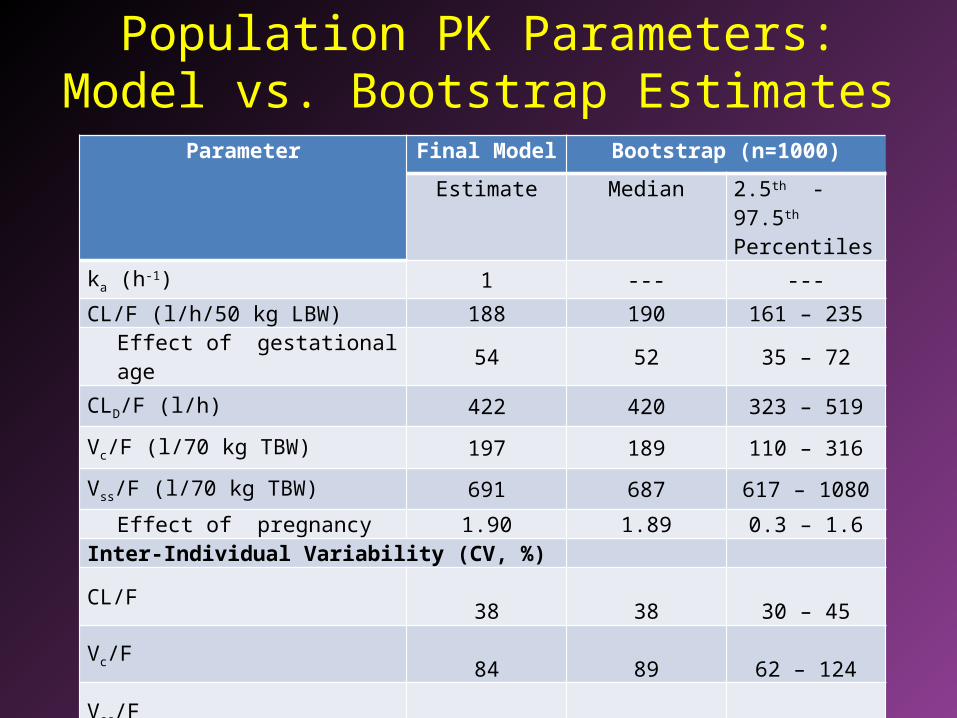
Population PK Parameters: Model vs. Bootstrap Estimates
Parameter Final Model Bootstrap (n=1000)
Estimate Median 2.5th - 97.5th Percentiles
ka (h-1) 1 --- ---
CL/F (l/h/50 kg LBW) 188 190 161 – 235Effect of gestational age 54 52 35 – 72
CLD/F (l/h) 422 420 323 – 519
Vc/F (l/70 kg TBW) 197 189 110 – 316
Vss/F (l/70 kg TBW) 691 687 617 – 1080
Effect of pregnancy 1.90 1.89 0.3 – 1.6Inter-Individual Variability (CV, %)
CL/F38 38 30 – 45
Vc/F 84 89 62 – 124
Vss/F 40 41 25 – 59
Residual error (%) 36 36 31 - 42
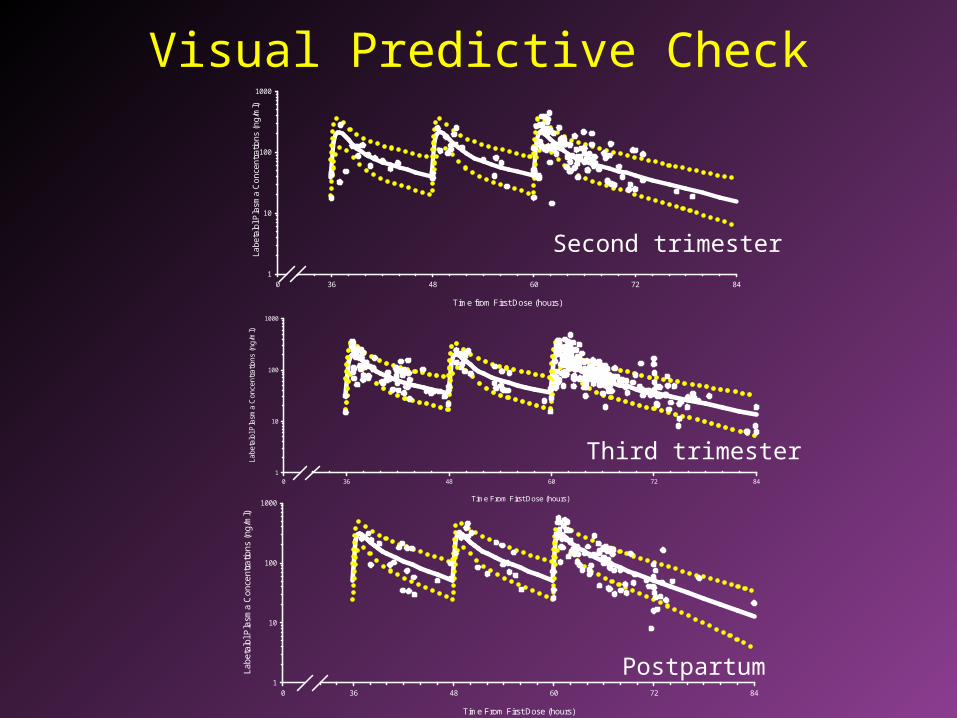
Visual Predictive Check
Time from First Dose (hours)
0 36 48 60 72 84
Labe
talo
l Pla
sma
Con
cent
ratio
ns (
ng/m
l)
1
10
100
1000
Time From First Dose (hours)
0 36 48 60 72 84
Labe
talo
l Pla
sma
Con
cent
ratio
ns (
ng/m
l)
1
10
100
1000
Time From First Dose (hours)
0 36 48 60 72 84
Labe
talo
l Pla
sma
Con
cent
ratio
ns (
ng/m
l)
1
10
100
1000
Second trimester
Third trimester
Postpartum
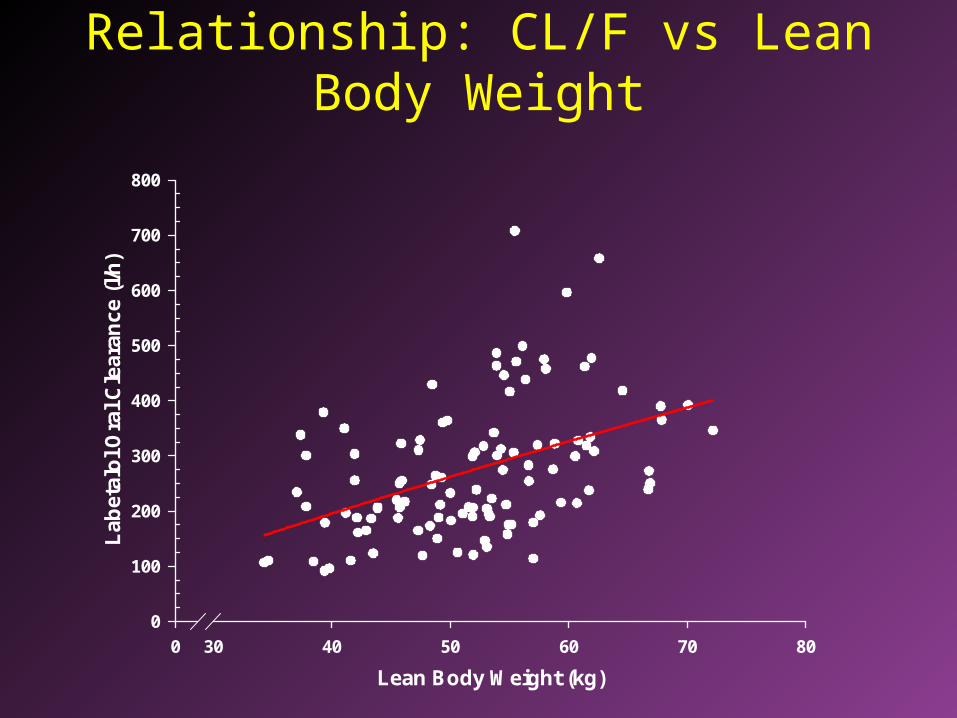
Relationship: CL/F vs Lean Body Weight
Lean Body Weight (kg)
0 30 40 50 60 70 80
La
be
talo
l Ora
l Cle
ara
nc
e (
l/h)
0
100
200
300
400
500
600
700
800
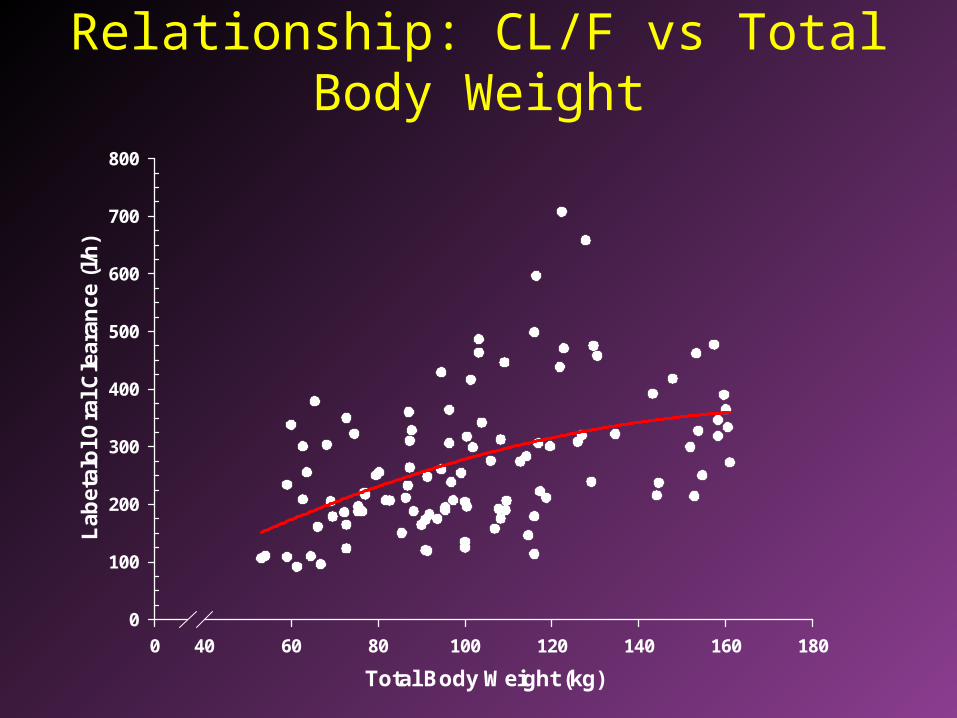
Relationship: CL/F vs Total Body Weight
Total Body Weight (kg)
0 40 60 80 100 120 140 160 180
Lab
etal
ol O
ral C
lear
ance
(l/h
)
0
100
200
300
400
500
600
700
800

Implications of Different Relationships between CL/F and LBW or TBW
• Lean body weight (LBW) provides more clinically useful indicator of differences in dose requirements among women of varying body sizes
• Excessive labetalol exposure may be reduced by adjusting labetalol doses based on LBW, or without regard to body size, rather than TBW

Mechanism for Pregnancy-Induced Change in CL/F
• Labetalol– high extraction ratio– hepatic metabolism
• Explanation for higher CL/F– reduced absorption from GI tract– decreased plasma protein binding– increased hepatic intrinsic clearance
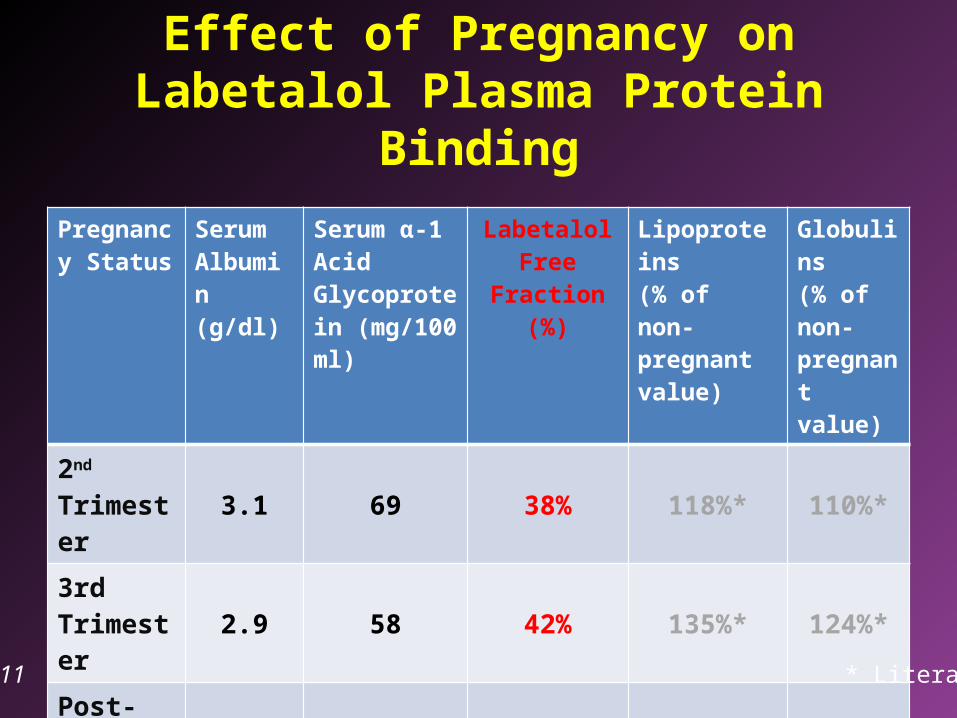
Effect of Pregnancy on Labetalol Plasma Protein Binding
Pregnancy Status
Serum Albumin (g/dl)
Serum α-1 Acid Glycoprotein (mg/100 ml)
Labetalol Free Fraction (%)
Lipoproteins(% of non-pregnant value)
Globulins(% of non-pregnant value)
2nd Trimester 3.1 69 38% 118%* 110%*
3rd Trimester 2.9 58 42% 135%* 124%*
Post-partum 3.6 120 41% --- ---
Fischer et al 2011 * Literature values
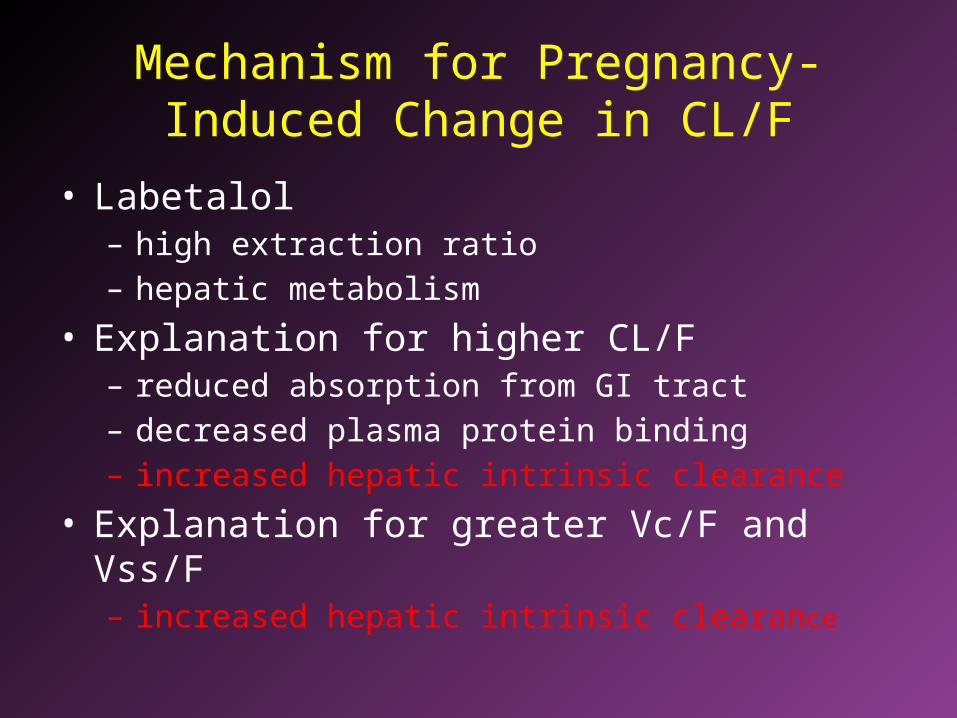
Mechanism for Pregnancy-Induced Change in CL/F
• Labetalol– high extraction ratio– hepatic metabolism
• Explanation for higher CL/F– reduced absorption from GI tract– decreased plasma protein binding– increased hepatic intrinsic clearance
• Explanation for greater Vc/F and Vss/F– increased hepatic intrinsic clearance
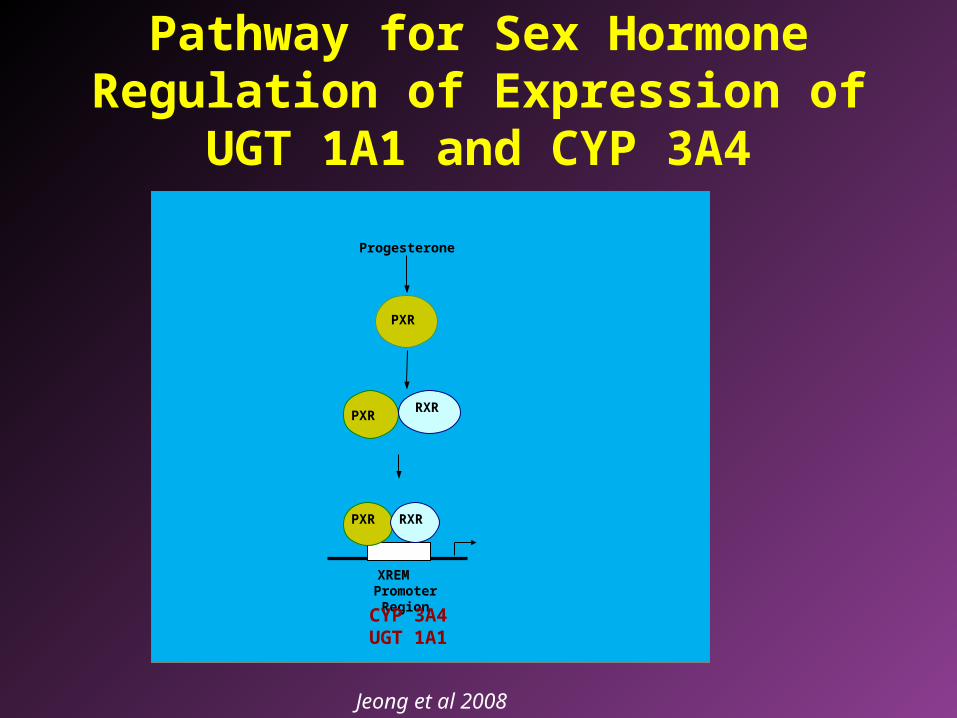
Pathway for Sex Hormone Regulation of Expression of UGT 1A1 and CYP 3A4
XREM Promoter Region
Progesterone
PXR
PXR
PXR
RXR
RXR
CYP 3A4UGT 1A1
Jeong et al 2008
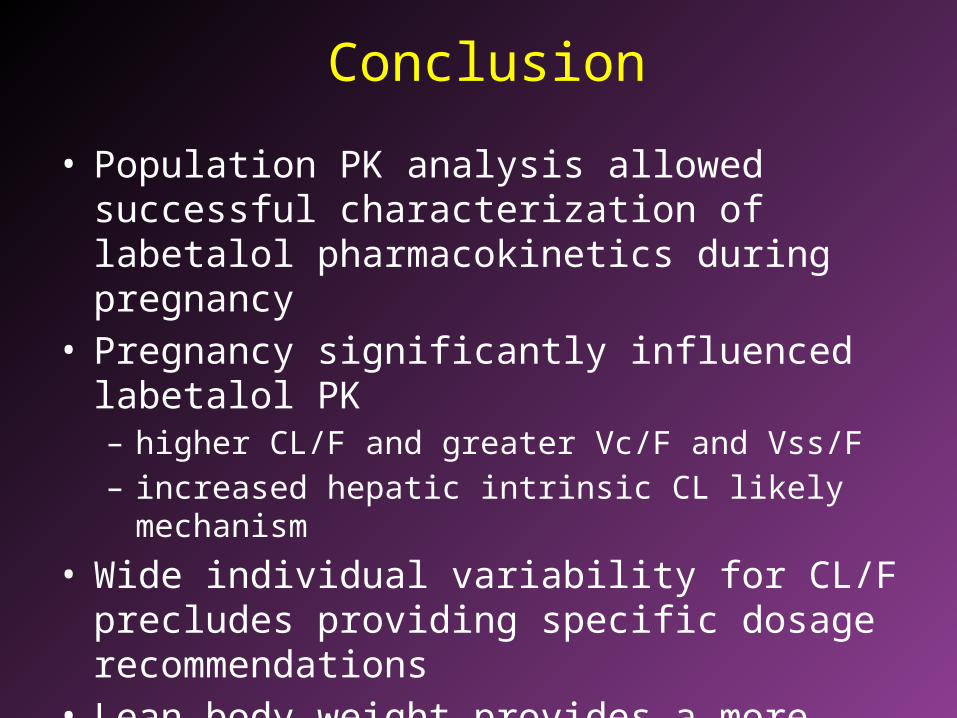
Conclusion
• Population PK analysis allowed successful characterization of labetalol pharmacokinetics during pregnancy
• Pregnancy significantly influenced labetalol PK– higher CL/F and greater Vc/F and Vss/F– increased hepatic intrinsic CL likely mechanism
• Wide individual variability for CL/F precludes providing specific dosage recommendations
• Lean body weight provides a more useful guide for adjusting labetalol doses in pregnant women than total body weight