lab manual for oocyte biophysics - uc san diego...
TRANSCRIPT
Lab Manual for Oocyte Biophysics:Physiology, Molecular Biology and Imaging
---------------------------------------------------------------------------------------
page
I. Basic Handling of Oocytes 2• Solutions• Obtaining the oocytes• Storage
II. Electrophysiology Rig 4• Setup• Using the rig
III. Voltage clamp recording 6• Background• Procedure• Typical results
IV. IP3 injections 8• Setup• Injecting• Other uses
V. LPA induced Cl- oscillations 9• Background• Procedure• Typical results• Analysis
VI. mRNA expression 16• Overall description• Preparation of mRNA• Injection of mRNA into oocyte• Using electrophysiology to detect if expression occurred
VII. Fluorescence imaging 23• Setting up• Preparing electrodes• Injecting • Fluorescence note• Using the camera
VIII. Appendix 28A. Formulas for basic oocyte solutions B. Formulas for oocyte dissection solutionsC. Notes
1
I. Basic Handling of Oocytes Rachel Kalmar
SolutionsWe use two solutions for the oocytes in the lab, Frog ringer and Barth’s. The ringer solution is used for perfusing the egg while clamping or imaging, and the Barth’s solution is used for storing the oocytes.
Both solutions are made with ddH2O, and can be stored in plastic 2L Nalgene bottles at room temperature. To make one liter of solution, pour 900 mL ddH2O into a flask or solution bottle (if making more than 1 liter solution, use ~100 mL less ddH2O than total volume, if making less than 1 liter, use about a tenth less than total amount). This will allow room to add HCl and NaOH to adjust the pH of the solution. Place a stir bar in the container and place the container on the stirring plate. Weigh out the specified amount of each chemical and add slowly.
Check the pH of the solution. Add NaOH/HCl until pH is 7.0. Then add enough ddH2O to bring volume to 1 L. (see Appendix A for solution formulas)
How to obtain the oocytesFind a lab that is willing to donate frogs for the quarter. (if having difficulty with this, contact [email protected]) All formulas for solutions listed in this section can be found in the appendix.
If frogs need to be sedated (transportation, handling), chill them in ice water.
To isolate the oocytes, follow the procedure adapted from the CSH lab manual:(Note: This section is included as a supplement to a demonstration to a dissection--oocyte removal should not be attempted without more instruction than available in this manual.)
1. Anesthetize a mature female frog by submerging it in 0.02% benzocaine until unconscious (~10 minutes). Tricaine 1g/L will also work (instead of benzocaine), with the disadvantage that it doesn’t act for as long.
2. Check to make sure frog is unconscious (will not respond when toes are pinched with forceps, eye poked with forceps).
3. Place frog ventral (belly) side up on plastic-coated benchtop paper (plastic side up).
4. Make a small incision (~1 cm long) though the skin and muscle layers on one side of the abdomen. (can use paper tissue to help pick up skin)
5. Remove a small quantity of ovarian tissue using a pair of forceps and a pair of scissors.
Note: The lobes of the ovaries should be readily visible once the incision is made. If the ovary is not obvious, the frog is either juvenile, moribund, or male.
6. Examine the tissue under a dissecting microscope to ensure that the ovaries are healthy.
2
Note: In healthy ovaries, the oocytes should show a distinct pigmentation difference between the animal and vegetal hemispheres, the pigment should not be mottled, and only a low percentage of oocytes should be undergoing resorption. The latter are easily recognized by their heavy covering of blood vessels.
7. Remove about 500 eggs from ovaries, using forceps and scissors. Place the eggs into a dish of ND96.
8. Sacrifice the frog by cutting out its heart. Place the animal into a tissue bag. and bring to tissue disposal facility (nearest is in bioengineering building).
9. In the dish with ND96, slice apart the sacs containing the oocytes. This will help degrade the tissue holding the eggs together, but will not harm the oocytes.
10. Put oocytes into vial containing 25 ml clean ND96, 43 mg collagenase (1.72 mg/mL) and 12.5 mg trypsin inhibitor (0.5 mg/mL).
11. Put vial on shaker at room temperature for 90 minutes.
12. Rinse oocytes in ND96, four times.
13. Put in 17ºC refrigerator with ND96 calcium solution.
14. One day later, transfer oocytes into petri dishes 3/4 full with Barth’s solution and store in incubator at 16ºC.
Transferring oocytes To transfer the oocytes without damaging them, use a plastic transfer pipette. Do not allow the oocytes to make contact with the air. To transfer large quantities of eggs, cut the end of the pipette to widen the opening--this will speed up the process. The oocytes should not be too crowded in their dishes. About 100 per medium-size petri dish is about the appropriate density the eggs should be kept at.
Note: If oocytes seem to have extra pieces of clear membrane in the petri dish and eggs do not appear uniformly round, the follicular membrane probably has not been removed completely. To remove the membrane, use two pairs of very fine forceps to gently peel the clear sock-like membrane from the egg. Try to gently grasp two edges of the “sock” on opposite sides of the egg, using both pairs of forceps. Use one pair of forceps to anchor the membrane and egg to the petri dish while pulling the membrane off the egg with the other forceps. Try to minimize jostling and poking of the oocyte.
StorageOocytes should be stored with about 100 eggs per medium-sized petri dishes (6.0 cm diameter, 1.5 cm depth), 1/2-3/4 filled with Barth’s solution. These dishes should be kept in an incubator at 16ºC. Solution should be exchanged for new Barth’s solution daily. A bottle of Barth’s solution should be stored in the incubator with the oocytes. To exchange solution, use a plastic transfer pipette to remove enough of the old solution so that the solution level comes just above the level of the oocytes. Pour in new Barth’s so that the dish is 1/2-3/4 filled, and return dish to incubator. The eggs should be fine to use for about a week.
3
II. Electrophysiology Rig Jennifer Coats
This is intended to be a general guide to setting up the electrophysiology rig for experiments. There are quite a few things that can go wrong with the rig that are very subtle, and hopefully this guide will help prevent most of these from occurring.
Setup
Basic connectionsThe left electrode (Vm) is the voltage-passing electrode and it should be connected to the voltage probe on the OC-275C. The right electrode is the current passing electrode (Im) and should be connected to the I electrode on the OC-725C. On the Oocyte Bath Clamp (7251 I) the red wire should be in the left ground well and the black wire should be in the left ground well. The cord at the back of the bath clamp should be connected to the bath probe on the OC-725C. The green ground wire should be grounded to the table with a screw.
On the OC-725C, the Command in ÷10 should be connected to the DAC 0 connection on the Interface. The I monitor should be connected to the + input on the Filter. The output of the Filter is connected to B on the Interface, which also connects with Channel 2 on the Scope. The Vm x 10 on the OC-725C is connected to A on the Interface, which is also connected with Channel 1 on the Scope. Dac 1 connects to Trig 1 on the Interface and the Interface is then connected to the computer.
PerfusionThe perfusion lines should always have 1X Ringer in them. Make sure that the vacuum pump is on and that the vacuum flask is empty when you start. Be sure to keep on eye on the level of fluid in the vacuum flask during the experiment, because if the fluid backs up into the vacuum lines, it will burn out the vacuum pump, and then you have a very big problem on your hands. If the perfusion lines have air bubbles in them or have stopped, use a screwdriver (the flat edge!) to push the fluid through the lines until the air bubbles are gone or the perfusion starts to flow again. The perfusion lines should be set up so that you can switch between the perfusion in the beaker and the syringe. Use the syringe to run through serum, or other similar things, and switch between Ringer and serum using the switch near the bath. The perfusion should be kept running at a medium pace and should fill the bath to the top. The level of the perfusion can be adjusted be moving the height of the vacuum line in the bath and the rate of perfusion can be adjusted by opening or closing the clamp on the perfusion line.
MicromanipulatorsBefore using the micromanipulators, you should practice learning which dial moves in the x, y, or z plane and which direction to turn the dial to get it to move in the direction you want. It is very important that you understand how to use the micromanipulators before you start an experiment. The fine dial moves the micromanipulator back and forth at a set angle. The fine dial should be set at 45º.
Agar BridgesUse the lamp to bend two capillary tubes into U shapes. These need to fit between the bath and the ground wells (where the Bath Clamp wires are). Prepare an agar solution by dissolving 0.8 g of agar in 100 ml of Ringer. You will need to heat the solution in the microwave until the agar dissolves. Usually you should let it boil once, mix, and boil again. While the solution is still liquid, add 20 ml of Gentomycin and use a syringe to fill the bent capillary tubes with the agar solution. Allow the agar to solidify by placing the bridge ends up on a piece of clay. The bridges should
4
always be stored in the fridge in some Ringer, so that no bacteria grow in them.
ElectrodesThe electrode wires on the rig should always be well chlorinated and evenly dull. If not, scrape the wires with a razor until they are shiny. Then let them sit in bleach until they are dull again. Glass electrodes are also needed for the rig. The Narishige PP-83 electrode puller has two heaters, and the electrode is pulled in two stages. Heater 1 should be set at 62 and heater 51 should be set at 51. Do not change the puller settings. Make sure that the heating coil block is flush against the heater block at the top of the puller. Put in a 1.5mm diameter capillary tube, being careful not to touch the heating coil. Clamp down the capillary tube with the top screw. Pull up the block with the bottom screw so that it touches the heating coil block, and clamp down the capillary tube with the second screw as well. Make sure that the stopper is in place at the bottom to catch the block with the second screw. Put the plastic shield in place and hit start. (Make sure the puller is turned on!) This is the first pull and the capillary tube should only be narrower in the middle. Move the stopper aside, so that the block with the second screw can now fall all the way to the bottom. Move down the heating coil block so that the heating coil is at the narrowest part of the tube. The heating coil block should no longer be touching the heater block at the top of the puller, and the coil is now running off of heater 2. Put the plastic shield in place and hit start. This is the second pull, and you should now have two glass electrodes. Use the ethanol lamp to flame the back (unsharp) ends of the electrodes so that they will not de-chlorinate the wire electrodes. Be very careful of the tips of the glass electrodes! If they break you will need to pull new ones. The tips are very small and cannot be seen with the naked eye. Use a syringe with a filter to fill the electrode with 2M KCl. Avoid air bubbles in the tip, and tap out with your finger any that might get stuck. If you think that there might be air bubbles in the tip, look at it under appropriate magnification (5x works fine) under a microscope. At 5x magnification, the tip itself should appear to about the width of a single human hair, and then taper up.
Using the Rig
Start the perfusion and make sure that it keeps running. Make sure that you don’t run out of Ringer in your perfusion beaker. Use the agar bridges to connect the two ground wells to the bath. Loosen the screws on the wire electrodes, but don’t pull them off. Push in the glass electrodes and make sure that they go all the way to the end, past the rubber stopper. Tighten the screws. Carefully lower the electrode into the bath and set the offset to zero with the Ve and Vm offset. Hit the electrode test button. The resistance of the electrode should be between 1 to 3 MW. If the resistance is lower than this, the electrode is probably broken and should be replaced. If it is higher than this, you can break the electrode on the bottom of the bath to increase the diameter and resistance of the tip. Very carefully lower the tip to almost the bottom of the bath and use the fine dial to gently touch the tip to the bottom of the bath. Raise the electrode and check the resistance again. If it is still too big try breaking it again.
Recording from oocytesChoose an oocyte that is fairly large and has well defined animal and vegetal (dark and light) poles. Eggs that are splotchy will not be healthy. Use a plastic Pasteur pipette to pick up the egg and put it in the mesh in the bath. Use the micromanipulators to get the electrodes close to the egg, but don’t poke it yet. Get very close and then use the fine dials to poke the egg. Go slowly and gently. You should see a small dimple on the egg where the electrode is. It doesn’t matter where you poke the egg, just as long as the electrodes are lined up facing each other. When you see the dimple, stop dialing in! Just tap the base of the micromanipulator, and this should push the electrode the rest of the way in. Watch the read out from the electrodes while you are doing this. When you are in the egg, the electrode will display the resting potential of the cell. For a healthy cell, the resting potential should be around –50 mV. If tapping in doesn’t work, gently dial in further. As soon as
5
you see the resting potential (whatever it may be), stop dialing in! It is very easy to damage and kill the egg. Once one electrode is in, you can insert the other one. Vm and Im should read the same resting potential. If they are not the same, one of the electrodes may have come out. You should probably get a new egg at that point. If the resting potential is very low, letting the egg sit for a few minutes may help to bring it up to a healthier level. If you are planning on using an electrode again, you should check the resistance again. The electrode may have gotten clogged and this will raise the resistance. You can try to unclog the electrode by hitting the Buzz button on the OC-725C repeatedly. However, this may not always work. (see further explanation in “Voltage clamp” section)
ComputerYou can record the information from the electrodes and the bath to the computer and watch the read out as it happens. There are two computer programs that can be used to record data, one in LabView and one called WinEDR. To use WinEDR open the program and choose the name of your file when it prompts you. Under the Record menu, choose the Record to File option to see a read out from the Bath Current and Vm electrodes. Hit the Record button when you want to start saving data.
Shutting downPut the agar bridges back in ringer and put in the fridge. Flush the perfusion lines with Ringer if you ran anything else through them. Cover the ringer beakers or empty them. Put the glass electrodes in the sharps box. Turn off the vacuum pump and empty the vacuum flask. Toss the egg in the trash and shut down the electronics.
III. Voltage clamp Brenda Bloodgood
Introduction: Some of the most revolutionary experiments in neuroscience have been made possible through the development of various electrophysiological techniques. In this section we will explore voltage clamp recordings and some of the possible applications.
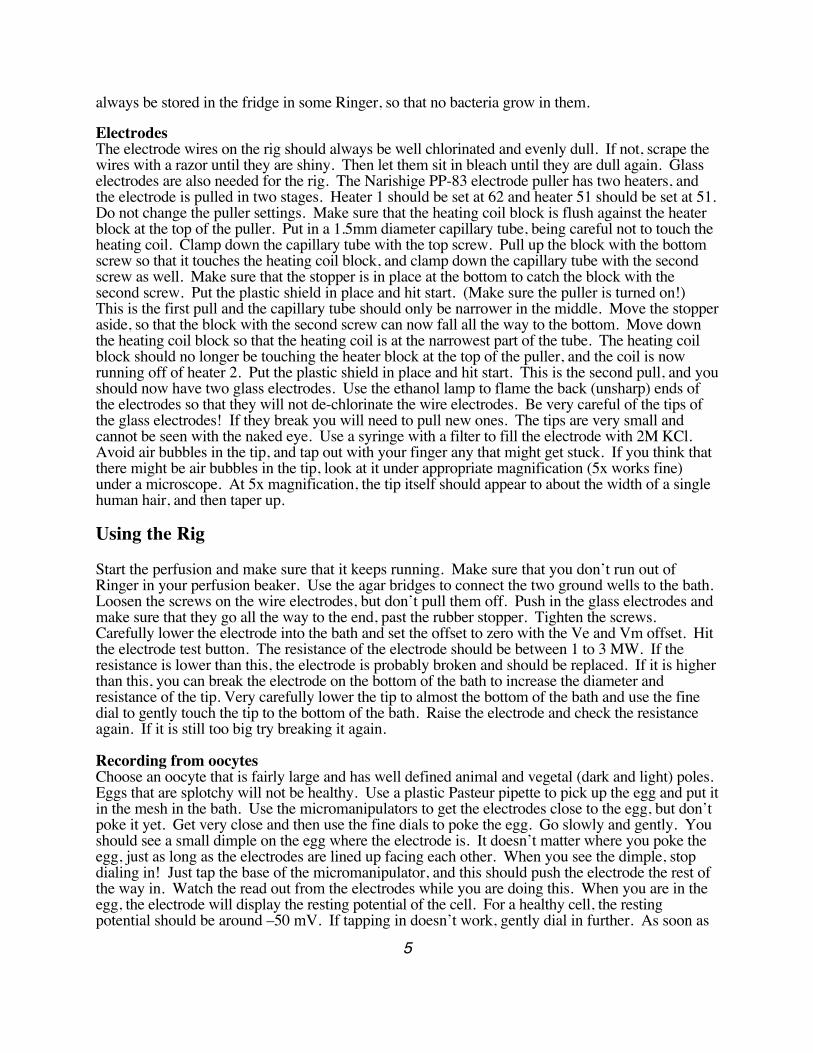
Background: The development of voltage clamp techniques is primarily attributed to the work of Marmont (1949), Cole (1949), and Hodgkin, Huxley, and Katz (1949, 1952). Effectively, to voltage clamp is to control the potential difference across the cell membrane in order to observe the cells current fluctuations. Most voltage clamp setups (including the one used in this lab) consist of an intracellular voltage-recording electrode and a follower circuit that is used to measure the membrane potential. The recorded signal is compared to the command voltage and amplified through a feedback amplifier. The difference between the two voltages (error signal) is converted into current (Ohm’s law) and applied to the cell through a second current electrode and into the bath-grounding electrode where it is recorded.
Voltage Clamp Schematic
Figure 1: Schematic of two-electrode voltage clamp method. E_: recorded potential, x1: follower circuit, E: recorded voltage, FBA: feedback amplifier, I_: injected current, I: recorded current. Figure from Hille (1992)
6
The injected current is equal and opposite the current generated by the cell in response to the given step command. Voltage clamp can be used to characterize the total current flow (current generated by the net movement of several different ion types) or to assess the current generated by an individual ion or through a single type of ion channel.
A simple understanding can be obtained by remembering the following:
IM = Ii + Ic = Ii + CM dE/dt
Where IM is the total current flowing across the membrane, Ii is the ionic current, Ic is the capacitive current, and CM dE/dt is the capacitance of the membrane changing with respect to time and voltage. During a step command dE/dt is 0 with the exception of the brief period of time necessary to initiate the step. During the time dE/dt is not 0, you see the sharp capacitive charging of the membrane. The capacitance change is several orders of magnitude quicker then the ionic currents. Generally, this allows you to disregard Ic when considering Ii for the cell .
Simply, voltage clamping a cell holds the membrane potential constant allowing us to look at the current that flows in response to the command voltage. Procedure: Place the oocyte in the perfusion chamber. Using the approach outlined previously, impale the cell with both the voltage and the current electrodes. Note the resting potential of the cell. This should be roughly between –20 and –50 mV and both electrodes should be in approximate agreement. Using the Oocyte Clamp OC-725C, set the command voltage. Initially, but depending on the manipulation, this should be at or near the resting potential of the cell. Set the clamp dial to slow, turn the gain up to high, and then increase the clamp dial to fast . The cell is now clamped at the said voltage. Note the amount of current required to hold the cell at the command voltage. This should be at or around 0 nA. Stepping the command voltage from –30 mV to –40 mV will generate a respective change in the recorded current. (see further explanation in “Recording from oocytes” section)
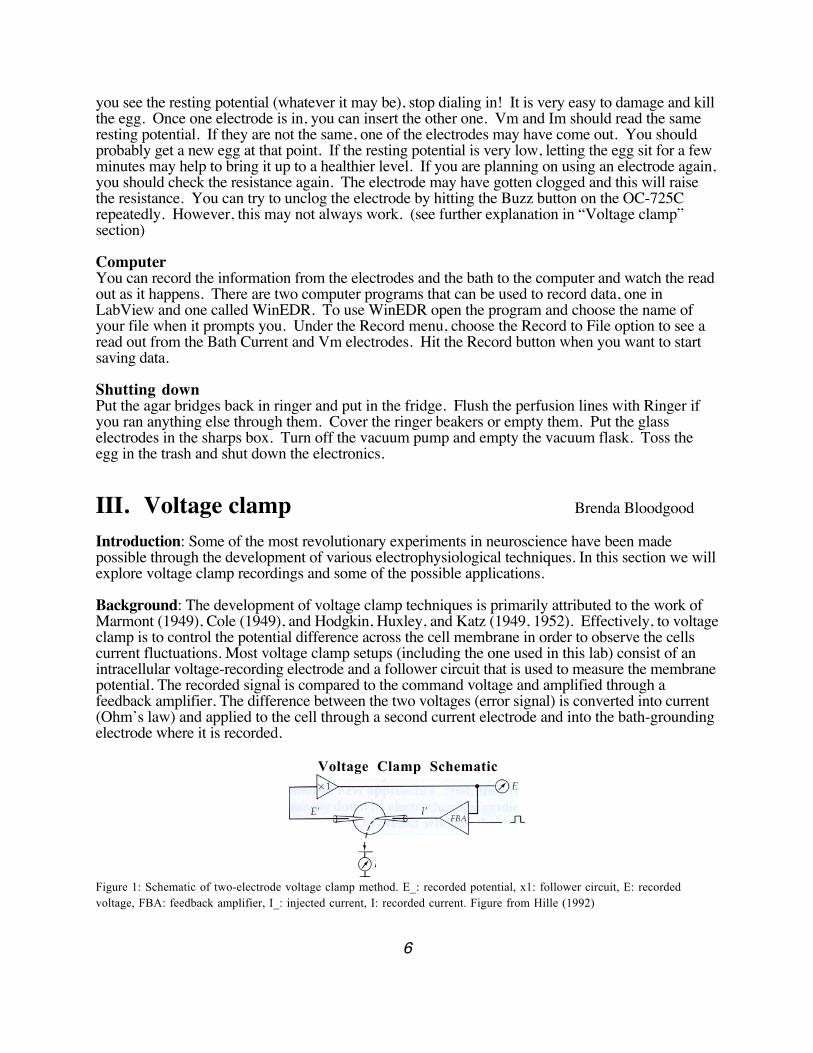
Results: Typical voltage clamp recordings for oocytes should look as follows.
Voltage Clamp Recording
Figure 2: Depolarization is accompanied by capacitive (IC) and leak currents (Il). (Figure from Kandell, Schwartz and Jessell 1991)
Note the approximately instantaneous capacitive charging and discharging of the membrane at the onset and offset respectively of the step. Recordings from oocytes, unless they are expressing an exogenous channel, should appear relatively similar.
7
Work Cited:
Cole, K. S. 1949. Dynamic electrical characteristics of the squid axon membrane. Arch. Sci. Physiol. 3:253-258. [2].Hille, B. Ionic Channels of Excitable Membranes. Sunderland, Massachusetts: Sinauer Associates Inc. 1992.Hodgkin, A. L., A. F. Huxley and B. Katz. 1949. Ionic currents underlying activity in the giant axon of the squid. Arch. Sci. Physiol. 3:129-150. [2,3].Hodgkin, A. L., A. Huxley, and B. Katz. 1952. Measurements of current-voltage relations in the membrane of the giant axon of Loligo. J. Physiol. (London) 116:424-445. [2,3,18].Kandell, E. R., J. H. Schwartz and T. M. Jessell. Principles of Neural Science. Norwalk, Connecticut: Appleton and Lange. 1991.Marmont, G. 1949. Studies on the axon membrane. I. A new method. J. Cell. Comp. Physiol. 34:351-382. [2].
IV. IP3 injections Jennifer Coats
SetupYou should have a healthy cell with a resting potential of about –40 to –50 mV in the bath with the electrodes already inserted. The perfusion should be running. Don’t clamp the cell yet, since you need to see a small drop in the cell’s resting potential when the injection pipette is fully inside the cell.
Preparing the injection pipette
Glass pipettes that are used as electrodes on the rig can also be used as injection pipettes. Since we are using capillary tubes to make the pipettes, we can use the capillary beads in the tube to back-fill our injection pipette, by capillary action. The solution will travel up the tube on the capillary bead. Prepare an aliquot of 1 mM IP3 in ddH2O and put it in a 1.5 mL Eppendorf tube. Place the pipette (which should have been pulled on the electrode puller with the same settings as for an electrophysiology electrode) end first into the Eppendorf tube. After a few seconds, you should be able to see the tip filling with liquid. The pipette should only stay in the tube for about a minute, since the injection pipette will not take up very much IP3. You should just barely be able to see the liquid in the tip.
The tricky part is breaking the tip. The tip is too small to inject with, so a tiny bit of it needs to be broken off. Put the pipette under the scope under the highest magnification. Hold the pipette securely, and using the sides of the fine forceps, gently touch the forceps to the tip of the pipette. You should see a tiny bit of the tip come away. If you take off too much, you will need to get a new pipette and try again. The way to test if enough has been broken off is to put the pipette in the injector. Look at the tip under high magnification. The controller for the injector has a timer and a switch. Ensure that the airflow is turned on to the controller. The timer reads in seconds, so if the timer read out is set to 00.060, this means that it is set to inject for 60 milliseconds. To inject, push the switch toward the timer. You should hear a clicking noise and see a light on the controller turn on. When you hit the switch to inject, you should see a small bead of solution form at the tip of the injection pipette. If the solution squirts out of the tip, you broke off too much and need to prepare a new one. If no solution comes out, you need to break more off the tip.
8
InjectingJust before you are ready to inject, fill the injection pipette with KCl from the filter syringe. Adding the KCl too early will cause the IP3 to diffuse throughout the pipette, and only a small amount of IP3 will actually be in the injection.
Insert the injection pipette into the cell the same way that you would an electrode pipette. Go slowly and be careful not to kill the oocyte. Since the tip of the injection pipette is more blunt than the tip of the electrode pipette, you may need to dial in the injection pipette more in order to get through the membrane. When the tip is in, you should see a large dimple in the oocyte, and the resting membrane potential should drop by a small amount. If the membrane potential drops and keeps dropping, you have probably pushed too far in with the injection pipette and killed the cell.
Now that the tip is in, you can inject. First, clamp the cell at about –80 mV. The timer should be set to 60 milliseconds to inject the right amount. Inject too much, and you will rupture the cell, but inject too little, and you won’t see any effect. Inject the IP3 by hitting the controller switch once. You should actually be able to see the oocyte swell a little bit during the injection. After the IP3 is injected, you should be able to see oscillations like the ones you get when you run through serum. If you don’t see any oscillations after a while, put serum on the oocyte and you should see large oscillations.
Other UsesYou can also use this protocol to inject many other things into the oocyte and look at their effects with the electrophysiology rig. You can inject Ca2+ into the cell and look at the effect it has on the Cl- channels. In this cause you should see a single inward response current and the cell should quickly recover. You can also inject Ca2+ buffers such as EGTA and BAPTA, and control the cell’s response to serum. Injecting a Ca2+ buffer into the cell should slow down and stop the Ca2+ oscillations produced by the serum.
V. LPA Induced Cl- Oscillations in Xenopus Oocytes Brenda Bloodgood
Introduction: Now that we have the basic voltage clamp preparation done, there are several more interesting manipulations we can explore. In this section we will look at Ca2+ induced Cl- oscillations generated by the lysophosphatidic acid (LPA) signal transduction pathway in Xenopus oocytes.
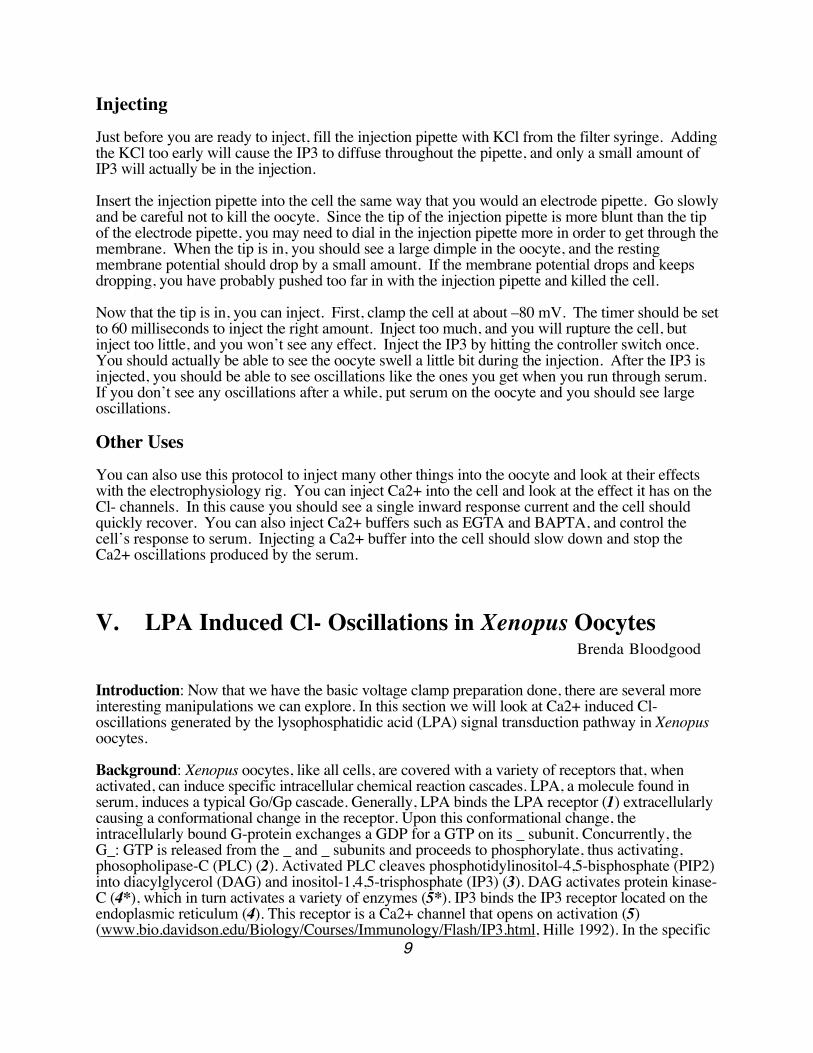
Background: Xenopus oocytes, like all cells, are covered with a variety of receptors that, when activated, can induce specific intracellular chemical reaction cascades. LPA, a molecule found in serum, induces a typical Go/Gp cascade. Generally, LPA binds the LPA receptor (1) extracellularly causing a conformational change in the receptor. Upon this conformational change, the intracellularly bound G-protein exchanges a GDP for a GTP on its _ subunit. Concurrently, the G_: GTP is released from the _ and _ subunits and proceeds to phosphorylate, thus activating, phosopholipase-C (PLC) (2). Activated PLC cleaves phosphotidylinositol-4,5-bisphosphate (PIP2) into diacylglycerol (DAG) and inositol-1,4,5-trisphosphate (IP3) (3). DAG activates protein kinase-C (4*), which in turn activates a variety of enzymes (5*). IP3 binds the IP3 receptor located on the endoplasmic reticulum (4). This receptor is a Ca2+ channel that opens on activation (5) (www.bio.davidson.edu/Biology/Courses/Immunology/Flash/IP3.html, Hille 1992). In the specific
9
case of Xenopus oocytes, the previously described cascade takes place (Yao and Parker 1993) with the resulting increase in internal [Ca2+] activating Ca2+ -dependent Cl- channels (6) (Kuruma and Hartzell 1999). The influx of Cl- ions creates a macroscopic current that we can measure and quantify with voltage clamp techniques (7).
In summary, LPA increases intracellular concentrations of IP3, which subsequently allows the releases of Ca2+ from the endoplasmic reticulum. This liberated Ca2+ activates Cl- channels generating a macroscopic current we can measure.
LPA Signal Transduction Cascade
Figure 3: LPA signal transduction pathway in Xenopus oocytes. Numbers reference previous description.
Procedure: Make frog Ringer with horse or goat serum at a 10_l: 100 ml dilution . Place the oocyte in the perfusion chamber; perfuse the cell with normal Ringer. Using the approach outline previously, voltage clamp the cell. Once you have clamped the cell, switch to the saline with serum and begin recording with the software .
There are two different recording protocols that have been used in the past. By the first, recordings are made for ~1-3 minute intervals. After each recording, but while still clamping the cell, perfuse
10
the oocyte with normal saline for 10-15 minutes. This, in theory, prevents saturation and adaptation of the intracellular machinery of the cascade. This cycle can be repeated several times. In the second protocol, again voltage clamp the cell. Continuously perfuse the chamber with serum Ringer. Record for 10 or more minutes.
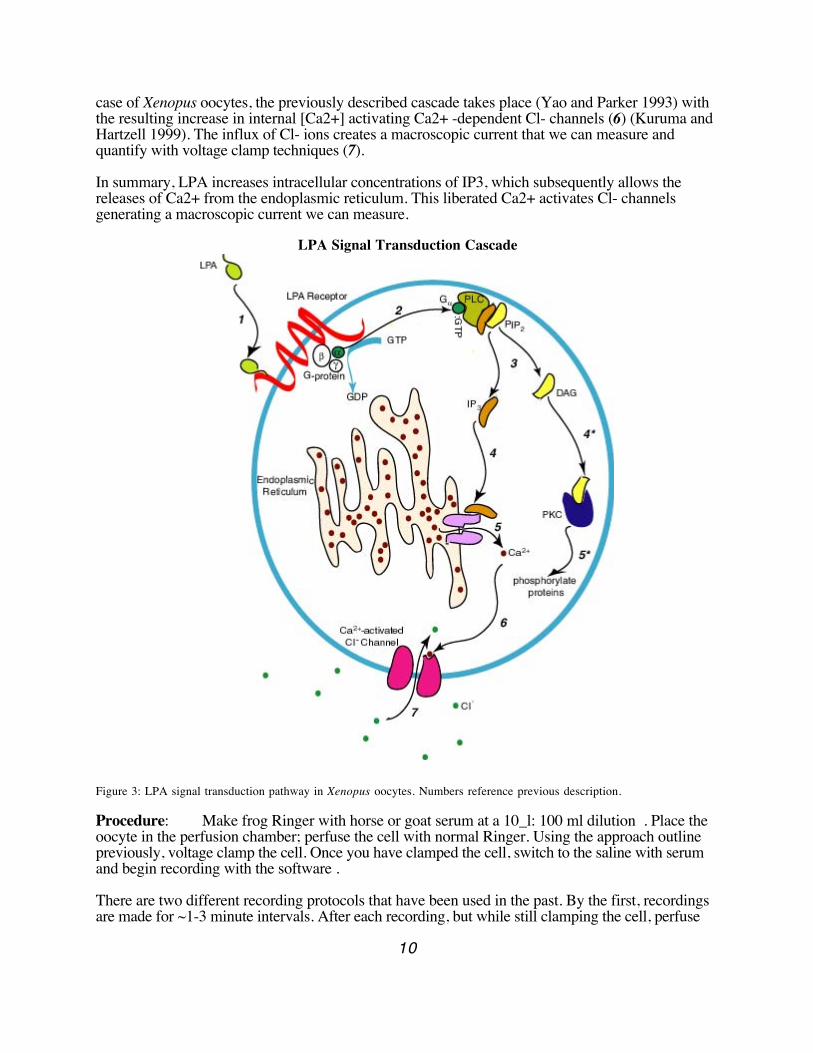
Results:The following current traces are recordings from the same oocyte using the first protocol. Traces are 120 seconds in duration. The oocyte was perfused with normal Ringer for 10 minutes between traces. All traces are to the same scale.
Ca2+ induced Cl- Oscillations (First Protocol) 10 sec
10nA
11
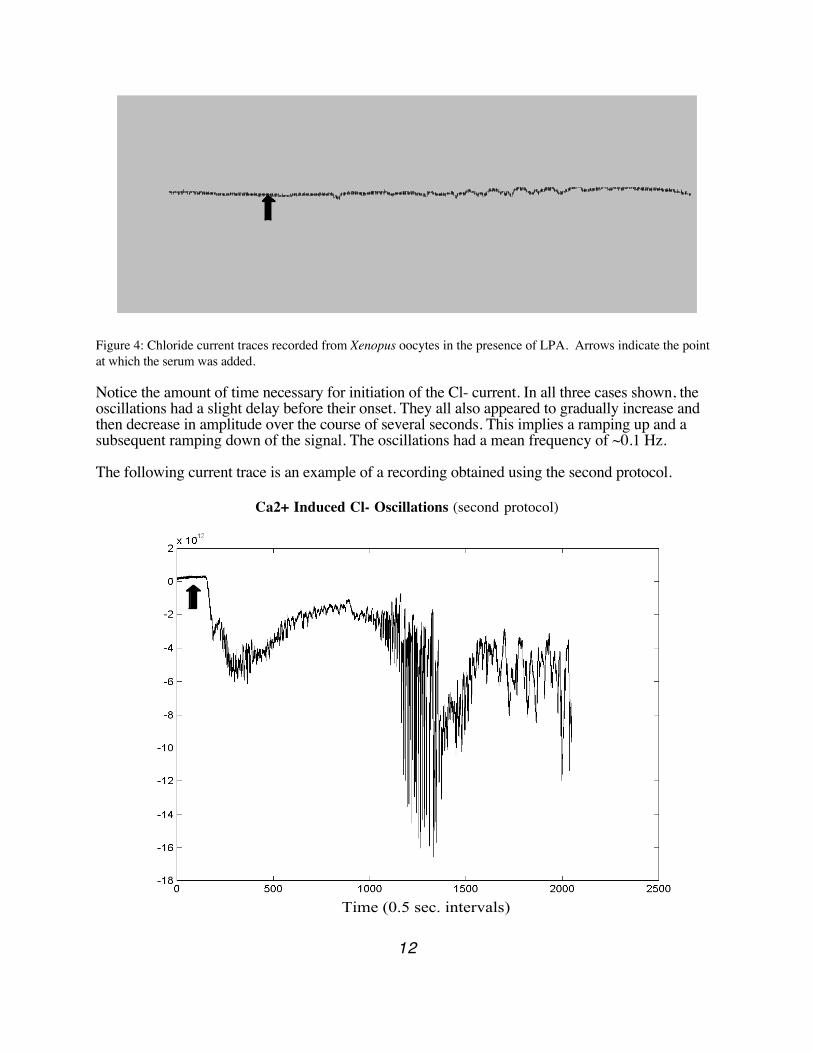
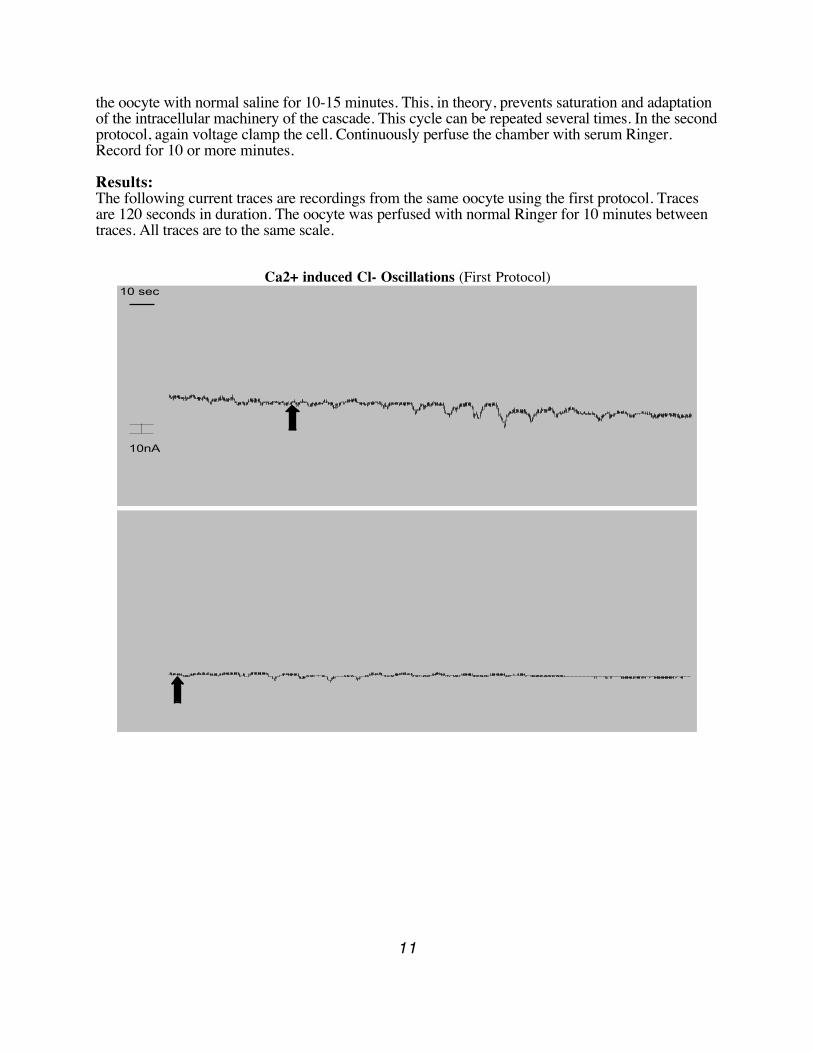
Figure 4: Chloride current traces recorded from Xenopus oocytes in the presence of LPA. Arrows indicate the point at which the serum was added.
Notice the amount of time necessary for initiation of the Cl- current. In all three cases shown, the oscillations had a slight delay before their onset. They all also appeared to gradually increase and then decrease in amplitude over the course of several seconds. This implies a ramping up and a subsequent ramping down of the signal. The oscillations had a mean frequency of ~0.1 Hz.
The following current trace is an example of a recording obtained using the second protocol.
Ca2+ Induced Cl- Oscillations (second protocol)
Time (0.5 sec. intervals)
12
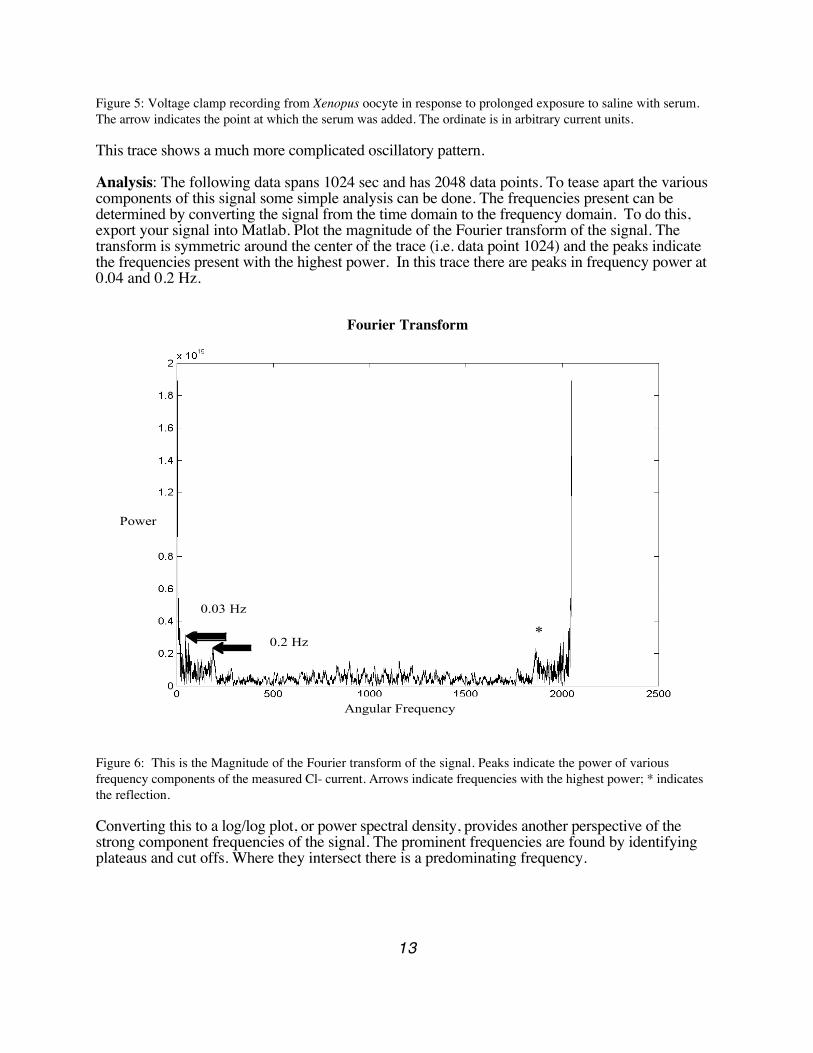
Figure 5: Voltage clamp recording from Xenopus oocyte in response to prolonged exposure to saline with serum. The arrow indicates the point at which the serum was added. The ordinate is in arbitrary current units.
This trace shows a much more complicated oscillatory pattern.
Analysis: The following data spans 1024 sec and has 2048 data points. To tease apart the various components of this signal some simple analysis can be done. The frequencies present can be determined by converting the signal from the time domain to the frequency domain. To do this, export your signal into Matlab. Plot the magnitude of the Fourier transform of the signal. The transform is symmetric around the center of the trace (i.e. data point 1024) and the peaks indicate the frequencies present with the highest power. In this trace there are peaks in frequency power at 0.04 and 0.2 Hz.
Fourier Transform
Angular Frequency
Power
0.2 Hz
0.03 Hz
*
Figure 6: This is the Magnitude of the Fourier transform of the signal. Peaks indicate the power of various frequency components of the measured Cl- current. Arrows indicate frequencies with the highest power; * indicates the reflection.
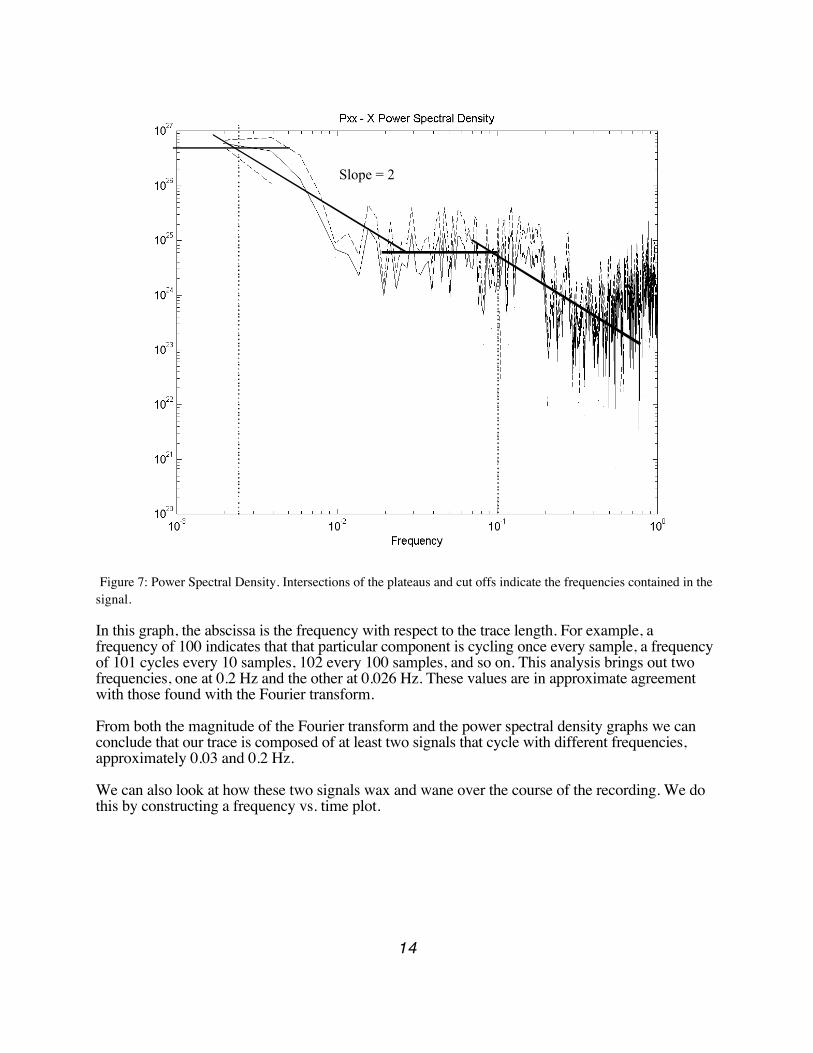
Converting this to a log/log plot, or power spectral density, provides another perspective of the strong component frequencies of the signal. The prominent frequencies are found by identifying plateaus and cut offs. Where they intersect there is a predominating frequency.
13
Slope = 2
Figure 7: Power Spectral Density. Intersections of the plateaus and cut offs indicate the frequencies contained in the signal.
In this graph, the abscissa is the frequency with respect to the trace length. For example, a frequency of 100 indicates that that particular component is cycling once every sample, a frequency of 101 cycles every 10 samples, 102 every 100 samples, and so on. This analysis brings out two frequencies, one at 0.2 Hz and the other at 0.026 Hz. These values are in approximate agreement with those found with the Fourier transform.
From both the magnitude of the Fourier transform and the power spectral density graphs we can conclude that our trace is composed of at least two signals that cycle with different frequencies, approximately 0.03 and 0.2 Hz.
We can also look at how these two signals wax and wane over the course of the recording. We do this by constructing a frequency vs. time plot.
14

Frequency vs. Time
Figure 8: This plot maps the change in the power of a frequency with respect to time. Red = highest power; blue = lowest power. The arrow indicates the addition of serum. = Ramping down of faster signal;
= Ramping up of faster signal
In this plot, each column represents the Fourier transforms done on the data points collected over 50 sec. The power of each of the frequencies is plotted along the ordinate, high to low represented by red to blue blocks. There is a constant low frequency component at approximately 0.02 Hz for the duration of the trace. The higher frequency component, however, is not constant. It appears to have a relatively rapid increase and slower decrease in frequency, lasting approximately 50 and 400 seconds respectively. It is likely that this is the current recorded using the first protocol.
Additional experiments should be done to determine the nature of the dual oscillations. One possible mechanism for the individual frequencies observed is the presence of different Cl- channel populations. Various Cl- channel blockers could be administered to determine whether or not there is a change in one or both or the Cl- current frequencies. Alternatively, there could be one Cl- channel that has two different kinetic behaviors depending on the [Ca2+]. To test this, fast and slow Ca2+ buffers could be separately injected into the oocyte.
15
Works Cited:Hille, B. Ionic Channels of Excitable Membranes. Sunderland, Massachusetts: Sinauer Associates Inc. 1992.Kuruma, A., and H. C. Hartzell. 1999. Dynamics of Ca2+ regulation of Cl- currents in Xenopus oocytes. Am. J. Physiolo. 276:C161-C175.Yao, Y., and I. Parker. 1993. Inositol trisphosphate-mediated Ca2+ influx into Xenopus oocytes triggers Ca2+ liberation from intracellular stores. J. Physiolo. 468:275-296.www.bio.davidson.edu/Biology/Courses/Immunology/Flash/IP3.html. June 2001.
V. mRNA expression Gary Tedeschi
Introduction
When doing electrophysiology experiments with the oocytes it may be desirable to investigate the properties of particular protein channels not native to the oocyte. To facilitate this one needs to express the particular protein in the egg. This is done by obtaining the cDNA template of the protein, transcribing the protein into mRNA, and injecting the mRNA into an oocyte. Utilizing the translation machinery of the oocyte the mRNA is then translated into the protein and, through processes not at all clearly understood, the protein folds into its appropriate conformation, finds its way into the membrane of the egg and orients itself in the appropriate way so as to function properly (truly miraculous indeed!)
Overall Description
The template DNA you obtain will be embedded in plasmid DNA. This is circular DNA used in cloning and other recombinant DNA techniques. To transcribe only the template DNA you will need to linearize the circular DNA so that when the transcription machinery reaches the end of the template it will just fall off instead continuing around and around giving you a bunch of unwanted RNA. This is done by cutting the plasmids with restriction enzymes in a process called “linearization”.
This will give the desired linear DNA, but now you have DNA plus unwanted enzymes. You will need to “clean” the DNA by extracting out the unwanted stuff with phenol/chloroform and then precipitating the DNA with ethanol and centrifugation.
Once DNA is thus obtained, you will use the Ambion mMessage RNA kit to transcribe the DNA into mRNA. But again you will have unwanted material along with the mRNA. So you will perform phenol/chloroform extraction and ethanol precipitation once again.
With the RNA in hand you will need to figure out how much you have. This quantification is done using a spectrophotometer.
Injection of oocytes with the RNA will be done using the nanoinjector. It will take about 48 hours for expression of proteins to be complete after injection of mRNA. The last step is to take electrical measurements at a electrophysiology station to try and detect the signature current response of the protein channel expressed. Successful detection of the signal is the final indication of successful expression.
16
General precautions when handling mRNA!!
RNAses are ruthless, ubiquitous, and uncompromising. There sole purpose is to destroy all your mRNA, cutting it to pieces, rendering it, and your work, useless. exist on your fingers; they travel in your spit droplets expunged by sneezes or overzealous conversation. So to guard against them, only use sterile equipment (e.g. tubes, pipette tips etc.). Always wear gloves when handling mRNA. Don’t sneeze on the mRNA or equipment holding mRNA. Try not to talk in the direction of the stuff. I know this is a bit paranoid, but you don’t want to waste the hours of boring, tedious lab work.
Chemicals needed
• 4 M NaCl• chloroform• phenol/chloroform• Ethanol• 70% Ethanol• Ambion mMessage Kit• Deionized water• TE (10 mM Tris-base + 1 mM EDTA at 7.8 pH)
Linearization
Note: the amount of materials you use will depend on your circumstances. However, as reference, in italics is an example of an expression procedure of shaker potassium channel.
• Turn on centrifuge, and set temperature to 4 deg C• Turn on water bath and set temperature to 37 deg C• Add 5 ml of X10 reaction buffer from the Ambion kit• Add 1-2 ml EcoR1 restriction enzyme from Ambion kit• Add desired concentration of template DNAFor example, add 3 ul of 0.75 mg/ml ShBt7 DNA for a total of about 2 mg of DNA.
• Add enough water to get 50 ml of solution• Incubate in 37 deg C bath for 2 hours
Purification and Precipitation
Purify with phenol/chloroform
• Add an equal volume of phenol/chloroform (50 ml)• Vortex for 20 sec or until mixture looks milky white• Centrifuge for 30 sec at 4 deg C and at 14000 rpm• Remove supernatant (the top layer of liquid containing the DNA) into a new Eppendorf tube• Repeat above 4 steps one time• Add an equal volume of chloroform (50 ml)
17
• Vortex for 20 sec• Centrifuge for 30 sec at 4 deg C and at 14000 rpm• Remove the supernatant into new Eppendorf tube
Precipitate with EtOH
• Add 2.5 volumes of Ethanol (EtOH) (125 ul)• Add 52 ml or 4M NaCl for each ml of solution (3 ml)• Vortex for 20 sec• Store at –20 deg C for 45 minutes• Centrifuge for 20 minutes at 4 deg C, 14000 rpm
Note: after centrifuging, the pellet of DNA will probably be too small to see. Thus to get your bearings to where the DNA may be, place the Eppendorf tube in the centrifuge so that the hinge of the tube’s cap is pointing up. This way you know that the DNA pellet is somewhere on the back of the tube in line with the hinge. It is important to keep that in mind when removing the supernatant – keep the tip of the pipette clear of the area where the DNA is suspected to be, you don’t want to suck out the DNA!
• Remove and discard supernatant• Add 500 ml of 75% EtOH• Centrifuge for 10 minutes at 4 deg C, 14000 rpm• Repeat last three steps one time• Remove and discard supernatant• Dry DNA pellet in air for about 15 minutes or until liquid is gone• Resuspend pellet in 3 ml TE (expect to have ~1 mg/3 ml)• Store DNA at –20 deg C.
Note: expect to end up with about half of the DNA that you started with. So in our case we assume that we have about 1 mg of DNA. There is no way to actually quantify the amount of DNA at this point; and there really is no need.
You can stop here and store the DNA for an indefinite period of time, continuing with transcription at a later time if need be.
Transcription of mRNA from Template DNA
See Ambion mMessage Instruction Manual page 7-8, section B, parts 1 – 4.In our case we scaled up the reaction by a factor of 3 by making a 60 ml mixture instead of 20 ml. We obtained a good yield with this, so you may want to try this also. If you do this be sure to add three times the given amounts indicated in the instruction manual and three times the values given below.
Note: when working with the RNA only use individually wrapped sterile tubes and prepackaged, sterile pipette tips. Use each tip only once. All this is needed to avoid contamination by RNAses. Recovery of the RNA
18
Facilitate removal of template DNA by cutting it up with DNAase I
• Add 1 ml DNAase I from kit• Incubate mixture in 37 deg C bath for 15 minutes to allow for digestion of DNA
Purification of mRNA with phenol/chloroform• Add 115 ml nuclease free water (now that your are working with RNA be sure to use the nuclease free water provided with the kit)• Add 15 ml Ammonium Acetate stop solution• Vortex for about 20 seconds• Add 500 ml (i.e. equal volume) of phenol/chloroform• Vortex for about 20 seconds• Centrifuge for 30 seconds at 4 deg C at 14000 rpm• Remove supernatant and put into new sterile Eppendorf tube• Add 500 ml (i.e. equal volume) of chloroform• Vortex for about 20 seconds• Centrifuge for 30 seconds at 4 deg C at 14000 rpm• Remove supernatant (aqueous phase) and put it into new sterile tube
Precipitate mRNA with EtOH
• Add 1 ml EtOH• Store at –20 deg C for 30 minutes to allow for precipitation• Centrifuge for 20 minutes at 4 deg C at 14000 rpm
At this point you should see a large pellet of RNA stuck to the side of the tube. If so, congratulations, it worked!!!!
• Remove and discard supernatant• Add 500 ml of 70% EtOH washing the sides of the tube as you add• Centrifuge for 3 minutes at 4 deg C at 14000 rpm• Dry pellet in air for about 15 minutes• Resuspend in 15 ul nuclease free water• Store RNA at –80 deg C. Can store RNA indefinitely at this point.
Quantification
Use the spectrophotometer to determine how much mRNA you have. Nucleic acids have a peak absorbance at 260 nm. A peak value of 1.00 corresponds to 40 mg/ml of RNA. Thus the concentration of RNA in a diluted sample is
A260 * dilution factor * 40 mg/ml
The spectrophotometer in the lab will make all the calculations for you. Read pages 59 – 60 and page 67 in the Biophotometer manual for the steps needed to make the measurements. Be sure to include the dilution in your measurements following the instructions on page 67.
19
You can also determine the purity of your sample. The absorbance at 280 nm has exactly half the value of that at 260 nm. Thus if sample is pure the ratio A260/A280 should be 2. You can accept a value as low as 1.5; but if it is lower, then your sample is contaminated and you get to start over. The Biophotometer also gives a read out for this ratio.
Injection of mRNA Into the Oocyte
Preparation of micropipettes
• Pull some glass micropipettes (this is same procedure as pulling electrodes)• Bake pipettes in the oven for 2 hours at 180 deg C to get rid of RNAses• Put on gloves and get one of the pipettes• Get a pair of forceps and fire the tips• Under microscope, barely break the tip of the pipette with the forceps
To get this right will require plain old practice and trial and error. The tips cannot be too big or they will damage the oocytes, on the other hand, the hole in the tip has to be big enough to allow for injection of fluid. The only way to figure out what is “too big” or “too small” is to screw up a couple of times.
• Back fill pipette with oil using the syringeBe sure not to allow air bubbles to get in.• Lower the nanoinjector tip by pushing the empty button on controller box. Lower it until it sticks out a couple of centimeters or so.• Push pipette over injector tip, ensuring it fits snugly into screw holder• Once in, push empty button to see if oil comes out of tip• Get 15 or 20 or so eggs and put them and some Barth’s solution into a dish which has a mesh on the bottom. The mesh will help hold the eggs.• Line up eggs, each egg in a square, so that the vegetal pole (light half) of the egg is facing up. You will be injecting into the vegetal pole.
Getting RNA for injection
• You should probably change gloves at this point• Get a sterile Eppendorf tube; break off its cap. You will use the cap to put the RNA into.• Get a tube of RNA from the freezer• Vortex tube to thaw the mixture• Centrifuge tube for 10 seconds to get mixture to the bottom of tube and prevent contamination.• Using a 10 ml pipette labeled “RNA only,” pipette desired amount into the cap
E.g., using a solution of 2 ng/10 nl solution, put 0.2 ml in cap to inject 20 eggs at 2 ng per egg (10 nl per injection). The normal amount per egg should be about 0.2ng per egg. We used 10 times that amount to exaggerate expression, to increase the hope of getting expression. But once confident that your procedure is working, 0.2ng per egg should suffice.
• Position cap under microscope at injection station, move injection tip close to the “bubble” of RNA solution with course controls, then insert tip into the “bubble” with microcontroller.• Push fill button to fill injection tip with RNA. Be sure not to suck up air by letting the tip come
20
out of the “bubble” while still filling.• Your are now ready to inject oocytes• Position oocytes such that you can easily move from one egg to the next by just the moving dish. Once you get the hang of this, injecting should become efficient.• Position first egg under injection tip.• Slowly stick egg with tip by turning microcontroller clockwise• Make sure settings on controller box are set for desired volume of injection. (10 nl is a good starting value see manual of nanoinjector for detail on how to do this)• Push the inject button on controller box• Pull out the tip by turning microcontroller counter clockwise. (try to be somewhat quick when pulling tip out to increase probability that egg can heal from the trauma of being impelled)• Position next egg, and repeat above• When done transfer eggs into another dish with Barth’s solution and store at 16 deg C• Allow at least 48 hours for complete expression
Using Electrophysiology To Detect If Expression Occurred
By applying a command voltage which starts at the resting potential of the particular ion channel expressed and increasing by 10mV steps, you should see a typical current response of the protein channel. E.g., -90mV is the resting potential for the shaker potassium channel (Johnston 17). The verification of such a response gives an indication that expression was successful.
• Set up an egg at an electrophysiology station for electrical measurements• Once you have electrodes stuck in an egg and are ready to take measurements, open the Winwcp program on the computer.• Look under help, contents for the section entitled “Things to do before making a recording”• Read through the section entitled “Creating a Stimulus Protocol” to familiarize yourself with setting up the appropriate command signals
Below I shall use the shaker potassium channel as an example. If you expressed a different channel, adjust voltages accordingly
• Create a new file by going to New under File• Go to Stimulus protocol editor under Setup• Drag step voltage command onto the voltage command protocol area• Enter the following settings
Delay 50.00msInitial Amplitude -90.00mV (if shaker)Increment 10.00mV# of Increments 10Duration 300.00ms
21
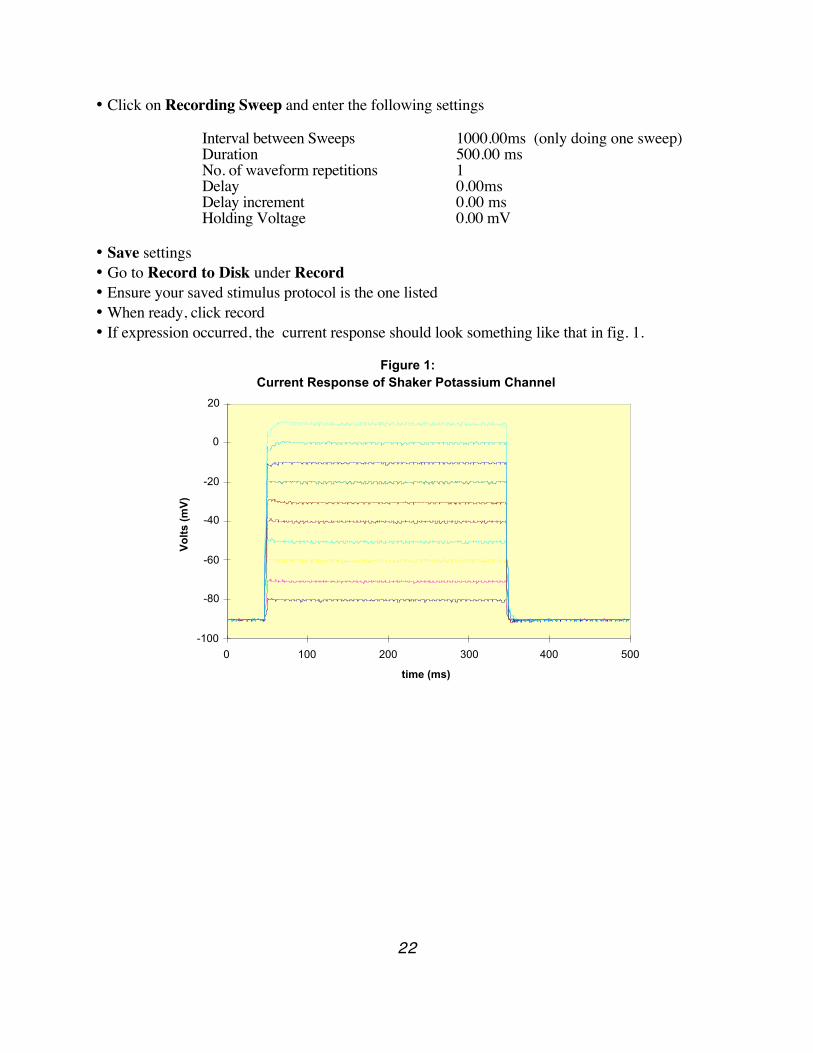
• Click on Recording Sweep and enter the following settings
Interval between Sweeps 1000.00ms (only doing one sweep)Duration 500.00 msNo. of waveform repetitions 1Delay 0.00msDelay increment 0.00 msHolding Voltage 0.00 mV
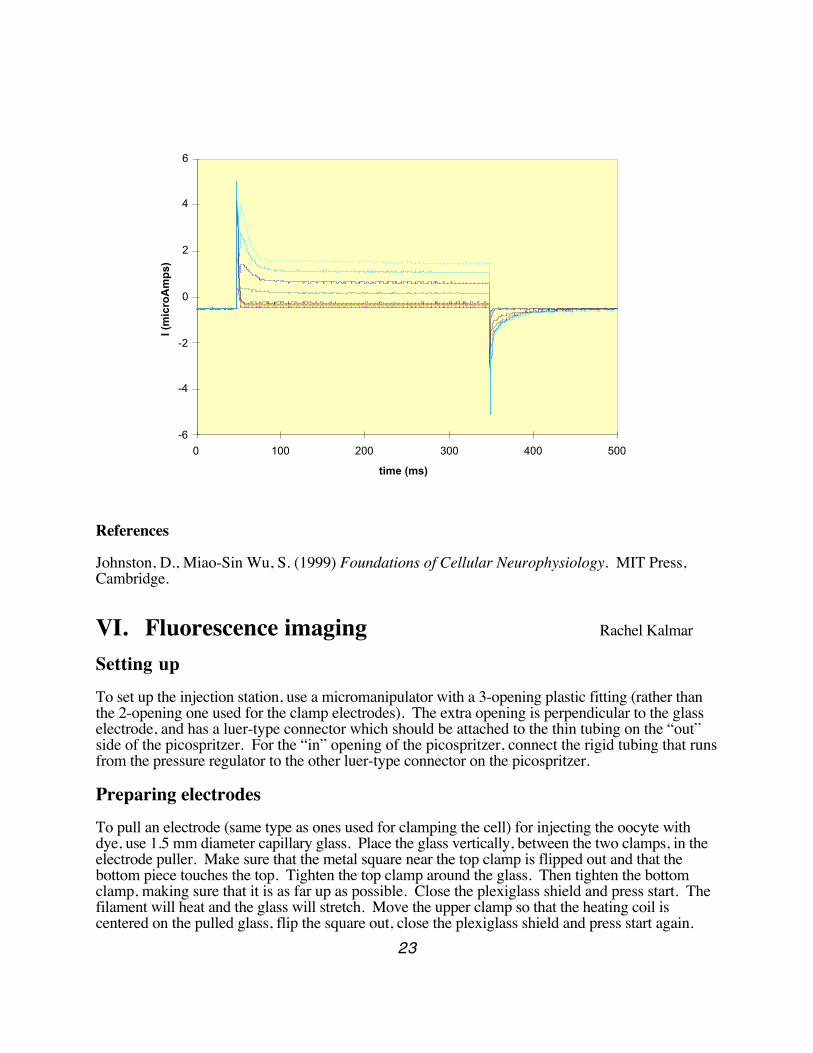
• Save settings• Go to Record to Disk under Record• Ensure your saved stimulus protocol is the one listed• When ready, click record• If expression occurred, the current response should look something like that in fig. 1.
Figure 1: Current Response of Shaker Potassium Channel
-100
-80
-60
-40
-20
0
20
0 100 200 300 400 500
time (ms)
Vo
lts
(mV
)
22
-6
-4
-2
0
2
4
6
0 100 200 300 400 500
time (ms)
I (m
icro
Am
ps)
References
Johnston, D., Miao-Sin Wu, S. (1999) Foundations of Cellular Neurophysiology. MIT Press, Cambridge.
VI. Fluorescence imaging Rachel Kalmar
Setting upTo set up the injection station, use a micromanipulator with a 3-opening plastic fitting (rather than the 2-opening one used for the clamp electrodes). The extra opening is perpendicular to the glass electrode, and has a luer-type connector which should be attached to the thin tubing on the “out” side of the picospritzer. For the “in” opening of the picospritzer, connect the rigid tubing that runs from the pressure regulator to the other luer-type connector on the picospritzer.
Preparing electrodesTo pull an electrode (same type as ones used for clamping the cell) for injecting the oocyte with dye, use 1.5 mm diameter capillary glass. Place the glass vertically, between the two clamps, in the electrode puller. Make sure that the metal square near the top clamp is flipped out and that the bottom piece touches the top. Tighten the top clamp around the glass. Then tighten the bottom clamp, making sure that it is as far up as possible. Close the plexiglass shield and press start. The filament will heat and the glass will stretch. Move the upper clamp so that the heating coil is centered on the pulled glass, flip the square out, close the plexiglass shield and press start again.
23
When the electrode is pulled, carefully remove the glass and fire polish the wide ends of the electrodes (hold them in a flame). This will prevent the electrode holder from being scratched and will ensure a good seal.
To fill the electrodes with dye, place wide end in dye (10 seconds should be plenty). A capillary fiber inside the electrode carries the dye to the tip. You should notice fluorescent color at the tip of the electrode. Fill the electrode with KCl, in the same way that the clamp electrodes are filled. Place this electrode into the plastic fitting so that it fits snugly.
Injecting Before you inject the oocyte, make sure that your manipulator is set up so that you can bring the electrode down with a sufficiently steep angle so that the egg does not slide as you insert the electrode. Slowly poke the electrode into the oocyte using the procedure outlined for voltage clamping.
The number on the picospritzer refers to how many ms the valve opens for. You can vary this as needed, but a reasonable number is anywhere between 50 ms and 250 ms. To inject the dye, you can either flip the switch on the picospritzer itself, or you can use a TTL pulse from the computer.
Fluorescence noteTo turn on the fluorescent light for imaging, you must turn on several items: the fluorescence lamp, the power for the shutter box, and the shutter. Be careful to read the warnings printed on the items’ labels. Try to minimize the length of time the oocyte is exposed to the fluorescent light by closing the shutter (switch on shutter box) when not imaging. The fluorescent light causes toxic free radicals to be released in the oocyte, which is detrimental to its health.
Using the camera(Note: this section likely to change)
To view the oocyte through the camera, switch the light path in the microscope by twisting the black knob to the right of the eyepieces 180º.
Double-click on “IPLab Spectrum IO P” icon.
Pull down the control menu. Select PVCam Basic Acquire. You should see this display:
24
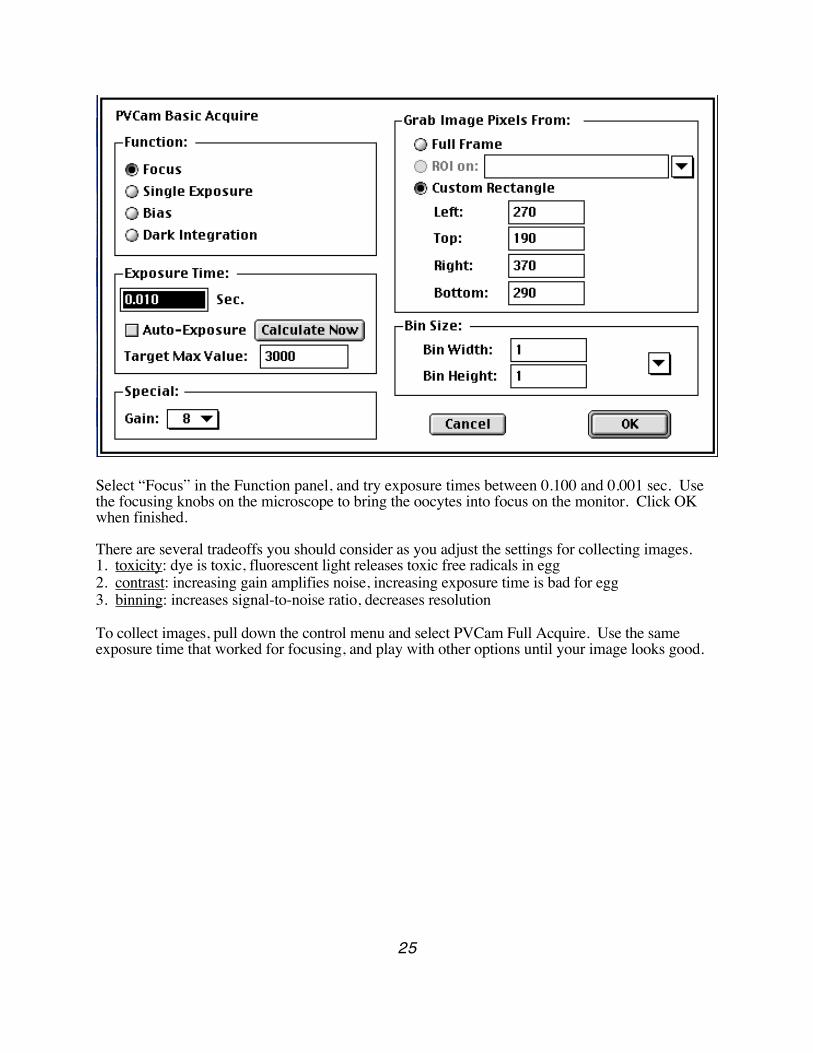
Select “Focus” in the Function panel, and try exposure times between 0.100 and 0.001 sec. Use the focusing knobs on the microscope to bring the oocytes into focus on the monitor. Click OK when finished.
There are several tradeoffs you should consider as you adjust the settings for collecting images. 1. toxicity: dye is toxic, fluorescent light releases toxic free radicals in egg2. contrast: increasing gain amplifies noise, increasing exposure time is bad for egg3. binning: increases signal-to-noise ratio, decreases resolution
To collect images, pull down the control menu and select PVCam Full Acquire. Use the same exposure time that worked for focusing, and play with other options until your image looks good.
25
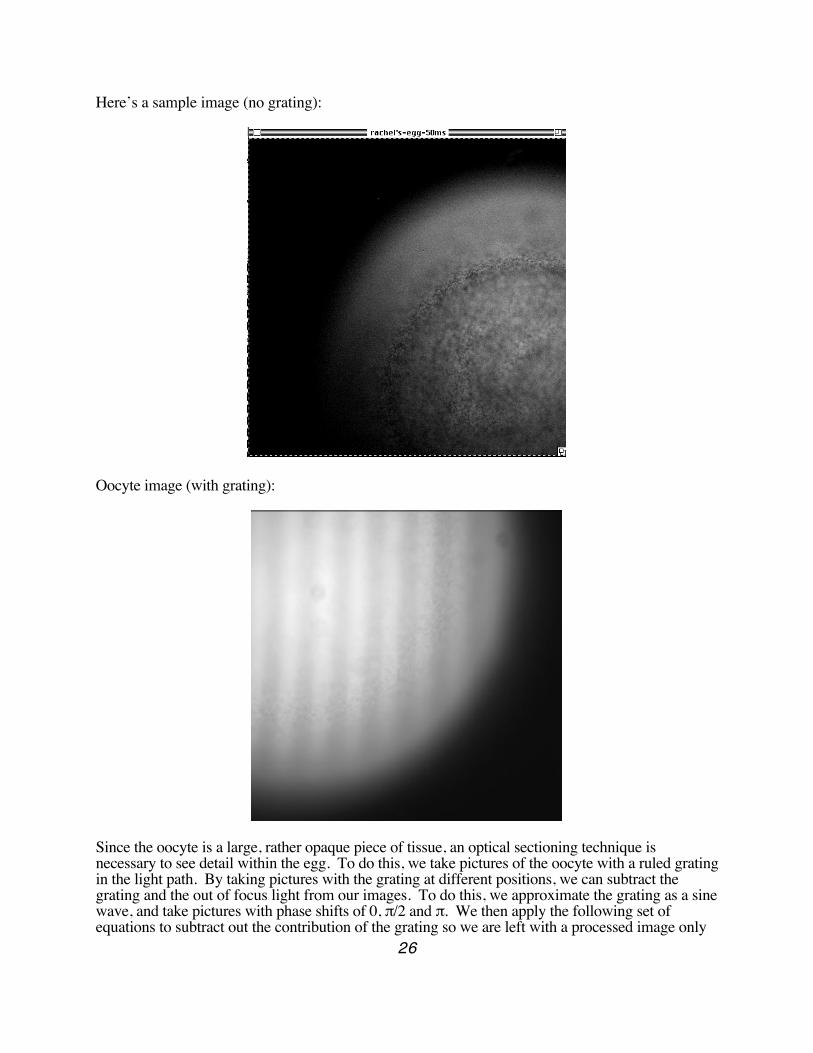
Here’s a sample image (no grating):
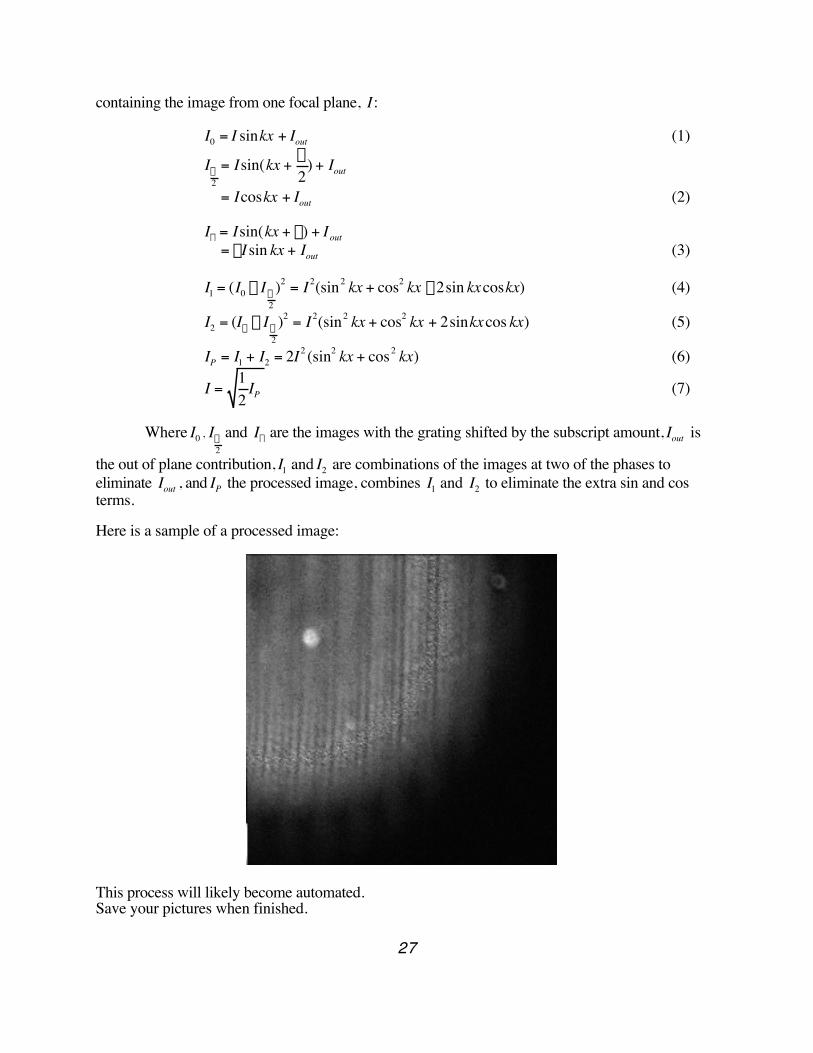
Oocyte image (with grating):
Since the oocyte is a large, rather opaque piece of tissue, an optical sectioning technique is necessary to see detail within the egg. To do this, we take pictures of the oocyte with a ruled grating in the light path. By taking pictures with the grating at different positions, we can subtract the grating and the out of focus light from our images. To do this, we approximate the grating as a sine wave, and take pictures with phase shifts of 0, π/2 and π. We then apply the following set of equations to subtract out the contribution of the grating so we are left with a processed image only
26
containing the image from one focal plane,
†
I:
†
I0 = I sinkx + Iout (1)
†
Ip2
= Isin(kx +p
2) + Iout
†
= Icoskx + Iout (2)
†
Ip = Isin(kx + p) + Iout
†
= -I sin kx + Iout (3)
†
I1 = (I0 - Ip2)2 = I2(sin2 kx + cos2 kx -2sin kxcoskx) (4)
†
I2 = (Ip - Ip2)2 = I2(sin2 kx + cos2 kx + 2sinkxcos kx) (5)
†
IP = I1 + I2 = 2I2 (sin2 kx + cos2 kx) (6)
†
I =12
IP (7)
Where
†
I0 ,
†
Ip2
and
†
Ip are the images with the grating shifted by the subscript amount,
†
Iout is
the out of plane contribution,
†
I1 and
†
I2 are combinations of the images at two of the phases to eliminate
†
Iout , and
†
IP the processed image, combines
†
I1 and
†
I2 to eliminate the extra sin and cos terms.
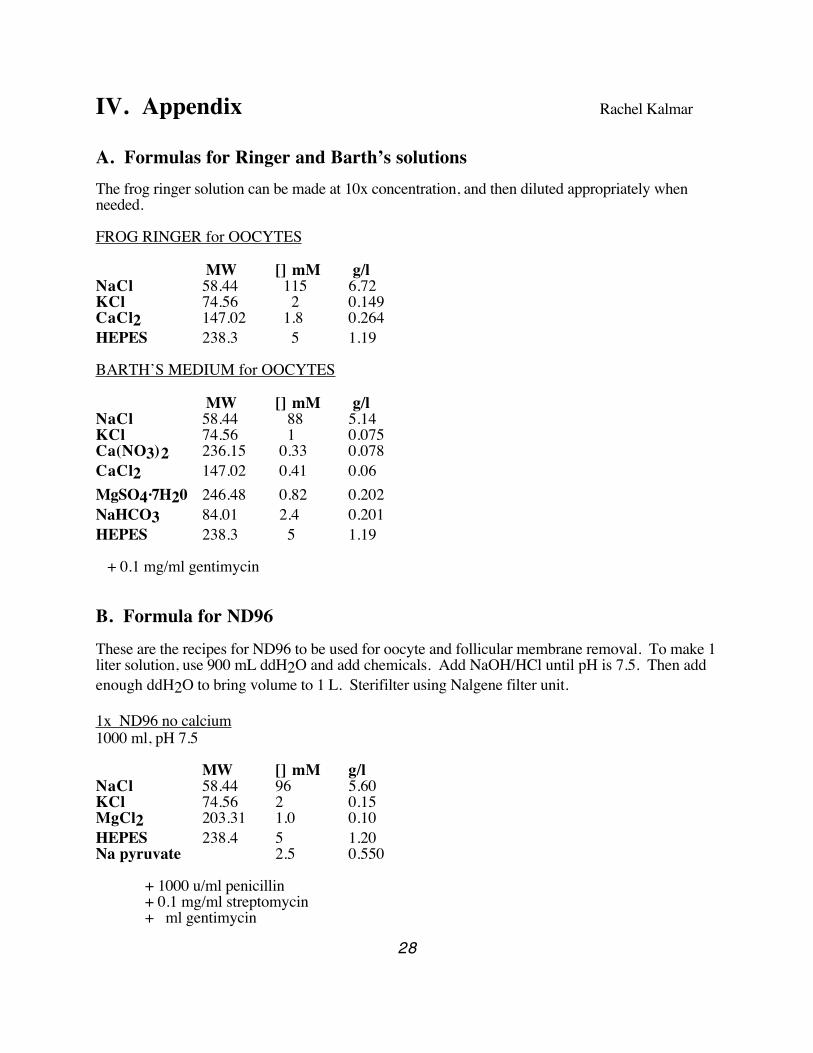
Here is a sample of a processed image:
This process will likely become automated.Save your pictures when finished.
27
IV. Appendix Rachel Kalmar
A. Formulas for Ringer and Barth’s solutionsThe frog ringer solution can be made at 10x concentration, and then diluted appropriately when needed.
FROG RINGER for OOCYTES
MW [] mM g/lNaCl 58.44 115 6.72KCl 74.56 2 0.149CaCl2 147.02 1.8 0.264HEPES 238.3 5 1.19
BARTH’S MEDIUM for OOCYTES
MW [] mM g/lNaCl 58.44 88 5.14KCl 74.56 1 0.075Ca(NO3)2 236.15 0.33 0.078CaCl2 147.02 0.41 0.06MgSO4.7H20 246.48 0.82 0.202NaHCO3 84.01 2.4 0.201HEPES 238.3 5 1.19
+ 0.1 mg/ml gentimycin
B. Formula for ND96These are the recipes for ND96 to be used for oocyte and follicular membrane removal. To make 1 liter solution, use 900 mL ddH2O and add chemicals. Add NaOH/HCl until pH is 7.5. Then add enough ddH2O to bring volume to 1 L. Sterifilter using Nalgene filter unit.
1x ND96 no calcium1000 ml, pH 7.5
MW [] mM g/lNaCl 58.44 96 5.60KCl 74.56 2 0.15MgCl2 203.31 1.0 0.10HEPES 238.4 5 1.20Na pyruvate 2.5 0.550
+ 1000 u/ml penicillin+ 0.1 mg/ml streptomycin+ ml gentimycin
28
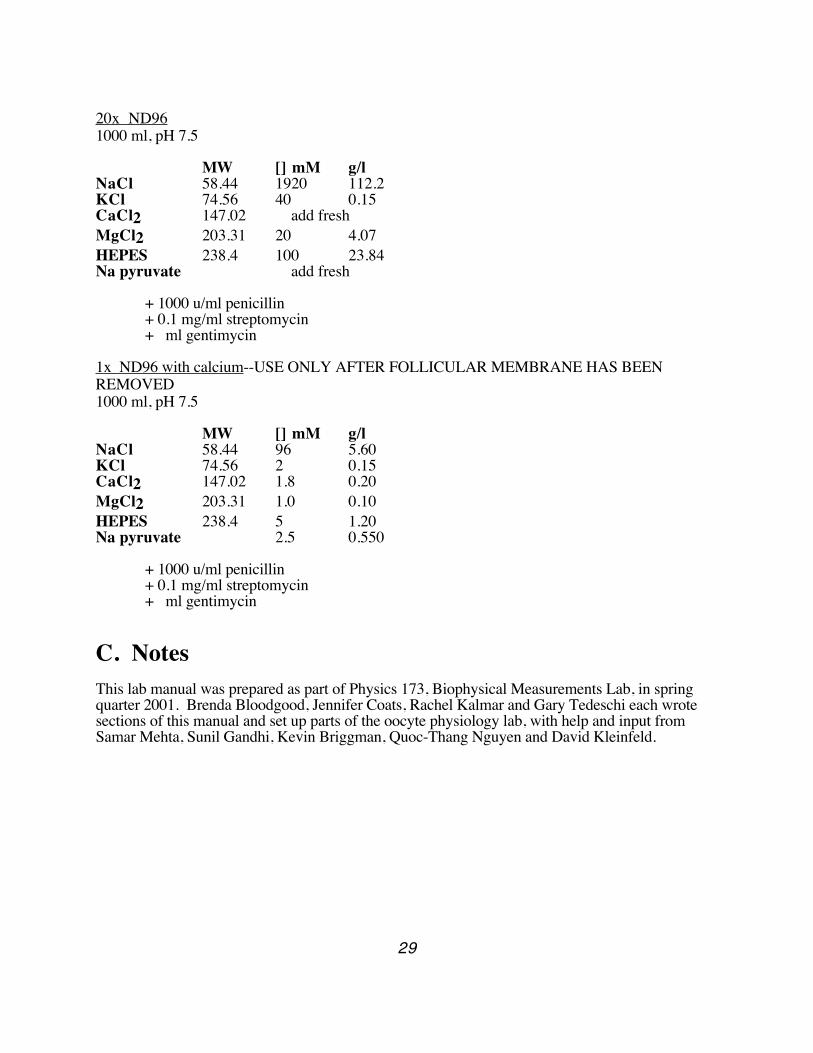
20x ND961000 ml, pH 7.5
MW [] mM g/lNaCl 58.44 1920 112.2KCl 74.56 40 0.15CaCl2 147.02 add freshMgCl2 203.31 20 4.07HEPES 238.4 100 23.84Na pyruvate add fresh
+ 1000 u/ml penicillin+ 0.1 mg/ml streptomycin+ ml gentimycin
1x ND96 with calcium--USE ONLY AFTER FOLLICULAR MEMBRANE HAS BEEN REMOVED1000 ml, pH 7.5
MW [] mM g/lNaCl 58.44 96 5.60KCl 74.56 2 0.15CaCl2 147.02 1.8 0.20MgCl2 203.31 1.0 0.10HEPES 238.4 5 1.20Na pyruvate 2.5 0.550
+ 1000 u/ml penicillin+ 0.1 mg/ml streptomycin+ ml gentimycin
C. NotesThis lab manual was prepared as part of Physics 173, Biophysical Measurements Lab, in spring quarter 2001. Brenda Bloodgood, Jennifer Coats, Rachel Kalmar and Gary Tedeschi each wrote sections of this manual and set up parts of the oocyte physiology lab, with help and input from Samar Mehta, Sunil Gandhi, Kevin Briggman, Quoc-Thang Nguyen and David Kleinfeld.
29