kriging and cokriging for spatial interpolation of ... · pdf filekriging and cokriging for...
TRANSCRIPT
Kriging and cokriging for spatial interpolation of rainfall in Espirito Santo State, Brazil
Alexson de Mello Cunha1,Gerson Rodrigues dos Santos2, Eliana de Sou-za1;Filipe Silveira Trindade3; Elpídio Inácio Fernandes Filho2; João Luiz Lani2; Michelle Milanez França1
1 Postgraduate Course on Soils and Plant Nutrition, Soils Department, Viçosa Federal Uni-versity.CEP 36570-000. Viçosa (MG). 2
[email protected], [email protected], [email protected], [email protected], [email protected], [email protected], [email protected]
University Viçosa Federal University, CEP 36570-000. Viçosa (MG).
Abstract
Kriging has become a widely used method for spatial distribution of hydro-climatic variables. The aim of this work was to evaluate the simple kriging and co-kriging on the spatial distribution of rainfall in Espírito Santo state, Brazil. Datamodel elevation and distance from the sea, obtained from sampling points in regu-lar and irregular grids were used as covariates in co-kriging. Also, we used aver-age annual rainfall of 108 rain gauge stations geographically distributed in the state. The evaluation of methods and variables was based on cross-validation, considering the errors of the predicted values, adjusting the first degree linear regression model of the observed values as a function of the estimated values and the coefficient of determination. In general, the regular grid sampling of the co-variates showed a slight trend toward better prediction accuracy compared to the irregular grid. Also, co-kriging provided more accurate results than kriging,which was verified by the average absolute errors, ranging from 7.066% to 7.924%, and by the root mean squared errors, varying from 109.6 mmand 120.4 mm. The results suggest that, wherenever possible, it is better to use co-kriging and regular grids for sampling.
Keywords: elevation, coastline, geostatistic, spatial prediction
1. Introduction
The rainfall is considered a useful variable in many fields other than agriculture, such as ecology, forestry, health and diseases, and other civil engineering (Chap-man and Thornes, 2003). However, these applications usually require data available on a continuous space (Hu, 2010). Often, rainfall data are obtained from specific collection points, which determines the use of spatial interpolation methods for their Mapping, among which we highlight the geostatistical interpolation and in-verse distance squared (Mello et al. 2003, Carvalho and Assad, 2005, Viola et al., 2010).
Kriging is a geostatistical method of univariate interpolation that has been wide-ly used because of its efficiency in the interpolation of rainfall data (Tabios and Salas, 1985). The multivariate extension of kriging, called co-kriging is used when
97
there is spatial correlation between the variable cross primary and secondary varia-bles (Vieira, 2000).The usefulness of co-kriging is often enhanced by the fact that the primary variable of interest is subsampled (Isaaks and Srivastava, 1989). In this respect, co-kriging has proven more interesting than kriging, due to the low density of rain gauge stations in the existing areas of interest, especially in mountainous areas of difficult construction and maintenance of equipment (Hu, 2010).
The method of cokriging, for purposes of spatial rainfall has usually involved topographic variables (Goovaerts, 2000; Hu, 2010). Among these variables, the elevation has been most widely used and studies have shown improvements in accuracy of prediction of rainfall using it as covariate (Hevese et al., 1992; Diodato and Cecarelli, 2005; Viola et al., 2010). However, as suggested by Goovaerts (2000), other environmental descriptors should be investigated, which may explain a large proportion of the spatial variability shown by rainfall.
The objectives of this study were to evaluate the method of simple kriging and co-kriging in the spatial distribution of annual precipitation in Espirito Santo State; evaluate the performance of spatial prediction by using different covariables and their sampling scheme with random points in a regular and irregular grids.
2. Methodology
The Espirito Santo State is located in southeastern of Brazil. Its area is approxi-mately 46,098.571 km2
Analysis of outliers was performed using boxplot graphs in the software Minitab 14. As mentioned by Junior Diggle and Ribeiro Junior (2000), the data should be inspected for possible outliers before any variogram is calculated. Then after the identification of rainfall outliers, it was removed from the dataset of the annual period and calculated the parameters of basic descriptive statistics.For co-kriging we used the elevation and the distance from the coast as secondary variables. These covariates were obtained for 3014 randomly sampled points in regular grid, with spacing of 5x 5 kilometer , and irregular grid, with a minimum distance of 1kilometer among the points. The distance from the coast was calculat-ed as the minimum distance of each point relative to the coast. The data of rainfall, elevation and distance from the Sea were analyzed by Pearson's correlation.
and has a great climatic diversity. The series of rainfall data used in this study were obtained from the hydrological information system HIDROWEB (ANA, 2011) and from the Capixaba Institute of Research (Tech-nical Assistance and Rural Extension - Incaper). In the total we used 108 rain gauge stations and it was considered 25 years of data, a recurrence period 1976 to 2006. The flaws in the monthly series presented in some rain gauge stations were filled by the method of weighted regional (Bertoni and Tucci, 2007). The con-sistency of the data series from Incaper and the filling of gaps were done using the method of double mass (Bertoni and Tucci, 2007).
The verification of anisotropy of the rainfall data was performed using the R (R DEVELOPMENT CORE TEAM, 2011), using the package GeoR (Ribeiro Juniorand Diggle, 2001), by experimental semivariograms in the directions of 0 º, 45 º, 90 º and 135 º. For the remainder procedures we used the package Geostatistical Ana-lyst software Arcgis 10.0. (ESRI, 2011), which were carried out trend analyzes, adjusting of semivariogram and cross-validation. The rainfall showed trend, but hisneed for removal was not confirmed by the results of cross-validation studies. We used simple kriging (SK) and cokriging (CK), without prior removal of trend and respectively with the exponential and Gaussian models, which best fit to the semivariograms. The average value of the precipitation, which must be known and
98
constant for performing simple kriging, was calculated from the data set used in the interpolation. There were two co-krigings using only one covariate, ie, cokriging rainfall x elevation (CKE) and co-kriging precipitation x distance from the Sea(CKD). We also evaluated the co-kriging with three sets of data, a primary (precipi-tation) and two secondary, represented by elevation and distance from the Sea (CKED). The model parameters were adjusted automatically focusing on the results of cross-validation. The map of kriging standard error, referred to as the standard deviation of the prediction for any individual point, was obtained in order to inform the correct interpolated values in the area of interest.
The interpolations were assessed by cross-validation, which the value found foreach sampled point is temporarily removed and an estimate is calculated for the remainder sampled points, using adjacent sampling points by an interpolation method. We fitted the linear regression model of observed values on e based on theestimated values, considering the values ����1�� �0 and R2 (Isaaks and Srivastava, 1989). The values obtained for the mean absolute error (MAE) were also used as a percentage, and root mean square error (RMSE), which are defined by equations 1 and 2:
���(%) = �� |��()��()|�()�
1. 100� . 1� (1)
���� = �� ���(��) � �(��)�� � �� (2)
Where z(si) is the average of observed precipitation, z(si) the number of predict-ed values and n the number of rain gauge station.
3. Preliminary results
The elevation data and distance from the Sea showed significant correlations (p <0.01) but weak (0.251) and moderate (-0.361), respectively, with annual precipita-tion. These results indicate that these variables can be useful in secondary analyzes of the spatial distribution of this primary variable in the study area. Distance from the Sea resulted in a higher correlation with the precipitation and hence to assist in the best potential for interpolation by using multivariate methods.
The directional semivariograms of rainfall showed different behaviors of the spatial continuity in the regions closer to the threshold. Based on these behavior displayed, which indicated no marked anisotropy for the primary outcome, geostatistic analysis was performed assuming an isotropic distribution.
The condition of isotropy for the precipitation data were then taken for both the construction of the semivariogram and for the cross-covariograms as directional analyzes carried out also in package ArcGis10.0 the Geostatistical Analyst.The semivariogram model and cross covariogram that best fits the rainfall data were exponential. The total variance of annual precipitation data was 36,176.26 mm, being close to the value found for the plateau (Figure 1).The CKE and CKED co-krigings produced the lowest values of RMSE (Table 2). The coefficients of determination were similar for kriging and co-kriging, but ������ �����0 �����1
In the evaluation of regular and irregular grids for the variables it was found that regular showed generally slight tendency towards greater efficiency in spatial pre-
showed over all best fit to the data in co-kriging.
99
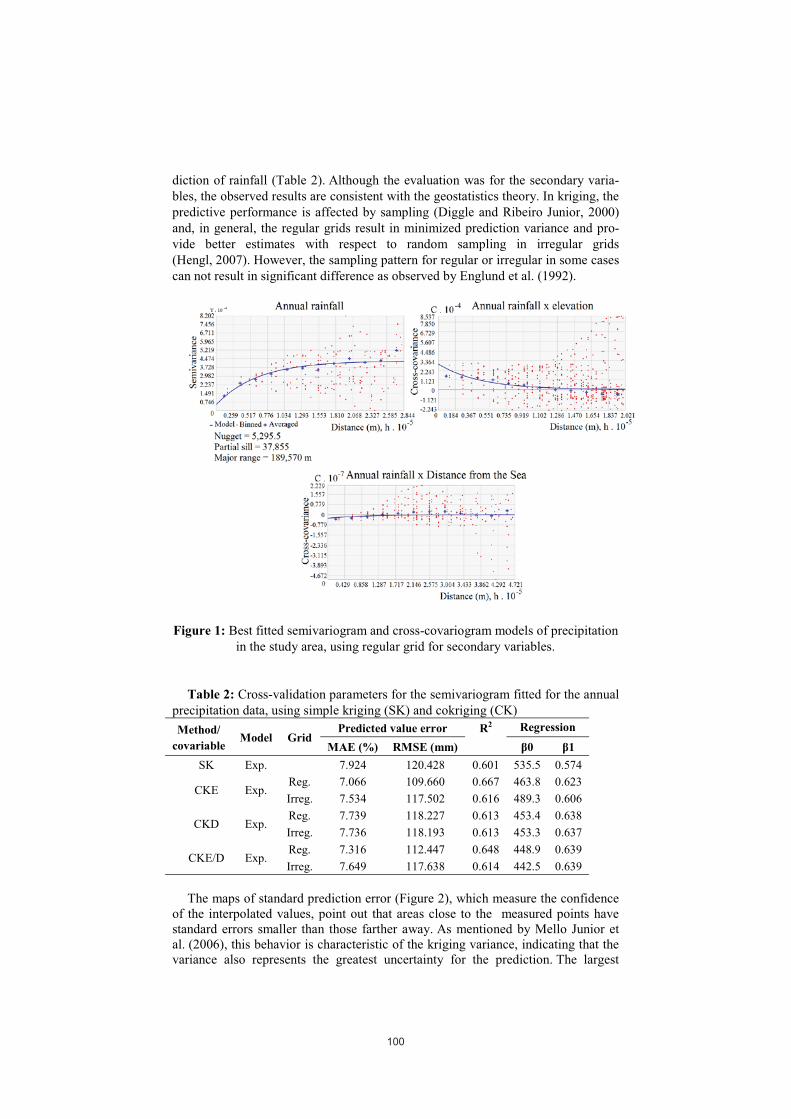
diction of rainfall (Table 2). Although the evaluation was for the secondary varia-bles, the observed results are consistent with the geostatistics theory. In kriging, the predictive performance is affected by sampling (Diggle and Ribeiro Junior, 2000) and, in general, the regular grids result in minimized prediction variance and pro-vide better estimates with respect to random sampling in irregular grids (Hengl, 2007). However, the sampling pattern for regular or irregular in some cases can not result in significant difference as observed by Englund et al. (1992).
Figure 1: Best fitted semivariogram and cross-covariogram models of precipitationin the study area, using regular grid for secondary variables.
Table 2: Cross-validation parameters for the semivariogram fitted for the annual precipitation data, using simple kriging (SK) and cokriging (Method/
CK)
covariableModel Grid
Predicted value error R Regression 2
MAE (%) RMSE (mm) �� ��SK Exp. 7.924 120.428 0.601 535.5 0.574
CKE Exp.Reg. 7.066 109.660 0.667 463.8 0.623Irreg. 7.534 117.502 0.616 489.3 0.606
CKD Exp.Reg. 7.739 118.227 0.613 453.4 0.638Irreg. 7.736 118.193 0.613 453.3 0.637
CKE/D Exp.Reg. 7.316 112.447 0.648 448.9 0.639Irreg. 7.649 117.638 0.614 442.5 0.639
The maps of standard prediction error (Figure 2), which measure the confidence
of the interpolated values, point out that areas close to the measured points have standard errors smaller than those farther away. As mentioned by Mello Junior et al. (2006), this behavior is characteristic of the kriging variance, indicating that the variance also represents the greatest uncertainty for the prediction. The largest
100
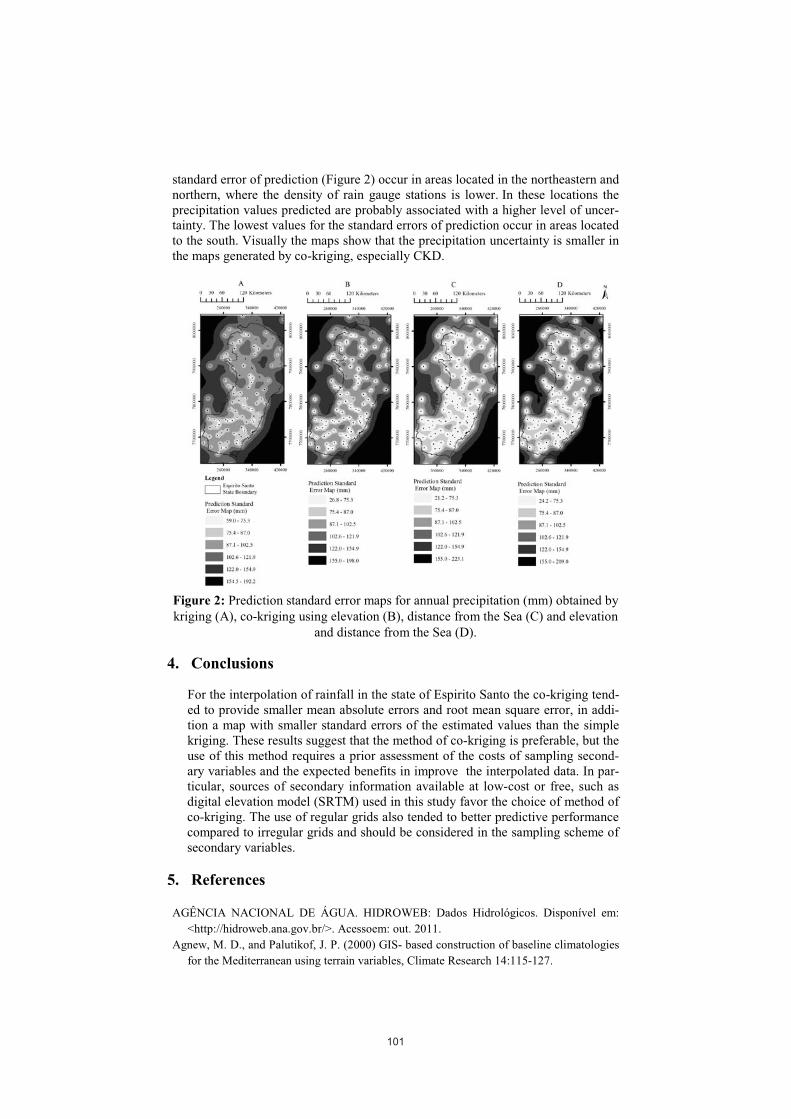
standard error of prediction (Figure 2) occur in areas located in the northeastern and northern, where the density of rain gauge stations is lower. In these locations the precipitation values predicted are probably associated with a higher level of uncer-tainty. The lowest values for the standard errors of prediction occur in areas located to the south. Visually the maps show that the precipitation uncertainty is smaller in the maps generated by co-kriging, especially CKD.
Figure 2: Prediction standard error maps for annual precipitation (mm) obtained by kriging (A), co-kriging using elevation (B), distance from the Sea (C) and elevation
and distance from the Sea (D).
4. Conclusions
For the interpolation of rainfall in the state of Espirito Santo the co-kriging tend-ed to provide smaller mean absolute errors and root mean square error, in addi-tion a map with smaller standard errors of the estimated values than the simple kriging. These results suggest that the method of co-kriging is preferable, but the use of this method requires a prior assessment of the costs of sampling second-ary variables and the expected benefits in improve the interpolated data. In par-ticular, sources of secondary information available at low-cost or free, such as digital elevation model (SRTM) used in this study favor the choice of method ofco-kriging. The use of regular grids also tended to better predictive performancecompared to irregular grids and should be considered in the sampling scheme ofsecondary variables.
5. References
AGÊNCIA NACIONAL DE ÁGUA. HIDROWEB: Dados Hidrológicos. Disponível em: <http://hidroweb.ana.gov.br/>. Acessoem: out. 2011.
Agnew, M. D., and Palutikof, J. P. (2000) GIS- based construction of baseline climatologies for the Mediterranean using terrain variables, Climate Research 14:115-127.
101
Bertoni J.C.; Tucci, C.E.M. (2007) Precipitação. In: Tucci, C.E.M. Hidrologia: Ciência e aplicação. Porto Alegre: UFRGS, p.177-241.
Camargo, E.;Fucks, S.; Câmara, G. (2004) Análise Espacial de Superfícies. In: Suzana Fucks; Marilia Sã Carvalho; Gilberto Cämara; Antônio Miguel Monteiro. (Org.). Análise Espacial de Dados Geográficos. Brasília: EMBRAPA, 1:79-122.
Carvalho, J.R.P.; Assad, E.D. (2005) Análise espacial da precipitação pluviométrica no Estado de São Paulo. Eng. Agríc.,Jaboticabal, 25:377-384.
Chapman, L.; Thornes, J.E. (2003) The use of geographical information systems in climatol-ogy and meteorology. Progress in Physical Geography 27: 313-330.
Diggle, P. J.; Ribeiro Júnior, P. J. Model-basedgeostatistics. In: SIMPÓSIO NACIONAL DE PROBABILIDADE E ESTATÍSTICA, 14., 2000, Caxambu. AnaisCaxambu: SINAPE, 2000. 192 p.
Diodato, N., Ceccarelli,
Englund, E., Weber, D., Leviant, N., (1992)The effects of sampling design parameters on block selection. Mathematical Geology 24:329–343.
M. (2005) Processes using multivariate geostatistics for mapping interpolation of climatolgical precipitation mean in the Sannio Mountains (Southern Italy) Earth Surface Processes and Landforms 30: 259-268.
ESRI, 2011.ArcGIS 10.0.Environmental Systems Research Institute, Redlands, CA, USA. http://www.esri.com
Goovaerts, P., (2000) Geostatistical Approaches for Incorporating Elevation Into the Spatial Interpolation of Rainfall. Journal of Hydrology 228:113-129.
Hengl, T., (2007)A Practical Guide to Geostatistical Mapping of Environmental Variables. EUR 22904 EN Scientific and Technical Research series, Office for Official Publications of the European Communities, Luxemburg.
Isaaks, E.H.; Srivastava, R.M. (1989) An introduction to applied geostatistics. New York: Oxford Universit, 561p.
Johansson, B., and Chen,D. (2003) The influence of wind and topography on precipitation distribution in Sweden: Statistical analysis and modeling, International Journal of Clima-tology 23, 1523- 1535.
Melo Júnior, J.C.F. de; Sediyama, G.C.; Ferreira, P.A.; Leal, B.G.; Minusi, R.B. (2006) Distribuição espacial da freqüência de chuvas na região hidrográfica do Atlântico, Leste de Minas Gerais. RevistaBrasileira de EngenhariaAgrícola e Ambiental, 10:417–425.
R DEVELOPMENT CORE TEAM (2008). R: A languageandenvironment for statistical-computing. Vienna, 2008. Disponível em: <http://www.R-project.org>
Ribeiro Júnior, P. J.;Diggle, P. P. GeoR: A package for geoestatisticalanalysis. R – News, v.21, n.2, p.15-18, 2001.
Tabios, G.Q., Salas, J.D. (1985) A comparative analysis of techniques for spatial interpola-tion of precipitation.Water Resources Bulletin, 21:365-380.
Vieira, D.B.; Lombardi Neto, F.; Santos, R.P. (1994) Análise das intensidades máximas de chuva em Pindorama (SP). Revista Brasileira de Ciência do Solo, 18:255-260.
Vieira, S. R. (2000) Geoestatística em estudos de variabilidade espacial do solo: Tópicos em ciência do solo. Viçosa: SociedadeBrasileira de Ciência do Solo, p.1-54.
Viola, M.R.; Mello, C.R.; Pinto, D. B.F.; Mello, J.M.; Ávila, L.F.. (2010) Métodos de inter-polação espacial para o mapeamento da precipitação pluvial. RevistaBrasileira de EngenhariaAgrícola e Ambiental, 14:970-978.
Yamada, K., (1990) Estimation of monthly precipitation by geographical factors and mete-orological variables, Hydrology in Mountainous Regions, I – Hydrological Measure-ments; the Water Cycle, 405-412.
102