knowledge capital and venture capital investments: new evidence from european panel data
TRANSCRIPT

Knowledge Capital and VentureCapital Investments:New Evidence from EuropeanPanel Data
Andrea SchertlerUniversity of Kiel, Chair of Finance
Abstract. Countries with a high amount of knowledge capital are likely to havehigher volumes of venture capital (VC) investments because more researchers comeup with innovative business ideas that require venture capital finance. Using paneldata techniques, the paper finds evidence that VC investments depend strongly onthe countries’ knowledge capital measured by the number of patents, or the numberof R&D researchers, or gross domestic expenditures on R&D. In addition, the paperanalyzes whether government-financed knowledge capital fulfills a special rolefor VC investments. It finds only weak evidence that VC investments depend, with adelay of several years, on government-financed knowledge capital.
JEL classification: G24, G32.
Keywords: VC investments; knowledge capital; Western Europe; panel data.
1. INTRODUCTION
The impact of venture capital finance on knowledge creation has beendiscussed in many recent papers (see, e.g., Engel, 2003; Kortum and Lerner,2000; Mull, 1990). According to these papers, venture capital (VC) invest-ments flow into young high-technology firms that create new knowledge inthe form of patents and highly qualified employees. Thus, VC investmentscan cause knowledge creation. This is, however, not the only possible causalrelationship between venture capital finance and knowledge capital.
There are arguments for a reverse causality between venture capital financeand knowledge capital on a countrywide basis. Government-financed andbusiness-financed knowledge capital may affect VC investments positivelybecause highly qualified employees or patent owners are likely to start upfirms and require venture capital finance for their start-ups. Venture capital
German Economic Review 8(1): 64–88
r Verein fur Socialpolitik and Blackwell Publishing Ltd. 2007, 9600 Garsington Road, Oxford OX4 2DQ, UKand 350 Main Street, Malden, MA 02148, USA.

finance is interesting for those particular start-ups whose profitability can beincreased by venture capitalists’ supporting services and whose risks requiremonitoring mechanisms not embodied in standard credit and equity finance.Thus, demand for venture capital comes only from particular firms, such asyoung, innovative, high-technology firms. Compared with business-financedknowledge capital, government-financed knowledge capital may play aspecial role because government-financed basic research may lower theresearch costs of potential entrepreneurs. As a result, business-financed aswell as government-financed knowledge capital is likely to be an importantprecondition for a vibrant venture capital industry.
The key question that I study in this paper is whether countries with highknowledge capital show higher volumes of VC investments than countrieswith low knowledge capital. To answer this question, I use a panel dataset of15 European countries over the years 1991–2001. This panel dataset allowstesting whether previous years’ knowledge capital has a significant impact onthe volume of today’s VC investments. I find evidence that my measures oftotal knowledge capital, which is the sum of government-financed andbusiness-financed knowledge capital, have strong explanatory power for VCinvestments. This result is robust with regard to various measures ofknowledge capital, such as the number of patent applications, the numberof R&D researchers or gross expenditures on R&D. In addition, I find weakevidence that my measures of government-financed knowledge capital affectVC investments positively with a delay of several years.
This reverse causality, i.e. the impact of previous years’ government- andbusiness-financed knowledge capital on VC investments, has not beenaddressed in depth in the recent literature. Using a country panel dataset,Da Rin et al. (2005) have not found a significant link between governmentR&D expenditures and the ratio of VC investments in either high-technologyindustries or firms’ early stage of development to total VC investments. Forfirms listed on the Neuer Markt, Audretsch and Lehmann (2004) have notfound a significant link between the number of patents a firm holds andventure capital backing. By contrast, using a US state-level panel dataset,Gompers and Lerner (1999) have found evidence that the volume and thenumber of VC investments depend positively on the logarithm of previousyears’ real industrial R&D expenditures per capita, and, in addition, thevolume of investments depends positively on the logarithm of previous years’real academic R&D expenditures per capita.
This paper also relates to the papers by Jeng and Wells (2000) and Leleuxand Surlemont (2003), who have analyzed determinants of VC investments.1
Jeng and Wells (2000) have found evidence that the market value of initialpublic offerings has a significantly positive impact, while labor market
1. In addition, there is a growing body of literature that analyzes the impact of VC investmentson labor market performance (see, e.g., Belke et al., 2005; Fehn and Fuchs, 2004; Wasmer andWeil, 2000).
Knowledge Capital and Venture Capital Investments
r Verein fur Socialpolitik and Blackwell Publishing Ltd. 2007 65
rigidities have a significantly negative impact on VC investments. Leleuxand Surlemont (2003) have analyzed whether funds offered by publicauthorities seed the industry or whether they crowd out private funds. Theirresults support neither the seeding nor the crowding-out hypothesis. Jengand Wells (2000) and Leleux and Surlemont (2003) have, however, not takeninto account the impact of the countries’ knowledge capital on VCinvestments.
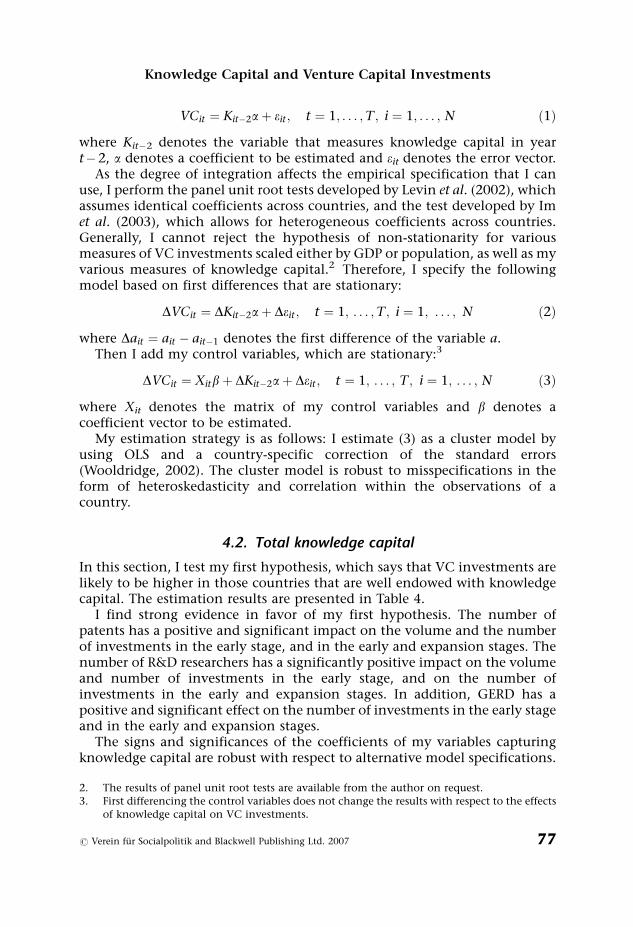
The remainder of the paper is organized as follows. In Section 2, I discussthe theoretical background for the empirical analysis. In Section 3, I describethe panel dataset, offer descriptive statistics on VC investments andknowledge capital for European countries and introduce control variablesused in the empirical analysis. In Section 4, I present estimation results on therole of total knowledge capital and government-financed knowledge capitalfor VC investments. In Section 5, I summarize the main findings of theempirical analysis.
2. THEORETICAL BACKGROUND
This paper tests two hypotheses related to the influence of knowledge capitalon the size of VC investments. My first hypothesis deals with the totalknowledge capital available in a country, which is financed by the privatesector and by governments. My second hypothesis deals with the part ofknowledge capital available in a country that is only government-financed.
Countries with a high amount of total knowledge capital are likely togenerate more business start-ups in high-technology industries thancountries with a low amount of knowledge capital. This is because thefounder of a high-technology start-up must be highly skilled and because thefounders need employees who are highly skilled, as well. Financial sources ofhigh-technology start-ups are limited. Family members and friends, impor-tant financial sources for start-ups, cannot fulfill the high capital needs ofhigh-technology start-ups. Banks cannot fulfill the high capital needs becausestart-ups in high-technology industries are likely to have low amounts ofcollateral necessary to obtain bank credits. Start-ups in high-technologyindustries have low amounts of collateral because they invest in intangibleassets more often. As Holmstrom and Tirole (1997) argue, monitoring is apartial substitute for collateral in order to mitigate incentive problems.Monitoring of start-ups in high-technology industries, however, must be ofhigh quality because start-ups in high-technology industries do not havetrack records. It may also require specific high-technology skills not commonto bank managers. In summary, the financial means of family members andfriends are limited and banks do not have the control mechanisms at theirdisposal that are necessary to mitigate adverse selection and moral hazardproblems of start-ups in high-technology industries.
A. Schertler
66 r Verein fur Socialpolitik and Blackwell Publishing Ltd. 2007

At this point, the specific role of venture capital finance, which results in apositive correlation between venture capital finance and the profitability offirms (see, e.g., Brav and Gompers, 1997; Engel, 2002; Engel and Keilbach,2002; Hellmann and Puri, 2000; Megginson and Weiss, 1991), comes intoplay. Venture capitalists are active, informed financial intermediaries. Theydo not only offer capital in the form of equity, but they actively selectpromising firms out of a large number of firms seeking finance. Using aSilicon Valley sample of firms, Hellmann and Puri (2000) have documentedthat innovator firms are more likely to be venture-capital-backed thanimitator firms. The number of innovator firms in a country is, ceteris paribus,higher in countries with high knowledge capital. This evidence and theevidence presented by Engel (2003) for Germany highlight the importance ofthe active selection process in venture capital finance.
Besides the active selection, venture capitalists are actively involved inmonitoring and supporting firms they have chosen to finance (Sahlman,1990). In the United States, lead venture capitalists, who support firms whenseveral venture capitalists invest money, spend on an average two hours perweek in firms when these firms are in their early stage of development(Gorman and Sahlman, 1989). These services are important because foundersof start-ups in high-technology industries are well qualified in their field ofexpertise, but they are likely lacking skills for the commercialization ofproduction. Thus, there is a double moral hazard problem between foundersand venture capitalists as firms’ success does not depend only on the effort ofthe entrepreneur, but also on the effort of the venture capitalist inmonitoring and supporting the firms (see, e.g., Casamatta, 2003; Lulfesmann,2000; Repullo and Suarez, 2004; Schmidt, 2003).
In summary, my first hypothesis is that the countries’ total knowledgecapital, which is the sum of business- and government-financed knowledgecapital, affects the size of VC investments positively.
My second hypothesis deals with the part of knowledge capital that hasbeen financed by governments. According to the theoretical model byKeuschnigg (2003), government-financed knowledge capital, such as basicresearch, is likely to play a special role in the size of VC invest-ments. Keuschnigg (2003) argues that the probability of researchers comingup with innovative business ideas increases with governments’ basic research.In his model, governments are interested in investing in basic researchbecause basic research is a public good. More specifically, governments’basic research in areas that lead to commercial applications reduces privatestart-up efforts, as it lowers the research costs of potential entrepreneurs.Thus, countries with a high amount of government-financed knowledgecapital are likely to generate more business ideas in high-technologyindustries than countries with a low amount of government-financedknowledge capital.
Therefore, my second hypothesis is that government-financed knowledgecapital affects the size of VC investments positively.
Knowledge Capital and Venture Capital Investments
r Verein fur Socialpolitik and Blackwell Publishing Ltd. 2007 67

3. DATA
3.1. Venture capital and knowledge capital
VC investments for 15 Western European countries are available from theEuropean Venture Capital Association (EVCA) on an annual basis. As EVCA’stotal investments, which are often called private equity investments, alsocomprise management buy-out and buy-in activities, VC investments mustbe approximated. For this, I use investments in firms’ early stage (seed andstart-up stages) in which the initial business concept is formed, prototypes ofnew products are developed and an initial marketing campaign is launched.Compared with other stages of development, such as the expansion stage, theearly stage is a very risky one. In addition to investments in the early stage, Iuse investments in firms’ early and expansion stages. In the expansion stage,firms require large amounts of external funding because the cash flow oftendoes not yet generate enough liquidity for the internal financing of the firms’growth. Because European countries differ in size, I scale investment volumesby gross domestic product (GDP). Table 1 gives a description of the variablesand data sources.
Apart from using investment volumes, I follow Gompers and Lerner (1999)and use the investment numbers scaled by population. Using the investmentnumbers is of particular interest, as high investment volumes, which mayindicate a well-developed venture capital industry, can be the result of a fewlarge investments, so that only a few firms are venture-capital-backed. Thus,the size of the venture capital industries may be overestimated when usingsolely investment volumes.
I check the robustness of the relationship between total knowledge capitaland VC investments by using VC investments in firms operating in theinformation and communications (IT) industry and VC investments in firmsoperating in the biotechnology and medical (BIO) industry. This allows me touse an industry-specific measure of knowledge capital, such as patentapplications in the IT industry and in the BIO industry.
Table 2 presents the mean values and standard deviations of investments inthe early stage, the early and expansion stages and all stages. It showssubstantial differences in investments in the early stage across Europeancountries averaged over the years 1991–2001. Investments in the early stagein Belgium, Finland and the Netherlands were higher than 0.03 per cent ofGDP. In contrast, investments in the early stage in Austria were as low as0.006 per cent of GDP.
Differences in investments in the early stage, in the early and expansionstages and in all private equity stages across countries were also substantial. Inthe United Kingdom, for example, investments in all stages accounted forabout 0.41 per cent of GDP. However, investments in the early stageaccounted for only 0.02 per cent of GDP, and investments in the early andexpansion stages for about 0.1 per cent of GDP. In the United Kingdom,
A. Schertler
68 r Verein fur Socialpolitik and Blackwell Publishing Ltd. 2007

Ta
ble
1D
ata
def
init
ion
san
dso
urc
es
Vari
ab
les
Des
crip
tio
nSo
urc
e
VC
inves
tmen
tsEarl
y-st
age
inve
stm
ents
:G
over
nm
ent-
an
dp
rivate
sect
or-
fun
ded
VC
inves
tmen
tsin
the
earl
yst
age
of
firm
s’d
evel
op
men
t(v
olu
mes
inp
erce
nt
of
GD
P,n
um
ber
sin
per
cen
to
fp
op
ula
tio
n)
Earl
y-and
expansi
on-s
tage
inve
stm
ents
:G
over
nm
ent-
an
dp
rivate
sect
or-
fun
ded
VC
inves
tmen
tsin
the
earl
yan
dex
pan
sio
nst
age
of
firm
s’d
evel
op
men
t(v
olu
mes
inp
erce
nt
of
GD
P,n
um
ber
sin
per
cen
to
fp
op
ula
tio
n)
ITin
vest
men
ts:
VC
inves
tmen
tsin
firm
so
per
ati
ng
inth
ein
form
ati
on
an
dco
mm
un
icati
on
sin
du
stry
(vo
lum
esin
per
cen
to
fG
DP,
nu
mb
ers
inp
erce
nt
of
po
pu
lati
on
)B
IOin
vest
men
ts:
VC
inves
tmen
tsin
firm
so
per
ati
ng
inth
eb
iote
chn
olo
gy
an
dm
edic
al
ind
ust
ry(v
olu
mes
inp
erce
nt
of
GD
P,n
um
ber
sin
per
cen
to
fp
op
ula
tio
n)
EV
CA
(vari
ou
sis
sues
)
Kn
ow
led
ge
cap
ital
Num
ber
ofpate
nt
appli
cati
ons
(per
cen
to
fp
op
ula
tio
n).
Th
ese
ries
nu
mb
erfo
rap
pli
cati
on
sb
yth
eEu
rop
ean
Pate
nt
Off
ice
(EPO
)is
65a.
Th
ese
ries
nu
mb
erfo
rap
pli
cati
on
sb
yth
eU
SPate
nt
Off
ice
is65b
.T
he
seri
esn
um
ber
of
the
nu
mb
ero
fp
ate
nt
ap
pli
cati
on
sto
the
EPO
inth
eIC
Tse
cto
r(p
rio
rity
yea
r)is
67.
Th
ese
ries
nu
mb
erfo
rth
en
um
ber
of
pate
nt
ap
pli
cati
on
sto
the
EPO
inth
eb
iote
chn
olo
gy
sect
or
(pri
ori
tyyea
r)is
68
Num
ber
ofR
&D
rese
arc
her
s(p
erce
nt
of
po
pu
lati
on
).C
alc
ula
ted
fro
mgo
ver
nm
ent-
fin
an
ced
R&
Dre
searc
her
s,an
db
usi
nes
sen
terp
rise
rese
arc
her
s.T
he
seri
esn
um
ber
of
go
ver
nm
ent-
fin
an
ced
R&
Dre
searc
her
sis
56.
Th
ese
ries
nu
mb
ero
fb
usi
nes
sen
terp
rise
rese
arc
her
sis
27
Main
scie
nce
an
dte
chn
olo
gy
stati
stic
s(O
EC
D,
2003)
Knowledge Capital and Venture Capital Investments
r Verein fur Socialpolitik and Blackwell Publishing Ltd. 2007 69

GER
D:
Gro
ssd
om
esti
cex
pen
dit
ure
so
nR
&D
as
ap
erce
nta
ge
of
GD
P.C
alc
ula
ted
fro
mth
ego
ver
nm
ent-
fin
an
ced
an
dth
eb
usi
nes
s-fi
nan
ced
GER
D.
Th
ese
ries
nu
mb
ero
fgo
ver
nm
ent-
fin
an
ced
GER
Dis
12.
Th
ese
ries
nu
mb
ero
fb
usi
nes
s-fi
nan
ced
GER
Dis
11
Gro
wth
inn
ewfu
nd
sra
ised
Gro
wth
rate
of
new
fun
ds
rais
edfo
rp
rivate
inves
tmen
tsEV
CA
(vari
ou
sis
sues
)
Go
ver
nm
ent
VC
fun
din
gN
ewfu
nd
sp
rovid
edb
ygo
ver
nm
ents
as
ap
erce
nta
ge
of
tota
ln
ewfu
nd
sra
ised
for
pri
vate
equ
ity
inves
tmen
tsEV
CA
(vari
ou
sis
sues
)
Pen
sio
nfu
nd
sN
ewfu
nd
sp
rovid
edb
yp
ensi
on
fun
ds
as
ap
erce
nta
ge
of
tota
ln
ewfu
nd
sra
ised
for
pri
vate
equ
ity
inves
tmen
tsEV
CA
(vari
ou
sis
sues
)
Em
plo
ym
ent
pro
tect
ion
ind
exM
easu
res
the
lab
or
mark
etri
gid
ity
thro
ugh
stri
ctn
ess
of
pro
tect
ion
again
std
ism
issa
lso
fre
gu
lar
an
dte
mp
ora
ryem
plo
ym
ent.
Tw
ovalu
esare
avail
ab
leo
ver
the
ob
serv
ati
on
per
iod
:o
ne
des
crib
esth
est
rict
nes
sin
the
late
1980s,
wh
ile
the
oth
erd
escr
ibes
the
stri
ctn
ess
inth
ela
te1990s.
Th
evalu
eo
fth
ela
te1980s
isu
sed
for
the
yea
rs1991–9
3,
wh
ile
the
valu
eo
fth
ela
te1990s
isu
sed
for
the
yea
rs1994–2
001
OEC
D(1
999,
Tab
le2.5
)
Cap
ital
gain
sta
xra
teW
orl
dw
ide
corp
ora
teta
xgu
ide
(vari
ou
sis
sues
)Len
din
gra
teIF
SC
D-R
OM
(IM
F,2003)
Gro
wth
rate
of
GD
PO
EC
DSt
ati
stic
al
Com
pen
diu
m(2
004)
Sto
ckm
ark
etre
turn
sA
nn
ual
retu
rns
on
sto
ckm
ark
ets
for
fast
-gro
win
gfi
rms
calc
ula
ted
fro
md
ail
ysh
are
ind
ices
Data
stre
am
Not
e:T
he
foll
ow
ing
cou
ntr
ies
are
incl
ud
edin
the
regre
ssio
nan
aly
sis:
Au
stri
a,
Bel
giu
m,
Den
mar
k,
Fin
lan
d,
Fra
nce
,G
erm
an
y,Ir
elan
d,
Italy
,N
eth
erla
nd
s,N
orw
ay,
Po
rtu
gal,
Spain
,Sw
eden
,Sw
itze
rlan
dan
dth
eU
nit
edK
ingd
om
.
A. Schertler
70 r Verein fur Socialpolitik and Blackwell Publishing Ltd. 2007

Ta
ble
2V
Cin
ves
tmen
tsin
Eu
rop
e
Earl
y-s
tage
inves
tmen
ts
Earl
y-
an
dex
pan
sio
n-s
tage
inves
tmen
tsIT
inves
tmen
tsB
IOin
ves
tmen
tsPri
vate
equ
ity
inves
tmen
ts
Vo
lum
eN
um
ber
Vo
lum
eN
um
ber
Vo
lum
eN
um
ber
Vo
lum
eN
um
ber
Vo
lum
eN
um
ber
Au
stri
aM
ean
0.5
80
0.0
38
1.6
76
0.0
67
0.7
04
0.0
30
0.1
62
0.0
10
2.1
00
0.0
70
Stan
dard
dev
iati
on
0.9
54
0.0
48
2.5
54
0.0
84
1.2
26
0.0
45
0.2
46
0.0
14
2.9
35
0.0
88
Bel
giu
mM
ean
3.2
82
0.0
96
9.5
03
0.2
06
4.3
77
0.0
92
1.1
81
0.0
21
11.1
30
0.2
27
Stan
dard
dev
iati
on
3.6
95
0.0
89
7.2
90
0.1
35
4.7
18
0.0
92
1.0
88
0.0
14
8.0
28
0.1
39
Den
mark
Mea
n1.3
66
0.0
71
3.9
14
0.1
47
1.7
81
0.0
60
1.1
94
0.0
43
5.1
11
0.1
67
Stan
dard
dev
iati
on
2.4
71
0.0
88
4.9
73
0.1
42
2.7
35
0.0
80
2.0
97
0.0
62
6.2
75
0.1
68
Fin
lan
dM
ean
3.4
13
0.2
22
7.1
96
0.3
56
3.3
89
0.1
43
1.5
32
0.0
76
10.2
81
0.4
06
Stan
dard
dev
iati
on
3.9
06
0.2
06
6.0
78
0.2
52
3.7
04
0.1
38
1.7
29
0.0
64
9.6
09
0.2
82
Fra
nce
Mea
n1.8
67
0.0
73
7.0
64
0.2
28
3.6
94
0.0
95
0.9
68
0.0
31
14.0
39
0.3
15
Stan
dard
dev
iati
on
2.4
96
0.0
66
5.3
90
0.0
83
4.8
64
0.0
61
0.6
13
0.0
07
9.3
10
0.0
91
Ger
man
yM
ean
2.2
35
0.0
72
6.7
43
0.1
47
2.2
96
0.0
47
1.2
06
0.0
21
9.2
60
0.1
59
Stan
dard
dev
iati
on
2.7
47
0.0
59
5.5
63
0.0
96
2.7
90
0.0
44
1.5
10
0.0
23
7.5
36
0.0
99
Irel
an
dM
ean
2.2
80
0.0
92
7.4
19
0.2
33
4.5
14
0.1
35
0.4
20
0.0
12
8.7
71
0.2
57
Stan
dard
dev
iati
on
3.1
85
0.1
00
4.9
58
0.1
52
5.6
04
0.1
45
0.3
54
0.0
08
5.1
11
0.1
61
Italy M
ean
1.2
16
0.0
20
4.6
23
0.0
40
1.3
87
0.0
11
0.0
79
0.0
02
9.2
41
0.0
51
Stan
dard
dev
iati
on
1.2
94
0.0
16
3.3
83
0.0
25
3.0
91
0.0
17
0.2
14
0.0
01
7.3
53
0.0
26
Knowledge Capital and Venture Capital Investments
r Verein fur Socialpolitik and Blackwell Publishing Ltd. 2007 71

Net
her
lan
ds
Mea
n3.7
45
0.0
94
14.8
05
0.2
61
5.8
94
0.1
06
1.2
52
0.0
27
23.9
40
0.3
35
Stan
dard
dev
iati
on
3.0
97
0.0
49
9.1
02
0.0
91
5.0
73
0.0
64
0.7
15
0.0
11
15.4
49
0.1
25
No
rway
Mea
n1.4
46
0.0
99
8.5
03
0.3
30
4.3
44
0.1
48
0.5
07
0.0
39
9.8
46
0.3
63
Stan
dard
dev
iati
on
1.7
28
0.0
80
4.3
02
0.1
43
4.3
15
0.1
03
0.6
07
0.0
27
5.2
81
0.1
44
Po
rtu
gal
Mea
n1.0
53
0.0
27
6.1
37
0.0
95
1.3
59
0.0
15
0.4
15
0.0
03
8.4
31
0.1
11
Stan
dard
dev
iati
on
0.6
44
0.0
17
2.4
00
0.0
30
1.8
64
0.0
13
1.0
71
0.0
02
3.3
61
0.0
33
Spain
Mea
n1.0
15
0.0
21
5.6
08
0.0
61
1.2
23
0.0
11
0.4
50
0.0
03
7.5
90
0.0
66
Stan
dard
dev
iati
on
0.9
09
0.0
10
3.9
87
0.0
17
1.6
62
0.0
11
0.7
64
0.0
01
6.0
24
0.0
18
Swed
enM
ean
2.8
13
0.1
42
9.3
20
0.2
55
4.7
75
0.1
25
2.4
78
0.0
52
26.7
08
0.2
94
Stan
dard
dev
iati
on
4.3
67
0.2
08
11.6
06
0.3
09
6.4
88
0.1
65
3.3
60
0.0
70
32.7
87
0.3
34
Swit
zerl
an
dM
ean
1.5
16
0.0
51
4.0
38
0.1
19
1.8
02
0.0
59
0.7
13
0.0
18
7.2
24
0.1
46
Stan
dard
dev
iati
on
2.4
67
0.0
63
4.2
11
0.1
07
1.9
42
0.0
63
0.8
49
0.0
20
7.1
81
0.1
15
Un
ited
Kin
gd
om
Mea
n2.1
53
0.0
46
12.8
84
0.2
10
7.2
79
0.0
81
3.4
28
0.0
38
41.4
58
0.3
38
Stan
dard
dev
iati
on
3.1
28
0.0
41
9.6
19
0.0
47
6.0
37
0.0
47
3.3
48
0.0
11
23.7
06
0.0
40
Not
e:T
his
tab
lere
po
rts
des
crip
tive
stati
stic
sfo
rEu
rop
ean
cou
ntr
ies
(1991–2
001).
Vo
lum
esare
as
ap
erce
nta
ge
ofG
DP,
mu
ltip
lied
by
100.N
um
ber
sare
as
ap
erce
nta
ge
of
po
pu
lati
on
,m
ult
ipli
edb
y100.
IT(B
IO)
inves
tmen
tsare
inves
tmen
tsin
ven
ture
-cap
ital
-back
edfi
rms
op
erati
ng
inth
ein
form
ati
on
an
dco
mm
un
icati
on
s(b
iote
chn
olo
gy
an
dm
edic
al)
ind
ust
ry.
A. Schertler
72 r Verein fur Socialpolitik and Blackwell Publishing Ltd. 2007

private equity was most often used to finance management buy-out deals. InFinland, by contrast, investments in all stages accounted for about 0.1 percent of GDP, while investments in the early stage accounted for 0.03 per cent,and investments in the early and expansion stages accounted for 0.07 percent of GDP. Thus, compared with the situation in the United Kingdom,private equity was substantially less often used to finance management buy-out deals.
Table 2 also informs on the importance of private equity investments inthe IT and BIO industries. According to industry investment volumes andnumbers, IT firms received more than three times as much private equity asBIO firms.
For the countries’ total knowledge capital, I use either the number ofpatent applications to the European or the US Patent Office scaled bypopulation, or the number of R&D researchers scaled by population, or thegross domestic expenditures on R&D scaled by GDP (GERD). For thecountries’ government-financed knowledge capital, I use either the govern-ment-financed number of R&D researchers scaled by population, or thegovernment-financed GERD scaled by GDP. Table 3 offers the mean valuesand standard deviations for the variables measuring knowledge capital. Itindicates that the countries also differ with respect to the knowledge capitalavailable in the countries.
Before I analyze whether the countries’ knowledge capital helps inexplaining VC investments, I discuss in the following the variables for whichI control in the empirical analysis.
3.2. Control variables
Recent theoretical and empirical literature has argued that VC investmentsdepend on the volume of new funds raised for private equity and venturecapital deals, new funds provided by governments and pension funds,developments in stock markets for fast-growing firms, labor market regula-tions and taxation of capital gains. In particular, a boost in new funds raisedmay lead to higher investments in later stages and to lower investments inthe early stage (Gompers, 1998). This is because firms in the early stagecannot employ as much capital as firms in later stages, and becausemonitoring capacities of venture capitalists cannot be increased in the shortrun (Keuschnigg, 2003). In order to control for changes in the conditions ofnew funds raised, I use the growth rate in new funds raised for private equityinvestments.
New funds provided by governments may have a positive impact on thesize of the venture capital industry in the case of positive externalities(Gebhardt and Schmidt, 2002; Lerner, 2002a), while they may have a negativeimpact in the case of adverse incentives on deal selection (EuropeanCommission, 2000; Keuschnigg and Nielsen, 2001; Murray and Marriot,1998). I take the role of governments into account by using the share of new
Knowledge Capital and Venture Capital Investments
r Verein fur Socialpolitik and Blackwell Publishing Ltd. 2007 73

Ta
ble
3K
no
wle
dge
cap
ital
inEu
rop
e Pate
nts
R&
Dre
searc
her
sG
ER
D
US
off
ice
Eu
rop
ean
off
ice
ITB
IOTo
tal
Go
ver
nm
ent-
fin
an
ced
To
tal
Go
ver
nm
ent-
fin
an
ced
Au
stri
aM
ean
0.0
061
0.0
105
0.0
016
0.0
004
0.3
023
0.0
106
1.4
509
0.7
191
Stan
dard
dev
iati
on
0.0
011
0.0
026
0.0
007
0.0
001
0.0
631
0.0
012
0.0
474
0.0
373
Bel
giu
mM
ean
0.0
064
0.0
093
0.0
019
0.0
007
0.3
965
0.0
125
1.6
441
0.4
386
Stan
dard
dev
iati
on
0.0
009
0.0
023
0.0
007
0.0
003
0.0
736
0.0
040
0.1
147
0.0
373
Den
mark
Mea
n0.0
080
0.0
114
0.0
021
0.0
014
0.5
053
0.0
648
1.7
273
0.6
782
Stan
dard
dev
iati
on
0.0
017
0.0
036
0.0
013
0.0
004
0.0
914
0.0
076
0.2
427
0.0
243
Fin
lan
dM
ean
0.0
139
0.0
176
0.0
086
0.0
005
0.6
398
0.0
762
2.5
132
0.8
541
Stan
dard
dev
iati
on
0.0
035
0.0
067
0.0
049
0.0
001
0.2
269
0.0
098
0.5
070
0.0
384
Fra
nce
Mea
n0.0
064
0.0
100
0.0
027
0.0
004
0.4
083
0.0
439
2.0
655
0.9
327
Stan
dard
dev
iati
on
0.0
007
0.0
016
0.0
007
0.0
001
0.0
226
0.0
027
0.0
776
0.1
171
Ger
man
yM
ean
0.0
123
0.0
195
0.0
042
0.0
005
0.5
338
0.0
453
2.3
073
0.8
336
Stan
dard
dev
iati
on
0.0
022
0.0
050
0.0
017
0.0
003
0.0
297
0.0
016
0.1
030
0.0
406
Irel
an
dM
ean
0.0
034
0.0
036
0.0
012
0.0
002
0.2
820
0.0
096
1.0
720
0.2
850
Stan
dard
dev
iati
on
0.0
014
0.0
016
0.0
008
0.0
001
0.0
779
0.0
036
0.1
266
0.0
272
Italy M
ean
0.0
028
0.0
051
0.0
008
0.0
001
0.1
570
0.0
236
1.0
400
0.5
550
Stan
dard
dev
iati
on
0.0
004
0.0
012
0.0
002
0.0
000
0.0
049
0.0
007
0.0
921
0.0
378
A. Schertler
74 r Verein fur Socialpolitik and Blackwell Publishing Ltd. 2007

Net
her
lan
ds
Mea
n0.0
079
0.0
144
0.0
059
0.0
007
0.3
509
0.0
476
1.7
482
0.8
136
Stan
dard
dev
iati
on
0.0
011
0.0
050
0.0
033
0.0
003
0.0
633
0.0
042
0.0
792
0.1
044
No
rway
Mea
n0.0
052
0.0
061
0.0
014
0.0
003
0.4
775
0.0
674
1.5
432
0.7
414
Stan
dard
dev
iati
on
0.0
011
0.0
017
0.0
006
0.0
001
0.0
622
0.0
027
0.0
455
0.0
672
Po
rtu
gal
Mea
n0.0
001
0.0
002
0.0
000
0.0
000
0.0
389
0.0
278
0.5
743
0.4
243
Stan
dard
dev
iati
on
0.0
000
0.0
001
0.0
000
0.0
000
0.0
139
0.0
067
0.1
179
0.0
739
Spain
Mea
n0.0
006
0.0
013
0.0
002
0.0
000
0.1
164
0.0
245
0.7
809
0.3
836
Stan
dard
dev
iati
on
0.0
001
0.0
005
0.0
001
0.0
000
0.0
257
0.0
050
0.0
413
0.0
378
Swed
enM
ean
0.0
160
0.0
188
0.0
058
0.0
006
0.6
948
0.0
266
3.2
314
0.9
441
Stan
dard
dev
iati
on
0.0
038
0.0
053
0.0
027
0.0
002
0.1
046
0.0
030
0.3
759
0.0
519
Swit
zerl
an
dM
ean
0.0
186
0.0
288
0.0
056
0.0
009
0.6
685
0.0
073
2.4
700
0.6
922
Stan
dard
dev
iati
on
0.0
013
0.0
056
0.0
021
0.0
003
0.0
363
0.0
012
0.0
517
0.0
510
Un
ited
Kin
gd
om
Mea
n0.0
062
0.0
075
0.0
023
0.0
005
0.4
021
0.0
238
1.5
527
0.6
050
Stan
dard
dev
iati
on
0.0
008
0.0
015
0.0
008
0.0
002
0.0
153
0.0
027
0.1
357
0.0
673
Not
e:T
his
tab
lere
po
rts
des
crip
tive
stati
stic
sfo
rEu
rop
ean
cou
ntr
ies
(1991–2
001).
ITd
eno
tes
the
info
rmati
on
an
dco
mm
un
icati
on
sin
du
stry
.B
IOd
eno
tes
the
bio
tech
no
logy
an
dm
edic
al
ind
ust
ry.Pate
nts
an
dR
&D
rese
arch
ers
are
scale
db
yp
op
ula
tio
n.G
ER
Dis
the
gro
ssex
pen
dit
ure
so
nR
&D
as
ap
erce
nta
ge
of
GD
P.
Ta
ble
3C
on
tin
ued
Pate
nts
R&
Dre
searc
her
sG
ER
D
US
Off
ice
Eu
rop
ean
off
ice
ITB
IOTo
tal
Go
ver
nm
ent-
fin
an
ced
To
tal
Go
ver
nm
ent-
fin
an
ced
Knowledge Capital and Venture Capital Investments
r Verein fur Socialpolitik and Blackwell Publishing Ltd. 2007 75

funds provided by governments divided by total new funds for private equityinvestments.
I control for the role of pension funds whose change in regulation has hada significant effect on the development of the venture capital industry in theUnited States (Gompers and Lerner, 1999; Lerner, 2002b). I use new fundsprovided by pension funds relative to total new funds. This variable reflectstwo important aspects of pension funding. It reflects that the assets managedby pension funds in European countries differ in size (see OECD InstitutionalInvestor Database, 2003). Moreover, it reflects regulations concerning thepercentage of pension funds’ portfolios that can be invested in high-risk assetclasses. For example, in Spain, pension funds can invest up to 10 per cent oftheir portfolios in unquoted firms (Tejada, 2003a), while in Portugal, pensionfunds can invest 15 per cent of their portfolios in unquoted firms (Tejada,2003b).
Developments in stock markets for fast-growing firms are likely to affectthe size of VC investments positively (Bascha and Walz, 2001; Black andGilson, 1998; Gompers, 1996). In order to capture developments in stockmarkets for fast-growing firms, I create a variable for annual stock marketreturns calculated from daily return indices of Europe’s stock markets for fast-growing firms. For Germany, I use the share index of the Neuer Marktfounded in 1997. For France, I use the share index of the Nouveau Marchefounded in 1996. For Spain, I use the share index of the Nuevo Mercadofounded in 2000. For the United Kingdom, I use the share index of theAlternative Investment Market founded in 1995. For all other countries, I usethe share index of the EASDAQ founded in 1996.
In addition to stock market returns, I use a dummy variable that equals onein 1999 and 2000 and zero otherwise. This dummy variable captures theextraordinary development in stock markets for fast-growing firms at the endof the 1990s that might result from periodically overoptimistic investors andfrom firms using the opportunity to go public in times of higher stock prices(Ritter, 1991).
Moreover, I control for labor market regulations emphasized, for example,by Da Rin et al. (2005) by taking into account differences in employmentprotection, for the price for alternative finance by using lending rates, and forthe capital gains taxes emphasized, for example, by Gompers and Lerner(1999) and Poterba (1989).
4. EMPIRICAL ANALYSIS
4.1. Specification of the regression equation
In order to test whether the various measures of total knowledge capitalhave a significant impact on VC investments, I start from the followingspecification:
A. Schertler
76 r Verein fur Socialpolitik and Blackwell Publishing Ltd. 2007
VCit ¼ Kit�2aþ eit ; t ¼ 1; . . . ;T ; i ¼ 1; . . . ; N ð1Þ
where Kit�2 denotes the variable that measures knowledge capital in yeart�2, a denotes a coefficient to be estimated and eit denotes the error vector.
As the degree of integration affects the empirical specification that I canuse, I perform the panel unit root tests developed by Levin et al. (2002), whichassumes identical coefficients across countries, and the test developed by Imet al. (2003), which allows for heterogeneous coefficients across countries.Generally, I cannot reject the hypothesis of non-stationarity for variousmeasures of VC investments scaled either by GDP or population, as well as myvarious measures of knowledge capital.2 Therefore, I specify the followingmodel based on first differences that are stationary:
DVCit ¼ DKit�2aþ Deit ; t ¼ 1; . . . ;T ; i ¼ 1; . . . ; N ð2Þ
where Dait ¼ ait � ait�1 denotes the first difference of the variable a.Then I add my control variables, which are stationary:3
DVCit ¼ Xitbþ DKit�2aþ Deit ; t ¼ 1; . . . ; T ; i ¼ 1; . . . ; N ð3Þ
where Xit denotes the matrix of my control variables and b denotes acoefficient vector to be estimated.
My estimation strategy is as follows: I estimate (3) as a cluster model byusing OLS and a country-specific correction of the standard errors(Wooldridge, 2002). The cluster model is robust to misspecifications in theform of heteroskedasticity and correlation within the observations of acountry.
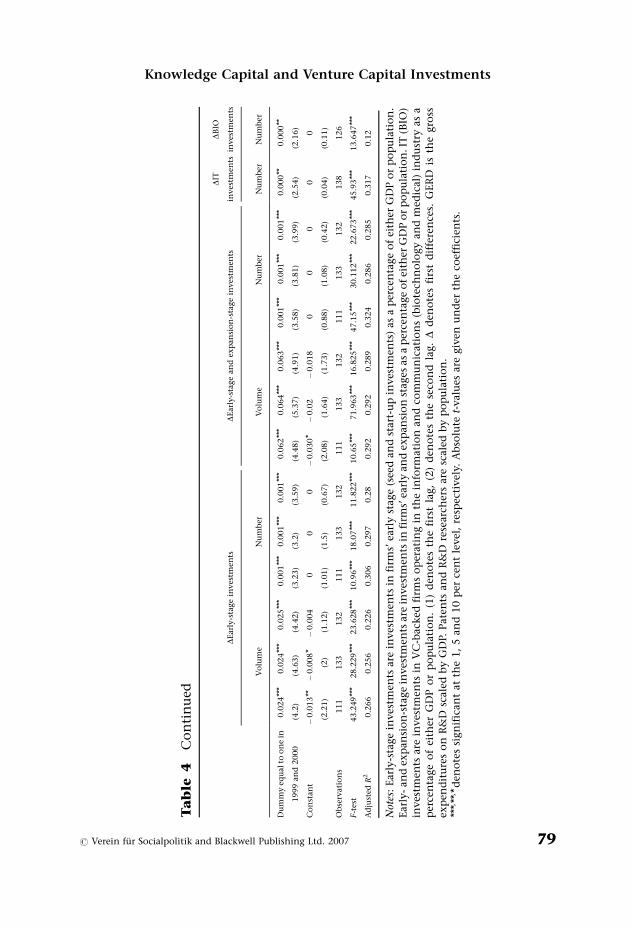
4.2. Total knowledge capital
In this section, I test my first hypothesis, which says that VC investments arelikely to be higher in those countries that are well endowed with knowledgecapital. The estimation results are presented in Table 4.
I find strong evidence in favor of my first hypothesis. The number ofpatents has a positive and significant impact on the volume and the numberof investments in the early stage, and in the early and expansion stages. Thenumber of R&D researchers has a significantly positive impact on the volumeand number of investments in the early stage, and on the number ofinvestments in the early and expansion stages. In addition, GERD has apositive and significant effect on the number of investments in the early stageand in the early and expansion stages.
The signs and significances of the coefficients of my variables capturingknowledge capital are robust with respect to alternative model specifications.
2. The results of panel unit root tests are available from the author on request.3. First differencing the control variables does not change the results with respect to the effects
of knowledge capital on VC investments.
Knowledge Capital and Venture Capital Investments
r Verein fur Socialpolitik and Blackwell Publishing Ltd. 2007 77

Ta
ble
4To
tal
kn
ow
led
ge
cap
ital
DEarl
y-s
tage
inves
tmen
tsD
Earl
y-s
tage
an
dex
pan
sio
n-s
tage
inves
tmen
ts
DIT
inves
tmen
ts
DB
IO
inves
tmen
ts
Vo
lum
eN
um
ber
Vo
lum
eN
um
ber
Nu
mb
erN
um
ber
DPate
nts
US
off
ice
(2)
9.8
73**
*0.3
68**
13.6
17**
0.5
35**
(3.3
4)
(2.7
5)
(2.5
5)
(2.8
4)
DR
&D
rese
arc
her
(2)
0.1
79**
*0.0
08**
0.0
81
0.0
08**
(3.2
5)
(2.9
1)
(0.5
6)
(2.9
1)
DG
ER
D(2
)0.0
24
0.0
02**
�0.0
37
0.0
03**
(1.2
5)
(2.1
6)
(1.0
2)
(2.3
2)
DIn
du
stry
pate
nts
(2)
0.2
65**
*0.6
05**
(3.8
1)
(2.1
7)
Gro
wth
rate
of
new
fun
ds
rais
ed(1
)
�0.0
77
�0.0
36
�0.0
39
�0.0
01
0�
0.0
01
�0.1
85*�
0.1
04
�0.0
86
�0.0
02
00
00.0
01
(1.6
7)
(1.3
)(1
.23)
(0.5
3)
(0.1
5)
(0.7
2)
(2.0
1)
(1.0
5)
(0.8
7)
(0.4
3)
(0.2
1)
(0.2
)(0
.1)
(0.9
8)
New
fun
ds
of
go
ver
nm
ents
(1)
�0.0
17
0.0
01
�0.0
03
00.0
00**
0�
0.0
42
�0.0
01
�0.0
06
00.0
01*
00
0.0
00*
(1.6
6)
(0.1
9)
(0.4
1)
(0.5
3)
(2.2
5)
(1.2
7)
(1.5
3)
(0.0
6)
(0.4
1)
(0.1
5)
(1.8
9)
(0.9
5)
(0.6
)(1
.83)
New
fun
ds
of
pen
sio
n
fun
ds
(1)
0.0
06
0.0
15
0.0
17
00.0
01**
0.0
01*
0.0
45
0.0
54
0.0
61
00.0
01
0.0
01
00
(0.2
9)
(1.0
6)
(1.2
5)
(0.6
)(2
.19)
(2.0
4)
(1.0
5)
(1.3
)(1
.5)
(0.2
9)
(1.1
9)
(1.1
2)
(1.7
1)
(0.1
9)
Em
plo
ym
ent
pro
tect
ion
ind
ex
�0.0
01
�0.0
01
00
00
0.0
01
0.0
02
0.0
03
00
00
0
(0.5
4)
(0.4
3)
(0.3
3)
(0.2
2)
(0.1
2)
(0)
(0.1
9)
(0.5
8)
(0.8
6)
(0.9
9)
(0.2
7)
(0.4
3)
(0.0
1)
(0.5
8)
Cap
ital
gain
sta
xra
te0
00
00
00
00
00
00
0
(1.1
3)
(0.3
7)
(0.5
3)
(1.5
9)
(1.5
2)
(1.1
9)
(0.4
6)
(1.4
3)
(1.0
4)
(0.5
)(0
.53)
(0.5
4)
(0.9
4)
(0.2
5)
Len
din
gra
te0.1
33
0.0
63
0.0
35
00.0
01
00.1
82
0.0
2�
0.0
08
0�
0.0
01
�0.0
02
00
(1.5
1)
(1.5
)(0
.87)
(0.0
1)
(0.6
1)
(0.2
2)
(0.7
7)
(0.1
4)
(0.0
7)
(0.1
2)
(0.7
5)
(1.2
4)
(0.2
3)
(0.1
1)
Gro
wth
rate
of
GD
P0.0
75**
0.0
15
0.0
15
0.0
03**
*0.0
01
0.0
01
0.0
6�
0.0
12
�0.0
03
0.0
03**
0.0
01
0.0
01
0.0
01
0
(2.7
8)
(1.0
2)
(0.9
8)
(3.2
2)
(1.2
3)
(0.7
5)
(1.2
5)
(0.4
3)
(0.0
8)
(2.5
6)
(1.1
7)
(0.9
)(0
.93)
(0.1
6)
Sto
ckm
ark
etre
turn
s0.0
28*
0.0
41**
0.0
42**
0.0
01
0.0
01**
0.0
01**
*0.0
63**
0.0
79**
*0.0
79**
*0.0
01
0.0
01**
0.0
02**
0.0
01*
0
(2.0
8)
(2.9
5)
(2.9
3)
(1.6
7)
(2.9
3)
(3.0
9)
(2.7
4)
(3.3
3)
(3.3
1)
(1.4
6)
(2.2
)(2
.3)
(2.0
3)
(0.4
1)
A. Schertler
78 r Verein fur Socialpolitik and Blackwell Publishing Ltd. 2007
Du
mm
yeq
ualto
on
ein
1999
an
d2000
0.0
24**
*0.0
24**
*0.0
25**
*0.0
01**
*0.0
01**
*0.0
01**
*0.0
62**
*0.0
64**
*0.0
63**
*0.0
01**
*0.0
01**
*0.0
01**
*0.0
00**
0.0
00**
(4.2
)(4
.63)
(4.4
2)
(3.2
3)
(3.2
)(3
.59)
(4.4
8)
(5.3
7)
(4.9
1)
(3.5
8)
(3.8
1)
(3.9
9)
(2.5
4)
(2.1
6)
Co
nst
an
t�
0.0
13**�
0.0
08*�
0.0
04
00
0�
0.0
30*�
0.0
2�
0.0
18
00
00
0
(2.2
1)
(2)
(1.1
2)
(1.0
1)
(1.5
)(0
.67)
(2.0
8)
(1.6
4)
(1.7
3)
(0.8
8)
(1.0
8)
(0.4
2)
(0.0
4)
(0.1
1)
Ob
serv
ati
on
s111
133
132
111
133
132
111
133
132
111
133
132
138
126
F-t
est
43.2
49**
*28.2
29**
*23.6
28
***
10.9
6**
*18.0
7**
*11.8
22
***
10.6
5**
*71.9
63
***
16.8
25**
*47.1
5**
*30.1
12
***
22.6
73**
*45.9
3**
*13.6
47**
*
Ad
just
edR
20.2
66
0.2
56
0.2
26
0.3
06
0.2
97
0.2
80.2
92
0.2
92
0.2
89
0.3
24
0.2
86
0.2
85
0.3
17
0.1
2
Not
es:
Ear
ly-s
tage
inves
tmen
tsare
inves
tmen
tsin
firm
s’ea
rly
stage
(see
dan
dst
art
-up
inves
tmen
ts)
as
ap
erce
nta
ge
of
eith
erG
DP
or
po
pu
lati
on
.Earl
y-an
dex
pan
sio
n-s
tage
inves
tmen
tsare
inves
tmen
tsin
firm
s’ea
rly
an
dex
pan
sio
nst
ages
as
ap
erce
nta
ge
ofei
ther
GD
Po
rp
op
ula
tio
n.IT
(BIO
)in
ves
tmen
tsare
inves
tmen
tsin
VC
-back
edfi
rms
op
erat
ing
inth
ein
form
ati
on
an
dco
mm
un
icat
ion
s(b
iote
chn
olo
gy
an
dm
edic
al)
ind
ust
ryas
ap
erce
nta
ge
of
eith
erG
DP
or
po
pu
lati
on
.(1
)d
eno
tes
the
firs
tla
g,
(2)
den
ote
sth
ese
con
dla
g.D
den
ote
sfi
rst
dif
fere
nce
s.G
ER
Dis
the
gro
ssex
pen
dit
ure
so
nR
&D
scale
db
yG
DP.
Pate
nts
an
dR
&D
rese
arch
ers
are
scale
dby
po
pu
lati
on
.**
*,**
, *d
eno
tes
sign
ific
an
tat
the
1,
5an
d10
per
cen
tle
vel
,re
spec
tivel
y.A
bso
lute
t-val
ues
are
giv
enu
nd
erth
eco
effi
cien
ts.
Ta
ble
4C
on
tin
ued
DEarl
y-s
tage
inves
tmen
tsD
Earl
y-s
tage
an
dex
pan
sio
n-s
tage
inves
tmen
ts
DIT
inves
tmen
ts
DB
IO
inves
tmen
ts
Vo
lum
eN
um
ber
Vo
lum
eN
um
ber
Nu
mb
erN
um
ber
Knowledge Capital and Venture Capital Investments
r Verein fur Socialpolitik and Blackwell Publishing Ltd. 2007 79

As a first robustness check, I estimate whether private equity investments inselected industries depend on the number of patent applications in theseindustries. The results of this exercise are also reported in Table 4. Theestimation results show that an increase in the number of patents in the ITindustry leads to an increase in the number of private equity investments inIT firms. Moreover, an increase in the number of patents in the BIO industryleads to an increase in the number of private equity investments in BIO firms.Thus, using a closer specification of knowledge capital for particularindustries leads to the same conclusion as the broader specification ofknowledge capital: the countries’ total knowledge capital explains the size ofVC investments.
As a second robustness check, I estimate my model for two sub-samples.In a first sub-sample, I exclude the United Kingdom, because the Britisheconomy is more market-based than the other European economiesconsidered here (Beck and Levine, 2002). In a second sub-sample, I excludelarge countries, i.e. France, Germany and the United Kingdom. The sizeof an economy may have implications for the knowledge capital coefficients,as large economies may be more efficient in realizing economies of scale.Venture capitalists operating in large economies may realize economies ofscale more often, as they may have more opportunities to syndicate theirinvestments and to concentrate their investment activity on particulartechnologies and stages of firms’ development. By focusing their invest-ment activity on particular stages and technologies, venture capitalists mayaccumulate more specific experience necessary for the successful selectionand monitoring of high-technology firms. Economies of scale may bereflected in lower coefficients of the variables capturing knowledge capital.Moreover, in the second half of the 1990s, the large countries in my samplehave developed comparatively liquid stock market segments for fast-growingfirms, while the small countries have failed to develop liquidity in thesemarkets (Bottazzi and Da Rin, 2002; Tejada, 2003a).
The robustness check reveals that neither excluding the UnitedKingdom nor the three largest countries from the sample changes myestimation results for VC investments substantially.4 When excluding theUnited Kingdom, I observe smaller coefficients of the variables capturingknowledge capital. The t-values are also lower. However, changes in the sizeand significance do not change the conclusion of my empirical analysis.When excluding the three largest countries, I observe in some specificationsan increase in the size of the coefficients and their significance. For example,GERD helps in explaining investments in the early stage when large countriesare excluded from the sample. Overall, however, there is a high degree ofsimilarity between the estimation results of the sub-samples and the fullsample.
4. The results of the robustness checks are available from the author on request.
A. Schertler
80 r Verein fur Socialpolitik and Blackwell Publishing Ltd. 2007

What about the signs and significance of the coefficients of my controlvariables? A boost in new funds raised has the expected negative andsignificant impact on the volume of investments in the early and expansionstages only in one specification. It does not affect investments in the earlystage.
New funds provided by governments have the expected positive andsignificant effect on the number of investments in the early stage in one outof three model specifications presented in Table 4 but they do not affect theinvestments volume in the early stage. In a related paper, Leleux andSurlemont (2003) have analyzed the impact of public authorities’ funding ofVC investments. They have found a positive and significant effect ofgovernment funding on the volume of VC investments. Thus, contrary tothe results by Leleux and Surlemont (2003), I do not find a significantrelationship between government funding and volumes of VC investments.The difference in the results may be caused by different model specifications:Leleux and Surlemont (2003) have used volumes of VC investments, while Iuse first differences because of their non-stationary behavior.
Funds provided by pension funds help in explaining the number ofinvestments in the early stage. New funds provided by pension funds have apositive and significant impact on the number of investments in the earlystage but not on investments in the early and expansion stages. This is in linewith the evidence presented in Schertler (2005): new funds provided bypension funds, as compared with funds provided by corporate investors, aremore often used for financing early-stage deals than later stage deals. Recentliterature has analyzed the role of pension funds by including the wealth ofpension funds in the regression analysis instead of the share of new fundsprovided by pension funds. Jeng and Wells (2000) have found evidence thatthe wealth of private pension funds is a significant determinant of venturecapital fundraising over time but not across countries. Schertler (2004) hasnot found a significant relationship between assets of pension funds and VCinvestments. As I mentioned before, assets of pension funds can be a poormeasure of pension funds activity in venture capital industries because thepension funds are allowed to invest different amounts of their assets inunquoted firms.
The stock market returns of fast-growing firms have a positive andsignificant impact on the volume and the number of investments in theearly stage, in the early and expansion stages and in IT. The higher the returnsare, the higher the increase in VC investments. This result is in line withprevious results. Using US data, Gompers and Lerner (1999) have documen-ted that the previous year’s equity market return has a positive effect on theinvestment number but not on the investment volume. Using a panel datasetsimilar to the one used here, Da Rin et al. (2005) have found that the ratio ofinvestments in the early stage to total private equity investments dependspositively on a dummy variable equal to one if a stock market for fast-growingfirms is available in a particular country.
Knowledge Capital and Venture Capital Investments
r Verein fur Socialpolitik and Blackwell Publishing Ltd. 2007 81

The growth rate of GDP helps in explaining the volume and the number ofinvestments in the early stage only when I use the number of patentapplications. Gompers and Lerner (1999) and Romain and van Pottelsberghe(2004) have documented a procyclical behavior of VC investments. Gompersand Lerner (1999) find that the growth of gross state products leads to anincrease in VC investments. In the paper by Romain and van Pottelsberghe(2004), which is based on a sample similar to the one used here, the growthrate of GDP is positive and significant in all model specifications, while I finda significantly positive impact only in some specifications. This may bebecause I use a first-difference approach, while Romain and van Pottelsberghe(2004) use VC investments in levels.
Other control variables included, i.e. the lending rate, the employmentprotection index and the capital gains tax rate, do not explain the variousmeasures of VC investments, except the dummy variable, which is equal toone for the years 1999 and 2000. The dummy variable has a positive andhighly significant coefficient. However, excluding this dummy variable doesnot substantially change the signs and significance of the other variables.5
4.3. Government-financed knowledge capital
In this section, I test my second hypothesis, which says that VC investmentsare likely to be higher in those countries that have high amounts ofgovernment-financed knowledge capital. In a first step, I follow Gompers andLerner (1999) and include both business-financed and government-financedknowledge capital, which is either GERD or R&D researchers. In a secondstep, I include only the government-financed knowledge capital. Theestimation results are presented in Table 5.
I find only weak evidence in favor of my second hypothesis. If I jointlyinclude business-financed and government-financed knowledge capital[columns (1)–(6) in Table 5], business-financed knowledge capital has apositive impact in most specifications, while government-financed knowl-edge capital has no significant impact on VC investments. More specifically,government-financed GERD and government-financed R&D researchers turnout to be insignificant for the investments in the early stage and in the earlyand expansion stages. Business-financed GERD affects the number ofinvestment in the early stage and in the early and expansion stagessignificantly positively, but it does not affect the volume of investments. Incontrast to this result, Romain and van Pottelsberghe (2004) have reportedpositive effects of business R&D expenditures on the volume of investmentsin the early stage. Their positive coefficients are likely to be the result of theunderlying positive trend in their data.
5. I also use year dummies for 1999 and 2000. The coefficients on these two dummies are mostoften statistically significant and are of a similar magnitude. I also use other year dummycombinations. This offers, however, no additional insights.
A. Schertler
82 r Verein fur Socialpolitik and Blackwell Publishing Ltd. 2007

Ta
ble
5G
over
nm
ent-
fin
an
ced
kn
ow
led
ge
cap
ital
DEarl
y-s
tage
inves
tmen
ts
DEarl
y-
an
dex
pan
sio
n-s
tage
inves
tmen
tsD
Earl
y-s
tage
inves
tmen
tsD
Earl
y-
an
dex
pan
sio
n-s
tage
inves
tmen
ts
Nu
mb
erV
olu
me
Nu
mb
erV
olu
me
Nu
mb
erN
um
ber
DIn
du
stry
-fin
an
ced
GER
D(2
)0.0
03**
0.0
04**
(2.2
3)
(2.6
5)
DG
over
nm
ent-
fin
an
ced
GER
D(2
)
0.0
01
�0.0
01
(0.7
3)
(0.6
7)
DB
usi
nes
s-fi
nan
ced
R&
D
rese
arc
her
s(2
)
0.0
22**
*0.3
17**
0.0
19**�
0.0
94
(4.9
4)
(2.3
2)
(2.7
5)
(0.2
1)
DG
over
nm
ent-
fin
an
ced
R&
D
rese
arc
her
s(2
)
�0.0
43*
0.7
45
�0.0
43
1.7
32
�0.0
05
�0.0
1
(1.8
3)
(1.1
2)
(1.3
3)
(1.4
2)
(0.3
5)
(0.5
5)
DG
over
nm
ent-
fin
an
ced
R&
D
rese
arc
her
s(3
)
0.0
29
0.0
32
(0.9
1)
(0.8
8)
DG
over
nm
ent-
fin
an
ced
R&
D
rese
arc
her
s(4
)
0.0
32**
0.0
36
(2.2
7)
(1.5
8)
DG
over
nm
ent-
fin
an
ced
R&
D
rese
arc
her
s(5
)
0.0
42**
0.0
62**
(2.5
)(2
.42)
Gro
wth
rate
of
new
fun
ds
rais
ed(1
)
�0.0
01
0�
0.0
32
00.0
01
�0.0
98
00
00
0.0
01
0.0
01
0.0
01
0
(0.7
)(0
.04)
(1.1
4)
(0.1
6)
(0.2
6)
(0.9
3)
(0.2
9)
(0.2
)(0
.23)
(0.0
1)
(0.4
)(0
.34)
(0.3
5)
(0.1
5)
New
fun
ds
of
go
ver
nm
ents
(1)
00.0
00*�
0.0
02
00
�0.0
02
00
00.0
00*
0.0
01
00
0.0
01
(1.3
5)
(2.0
5)
(0.3
2)
(1.1
1)
(1.6
)(0
.16)
(1.7
6)
(1.7
1)
(1.5
4)
(1.9
)(1
.5)
(1.4
7)
(1.3
5)
(1.6
2)
New
fun
ds
of
pen
sio
nfu
nd
s
(1)
0.0
00*
00.0
11
00
0.0
52
0.0
01
0.0
01
0.0
01*
0.0
01
0.0
01
0.0
01
0.0
01
0.0
01
(1.8
5)
(1.6
9)
(0.8
3)
(0.9
)(0
.95)
(1.1
7)
(1.6
)(1
.75)
(1.7
8)
(1.6
5)
(0.9
8)
(1.0
7)
(1.1
)(1
.1)
Em
plo
ym
ent
pro
tect
ion
ind
ex
00
�0.0
01
00
0.0
01
00
00
00
00
(0.3
5)
(0.2
5)
(0.5
7)
(0.0
8)
(0.3
7)
(0.4
)(0
.18)
(0.3
)(0
.36)
(0.6
1)
(0.1
)(0
.02)
(0.0
3)
(0.3
)
Cap
ital
gain
sta
xra
te0
00
00
00
�0.0
00*
0�
0.0
00**
00
00
(1.1
5)
(0.0
9)
(0.1
4)
(0.5
6)
(0.5
)(1
.02)
(1.1
9)
(1.9
6)
(1.7
2)
(2.1
6)
(0.3
6)
(0.7
9)
(0.6
3)
(0.8
5)
Len
din
gra
te0
0.0
01
0.0
4�
0.0
01
�0.0
01
�0.0
13
�0.0
01
�0.0
01
�0.0
01
�0.0
01
�0.0
02
�0.0
02
�0.0
03
�0.0
03
(0.3
5)
(0.6
2)
(1.0
6)
(0.4
2)
(0.7
7)
(0.0
9)
(0.3
5)
(0.4
1)
(0.4
9)
(0.3
7)
(0.9
9)
(1.0
6)
(1.0
8)
(1.1
1)
Knowledge Capital and Venture Capital Investments
r Verein fur Socialpolitik and Blackwell Publishing Ltd. 2007 83

Gro
wth
rate
of
GD
P0.0
01
0.0
01
0.0
23
0.0
02*
0.0
01
�0.0
04
0.0
01*
0.0
01*
0.0
01
0.0
01*
0.0
01
0.0
02
0.0
02
0.0
02
(1.3
)(1
.56)
(1.5
5)
(1.8
2)
(1.2
9)
(0.1
3)
(1.7
9)
(2.0
1)
(1.7
4)
(2.0
8)
(1.4
)(1
.7)
(1.4
6)
(1.5
5)
Sto
ckm
ark
etre
turn
0.0
01**
*0.0
01**
0.0
42**
0.0
02**
0.0
01*
0.0
80**
*0.0
01**
0.0
01**
0.0
01**
0.0
01**
0.0
01*
0.0
01*
0.0
01*
0.0
01*
(3.1
9)
(2.7
6)
(2.9
3)
(2.3
8)
(2.1
1)
(3.3
4)
(2.4
1)
(2.6
2)
(2.3
3)
(2.3
9)
(2)
(2.0
8)
(1.9
3)
(1.9
8)
Du
mm
yeq
ual
too
ne
in1999
an
d2000
0.0
01**
*0.0
01**
*0.0
24**
*0.0
01**
*0.0
01**
*0.0
64**
*0.0
01**
*0.0
01**
*0.0
01**
*0.0
01**
*0.0
01**
*0.0
01**
*0.0
01**
*0.0
01**
*
(3.5
4)
(3.2
8)
(4.5
2)
(3.9
4)
(3.8
6)
(5.5
1)
(3.7
9)
(4.1
2)
(3.7
1)
(3.8
3)
(4.2
4)
(4.4
2)
(4.2
)(4
.3)
Co
nst
an
t0
�0.0
00**�
0.0
06
00
�0.0
15
00
00
00
00
(0.1
3)
(2.9
8)
(1.3
8)
(0.6
7)
(1.5
1)
(1)
(0.5
7)
(0.6
)(0
.79)
(0.8
9)
(0.5
7)
(0.6
7)
(0.8
9)
(1.0
9)
Ob
serv
ati
on
s132
133
133
132
133
133
136
136
136
136
136
136
136
136
F-t
est
20.6
58
***
56.4
81**
*43.5
69**
*23.7
99
***
39.0
5**
*37.7
17**
*82.0
1**
*20.1
51**
*20.0
43**
*38.9
4**
*26.8
52**
*56.8
99**
*24.7
84
***
38.3
9**
*
Ad
just
edR
20.2
88
0.3
19
0.2
56
0.3
06
0.2
81
0.2
91
0.2
25
0.2
36
0.2
36
0.2
42
0.2
50.2
56
0.2
57
0.2
68
Not
es:
Earl
y-s
tage
inves
tmen
tsare
inves
tmen
tsin
firm
s’ea
rly
stage
(see
dan
dst
art
-up
inves
tmen
ts)
as
ap
erce
nta
ge
of
eith
erG
DP
or
po
pu
lati
on
.Earl
y-an
dex
pan
sio
n-s
tage
inves
tmen
tsare
inves
tmen
tsin
firm
s’ea
rly
an
dex
pan
sio
nst
ages
as
ap
erce
nta
ge
ofei
ther
GD
Po
rp
op
ula
tio
n.IT
(BIO
)in
ves
tmen
tsare
inves
tmen
tsin
ven
ture
-cap
ital-
back
edfi
rms
op
erati
ng
inth
ein
form
ati
on
an
dco
mm
un
icati
on
s(b
iote
chn
olo
gy
an
dm
edic
al)
ind
ust
ryas
ap
erce
nta
ge
of
eith
erG
DP
or
po
pu
lati
on
.(1
)d
eno
tes
the
firs
tla
g,(2
)d
eno
tes
the
seco
nd
lag.D
den
ote
sfi
rst
dif
fere
nce
s.G
ER
Dis
the
gro
ssex
pen
dit
ure
so
nR
&D
scale
db
yG
DP.
Pate
nts
an
dR
&D
rese
arch
ers
are
scale
dby
po
pu
lati
on
.**
*,**
, *d
eno
tesi
gn
ific
an
tat
the
1,
5an
d10
per
cen
tle
vel
,re
spec
tivel
y.A
bso
lute
t-valu
esare
giv
enu
nd
erth
eco
effi
cien
ts.
A. Schertler
84 r Verein fur Socialpolitik and Blackwell Publishing Ltd. 2007

As there might be a close relationship between business-financed knowl-edge capital and government-financed knowledge capital, I also runregressions excluding business-financed knowledge capital. However, as theresults in columns (7) and (11) of Table 5 indicate, in which I use the secondlag of knowledge capital that I used in all the specifications presented so far,government-financed R&D researchers do not help in explaining my variousmeasures of VC investments. This also holds for government-financed GERD,for which I do not report estimation results.
The reasons for the insignificance of government-financed knowledgecapital could be that government-financed knowledge capital does notfinance those areas with promising commercial applications (Keuschnigg,2003) or that basic government-financed R&D research needs more than twoyears to result in commercial applications for which founders require venturecapital finance. Therefore, I estimate in a second step whether government-financed knowledge capital lagged more than two years has a significantimpact on VC investments. Indeed, as the results presented in columns (9),(10) and (14) indicate, government-financed R&D researchers have a delayedpositive effect on the number of investments in the early stage and in theearly and expansion stages. This delay amounts to several years. Morespecifically, the fourth and fifth lags of the government-financed R&Dresearchers have positive and significant coefficients.
5. SUMMARY
Several recent papers have found evidence that venture capital backing has apositive impact on knowledge creation within single firms. In contrast to thisresearch strategy, I have analyzed whether previous years’ knowledge capitalexplains VC investments on a countrywide basis for Western Europeancountries. I expected that previous years’ knowledge capital would have apositive impact on VC investments, as patent owners and highly qualifiedemployees who start up an innovative firm in high-technology industrieslikely need venture capital finance because they have limited access to othersources of funding.
This paper has shown that previous years’ knowledge capital has asignificantly positive impact on the various measures of VC investments. Inparticular, I have found evidence that the number of patent applicationssignificantly affects the number and the volume of investments in the earlystage. Moreover, I have found evidence that the number of patents registeredin the particular industry significantly affects the numbers of VC investmentsin the respective industry, such as the biotechnology and medical industry.
In the empirical analysis, I have used several control variables. Interest-ingly, many control variables have not helped in explaining VC investments,such as the capital gains tax rate, the growth rate of new funds and thelending rate. Other control variables have, however, helped in explaining VC
Knowledge Capital and Venture Capital Investments
r Verein fur Socialpolitik and Blackwell Publishing Ltd. 2007 85

investments. In some model specifications, the new funds provided bypension funds have helped in explaining VC investments: the higher therelative volumes provided by pension funds, the higher the number ofinvestments in the early stage is. More importantly, in many specifications,the stock market returns of fast-growing firms have had a significantlypositive impact on the volume and number of VC investments.
This paper has important policy implications because it shows that avibrant venture capital industry can develop only in those countries thathave sufficient knowledge capital. Therefore, a successful strategy forestablishing liquid venture capital industries in Europe might be to increaseVC investments by increasing the knowledge capital of the countries.However, this paper shows that government-financed knowledge capitalcan only be expected to increase VC investments several years aftergovernments have invested in knowledge capital.
ACKNOWLEDGEMENTS
Financial support from the European Union, DG Research (Contract No.HPSE-CT-1999-00039), is gratefully acknowledged. The author would like tothank two anonymous referees, Claudia M. Buch, Christian Keuschnigg, PeterNippel, Uwe Walz, and participants of the Annual Meeting of the Verein furSocialpolitik, 2003, for most helpful comments and suggestions, as well asHeiko Rachinger for most efficient research assistance. The remaining errorsand inaccuracies are solely my own responsibility.
Address for correspondence: University of Kiel, Department of Business,Chair of Finance, Olshausenstr. 40, 24098 Kiel, Germany. Tel.: þ 49 431 8804748; fax: þ 49 431 880 1386; e-mail: [email protected].
REFERENCES
Audretsch, D. A. and E. Lehmann (2004), ‘Debt or Equity: The Role of Venture Capitalin Financing High-Tech Firms in Germany’, Schmalenbach Business Review 56, 340–357.
Bascha, A. and U. Walz (2001), ‘Convertible Securities and Optimal Exit Decisions inVenture Capital Finance’, Journal of Corporate Finance 7(3), 285–306.
Beck, T. and R. Levine (2002), ‘Industry Growth and Capital Allocation: Does Havinga Market- or Bank-Based System Matter?’, Journal of Financial Economics 64(2),147–180.
Belke, A., R. Fehn and N. Foster (2005), ‘Venture Capital Investments and LaborMarket Performance: A Panel Data Analysis’, in: V. Kanniainen and C. Keuschnigg(eds.), Venture Capital, Entrepreneurship, and Public Policy, MIT Press, Cambridge, MA.
Black, B. S. and R. J. Gilson (1998), ‘Venture Capital and the Structure of CapitalMarkets: Banks versus Stock Markets’, Journal of Financial Economics 47(3), 243–277.
Bottazzi, L. and M. Da Rin (2002), ‘Europe’s New Stock Markets’, CEPR DiscussionPaper No. 3521.
A. Schertler
86 r Verein fur Socialpolitik and Blackwell Publishing Ltd. 2007

Brav, A. and P. Gompers (1997), ‘Myth or Reality? The Long-Run Underperformance ofInitial Public Offerings: Evidence from Venture and Non-Venture Capital-BackedCompanies’, Journal of Finance 52(5), 1791–1821.
Casamatta, C. (2003), ‘Financing and Advising: Optimal Financial Contracts withVenture Capitalists’, Journal of Finance 58(5), 2059–2085.
Da Rin, M., G. Nicodano and A. Sembenelli (2005), ‘Public Policy and the Creation ofActive Venture Capital Markets’, ECB Working Paper No. 430, European CentralBank ( January).
Engel, D. (2002), ‘The Impact of Venture Capital on Firm Growth: An EmpiricalInvestigation’, ZEW Discussion Paper 02-02.
Engel, D. (2003), ‘Hoheres Beschaftigungswachstum durch Venture Capital?’, Journalof Economics and Statistics 223(1), 1–22.
Engel, D. and M. Keilbach (2002), ‘Firm Level Implications of Early Stage VCInvestments: An Empirical Investigation’, ZEW Discussion Paper 02-82.
European Commission (2000), ‘Progress Report on the Risk Capital Action Plan’,Communication from the Commission to the Council and the EuropeanParliament, Brussels, COM(2000) 658 final.
EVCA (European Venture Capital Association), Yearbook, various issues, Zaventem,Belgium.
Fehn, R. and T. Fuchs (2004), ‘Capital Market Institutions and Venture Capital: DoThey Affect Unemployment and Labour Demand?’, Applied Economics Quarterly50(4), 393–422.
Gebhardt, G. and K. M. Schmidt (2002), ‘Der Markt fur Venture Capital: Anreiz-probleme, Governance Strukturen und staatliche Interventionen’, Perspektiven derWirtschaftspolitik 3(3), 235–255.
Gompers, P. A. (1996), ‘Grandstanding in the Venture Capital Industry’, Journal ofFinancial Economics 42(1), 133–156.
Gompers, P. A. (1998), ‘Venture Capital Growing Pains: Should the Market Diet?’,Journal of Banking and Finance 22, 1089–1104.
Gompers, P. A. and J. Lerner (1999), ‘What Drives Venture Capital Fundraising?’, NBERWorking Paper No. 6906.
Gorman, M. and W. Sahlman (1989), ‘What Do Venture Capitalists Do?’, Journal ofBusiness Venturing 4(4), 231–248.
Hellmann, T. and M. Puri (2000), ‘The Interaction between Product Market and FinancingStrategy: The Role of Venture Capital’, Review of Financial Studies 13(4), 959–984.
Holmstrom, B. and J. Tirole (1997), ‘Financial Intermediation, Loanable Funds, andthe Real Sector’, Quarterly Journal of Economics 112(3), 663–691.
Im, K. S., M. H. Pesaran and Y. Shin (2003), ‘Testing for Unit Roots in HeterogenousPanels’, Journal of Econometrics 115, 53–74.
IMF (International Monetary Fund) (2003), IFS CD-ROM (International FinancialStatistics), IMF, Washington, DC.
Jeng, L. A. and P. C. Wells (2000), ‘The Determinants of Venture Capital Funding:Evidence across Countries’, Journal of Corporate Finance 6, 241–289.
Keuschnigg, C. (2003), ‘Optimal Public Policy for Venture Capital Backed Innovation’,CEPR Discussion Paper No. 3850.
Keuschnigg, C. and S. B. Nielsen (2001), ‘Public Policy for Venture Capital’, Inter-national Tax and Public Finance 8(4), 557–572.
Kortum, S. and J. Lerner (2000), ‘Assessing the Contribution of Venture Capital toInnovation’, Rand Journal of Economics 31(4), 674–692.
Knowledge Capital and Venture Capital Investments
r Verein fur Socialpolitik and Blackwell Publishing Ltd. 2007 87

Leleux, B. and B. Surlemont (2003), ‘Public versus Private Venture Capital: Seeding orCrowding Out? A Pan-European Analysis’, Journal of Business Venturing 18, 81–104.
Lerner, J. (2002a), ‘When Bureaucrats Meet Entrepreneurs: The Design of Effective‘‘Public Venture Capital’’ Programmes’, Economic Journal 112(February), F73–F84.
Lerner, J. (2002b), ‘Boom and Bust in the Venture Capital Industry and the Impact onInnovation’, Federal Reserve Bank of Atlanta Economic Review, Fourth Quarter 2002.
Levin, A., C. Lin and C. Chu (2002), ‘Unit Root Tests in Panel Data: Asymptotic andFinite Sample Properties’, Journal of Econometrics 108, 1–24.
Lulfesmann, C. (2000), ‘Start-Up Firms, Venture Capital Financing and Renegotiation’,Journal of Financial Management and Analysis 13(1), 1–15.
Megginson, W. L. and K. A. Weiss (1991), ‘Venture Capitalist Certification in InitialPublic Offerings’, Journal of Finance 46(3), 879–903.
Mull, F. (1990), Towards a Positive Theory of Venture Capital, UMI DissertationInformation Service, Ann Arbor, MI.
Murray, G. C. and R. Marriot (1998), ‘Why has the Investment Performance ofTechnology-Specialist, European Venture Capital Funds Been So Poor?’, ResearchPolicy 27(9), 947–976.
OECD (Organisation for Economic Co-operation and Development) (1999), OECDEmployment Outlook, OECD, Paris.
OECD (Organisation for Economic Co-operation and Development) (2003), OECDMain Science and Technology Statistics, OECD, Paris.
OECD (Organisation for Economic Co-operation and Development) (2004), StatisticalCompendium, OECD, Paris.
Poterba, J. M. (1989), ‘Venture Capital and Capital Gain Taxation’, Tax Policy and theEconomy 3, 47–67.
Repullo, R. and J. Suarez (2004), ‘Venture Capital Finance: A Security DesignApproach’, Review of Finance 8(1), 75–108.
Ritter, J. R. (1991), ‘The Long-Run Performance of Initial Public Offerings’, Journal ofFinance 46(1), 3–27.
Romain, A. and B. van Pottelsberghe (2004), ‘The Determinants of Venture Capital:Additional Evidence’, Discussion Paper Series 1: Studies of the Economic ResearchCentre No. 19/2004, Deutsche Bundesbank.
Sahlman, W. A. (1990), ‘The Structure and Governance of Venture-Capital Organiza-tions’, Journal of Financial Economics 27(2), 473–521.
Schertler, A. (2004), ‘Explaining Cross-Country Variations in Venture CapitalInvestments: Theory and Empirical Evidence’, Kredit und Kapital 37(3), 297–328.
Schertler, A. (2005), ‘European Venture Capital Markets: Fund Providers andInvestment Characteristics’, Applied Financial Economics 15(6), 367–380.
Schmidt, K. (2003), ‘Convertible Securities and Venture Capital Finance’, Journal ofFinance 58(3), 1139–1166.
Tejada, R. (2003a), ‘Venture Capital Policy Review: Spain’, STI Working Paper No.2003/18, Industry Issues, Organisation for Economic Co-operation and Develop-ment.
Tejada, R. (2003b), ‘Venture Capital Policy Review: Portugal’, STI Working Paper No. 2003/19, Industry Issues, Organisation for Economic Co-operation and Development.
Wasmer, E. and P. Weil (2000), ‘The Macroeconomics of Labor and Credit MarketImperfections’, IZA DP 179, Bonn.
Wooldridge, J. M. (2002), Econometric Analysis of Cross-Section and Panel Data, MITPress, Cambridge, MA.
A. Schertler
88 r Verein fur Socialpolitik and Blackwell Publishing Ltd. 2007