kinetics of trichloroethene dechlorination and methane formation by a mixed anaerobic culture in a...
TRANSCRIPT

Electrochimica Acta 53 (2008) 5300–5305
Contents lists available at ScienceDirect
Electrochimica Acta
journa l homepage: www.e lsev ier .com/ locate /e lec tac ta
Kinetics of trichloroethene dechlorination and methane formation by
a mixed anaerobic culture in a bio-electrochemical systemFederico Aulenta ∗, Priscilla Reale, Alessandro Catervi, Stefania Panero, Mauro Majoneldo M
vestigrolledeveraing f
ossiberati
al TCE.800
ievedmatiolturepetinindind m
Department of Chemistry Stanislao Cannizzaro, Sapienza University of Rome, Piazzale A
a r t i c l e i n f o
Article history:Received 29 November 2007Received in revised form 15 February 2008Accepted 23 February 2008Available online 4 March 2008
Keywords:Anaerobic bioremediationBio-electrochemical dechlorinationCompetitionElectron donorTrichloroethene
a b s t r a c t
In the present study, we inprotons reduction at contof trichloroethene (TCE). Sat different potentials rangcathode potential it was pa balance between H2 genmethanogenesis). Microbicathode was lower than −0current efficiency was achvs. Ag/AgCl). Methane forpresence in the mixed cuof this fact, these two comexternal potential, therebyfor H2 for dechlorination a
1. Introduction
Chlorinated ethenes, such as trichloroethene (TCE), are amongthe most frequently detected groundwater pollutants [1]. Allchloroethenes, as well as their dechlorination products, are eitherknown or suspected carcinogens, therefore their presence inthe environment is of high concern. Remediation methods toremove these chemicals from groundwater quickly and inexpen-sively are needed. Anaerobic bioremediation is one of the mostappealing clean up methods because it has the potential to effec-tively transform toxic chloroethenes, including TCE, into harmlessnon-chlorinated end-products such as ethene [2–6]. In anaerobicbioremediation, electron donors are added to the contaminatedsite to stimulate the growth and activity of indigenous microbialpopulations that are capable of reductively dechlorinating the chlo-rinated compounds [6–9]. As for TCE, this compound is sequentiallydechlorinated to cis-dichloroethene (cDCE), vinyl chloride (VC) andfinally ethene (ETH). Although there is recent evidence that somedechlorinating bacteria can use acetate as electron donor [8,10,11],H2 is typically the direct electron donor for this process [12,13].There are currently different approaches that may be used todeliver H2 to contaminated groundwater in support of the reductive
∗ Corresponding author. Tel.: +39 0649913948; fax: +39 06490631.E-mail address: [email protected] (F. Aulenta).
0013-4686/$ – see front matter © 2008 Elsevier Ltd. All rights reserved.doi:10.1016/j.electacta.2008.02.084
oro 5, 00185 Rome, Italy
ated the use of a lab-scale, bio-electrochemical system to generate H2 fromcathodic potentials, in support of the microbial reductive dechlorinationl batch potentiostatic experiments were performed on graphite cathodes
rom −0.700 to −1.000 V vs. Ag/AgCl. By appropriately changing the appliedle to finely control the liquid phase H2 concentration, which resulted fromon (from protons reduction) and consumption (from dechlorination anddechlorination was stimulated when the potential applied to the graphite
V vs. Ag/AgCl. However, a combination of high dechlorination rate and highonly in a very narrow range of cathode potentials (i.e., −0.850 to −0.875 Vn was significantly slower than TCE dechlorination, probably due to theof a lower number of methanogens compared to dechlorinators. In spiteg metabolisms were stimulated in a similar way by the application of an
cating a similar affinity for H2. Indeed, calculated half-velocity coefficientsethanogenesis were 20.1 ± 7.6 and 17.9 ± 8.5 nM, respectively.
© 2008 Elsevier Ltd. All rights reserved.
dechlorination; these include H2 gas sparging; the use of organicsubstrates which release H2 upon fermentation; passive H2 dissolu-tion into the groundwater using hollow-fiber membranes [14–17].All of these approaches typically suffer from a lack of control over H2delivery. Moreover, the use of organic substrates has the additional
drawback of resulting in the accumulation of high levels (thou-sands of mg/L) of fermentation products such as volatile fatty acids(e.g., acetate, propionate, butyrate) with consequent deteriorationof groundwater quality [18]. Recently, different researchers havealso proposed the use of electric current to produce H2 to supportthe biological reduction of nitrate or chlorinated solvents [19–21].In spite of this, no attempts were made to effectively control therate of H2 evolution in such systems.The ability to control the H2 delivery and in turn the H2 con-centration levels in the groundwater is crucial in determiningthe outcome of the competition between dechlorinating bacte-ria and other H2-consuming microorganisms such methanogens,homoacetogens, sulphate reducers, and others. Because in thefield the cost of the electron donor that must be supplied toachieve an effective enhancement of dechlorination processes maybe significant, it is always desirable to minimize competition forH2 between dechlorinators and competing organisms. Pioneer-ing studies [22–25] addressed the issue of competition for H2between dechlorinators and methanogens in contaminated sub-surface environments. The authors found that dechlorinators havethe potential to out-compete methanogens when H2 is present at

mica A
F. Aulenta et al. / Electrochilow concentration, due to their higher affinity for H2 (low half-velocity coefficient for H2 use). As an example, Smatlak et al.reported a 10-fold higher half-velocity constant for H2 use formethanogenesis (960 ± 180 nM) compared to PCE dechlorinationto VC (100 ± 50 nM).
In the present study, we investigated at a laboratory scale, thefeasibility of using a graphite electrode (cathode) polarized at con-trolled potential values, to generate H2 (from protons reduction)at controlled rates in support of the microbial reductive dechlo-rination of TCE. Process efficiency as well as the competition forproduced H2 between dechlorinating bacteria and methanogenswas examined as a function of the potential applied to the graphiteelectrode.
2. Experimental
2.1. Bio-electrochemical cell
The lab-scale, bio-electrochemical cell used in this study wasspecially designed for cultivating strictly anaerobic bacteria. It con-sisted of two gastight borosilicate glass bottles separated by a 3 cm2
cross-sectional area, Nafion 117® (DuPont) proton exchange mem-
brane (PEM) (Fig. 1). Prior to be assembled in the cell, the PEMwas pretreated as described previously [26]. The total volume ineach compartment was approximately 300 mL, and the liquid vol-ume was 160 mL. Both the cathodic and anodic compartmentswere equipped with side arms, ending with Teflon-faced butylstoppers, which allowed the sampling of the headspace and liq-uid phase. The cathode (working electrode) consisted of 3 rodsof unpolished graphite (100 mm length, 8 mm diameter) and theanode (counter electrode) was a platinum wire. A reference elec-trode (i.e., saturated Ag/AgCl; +200 mV vs. SHE) (Amel S.r.l., Milano,Italy) was placed in the cathode compartment. The electrodes weresoaked in deionized water prior to being used. Electrochemicalmeasurements and monitoring were performed using a Galvanos-tat/Potentiostat MACCOR 4000 (Kyunggi-Do, Korea) interfaced to acomputer.2.2. Culture and medium
The cathodic compartment of the bio-electrochemical reactorwas initially inoculated with 160 mL of a TCE dechlorinating culture,
Fig. 1. Scheme of the bio-electrochemical cell, and proposed mechanisms by whichthe H2 produced at the cathode from protons reduction supports the microbialreductive dechlorination of TCE.
cta 53 (2008) 5300–5305 5301
highly enriched in Dehalococcoides spp. [7,26]. The original culturecould dechlorinate TCE to predominantly VC and ethene, using H2as electron donor. Weekly, the dechlorinating culture in the cathodecompartment of the bio-electrochemical reactor received a doseof TCE (0.08 mmol) and molecular H2 (0.4 mmol). Before each re-feeding, the headspace of both the cathodic and anodic chamberswas flushed with N2/CO2 gas mixture (70:30) to remove volatilecompounds including residual TCE, dechlorination products andmethane. Weekly, a volume (∼14 mL out of 160 mL) of the cul-ture was removed and replaced by fresh anaerobic basal medium,which contained (g/L): (NH4)2Cl, 0.5; MgCl2·H2O, 0.1; K2HPO4, 0.4;CaCl2·H2O, 0.05; 10 mL of a trace metal solution [27], and 1 mLvitamin solution [28]. The pH of the medium was measured and cor-rected to ∼7.5 using NaHCO3 (10%, w/w). The average hydraulic andcell retention time in the bio-electrochemical reactor was approxi-mately 80 days. Once per month, the culture also received a dose ofyeast extract (5 mg) as a carbon source. Periodically, the anolytewas also replaced by freshly prepared basal medium. The bio-electrochemical cell was maintained in a water batch at 25 ◦C. Thecontent of the cell (both the cathodic and anodic compartments)was continuously mixed with a magnetic stirrer.
2.3. Batch potentiostatic experiments
To investigate the influence of applied cathode potentials onthe rate of TCE dechlorination and methanogenesis, batch poten-tiostatic experiments were conducted. In these experiments, thecathode (working electrode) was polarized with a potentiostatto the desired value in the range −0.7 to −1.0 V vs. an Ag/AgClreference electrode. Prior to the beginning of each test, the twocompartments were flushed for approximately 0.5 h with N2/CO2gas mixture to eliminate residual volatile compounds and to assureanaerobic conditions. The cathodic compartment was then spikedwith the desired mass of TCE (25 �mol) and the cathode waspolarized to the desired potential. During the experiments, atregular intervals, gaseous samples (100–500 �L) were removedfrom the headspace of the cathodic compartment, using gastight,sample-lock Hamilton (Reno, NV) syringes and analyzed by gaschromatography for TCE, TCE-dechlorination products, methane,and hydrogen. During the tests, the bio-electrochemical reactorwas maintained at 25 ◦C in a water bath and both compartmentswere kept under magnetic stirring. Abiotic batch potentiostaticexperiments were also performed to quantify the electrochemicalreductive dechlorination of TCE in the absence of the dechlorinatingculture. These tests were carried out in a parallel reactor, adopting
identical electrodes and conditions used for biotic experiments.During the experiments the current flowing in the circuit wasrecorded. The cumulative electric charge (�F) transferred wascalculated by integrating current over the period of electrode polar-ization. Cumulative reducing equivalents (�eq) that were usedfor reductive dechlorination or methanogenesis were calculatedfrom the measured levels of TCE dechlorination products andmethane, as previously described [7]. Molar equivalents factorsused were: 2 eq/mol for each chlorine removed from chlorinatedethenes, 2 eq/mol for hydrogen, and 8 eq/mol for methane. Cur-rent efficiencies for reductive dechlorination or methanogenesiswere calculated, at any time, as the ratio between the cumula-tive equivalents used for dechlorination or methanogenesis and thecumulative electric charge transferred at the electrode.
To account for variations of activity of the microbial cultureover time, due to growth and little changes in composition ofgrowth medium, each potentiostatic experiment was anticipatedby a control test. Such control tests were conducted under con-ditions identical to those previously described but without theapplication of an external potential to the cathode (these tests arehereafter referred to as “open circuit experiments”). For each poten-
mica Acta 53 (2008) 5300–5305
5302 F. Aulenta et al. / Electrochitiostatic experiment (also for open circuit experiments), the initialdechlorination rate and methane formation rate were calculatedfrom the regression of the initial linear time profile of the cumula-tive dechlorination curve and methane formation curve. The effectof H2 concentration on dechlorination rate and methane forma-tion rate was assumed to follow Michaelis–Menten kinetics. Thehalf-velocity coefficients for H2 were obtained by fitting rates vs.liquid phase H2 concentrations using a software package (SCIEN-TIST, Micromath Inc., St. Louis, MO, USA). Model equations weresolved numerically using fourth-order Runge-Kutta method. Thestandard deviation for each parameter was also estimated.
2.4. Analytical methods
Chlorinated ethenes, ethene, ethane, and methane were ana-lyzed in 250–500 �L gaseous samples, using a gas chromatographVarian 3400 (Palo Alto, CA) equipped with a flame ionization detec-tor, as described previously [26]. H2 was analyzed in 500 �L gaseoussample by a Trace Analytical TA3000R equipped with a reductiongas detector (RGD) (Menlo Park, CA) [13]. When the H2 level wasabove the range of the RGD, i.e., >0.5 �mol, it was quantified usinga Varian 3400 GC equipped with a thermo-conductivity detector(TCD), as described elsewhere [29]. Headspace concentrations wereconverted to nominal concentrations (total amount of substancedivided by the liquid volume of the bottle) or liquid phase concen-trations using tabulated Henry’s law constants.
3. Results and discussion
3.1. Reductive dechlorination and methanogenesis in batchpotentiostatic experiments
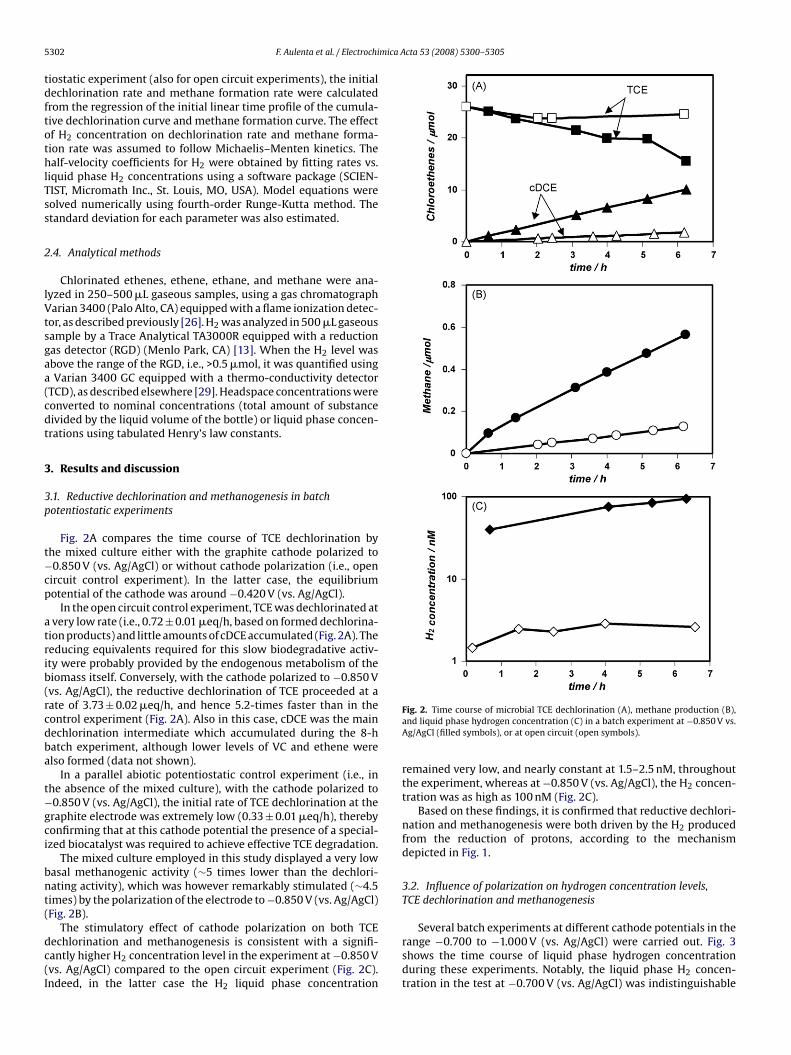
Fig. 2A compares the time course of TCE dechlorination bythe mixed culture either with the graphite cathode polarized to−0.850 V (vs. Ag/AgCl) or without cathode polarization (i.e., opencircuit control experiment). In the latter case, the equilibriumpotential of the cathode was around −0.420 V (vs. Ag/AgCl).
In the open circuit control experiment, TCE was dechlorinated ata very low rate (i.e., 0.72 ± 0.01 �eq/h, based on formed dechlorina-tion products) and little amounts of cDCE accumulated (Fig. 2A). Thereducing equivalents required for this slow biodegradative activ-ity were probably provided by the endogenous metabolism of thebiomass itself. Conversely, with the cathode polarized to −0.850 V(vs. Ag/AgCl), the reductive dechlorination of TCE proceeded at a
rate of 3.73 ± 0.02 �eq/h, and hence 5.2-times faster than in thecontrol experiment (Fig. 2A). Also in this case, cDCE was the maindechlorination intermediate which accumulated during the 8-hbatch experiment, although lower levels of VC and ethene werealso formed (data not shown).In a parallel abiotic potentiostatic control experiment (i.e., inthe absence of the mixed culture), with the cathode polarized to−0.850 V (vs. Ag/AgCl), the initial rate of TCE dechlorination at thegraphite electrode was extremely low (0.33 ± 0.01 �eq/h), therebyconfirming that at this cathode potential the presence of a special-ized biocatalyst was required to achieve effective TCE degradation.
The mixed culture employed in this study displayed a very lowbasal methanogenic activity (∼5 times lower than the dechlori-nating activity), which was however remarkably stimulated (∼4.5times) by the polarization of the electrode to −0.850 V (vs. Ag/AgCl)(Fig. 2B).
The stimulatory effect of cathode polarization on both TCEdechlorination and methanogenesis is consistent with a signifi-cantly higher H2 concentration level in the experiment at −0.850 V(vs. Ag/AgCl) compared to the open circuit experiment (Fig. 2C).Indeed, in the latter case the H2 liquid phase concentration
Fig. 2. Time course of microbial TCE dechlorination (A), methane production (B),and liquid phase hydrogen concentration (C) in a batch experiment at −0.850 V vs.Ag/AgCl (filled symbols), or at open circuit (open symbols).
remained very low, and nearly constant at 1.5–2.5 nM, throughoutthe experiment, whereas at −0.850 V (vs. Ag/AgCl), the H2 concen-tration was as high as 100 nM (Fig. 2C).
Based on these findings, it is confirmed that reductive dechlori-nation and methanogenesis were both driven by the H2 producedfrom the reduction of protons, according to the mechanismdepicted in Fig. 1.
3.2. Influence of polarization on hydrogen concentration levels,TCE dechlorination and methanogenesis
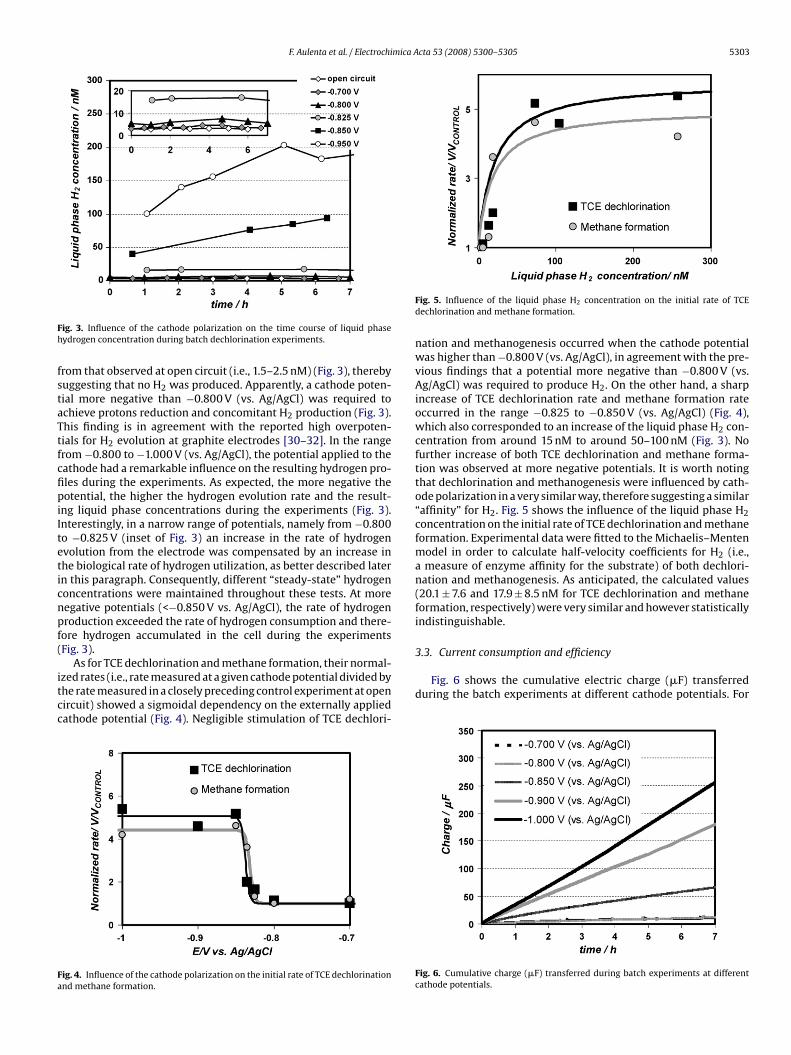
Several batch experiments at different cathode potentials in therange −0.700 to −1.000 V (vs. Ag/AgCl) were carried out. Fig. 3shows the time course of liquid phase hydrogen concentrationduring these experiments. Notably, the liquid phase H2 concen-tration in the test at −0.700 V (vs. Ag/AgCl) was indistinguishable
F. Aulenta et al. / Electrochimica A
which also corresponded to an increase of the liquid phase H2 con-
Fig. 3. Influence of the cathode polarization on the time course of liquid phasehydrogen concentration during batch dechlorination experiments.
from that observed at open circuit (i.e., 1.5–2.5 nM) (Fig. 3), therebysuggesting that no H2 was produced. Apparently, a cathode poten-tial more negative than −0.800 V (vs. Ag/AgCl) was required toachieve protons reduction and concomitant H2 production (Fig. 3).This finding is in agreement with the reported high overpoten-
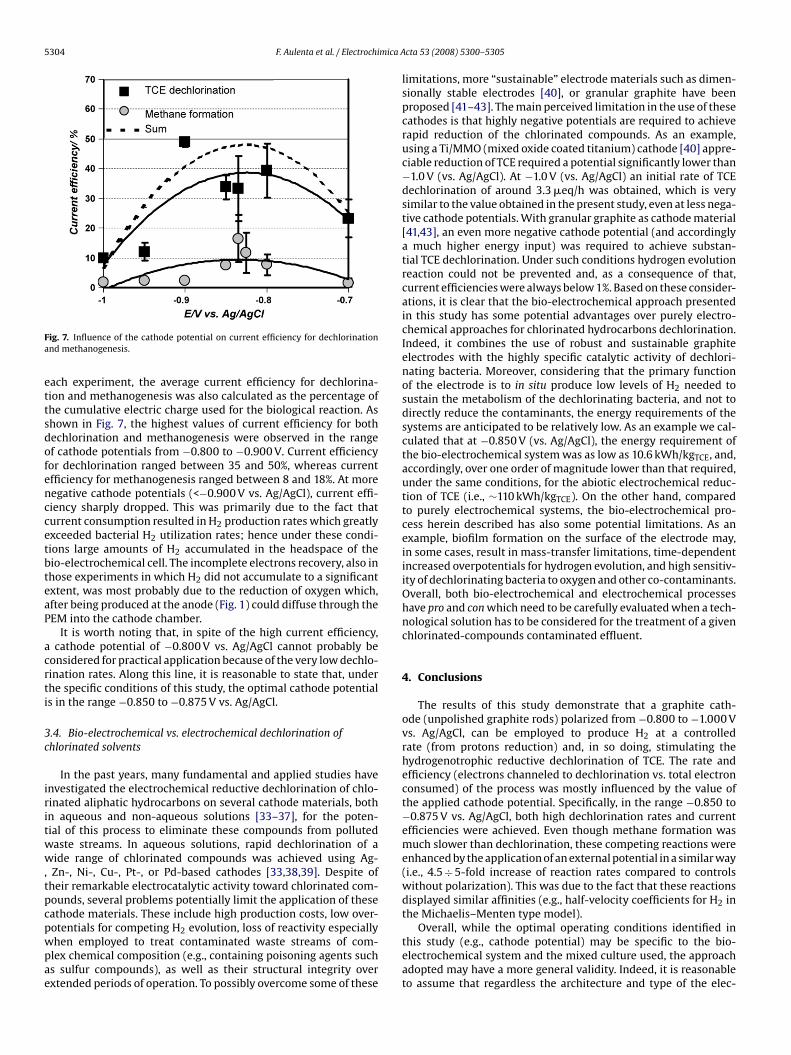
tials for H2 evolution at graphite electrodes [30–32]. In the rangefrom −0.800 to −1.000 V (vs. Ag/AgCl), the potential applied to thecathode had a remarkable influence on the resulting hydrogen pro-files during the experiments. As expected, the more negative thepotential, the higher the hydrogen evolution rate and the result-ing liquid phase concentrations during the experiments (Fig. 3).Interestingly, in a narrow range of potentials, namely from −0.800to −0.825 V (inset of Fig. 3) an increase in the rate of hydrogenevolution from the electrode was compensated by an increase inthe biological rate of hydrogen utilization, as better described laterin this paragraph. Consequently, different “steady-state” hydrogenconcentrations were maintained throughout these tests. At morenegative potentials (<−0.850 V vs. Ag/AgCl), the rate of hydrogenproduction exceeded the rate of hydrogen consumption and there-fore hydrogen accumulated in the cell during the experiments(Fig. 3).As for TCE dechlorination and methane formation, their normal-ized rates (i.e., rate measured at a given cathode potential divided bythe rate measured in a closely preceding control experiment at opencircuit) showed a sigmoidal dependency on the externally appliedcathode potential (Fig. 4). Negligible stimulation of TCE dechlori-
Fig. 4. Influence of the cathode polarization on the initial rate of TCE dechlorinationand methane formation.
cta 53 (2008) 5300–5305 5303
Fig. 5. Influence of the liquid phase H2 concentration on the initial rate of TCEdechlorination and methane formation.
nation and methanogenesis occurred when the cathode potentialwas higher than −0.800 V (vs. Ag/AgCl), in agreement with the pre-vious findings that a potential more negative than −0.800 V (vs.Ag/AgCl) was required to produce H2. On the other hand, a sharpincrease of TCE dechlorination rate and methane formation rateoccurred in the range −0.825 to −0.850 V (vs. Ag/AgCl) (Fig. 4),
centration from around 15 nM to around 50–100 nM (Fig. 3). Nofurther increase of both TCE dechlorination and methane forma-tion was observed at more negative potentials. It is worth notingthat dechlorination and methanogenesis were influenced by cath-ode polarization in a very similar way, therefore suggesting a similar“affinity” for H2. Fig. 5 shows the influence of the liquid phase H2concentration on the initial rate of TCE dechlorination and methaneformation. Experimental data were fitted to the Michaelis–Mentenmodel in order to calculate half-velocity coefficients for H2 (i.e.,a measure of enzyme affinity for the substrate) of both dechlori-nation and methanogenesis. As anticipated, the calculated values(20.1 ± 7.6 and 17.9 ± 8.5 nM for TCE dechlorination and methaneformation, respectively) were very similar and however statisticallyindistinguishable.
3.3. Current consumption and efficiency
Fig. 6 shows the cumulative electric charge (�F) transferredduring the batch experiments at different cathode potentials. For
Fig. 6. Cumulative charge (�F) transferred during batch experiments at differentcathode potentials.
5304 F. Aulenta et al. / Electrochimica A
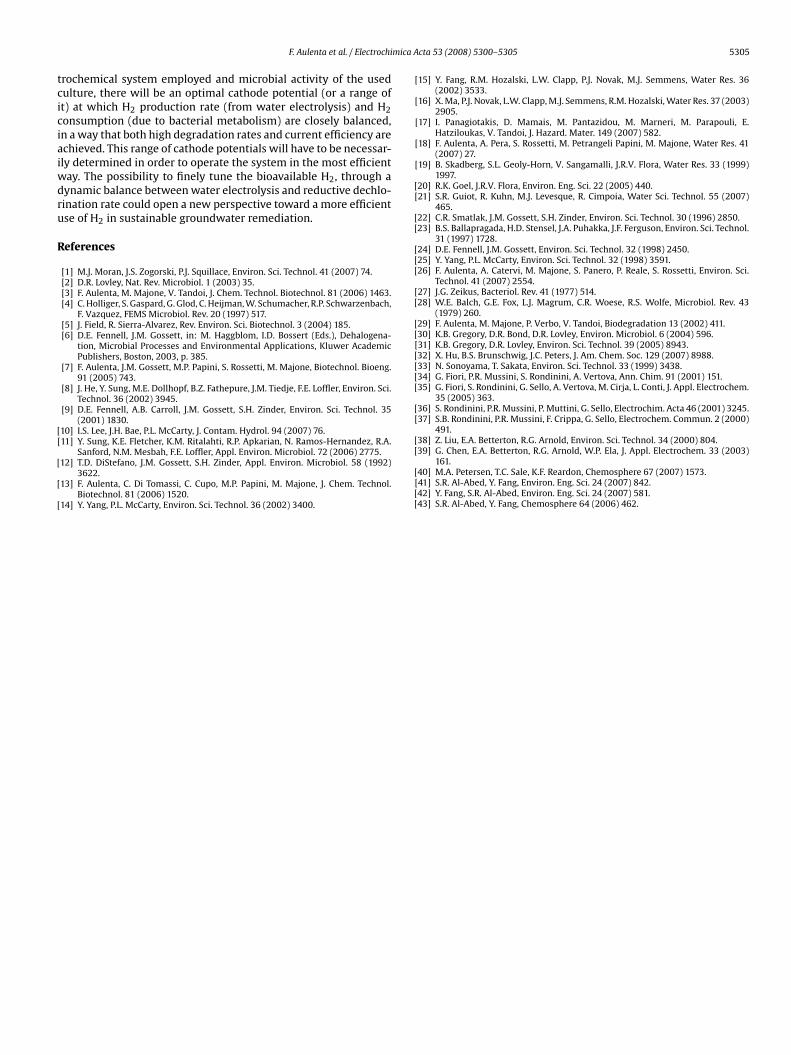
Fig. 7. Influence of the cathode potential on current efficiency for dechlorinationand methanogenesis.
each experiment, the average current efficiency for dechlorina-tion and methanogenesis was also calculated as the percentage ofthe cumulative electric charge used for the biological reaction. Asshown in Fig. 7, the highest values of current efficiency for bothdechlorination and methanogenesis were observed in the rangeof cathode potentials from −0.800 to −0.900 V. Current efficiencyfor dechlorination ranged between 35 and 50%, whereas currentefficiency for methanogenesis ranged between 8 and 18%. At morenegative cathode potentials (<−0.900 V vs. Ag/AgCl), current effi-ciency sharply dropped. This was primarily due to the fact thatcurrent consumption resulted in H2 production rates which greatlyexceeded bacterial H2 utilization rates; hence under these condi-tions large amounts of H2 accumulated in the headspace of thebio-electrochemical cell. The incomplete electrons recovery, also inthose experiments in which H2 did not accumulate to a significantextent, was most probably due to the reduction of oxygen which,after being produced at the anode (Fig. 1) could diffuse through thePEM into the cathode chamber.
It is worth noting that, in spite of the high current efficiency,a cathode potential of −0.800 V vs. Ag/AgCl cannot probably beconsidered for practical application because of the very low dechlo-rination rates. Along this line, it is reasonable to state that, underthe specific conditions of this study, the optimal cathode potential
is in the range −0.850 to −0.875 V vs. Ag/AgCl.3.4. Bio-electrochemical vs. electrochemical dechlorination ofchlorinated solvents
In the past years, many fundamental and applied studies haveinvestigated the electrochemical reductive dechlorination of chlo-rinated aliphatic hydrocarbons on several cathode materials, bothin aqueous and non-aqueous solutions [33–37], for the poten-tial of this process to eliminate these compounds from pollutedwaste streams. In aqueous solutions, rapid dechlorination of awide range of chlorinated compounds was achieved using Ag-, Zn-, Ni-, Cu-, Pt-, or Pd-based cathodes [33,38,39]. Despite oftheir remarkable electrocatalytic activity toward chlorinated com-pounds, several problems potentially limit the application of thesecathode materials. These include high production costs, low over-potentials for competing H2 evolution, loss of reactivity especiallywhen employed to treat contaminated waste streams of com-plex chemical composition (e.g., containing poisoning agents suchas sulfur compounds), as well as their structural integrity overextended periods of operation. To possibly overcome some of these
cta 53 (2008) 5300–5305
limitations, more “sustainable” electrode materials such as dimen-sionally stable electrodes [40], or granular graphite have beenproposed [41–43]. The main perceived limitation in the use of thesecathodes is that highly negative potentials are required to achieverapid reduction of the chlorinated compounds. As an example,using a Ti/MMO (mixed oxide coated titanium) cathode [40] appre-ciable reduction of TCE required a potential significantly lower than−1.0 V (vs. Ag/AgCl). At −1.0 V (vs. Ag/AgCl) an initial rate of TCEdechlorination of around 3.3 �eq/h was obtained, which is verysimilar to the value obtained in the present study, even at less nega-tive cathode potentials. With granular graphite as cathode material[41,43], an even more negative cathode potential (and accordinglya much higher energy input) was required to achieve substan-tial TCE dechlorination. Under such conditions hydrogen evolutionreaction could not be prevented and, as a consequence of that,current efficiencies were always below 1%. Based on these consider-ations, it is clear that the bio-electrochemical approach presentedin this study has some potential advantages over purely electro-chemical approaches for chlorinated hydrocarbons dechlorination.Indeed, it combines the use of robust and sustainable graphiteelectrodes with the highly specific catalytic activity of dechlori-nating bacteria. Moreover, considering that the primary functionof the electrode is to in situ produce low levels of H2 needed tosustain the metabolism of the dechlorinating bacteria, and not todirectly reduce the contaminants, the energy requirements of thesystems are anticipated to be relatively low. As an example we cal-culated that at −0.850 V (vs. Ag/AgCl), the energy requirement ofthe bio-electrochemical system was as low as 10.6 kWh/kgTCE, and,accordingly, over one order of magnitude lower than that required,under the same conditions, for the abiotic electrochemical reduc-tion of TCE (i.e., ∼110 kWh/kgTCE). On the other hand, comparedto purely electrochemical systems, the bio-electrochemical pro-cess herein described has also some potential limitations. As anexample, biofilm formation on the surface of the electrode may,in some cases, result in mass-transfer limitations, time-dependentincreased overpotentials for hydrogen evolution, and high sensitiv-ity of dechlorinating bacteria to oxygen and other co-contaminants.Overall, both bio-electrochemical and electrochemical processeshave pro and con which need to be carefully evaluated when a tech-nological solution has to be considered for the treatment of a givenchlorinated-compounds contaminated effluent.
4. Conclusions
The results of this study demonstrate that a graphite cath-ode (unpolished graphite rods) polarized from −0.800 to −1.000 Vvs. Ag/AgCl, can be employed to produce H2 at a controlledrate (from protons reduction) and, in so doing, stimulating thehydrogenotrophic reductive dechlorination of TCE. The rate andefficiency (electrons channeled to dechlorination vs. total electronconsumed) of the process was mostly influenced by the value ofthe applied cathode potential. Specifically, in the range −0.850 to−0.875 V vs. Ag/AgCl, both high dechlorination rates and currentefficiencies were achieved. Even though methane formation wasmuch slower than dechlorination, these competing reactions wereenhanced by the application of an external potential in a similar way(i.e., 4.5 ÷ 5-fold increase of reaction rates compared to controlswithout polarization). This was due to the fact that these reactionsdisplayed similar affinities (e.g., half-velocity coefficients for H2 inthe Michaelis–Menten type model).
Overall, while the optimal operating conditions identified inthis study (e.g., cathode potential) may be specific to the bio-electrochemical system and the mixed culture used, the approachadopted may have a more general validity. Indeed, it is reasonableto assume that regardless the architecture and type of the elec-
mica A
[
[
[
[
[
[
[
[
[[
[22] C.R. Smatlak, J.M. Gossett, S.H. Zinder, Environ. Sci. Technol. 30 (1996) 2850.
F. Aulenta et al. / Electrochi
trochemical system employed and microbial activity of the usedculture, there will be an optimal cathode potential (or a range ofit) at which H2 production rate (from water electrolysis) and H2consumption (due to bacterial metabolism) are closely balanced,in a way that both high degradation rates and current efficiency areachieved. This range of cathode potentials will have to be necessar-ily determined in order to operate the system in the most efficientway. The possibility to finely tune the bioavailable H2, through adynamic balance between water electrolysis and reductive dechlo-rination rate could open a new perspective toward a more efficient
use of H2 in sustainable groundwater remediation.References
[1] M.J. Moran, J.S. Zogorski, P.J. Squillace, Environ. Sci. Technol. 41 (2007) 74.[2] D.R. Lovley, Nat. Rev. Microbiol. 1 (2003) 35.[3] F. Aulenta, M. Majone, V. Tandoi, J. Chem. Technol. Biotechnol. 81 (2006) 1463.[4] C. Holliger, S. Gaspard, G. Glod, C. Heijman, W. Schumacher, R.P. Schwarzenbach,
F. Vazquez, FEMS Microbiol. Rev. 20 (1997) 517.[5] J. Field, R. Sierra-Alvarez, Rev. Environ. Sci. Biotechnol. 3 (2004) 185.[6] D.E. Fennell, J.M. Gossett, in: M. Haggblom, I.D. Bossert (Eds.), Dehalogena-
tion, Microbial Processes and Environmental Applications, Kluwer AcademicPublishers, Boston, 2003, p. 385.
[7] F. Aulenta, J.M. Gossett, M.P. Papini, S. Rossetti, M. Majone, Biotechnol. Bioeng.91 (2005) 743.
[8] J. He, Y. Sung, M.E. Dollhopf, B.Z. Fathepure, J.M. Tiedje, F.E. Loffler, Environ. Sci.Technol. 36 (2002) 3945.
[9] D.E. Fennell, A.B. Carroll, J.M. Gossett, S.H. Zinder, Environ. Sci. Technol. 35(2001) 1830.
10] I.S. Lee, J.H. Bae, P.L. McCarty, J. Contam. Hydrol. 94 (2007) 76.[11] Y. Sung, K.E. Fletcher, K.M. Ritalahti, R.P. Apkarian, N. Ramos-Hernandez, R.A.
Sanford, N.M. Mesbah, F.E. Loffler, Appl. Environ. Microbiol. 72 (2006) 2775.12] T.D. DiStefano, J.M. Gossett, S.H. Zinder, Appl. Environ. Microbiol. 58 (1992)
3622.13] F. Aulenta, C. Di Tomassi, C. Cupo, M.P. Papini, M. Majone, J. Chem. Technol.
Biotechnol. 81 (2006) 1520.14] Y. Yang, P.L. McCarty, Environ. Sci. Technol. 36 (2002) 3400.
[
[[[
[[
[[[[[[[
[[
[[
[[[[
cta 53 (2008) 5300–5305 5305
15] Y. Fang, R.M. Hozalski, L.W. Clapp, P.J. Novak, M.J. Semmens, Water Res. 36(2002) 3533.
16] X. Ma, P.J. Novak, L.W. Clapp, M.J. Semmens, R.M. Hozalski, Water Res. 37 (2003)2905.
[17] I. Panagiotakis, D. Mamais, M. Pantazidou, M. Marneri, M. Parapouli, E.Hatziloukas, V. Tandoi, J. Hazard. Mater. 149 (2007) 582.
18] F. Aulenta, A. Pera, S. Rossetti, M. Petrangeli Papini, M. Majone, Water Res. 41(2007) 27.
19] B. Skadberg, S.L. Geoly-Horn, V. Sangamalli, J.R.V. Flora, Water Res. 33 (1999)1997.
20] R.K. Goel, J.R.V. Flora, Environ. Eng. Sci. 22 (2005) 440.21] S.R. Guiot, R. Kuhn, M.J. Levesque, R. Cimpoia, Water Sci. Technol. 55 (2007)
465.
23] B.S. Ballapragada, H.D. Stensel, J.A. Puhakka, J.F. Ferguson, Environ. Sci. Technol.31 (1997) 1728.
24] D.E. Fennell, J.M. Gossett, Environ. Sci. Technol. 32 (1998) 2450.25] Y. Yang, P.L. McCarty, Environ. Sci. Technol. 32 (1998) 3591.26] F. Aulenta, A. Catervi, M. Majone, S. Panero, P. Reale, S. Rossetti, Environ. Sci.
Technol. 41 (2007) 2554.27] J.G. Zeikus, Bacteriol. Rev. 41 (1977) 514.28] W.E. Balch, G.E. Fox, L.J. Magrum, C.R. Woese, R.S. Wolfe, Microbiol. Rev. 43
(1979) 260.29] F. Aulenta, M. Majone, P. Verbo, V. Tandoi, Biodegradation 13 (2002) 411.30] K.B. Gregory, D.R. Bond, D.R. Lovley, Environ. Microbiol. 6 (2004) 596.31] K.B. Gregory, D.R. Lovley, Environ. Sci. Technol. 39 (2005) 8943.32] X. Hu, B.S. Brunschwig, J.C. Peters, J. Am. Chem. Soc. 129 (2007) 8988.33] N. Sonoyama, T. Sakata, Environ. Sci. Technol. 33 (1999) 3438.34] G. Fiori, P.R. Mussini, S. Rondinini, A. Vertova, Ann. Chim. 91 (2001) 151.35] G. Fiori, S. Rondinini, G. Sello, A. Vertova, M. Cirja, L. Conti, J. Appl. Electrochem.
35 (2005) 363.36] S. Rondinini, P.R. Mussini, P. Muttini, G. Sello, Electrochim. Acta 46 (2001) 3245.37] S.B. Rondinini, P.R. Mussini, F. Crippa, G. Sello, Electrochem. Commun. 2 (2000)
491.38] Z. Liu, E.A. Betterton, R.G. Arnold, Environ. Sci. Technol. 34 (2000) 804.39] G. Chen, E.A. Betterton, R.G. Arnold, W.P. Ela, J. Appl. Electrochem. 33 (2003)
161.40] M.A. Petersen, T.C. Sale, K.F. Reardon, Chemosphere 67 (2007) 1573.41] S.R. Al-Abed, Y. Fang, Environ. Eng. Sci. 24 (2007) 842.42] Y. Fang, S.R. Al-Abed, Environ. Eng. Sci. 24 (2007) 581.43] S.R. Al-Abed, Y. Fang, Chemosphere 64 (2006) 462.