kinetics and deactivation in the methanol synthesis … alam kinetics and deactivation in the...
TRANSCRIPT

Chemical EngineeringJune 2011Hilde Johnsen Venvik, IKPAnders Holmen, IKP
Submission date:Supervisor:Co-supervisor:
Norwegian University of Science and TechnologyDepartment of Chemical Engineering
Kinetics and Deactivation in theMethanol Synthesis Reaction
Mahmud Alam


Mahmud Alam
Kinetics and Deactivation in the Methanol Synthesis Reaction
Master’s Thesis 2011
Trondheim, June 2011
Academic Supervisor: Professor Hilde J. Venvik and Professor Anders Holmen
Norwegian University of Science and Technology
Faculty of Natural Sciences and Technology
Department of Chemical Engineering


NTNU Faculty of Natural Sciences and Technology
Norwegian University of Science Department of Chemical Engineering
and Technology
Masters Thesis
Title: Kinetics and deactivation in methanol synthesis
Keywords: Methanol Synthesis, Kinetics , deactivation
Author: Mahmud Alam Carried out through: Spring 2011
Supervisor: Professor Hilde J. Venvik Professor Anders Holmen
Number of pages: 105 Main report: 61 Appendix: 44
Abstract:
This study is highlighting the synthesis of methanol by using Cu-based ( 2 3/ /Cu ZnO Al O )
catalyst and synthesis gas, which consists a mixture of CO, CO2, H2, N2 and CH4. The catalyst
was prepared as per the procedure described by the ICI and characterized by performing X-ray
diffraction and Nitrogen adsorption/desorption. Experiments were carried out for the methanol
synthesis at 80 bar pressure as well as at 255ºC temperatures and found very good
reproducibility. The deactivation of the prepared catalyst was studied by using laboratory based
fixed bed reactor. The experimental result showed that the prepared catalyst was highly stable
and there was no deactivation of the catalyst up to 240 hours of the reaction period of time. The
effect of the composition of feed gas (i.e., synthesis gas) on the activation energy of methanol
synthesis was measured at specific conditions of pressure and contact time. However, the
maximum 3CH OHr was observed whenever the ratio of 2 /H CO was 2. The higher production of
methanol was 2.084 g/h, which was observed at specific pressure, temperature and contact time
of feed in the experiment.
I declare that this is an independent work according to the regulations of Norwegian University
of Science and Technology.
Date and Signature:21/06/2011


Preface
This thesis has been prepared as a partial fulfillment of the Master of Science at the
Department of Chemical Engineering, Faculty of Natural Sciences and Technology,
Norwegian University of Science and Technology, Trondheim, Norway. The relevant all
works in order to prepare Masters Thesis were carried out during the period of January to
June 2011.
The entire work relevant to the thesis was supervised by Professor Hilde J. Venvik and co-
advised by Professor Anders Holmen, Department of Chemical Engineering, Faculty of
Natural Sciences and Technology, Norwegian University of Science and Technology,
Trondheim, Norway.
A CD-ROM, containing all data files obtained from the experimental work is attached with
the thesis.
Trondheim, June 2011
Mahmud Alam


Acknowledgement
Foremost, I would like to express my sincere gratitude to my supervisor Professor Hilde J.
Venvik, Department of Chemical Engineering, Faculty of Natural Sciences and Technology,
Norwegian University of Science and Technology, Trondheim, Norway for her continuous
support to my experimental work and also for her kind patience, motivation, enthusiasm as
well as her immense knowledge to organize my laboratory work. I also expressed my special
thanks to her to allow me as a member of the catalysis research group.
I would also like to thank Xuyan Kim Phan a PhD student at the Chemical Engineering
Department (NTNU) for her continuous guidance and support to the experimental work.
Special thanks to Mr. Ayob Esmaelpour, master student at the Chemical Engineering
Department (NTNU) for his help on methanol synthesis setup and encouragement. By using
this opportunity, I would like to thanks to all employees at the laboratory of the Department
of Chemical Engineering, NTNU for the enormous support to me during the study period.
Last but not the least; I would like to thank my wife Mrs Sarmin and our little angle Master
Noshin for their sacrificing a lot during my study period and inspiring me to accomplish the
study in due time.


LIST OF FIGURES.......................................................................................................................................... III
LIST OF TABLES............................................................................................................................................. V
LIST OF SYMBOLS AND ABBREVIATIONS ...................................................................................................... VI
1 INTRODUCTION ................................................................................................................................... 1
2 METHANOL PRODUCTION IN PAST‐A BRIEF OVERVIEW ........................................................................ 3
3 METHANOL SYNTHESIS ........................................................................................................................ 4
3.1 CHEMISTRY OF METHANOL SYNTHESIS ............................................................................................................ 4 3.2 CONVERSION OF SYNTHESIS GAS TO METHANOL ............................................................................................... 4
4 METHANOL SYNTHESIS CATALYST ........................................................................................................ 5
4.1 CU/ZNO‐AL2O3 CATALYSTS ......................................................................................................................... 5 4.2 CATALYSTS WITH ZIRCONIUM (ZR)................................................................................................................. 6 4.3 PD‐BASED CATALYSTS.................................................................................................................................. 7 4.4 OTHER CATALYST ....................................................................................................................................... 7
5 METHANOL SYNTHESIS TECHNOLOGIES................................................................................................ 8
5.1 THE CONVENTIONAL ICI’S 100‐ATM METHANOL SYNTHESIS PROCESS................................................................. 8 5.2 HALDOR TOPSOE A/S LOW‐PRESSURE METHANOL SYNTHESIS PROCESS ............................................................... 9 5.3 KVAERNER METHANOL SYNTHESIS PROCESS .................................................................................................... 9 5.4 KRUPP UHDE’S METHANOL SYNTHESIS PROCESS ............................................................................................ 10
6 THERMODYNAMIC OF METHANOL SYNTHESIS ................................................................................... 12
7 KINETICS OF METHANOL SYNTHESIS................................................................................................... 15
7.1 RATE EXPIRATION OF METHANOL SYNTHESIS .................................................................................................. 15 7.2 ACTIVATION ENERGY OF METHANOL SYNTHESIS .............................................................................................. 17 7.3 THE ORDER OF REACTION ........................................................................................................................... 18
8 SYNTHESIS GAS FOR METHANOL ........................................................................................................ 19
9 CHARACTERIZATION OF CATALYST MATERIALS................................................................................... 21
9.1 X‐RAY DIFFRACTION .................................................................................................................................. 21 9.2 NITROGEN ADSORPTION/DESORPTION.......................................................................................................... 22
10 EXPERIMENTAL.............................................................................................................................. 25
10.1 METHANOL SYNTHESIS CATALYST................................................................................................................ 25 10.1.1 Catalyst Preparation................................................................................................................... 25 10.1.2 Catalyst Characterization ........................................................................................................... 25 10.1.2.1 X‐ray diffraction ..................................................................................................................... 25 10.1.2.2 Nitrogen Adsorption/Desorption............................................................................................ 26 10.1.3 Catalyst Reduction...................................................................................................................... 27
10.2 METHANOL EXPERIMENTAL SETUP .............................................................................................................. 27 10.2.1 Reactors...................................................................................................................................... 28 10.2.2 Product analysis.......................................................................................................................... 28
11 HEALTH, ENVIRONMENT AND SAFETY ............................................................................................ 30
11.1 SET‐UP RISK ASSESSMENT........................................................................................................................... 30 11.2 RISK CONCERNING WITH CARBON MONOXIDE................................................................................................. 31 11.3 RISK CONCERNING WITH METHANOL ............................................................................................................ 31
12 RESULTS AND DISCUSSIONS ........................................................................................................... 32

12.1 METHANOL SYNTHESIS CATALYST................................................................................................................. 32 12.1.1 Catalyst characterization............................................................................................................ 32
12.2 EXPERIMENTS.......................................................................................................................................... 34 12.2.1 Activity Test ................................................................................................................................ 34 12.2.2 Kinetics of Methanol Synthesis ................................................................................................... 37 12.2.3 The order of the methanol formation reaction .......................................................................... 42
13 CONCLUSIONS ............................................................................................................................... 44
14 REFERENCES .................................................................................................................................. 45
APPENDICES............................................................................................................................................... 48

List of figures
Figure 5‐1 A schematic of ICI’s Low‐Pressure methanol synthesis process [3] ......................................8 Figure 5‐2 A schematic of Haldor Topsoe A/S Low‐Pressure methanol synthesis process [3]....... Error!
Bookmark not defined. Figure 5‐3 A schematic of Kvaerner Low‐Pressure methanol synthesis process [6]. ...........................10 Figure 5‐4 A schematic of Krupp Uhde methanol synthesis process [29]. ...........................................11 Figure 6‐1 Degree of Conversion of CO against Reaction Pressure at 25ºC [30]..................................12 Figure 6‐2 the comparison of the activities of Liquid phase LP201 and C302 at a space velocity of
3000 / .catml g h [31]. ...........................................................................................................................13
Figure 6‐3 Degree of Conversion of CO against Reaction Temperature at 80 bar pressure [30]. ........13 Figure 6‐4 Influence of temperature and pressure on CO conversion at a space velocity of 3000
/ .catml g h [31]. ....................................................................................................................................14
Figure 7‐1 the reaction scheme for the synthesis of methanol and water gas shift reaction [33] ......15 Figure 7‐2 the reaction scheme for the synthesis of methanol and reverse water gas shift reactions.
rds, rate determining step [33]. ............................................................................................................16 Figure 7‐3 Parameter Values for the steady state kinetic model [34]..................................................17 Figure 7‐4 the lnk is plotted versus the inverse of the temperature...................................................18
Figure 8‐1 outlet equilibrium methanol concentration as function of the inlet mole fraction of 2H ,
CO and 2CO . .........................................................................................................................................19
Figure 9‐1 BET Adsorption Isotherm [42] .............................................................................................23 Figure 10‐1 a scheme of the synthesis of methanol catalyst................................................................26 Figure 10‐2Catalyst reduction before the reaction in Fixed Bed reactor .............................................27 Figure 10‐3 A fixed bed reactor configuration......................................................................................28
Figure 12‐1 XRD for of 2 3/ /Cu ZnO Al O which was produced by 2‐steps co‐precipitation followed
ICI procedure.........................................................................................................................................32
Figure12‐2 Conversion of CO and CO+ 2CO as a function of time on stream in fixed bed reactor
when deactivation test is done by 2nd batch of Catalyst. Conditions: contact time 103 3. /catms g cm ,
pressure of 80 bars and temperature of 255ºC. Synthesis gas compositions were
2 2 2/ / /H CO CO N = 65/25/5/5 .........................................................................................................34
Figure 12‐3 Conversion of CO as a function of time on stream in fixed bed reactor for 1st and 2nd
batch of ICI catalysts. Conditions: contact time 103 3. /catms g cm , pressure of 80 bars and
temperature of 255ºC. Synthesis gas compositions were 2 2 2/ / /H CO CO N = 65/25/5/5..............36
Figure 12‐4 Arrhenius diagrams of the pseudo‐first order reaction ( ln k Vs1000
T) for different feeds.
Conditions: Pressure=80 bar and Contact time 103 3. /catms g cm ......................................................37
Figure 12‐5 exhibited the apparent activation energy corresponding to the partial pressure of CO
( COP ) in feed gas and it was observed that the apparent activation energy was increased with
increasing partial pressure of CO ( COP ) in feed gas. a COE VsP Conditions: Pressure=80 bar,
Temperature= 240ºC and Contact time 103 3. /catms g cm..................................................................38

Figure 12‐6 2
2 2
CO COa
CO CO H
P PE Vs
P P P
. Conditions: Pressure=80 bar, Temperature= 240ºC and Contact
time 103 3. /catms g cm ..........................................................................................................................39
Figure 12‐7 3
2./CH OH Cat
Hr mol g hVs
CO ratio. Conditions: Pressure=80 bar, Temperature= 240ºC and
Contact time 103 3. /catms g cm ...........................................................................................................40
Figure 12‐8 3 ./CH OH Catr mol g hVs 2
2 2
CO CO
CO CO H
P P
P P P
. At Pressure=80 bar, Temperature= 240ºC and
Contact time 103 3. /catms g cm . ..........................................................................................................41
Figure12‐9 : ln COr Vs ln COP . Conditions: assuming 2HP constant in Feed‐3 and Feed‐5 ...................42
Figure12‐10: 2
ln Hr Vs2
ln HP . Conditions: assuming COP constant in Feed‐1 and Feed‐5 ..................43
Figure A‐ 1:Process Diagram of the Methanol Synthesis Experimental Setup .....................................49
Figure A‐ 2:Calibration Curve for 2H ...................................................................................................51
Figure A‐ 3: Calibration Curve for 2N ..................................................................................................51
Figure A‐ 4: Calibration Curve for CO....................................................................................................52
Figure A‐ 5: Calibration Curve for 2CO ................................................................................................52
Figure A‐ 6: Calibration Curve for 4CH ...............................................................................................52
Figure A‐ 7: Calibration Curve for Methylformate................................................................................53 Figure A‐ 8: Calibration Curve for Methanol.........................................................................................53 Figure A‐ 9: Calibration Curve for Ethanol ............................................................................................53 Figure A‐ 10: Calibration Curve for Propanol........................................................................................54 Figure A‐ 11: Calibration Curve for Butanol ..........................................................................................54 Figure A‐ 12: Calibration Curve for 3‐Hexanon.....................................................................................54 Figure A‐ 13: Calibration Curve for Synthesis Gas. ...............................................................................55 Figure A‐ 14: Calibration Curve for Helium Gas ....................................................................................55 Figure A‐ 15: Calibration Curve for Hydrogen Gas................................................................................56
Figure G‐ 1: certificate of VTL safety Course.........................................................................................88 Figure G‐ 2: Above documents shows that I did a gas course 6th Sept, 2010 .......................................91

List of tables
Table 10‐1: the chemicals that are used for the synthesis of ICI methanol catalyst ............................25 Table 12‐1: BET result ...........................................................................................................................33 Table 12‐2: The activation energy of methanol synthesis for different feeds at the specific conditions
of pressure and contact time and the partial pressure of corresponding feed ...................................38
Table 12‐3: productivity of methanol (3 ./CH OH Catr mol g ) with corresponding to the feed gas
compositions.........................................................................................................................................40

List of Symbols and Abbreviations
MTPD Metric Ton per Day
MeOH Methanol ∆H298 Change of standard enthalpy of formation at 298 K BASF Badische Anilin and Soda Fabrik ICI Imperial Chemical Industries Limited XRD X-Ray Diffraction λ Wavelength θ The angle between the incoming x-rays and the normal to reflecting lattice plane η An integer called the order of the reflection β Peak Width k rate constant BET Brunauer Emmett Teller E1 The heat of adsorption EL Heat of adsorption second and higher layer Na Avogadros number V The mole volume of adsorbent WGS Water Gas Shift reaction HES Health Environment and Safety GC Gas Chromatography

1 Introduction
The greenhouse effect has been recognized worldwide to be an important and critical issue
and a number of countermeasures are proposed to reduce the effect of green house. The
continuous emission of carbon dioxide in the air has been identified as one of the major
causes of green house effect and therefore, catalytic hydrogenation of carbon dioxide to
produce chemical and fuels has received much attention as one of the most promising
mitigation options. In particular, methanol production by hydrogenation of carbon dioxide
has been considered as a mean to reduce carbon dioxide emission, but the greater challenge
is related to the availability of potential source of hydrogen [1].
The production of methanol is around 40 million tons per year in the world [2]. The
production rate is increasing 4% annually. Methanol has traditionally been used as feed for
production of a range of chemicals such as acetic acid ( 3CH COOH ) and formaldehyde
( HCHO ). In recent years, methanol is also used for synthesis of others chemical, for
example, DME (dimethyl-ether) and olefins and other fuels. The most of the methanol is
produced from natural gas and especially in Middle East, the industrial infrastructure have
been established in areas where natural gas is available and cheap. In China, the methanol
is produced from coal where natural gas is not available. There is doubt that in near future,
natural gas can be used for the continuous production of methanol due to its uncertain
availability [3]. The capacity of methanol industries has increased considerably during the
last decade. In 1996, a world scale methanol plant with a capacity of 2500 MTPD was
started up in Tjeldbergodden, Norway. However, now a day, several plants are in operation
with higher capacity for methanol production throughout the world [2].
Methanol is a colourless liquid with boiling point of 65ºC and it can mix with organic
liquids as well as with water. Therefore, it is often used as a solvent for domestic and
industrial applications. Due to its beneficial physical properties, like low freezing
temperature, it is used as a refrigerant. Moreover, methanol has been used as clean fuel that
produces less pollution and thus it can be considered as an important alternative fuel. The
technology for commercial methanol production has been available since the early of the
20th century, considering its potential usage it is an intense research of interest for scientists

to prepare better catalysts, which would enable the synthesis reaction in a cost-effective
manner with sustainable production [3].
To save the earth from the energy crisis in future, technologist must pay attention to the
fundamental aspects of the process design in order to improve the efficacy of the process.
A small improvement in energy and process efficiency, can being a large benefit to the
commercial production. The new research should emphasize the several issues related to
heat and mass transfer, thermodynamics, kinetics, reactor design, modelling, process
control, optimization and energy integration [3].
In the light of circumstances mentioned above, the major aim of the thesis is to prepare
highly stable catalyst in order to synthesis of methanol in a cost effective manner with
ensuring sustainable production. Considering the aim of this study, the major objectives of
the study is to: (i) measure the deactivation of catalyst in the synthesis process of methanol,
(ii) quantify the activation energy of methanol synthesis, and (iii) measure the maximum
production by using the ratio of H2/CO.

2 Methanol production in past-a brief overview
In 1923, the methanol was first produced by the BASF in Leuna, Germany. Although, in
some researchers claimed that G. Partort, a French Portent, was the first inventor of
methanol, who produced oxygenated hydrocarbon in 1921 by reacting a gaseous mixture
of CO and 2H . In the beginning of the 20th century, in Germany, a research and
development programme was initiated to produce hydrogen and synthesis gas at high
pressure that are commonly known as ’Hydrerungs verfahrung’. However, such
intervention led to develop the Haber-Bosch ammonia synthesis, the hydro-
desulphurization process (Bergius, 1920), the Fischer-Tropsch discovery (Hans Fischer
and Franz Tropsch, 1923) and the invention of methanol production from synthesis gas [4].
The development of the methanol synthesis process was started by M. Pier in February
1922 and he used the ammonia synthesis equipment of BASF [4].
Crude methanol was first produced in 1923 and at that time, the methanol had been
produced from wood distillate (i.e., a pyrolysis process with low yields and intensive feed-
stock handling). The high pressure process that was developed by the BASF, operated at
up to 250-350 bar pressure and 320-450ºC acted as dominant technology over the last 45
years for methanol synthesis. The prior of that time, the synthesis gas produced from
German coal/lignite was contaminated with chlorine and sulphur and considered as a
strong catalyst poisons. Then a relatively poison resistance catalyst ( 2 3/ZnO Cr O ) was
developed and a cupper based catalyst was applied to produce methanol, but the
experiment failed to show any significant output. Later on during 1960s, the Imperial
Chemical Industries (ICI) improved the use of Cu-based catalyst concept and they
concluded that Zn is the perfect dispersant for Cupper and enhance the reactivity of
catalyst at lower operating conditions [4].

3 Methanol synthesis
3.1 Chemistry of methanol synthesis
The catalytically conversion of synthesis gas to methanol has been commercially available
since 1923 and at that time, the first commercial plant for methanol synthesis was built by
the BASF. The technology of the methanol production has gone through constant
improvements and major modifications, among which the biggest change was undoubtedly
a transition from high-pressure synthesis to low-pressure synthesis. The production of
methanol is the heterogeneous catalytic conversion of synthesis gas that originates from
natural gas or coal. The composition of synthesis gas varies widely, depending on the
process of conversion as well as the type of feed stocks [5].
3.2 Conversion of synthesis gas to Methanol
The synthesis gas is a mixture of hydrogen, carbon dioxide, carbon monoxide as principle
components and consist methane and steam as secondary components. The synthesis gas is
typically produced via steam reforming of natural gas, gasification or partial oxidation of
coal, gasification of bio-mass, gasification of municipal solid wastes, coke oven gas etc.
The most popularly used commercial catalyst is 2 3/ /CuO ZnO Al O which is synthesized
by co-precipitation process. In such a catalyst formulation, alumina ( 2 3Al O ) is a support
that can be replaced by other similar support, for example, 2ThO . The major stoichiometric
reactions involved in the commercial conversion to produce methanol are mentioning
bellow:
CO2+3H2=CH3OH+H2O rH = -90.8 KJ/mol (3.2.1)
CO+2H2= CH3OH rH = -49.6 KJ/mol (3.2.2)
CO+ H2O= CO2+ H2 rH = -41.0 KJ/mol (3.2.3)
Both of reaction (3.2.1) and (3.2.2) are exothermic and resulting in a reduction in volume.
The conversion reaction is, therefore, favored by low temperature and high pressures.
Today’s synthesis process is done at low pressure, some even close to the pressure at
which the steam reforming production of synthesis gas operate. So this process consumes
less energy than the high pressure ones as the synthesis gas compression is a costly
operation [5].

4 Methanol synthesis catalyst
The first commercial plant of methanol synthesis was build by the BASF in 1923 and
2 3/ZnO Cr O was used as catalyst, which operated at 300ºC and 200 atm pressures. After
that, the process was successfully operated over a long period of time and later that process
was replaced by more efficient and low pressure methanol synthesis technology. In 1927,
the Commercial Solvent Corporation and DuPont were started the experiment for methanol
synthesis and in the same year, DuPont established a commercial plant at Belle to produce
methanol and ammonia by using coal as a raw material, while 2 3/ZnO Cr O or 2 3 /Cr O CuO
was used as catalyst [3].
The first patent for methanol synthesis on cupper based catalysts was reported in 1921 by
Patart [4], but due to low thermal resistance of this catalyst it was not used as
commercially approximately for half a century. It was also suspected that the sulphur
poisoned the cupper based catalyst. When ICI was developed a process to produce
synthesis gas almost free of impurities by steam reforming of naphtha, the use of copper
based catalysts was received much attention for methanol synthesis process (Humphreys et
al. 1974), The modern ICI methanol process was developed initially based on ternary
catalysts containing CuO, ZnO and 2 3Cr O under 250-270 ºC at 50-100 bar pressure.
However, another study indicated that the alumina rather than 2 3Cr O increased life time of
catalyst and therefore, low-pressure catalyst contain alumina as a third components rather
than 2 3Cr O [7]. Now a day, there are several catalysts allowing the production of almost
pure methanol from synthesis gas under the low pressure (< 100 atm). These catalysts are
containing cupper and a mixture of oxides such as ZnO - 2 3Al O or ZnO – 2 3Cr O . Other
oxides have also been used as catalyst support [8].
4.1 Cu/ZnO-Al2O3 catalysts
The 2 3/ /Cu ZnO Al O catalyst is widely used in the commercial process plant of methanol
synthesis and 2 3Cr O based catalyst also found to be used in commercial production of
methanol [9]. The 2 3/ /Cu ZnO Al O catalyst is very active for CO rich feed, but the
activeness of this catalyst decreased with increasing the amount of 2CO in the feed [10].
However, the utilization of 2CO is typically important due to environmental regulations

and thus many studies have been carried out in order to find a catalyst that is active with
2CO -rich feed. Therefore, Cu-based catalyst has been studied with metal additives [10].
The /Cu ZnO catalyst performs well with CO rich feed, but the loss of activity in the 2CO
rich feed occurred due to the presence of water, which is produced along with methanol in
2CO hydrogenation [11]. Water is also identified as a responsible one to decrease the
action of 2 3/ /Cu ZnO Al O observed in another study [12]. By using different feed
compositions, it was observed that the methanol yield decreases and water yield increases
with increasing the rate of 2CO in feed, and the presence of water accelerated the
deactivation of the Cu/ZnO-based catalysts and added silica into the catalyst can slow
down the effect of water and allow the methanol synthesis from the 2CO -rich feed [13].
Cu/ZnO catalysts with alcohol promoters (such as ethanol, propanol and buthanol) at low
pressure (i.e., 3.0 MPa) and 443K for methanol synthesis has also been reported, the
reaction at low temperature led to high conversion of CO from 50% to 80 % [14]. The
influence of Zn, Cr and Co oxide additives were tested into Cu-based catalysts and
observed significant improvements in the catalyst activities that increases the water gas
shift reaction in methanol synthesis. No significant changes in activity were observed when
CoO [15] added. Nevertheless, 2SiO and its influence to the activity of the Cu-based
catalysts have been studied [16] and the addition of 2SiO increased the catalytic activity for
the methanol synthesis from 2CO [17].
4.2 Catalysts with Zirconium (Zr)
It has been recognized that Zirconium is one of the potential support materials to Cu-based
catalysts, since it has improved the activity of catalysts for methanol synthesis from both
CO and 2CO [18]. Manganese (Mn) promoted Cu/Zn/Zr catalysts have been investigated
and compared with 2 3/ /Cu ZnO Al O catalyst showed that zirconium influenced the catalyst
activity and whenever added Mn to Cu/Zn/Zr catalyst that increased the rate of methanol
production [19]. In addition, it was observed that Mn promoted cupper/zinc/zirconia
catalyst exhibited remarkable high stability and high selectivity although crude methanol
did not contain any by-products other than water [19].

Comparing the use of Cu, Ag and Au in the catalysts (M/ (3ZnO/ 2ZrO ) for methanol
synthesis, where M denoted as Cu, Ag or Au, the catalyst with Cu showed the highest
activity in methanol synthesis [20]. But in the case of 2/Cu SiO catalyst with Zr increased
the rate of methanol synthesis with increasing the load of Zr [16]. The comparison study
between 2/Cu SiO and 2 2/ /Cu ZrO SiO in the hydrogenation of CO revealed that the rate
of methanol synthesis is enhanced when Zr added in the catalyst [21] and the evaluation of
the same catalysts with Ti in the experiment indicated that the addition of Ti has similar
influence as Zr [22]. However, to test the influence of adding Ce to 2ZrO , it was found that
1 2/ x xCu Ce Zr O catalysts varying with Ce content and the adding Ce increased the activity
of the catalyst for methanol synthesis through hydrogenation of 2CO [23]. The promoting
action of Ga oxide to the catalyst for methanol synthesis from 2CO was investigated based
on 2 2 3/ / /Cu ZnO ZrO Al O and 2 2 3 2 3/ / / /Cu ZnO ZrO Al O Ga O catalysts and the findings
of this study concluded that the activities of these catalysts were higher than the activities
of the traditional Cu-based catalysts [11].
4.3 Pd-based catalysts
At high temperature, the deactivation of Cu/ZnO catalyst occurs quickly in methanol
synthesis reaction but Pd supported Cu-based catalyst shows more stability [24]. The
preparation methods that influence to obtain best structure of Pd-ZnO catalysts was studied
[25]. The influence of different oxide additives to supported Pd catalyst was also tested and
the outcomes of this research proved that the catalyst of Pd supported by CeO2 showed
more activity and long lifetime for methanol synthesis from CO2 similar as 2 3La O and
TiO2 [26]. The comparison between Cu-based catalyst and Pd-based catalyst in presence of
Ce in both catalysts exhibited that Cu-based catalyst equally performed similar as Pd-based
catalyst [27].
4.4 Other Catalyst
Methanol synthesis from CO by using Cu-based catalyst with potassium (K) conformed
that the K acts as a promoter during the methanol production when prepared catalyst was
selective for methanol synthesis, although CO2 had a negligible effect on the performance
of the catalyst to the applied pressure regime [28].

5 Methanol synthesis technologies
The systematic synthesis of methanol has a history of about 100 years dating back to the
early 1900’s, when methanol was produced from destructive distillation of wood and thus
known as wood alcohol. In 1923, the BASF developed a high pressure catalytic
commercial methanol synthesis process operated at 250 to 350 atm pressures and ever
since, the high pressure methanol technology was adopted popularly by a number of
industries almost 50 years. In 1963, ICI developed a low pressure methanol synthesis
process, which was operated at 50 to 100 atm pressures [3].
5.1 The Conventional ICI’s 100-ATM methanol Synthesis Process
In the mid-1900’s, ICI reduced the methanol synthesis pressure by using catalyst but the
process was not ideal for large capacity of production unit due to the necessity of large
equipment under low pressure condition which ultimately caused slower rate of reaction.
Then the effort was made to find out better materials and equipment design as well as
search for a suitable catalytic system that would be more active at 100 atm pressure. As a
consequent of such initiative in 1972, ICI recommended 2 3/ /Cu ZnO Al O catalyst system
that ultimately enhanced and bring modification in the designing of energy efficient
process as well as the optimization process. A process diagram is given in bellow. Along
with efficient design, management of catalyst life has always been the principle issue of
the process maintenance and enhancement [3].
Figure 5-1 A schematic of ICI’s Low-Pressure methanol synthesis process [3]

5.2 Haldor Topsoe A/S Low-Pressure Methanol Synthesis Process
This process is designed to produce methanol from natural or associated gas feed stocks,
utilizing a two-step reforming process to generate feed synthesis gas mixture for the
methanol synthesis. Associated gas is a natural gas produced with crude oil from the same
reservoir. It is claimed that the total investment for this process is lower than the
conventional flow scheme which based on straight steam reforming of natural gas
approximately 10%, even after considering an oxygen plant [29]. The two-stage reforming
usually conducted by primary reforming, in where, a preheated mixture of natural gas and
steam are reacted and in the secondary reforming stage, the exit gas further converted with
the aid of oxygen. The energy integration process was done as shown in Figure 5-2 in
bellow. The process technology is suitable for smaller to larger methanol plants up to
10,000 TPD [3].
Figure 5-2 A schematic of Haldor Topsoe A/S Low-Pressure methanol synthesis process [3].
5.3 Kvaerner Methanol Synthesis Process
This process was developed by the Kvaerner Process Technology/Synetix, UK based on a
low-pressure methanol synthesis process and two-stage steam reforming, similar to the
Haldor Topsoe process. Figure 5-3 shows a schematic of the Kvaerner methanol synthesis

process. The feed gas stock may be natural or associated gas. In this process, however,
carbon dioxide can be used as a supplementary feedstock in order to adjust the
stoichiometric ratio of the synthesis gas. However, this process is more suitable for regions
with high availability of low-cost gas such as CO2 - rich natural gas and financial
restrictions of low capital investment. There are a number of commercial plants currently
in operation based on this design and their typical sizes range from 2000 to 3000 MTPD
[6].
Figure 5-3 A schematic of Kvaerner Low-Pressure methanol synthesis process [6].
5.4 Krupp Uhde’s Methanol Synthesis Process
The process, developed by Krupp Uhde GmbH based on the low-pressure synthesis
process of methanol as well as steam reforming for synthesis gas generation. A unique
feature of this process is its flexibility of feedstock choice, which includes natural gas,
liquefied petroleum gas, or heavy naphtha [29]. The steam reformer is uniquely designed
with a top fired box type furnace with a cold outlet header system. The steam reforming
reaction usually takes place heterogeneously over a nickel catalyst system. The reformer
effluent gas that contain H2, CO, CO2, and CH4 are allowed to cool from 880°C to ambient
temperature eventually, and most of the heat content is recovered by steam generation,
BFW preheating, preheating of demineralized water, and heating of crude methanol for
three-column distillation. Eleven plants have been built until 2005 using such technology.
Figure 5-4 showing a schematic of Krupp Uhde’s methanol synthesis process [29].

Figure 5-4 A schematic of Krupp Uhde methanol synthesis process [29].

6 Thermodynamic of methanol Synthesis
Normally methanol is synthesized by catalytic hydrogenation of CO.
CO+2H2= CH3OH rH = -91.07 KJ/mol ………... (6.1)
Two more reactions are taken place during the methanol production process as mentioned
in bellow:
CO2+3H2=CH3OH+H2O rH =-52.8 KJ/mol……………. (6.2)
CO2+3H2= CO+ H2O rH = -41.12 KJ/mol…………. (6.3)
All the above reactions are reversible and exothermic, produce heat during the reaction.
The equation 6.3 is known as Water Gas Shift reaction. Moreover, the reactions are
exothermic and reduce in the volume of product. The higher yield of methanol is obtained
at high pressure and low temperature [30].
Figure 6-1 Degree of Conversion of CO against Reaction Pressure at 25ºC [30].
As seen in Figure 6-1, degree of conversion of CO is increased with increasing of pressure,
but for pressure higher than 10 bar the conversion degree is 90% or greater, and for p=80
bar almost an overall conversion is reached [30].

Figure 6-2 the comparison of the activities of Liquid phase LP201 and C302 at a space velocity of 3000
/ .catml g h [31].
The activities of the LP201 (a new catalyst denoted LP201) and commercial C302
(manufactured in China) catalysts in a mechanical agitated slurry reactor are compared.
The result is shown in Figure 6-2. It can be seen that the activity of the LP201 catalyst is
much higher than that of the commercial C302 catalyst. When LP201 is used, its synthesis
gas conversion at the lower pressure of 4 MPa is higher than that of C302 at 6 MPa. This
indicates that the LP201 catalyst is suitable for the large scale synthesis of methanol in a
slurry reactor [31].
Figure 6-3 Degree of Conversion of CO against Reaction Temperature at 80 bar pressure [30].
When the reactor temperature is increased the corresponding decrease of conversion grade
is observed (Figure 6-3). In accordance with thermodynamic data, low reaction

temperatures provide high conversion grades. Definitely, in an isothermal reactor the
excess reaction heat have to be removed through a proper exchange [30].
Figure 6-4 Influence of temperature and pressure on CO conversion at a space velocity of 3000
/ .catml g h [31].
Figure 6.4 shows the influence of temperature and pressure on CO conversion in a slurry
reactor. There exist different phenomena at high and low pressure conditions. When the
pressure is relatively low, with an increase in temperature, the change in CO conversion is
not monotonic, and the trend is that of an increase followed by a decrease, with the
maximum conversion appearing near 250 ºC.

7 Kinetics of Methanol Synthesis
7.1 Rate expiration of methanol synthesis
The commercial productions of methanol have been started since 1923, but still there are
open question about the mechanism and kinetics of methanol synthesis reaction [32]. The
mechanisms for the catalytic conversion of 2 2/ /CO CO H feed into methanol over the
catalyst 2 3/ /Cu ZnO Al O are well known and a number of kinetics equations have been
proposed. The mechanisms are based on the following reactions [33].
CO2+3H2=CH3OH+H2O ……………………………………………………… (7.1.1)
CO+2H2= CH3OH …....……………………………………………………….. (7.1.2)
Here 1K and 2K are the equilibrium constants for reaction 7.1.1 and 7.1.2
The water gas shift reaction is
CO+ H2O= CO2+ H2………………………………………………………… (7.1.3)
Figure 7-1 the reaction scheme for the synthesis of methanol and water gas shift reaction [33]

Figure 7-2 the reaction scheme for the synthesis of methanol and reverse water gas shift reactions. rds,
rate determining step [33].
The value of 1K and 3K are taken from Graaf et al (1986) [34].
10 1
3066log 10.592K
T …………………………………………………….. (7.1.4)
10 3
2073log 1/ 2.029K
T ……………………………………………… (7.1.5)
Here T in K [34].
According to Graaf et al (1986) [34], the kinetics expression for methanol synthesis and water gas
shift reaction as in below:
Model A:
2 3
2 2 2
2 2
3
2 2
2 2 2 2
2 2
' '5 2 3 4 3
1
3
8 9
[1 ]
(1 ( )( ) )
H O CH OHa H CO H
H COCH OH
H O H OH H H O H O
H H
P PK K K K K P P
P P Kr
K PK P K P
K K K P
Model B:
2
2
2 2
2 2
2 2 2 2
2 2
'1 3
8 9
[1 ( )]
(1 ( )( ) )
H O COCO
CO HRWGS
H O H OH H H O H O
H H
P PK P K
P Pr
K PK P K P
K K K P

Here pressure in bar and reaction rates in mol/Kg cat.-s [35]
Figure 7-3 Parameter Values for the steady state kinetic model [34].
7.2 Activation energy of methanol synthesis
For measurement of kinetics study, the experiment is carried out at a study-state conditions
and external mass and heat transfer limitations are always negligible. In fixed bed reactor,
the rate is evaluated by the numerically solving of mass balance equation. According to
Graaf et al 1988[35], assuming the equation 7.1.2 reaction is rate controlling step for
methanol synthesis, the kinetics rate expiration can be written as in bellow [36].
2 3 2
3
2 2 2 2 2 2
' 3/2 1/2 0
( ) 1/2 1/2
[ / ( )]
(1 )( ( / ) )CO CO H CH OH H eq
CH OH COCO CO CO CO H H O H H O
K K f f f f Kr
K f K f f K K f
……………………. (7.2.1)
Here, if is fugacity of particular gas [36].
This simplification equation is obtained by assuming the first order reaction. It is already
assume that the methanol is formed from CO and water adsorption is almost negligible and
adsorption of CO is predominated then 2 2 2 2
1/2 1/2( / )H H O H H Of K K f and
2 21CO CO CO COK f K f [37]. So the equation 7.2.1 become as
3
3 2
2
( ) 0( )CH OH
CH OH CO HCO H eq
fr K f
f f K …………………………………………….. (7.2.2)
The fugacity of gas mixture can be replaced by partial pressure of gas mixture
3
3 2
2
( ) 0( )CH OH
CH OH CO HCO H eq
Pr K P
P P K ……………………………………………... (7.2.3)

According to Arrhenius,
0 exp( )aEk k
RT
…………………………………………………………. (7.2.4)
0ln ln aEk k
RT
………………………………………………………….. (7.2.5)
Figure 7-4 the lnk is plotted versus the inverse of the temperature.
7.3 The order of reaction
The power rate law can be expressed as in below
CA B nn nA B Cr kP P P …………………………………………..………………………… (7.3.1)
If we consider that the methanol formation is taken place according to the reaction 7.1.2,
the power rate low can be written as
2
2
H COn n
H COr kP P ……………………………………………………………………… (7.3.2)
Or
2 2ln ln ln lnH H CO COr k n P n P …………………………………………………. (7.3.3)
Here 2Hn is the order of reaction with respect to 2H , COn is the order of reaction with
respect to CO and k is known as rate constant [39].

8 Synthesis Gas for Methanol
Methanol is produced from the catalytic reaction of synthesis gas. The composition of
synthesis gas has great influenced on the production of methanol. The stoichiometry for
methanol synthesis from synthesis gas as in given below [38].
2 2
2
H COM
CO CO
………………………………………………………………………... (8.1)
Here, M is stoichiometric number [38].
The value of M required for methanol synthesis is 2 but commercially desirable value
of NS is 1.95 to 2.15 [38].
Normally the most of synthesis gas is produced by steam reforming of natural gas. As
shown, the reaction 7.1.1 and 7.1.2 are involved in methanol synthesis reaction. It should
be desirable to minimize the amount of 2CO in the synthesis gas for several reasons.
According to reaction 7.1, the low content of 2CO in synthesis gas, results more reactive
mixture and the % of 2CO should be at least about 2%. Moreover less % of 2CO in
synthesis gas, lower consumption of hydrogen and less production of water in methanol
synthesis process. The production of methanol with lower content of water can eliminate
the distillation process of crude methanol [38].
Figure 8-1 outlet equilibrium methanol concentration as function of the inlet mole fraction of 2H , CO
and 2CO .

Notice that the highest methanol concentration is for a mixture of only 2H and CO at a
ratio of 2:1 (stoichiometric ratio). The solid curve is the methanol equilibrium without
2CO in the gas mixture [40].
As shown in Figure 8-1, the maximum amount of methanol is obtained when synthesis gas
contain only a pure mixture of hydrogen and carbon-monoxide. On the principle, the
maximum amount of methanol can be produced from mixture of hydrogen and carbon-
monoxide with minor amount of 2CO and it should be noted that methanol is produced
from 2CO not from CO [40].
The composition of synthesis gas depends on the feedstock from which it is produced.
When naphtha is used as feedstock, the stoichiometry ration is approximately right but
when methane is used as feed, it produces excess of hydrogen. This excess hydrogen can
be minimized either burn as fuel or can be added carbon dioxide with synthesis gas [41].

9 Characterization of catalyst materials
The characterization of catalyst is one of the most important fields of study in catalysis
process. In the heterogeneous catalyst, the metal particles are dispersed on the support
materials and activity, selectivity and stability of catalyst depend on the size of metal and
size distribution in the crystalline structure of catalyst. Therefore, the studies of these
parameters are the major tasks for the researcher and this process is known as catalyst
characterizations [39].
9.1 X-ray diffraction
X-ray diffraction (XRD) is one of the most used techniques in catalyst characterization and
it is applied to measure the crystalline phase inside the catalyst by using lattice structure
parameters and getting the idea about particle size identification. When X-ray is passing
through a crystalline material, the patterns produce information about size and shape of
unit cell [39].
In XRD, the source of X-ray is known as x-ray fluorescence and it is consist of a target and
an anode that is bombarded with high energy electrons emitted from a cathode. As a result,
the anode emits x-ray from two processes. Firstly, the electrons in K-shell are emitted by
the electron beam from the cathode and create a continuous background spectrum of
bremsstrahlung. Thereafter, the core hold in K shell and filled up by transition of electrons
which reduce the higher energy levels of L and M shells. This process lead to generation of
X-ray photons [40].
XRD occurs in the elastic scattering of x-ray photons by atoms in a periodic lattice. The
scattered monochromatic x-rays that are in phase give constructive interference. In
catalyst, there is a 3D periodic lattice arrangement of atoms that allow each set of atom
planes to form diffracted beams. From diffraction of x-ray in these crystals the space
between the planes can be determined using Bragg’s law as shown in equation 9.1.1. The
lattice spacing determined from Bragg’s law are characteristic for a certain compounds
[40].
nλ= 2d sinθ ; n=1, 2,………………………………………………………………… (9.1.1)

Where, is the wavelength of X-rays, d is the distance between two lattice planes, θ is the
angle between the incoming x-rays and the normal to the reflecting lattice plane and n is an
integer called the order of the reflection.
In practice, the x-ray diffraction pattern of a powered sample can be measured with a
stationary x-ray source and a movable detector. The intensity of diffracted radiation is then
scanned as function of angle 2θ between the incoming and the diffracted beams. This setup
enables to determine of the lattice spacing’s and consequently crystallographic phases
present in the crystal. Also particles size can be estimated from XRD patterns. The crystal
size is related to peak width and can be measured by the Scherrer formula as mentioned
below: [40]
cos
kL
…………………………………………………………………….. (9.1.2)
In this equation, L is a measurement for the dimension of the particles in the direction
perpendicular to the reflecting plane, k is a constant, is the X-ray wavelength, is the
peak width and θ is the angle between the beam and the normal to the reflecting plane.
For catalyst characterization, XRD can provide clear and unequivocal structure
information on particles (size and shape), which are enough large for XRD analysis. XRD
has a limitation that it cannot detect particles either too small or amorphous [40].
9.2 Nitrogen adsorption/desorption
BET is a famous theory for physical adsorption of gas molecules on a solid surface and it
is very useful technique to determine the specific surface area of material. In 1938, Stephen
Brunauer, Paul Hugh Emmett, and Edward Teller published the BET theory for the first
time. BET consists of the first initials of their family names [42]. This theory is the
extension of the Langmuir theory which is based on the theory of monolayer adsorption
and BET theory is based on the multi-layer adsorptions and consist the following
hypotheses: (i) gas molecules physically adsorb on a solid in layers infinitely; (ii) there is
no interaction between each adsorption layer; (ii) the Langmuir theory can be applied to
each layer.
BET expressed an equation as in following:

00
1 1 1/
[( / ) 1] m m
CP P
V P P V C V C
…………………………………………………
(9.2.1)
Here 0P and P are the equilibrium and the saturation pressure of the adsorbate at the
temperature of adsorption, V is the volume adsorbed , mV is the volume of the monolayer
and C is the BET constant which is expressed as
1exp LE EC
RT
………………………………………………………………... (9.2.2)
Where 1E the heat of adsorption for 1st is layer and LE is for second and higher layer. This
equation is the based on heat of liquefaction [42].
The BET adsorption isotherm based on the equation (9.2.1) as in below
Figure 9-1 BET Adsorption Isotherm [42]
The value of slope A=1
m
C
V C
and intercept I=
1
mV C of the line are used to calculate the
monolayer adsorption mV and constant C.
mV =1
A I…………………………………………………………………………… (9.2.3)
C=1A
I ……………………………………………………………………………… (9.2.4)
The BET is widely used in surface science for the calculation of surface area of solid by
physical adsorption of gas molecules [43].
.m a
BET Total
V N SS
V ……………………………………………………………………. (9.2.5)

.BET TotalBET
SS
a …………………………………………………………………….. (9.2.6)
Here aN = Avogadro’s number, V= The mole volume of adsorbent gas, a = the mole
weight of adsorbed [43].

10 Experimental
10.1 Methanol Synthesis Catalyst
10.1.1 Catalyst Preparation
There are many methods for preparation of Cu-based mixed oxide catalysts. In this sub-
chapter, the preparation of Cu-based ( 2 3/ /CuO ZnO Al O ) catalyst that was prepared by 2-
steps co-precipitation followed by ICI procedure is descript in the Figure 10-1 in bellow
[43].
The chemicals that are used for the synthesis of ICI methanol catalyst are below:
Table 10‐1: the chemicals that are used for the synthesis of ICI methanol catalyst
Name of Chemical Chemical Formula
Compound
Sodium Aluminate
Nitric acid
Zinc Nitrate Tetrahydrate
Sodium Carbonate
Cupric Nitrate Trihydrate
N.B: De-ionized water is used for preparation of catalyst.
10.1.2 Catalyst Characterization
The prepared ICI methanol catalysts were characterized by XRD and BET.
10.1.2.1 X-ray diffraction
The XRD were studied for fresh Catalyst, reduced catalyst and used catalyst powder that
was shown in Figure 12-1.The X-ray patterns of catalyst were obtained using a D8 Focus
diffractometer from Bruker AXS with CuKα-radiation. The D8 Focus apparatus was
equipped with a 2 theta/theta gonimeter and a Lynx Eye detector. The rotation was
activated.
2NaAlO
3HNO
3 2 2( ) .4Zn NO H O
2 3Na CO
3 2 2( ) .3Cu NO H O

Figure 10-1 a scheme of the synthesis of methanol catalyst
10.1.2.2 Nitrogen Adsorption/Desorption
BET surface area of Cu-based catalyst that was measured, recorded in the micrometrics
TriStar 3000 instrument (surface area and porosity analyzer). This experiment was
performed by PhD student Xuyen Kim Phan. The amount of catalyst placed on the sample
holder was approximately 0.0476 g. The catalyst was outgassed at 300 ºC around 6 hours
and then it was analyzed by BET instrument.

10.1.3 Catalyst Reduction
The catalyst reduction (before reaction) was done in tubular fixed bed reactor and this
process was performed around 17 hours.
In catalyst reduction process, first the fixed bed reactor was filled with 1gm (around)
catalyst and then it was joined with gas flow line. A thermo well and a thermocouple were
placed in the fixed bed reactor and reduction was carried out with the flow of synthesis gas
containing the composition 2 2 2: : : 25 : 5 : 65 :5CO CO H N . The temperature of fixed bed
reactor was controlled by Eurotherm temperature controller and a Kanthal oven. A
programmed was set in Eurotherm controller in such a way that the controller could be
control the fixed bed reactor temperature around the whole time of reduction period that
was aspect according to reduction conditions.
The reduction procedure for catalyst is shown in Figure 10-2 and the reduction was started
from room temperature at 16 ºC and the increasing in temperature was done by ramping.
The whole reduction process was done at 1 bar pressure.
Time in h
0 2 4 6 8 10 12 14 16 18
Tem
per
atu
re in
C
0
50
100
150
200
250
300
Catalyst Reductiom
Figure 10-2Catalyst reduction before the reaction in Fixed Bed reactor
10.2 Methanol Experimental Setup
The experimental setup for methanol synthesis is designed by Hamidreza Bakhtiary and
Xuyan Kim Phan as a part of their PhD work. This setup is build-up for conversion of
synthesis gas into methanol and all the equipments are designed in such a way so that it
can be worked at a pressure up to 100 bars and temperature up to 500 ºC. All parts in the
rig are made of Stainless steel and the piping is mainly in ¼” with svagelok fitting. The
Process diagram of methanol synthesis setup is shown in Figure-Appendix 1. There are
three feed lines, one for Synthesis gas, one for hydrogen and other for nitrogen (other inert
gas). The synthesis gas line is used for supply of feed gas into the reactor; 2H and 2N
lines are used for leak test. All the three lines are used at high pressure around 80 bars. The
lines are also equipped with manometers (a manometer is a device for measuring the
pressure of fluid), manual valves, filters and ventilation valves. Bronkhorst digital mass
flow meters are also be fitted in lines to control the feed gas flow and the pressure. The
temperate in the reactor is controlled by digital Eurotherm controller which is connected
with a furnace around the fixed bed reactor. The feed is preheated near the reaction
temperature by heating band insulated around the feed line before the reactor.
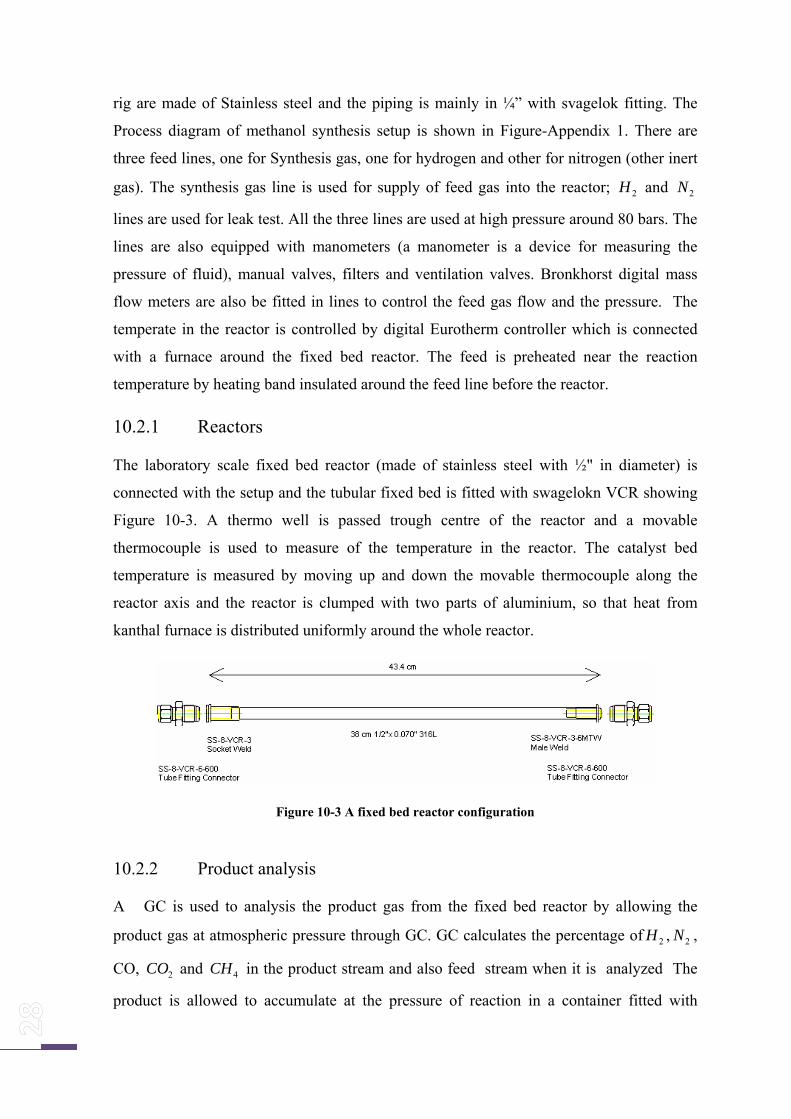
10.2.1 Reactors
The laboratory scale fixed bed reactor (made of stainless steel with ½" in diameter) is
connected with the setup and the tubular fixed bed is fitted with swagelokn VCR showing
Figure 10-3. A thermo well is passed trough centre of the reactor and a movable
thermocouple is used to measure of the temperature in the reactor. The catalyst bed
temperature is measured by moving up and down the movable thermocouple along the
reactor axis and the reactor is clumped with two parts of aluminium, so that heat from
kanthal furnace is distributed uniformly around the whole reactor.
Figure 10-3 A fixed bed reactor configuration
10.2.2 Product analysis
A GC is used to analysis the product gas from the fixed bed reactor by allowing the
product gas at atmospheric pressure through GC. GC calculates the percentage of 2H , 2N ,
CO, 2CO and 4CH in the product stream and also feed stream when it is analyzed The
product is allowed to accumulate at the pressure of reaction in a container fitted with

cooling water system bellow the reactor and it is allowed to pass in another container at
atmospheric pressure where it is collected.

11 Health, Environment and safety
11.1 Set-up risk assessment
The risk assessment is the most important tools for a chemical process operation that we
use for the systematic identification of issues linked to HES. A risk assessment must be
carried out prior to the commencement of a specified chemical process and again when the
process is modified. This risk assessment is done to remove or control the risk factors
during the operational period of the chemical process.
So through risk assessment conducted prior to a concrete task or process, measures
designed to eliminate or control the factors representing a potential risk can be
implemented before the work starts. It also offers the possibility of increased control over
factors/conditions that need to be checked during the actual carrying out of the
task/process. The details descriptions and necessary data about HES are given in Appendix
C.
As indicated in the NTNU goals of Health, Environment and Safety, the work and learning
environment must support and promote its users capacity to work and learn, safeguard their
health and well-being and protect them against work-related illnesses and accidents. HES-
related problems should be solved consecutively at the lowest possible level in order to
prevent employees or students from developing work related illnesses or suffering work
related accidents and to prevent the activities from having a negative impact on the
environment.
As described below activities is associated with several HES issues on the methanol
synthesis set-up.
• Transport and mounting of the gas bottle
• Modification and maintained of experimental set-up
• Leak testing and reactor mounting
• Reaction experiment
• Experiment shut-down and dismounting of reactor
• Cleaning parts
• Handling of catalyst

For existing risk assessments, safety measures, rules and procedures are as in below-
• In the methanol synthesis set-up, a well established toxic and flammable gas
alarm system is exist so for any incidence, the gas syncing system will able to
inform and necessary action concerning the HES can be taken according to rules
and procedure.
• For personal protection, safety goggle is very important in the VTL lab and it is
mandatory for every one who is working in side the lab
11.2 Risk concerning with carbon monoxide
The carbon monoxide is colorless and odorless gas, it comes as synthesis gas component
for methanol synthesis. The chemical company YARA PRAXAIR is supplier of synthesis
gas in our lab. The carbon monoxide is extremely flammable and toxic gas. It may cause
harm to the unborn child and danger of serious damage to health by prolonged exposure
through inhalation. This gas should be keeping away from the source of ignition and
should be store in safe area as the condition of flammable gas storage. It needs to use in
well ventilated area and in case of fire, this gas should be allowed to burn if flow cannot be
shut off immediately and need to immediate contact responsible person. It has not any
significant effect or critical hazards environmentally. This gas should be disposed as
hazardous waste. Before use, special instruction should be read [44].
11.3 Risk concerning with methanol
The methanol is very dangerous poison and its vapor also harmful to human. It may cause
blindness if swallowed and harmful if inhaled or absorbed through skin. It may causes
irritation to skin, eyes and respiratory tract. It also affects central nervous system and liver.
The liquid and vapor of methanol is flammable. Personal protection is necessary like
goggles, apron, vent hood and protective gloves in used area. This liquid is slightly toxic
for aquatic life and it causes degradation in soil and air. This gas should be disposed as
hazardous waste. This gas/liquid should be keeping away from the source of ignition and
should be store in safe area as the condition of flammable gas/liquid storage. It needs to
use in well ventilated area. [44]

12 Results and discussions
12.1 Methanol synthesis catalyst
12.1.1 Catalyst characterization
The experiment was done on the Cu-based catalyst that was prepared by 2-steps co-
precipitation followed ICI procedure.
12.1.1.1 X-Ray Diffraction
Figure 12-1 shows the XRD diffractograms for Cu-based catalyst in fresh (blue line in
top), reduced (pink line in middle) and used (red line in bottom) form. In the fresh sample,
ZnO is the main component present in crystal form and also small crystallites of CuO were
detectable.
Figure 12-1 XRD for of 2 3/ /Cu ZnO Al O which was produced by 2-steps co-precipitation followed
ICI procedure.
It should be noted that the broad peaks are the indication of the small crystallites and the
no peak means vary small crystallites or amorphous phase. The reduction of CuO to Cu
and possible of some sintering or agglomeration of Cu crystallites during 17 h of
Fresh Catalyst
Reduced Catalyst
Used Catalyst

reduction period of time were also seen and during 240 h of reaction time, the Cu
crystallites were not growth so much because the peaks were not sharpened.
12.1.1.2 Adsorption/Desorption
The BET surface area for 2 3/ /Cu ZnO Al O catalyst was measured by 2N adsorption and
desorption. The result is shown in Table 12.1
Table 12‐1: BET result
Catalyst BETS
2 /m g Pore width nm
2nd batch 2 3/ /Cu ZnO Al O 178 11.18282
In Table 12.1, the BET result showed that the prepared Cu-based catalyst has high surface
area with porosity and possibly well mixed of 2 3CuO ZnO Al O . The ZnO and 2 3Al O
stabilize Cu and are structural promoters of the catalyst.

12.2 Experiments
The activity test of 2 3/ /Cu ZnO Al O were performed in the Fixed Bed Reactor and before
the reaction started, the catalyst was reduced with synthesis gas around 17 h (as describe in
sub-chapter-10.1.3)
12.2.1 Activity Test
The catalyst activity test was performed in fixed bed reactor abound 240 h and during this
period, the conversion of CO and CO+ 2CO were measured by product gas analysis from
fixed bed reactor by continuous online GC operation. Conditions were as contact time
103 3. /catms g cm , pressure of 80 bars and temperature of 255ºC. Synthesis gas
compositions were 2 2 2/ / /H CO CO N = 65/25/5/5 and the result is showing in Figure 12-2
and the result showed the almost constant conversion during 240 h reaction period of time.
TOS in h
0 50 100 150 200 250 300
% C
onve
rsio
n
0
20
40
60
80
100
% Conversion of CO% Conversion (CO+CO2)
Figure12-2 Conversion of CO and CO+ 2CO as a function of time on stream in fixed bed reactor
when deactivation test is done by 2nd batch of Catalyst. Conditions: contact time 103 3. /catms g cm ,
pressure of 80 bars and temperature of 255ºC. Synthesis gas compositions were 2 2 2/ / /H CO CO N =
65/25/5/5
It should be mentioned that the details about the calibration of GC for both of gas phase
and liquid phase are given in appendix (A1.1.3 and A 1.4) and all the mass balance are
done based the equations (A1.1 and A 1.2) also given in the appendix.

Figure 12-1 shows the XRD diffractograms for Cu-based catalyst in fresh, reduced and
used form. As mentioned, the fresh Cu-based catalyst power showed to be amorphous with
peak of ZnO and CuO on overlapping. After reduction, the clear peak of ZnO and Cu were
observed and used catalyst was similar with that of the reduced. This supports our
conclusion that the deactivation of catalyst was negligible during the reaction time (240 h)
[45].
As we seen in the Figure 12-2, the total conversion of ( 2CO CO ) was lower than the
conversion of CO. According to Yang Y, et al. (2010) [48], WGS (water gas shift) reaction
also occurs over the same catalyst and under the same conditions of methanol formation
simultaneously and WGS reaction is faster than methanol formation. So because of faster
WGS reaction, we experienced more 2CO in the outlet of the fixed bed reactor compare to
the inlet.
Coteron, A., et al, (1994), proposed a model for methanol synthesis from the synthesis gas
and according to their experiments, methanol is produced by hydrogenation of 2CO and
the role of CO is the removal of oxygen adsorbed on the catalyst surface as a result of the
reactions between 2CO and 2H [46]. This is the consistent with our experimental
observation for having more 2CO in the outlet stream of the fixed reactor.
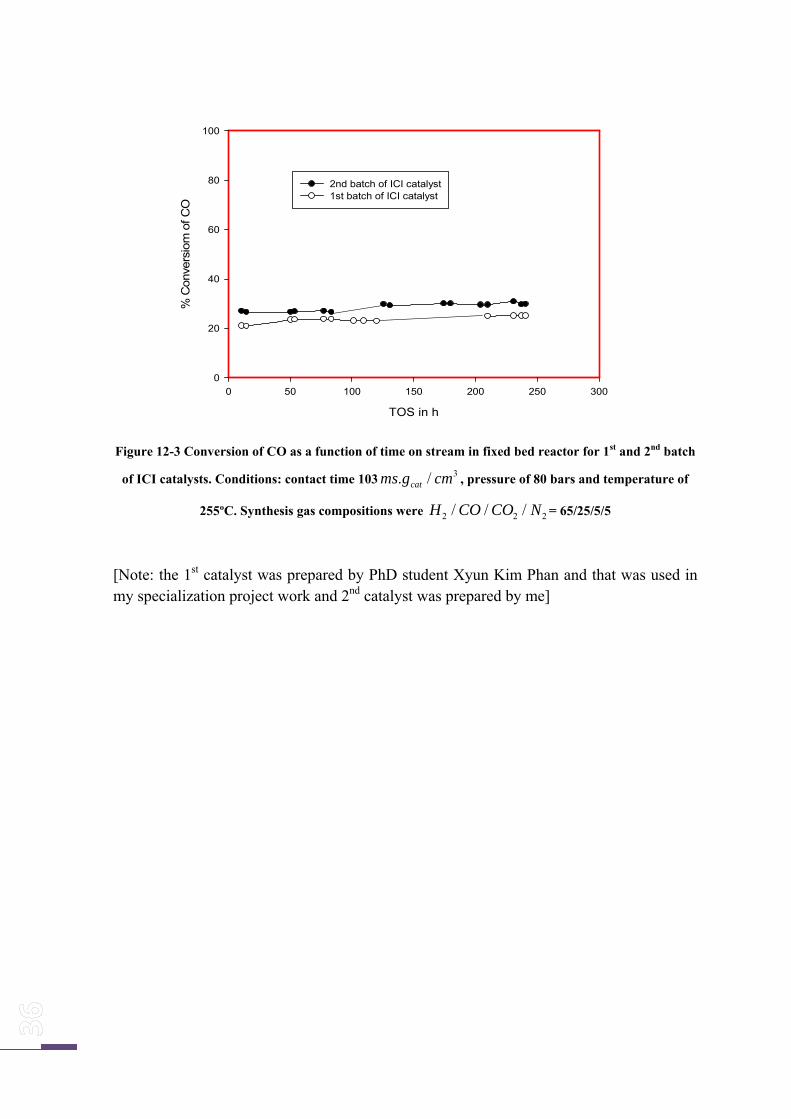
A comparison of activity between 1st batch and 2nd batch ICI catalysts are shown in Figure
12-3 as in below. Conditions were as contact time 103 3. /catms g cm , pressure of 80 bars
and temperature of 255ºC. Synthesis gas compositions were 2 2 2/ / /H CO CO N =65/25/5/5.
The result exhibited that the 2nd batch was more active compare to the 1st batch catalyst and
actually it is depend on the efficiency of catalyst making.
TOS in h
0 50 100 150 200 250 300
% C
onv
ers
iom
of C
O
0
20
40
60
80
100
2nd batch of ICI catalyst1st batch of ICI catalyst
Figure 12-3 Conversion of CO as a function of time on stream in fixed bed reactor for 1st and 2nd batch
of ICI catalysts. Conditions: contact time 103 3. /catms g cm , pressure of 80 bars and temperature of
255ºC. Synthesis gas compositions were 2 2 2/ / /H CO CO N = 65/25/5/5
[Note: the 1st catalyst was prepared by PhD student Xyun Kim Phan and that was used in my specialization project work and 2nd catalyst was prepared by me]

12.2.2 Kinetics of Methanol Synthesis
The kinetic study for methanol synthesis was carried out in this experimental thesis work
and it has been observed that the apparent activation energy of methanol formation
depends on the different feed gas compositions Figure 12-4 and Table 12.2.
The Figure-12.4 in below is shown lnk Vs 1000/T in K (Kelvin) at the conditions as
pressure 80 bar and contact time 103 3. /catms g cm for different feeds with different feed
compositions. The Arrhenius diagrams for the pseudo-first order reaction shown in Figure
12-4 were done based on the materials balance, assumptions and equations that were
mentioned in sub-chapter 7.2. The details about the feed compositions are given Table
12.2.
1000/T in K
1,88 1,90 1,92 1,94 1,96 1,98 2,00 2,02 2,04
lnk
8,5
9,0
9,5
10,0
10,5
11,0
11,5
12,0
Feed-1Feed-2Feed-3Feed-4Feed-5
Figure 12-4 Arrhenius diagrams of the pseudo-first order reaction ( ln k Vs1000
T) for different feeds.
Conditions: Pressure=80 bar and Contact time 103 3. /catms g cm
The activation energy was calculated for different feeds according to the Arrhenius
Equation (Equation 7.2.5) that was mentioned in sub-chapter 7.2 and the corresponding
Arrhenius plots give apparent activation energy for methanol synthesis are shown in
Table 12.2.
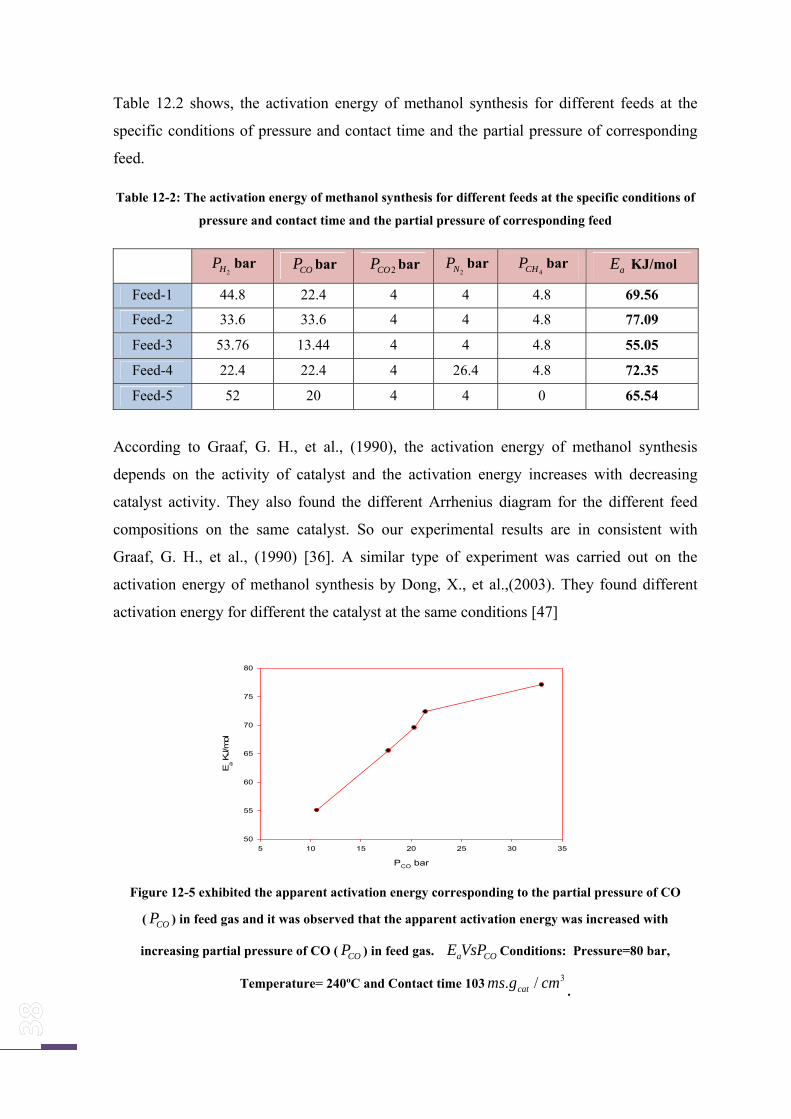
Table 12.2 shows, the activation energy of methanol synthesis for different feeds at the
specific conditions of pressure and contact time and the partial pressure of corresponding
feed.
Table 12-2: The activation energy of methanol synthesis for different feeds at the specific conditions of
pressure and contact time and the partial pressure of corresponding feed
2HP bar COP bar 2COP bar
2NP bar 4CHP bar aE KJ/mol
Feed-1 44.8 22.4 4 4 4.8 69.56
Feed-2 33.6 33.6 4 4 4.8 77.09
Feed-3 53.76 13.44 4 4 4.8 55.05
Feed-4 22.4 22.4 4 26.4 4.8 72.35
Feed-5 52 20 4 4 0 65.54
According to Graaf, G. H., et al., (1990), the activation energy of methanol synthesis
depends on the activity of catalyst and the activation energy increases with decreasing
catalyst activity. They also found the different Arrhenius diagram for the different feed
compositions on the same catalyst. So our experimental results are in consistent with
Graaf, G. H., et al., (1990) [36]. A similar type of experiment was carried out on the
activation energy of methanol synthesis by Dong, X., et al.,(2003). They found different
activation energy for different the catalyst at the same conditions [47]
PCO bar
5 10 15 20 25 30 35
Ea KJ/
mol
50
55
60
65
70
75
80
Figure 12-5 exhibited the apparent activation energy corresponding to the partial pressure of CO
( COP ) in feed gas and it was observed that the apparent activation energy was increased with
increasing partial pressure of CO ( COP ) in feed gas. a COE VsP Conditions: Pressure=80 bar,
Temperature= 240ºC and Contact time 103 3. /catms g cm.

Figure 12-5 exhibited the apparent activation energy corresponding to the partial pressure
of CO ( COP ) in feed gas and it was observed that the apparent activation energy was
increased with increasing partial pressure of CO ( COP ) in feed gas.
A similar trend was observed in Figure 12-6 and when the pressure fraction of 2CO CO
was increased, the apparent activation energy also increased.
(PCO+PCO2)/(PCO+PCO2
+PH2)
0.2 0.3 0.4 0.5 0.6
Ea
, kJ/
mo
l
50
55
60
65
70
75
80
Figure 12-6 2
2 2
CO COa
CO CO H
P PE Vs
P P P
. Conditions: Pressure=80 bar, Temperature= 240ºC and Contact
time 103 3. /catms g cm .
From our experimental dates, we were tried to fine out a relationship between activation
energy aE and partial pressure of CO ( COP ) or the pressure fraction of ( 2CO CO ) as
shown in Figure 12-5 and Figure12-6 respectively. As seen in the mentioned figures, the
activation energy aE was increased with increasing of both COP and 2
2 2
CO CO
CO CO H
P p
P p P
.
According to Chorkendorff, I., et al., (2007), we found a relationship between activation
energy, reaction order and partial pressure of reactant. As seen, when the partial pressure
of a reactant is increased, the order of reaction corresponding to that reactant is decreased
and activation energy is increased with respect to that particular reactant. Our results were
shown similar trend as explained in the literature [39].

Table 12-3: productivity of methanol (3 ./CH OH Catr mol g ) with corresponding to the feed gas
compositions.
% of 2H % of CO % of 2CO % of 2N %of 4CH 3 ./CH OH Catr mol g
Feed-1 56 28 5 5 6 3.587975
Feed-2 42 42 5 5 6 3.077836
Feed-3 67.2 16.8 5 5 6 3.225209
Feed-4 28 28 5 33 6 1.80249
Feed-5 65 25 5 5 0 3.427915
In Table 12.3 shown that the Feed-4 was exhibited minimum productivity of methanol
formation due to highest inert content. According to Langmuir-Hinshelwood mechanism
for multi-component reactant, when the partial pressure of one component is increased, the
rate constant is also increased [49]. From Table 12.3, Feed-4 was contained 33% of 2N
where as other four feed were contained 5% 2N . As a result we observed lowest rate of
methanol formation which was not similar with other four feeds. So for that cause, we did
not use Feed-4 in the Figure 12-7 and Figure 12-8.
Figure 12-7 displayed the effect of 2 :H CO ratio on the methanol productivity
(3 ./CH OH Catr mol g ) at the conditions as pressure 80 bars, temperature 240 ºC and contact time
103 3. /catms g cm for different feeds and the result shown that the productivity of methanol
was increased up-to a point and then began to decrease with increasing 2 :H CO ratio.
H2/CO ratio
0,5 1,0 1,5 2,0 2,5 3,0 3,5 4,0 4,5
r CH
3OH m
ol/g
Cat.h
3,0
3,1
3,2
3,3
3,4
3,5
3,6
3,7
Figure 12-7 3
2./CH OH Cat
Hr mol g hVs
CO ratio. Conditions: Pressure=80 bar, Temperature= 240ºC and
Contact time 103 3. /catms g cm

Figure 12-7showed, the maximum productivity of methanol was obtained when 2 /H CO
ratio was 2. According to the reference [47], we agreed that methanol is produced from
hydrogenation of 2CO . If methanol is produced from 2CO (according to reaction 7.1.1
which was described in sub-chapter 7.1), for maximum productivity of methanol the
stoichiometric ratio of 2 /H CO should be 3 and for CO the stoichiometric ratio of
2 /H CO should be 2. Yang, Y., et al., (2010) [48] found that the faster RWGS (reverse
water gas shift) reaction only leads to the accumulation of CO rather the methanol
formation when methanol was produced from the mixture of 2CO and 2H . According to
reference [39] for maximum amount of methanol formation from a mixture of CO and,
2H a minor amount of 2CO is used. In practically, our experiment showed that the
maximum productivity of methanol formation was at the ratio ( 2H to CO ratio) of 2 and
the possible explanation was that the WGS reaction could be produced one mole of 2H
during the consumption of one mole of CO. So stoichiometrically need ratio 2 ( 2H to CO
ratio) for maximum production of methanol.
A similar result was observed in Figure 12-7.
(PCO+PCO2)/(PCO+PCO2+pH2
) bar
0,20 0,25 0,30 0,35 0,40 0,45 0,50 0,55 0,60
r CH
3OH m
ol/g
Cat.h
3,0
3,1
3,2
3,3
3,4
3,5
3,6
3,7
Figure 12-8 3 ./CH OH Catr mol g hVs 2
2 2
CO CO
CO CO H
P P
P P P
. At Pressure=80 bar, Temperature= 240ºC and
Contact time 103 3. /catms g cm .

12.2.3 The order of the methanol formation reaction
We have considered the Feed-3 and Feed-5, the partial pressure of 2HP were assumed as
constant and we were plotted ln COr Vs ln COP . According to the power rate equation 7.3.3
shown in sub-chapter 7.3, the resulting slope of the curve exhibited the order of methanol
formation with respect to CO.
y = 1.2358x - 0.2152
R2 = 1
0
0.5
1
1.5
2
2.5
3
3.5
0 0.5 1 1.5 2 2.5 3
lnPCO bar
lnr C
O m
ol/
h
Figure12-9 : ln COr Vs ln COP . Conditions: assuming 2HP constant in Feed-3 and Feed-5
Also we have considered Feed-1 and Feed-5, the partial pressure of COP were assumed as
constant and we were plotted 2
ln Hr Vs2
ln HP . According to the power rate equation 7.3.3
shown in sub-chapter 7.3, the resulting slope of the curve exhibited the order of methanol
formation with respect to 2H . Figure 12.10 and Figure 12.11 showed that the order of
methanol formation with respect to CO was 1.23 and with respect to 2H was 1.1.
It should be mentioned that the conditions for kinetics study were chosen in such a way
that the % conversion of CO was between 10 to 20 because at the higher conversion it was
possible to become at equilibrium conversion of CO and the equilibrium conversion could
be affected the kinetics results.

y = 1.1063x - 0.2551
R2 = 1
0
0.5
1
1.5
2
2.5
3
3.5
4
4.5
0 0.5 1 1.5 2 2.5 3 3.5 4
PH2 bar
r H2
mo
le/h
Figure12-10: 2
ln Hr Vs2
ln HP . Conditions: assuming COP constant in Feed-1 and Feed-5

13 Conclusions
A second batch of 2 3/ /Cu ZnO Al O for methanol synthesis was prepared following the
method patented by ICI. The synthesized catalyst was characterized by using XRD and
BET. The XRD results showed that the fresh catalyst was amorphous with peak of ZnO
and CuO on overlapping and reduced catalyst clear peak with of ZnO and Cu and the used
catalyst was similar with reduced catalyst. BET result exhibited the prepared catalyst has
high surface area with porosity. It was concluded from XRD result and activity test report,
the deactivation of synthesized ICI catalyst was not observed during 240 h of reaction
period of time. The kinetics studies conformed us; (i) the activation energy of methanol
formation was depended on the activity of catalyst as well as the compositions of the feed
gas, (ii) the activation energy was increased with the increasing of the partial pressure of
CO and as well as the pressure fraction of ( 2CO CO ) , (iii) the maximum productivity of
methanol was obtained when the ratio of 2 /H CO was 2, and (iv) the order of the
methanol formation reaction was 1.1 and 1.23 respectively with 2H and CO. Besides that,
our finding with many other literatures supported that methanol is produced by
hydrogenation of 2CO and the role of CO is the removal of oxygen adsorbed on the
catalyst surface as a result of the reactions between 2CO and 2H .

14 References
1. Saito M, Fujitani T, Takeuchi M, Watanabe T (1996) Development of copper/zinc oxide-based multicomponent catalysts for methanol synthesis from carbon dioxide and hydrogen. Applied Catalysis A: General, 138 (2): 311-318.
2. Gedde-Dahl A, Holm-Larsen H (1999) Start-up and initial operation of a 2,400 MTPD methanol plant. Ammonia Plant Saf, 39: 14–23.
3. Lee S (1990) Methanol Synthesis Technology, CRC Press, Boca Raton, FL 4. Haynes W (1948) American Chemical Industry-A History. Von Nostrand Co, Amsterdam,
IV (1923-29): 169. 5. Tijm PJA, Waller FJ, Brown DM (2001) Methanol technology developments for the new
millennium. Applied Catalysis A: General, 221 (1-2):275-282. 6. Lee S, Speight JG, Loyalka SK (2007) Handbook of Alternative Fuel Technologies. CRC
Press (Taylor and Francis Group), Boca Raton, FL. 7. Mark S, Wainwright R, Warwich L, Jan B (1982) Catalysts for methanol synthesis and
method for their production. US Paten: 4349464. 8. Klier K (1982) Methanol synthesis. Advances in Catalysis, 31:243-313. 9. Bradford MCJ, Konduru MV, Fuentes DX (2003) Preparation, characterization and
application of Cr2O3/ZnO catalysts for methanol synthesis. Fuel Processing Technology, 83 (1-3):11-25.
10. Yang C, Ma Z, Zhao N, Wei W, Hu T, Sun Y (2006) Methanol synthesis from CO2-rich syngas over a ZrO2 doped CuZnO catalyst. Catalysis Today, 115: 222-227.
11. Saito M, Takeuchi M, Watanabe T, Toyir J, Luo S, Wu J (1997) Methanol synthesis from CO2 and H2 over a Cu/ZnO-based multicomponent catalyst. Energy Conversion and Management, 38 (1): 403-S408.
12. Nowak P, Lachowska M, Skrzypk J (1991) Influence of water vapour on methanol synthesis over CuO-ZnO-Al2O3 catalyst. Chemical Engineering Science, 46(12): 3324-3325.
13. Wu J, Saito M, Takeuchi M, Watanabe T (2001) The stability of Cu/ZnO-based catalysts in methanol synthesis from a CO2-rich feed and from a CO-rich feed. Applied Catalysis A: General, 218 (1-2): 235-240.
14. Yang R, Yu X, Zhang Y, Li W, Tsubaki N (2008) A new method of low-temperature methanol synthesis on Cu/ZnO/Al2O3 catalysts from CO/CO2/H2. Fuel, 87 (4-5): 443-450.
15. Huang X, Ma L, Wainwright MS (2004), The influence of Cr, Zn and Co additives on the performance of skeletal copper catalysts for methanol synthesis and related reactions. Applied Catalysis A: General, 257 (2): 235-243.
16. Fisher IA, Woo HC, Bell AT (1997) Effects of zirconia promotion on the activity of Cu/SiO2 for methanol synthesis from CO/H2 and CO2/H2. Catalysis Letters, 44 (1-2): 11-17.
17. Choi Y, Futagami K, Fujitani T, Nakamura J (2001) The role of ZnO in Cu/ZnO methanol synthesis catalysts — morphology effect or active site model? Applied Catalysis A: General, 208 (1-2): 163–167.
18. Jung KT, Bell AT (2002) Effects of Zirconia Phase on the Synthesis of Methanol over Zirconia-Supported Copper. Catalysis Letters, 80 (1-2): 63-68.

19. Lachowska M, Skrzypek J (2003) Hydrogenation of carbon dioxide to methanol over Mn promoted copper/zinc/zirconia-catalysts. Paper presented in the 30th International Conference of Slovak Society of Chemical Engineering, May 26-30. Pp: 117
20. Sloczynski J, Grabowski R, Kozlowska A, Olszewski P, Stoch J, Skrzypek J, Lachowska M (2004) Catalytic activity of the M/(3ZnO center dot ZrO2) system (M = Cu, Ag, Au) in the hydrogenation of CO2 to methanol. Applied Catalysis a: General, 278 (1): 11-23.
21. Fisher IA, Bell AT (1998) In Situ Infrared Study of Methanol Synthesis from H2/CO over Cu/SiO2and Cu/ZrO2/SiO2. Journal of Catalysis, 178 (1): 153-173.
22. Schilke TC, Fisher IA, Bell AT (1999) In SituInfrared Study of Methanol Synthesis from CO2/H2on Titania and Zirconia Promoted Cu/SiO2. Journal of Catalysis, 184 (1): 144-156.
23. Pokrovski KA, Rhodes MD, Bell AT (2005) Effects of cerium incorporation into zirconia on the activity of Cu/ZrO2 for methanol synthesis via CO hydrogenation. Journal of Catalysis, 235 (2): 368-377.
24. Zhang Q, Li X, Fujimoto K (2006) Pd-promoted Cr/ZnO catalyst for synthesis of methanol from syngas. Applied Catalysis A: General, 309 (1):28-32.
25. Kim CH, Lee JS, Trimm DL (2003) The Preparation and Characterization of Pd–ZnO Catalysts for Methanol Synthesis. Topics in Catalysis, 22(3-4): 319-324.
26. Tsubaki N, Fujimoto K(2003) Promotional SMSI effect on supported palladium catalysts for methanol synthesis .Topics in Catalysis, 22(3-4): 325-335.
27. Shen WJ, Ichihashi Y, Matsumura Y (2005) Low temperature methanol synthesis from carbon monoxide and hydrogen over ceria supported copper catalyst. Applied Catalysis A: General 282(1-2):221-226.
28. Maack M, Friis JH, Sckerl S, Larsen J H, Chorkendorff I(2003) Methanol synthesis on potassium-modified Cu(100) from CO + H2 and CO + CO2 + H2. Topics in Catalysis 22(3-4):151-160.
29. Petrochemical Processes Special Report (2003). Hydrocarbon Processing 82 (3): 105. 30. Larocca V, Molino A, Petrone MT, Barisano D, Giordano G(2010) Synthesis of methanol
from biomass-derived syngas :Modelling and sizing of a bench-scale reactor. International Journal of Energy & Technology 2 (2): 1-7.
31. Ren F, Li H, Wang D, Wang J(2003) Methanol Synthesis from synthesis gas in a slurry reactor. Chem Soc, Div Fuel Chem 48(2): 922
32. Rozovskii AY, Lin GI (2003) Fundamental of methanol synthesis and decomposition. Topics in Catalysis 22(3-4): 137-150.
33. Bussche KMV, Froment GF (1996) A steady-state model for methanol synthesis and the
water gas shift reaction on a commercial 2 3/ /Cu ZnO Al O . Journal of Catalysis 161(1): 1-
10. 34. Graaf GH, Sijtsema PJ, Stamhuis PJJM, Stamhuis EJ, Joosten GEH (1986) Chemical
equilibrium in methanol synthesis. Chemical Engineering Science 41(11): 2883-2890. 35. Graaf GH, Stamhuis E J, Beenackers AACM (1988) Kinetics of low pressure methanol
synthesis. Chemical Engineering Science 43(12): 3185-3195. 36. Graaf GH, Scholtens H, Stamhuis E J, Beenackers AAC M(1990) Intra-particle diffusion
limitation in low pressure methanol synthesis. Chemical Engineering Science 45(4): 773-783
37. Christopher D, William J(2010) Synthesis gas production and use. US Patent US-7,772,292 B2,
38. Liu J (2004) Advanced electron microscopy characterization of nanostructure heterogeneous catalysts. Microscopy and Microanalysis 10(1): 55-76.

39. Chorkendorff I, Niemantsverdriet J W(2007) Concepts of modern catalysis and kinetics. Wiley-VCH 2nd Edition
40. Moulijn JA (2001) A chemical process technology. Wiley-VCH 41. Niemantsverdriet JW (1993) Spectroscopy in catalysis: An introduction. Wiley-VCH . 42. Brunauer S, Emmett P H ,Teller E(1938) Adsorption of gases in multimolecular layers.
Journal of the American Chemical Society 60 (1): 309-319 43. Cornthwait D(1975) Methanol Synthesis Catalyst. US patent no 3,923,694 44. Safety data sheet,.Yara Praxair AS, P.O Box 23, Haugenstua, N-0915, Oslo, Norway 45. Brunauer S, Emmett P H ,Teller E(1938) Adsorption of gases in multimolecular layers.
Journal of the American Chemical Society 60 (1): 309-319
46. Conteron A, Hayhurst A N (1994) Kinetics of the synthesis of methanol from 2CO H
and 2 2CO CO H over copper-based amorphous catalysts. Chemical Engineering
Science 49(2): 209-221 47. Yang Y, Evans J, Rodriguez A, White G, Liu P(2010) Fundamental studies of methanol
synthesis from 2CO hydrogenation on Cu(111), Cu Clusters and Cu/Zn(0001). Phys.
Chem. Phys. 12: 9909-9917 48. Dong X, Shen B, Zhang H, Lin G, Yuan Y(2003) Study on highly active catalyst and a
once-through process for methanol synthesis from syngas, Journal of Natural Gas Chemistry12(1): 49-55
49. Vannice M A (2005) Kinetics of catalytic reaction. Springer Science.

Appendices
Appendix A: Process Diagram of the Methanol Synthesis Experimental Setup
Appendix A.1: Methanol Experimental Setup
Appendix A.1.1: Reactors
Appendix A.1.2: Product analysis
Appendix A.1.3: Gas Chromatograph Analyses
Appendix A.1.3.1: the calibration of GC for gas phase analysis
Appendix A.1.4: the calibration of GC for liquid phase analysis
Appendix A.1.5: Calibration Curve for Mass flow Controller at Methanol Synthesis
Experimental Setup
Appendix B: Data form the GC Analysis for activation test of catalyst
Appendix C: Health, Environment and safety
Appendix D: Hazardous activity identification process in methanol synthesis rig.
Appendix E: the existing risk assessment analysis data sheet of methanol synthesis experimental set-up
Appendix F: The materials, safety and data sheets for all the gas and chemical are given in bellow
Appendix G: Regarding to the HES I did the following courses and training

Appendix A
Process Diagram of the Methanol Synthesis Experimental Setup
Figure A‐ 1:Process Diagram of the Methanol Synthesis Experimental Setup
Appendix A.1: Methanol Experimental Setup
The experimental setup for methanol synthesis is designed by Hamidreza Bakhtiary and Xuyan
Kim Phan as a part of their PhD work. This setup is build-up for conversion of synthesis gas into
methanol and all the equipments are designed in such a way so that it can be worked at a pressure
up to 100 bars and temperature up to 500 ºC. All parts in the rig is made of Stainless steel and the
piping is mainly in ¼” with svagelok fitting. The Process diagram of methanol synthesis setup is
shown in Figure-Appendix1. There are three feed lines, one for Syngas, one for hydrogen and other
for nitrogen (other inert gas). The syngas line is used for supply of feed gas into the reactor; 2H
and 2N lines are used for leak test. All the three lines are used at high pressure around 80 bars.
The lines are also equipped with manometers (a manometer is a device for measuring the pressure
of fluid), manual valves, filters and ventilation valves. Bronkhorst digital mass flow meters are also
be fitted in lines to control the feed gas flow and the pressure. The temperate in the reactor is
controlled by digital Eurotherm controller which is connected with a furnace around the fixed bed
reactor. The feed is preheated near the reaction temperature by heating band insulated around the
feed line before the reactor.

Appendix A.1.1: Reactors
The laboratory scale fixed bed reactor (made of stainless steel with ½" in diameter) is connected
with the setup and the tubular fixed bed is fitted with swagelokn VCR showing Figure 10-3. A
thermo well is passed trough centre of the reactor and a movable thermocouple is used to measure
of the temperature in the reactor. The catalyst bed temperature is measured by moving up and down
the movable thermocouple along the reactor axis and the reactor is clumped with two parts of
aluminium, so that heat from kanthal furnace is distributed uniformly around the whole reactor.
Appendix A.1.2: Product analysis
A GC is used to analysis the product gas from the fixed bed reactor by allowing the product gas at
atmospheric pressure through GC. GC calculates the percentage of 2H , 2N , CO, 2CO and 4CH in
the product stream and also feed stream when it is analyzed The product is allowed to accumulate
at the pressure of reaction in a container fitted with cooling water system bellow the reactor and it
is allowed to pass in another container at atmospheric pressure where it is collected.
The following formulas are used to measure the % conversion of CO and 2CO as in bellow.
% Conversion of CO: *100COin COoutCO
COin
n nX
n
……………… (A 1.1)
% Conversion of 2CO : 2 2
2
2
*100CO in CO outCO
CO in
n nX
n
…………….. (A 1.2)
The contact time (ms): 3/
( )
cat
Syngas
mW F
cmF
ms
…………………. (A 1.3)
Here COX and 2COX are the Conversion of CO and 2CO respectively. CO in feed gas and
product gas are shown as COinn and COoutn . 2CO in feed and product gas are shown as 2CO inn and
2CO outn respectively. W is the weight of catalyst and F is the feed gas flow rate.
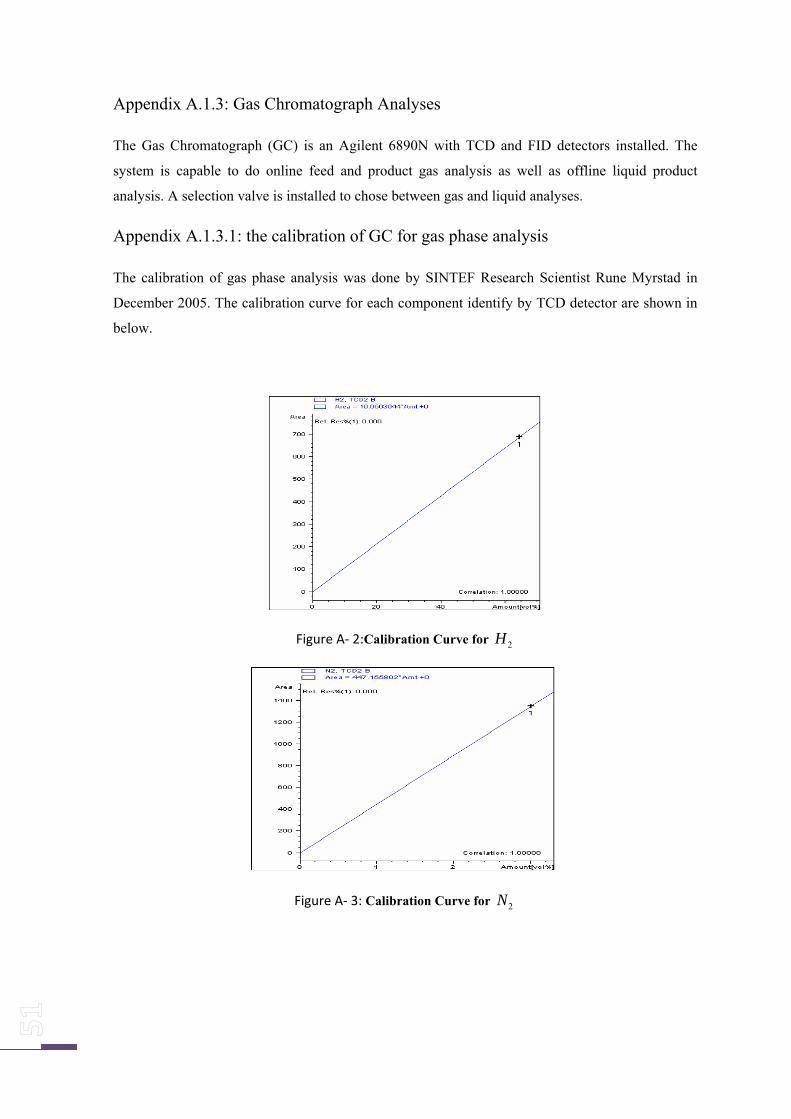
Appendix A.1.3: Gas Chromatograph Analyses
The Gas Chromatograph (GC) is an Agilent 6890N with TCD and FID detectors installed. The
system is capable to do online feed and product gas analysis as well as offline liquid product
analysis. A selection valve is installed to chose between gas and liquid analyses.
Appendix A.1.3.1: the calibration of GC for gas phase analysis
The calibration of gas phase analysis was done by SINTEF Research Scientist Rune Myrstad in
December 2005. The calibration curve for each component identify by TCD detector are shown in
below.
Figure A‐ 2:Calibration Curve for 2H
Figure A‐ 3: Calibration Curve for 2N

Figure A‐ 4: Calibration Curve for CO
Figure A‐ 5: Calibration Curve for 2CO
Figure A‐ 6: Calibration Curve for 4CH

Appendix A.1.4: the calibration of GC for liquid phase analysis
The calibration of liquid phase analysis was done together with PhD student Xuyen Kim Phan and
Hamidreza Bakthiary in February 2008. The GC software calculated the calibration curves for each
compound identify by FID detector are given in below.
Figure A‐ 7: Calibration Curve for Methylformate
Figure A‐ 8: Calibration Curve for Methanol
Figure A‐ 9: Calibration Curve for Ethanol

Figure A‐ 10: Calibration Curve for Propanol
Figure A‐ 11: Calibration Curve for Butanol
Figure A‐ 12: Calibration Curve for 3-Hexanon
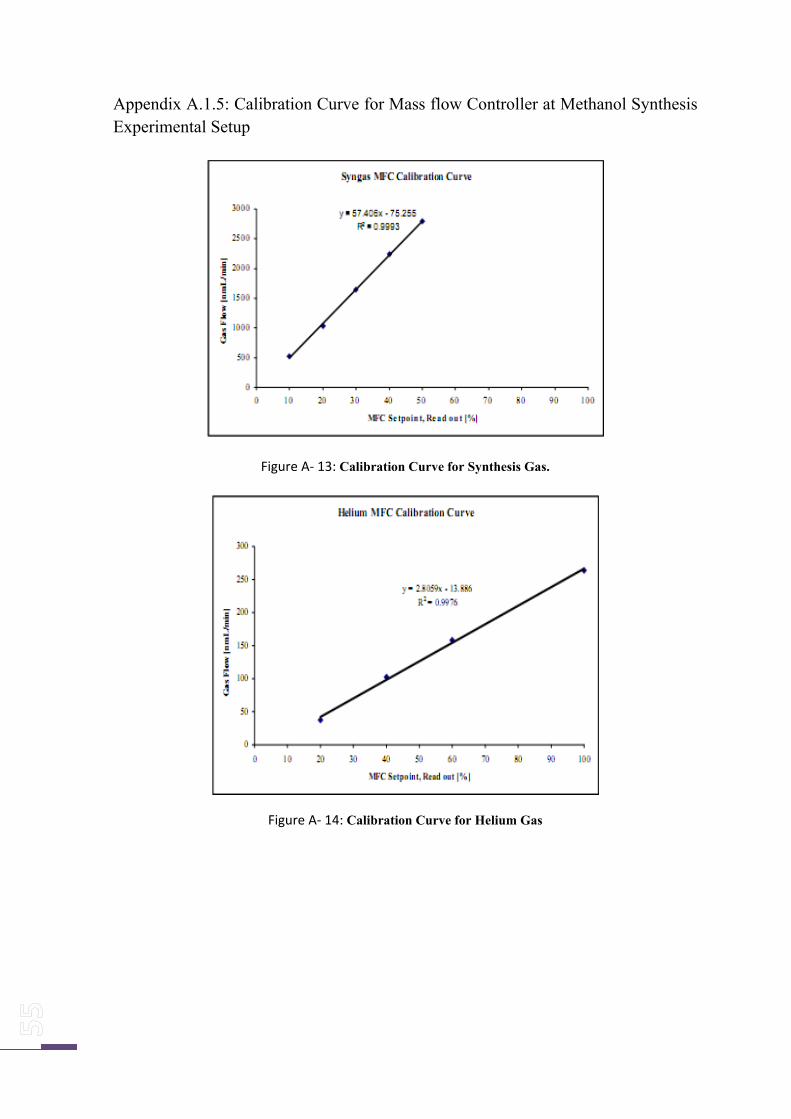
Appendix A.1.5: Calibration Curve for Mass flow Controller at Methanol Synthesis Experimental Setup
Figure A‐ 13: Calibration Curve for Synthesis Gas.
Figure A‐ 14: Calibration Curve for Helium Gas

Figure A‐ 15: Calibration Curve for Hydrogen Gas

Appendix B
Data form the GC Analysis for activation test of catalyst
Table B‐ 1: Data from the GC Analysis of the Feedstock Gas and calculation of the Area Ratios.
Analysis No
Comments AN₂ ACO ACO₂ ACO/AN₂ ACO₂/AN₂ ACO/ACO₂
8 001F0108 1893.32 9197.88 1171.99 4.858069423 0.619013162 7.848087441
16 001F0116 1885.56 8941.8 1120.39 4.742251639 0.594194828 7.980970912
24 001F0124 1887.44 8983.02 1665.28 4.759367185 0.882295596 5.394300058
32 001F0132 1888.35 9036.4 1280.12 4.7853417 0.67790399 7.059025716
33 001F0133 1880.81 8999.19 1291.55 4.78474168 0.686698816 6.967744183
34 001F0134 1881.79 9006.75 1307.46 4.786267331 0.694795912 6.88873847
35 001F0135 1883.52 9015.4 1323.72 4.786463643 0.70279052 6.810654821
36 001F0136 1880.88 9004.3 1338.63 4.787280422 0.711704096 6.726503963
37 001F0137 1881.07 8999.4 1354.79 4.784191976 0.720223065 6.642653105
38 001F0138 1862.1 8908.9 1360.39 4.78432952 0.730567639 6.548783805
39 001F0139 1878 8985.78 1392.23 4.784760383 0.741336528 6.454235292
AVERAGE 4.784 0.883
Table B‐ 2: Calculation of CO and CO+CO₂% Conversion for Cu-based catalyst in FBR. Conditions:
pressure 80 bars, temperature 255 ºC, contact time 103 3. /catms g cm
Analysis No Comments ACO/AN₂ ACO₂/AN₂ CO% Conv. CO+CO₂%
Conv. TOS(h)
2 001F0102 3.48 0.41 27.20 31.20 1.98
3 001F0103 3.48 0.42 27.30 31.19 2.64
4 001F0104 3.46 0.44 27.80 31.15 3.3
5 001F0105 3.42 0.50 28.45 30.65 3.96
6 001F0106 3.39 0.59 29.048 29.61 4.62
7 001F0107 3.38 0.68 29.42 28.30 5.28
8 001F0108 3.37 0.76 29.58 26.97 5.94
9 001F0109 3.38 0.83 29.28 25.53 6.6
10 001F0110 3.43 0.88 28.24 23.76 7.26
11 001F0111 3.46 0.90 27.69 22.91 7.92
12 001F0112 3.47 0.91 27.37 22.46 8.58
13 001F0113 3.48 0.92 27.19 22.346 9.24
14 001F0114 3.49 0.91 27.04 22.29 9.9
15 001F0115 3.49 0.91 26.94 22.24 10.56
16 001F0116 3.50 0.91 26.80 22.12 11.22

17 001F0117 3.50 0.91 26.72 22.04 11.88
18 001F0118 3.501 0.91 26.69 21.97 12.54
19 001F0119 3.51 0.92 26.69 21.90 13.2
20 001F0120 3.51 0.92 26.64 21.78 13.86
21 001F0121 3.51 0.93 26.58 21.66 14.52
New sequence: 2 001F0102 4.401383072 0.968581385 7.997845475 5.241495361 45.12
3 001F0103 3.911324631 0.965125264 18.241542 13.95006362 45.78
4 001F0104 3.676103023 0.961412147 23.15838163 18.16631074 46.44
5 001F0105 3.588685576 0.961747621 24.9856694 19.70296107 47.1
6 001F0106 3.548209142 0.96231397 25.8317487 20.40721524 47.76
7 001F0107 3.527783571 0.963969677 26.25870462 20.73842864 48.42
8 001F0108 3.518899584 0.965803386 26.4444067 20.86283801 49.08
9 001F0109 3.512437685 0.968472014 26.57947984 20.92977415 49.74
10 001F0110 3.508599301 0.971310261 26.65971362 20.9474226 50.4
11 001F0111 3.505376754 0.973708944 26.72707454 20.96196051 51.06
12 001F0112 3.502815146 0.976393318 26.78061985 20.95979417 51.72
13 001F0113 3.500453956 0.977813156 26.82997583 20.97640529 52.38
14 001F0114 3.500758796 0.978914351 26.82360376 20.95159437 53.04
15 001F0115 3.498179655 0.980168155 26.87751557 20.97498129 53.7
Analysis No Comments ACO/AN₂ ACO₂/AN₂ CO% Conv. CO+CO₂%
Conv. TOS(h)
New sequence: 2 001F0102 3.812912624 0.94636492 20.29864916 16.01768934 74.16
3 001F0103 3.680448527 0.94706503 23.06754752 18.34279942 74.82
4 001F0104 3.604674979 0.947553701 24.65144275 19.67127793 75.48
5 001F0105 3.565459586 0.947702597 25.47116249 20.36064614 76.14
6 001F0106 3.542509558 0.948315762 25.95088716 20.75480288 76.8
7 001F0107 3.490173868 0.949949259 27.04486062 21.64949485 77.46
8 001F0108 3.525948939 0.950708577 26.29705396 21.00480826 78.12
9 001F0109 3.521951466 0.951057856 26.38061318 21.06918437 78.78
10 001F0110 3.518274156 0.993057628 26.45748001 20.3929454 79.44
11 001F0111 3.514850605 0.951225704 26.52904253 21.19152445 80.1
12 001F0112 3.514685873 0.952263565 26.53248594 21.17611722 80.76
13 001F0113 3.513242889 0.953239861 26.56264865 21.1843524 81.42
15 001F0115 3.511539253 0.95697918 26.59825977 21.14843069 82.74
New sequence: 2 001F0102 1.871035741 0.939240006 60.88972113 50.40981564 123
3 001F0103 2.877160058 0.940163947 39.85869443 32.63942112 123.66
4 001F0104 3.245643613 0.929747956 32.15627899 26.32095342 124.32
5 001F0105 3.341800131 0.928400611 30.14631833 24.6479488 124.98

6 001F0106 3.360454604 0.930030178 29.7563837 24.29001621 125.64
7 001F0107 3.369453805 0.934621339 29.56827331 24.05020038 126.3
8 001F0108 3.376121878 0.937286765 29.42889051 23.88550126 126.96
9 001F0109 3.373747721 0.939305247 29.47851753 23.89177752 127.62
10 001F0110 3.369377274 0.938993755 29.56987304 23.97439512 128.28
11 001F0111 3.368298571 0.939651424 29.59242117 23.98182468 128.94
12 001F0112 3.369308614 0.938453391 29.57130823 23.98514195 129.6
13 001F0113 3.375482542 0.936976859 29.44225456 23.90225163 130.26
14 001F0114 3.38302431 0.937579259 29.2846089 23.75853946 130.92
15 001F0115 3.396449753 0.939284793 29.00397673 23.49153791 131.58
New sequence: 2 001F0102 1.515681736 0.825368918 68.31768946 58.6897714 171.84
3 001F0103 2.518369091 0.897939995 47.35850562 39.71573873 172.5
4 001F0104 3.065452936 0.934512113 35.92280653 29.41653347 173.16
5 001F0105 3.272364344 0.948612877 31.59773529 25.51654808 173.82
6 001F0106 3.329294592 0.954860482 30.40772174 24.40171035 174.48
8 001F0108 3.34339448 0.959497824 30.11299164 24.07107281 175.8
10 001F0110 3.345431397 0.957567215 30.07041395 24.06919691 177.12
12 001F0112 3.345784092 0.953372602 30.06304155 24.13699145 178.44
13 001F0113 3.347945952 0.95189887 30.01785218 24.12484874 179.1
New sequence: 2 001F0102 1.257206477 0.731527943 73.7206004 64.90675102 201.54
3 001F0103 2.224754696 0.831117034 53.49593028 46.07602384 202.2
4 001F0104 2.912100772 0.89888608 39.12832835 32.75124666 202.86
5 001F0105 3.234689711 0.932848394 32.38524851 26.45953583 203.52
6 001F0106 3.37224765 0.950993053 29.50987353 23.71200454 204.18
7 001F0107 3.376690623 0.958605111 29.41700203 23.49928122 204.84
10 001F0110 3.360010465 0.961382338 29.76566754 23.74461262 206.82
12 001F0112 3.36312531 0.960566912 29.7005579 23.70403702 208.14
13 001F0113 3.368371811 0.960733543 29.59089025 23.60851679 208.8
14 001F0114 3.369899699 0.960409256 29.55895279 23.58727802 209.46
New sequence: 2 001F0102 1.733527747 0.807471295 63.76405211 55.16147799 231.9
3 001F0103 2.688801361 0.886185646 43.79595818 36.91570485 232.56
4 001F0104 3.151897636 0.925951775 34.11585209 28.04218437 233.22
5 001F0105 3.308736366 0.94151672 30.83745054 24.99994554 233.88
Analysis No Comments ACO/AN₂ ACO₂/AN₂ CO% Conv. CO+CO₂%
Conv. TOS(h)
6 001F0106 3.351405465 0.94953619 29.94553794 24.10549399 234.54
7 001F0107 3.359903382 0.955332654 29.7679059 23.85325506 235.2
10 001F0110 3.363326638 0.961240953 29.69634953 23.68859023 237.18
12 001F0112 3.361211154 0.961703825 29.74056951 23.71775227 238.5
14 001F0114 3.353718583 0.959282043 29.89718681 23.89270114 239.82
15 001F0115 3.355480746 0.958317035 29.8603523 23.87863453 240.48

Table B‐ 3: the value of rate constant corresponding to the feed gas
Temperature ºC Feed-1 Feed-2 Feed-3 Feed-4 Feed-5
255 43232.68 102065.4 16245.6 92179.25 30642.97
240 27371.25 61283.99 11291.42 57761.78 19785.65
235 23310.76 51369.93 9980.321 48703.96 17001.19
230 19773.72 42639.07 8753.383 40966.23 14588.21
225 16728.45 35399.83 7654.688 34414.22 12492.58
220 14012.63 29410.9 6659.027 28603.97 10597.95
Appendix C
Health, Environment and safety
Appendix C.1: Set-up risk assessment
The rick assessment is the most important tools for a chemical process operation that we
use for the systematic identification of issues linked to HES. A rick assessment must be
carried out prior to the commencement of a specified chemical process and again when the
process is modified. This rick assessment is done to remove or control the rick factors
during the operational period of the chemical process.
So through risk assessment conducted prior to a concrete task or process, measures
designed to eliminate or control the factors representing a potential risk can be
implemented before the work starts. It also offers the possibility of increased control over
factors/conditions that need to be checked during the actual carrying out of the
task/process. The details descriptions and necessary data about HES are given in Appendix
C.
As indicated in the NTNU goals of Health, Environment and Safety, the work and learning
environment must support and promote its users’ capacity to work and learn, safeguard
their health and well-being, and protect them against work-related illnesses and accidents.
HES-related problems should be solved consecutively at the lowest possible level, in order
to prevent employees or students from developing work-related illnesses or suffering
work-related accidents, and to prevent the activities from having a negative impact on the
environment.
As described below activities is associated with several HES issues on the methanol synthesis set-
up.
• Transport and mounting of the gas bottle
• Modification and maintained of experimental set-up
• Leak testing and reactor mounting
• Reaction experiment
• Experiment shut-down and dismounting of reactor
• Cleaning parts

• Handling of catalyst
For existing risk assessments, safety measures, rules and procedures are as in below-
• In the methanol synthesis set-up, a well established toxic and flammable
gas alarm system is exist so for any incidence, the gas syncing system will
able to inform and necessary action concerning the HES can be taken
according to rules and procedure.
• For personal protection, safety goggle is very important in the VTL lab
and it is mandatory for every one who is working in side the lab
Appendix C.2: Risk concerning with carbon monoxide
The carbon monoxide is colorless and odorless gas, it comes as synthesis gas component
for methanol synthesis. The chemical company YARA PRAXAIR is supplier of synthesis
gas in our lab. The carbon monoxide is extremely flammable and toxic gas. It may cause
harm to the unborn child and danger of serious damage to health by prolonged exposure
through inhalation. This gas should be keeping away from the source of ignition and
should be store in safe area as the condition of flammable gas storage. It needs to use in
well ventilated area and in case of fire, this gas should be allowed to burn if flow cannot be
shut off immediately and need to immediate contact responsible person. It has not any
significant effect or critical hazards environmentally. This gas should be disposed as
hazardous waste. Before use, special instruction should be read [44].
Appendix C.3: Risk concerning with methanol
The methanol is very dangerous poison and its vapor also harmful to human. It may cause
blindness if swallowed and harmful if inhaled or absorbed through skin. It may causes
irritation to skin, Eyes and respiratory tract. It also affects central nervous system and liver. The
liquid and vapor of methanol is flammable. Personal protection is necessary like goggles, apron,
vent hood and protective gloves in used area. This liquid is slightly toxic for aquatic life and it
causes degradation in soil and air. This gas should be disposed as hazardous waste. This gas/liquid
should be keeping away from the source of ignition and should be store in safe area as the
condition of flammable gas/liquid storage. It needs to use in well ventilated area. [44]
Appendix C.4: Risk concerning with Hydrogen
The Hydrogen is colorless and odorless gas and extremely flammable gas, stable under
recommended storage and condition. Inhalation of vapor may cause dizziness, an irregular

heartbeat, narcosis, nausea or asphyxiation. If any one inhaled, remove to fresh air. This
substance classified with a health or environmental hazard. This gas should be disposed as
hazardous waste. This gas should be keeping away from the source of ignition. Personal
protection is necessary like goggles, apron, vent hood and protective gloves in used area
and it needs to use in well ventilated area [44]

Appendix D
Hazardous activity identification process in methanol synthesis rig.
Table D- 1: Hazardous activity identification process in methanol synthesis rig.

Appendix D.1: The risk assessments for methanol synthesis rig
Table D- 2: The risk assessments for methanol synthesis rig

Appendix E
The existing risk assessment analysis data sheet of methanol synthesis experimental set-up.


Appendix F
The materials, safety and data sheets for all the gas and chemical are given in bellow


Appendix G
Regarding to the HES I did the following courses and training
Appendix G.1: A special training course for VLT that I have done.
Figure G- 1: certificate of VTL safety Course

Appendix G.2: A gas training course for using gas bottle in lab that I have
done. The necessary documents for that are shown in bellow.
Adresse: Sem Sælandsv.4
Postnr./-sted: 7491
Trondheim.
Det bekreftes at følgende studenter ( se vedlagt liste) har fått utdelt og er gjort kjent med:
Arbeidsforhold og arbeidsavtaler.
Hvem gjør hva
Denne bekreftelsen gjelder:
Institutt for kjemisk prosessteknologi - NTNU
Egenerklæring HMS
Egenerklæring om helse, miljø og sikkerhet

-------- Original Message --------
Subject: HSE-Security course 6. Sept.
Date: Fri, 10 Sep 2010 14:30:25 +0200
From: Berit Borthen <[email protected]>
Reply-To: [email protected]
Organization: NTNU
To: Hilde Johnsen Venvik <[email protected]>, Anders Holmen <[email protected]>
Hei,
Det bekreftes herved at følgende studenter har gjennomgått IKPs
HMS-introduksjonskurs.
Dette omfatter sikkerhetskurset og opplæring i bruk av gass og
flaskeregulatorer. Varighet ca 2 timer.
Se vedlegg.
mvh
Berit

Figure G- 2: Above documents shows that I did a gas course 6th Sept, 2010