kimberlite wall rock fragmentation processes: … et al _paper... · 2 1. introduction kimberlite...
TRANSCRIPT
1
Kimberlite Wall Rock Fragmentation Processes: Venetia
K08 Pipe Development
The final publication is available at www.springerlink.com - 10.1007/s00445-011-0499-3
W.P. Barnett (1,2) , S. Kurszlaukis (3), M. Tait (1), P. Dirks (4)
(1) Mineral Resources Management, De Beers Group Services, P/Bag X01, Southdale 2135, South Africa
(2) present address: SRK Consulting, Suite 2200, 1066 West Hastings Street, Vancouver V6E3X2, BC,
Canada ([email protected]; +17782388038)
(3) Kimberlite Petrology Unit, De Beers Canada Inc., Toronto, Ontario, Canada
(4) School of Earth and Environmental Sciences, James Cook University, Townsville, Australia
Abstract
Current kimberlite pipe development models strongly advocate a downward growth process with the pipe
cutting down onto its feeder dyke by means of volcanic explosions. Evidence is presented from the K08
kimberlite pipe in Venetia Mine, South Africa, which suggests that some pipes or sub-components of pipes
develop upwards. The K08 pipe in pit exposure comprises >90 vol.% chaotic mega-breccia of country rock
clasts (gneiss and schist) and <10 vol.% coherent kimberlite. Sub-horizontal breccia layers, tens of metres
thick, are defined by lithic clast size variations, and contain zones of shearing and secondary fragmentation.
Textural studies of the breccias and fractal statistics on clast size distributions are used to characterize
sheared and non-sheared breccia zones, and to deduce a fragmentation mechanism. Breccia statistics are
compared directly with the statistics of fragmented rock produced from mining processes in order to
support interpretations. Results are consistent with an initial stage of brecciation formed by upward-moving
collapse of an explosively pre-conditioned hangingwall into a subterranean volcanic excavation. Our
analysis suggests that the pre-conditioning is most likely to have been caused by explosions, either phreatic
or phreatomagmatic in nature, with a total energy output of 2.7x10⁹ kJ (656 tons of TNT). A second stage
of fragmentation is interpreted as shearing of the breccia caused by multiple late kimberlite intrusions and
possible bulk movement of material in the pipe conduit related to adjacent volcanism in the K02 pipe.
Keywords: Breccia, Fractal, Mechanics, Growth, Particle Size Distribution
2
1. Introduction
Kimberlite is the source rock of more than 90% of the world’s diamonds, and the geometry of a volcanic
kimberlite pipe is a critical factor in defining a diamond resource. The geometry of a volcanic pipe is a
consequence of the mechanical processes that occurred during its formation. Current models for kimberlite
pipe development suggest a dominance of downward growth processes as the pipe progressively cuts down
onto its feeder dyke by means of volcanic explosions (e.g. Lorenz 1975; Sparks et al. 2006) and gravity
induced collapse (Lorenz and Kurszlaukis 2007; Barnett 2008). The dominant physical source of explosive
energy remains in contention (Field et al. 2008).
Intra-pipe kimberlite facies are generally rich in lithic clasts derived from the country rock. Facies
containing > 95% lithic clasts are commonly observed along pipe margins. Where preserved, these country
rock breccias are the most direct product of the fragmentation process and as such, provide key insights
into the mechanics of kimberlite pipe emplacement (e.g. Clement 1982; Laznicka 1986).
The kimberlite pipes in the Venetia kimberlite cluster have been dated at 519 Ma (Phillips et al. 1999) and
are situated in the Limpopo Metamorphic Belt of South Africa (Fig.1). The pipes are mined by DeBeers,
and have provided much data and insight into kimberlite emplacement processes (e.g. Seggie et al. 1999;
Kurszlaukis and Barnett 2003; Barnett 2004; Medlin 2005; Tait et al. 2006; Brown et al. 2009). The
Venetia cluster is unusual in that (at least) 16 individual pipes have been identified within an area no larger
than 2.5 km2. Given the close proximity of the volcanic pipes, it is expected that interaction occurred
between pipes during emplacement (e.g. mixing of erupted pyroclastics and interfering pipe-induced wall
rock stress and strain). This is reflected in a wide range of kimberlitic lithofacies including a plethora of
lithic breccia bodies indicative of an environment in which a range of dynamic processes occurred.
The Venetia pit is a remarkable natural laboratory in which the mining process allows for a precise, 3-D re-
construction of pipe geometries, with an assessment of the spatial distribution of kimberlite textures within
each mined pipe. In the Venetia pit explosive fragmentation during mining involves large volumes of rock
(up to 1 Mt per blast); a process that can be loosely compared to volcanic explosions. Thus, explosive
fragmentation of wall rock during mining provides experimental data that can be compared with
fragmentation that occurred in kimberlite eruptions. Mining excavations also experience gravity-driven
collapse of the rock mass in a process that mimics wall collapse in volcanic pipes and craters (Barnett
2008).
This paper investigates the lithic breccias in the K08 kimberlite pipe in Venetia Mine. The K08 pipe is
exposed in the north slope of the open pit over a height of 136 m, and consists of > 90 vol.% breccia of
country rock clasts (gneiss and schist) and < 10 vol.% coherent kimberlite (Fig.2). Coherent is used in this
3
paper to describe a kimberlite with a non-fragmental, igneous texture (Cas et al. 2008; 2009). The
kimberlite component is diamond-bearing, but has not been classified as a resource because of its low
volume at current exposure levels. The K08 pipe is unique in the cluster because of its locality between the
K01 and K02 pipes, its large surface area (25700 m2), and its high lithic breccia content.
Breccias are texturally characterized by the composition of the particles and the matrix, by the particle size
distribution, and by the abundance, shape, surface roughness, degree of rotation and/or alignment (fabric)
of particles (Laznicka 1988; Jebrak 1997; Mort and Woodcock 2008). Studies have shown that many types
of rock fragmentation processes can be characterized as scale-independent (Turcotte 1986; Sammis et al.
1987; Biegel et al. 1989; Blenkinsop 1991; Kaminski and Jaupart 1998; Guo and Morgan 2008), in which a
self-similar distribution in particles sizes is created after fragmentation has occurred. Self-similar particle
size distributions (PSD’s) can be described by fractal statistics (e.g. Tucotte 1986; Sammis et al. 1987;
Blenkinsop 1991). In this paper we present PSD’s for breccias in the K08 pipe which are compared with
PSD’s determined for breccia’s derived from mining-related fragmentation, to derive at models for the
emplacement process.
2. Observations and 3D Model
2.1 Pit Exposures
The K08 pipe has been mapped along 11 bench levels (Fig.2) from surface at approximately 700 m above
mean sea level (m.a.m.s.l.) down to 564 m.a.m.s.l. by the authors at different stages of pit expansion
(Fig.3), between 2004 and 2008. The mapping was not always on the final pit face shown in Fig.2, but at
different stage of face development, which allows 3-D insight into the pipe. The geometry of the K08 pipe
has been modeled with 3-D wireframes using GEMS (GemcomTM
software; Fig.4). The shape has been
constrained from pit exposures, and continuity of the pipe with depth has been traced with drill hole data
down to 90 m.a.m.s.l. (610 m below surface), including contact intersections down to 190 m.a.m.s.l. Depth
reconstructions are based on 5 drill holes that intersect the pipe. Measurements in the pit have been linked
to surveyed coordinates of contacts and section lines.
The pipe consists almost entirely of the Country Rock Breccia (CRB), with kimberlite being the other main
rock type. Between 670 m.a.m.s.l. and 475 m.a.m.s.l. no inter-particle kimberlite has been observed at all,
whilst the top 30 m (700-670 m.a.m.s.l.) of the exposed K08 pipe contains significant amounts of coherent
kimberlite. The total volume of CRB in the K08 pipe derived from the 3-D model is 4.4 million m3. In the
top 115 m of the exposed pipe the horizontal sectional surface area decreases steadily from 24300 m2 to
15900 m2 as the southern contact moves progressively inwards. The northern, eastern and western contacts
are sub-vertical. Rare lithic-poor intrusive dykes and sills cross-cut the CRB.
4
2.1.1 Lithic Breccia Facies
The most common rock type in the K08 pipe is a lithic-clast-supported, country rock breccia (CRB; Fig.3
and Fig.4) comprising angular gneiss and schist clasts, ranging in size from < 1 mm to over 10 m. This
breccia is devoid of kimberlite matrix, and can be divided into two facies referred to as CRB_1 and CRB_2
(Fig.2 and Fig.3), with sharp or gradational contacts between the facies. Facies CRB_1 is visually distinct
with a larger average particle size, and has either a carbonate matrix or no matrix (i.e. open space with free
growing carbonate crystals on walls of the void). The clasts typically, but not exclusively, are weakly
aligned in a generally sub-horizontal orientation (Fig.3). Rare local variations in texture resemble slump
structures.
The second facies (CRB_2) has a smaller average particle size (Fig.3), with both angular and sub-angular
clasts (i.e. increased rounding), and commonly includes a sandy matrix infill of local origin. CRB_2 is
more poorly cemented than CRB_1, and particles can typically be removed from the rock mass by hand.
The preferred clast orientation is stronger in CRB_2, typically defining a fabric that dips towards the centre
of the pipe at shallow angles. CRB_2 occurs in zones that vary in width from several centimeters to several
tens of metres. Contact zones between CRB_1 and CRB_2 occur in all directions from sub-horizontal to
sub-vertical, but most often dip away from the K08 external pipe contacts into the breccia at shallow angles
(Fig.2). Along shallow dipping contacts CRB_2 may be more finely comminuted with the development of
discrete shear planes (Fig.3). Spaced shear fractures have been mapped on one bench as an anastomosing
network of planes (Fig.3b), with associated synthetic fracturing showing local curvature and clast rotation
indicative of a normal shear sense.
The CRB lithic clast types are identical to the country rock adjacent to the pipe. The distribution of clasts
within the CRB varies between zones that are more abundant in either amphibolite gneiss, biotite gneiss or
biotite schist. Blocks of marble are rare, and were derived from a folded stratigraphic horizon (Barnett
2003) positioned either ~700 m below or, more likely, ~100 m above the current topographic surface.
Serpentine is occasionally observed in the breccia matrix or as coatings on particles. It is typically observed
within an alteration zone extending a few metres from the contact of a kimberlite dyke. Shear zones near to
the kimberlite intrusions are also exploited and traced by serpentine-rich alteration zones (Fig.3b).
Typical kimberlite contact breccias commonly have gradational contacts with in-situ country rock.
However, the observed K08 contacts are sharp with only rare signs of increased fracture-development on
the country rock side of the contact (Fig.3). The contacts typically follow pre-existing structures, usually a
joint set or less commonly the gneissic fabric. The contacts are irregular from bench to bench as influenced
by pre-existing joints. Either CRB_1 or CRB_2 are located along the pipe contacts, and breccia clasts do
not display a distinctly increase in size towards the contacts.
5
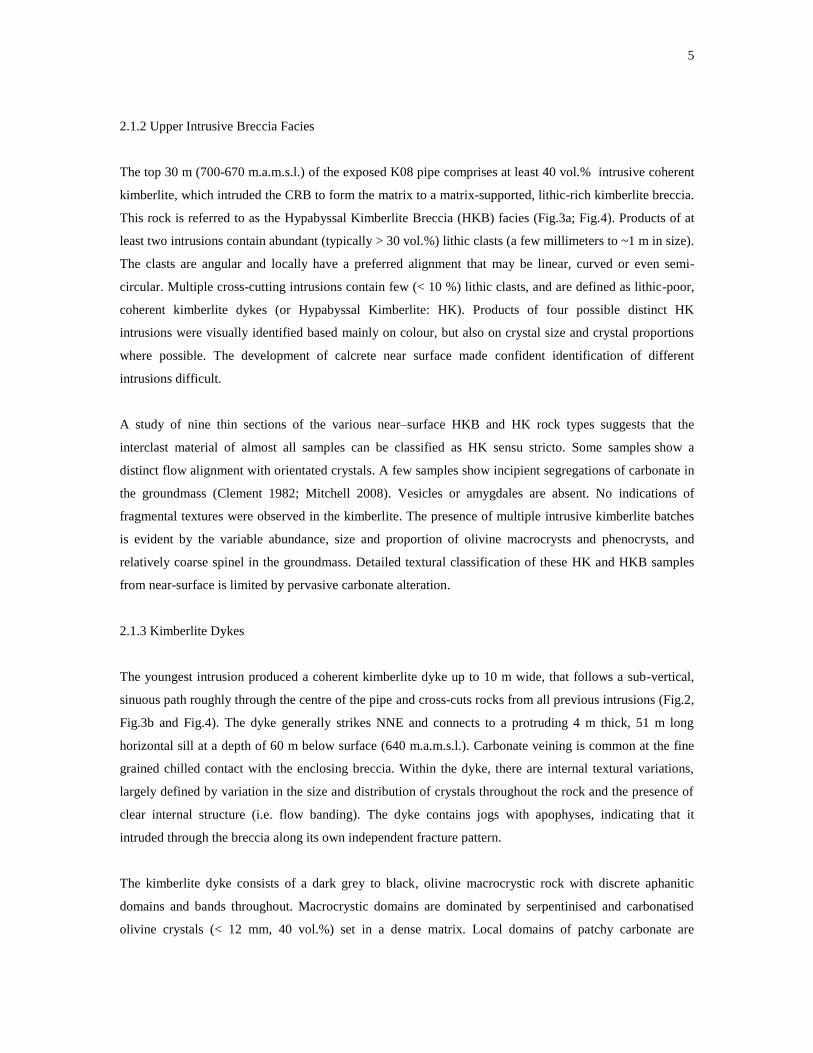
2.1.2 Upper Intrusive Breccia Facies
The top 30 m (700-670 m.a.m.s.l.) of the exposed K08 pipe comprises at least 40 vol.% intrusive coherent
kimberlite, which intruded the CRB to form the matrix to a matrix-supported, lithic-rich kimberlite breccia.
This rock is referred to as the Hypabyssal Kimberlite Breccia (HKB) facies (Fig.3a; Fig.4). Products of at
least two intrusions contain abundant (typically > 30 vol.%) lithic clasts (a few millimeters to ~1 m in size).
The clasts are angular and locally have a preferred alignment that may be linear, curved or even semi-
circular. Multiple cross-cutting intrusions contain few (< 10 %) lithic clasts, and are defined as lithic-poor,
coherent kimberlite dykes (or Hypabyssal Kimberlite: HK). Products of four possible distinct HK
intrusions were visually identified based mainly on colour, but also on crystal size and crystal proportions
where possible. The development of calcrete near surface made confident identification of different
intrusions difficult.
A study of nine thin sections of the various near–surface HKB and HK rock types suggests that the
interclast material of almost all samples can be classified as HK sensu stricto. Some samples show a
distinct flow alignment with orientated crystals. A few samples show incipient segregations of carbonate in
the groundmass (Clement 1982; Mitchell 2008). Vesicles or amygdales are absent. No indications of
fragmental textures were observed in the kimberlite. The presence of multiple intrusive kimberlite batches
is evident by the variable abundance, size and proportion of olivine macrocrysts and phenocrysts, and
relatively coarse spinel in the groundmass. Detailed textural classification of these HK and HKB samples
from near-surface is limited by pervasive carbonate alteration.
2.1.3 Kimberlite Dykes
The youngest intrusion produced a coherent kimberlite dyke up to 10 m wide, that follows a sub-vertical,
sinuous path roughly through the centre of the pipe and cross-cuts rocks from all previous intrusions (Fig.2,
Fig.3b and Fig.4). The dyke generally strikes NNE and connects to a protruding 4 m thick, 51 m long
horizontal sill at a depth of 60 m below surface (640 m.a.m.s.l.). Carbonate veining is common at the fine
grained chilled contact with the enclosing breccia. Within the dyke, there are internal textural variations,
largely defined by variation in the size and distribution of crystals throughout the rock and the presence of
clear internal structure (i.e. flow banding). The dyke contains jogs with apophyses, indicating that it
intruded through the breccia along its own independent fracture pattern.
The kimberlite dyke consists of a dark grey to black, olivine macrocrystic rock with discrete aphanitic
domains and bands throughout. Macrocrystic domains are dominated by serpentinised and carbonatised
olivine crystals (< 12 mm, 40 vol.%) set in a dense matrix. Local domains of patchy carbonate are
6
recognised. The internal lithic content is low (< 5%) and dominated by heavily altered (carbonatised), sub-
angular clasts of country rock gneiss, schist and marble. Locally a distinct alignment of platy olivine grains
defines a banding in the rock, that is sinuous, but typically contact parallel. Rare, localised clastic domains
are mapped, described as cm-scale ―pipe-like‖ structures of altered angular macrocryst-bearing, lapilli-
sized fragments set within an altered matrix of carbonate and serpentine.
Microscopically the dyke rock is coherent in texture, with partially to completely altered olivine (now
serpentine, carbonate and talc) macrocrysts (< 12 mm) set within a groundmass of finer subhedral to
euhedral serpentinised olivine phenocrysts (< 1 mm), spinel (< 0.2 mm), phlogopite (< 0.1mm), perovskite
(< 0.2 mm), rare serpentinised monticellite and microlitic apatite. Serpentine and carbonate form the matrix
of the rock, with localised patches of carbonate. The degree of alteration within the olivine pseudomorphs
varies substantially, with some crystals preserving fresh cores, whilst others are completely replaced by
serpentine, carbonate and rarely, opaque oxides. Carbonate veining is common and the lithic content is low
(< 1 vol.%).
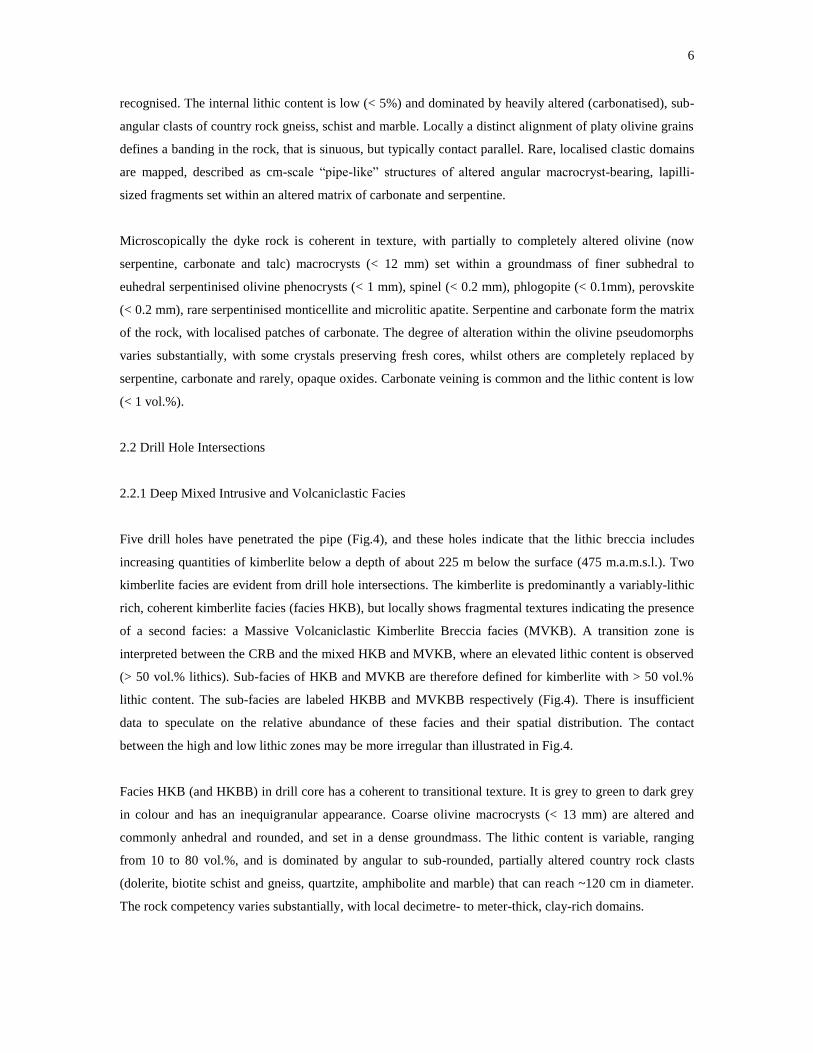
2.2 Drill Hole Intersections
2.2.1 Deep Mixed Intrusive and Volcaniclastic Facies
Five drill holes have penetrated the pipe (Fig.4), and these holes indicate that the lithic breccia includes
increasing quantities of kimberlite below a depth of about 225 m below the surface (475 m.a.m.s.l.). Two
kimberlite facies are evident from drill hole intersections. The kimberlite is predominantly a variably-lithic
rich, coherent kimberlite facies (facies HKB), but locally shows fragmental textures indicating the presence
of a second facies: a Massive Volcaniclastic Kimberlite Breccia facies (MVKB). A transition zone is
interpreted between the CRB and the mixed HKB and MVKB, where an elevated lithic content is observed
(> 50 vol.% lithics). Sub-facies of HKB and MVKB are therefore defined for kimberlite with > 50 vol.%
lithic content. The sub-facies are labeled HKBB and MVKBB respectively (Fig.4). There is insufficient
data to speculate on the relative abundance of these facies and their spatial distribution. The contact
between the high and low lithic zones may be more irregular than illustrated in Fig.4.
Facies HKB (and HKBB) in drill core has a coherent to transitional texture. It is grey to green to dark grey
in colour and has an inequigranular appearance. Coarse olivine macrocrysts (< 13 mm) are altered and
commonly anhedral and rounded, and set in a dense groundmass. The lithic content is variable, ranging
from 10 to 80 vol.%, and is dominated by angular to sub-rounded, partially altered country rock clasts
(dolerite, biotite schist and gneiss, quartzite, amphibolite and marble) that can reach ~120 cm in diameter.
The rock competency varies substantially, with local decimetre- to meter-thick, clay-rich domains.
7
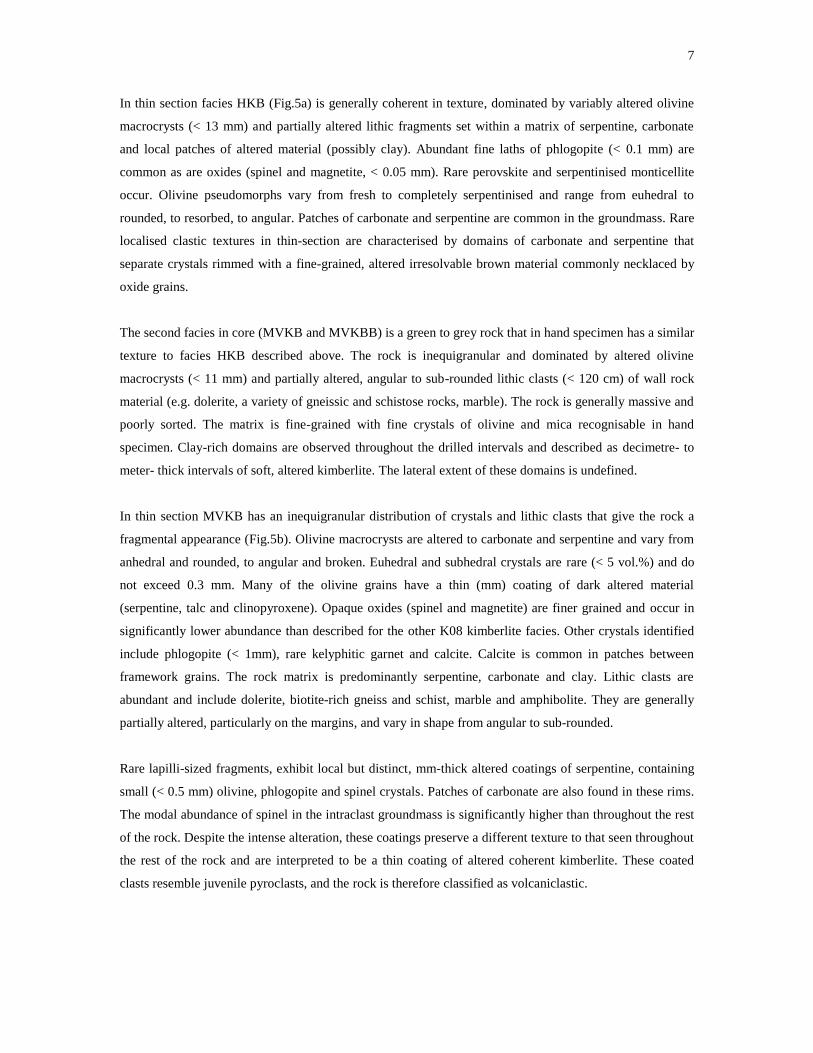
In thin section facies HKB (Fig.5a) is generally coherent in texture, dominated by variably altered olivine
macrocrysts (< 13 mm) and partially altered lithic fragments set within a matrix of serpentine, carbonate
and local patches of altered material (possibly clay). Abundant fine laths of phlogopite (< 0.1 mm) are
common as are oxides (spinel and magnetite, < 0.05 mm). Rare perovskite and serpentinised monticellite
occur. Olivine pseudomorphs vary from fresh to completely serpentinised and range from euhedral to
rounded, to resorbed, to angular. Patches of carbonate and serpentine are common in the groundmass. Rare
localised clastic textures in thin-section are characterised by domains of carbonate and serpentine that
separate crystals rimmed with a fine-grained, altered irresolvable brown material commonly necklaced by
oxide grains.
The second facies in core (MVKB and MVKBB) is a green to grey rock that in hand specimen has a similar
texture to facies HKB described above. The rock is inequigranular and dominated by altered olivine
macrocrysts (< 11 mm) and partially altered, angular to sub-rounded lithic clasts (< 120 cm) of wall rock
material (e.g. dolerite, a variety of gneissic and schistose rocks, marble). The rock is generally massive and
poorly sorted. The matrix is fine-grained with fine crystals of olivine and mica recognisable in hand
specimen. Clay-rich domains are observed throughout the drilled intervals and described as decimetre- to
meter- thick intervals of soft, altered kimberlite. The lateral extent of these domains is undefined.
In thin section MVKB has an inequigranular distribution of crystals and lithic clasts that give the rock a
fragmental appearance (Fig.5b). Olivine macrocrysts are altered to carbonate and serpentine and vary from
anhedral and rounded, to angular and broken. Euhedral and subhedral crystals are rare (< 5 vol.%) and do
not exceed 0.3 mm. Many of the olivine grains have a thin (mm) coating of dark altered material
(serpentine, talc and clinopyroxene). Opaque oxides (spinel and magnetite) are finer grained and occur in
significantly lower abundance than described for the other K08 kimberlite facies. Other crystals identified
include phlogopite (< 1mm), rare kelyphitic garnet and calcite. Calcite is common in patches between
framework grains. The rock matrix is predominantly serpentine, carbonate and clay. Lithic clasts are
abundant and include dolerite, biotite-rich gneiss and schist, marble and amphibolite. They are generally
partially altered, particularly on the margins, and vary in shape from angular to sub-rounded.
Rare lapilli-sized fragments, exhibit local but distinct, mm-thick altered coatings of serpentine, containing
small (< 0.5 mm) olivine, phlogopite and spinel crystals. Patches of carbonate are also found in these rims.
The modal abundance of spinel in the intraclast groundmass is significantly higher than throughout the rest
of the rock. Despite the intense alteration, these coatings preserve a different texture to that seen throughout
the rest of the rock and are interpreted to be a thin coating of altered coherent kimberlite. These coated
clasts resemble juvenile pyroclasts, and the rock is therefore classified as volcaniclastic.
8
3. Breccia Particle Size Analysis
3.1 Fractal Statistics
The particle size distribution (PSD) of breccias guided by fractal statistics of the PSD can help differentiate
between fragmentation mechanisms. For a fractal PSD the number of particles (N) greater in size than a
specific radius (r) is related to r by a power-law distribution, N = constant * r –D
, where D is the fractal
dimension. Fractal distributions when plotted on a graph as log N versus log r can be identified as linear
segments over specific size ranges. The fractal dimension D is the slope of the linear segment, and the
value of D may be indicative of the fragmentation process (Jebrak 1997), the properties of the fragmented
material (or the resistance of the material to the process causing fragmentation; Hisada 2004), as well as the
amount of energy in single or repeated fragmentation events (Blenkinsop 1991; Kaminski and Jaupart
1998).
In this study, log (N /A) is plotted on the ordinate axis to represent the number of particles per m2, where A
is the total sampled area. This is an accepted way to compare the PSD of samples of different sample size
on the same graph (e.g. Blenkinsop 1991). The PSD as sampled along a one dimensional line (e.g. a drill
core), or a two dimensional image of a rock face, suffer from an inherent bias since larger particles are
preferentially intersected, and smaller particles under-represented. Fractal distributions derived from 1-D or
2-D sampling have been corrected to 3-D distributions by adding either 2 or 1 to the D values respectively
(i.e. D3D = D1D + 2; D3D = D2D + 1). The validity of this dimensional correction can be demonstrated
mathematically (e.g. Turcotte 1997), but it is not clear how accurate the relationship is when applied to real
geological breccias, and particle shape has an influence on the result. It has nevertheless been used in the
literature (e.g. Sammis et al. 1987; Blenkinsop 1991; Jebrak 1997), and remains the only practical way to
compare data sets acquired at different dimensional scales. In this paper, all D values are reported as 3-D
values by using the approach stated above.
There are a number of practical limitations to identifying a fractal distribution. Firstly, breccias may have
evolved complexly and the distribution may not be fractal, or may only have self-similar characteristics
over a limited size range. Sampling resolution limitations prevent smaller particles from being counted, and
the sample window size prevents the largest particles from being adequately sampled. Such sampling bias,
generally causes the plotted distributions to be non-linear in the largest and smallest size ranges (referred to
as the ―roll-off‖ effect) even if the particle size distribution is truly fractal. Small datasets of particle sizes
(such as for the coarse particle size range) have increased variance, and graphical plots have staggered or
irregular trends, making the determination of linear trends or the gradient of linear trends unreliable. PSD’s
may also be characterized graphically as consisting of different linear trends for different size ranges. Such
distributions are called multi-fractal, and indicate that a different fragmentation process exists over each of
the different size ranges, each characterized by a distinct fractal dimension.
9
For the above reasons it is generally recommended that caution should be used when identifying a
distribution as fractal if the linear segment is not more than an order magnitude in size range (e.g. Mort and
Woodcock 2008). This limits the robustness of many interpretations. The best way to improve certainty is
to find repeated supporting patterns in the data, and to combine data sets acquired at multiple scales. A PSD
can also be compared to that from a known fragmentation process. In this paper all these methods have
been used to improve interpretations, but the limited size ranges presented remain a limitation for fractal
statistics. We would like to emphasize that all the characteristics of the PSD give information about
fragmentation, not just the fractal properties or lack thereof. For example, a steep gradient in a PSD that is
near-linear is similar to a steep linear and demonstrably fractal PSD in the sense that that there is a high
ratio of fine particles to coarse particles. In this study, the K08 interpretation is based on field observations
and a study of the PSD, and fractals are used were possible.
3.2 Kimberlite Fractal Breccias
Barnett (2004) analyzed contact breccias from six kimberlite pipes in southern Africa and showed a multi-
fractal (at least two distinct linear segments) distribution over 10 orders of magnitude in particle size.
Particles smaller than ~3 cm (on average) in radius show a D value of 2.6 – 2.7, typical of constrained
comminution type fragmentation (Biegle et al. 1989; Blenkinsop 1991). Larger particles have higher D
values. Barnett (2004) suggests that D values of 3.1 – 3.3 are representative of contact breccias that have
undergone subsidence and partial shearing and abrasion. Such distributions with different linear fractal
trends that define different size ranges are regarded as multi-fractal trends and are common in the earth
sciences (Blenkinsop 1991; Turcotte 1997). In the case of the analyzed kimberlite breccias, a different
fragmentation process dominates the formation of coarser particles compared to finer particles < 3 cm.
Barnett (2004) also suggests that the Venetia K01 pipe contact breccia may have undergone initial
explosive fragmentation (D > 4), followed by subsidence causing a reduction in the D value towards
constrained comminution values. This interpretation is not in agreement with theoretical predictions by
Turcotte (1986), who indicates that a single-stage of fragmentation, such as a once-off explosion, should
not have a D value greater than 3. It is also not in agreement with other studies (e.g. Blenkinsop 1991;
Coop et al. 2004; Guo and Morgan 2007) that show that cumulative fragmentation energy should typically
cause a progressive increase in the D value.
3.3 K08 Breccia Sampling and Analysis
During face mapping of the K08 CRB_1 and CRB_2 breccias, photographs were taken for 2D particle size
analysis. Each clast in the photographs was manually digitized using a CAD package. ImageJ software
(Rasband 1997-2009) was then used to determine the area size of each clast, and a radius is calculated
10
assuming a circle shape. The particle size distribution for each photograph was graphically plotted and
linear segments with linear regression coefficients greater than 0.98 were identified as most likely fractal.
Five CRB samples were analyzed. Fig.6 is a photograph covering an area containing both CRB_1 (basal
half of photograph) and CRB_2 (top half of photograph). This photograph was split into the two breccia
facies during analysis in order to quantify the difference between the two facies when located in close
proximity. The contact between the facies is finer grained than elsewhere, and a second photograph was
analyzed that represents a close-up of CRB_2 near the contact. The PSD distributions in Fig.7 illustrate the
results of the analysis.
All PSD’s analyzed have indications of multi-fractal trends, with between 1 and 3 linear segments. None of
the linear segments in Fig.7 cover a large particle size range, and detailed interpretation is therefore
regarded as tentative. The ―roll-off‖ affect may cause some of the observed change in D values. The
sharper the change in the gradient (fractal dimension D) of the PSD, the more convincing the argument for
a different fractal segment. For purpose of reference in subsequent interpretations, different linear segments
of each distribution are labeled. The label Dc is used for linear segments defined by the coarse particle
component, typically with a fractal dimension D > 3, but unreliable in actual value since it is represented by
the smallest population of data (Fig.6). The label Dp is used for intermediate size ranges, and in our
analyses is typically D ≈ 3 (Fig.6). This is the size range least affected by sampling bias and is most
reliable.
The PSD for CRB_1 (Fig.7) could be divided into two linear segments, with Dc = 3.4 and Dp = 2.8. More
likely, however, it could be argued that only one fractal segment is present with D ≈ 3, and that sampling
bias has caused roll-off and under-representation of the coarse particles.
The PSD for CRB_2 is clearly finer grained than CRB_1 (Fig.7). The coarse sized segment for CRB_2 has
Dc ≈ 5, but low sample support would make this actual fractal dimension value unreliable. However, Dc is
greater than 3, and the sharp change in gradient strongly suggests that the coarse population of particles is
distinctly different (Barnett 2004). The Dp segment for CRB_2 is close to a value of 3. The sheared contact
zone between the two facies (CRB_2 SZ in Fig.7) shows increased particle size reduction, with a higher Dc
value but still with Dp having a value of 3. Overall, the inflexion point contact between Dp and Dc moves
progressively to smaller particle sizes (21 cm to 11 cm).
In order to simplify the visual representation of the data and aid interpretation, only the best-fit lines
through the most linear parts (possibly fractal, but not necessarily) of the distributions are plotted in Fig.8.
One additional photograph (~65 cm wide) was analyzed for CRB_1, which has a coarse particle Dc of 3.4
(Fig.8). Two additional samples for CRB_2 were also analyzed, one covering an area 5 m wide (Dc = 6.7)
11
and the other 1 m wide (Dc = 4.6). The Dp segment of each sample approximates a value of 3. The 65 cm
wide CRB_1 sample presents an exception, since the finer component of particles has a fractal dimension
of 2.6-2.7. In certain analyses a D value of 2.6-2.7 stands out as distinctly different to Dp and may be
considered representative of the trend identified in Barnett (2004). It is labeled Dcom (for reasons discussed
later; Fig.8 and Fig.9), but is often difficult to discern because of sampling resolution bias.
Two drill holes, GDH027 and GDH045 were drilled through the K08 CRB facies (Fig.4 shows the position
of the drill holes). The size of each clast intersecting a reference line on the core was measured. These holes
penetrate the K08 pipe at a depth of between 160 m and 280 m below surface (540-420 m.a.m.s.l.), which
is below the depths of visual pit exposure. Barnett (2004) presented the data to illustrate layering within the
pipe as defined by variations in average clast size. The clast sizes define sub-domains that have distinctly
different grain size averages and ranges. A moving mean taken down a drill hole shows the clast population
varying in size, thus defining a crude layering. Unfortunately, the breccia logs were done years prior to the
face mapping and CRB_1 and CRB_2 facies were not described. The data have been further analyzed in
detail to determine sub-domains without the aid of detailed descriptive logs. Sub-domain boundaries have
been defined where rapid down-hole changes in average particle size and fractal dimension are observed.
Each fractal segment in each sub-domain in the drill holes is plotted (Fig.9) individually. All sub-domains
have multiple linear segments (possibly multi-fractal) with either two or three fractal trends (combinations
of Dc, Dp and Dcom) over distinct size ranges. The Dp value approximates 3 (Fig.9), identical to the 2D data.
Dc ranges between 3.7 and 12 in value, again similar to the 2D data. Dcom averages 2.63 in the two drill
holes, and is often found in addition to Dp, but at a finer particle size range. In some domains Dcom is
present while Dp is completely absent.
3.4 Mining Related Fragmentation Sampling and Analysis
When ascending magma reacts explosively with meteoric water (usually groundwater), most of the thermal
energy of the magma is converted into highly energetic, supersonic shock waves, which are able to
fragment not only the magma, but also the country rock down to small grain sizes (Kurszlaukis et al. 1998;
Raue et al. 2000; Büttner et al. 2002; Zimanowski et al. 2003). This volcanic process may be similar to
fragmentation caused by large explosions during the mining process. The PSD of mine production Blast
1829 that was created by using industrial explosives was sampled for comparison with the breccias. This
blast affected the same rock types (mixed biotite gneiss and schist) as those encountered in the CRB in the
K08 pipe. The rock was jointed in a similar manner to the country rock mass all around the mine, and there
were no indications of additional fragmentation caused by the nearby volcanic pipes. Two photograph
samples were taken, one at a scale covering an area 0.63 m2 and the other an area of 28.9 m
2. The data
acquired at these scales were combined to provide a representative distribution that shows a linear fractal
12
distribution over one order of magnitude in particle size (Fig.10). The fractal dimension of the linear
segment is 3, over a size range of 0.05 to 0.6 m.
Pit sidewall failures of jointed rock are common occurrences in the mining industry. In a similar fashion to
open pits, marginal breccias in volcanic pipes may form by the process of sidewall failure collapse. The
result is a debris pile that rapidly flows down the excavation/crater sidewall to be deposited on the floor of
the excavation/crater, thus forming a talus fan of block sized particles from several meters up to tens of
meters in size. The talus fan has its thickest vertical dimension adjacent to the excavation wall and extends
only a few tens of meters into the excavation forming a wedge shape at the angle of repose for the coarse
blocky particles.
Five photograph samples of the PSD of one Venetia pit slope failure were analyzed by Barnett (2004) and
superficially compared to that of the K01 breccia facies. This failure talus was no more than 3 to 4 m thick
and showed no indications of sorting, with large blocks several metres in size adjacent particles ranging
from several decimetres to sub-millimetre in size. This data have been re-evaluated in more detail to further
guide the interpretation of the K08 breccia. The photographs cover a sample size range from 1.97 m2 to
18.1 m2. The composition of the talus is predominantly gneiss, but includes a component of biotite schist.
The samples were merged to form a single distribution (Fig.10) that is statistically more robust. The
distribution is coarser grained than the PSD for the explosive Blast 1829 or the PSD’s either CRB_1 or
CBR_2, with more large particles (> 0.15 m) and less fine particles (< 0.1 m). The distribution has a linear
segment from 0.8 m to 0.19 m that has fractal dimension of about 3.25, which is slightly steeper than the
explosive PSD. The rest of the PSD is non-linear with a gradient shallower than the breccias.
4. K08 Breccia Interpretation
4.1 Staged Fragmentation
Results from 1-D drill hole samples and 2-D photograph are similar. The joint spacing distribution
illustrated in Fig.9 (linear 1D drill hole sample) is determined from 23.65 km of drilling through un-
brecciated wall rock, and is considered to be representative of the in-situ distribution of joint-bounded
block sizes prior to brecciation. The sampled breccia PSD’s develop from this initial rock mass state of
fragmentation. Fig.11 is a schematic illustration of the fragmentation process as represented on the fractal
graphs.
Collectively, the most well sampled components of the 1-D and 2-D PSD’s define a linear trend with an
interpreted fractal dimension Dp = 3 (Fig.8, Fig.9 and Fig.11a). Both CRB_1 and CRB_2 have this
characteristic Dp trend. The Dp trend is therefore considered the most robust part of the interpretation and
represents the initial stage of fragmentation of in-situ, jointed rock. Note how the Dp trend forms a tangent
13
to the in-situ jointed rock PSD, and represents a clockwise rotation of the PSD around the coarsest particles
(Fig.9 and Fig.11a).
The coarser particle population in CRB_1 has a Dc only slightly greater than 3, possibly indicating that the
coarse particles have not evolved much in character beyond the fragmentation state represented by Dp.
Alternatively, it is possible that the K08 breccia Dc values of 3.1 to 3.4 is due to statistical bias (too few
sampled coarse particles) masking an actual value of 3.
The coarse particles in the CRB_2 breccia have greatly increased Dc values indicating further
fragmentation of coarse particles significantly beyond the fragmentation state represented by Dp (Fig.11b).
A progression in D values is commonly observed in adjacent domains, so that as the average particle size
decreases, Dc increases, but the particle size defining the knick-point between the Dc and Dp segments
decreases. Such an observation is expected if the larger clasts are being preferentially fragmented during
secondary fragmentation (Blenkinsop 1991).
The CRB_1 facies appears to represent an older facies, based on the generally coarser particle sizes and its
more strongly cemented character. The CRB_2 smaller average particle sizes, poorly cemented character
and spatial association with zones of shearing that cross-cut the pipe suggest that the CRB_2 has undergone
second-stage brecciation. The fractal PSD analysis with an increased Dc supports this interpretation.
Dcom values of approximately 2.6 are usually only observed in the finer particles sizes below 3-5 cm (down
to at least microscopic scales; Barnett 2004), and is commonly interpreted to represent constrained
comminution (Biegle et al. 1989; Sammis and Biegel 1989; Blenkinsop 1991), which occurs in fine
particles as they are point-loaded by larger particles under high confining stresses. PSD segments with Dcom
values were seen in this study in one CRB_1 photograph sample and in a number of subdomains identified
in the drill cores. Some domains contained coarse particles up to 20 cm in size consistent with a shallow
Dcom trend.
Based on the above analysis and field observations, we interpret at least two stages of fragmentation
(Fig.11), characterized by at least three fragmentation mechanisms as expressed by Dcom, Dp and Dc. The
natures of these mechanisms are explored below.
4.2 Stage 1 Brecciation
4.2.1 Comparison with Explosive Fragmentation
The first stage of brecciation is interpreted to be that which formed the CRB_1 and the PSD defined by Dp
= 3. A fractal dimension value of 3 is considered by Turcotte (1986) to be the theoretical maximum value
14
that a single-stage primary fragmentation process can achieve, and would therefore be considered to have
formed by a high energy, efficient fragmentation mechanism. Perfect (1997) presents an alternative
theoretical fragmentation model where D can be greater than 3, so long as the rock is weak and susceptible
to fragmentation. This option does not seem likely for the strong gneissic rock at Venetia. The determined
D value of 3 for Blast 1829 therefore seems a robust sampling result, and characteristic of explosive
fragmentation in the local gneiss. D values of 3 are also considered representative of explosive
fragmentation by Jebrak (1997; see also Zhang 1996).
The energy required to create a fracture 1 m2 in size is known as the surface energy of the fracture. The
surface area of the particles is considered to be directly proportional to the energy used to create the
surface, where the coefficient of proportionality is the surface energy. In principle, the increase in fracture
area per m3 from the in-situ jointed rock PSD to the CRB_1 PSD can be used to calculate the energy
required to cause fragmentation (Raue et al. 2000). Unfortunately, there is no robust estimation of surface
energy for the Venetia rocks which are variable in composition due to layering and variable mineralogy.
There is an additional problem with such a calculation; since the full size range of particles has not been
sampled without bias, a direct energy calculation would not represent reality.
An alternative approach to this problem is to compare the PSD of a mine production Blast 1829 to the PSD
for CRB_1. The comparison is considered a more robust analytical approach because (a) the average
physical properties of the blast, inclusive of its variable gneiss mineralogy, is likely to be similar to that of
the gneiss breccias, (b) the photographic sample of the blast PSD suffers the exact same resolution and
dimensionality constraints as do the breccia samples, and (c) a specific size range of particles from the
breccias can be compared to an identical size range of particles from the blast.
Blast 1829 is known from mine records to have had an average ANFO (industrial explosives; ―Ammonium
Nitrate / Fuel Oil‖) explosive powder factor of 0.3 kg/m3. This is equivalent to 870 kJ/m
3 or 0.2 kg/m
3 of
TNT. To calculate the energy required to form CRB_1 the ratio of the surface area of the particles in
CRB_1 and the surface area of blast fragments was determined. The ratio is used to proportionally reduce
the value 0.3 kg/m3 to derive a value consistent with formation of the PSD of CRB_1.
Only particles between 1 m and 1 cm in diameter were used for the calculation. However, first the 3-D
distribution (3-D PSD) of particles was calculated from the two dimensional photograph sample using a
stereological conversion (e.g. Sahagian and Proussevitch 1998; Mock and Jerram 2005; Higgins 2006;
Marsh 2007). The PSD for each data set was converted to a 3-D PSD using the CSDCorrections 1.37
program (Higgins 2000). The accuracy of such stereological corrections is limited, in particular with
particles of non-spherical shape (Morgan and Jerram 2006). However, the shape of the particles from the
blast are similar to those in the breccias (Barnett 2004) and the poorly developed to absent preferred
15
orientation of particles in the CRB_1 breccia suggests that the accuracy of the relative comparison should
not be affected by a shape bias.
The calculations indicate that the energy causing the first-stage fragmentation (and forming CRB_1
breccia) can be estimated at 72% (0.22 kg ANFO/m3) of the mine production blast. The estimate of energy
required for primary brecciation is therefore within the same order of magnitude of energy release used to
explosively fragment the rock during mining. The calculated total energy for primary fragmentation of the
modeled volume of CRB (4.4 million m3) is 2.7x10
9 kJ (or 656 Tons of TNT). The close similarity between
the Dp trend in all the breccia data to that of the blast strongly suggests the first-stage brecciation contains a
component of explosive fragmentation.
If the stereologically corrected 3-D PSD is plotted on a graph (Fig.12) showing the percentage of particles
below a specific size, with only the abscissa in logarithmic scale, then the shape of the PSD is distinctive.
Note that the shape of the CRB_1 PSD’s is similar to that of the production blast, but slightly coarser in
particle size. This provides further supporting evidence of an explosive origin for the breccias.
4.2.2 Comparison with Pit Wall Failure
It is possible that pipe sidewall failures could have contributed to breccia formation in the K08 pipe, but the
characteristic talus fan collapse structures seen along the K02 pipe margins in the contact breccia facies
(Kurszlaukis and Barnett 2003) are not observed along the K08 margins. Analogous examples from the
Venetia K02 kimberlite geology are described by Kurszlaukis and Barnett (2003) and Brown et al. (2009).
The K02 sidewall fan structures are zones up to about 20 m wide of country rock breccias, which have
internal facies contacts dipping up to 34o (the angle of repose) away from the contact and fragment sizes
that increase from sub-millimeter size to mega-lithic blocks several metres in diameter towards the contact.
The absence of contact breccia fans in K08 does not preclude the possibility of sidewall collapse and
associated mass flows from filling the pipe, since subsidence of the pipe infill might cause chaotic mixing
and obscure such textures. However, the lack of evidence for steep-angled shearing along the pipe margins,
the presence and preservation of large-scale sub-horizontal fabrics and the presence of CRB_1 type breccia
facies (no preferred alignment) in contact with the pipe’s margins strongly suggests an under-cutting and
collapse mechanism dominated the K08 pipe infill. Such undercutting and collapse processes are likely to
be common in kimberlites and have been used to describe kimberlite pipe geometries and facies elsewhere
(e.g. Downes et al. 2007; Naidoo et al. 2004; Barnett 2008; Seghedi et al. 2009). An excellent example
from the Venetia cluster is described by Kurszlaukis and Barnett (2003) for collapsed fragments in the K02
pipe.
16
The sampled pit failure talus (Fig.10) is considered representative of the fragmentation process producing
contact fans. A similar energy comparison calculation was done with the pit failure PSD as was done for
blasting PSD. A comparison of the surface area of the failure particles to that of the explosive particles
indicates that the failure requires about 8% of the energy of the mine blast to form the slope failure PSD.
This is considered a significant difference to the CRB_1 breccia facies and demonstrates that much more
energy is required to form the CRB_1 than simple sidewall collapse. In addition, the stereologically
corrected 3D PSD for pit failure talus in Fig.12 is distinctly different to that of the breccias. It is concluded
that the CRB_1 PSD is not likely to represent a process dominated by rock mass collapse and flow
fragmentation.
4.2.3 Stage 1 Brecciation Alternatives
Alternative fragmentation mechanisms can be considered for the formation of the CRB_1 PSD. The first
alternative would be hydraulic fragmentation. Hydraulic fragmentation is a low energy form of
fragmentation that forms particles of similar size with negligible fine particles (e.g. Mort and Woodcock
2008). Hydraulic breccias are known to have a low D of circa 1 (Jébrak 1997). Hydraulic fragmentation
alone is therefore not likely to be responsible for the formation of CRB_1 facies.
Chemical corrosion can cause fragmentation, but no evidence for corrosion of the edges of the breccia
particles was observed. Dynamic mixing and fluidization of the particles over sustained periods of time can
cause significant fragmentation and formation of fine particles. However, these processes tend to cause
rounding of the particles, and so the angular shape (measured as similar in shape to explosion particles by
Barnett 2004) of the breccia clasts would seem to negate that possibility.
If a void is present between a collapsing hangingwall and pipe infill in a sub-terranean volcanic excavation,
then falling blocks may fragment on impact at the top of the infill. An identical process is understood to be
partly responsible for fragmentation in block cave mines. Models and expertise exist in the mining industry
that predict the degree of fragmentation based on initial jointing, rock properties and height from which the
hangingwall falls. The expected PSD from impact fragmentation is similar to the pit failure PSD in Fig.12
and requires a fall greater than 350 m to produce a similar fragmentation energy that formed CRB_1
(Kojovic pers. comm.. 2009). The dissimilar PSD curve and large height (the gap would have to be
maintained to form the entire breccia) required makes impact fragmentation unlikely to be a significant
contributor to the formation of CRB_1.
4.2.4 Constrained Comminution
Applied strain on a breccia body causes fragmentation by means of particle crushing (splitting) and/or
abrasion (corner rounding). Breccias undergoing shearing go through a phase of strain hardening where
17
particles are crushed and shear fracture planes start to be developed, followed by strain softening as the
strain localizes into increasingly finer grained gouge zones where grain sliding dominates. Larger particles
of decreasing size are progressively isolated by the developing high strain zones at decreasing scale (Ben-
Zion and Sammis 2003). The scale-invariant texture thus produced results in a fractal grain structure shown
by Sammis et al. (1987) with a D value of around 2.6 ± 0.11 (theoretical value of 2.58 by Turcotte 1986).
The fragmentation process is termed ―constrained comminution‖.
With constrained comminution the particles are constrained from moving under high confining pressures,
unlike other crushing and milling processes (e.g. Kelly and Spottiswood 1990). Adjacent grains apply
point-load compressive stresses on each other causing fragmentation. Sammis and Biegel (1989) interpret
constrained comminution to be more energy efficient than eroding/resupplying larger particles from outside
the high strain zone. They suggest the existence of an upper limit to the particles sizes developed in gouge
breccias, and observe a 1 cm limit for the PSD (D = 2.57) representing the Lopez fault in California, USA.
A lower fractal limit of 1–10 µm is suggested for the gouge, as limited by mineral cleavage and
intergranular porosity affects on cataclasis.
If the largest particles are isolated from each other by the development of high strain zones, it is not
possible to preferentially fragment them further. Shear fragmentation experiments on granular materials
(e.g. Bridgwater et al. 2003; Coop et al. 2004) show how PSD curves rotate around the largest particle,
which is preserved throughout the experiment. In order to do this the shear strain must be partitioned
around the largest particle. Many experiments show stabilization of the PSD after a certain amount of
strain, typically with a D of around 2.6 (Morrow and Byerlee 1989; Coop et al. 2004). Coop et al. (2004)
show that confining stress helps stabilize the PSD, which reached a D value of 2.57 in their experiments.
We suggest that the overall Dp (≈3) trend from the current study is not representative of constrained
comminution (≈2.6). Poorly sampled Dcom trends from the current study are interpreted to be equivalent to
the constrained comminution fragmentation results determined in the experiments discussed above. The
resolution of samples in our study does not extend below 1 cm and so Dcom trends would be expected to be
under-sampled and lost in the ―roll-off‖ effect. The one finer grained CRB_1 sample with a Dcom trend in
Fig.8 could indicate the on-set of constrained comminution in the CRB_1 facies due to compaction.
However, it might also be caused by statistical variance and alone cannot be considered convincing
evidence. Furthermore, the lack of fine particles and the presence of voids between particles in CRB_1
suggests that constrained comminution is not a significant fragmentation process in the CRB_1 facies. A
few drill core sub-domains (e.g. Fig.9) indicate the presence of Dcom trends with values between 2.6 and 2.7
(Fig.9). These sub-domains are of unknown facies, but interpreted to be most likely CRB_2 facies or at
least transitional to CRB_2.
18
4.2.5 Stage 1 Synthesis: Pre-fragmentation and undercutting
The structure and texture of the breccia layering within the K08 pipe suggests that the pipe growth process
was predominantly upwards by progressive collapse (caving) of the hangingwall by a subterranean volcanic
excavation. If this is the case, the question remains as to why the PSD distributions do not resemble that of
slope failures or gravity-driven collapse (Fig.12) more closely. CRB_1 has too few large particles and too
many small particles to represent a simple slope failure. By implication, too much energy has gone into the
formation of the CRB_1 PSD (0.22 kg rather than 0.02 kg ANFO/m3 as calculated previously). Since the
CRB_1 PSD (including the fractal Dp trend) resembles a PSD formed by explosive fragmentation more
closely, it is interpreted that it is the result of a phase of explosive pre-fragmentation. Subterranean
explosions may not be sufficiently energetic to eject material, but energetic enough to fragment the rock
and imprint an explosive fractal signature. The pre-conditioned rock mass is hypothesized to have collapsed
into a subterranean volcanic excavation, to create the overall horizontal layered structure preserved in
CRB_1 across most of the pipe (Fig.13).
Since the CRB_1 breccia lacks kimberlite material, with open interstitial space lined with drusy carbonate,
the pre-conditioning explosions are likely to involve a limited amount of magma. A small number of
magmatic or phreatomagmatic explosions may have occurred during primary breccia fragmentation, but
this would require any kimberlite to have been washed or dissolved out of the matrix by hydrothermal
circulation. The explosions are likely to have been centered on magmatic dykes, or dykes of preceding
volatile-fluids. There are certainly abundant fluids associated with kimberlite emplacement, the effects of
which may impact strongly on wall-rock composition and textures (Brown et al. 2007). Evidence for fluids
associated with the late cross-cutting dyke is observed as a serpentine halo (Fig.3b). We consider it possible
that preceding volatile-fluids may react violently with groundwater, but we acknowledge that we have no
physical or theoretical manner to quantify this possibility.
The preserved lithic content and large-scale structure suggests that K08 never ejected large volumes of
material, and possibly never even breached to surface (Fig.13). The emplacement behaviour of the volcano
must have changed over time, since after an initial highly explosive stage forming the CRB_1 breccia,
coherent kimberlite intruded the same level in the pipe without any evidence of explosive fragmentation.
This means that kimberlite magma alone did not fragment the country rock. The possibility that fluids alone
were controlling the brecciation of the country rock is unlikely, since CRB_1 does not have the fractal
signature of a hydraulic breccia. Hence, the availability of groundwater is interpreted to be the controlling
factor that regulated the explosivity of the intruding magma and/or associated volatile-fluids.
It must be questioned whether the preserved K08 pipe architecture represents early pipe development in
general, or a possible late pipe geometry modification process. Undercut pipe sidewall and hangingwall
caving processes are increasingly being recognized elsewhere in the Venetia cluster and other kimberlites
19
world-wide. K08 may be an example of such secondary pipe geometry modification and is in essence an
ancillary sideward development to K02. However, the explosive signature of the breccia PSD would still
need explanation.
Alternatively, K08 may be an example of incomplete pipe development (Fig.13). It could be argued that the
K08 pipe represents the `starved` sibling of K01 and K02 edifices, since the gas and magma supply would
preferentially use these more developed pathways to the surface and would have drained the scarcely
available groundwater to their deeper root zones thus halting explosive pipe development. The mass deficit
required at depth in K08 to allow hangingwall collapse is most easily explained as due to connectivity to
the nearby K02 pipe (Fig.13). The K02 pipe development may have encroached on the embryonic and
starved incipient K08 pipe by lateral quarrying, and partially under-cutting the pre-conditioned rock. Brown
et al. (2009) demonstrate that the K02 pipe was excavated to depths greater than 700 m before being filled
by gravitational collapse of the pipe sidewall. The well jointed and explosively pre-fragmented rock mass
at K08 could have similarly progressively collapsed downwards through the connection into the K02 pipe.
Finally, magma would still be able to intrude into the K08 breccia pipe without reacting explosively with
groundwater while the nearby volcanic pipes remain active, or prior to significant groundwater recharge.
Either way, the model suggests that upward growth processes should be considered as viable for kimberlite
pipe development, either early during proto-pipe emplacement towards the surface, or as a late stage
modification of established pipes.
4.3 Stage 2 Shearing Brecciation
The second stage of brecciation is interpreted to have formed CRB_2 from CRB_1, and is defined by an
increase in Dc to values of 3.4 and greater. By implication, larger particles are fragmented and the average
particle size decreases. The reduction in abundance of larger particles and the increase in abundance of
smaller particles is clearly illustrated in Fig.7. Since CRB_2 is associated with increased clast alignment,
smaller average clast size and zones of shearing, the secondary fragmentation is considered to have been
due to applied shear stresses.
Occasional Dcom trends observed in drill core data (e.g. Fig.9) are likely to be distinctive of constrained
comminution and are also consistent with shearing fragmentation. It is expected that the CRB_1 Dp trend
would be influenced by shearing fragmentation. Dp is most likely to slightly increase in value as
fragmented coarse particles are fed into the intermediate size ranges, but the D value change might be as
low as 0 to 0.3 and difficult to distinguish in the limited data. It is also possible that the Dp trend is reduced
in size range from both ends; i.e. decreasing Dc-Dp knick-point as the Dc range gets larger, and an
overprinting Dcom trend occurs in the smaller size ranges (Fig.11b)
20
Using similar assumptions and calculations for energy estimates as done for the first stage of
fragmentation, the additional energy required to go from CRB_1 to CRB_2 is 48% of that of the production
blast. This value is higher than what might be expected from shearing only and therefore the possibility that
additional local explosive fragmentation occurred might be considered. The abundance of particles per m2
smaller than 0.12 m in diameter is slightly greater than that measured for the production blast (Fig.10). It is
also possible that shearing induced fragmentation under high confining pressures is a very energy efficient
process of fragmentation.
Distinct Element Method (DEM) numerical modeling of the development of fault gouge zones by Guo and
Morgan (2007) shows the importance of normal compressive stress (σn) and intact rock strength
(Unconfined Compressive Strength, σc) on gouge zone properties. Their studies include compressive
stresses of up to 100 MPa. The higher the σn/σc ratio, the more rapid the localization of strain into thinner
gouge zones, but also the more effective is the process of early stage crushing fragmentation through the
growth of shear fractures. Fragmentation is most intense in the earliest stage of shearing until the friction
angle reaches its peak value (Guo and Morgan 2008). At low σn/σc ratios and higher strains (i.e. in later
stages of gouge development) abrasive rounding becomes more dominant (e.g. Bridgwater et al. 2003;
Coop et al. 2004). Laboratory fragmentation experiments using pure compressive stresses (e.g. Lee and
Farmoomand 1967; McDowell and Bolton 1998; Nakata et al. 2001; and references in McDowell et al.
1996) also show that crushing dominates fragmentation at higher applied stress.
Most published analogue experiments reviewed during this study are undertaken at confining pressures less
than 1 MPa. Significantly higher stresses could easily have been present in the K08 pipe. If the breccia pile
was only 100 m higher than the current exposure then the vertical confining stress would have varied at
least between 2 and 7 MPa from the top to the base of the currently preserved pile of CRB (using a rock
density of 2.84 g/cm3 and a bulking factor of 1.3). In these confined conditions shear fracturing is likely to
be dominant and possibly energy efficient.
Blenkinsop’s (1991) study of Cajon Pass fault breccias from California, USA, also show the preservation of
constrained comminution breccias (D = 2.67), as well as preferential fragmentation of coarser particles with
D values up to 5.5; as seen in our study. He explains the Cajon Pass breccia PSD as a result of the final
stage of strain with increased confining stress causing a transition from interparticle sliding to interparticle
fracture. The breccia is therefore not in a state of equilibrium, such that the late change in stress state
induces preferential shear fragmentation of the coarse particle size fraction.
We envisage a similar situation for the K08 breccias. CRB_2 appears to be preserved in a range of strain
states across the K08 pipe, typically showing the earliest stages of shearing characterized by the
development of shear fractures and particle crushing. Shear fracturing of the largest particles causes
21
increased Dc values (> 3.4). Sub-domains with established Dcom trends observed in particle sizes over 10 cm
(Fig.9) may indicate a breccia in a more advanced state of shearing.
Our observations show that magma of at least two intrusions entrained lithic clasts from a presumably un-
cemented CRB breccia facies. The kimberlite has adequate viscosity to drag and suspend the particles,
resulting in a matrix supported texture, where preferred clast alignment indicates magma flow direction.
Clast alignment in non-linear, semi-circular patterns is interpreted to indicate a radial expanding flow
pattern caused by injection of magma into the breccia. In contrast, the late cross-cutting dyke appears to
have intruded through at least partially cemented breccia by fracturing the breccia and forcing open a
conduit. The deep HKBB/MVKBB and HKB/MVKB facies indicates the presence of volcanic processes
below the main CRB breccia facies that intrudes and consequently dilutes the number of lithic clasts, and
cause textures associated with magma fragmentation.
We do not have evidence to suggest what volcanic processes occurred beneath the K08 CRB facies. It can
be speculated that the close proximity of the K08 pipe to the K02 pipe may indicate a connection between
the two pipes at depth (Fig.13). K02 may then be a source of volcaniclastic kimberlite to the lower K08
pipe, as is the case for the mapped K02 extension towards K03 (Kurszlaukis and Barnett 2003; Brown et al.
2009). We therefore suggest that shearing to form CRB_2 could have occurred either during early magma
injection into the unconsolidated breccia, or during late cross-cutting dyke emplacement, or from dynamic
volcanic processes occurring in the lower pipe, possibly even linked to an active K02 eruption centre.
5. Conclusion
The study of the Venetia K08 kimberlite pipe offers insight into some of the processes of wall-rock
fragmentation that contribute to the development of volcanic pipes. Observations and data derived from pit
mapping and drill core logging are used to present a 3-D model of the pipe (Fig.4 and Fig.13), including a
domain of 4.4 million m3 of country rock breccia. Detailed sampling and analysis of the breccia PSDs are
used to build an interpretation of the stages of development of the breccia.
At least two stages of breccia formation are interpreted, forming a CRB_1 facies and a CRB_2 facies. The
first-stage breccia facies (CRB_1) is interpreted to have been formed by upward-moving collapse of an
explosively pre-conditioned hangingwall into a subterranean volcanic excavation. Our analysis suggests
that the pre-conditioning is most likely to have been caused by explosions, either phreatic or
phreatomagmatic in nature, with a total energy output of 2.7x10⁹ kJ (656 tons of TNT). The analysis is
based on a comparison of the breccia PSD (including fractal statistics) with the PSD formed by mine
production blasts and mine slope failures at Venetia Mine.
22
The second-stage breccia facies (CRB_2) is interpreted to have formed due to complex adjustments in the
pipe causing shearing and re-fragmentation of the breccia. The driving force for the shearing may be the
observed infiltrating magma and/or cross-cutting intrusions, or the unknown volcanic processes responsible
for the fragmentation textures observed in the kimberlite facies below the breccia.
We suggest that the observations and analyses of the K08 pipe presented in this paper are most easily
interpreted by a model of upward pipe propagation, either early during proto-pipe emplacement towards the
surface, or as an ancillary sideward growth of the established K02 pipe. The initial pipe development may
have been interrupted by the migration of volcanic activity to the adjacent K01 and/or K02 pipes.
6. Acknowledgements
De Beers Consolidated Mines is thanked for the support we received and permission to publish the data.
Tom Gernon and Claude Jaupart are thanked for their constructive and thoughtful reviews. Comments by
Dirk van Schalkwyk are appreciated and helped simplify thoughts gone awry. Special thanks to Matthew
Pierce, Toni Kojovic and Steve Sparks for discussions, analysis and well aimed questions. Venetia Mine
geologists are acknowledged for their aid in sampling drill core. Brad Meiring and students Marie, Martin
and JP are thanked for their contributions to data collection.
7. References
Bahnemann KP (1986) A review of the geology of the Messina copper deposits, northern Transvaal. In:
Anhauesser CR, Maske S (eds) Mineral Deposits of Southern Africa, Geological Society of South Africa,
Johannesburg, pp. 1671-1688
Barnett WP (2003) Geological control on slope failure mechanisms in the open pit at the Venetia Mine. S
Afr J Geol 106(2):149-164
Barnett WP (2004) Subsidence breccias in kimberlite pipes – an application of fractal analysis. Lithos
76:299-316
Barnett WP (2006) The Mechanics of Kimberlite Emplacement. Dissertation, University of KwaZulu-
Natal, South Africa
Barnett WP (2008) The rock mechanics of kimberlite volcanic pipe excavation. J Volcanol Geotherm Res.
doi:10.1016/j.jvolgeores.2007.12.021
23
Ben-Zion Y, Sammis CG (2003) Characterization of Fault Zones. Pure Appl Geophys 160:677-715
Biegel RL, Sammis CG, Dieterich JH (1989) The frictional properties of a simulated gouge having a fractal
particle distribution. J Struct Geol 11:827– 846
Blenkinsop TG (1991) Cataclasis and Processes of Particle Size Reduction. Pure Appl Geophys 136(1):59-
86
Bridgewater J, Utsumi R, Zhang Z, Tuladhar T (2003) Particle attrition due to shearing – the effects of
stress, strain and particle shape. Chem Eng Sci 58:4649-4665
Brown RJ, Kavanagh J, Sparks RSJ, Tait M, Field M (2007) Mechanically disrupted and chemically
weakened zones in segmented dikes systems cause vent localization: Evidence from kimberlite volcanic
systems. Geology 35(9):815-818
Brown R J, Tait M, Field M, Sparks R S J (2009) Geology of a complex kimberlite pipe (K2 pipe, South
Africa): insights into conduit processes during explosive ultrabasic eruptions. Bull Volcanol.
doi:10.1007/s00445-008-0211-4
Büttner R, Dellino P, La Volpe L, Lorenz V, Zimanowski B (2002) Thermohydraulic explosions in
phreatomagmatic eruptions as evidenced by the comparison between pyroclasts and products from Molten
Fuel Coolant Interaction experiments. J Geophys Res. doi:10.1029/2001JB000792
Cas R, Porritt L, Pittari A, Hayman P (2008) A new approach to kimberlite facies terminology using a
revised general approach to the nomenclature of all volcanic rocks and deposits: Descriptive to genetic. J
Volcanol Geotherm Res 174(1-3):226-240
Cas R, Porritt L, Pittari A, Hayman P (2009) A practical guide to terminology for kimberlite facies: A
systematic progression from descriptive to genetic, including a pocket guide. Lithos 112(1):183-190
Coop MR, Sorenson KK, Bodas Freitas T, Georgoutsos G (2004) Particle breakage during shearing of a
carbonate sand. Géotechnique 54(3):157-163
Downes PJ, Ferguson D, Griffin BJ (2007) Volcanology of the Aries micaceous kimberlite, central
Kimberley Basin, Western Australia. J Volcanol Geotherm Res 159:85–107
24
Esterle JS, Kojovic T, O’Brien G, Scott AC (1996) Coal breakage modeling: A tool for managing fines
generation. In: Howarth D, Gurgenci H, Sutherland D, Firth B (eds) Proceedings of the 1996 Mining
Technology Conference, Cooperative Research Centre for Mining Technology and Equipment, Fremantle
WA, pp. 211-228
Field M, Stiefenhofer J, Robey J, Kurszlaukis S (2008) Kimberlite hosted diamond deposits of southern
Africa: A review. Ore Geol Rev 30:33-75
Guo Y, Morgan JK (2008) Fault gouge evolution and it dependence on normal stress and rock strength –
Results of discrete element simulations: Gouge zone micromechanics. J Geophys Res. doi:
10.1029/2006JB004525
Guo Y, Morgan JK (2007) Fault gouge evolution and it dependence on normal stress and rock strength –
Results of discrete element simulations: Gouge zone properties. J Geophys Res. doi:
10.1029/2006JB004524
Higgins MD (2000) Measurement of crystal size distributions. Am Mineral 85:1105-1116
Higgins MD (2006) Verification of ideal semi-logarithmic, lognormal or fractal crystal size distributions
from 2D datasets. J Volcanol Geotherm Res 154(1/2):8-16
Hisada E (2004) Clast-size analysis of impact-generated pseudotachylite from Vredefort Dome, South
Africa. J Struct Geol 26:1419-1424
Jébrak M (1997) Hydrothermal breccias in vein-type ore deposits: a review of mechanisms, morphology
and size distribution. Ore Geol Rev 12:111–134
Kaminski E and Jaupart C (1998) The size distribution of pyroclasts and the fragmentation sequence in
explosive volcanic eruptions. J Geophys Res 103(B12):19759-29779
Kelly EG, Spottiswood DJ (1990). The Breakage Function; What is it really? Miner Eng 3(5):405-414
Kurszlaukis S, Büttner R, Zimanowski B, Lorenz V (1998) On the first experimental phreatomagmatic
explosion of a kimberlite melt. J Volcanol Geotherm Res 80:323-326
Kurszlaukis S, Barnett WP (2003) Volcanological and Structural Aspects of the Venetia Kimberlite Cluster
– a case study of South African kimberlite maar-diatreme volcanoes. S Afr J Geol 106(2):165-192
25
Laznicka P (1988) Breccias and coarse fragmentites. Petrology, environments, associations, ores. In:
Developments in Economic Geology Vol 25, Elsevier, New York
Lee KJ, Farhoomand I (2003) Compressibility and crushing of granular solids in anisotropic triaxial
compression. Canadian Geotechnical Journal, Ottawa, Canada, 4(1):68-86
Lorenz V (1975) Formation of phreatomagmatic maar-diatreme volcanoes and its relevance to the
formation of kimberlite diatremes. In: Ahrens LH, Dawson JB, Duncan AR, Erlank AJ (Eds.), Proceedings
of the 1st International Kimberlite Conference, Cape Town, South Africa 1973. Phys Chem Earth 9:17-27
Lorenz V, Kurszlaukis S (2007) Root zone processes in the phreatomagmatic pipe emplacement model and
consequences for evolution of maar-diatreme volcanoes. J Volcanol Geotherm Res 159:4-32
Marsh BD (2007) Crystallization of Silicate Magmas Deciphered Using Crystal Size Distributions. J. Am.
Ceram. Soc 90(3):746–757
McDowell GR, Bolton MD, Robertson D (1996) The fractal crushing of granular materials. J Mech Phys
Solids 44(12):2079-2102
McDowell GR, Bolton MD (1998) On the micromechanics of crushable aggregates. Geotechnique
48(5):667-679
Medlin CC (2005) Spherical, multi-shelled, juvenile magmaclasts in kimberlite, Venetia Mine.
Dissertation, University of Pretoria, South Africa
Mitchell RH (2008) Petrology of hypabyssal kimberlites: Relevance to primary magma compositions. J
Volcanol Geotherm Res 174(1-3):1-8
Mock A, Jerram DA (2005) Crystal Size Distributions (CSD) in Three Dimensions: Insights from the 3D
Reconstruction of a Highly Porphyritic Rhyolite. J Petrol 46(8):1525-1541
Morgan DJ, Jerram DA (2006) On estimating crystal shape for crystal size distribution analysis. J Volcanol
Geotherm Res. doi:10.1016/j.volgeores.2005.09.016
Mort K, Woodcock NH (2008) Quantifying fault breccia geometry: Dent Fault, NW England. J Struct Geol
30:701-70
26
Moss S, Russell JK, Andrews GDM 2008 Progressive infilling of a kimberlite 602 pipe at Diavik,
Northwest Territories, Canada: Insights from volcanic facies architecture, textures, and granulometry. J
Volcanol Geotherm Res 174:103-116.
Naidoo P, Stiefenhofer J, Field M, Dobbe R (2004) Recent advances in the geology of Koffiefontein Mine,
Free State Province, South Africa. Lithos 76:161–182
Nakata Y, Hyodo M, Hyde AFL, Kato Y, Murata H (2001) Microscopic particle crushing and sand
subjected to one-dimensional compression, Soils and Foundations. Japanese Geotechnical Society
41(1):69-82
Perfect E (1997) Fractal models for the fragmentation of rocks and solids: a review. Eng Geol 48:185-198
Phillips D, Kiviets GB, Barton ES, Smith CB, Viljoen KS, Fourie LF (1999) 40Ar/39Ar dating of
kimberlites and related rocks: problems and solution. In: Proceedings of the 7th International Kimberlite
Conference, Cape Town, South Africa, pp. 677-687
Pierce M, Gaida M, DeGagne D (2009) Estimation of Rock Block Strength. In: Diederichs M, Grasselli G
(eds) RockEng09 (Proceedings, 3rd CANUS Rock Mechanics Symposium, Toronto, May 2009, Paper No.
4360.
Rasband WS (1997-2009) ImageJ. U. S. National Institutes of Health, Bethesda, Maryland, USA,
http://rsb.info.nih.gov/ij/. Accessed 1 September 2003.
Raue H, Büttner R, Lorenz V, Zimanowski B (2000) Energy budget of a typical Eifelmaar volcanic
explosion. In: International Maar Conference, Daun/Vulkaneifel, Extended Abstracts, Terra Nostra
2000(6):418-422
Sahagian DL, Proussevitch AA (1998) 3D particle size distributions from 2D observations: stereology for
natural applications. J Volcanol Geotherm Res 84:173-196
Sammis CG, King G, Biegel R (1987) The kinematics of gouge deformation. Pure Appl Geophys 125:777-
812
Sammis CG, Biegel R (1989) Fractals fault gouge and friction. Pageoph 131(1/2):255-271
27
Seggie AG, Hannweg GW, Colgan EA, Smith CB (1999) The geology and geochemistry of the Venetia
kimberlite cluster, Northern Province, South Africa. In: Proceedings of the 7th International Kimberlite
Conference, Cape Town, South Africa, pp. 750-756
Seghedi I, Maicher D, Kurszlaukis S (2009) Volcanology of Tuzo pipe (Gahcho Kué cluster) — Root–
diatreme processes re-interpreted. Lithos. doi:10.1016/j.lithos.2009.04.027
Sparks RSJ, Baker L, Brown R, Field M, Schumacher J, Stripp G, Walters AL (2006) Dynamic constraints
on kimberlite volcanism. J Volcanol Geotherm Res 155:18-48
Tait M, Brown RJ, Mnyama A (2006) Internal architecture of the Venetia K1 kimberlite: A new geological
model and implications for kimberlite emplacement processes. Venetia Mine, Limpopo RSA. In: 2006
Kimberlite Emplacement Workshop: Long Abstracts, Saskatoon, Canada.
Taylor RG (1992) Ore Textures, Recognition and Interpretation: Vol1, Infill. Economic Geology Research
Unit, Townsville, Australia
Turcotte DL (1986) Fractals and fragmentation. J Geophys Res 91:1921-1926
Turcotte DL (1997) Fractals and Chaos in Geology and Geophysics. Cambridge University Press, New
York
Zhang J (1996) Research on the fragment-size model for blasting in jointed rock mass. In: Mohanty (ed)
Rock Fragmentation by Blasting, Balkema, Rotterdam, pp. 19-24
Zimanowski B, Wohletz K, Dellino P, Büttner R (2003) The volcanic ash problem. J Volcanol Geotherm
Res 122:1–5
28
Fig.1 Plan view of the kimberlite pipes in the Venetia cluster as modeled in 3D using GEMS software. The
reference grid lines are based on local mine co-ordinates and are labeled in metres. The inset shows the
location of Venetia in southern Africa
Fig.2 Overview photograph of the northern face of the Venetia Mine pit (2007), showing the extent of
outcropping K08 pipe breccia. The latest cross-cutting kimberlite dyke intrusions are shaded. Breccia facies
domain contacts have been interpreted remotely and are represented by solid lines. CRB_2 facies is hatched
by dashed lines representing the interpreted shear fabric orientation. The sub-horizontal layering of the
CRB_1 facies is indicated by the fine dotted lines. Haulage ramps into the open pit are visible on the lower
left, lower right and inclined gently from left to right through the centre of the image
Fig.3 Vertical face mapping examples from the K08 pipe. View northwards. Top: Three facies distinctive
of the near-surface exposures including (i) hypabyssal intrusive breccia (shaded ―HKB‖) incorporating
xenoliths of pre-existing breccia, (ii) cemented country rock breccia (―CRB_1‖) with near-horizontal
layering, and (iii) sheared country rock breccia (―CRB_2‖) with shear fabric dipping shallowly towards
right. Bottom: CRB_2 facies with penetrative shear fracture planes dipping at shallow to intermediate
angles towards the left, away from the pipe contact. Synthetic fracture geometry along the most prominent
shears indicates normal shear sense. An alteration zone represented by serpentine in the breccia matrix is
lightly shaded. Sills of the latest intruding kimberlite dyke (―HK Dyke‖) are darkly shaded
Fig.4 3D model view towards the northeast of the interpreted K08 pipe facies as modeled using GEMS
software. Facies domains are shown and labeled with the dominant rock types. Labels are: CRB = country
rock breccia; HK = hypabyssal kimberlite; HKB = hypabyssal kimberlite breccia (< 50% lithic clasts);
HKBB = hypabyssal kimberlite breccia (> 50% lithic clasts); MVKB = massive volcaniclastic kimberlite
breccia (< 50% lithic clasts); MVKBB = massive volcaniclastic kimberlite breccia (> 50% lithic clasts).
Five drill holes that intersect the pipe are shown. The two holes discussed in the text are labeled
Fig.5 Photo micrographs of HKB and MVKB samples from drill hole intersections below 225 m. a) HKB
that is coherent in texture, dominated by variably altered olivine macrocrysts and partially altered lithic
fragments set within a matrix of serpentine, carbonate and local patches of altered irresolvable clay; b)
MVKB with an inequigranular distribution of crystal and lithic debris with olivine macrocrysts altered to
carbonate and serpentine, calcite commonly in local patches and pools between framework grains. It has a
distinctly fragmental appearance
Fig.6 Photograph of the gradationally sheared contact between the two facies of breccia, CRB_1 and
CRB_2. View northwards. The contact between the two facies is partly transitional, but the particles below
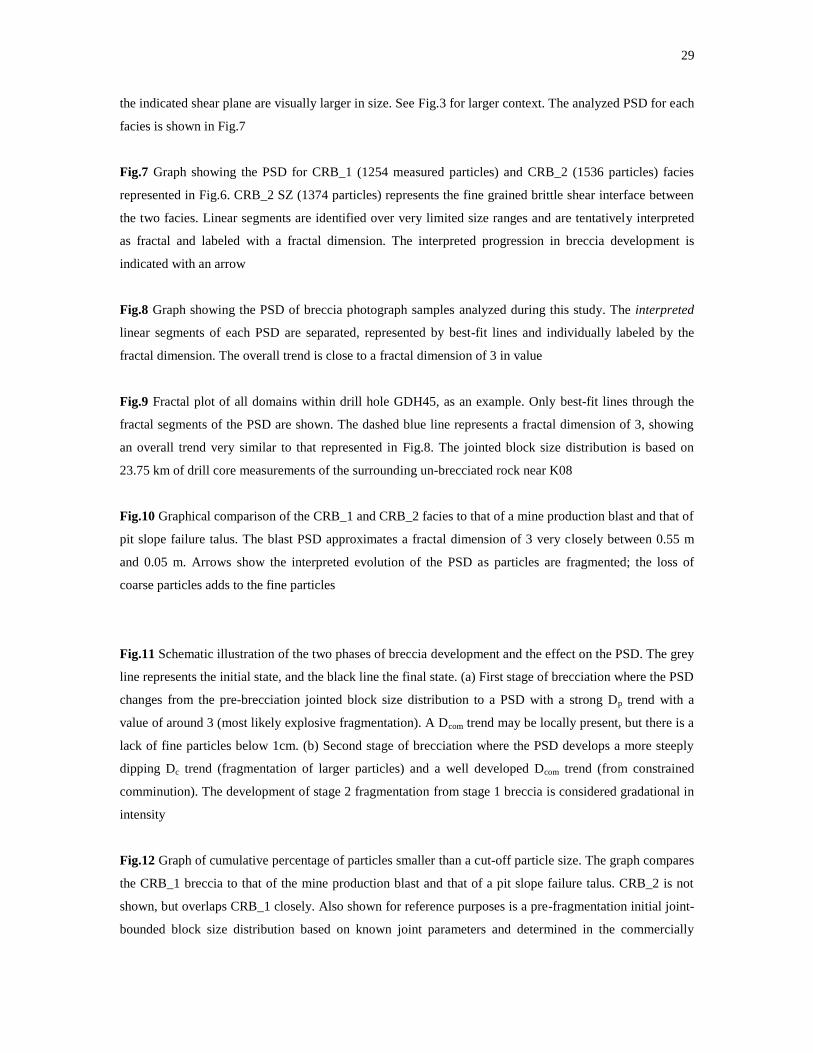
29
the indicated shear plane are visually larger in size. See Fig.3 for larger context. The analyzed PSD for each
facies is shown in Fig.7
Fig.7 Graph showing the PSD for CRB_1 (1254 measured particles) and CRB_2 (1536 particles) facies
represented in Fig.6. CRB_2 SZ (1374 particles) represents the fine grained brittle shear interface between
the two facies. Linear segments are identified over very limited size ranges and are tentatively interpreted
as fractal and labeled with a fractal dimension. The interpreted progression in breccia development is
indicated with an arrow
Fig.8 Graph showing the PSD of breccia photograph samples analyzed during this study. The interpreted
linear segments of each PSD are separated, represented by best-fit lines and individually labeled by the
fractal dimension. The overall trend is close to a fractal dimension of 3 in value
Fig.9 Fractal plot of all domains within drill hole GDH45, as an example. Only best-fit lines through the
fractal segments of the PSD are shown. The dashed blue line represents a fractal dimension of 3, showing
an overall trend very similar to that represented in Fig.8. The jointed block size distribution is based on
23.75 km of drill core measurements of the surrounding un-brecciated rock near K08
Fig.10 Graphical comparison of the CRB_1 and CRB_2 facies to that of a mine production blast and that of
pit slope failure talus. The blast PSD approximates a fractal dimension of 3 very closely between 0.55 m
and 0.05 m. Arrows show the interpreted evolution of the PSD as particles are fragmented; the loss of
coarse particles adds to the fine particles
Fig.11 Schematic illustration of the two phases of breccia development and the effect on the PSD. The grey
line represents the initial state, and the black line the final state. (a) First stage of brecciation where the PSD
changes from the pre-brecciation jointed block size distribution to a PSD with a strong Dp trend with a
value of around 3 (most likely explosive fragmentation). A Dcom trend may be locally present, but there is a
lack of fine particles below 1cm. (b) Second stage of brecciation where the PSD develops a more steeply
dipping Dc trend (fragmentation of larger particles) and a well developed Dcom trend (from constrained
comminution). The development of stage 2 fragmentation from stage 1 breccia is considered gradational in
intensity
Fig.12 Graph of cumulative percentage of particles smaller than a cut-off particle size. The graph compares
the CRB_1 breccia to that of the mine production blast and that of a pit slope failure talus. CRB_2 is not
shown, but overlaps CRB_1 closely. Also shown for reference purposes is a pre-fragmentation initial joint-
bounded block size distribution based on known joint parameters and determined in the commercially

30
available software BCF (Block Cave Fragmentation, by E.S. Esterhuizen). The arrow shows the expected
direction of evolution of the PSD, from joint-bounded blocks to CRB after fragmentation
Fig.13 Schematic illustration of the possible architecture of the K08 pipe. View northwards. Concepts
discussed in the paper are presented, such as (i) explosive preconditioning of the rock prior to collapse, (ii)
undercutting and gravitational collapse of the hangingwall, (iii) zones of breccia shearing and
refragmentation, (iv) a possible link to a source of volcaniclastic material in K02, and (v) multiple phases
of magmatic kimberlite intrusion. The image does not represent the final state of the K02 pipe; see Brown
et al. (2009) for sections through K02
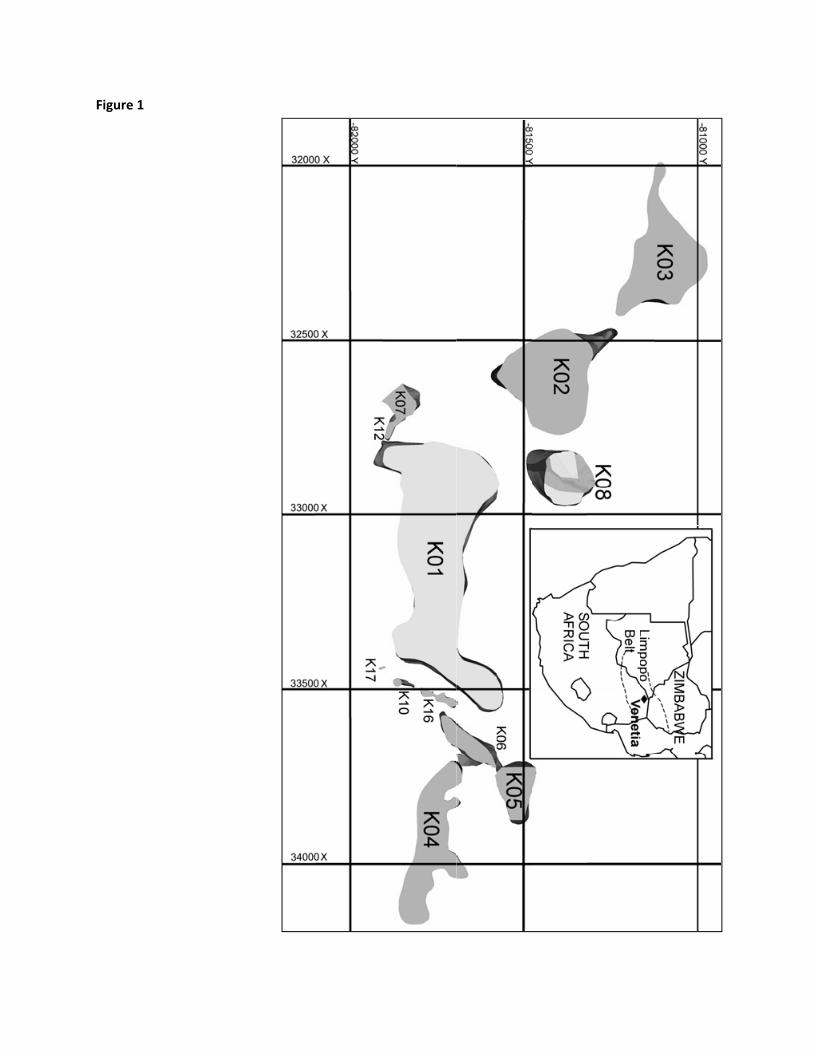
Figure 1
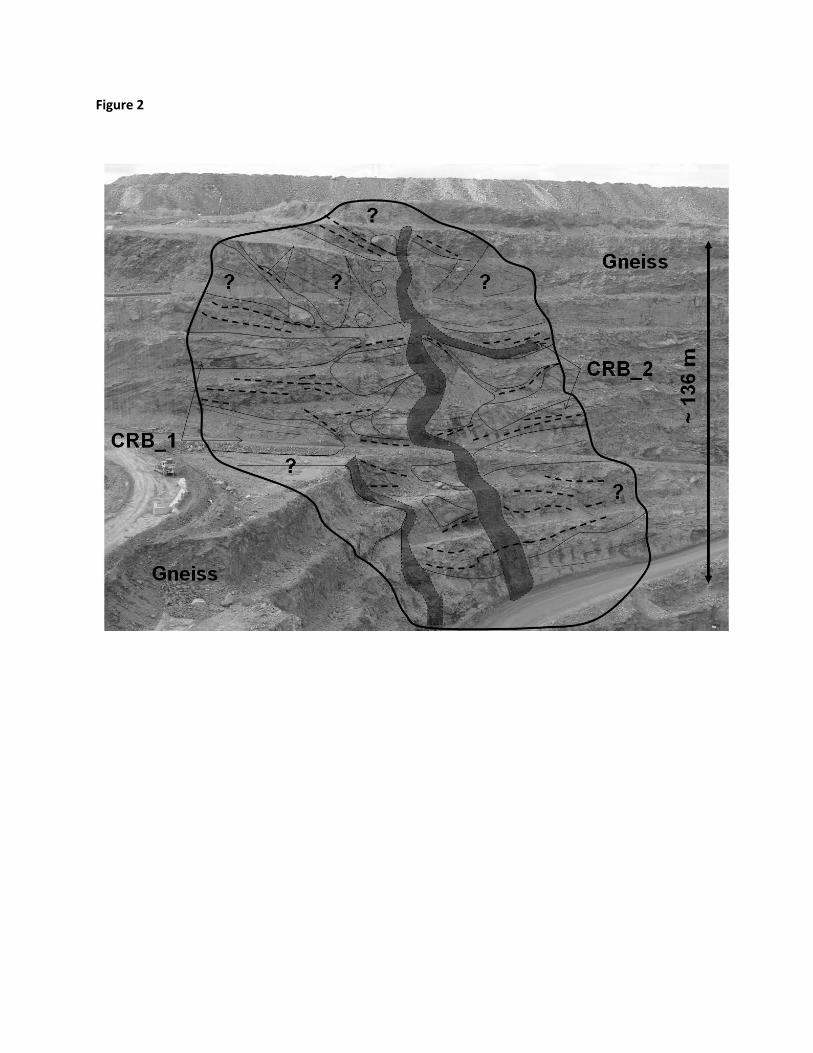
Figure 2
Figure 3
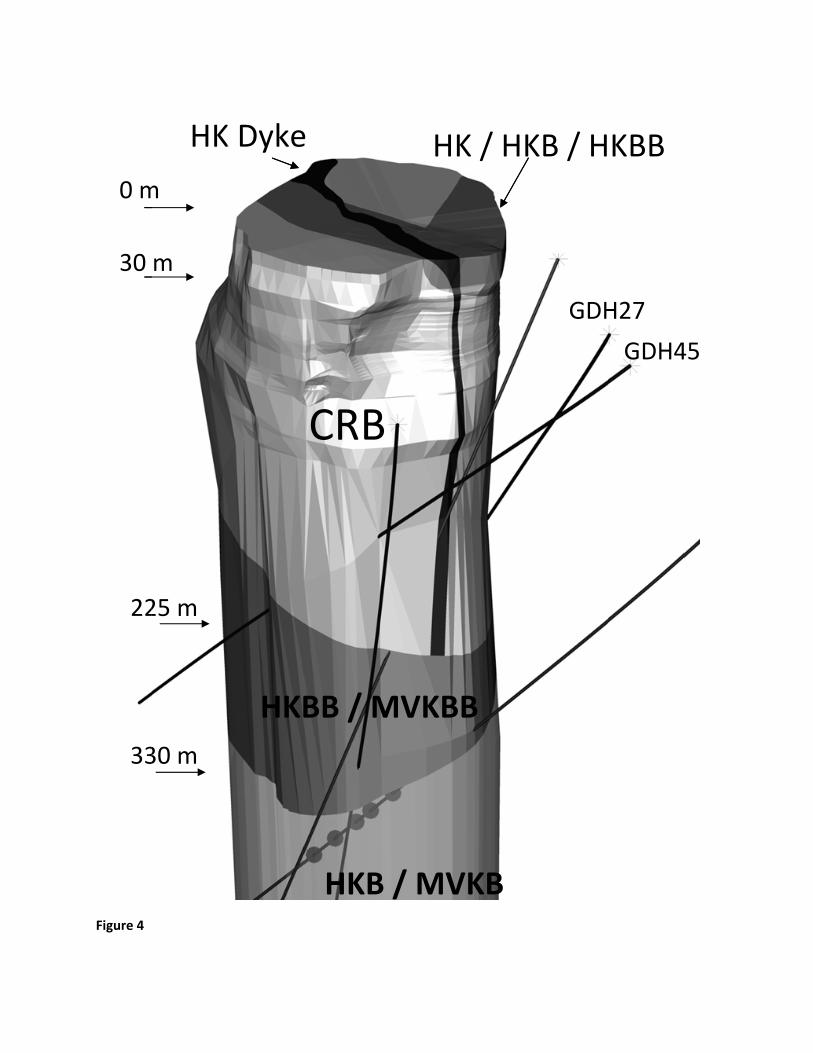
Figure 4
0 m
22
30
33
HK
m
25 m
m
30 m
K Dyke
HKB
CRB
e
HKB
BB / M
B
H
B / MV
MVKB
K / HK
VKB
BB
KB / H
GDH
KBB
H27
GDH4
45
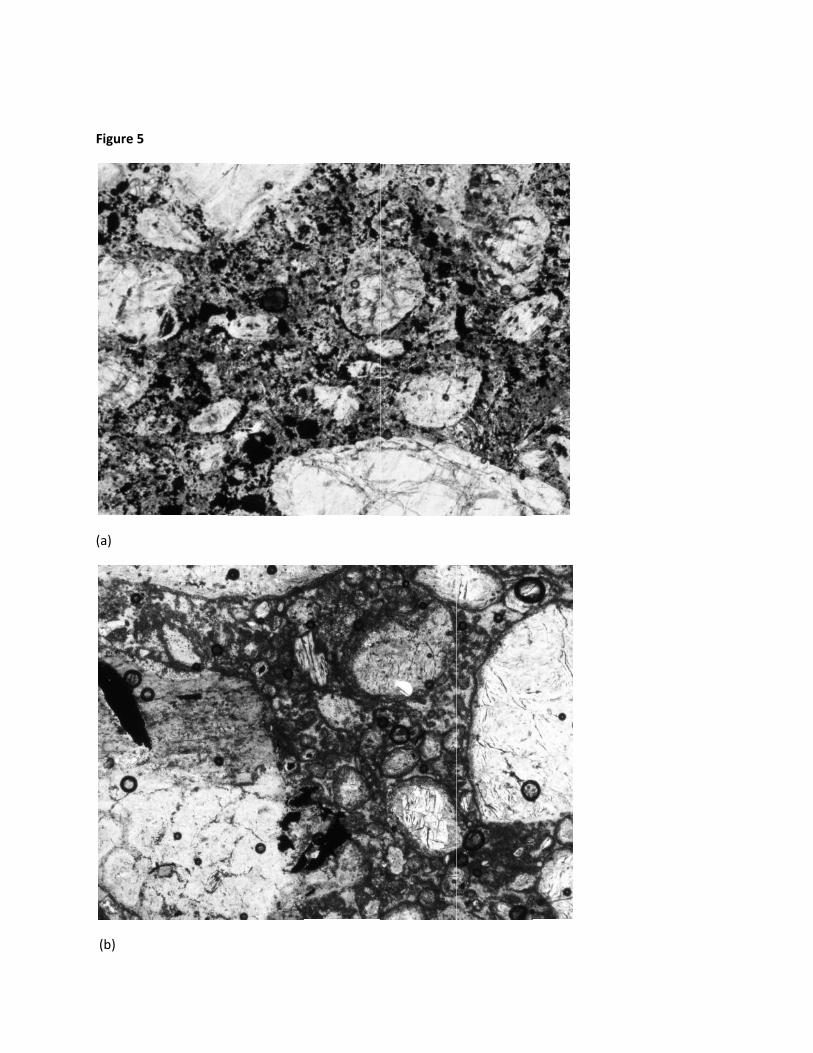
Figure 5
(a)
(b)
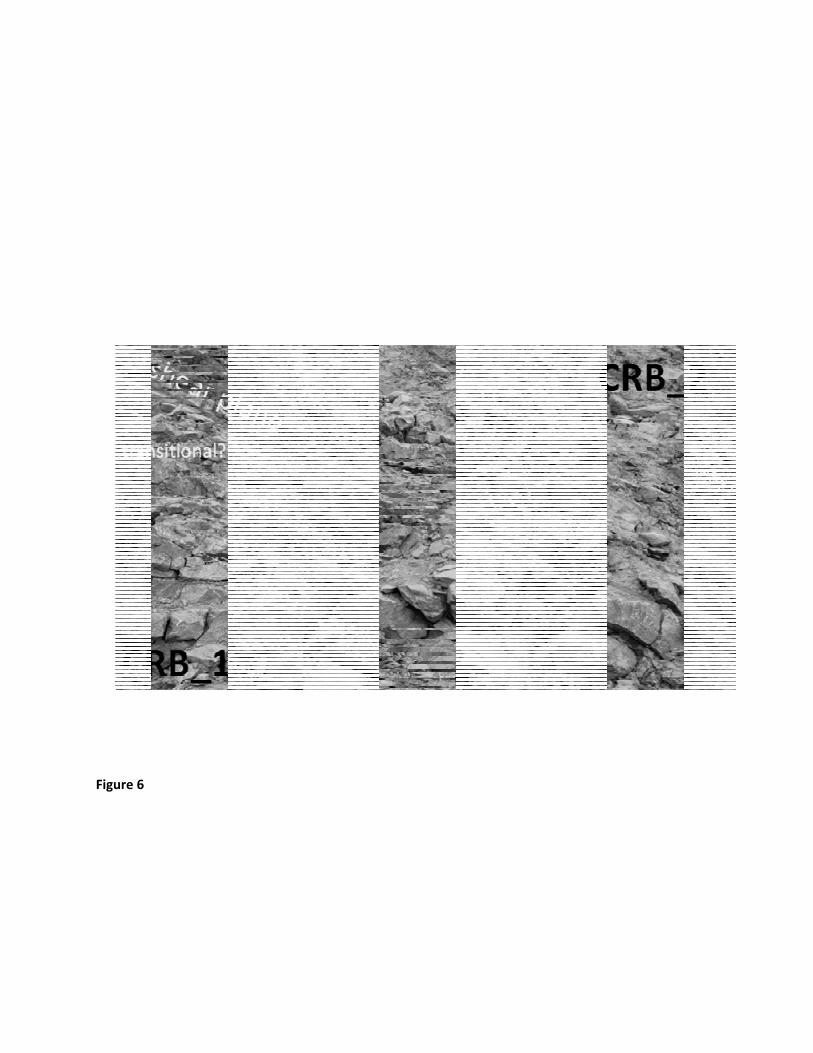
Figure 6
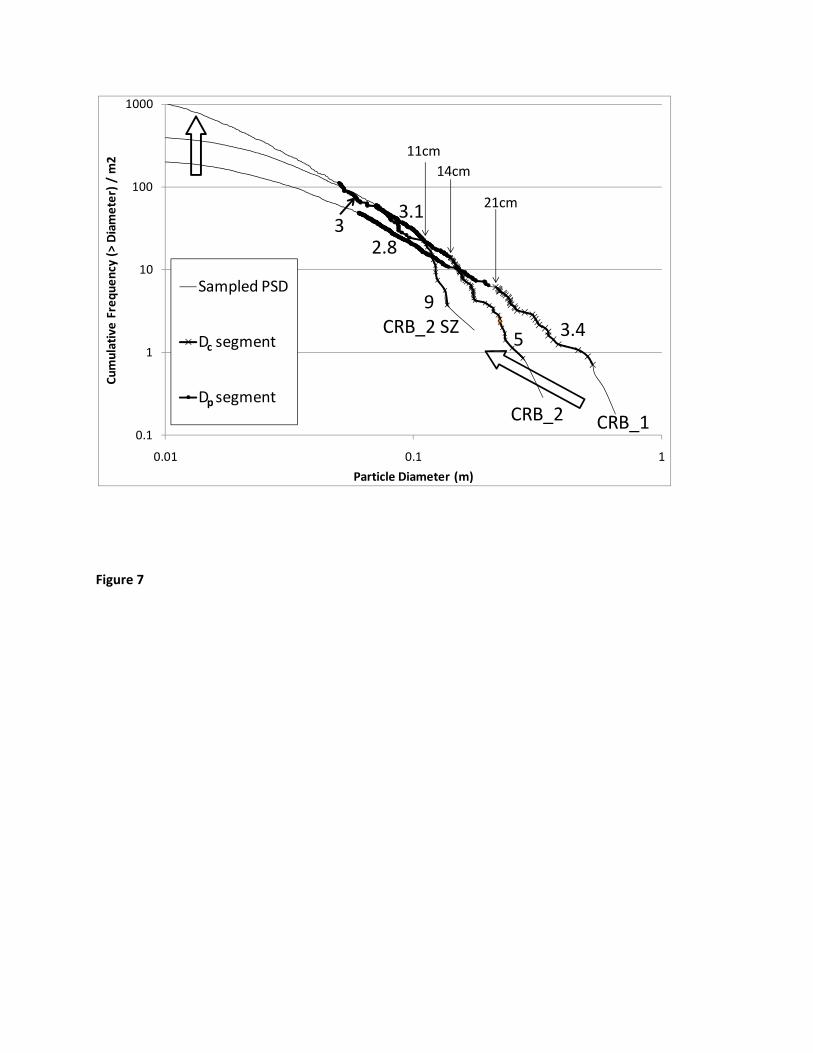
Figure 7
0.1
1
10
100
1000
0.01 0.1 1
Cumulative Freq
uency (> Diameter) /
m2
Particle Diameter (m)
Sampled PSD
D segment
D segment
3.45
9
3.1
2.83
CRB_2 CRB_1
CRB_2 SZ
11cm14cm
21cm
c
p
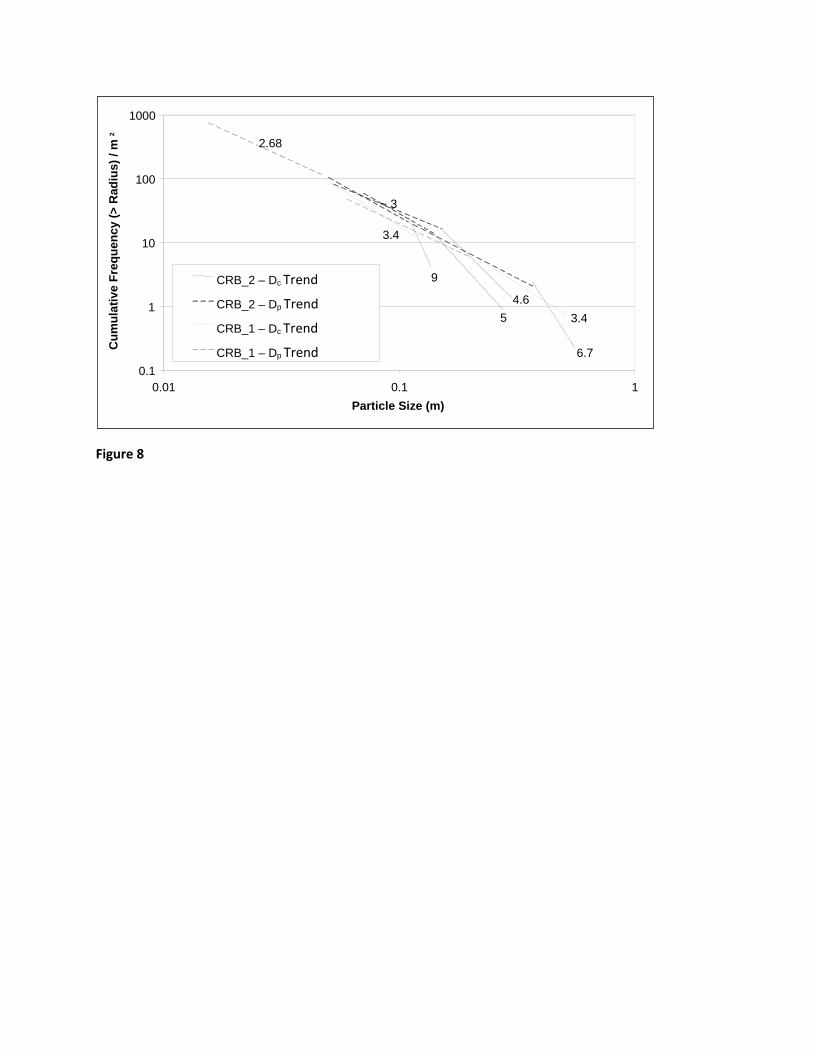
Figure 8
4.6
6.7
5 3.4
9
~ 3
2.68
3.4
0.1
1
10
100
1000
0.01 0.1 1 Particle Size (m)
CRB_2 – Dc Trend
CRB_2 – Dp Trend
CRB_1 – Dc Trend
CRB_1 – Dp Trend
2 C
umul
ativ
e Fr
eque
ncy
(> R
adiu
s) /
m
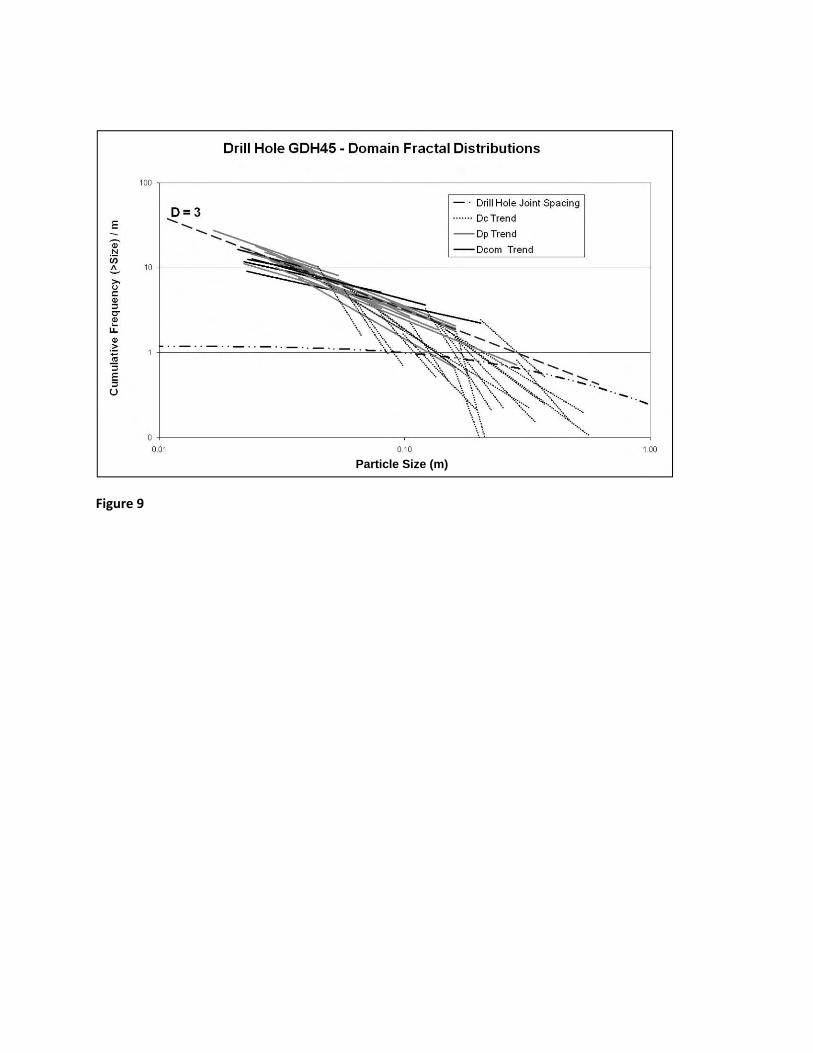
Figure 9
Particle Size (m)
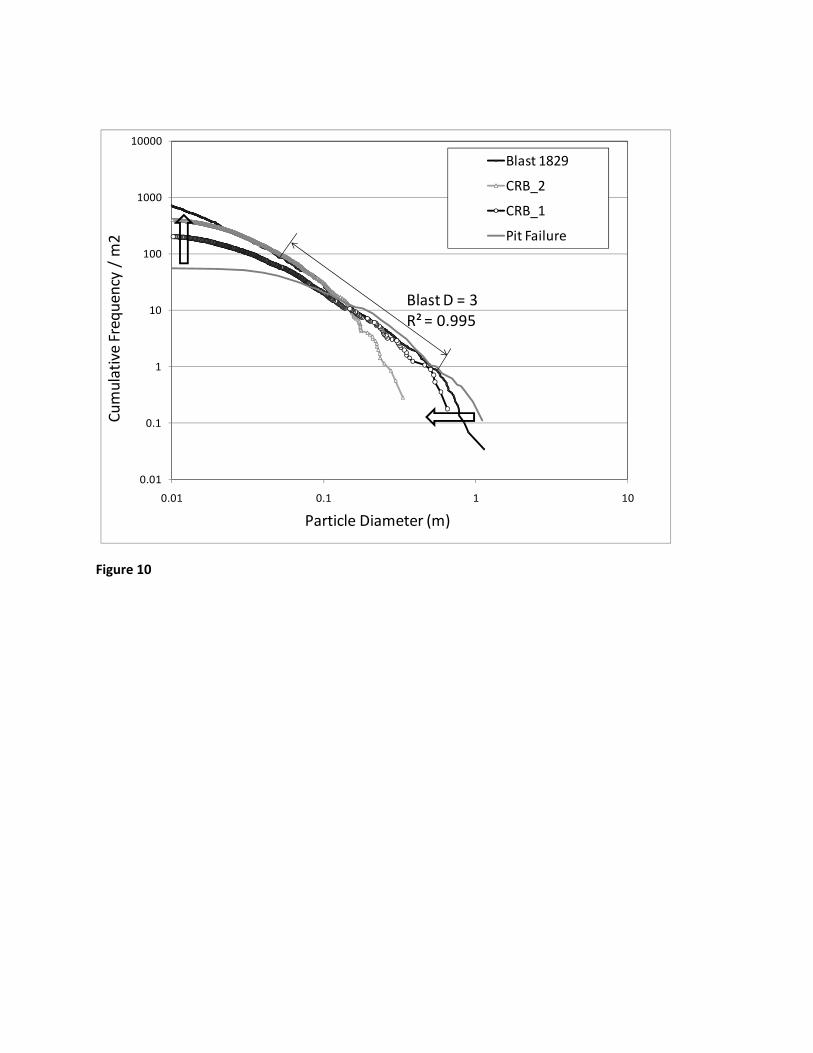
Figure 10
0.01
0.1
1
10
100
1000
10000
0.01 0.1 1 10
Blast 1829
CRB_2
CRB_1
Pit Failure
Cumulative Frequency/ m2
Particle Diameter (m)
Blast D = 3R² = 0.995
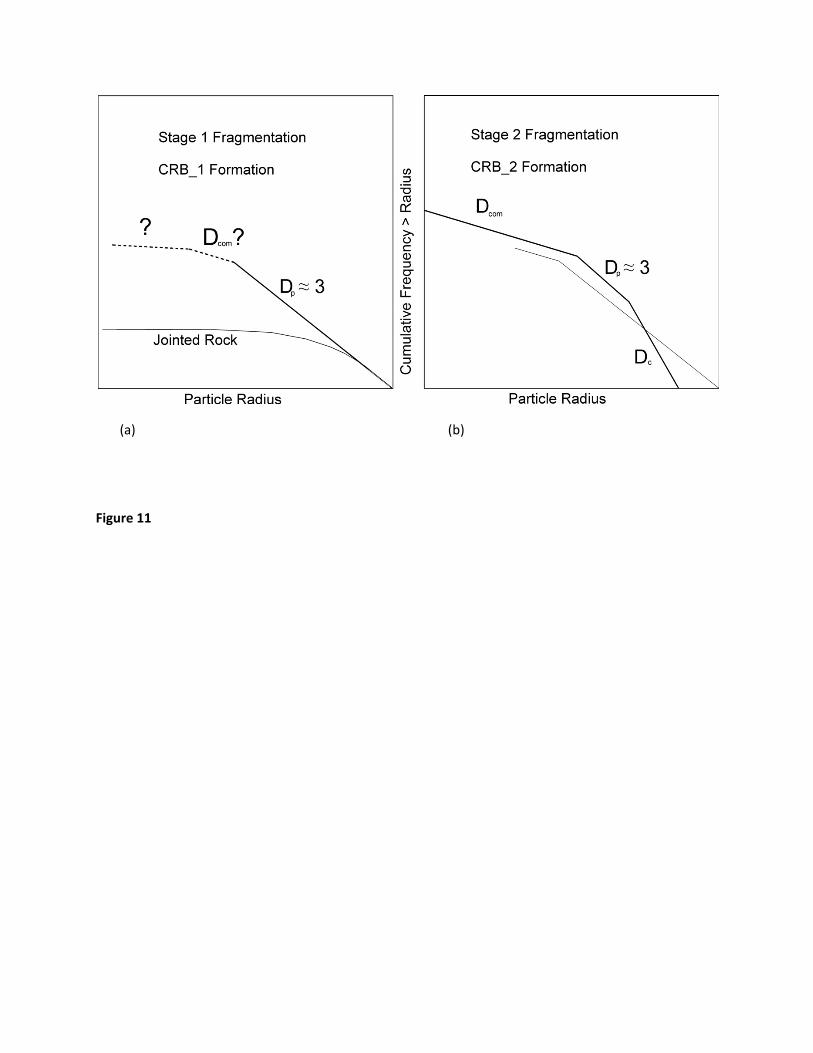
(a) (b)
Figure 11
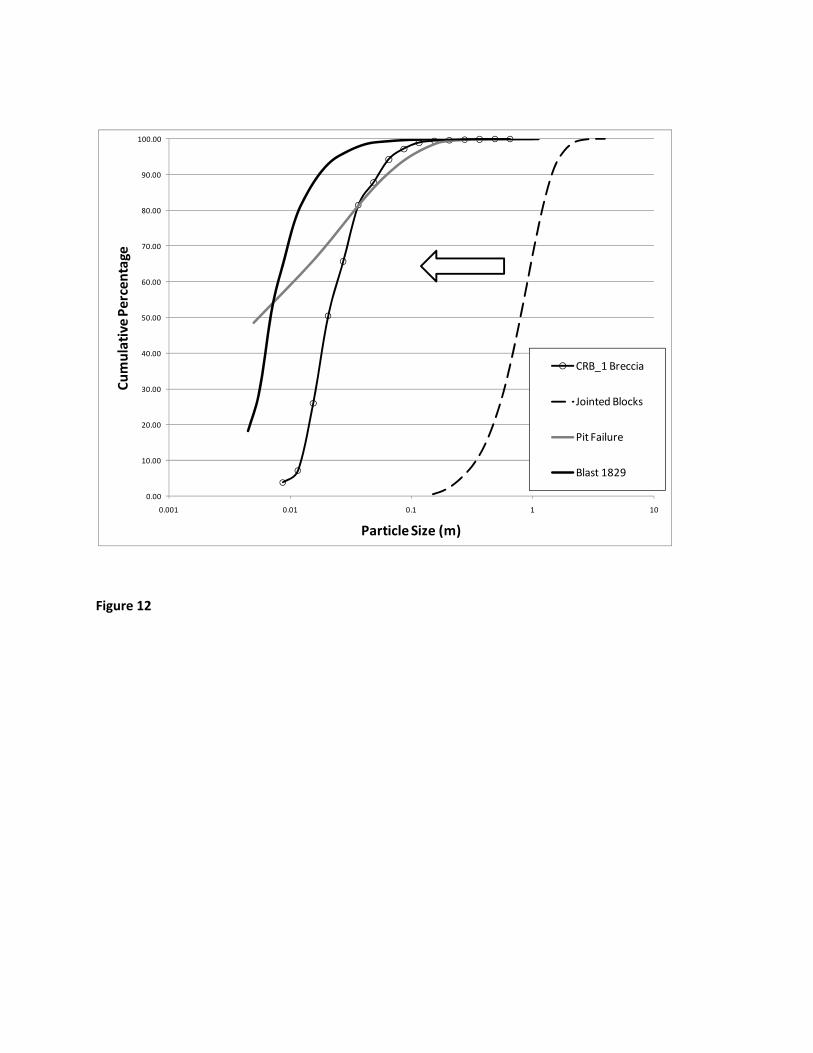
Figure 12
0.00
10.00
20.00
30.00
40.00
50.00
60.00
70.00
80.00
90.00
100.00
0.001 0.01 0.1 1 10
Cumulative Pe
rcen
tage
Particle Size (m)
CRB_1 Breccia
Jointed Blocks
Pit Failure
Blast 1829
Figure 13
K02
K08