keystone potato producers association mccain foods …€¦ · keystone potato producers...
TRANSCRIPT
Keystone Potato Producers Association
McCain Foods (Canada)
Simplot Canada (II) Ltd.
2012 Potato Research Report
Prepared by Gaia Consulting Ltd.


Introduction
This is the 23rd annual report on potato research funded by Keystone Potato Producers
Association (KPPA), McCain Foods Limited and Simplot Canada (II) Ltd. Other contributors are
listed under the “Funding or In-Kind Support” headings at the beginning of each project report.
On behalf of above sponsors I would like to thank everyone who contributed to the success of
the 2012 potato research program.
Copies of the this report can be downloaded from www.gaiaconsulting.mb.ca
Anyone wanting additional information regarding the research trials can contact:
Gaia Consulting Ltd.
Box 314
Portage la Prairie, Manitoba
R1N 3B5
Phone: (204) 267-2665
Email: [email protected] or [email protected]

Contents
Potassium Management for Irrigated Russet Burbank Potato Production in Manitoba ............... 1
Manitoba Potato Variety Adaptation Trial – Umatilla .................................................................... 8
Manitoba Potato Variety Adaptation Trial – Bannock Russet ...................................................... 14
Manitoba Potato Variety Adaptation Trial – Blazer Russet .......................................................... 20
Confine Injury to Seed Potato ....................................................................................................... 26
Evaluation of Conventional Ridged-row (CRR) and 5-row Bed (BED) Planting Methods ............. 29
In-Field Bed Planting Evaluation ................................................................................................... 39
Evaluation of Late Blight Fungicide Programs .............................................................................. 43
Starch Variety Evaluation for the Manitoba Potato Industry ....................................................... 48
Effect of Fall Soil Preparation on Potato Yield and Grade 2010 - 2012 ........................................ 52
Effect of Reservoir Tillage on Potato Yield and Grade .................................................................. 60

1
Potassium Management for Irrigated Russet Burbank Potato Production
in Manitoba
Funding: ARDI 50%
Keystone Vegetable Producers 16.6%
Simplot Canada 16.6%
McCain Foods 16.7%
In Kind Delta Ag Services
Beaver Creek Farms
WF Farms
North Port
Riverbend Colony
Almasippi Irrigation Farms
Progress: Third and final year
Principal Investigators: Blair Geisel, Darin Gibson and Donovan Fehr, Gaia Consulting Ltd.
Summary:
In the past 6 years, fertility studies conducted by Keystone Potato Producers, McCain and
Simplot have concentrated mainly on nitrogen and phosphorus. In 2010 the focus on
nutrient studies shifted to potassium for two reasons. Since 2004, potato yields have
increased by 30% and the price of potash (potassium) has increased by over 400%
accounting for 4-6% of the total cost of production. Because of these changes, potassium
management must be fine-tuned to optimize yield, quality and profit. AgVise Laboratories
and MAFRI indicate that a response in potato yield to potassium fertilizer would likely occur
in soils with less than 150 and 200 ppm soil test K in 0- 6 inches of soil respectively. If these
recommendations are no longer valid then producers may not be maximizing net return.
Under-application of potassium might limit yields whereas over application will increase
costs. Either situation will reduce net profit.
Maximum marketable yield was achieved when 300, 200 and 100 lbs K20/acre were applied
to soils when the residual concentration of potassium was <100, >100-200 or > 200 ppm
respectively. These results are consistent with AgVise recommendations to produce a yield
of 350 cwt/acre. Approximately 0.6 lbs K20 are removed from the soil for each cwt of
potatoes produced or 200 lbs K20 is removed to produce 350 cwt/ac yield.
2
The addition of potassium fertilizer reduced specific gravity, incidence of hollow heart and
lightened French fry colour. Specific gravity was reduced by an average of 0.0015 to 0.0017
points for every additional 100 lbs of applied K20 at plant or in split applications respectively.
Potassium had no effect in the incidence of sugar end defect. There was no difference in
crop response to at-plant or split applications of fertilizer or KCl or KMAG sources of
potassium.
Objectives:
1. Determine the effect of potassium rate and application timing on Russet
Burbank yield and quality.
2. Determine critical soil and tissue levels at which a response to potassium
can be expected.
3. Determine the effect of potassium source as well as the addition of sulfur
and magnesium (present in KMAG or potassium magnesium sulfate) on
Russet Burbank yield and quality.
Procedure:
Plot size: 4 rows by 12 m (Assessments conducted on 2 centre rows)
Trial design: RCB 4 replicates
Crop/Variety: Potatoes/ Russet Burbank
Row spacing: 1 metre
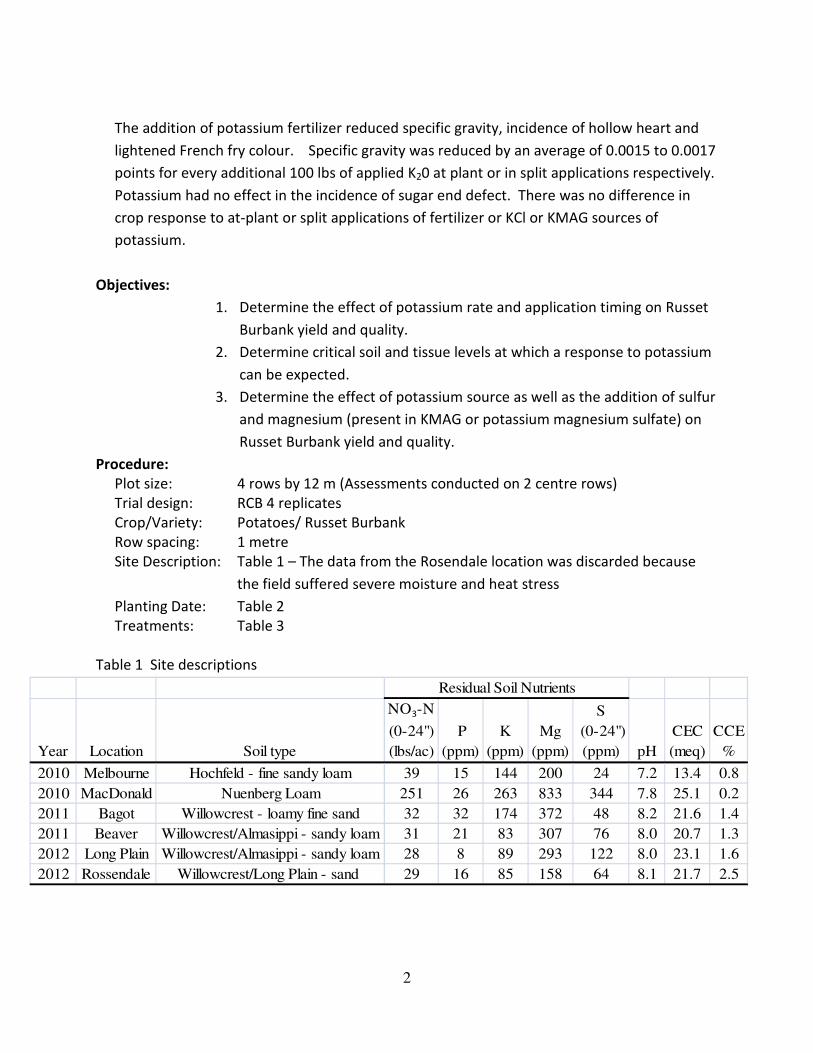
Site Description: Table 1 – The data from the Rosendale location was discarded because
the field suffered severe moisture and heat stress
Planting Date: Table 2
Treatments: Table 3
Table 1 Site descriptions
Year Location Soil type
NO3-N
(0-24")
(lbs/ac)
P
(ppm)
K
(ppm)
Mg
(ppm)
S
(0-24")
(ppm) pH
CEC
(meq)
CCE
%
2010 Melbourne Hochfeld - fine sandy loam 39 15 144 200 24 7.2 13.4 0.8
2010 MacDonald Nuenberg Loam 251 26 263 833 344 7.8 25.1 0.2
2011 Bagot Willowcrest - loamy fine sand 32 32 174 372 48 8.2 21.6 1.4
2011 Beaver Willowcrest/Almasippi - sandy loam 31 21 83 307 76 8.0 20.7 1.3
2012 Long Plain Willowcrest/Almasippi - sandy loam 28 8 89 293 122 8.0 23.1 1.6
2012 Rossendale Willowcrest/Long Plain - sand 29 16 85 158 64 8.1 21.7 2.5
Residual Soil Nutrients
3
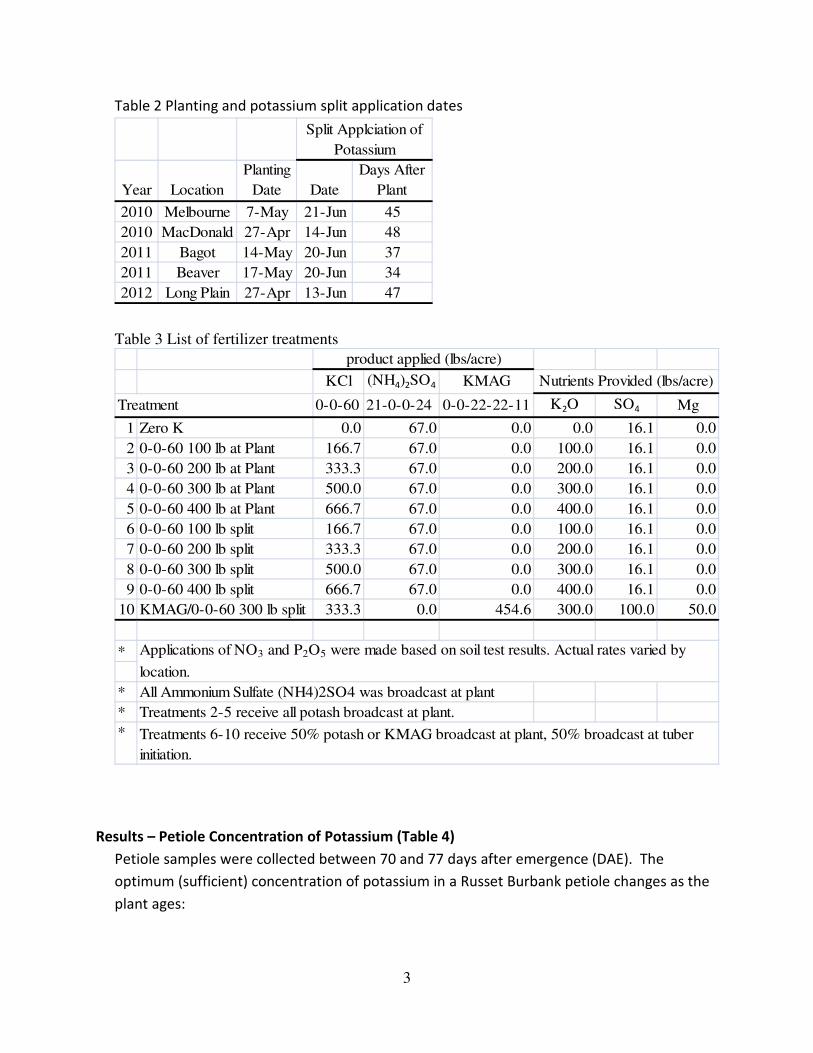
Table 2 Planting and potassium split application dates
Year Location
Planting
Date Date
Days After
Plant
2010 Melbourne 7-May 21-Jun 45
2010 MacDonald 27-Apr 14-Jun 48
2011 Bagot 14-May 20-Jun 37
2011 Beaver 17-May 20-Jun 34
2012 Long Plain 27-Apr 13-Jun 47
Split Applciation of
Potassium
Table 3 List of fertilizer treatments
KCl (NH4)2SO4 KMAG
0-0-60 21-0-0-24 0-0-22-22-11 K2O SO4 Mg
1 Zero K 0.0 67.0 0.0 0.0 16.1 0.0
2 0-0-60 100 lb at Plant 166.7 67.0 0.0 100.0 16.1 0.0
3 0-0-60 200 lb at Plant 333.3 67.0 0.0 200.0 16.1 0.0
4 0-0-60 300 lb at Plant 500.0 67.0 0.0 300.0 16.1 0.0
5 0-0-60 400 lb at Plant 666.7 67.0 0.0 400.0 16.1 0.0
6 0-0-60 100 lb split 166.7 67.0 0.0 100.0 16.1 0.0
7 0-0-60 200 lb split 333.3 67.0 0.0 200.0 16.1 0.0
8 0-0-60 300 lb split 500.0 67.0 0.0 300.0 16.1 0.0
9 0-0-60 400 lb split 666.7 67.0 0.0 400.0 16.1 0.0
10 KMAG/0-0-60 300 lb split 333.3 0.0 454.6 300.0 100.0 50.0
*
* All Ammonium Sulfate (NH4)2SO4 was broadcast at plant
* Treatments 2-5 receive all potash broadcast at plant.
*
product applied (lbs/acre)
Nutrients Provided (lbs/acre)
Treatment
Applications of NO3 and P2O5 were made based on soil test results. Actual rates varied by
location.
Treatments 6-10 receive 50% potash or KMAG broadcast at plant, 50% broadcast at tuber
initiation.
Results – Petiole Concentration of Potassium (Table 4)
Petiole samples were collected between 70 and 77 days after emergence (DAE). The
optimum (sufficient) concentration of potassium in a Russet Burbank petiole changes as the
plant ages:
4
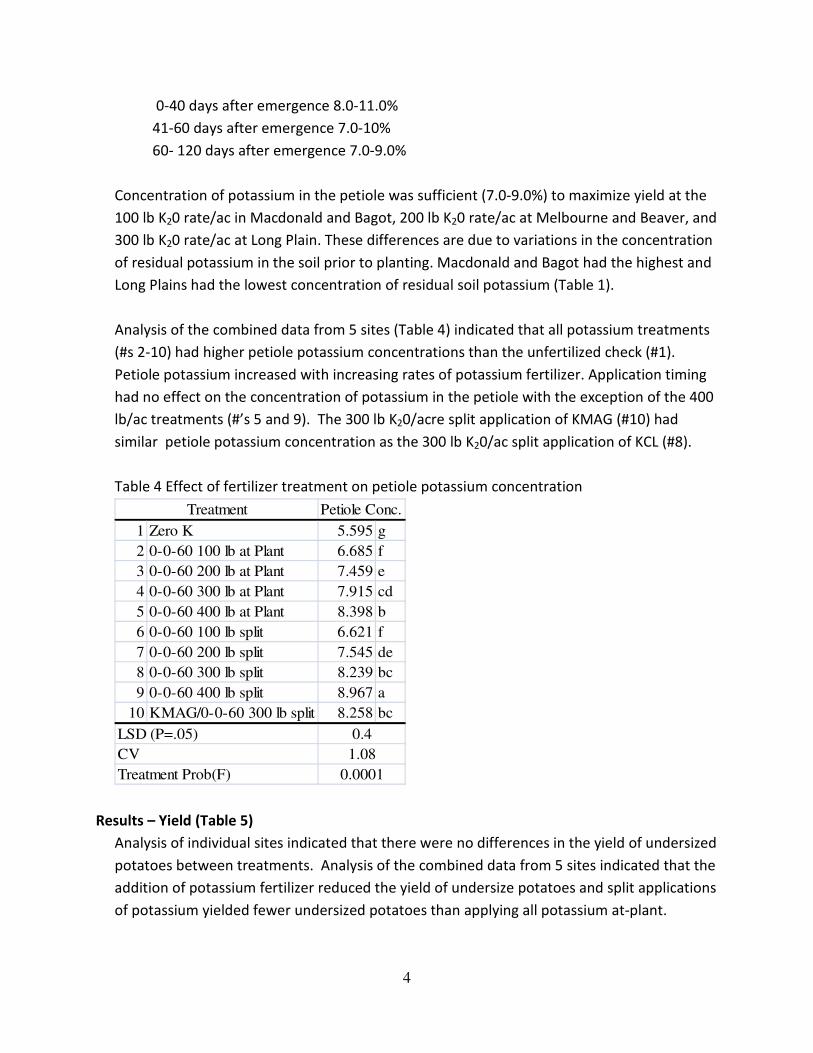
0-40 days after emergence 8.0-11.0%
41-60 days after emergence 7.0-10%
60- 120 days after emergence 7.0-9.0%
Concentration of potassium in the petiole was sufficient (7.0-9.0%) to maximize yield at the
100 lb K20 rate/ac in Macdonald and Bagot, 200 lb K20 rate/ac at Melbourne and Beaver, and
300 lb K20 rate/ac at Long Plain. These differences are due to variations in the concentration
of residual potassium in the soil prior to planting. Macdonald and Bagot had the highest and
Long Plains had the lowest concentration of residual soil potassium (Table 1).
Analysis of the combined data from 5 sites (Table 4) indicated that all potassium treatments
(#s 2-10) had higher petiole potassium concentrations than the unfertilized check (#1).
Petiole potassium increased with increasing rates of potassium fertilizer. Application timing
had no effect on the concentration of potassium in the petiole with the exception of the 400
lb/ac treatments (#’s 5 and 9). The 300 lb K20/acre split application of KMAG (#10) had
similar petiole potassium concentration as the 300 lb K20/ac split application of KCL (#8).
Table 4 Effect of fertilizer treatment on petiole potassium concentration
1 Zero K 5.595 g
2 0-0-60 100 lb at Plant 6.685 f
3 0-0-60 200 lb at Plant 7.459 e
4 0-0-60 300 lb at Plant 7.915 cd
5 0-0-60 400 lb at Plant 8.398 b
6 0-0-60 100 lb split 6.621 f
7 0-0-60 200 lb split 7.545 de
8 0-0-60 300 lb split 8.239 bc
9 0-0-60 400 lb split 8.967 a
10 KMAG/0-0-60 300 lb split 8.258 bc
Treatment Prob(F) 0.0001
Treatment Petiole Conc.
LSD (P=.05) 0.4
CV 1.08
Results – Yield (Table 5)
Analysis of individual sites indicated that there were no differences in the yield of undersized
potatoes between treatments. Analysis of the combined data from 5 sites indicated that the
addition of potassium fertilizer reduced the yield of undersize potatoes and split applications
of potassium yielded fewer undersized potatoes than applying all potassium at-plant.
5
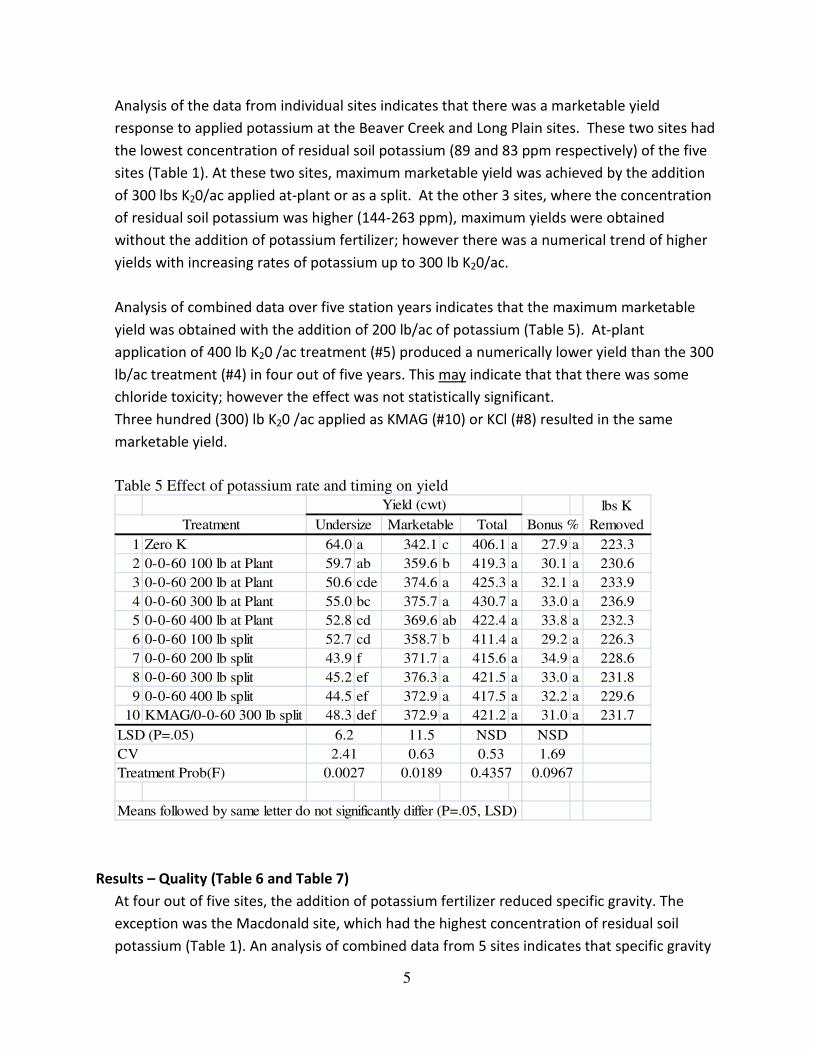
Analysis of the data from individual sites indicates that there was a marketable yield
response to applied potassium at the Beaver Creek and Long Plain sites. These two sites had
the lowest concentration of residual soil potassium (89 and 83 ppm respectively) of the five
sites (Table 1). At these two sites, maximum marketable yield was achieved by the addition
of 300 lbs K20/ac applied at-plant or as a split. At the other 3 sites, where the concentration
of residual soil potassium was higher (144-263 ppm), maximum yields were obtained
without the addition of potassium fertilizer; however there was a numerical trend of higher
yields with increasing rates of potassium up to 300 lb K20/ac.
Analysis of combined data over five station years indicates that the maximum marketable
yield was obtained with the addition of 200 lb/ac of potassium (Table 5). At-plant
application of 400 lb K20 /ac treatment (#5) produced a numerically lower yield than the 300
lb/ac treatment (#4) in four out of five years. This may indicate that that there was some
chloride toxicity; however the effect was not statistically significant.
Three hundred (300) lb K20 /ac applied as KMAG (#10) or KCl (#8) resulted in the same
marketable yield.
Table 5 Effect of potassium rate and timing on yield
1 Zero K 64.0 a 342.1 c 406.1 a 27.9 a 223.3
2 0-0-60 100 lb at Plant 59.7 ab 359.6 b 419.3 a 30.1 a 230.6
3 0-0-60 200 lb at Plant 50.6 cde 374.6 a 425.3 a 32.1 a 233.9
4 0-0-60 300 lb at Plant 55.0 bc 375.7 a 430.7 a 33.0 a 236.9
5 0-0-60 400 lb at Plant 52.8 cd 369.6 ab 422.4 a 33.8 a 232.3
6 0-0-60 100 lb split 52.7 cd 358.7 b 411.4 a 29.2 a 226.3
7 0-0-60 200 lb split 43.9 f 371.7 a 415.6 a 34.9 a 228.6
8 0-0-60 300 lb split 45.2 ef 376.3 a 421.5 a 33.0 a 231.8
9 0-0-60 400 lb split 44.5 ef 372.9 a 417.5 a 32.2 a 229.6
10 KMAG/0-0-60 300 lb split 48.3 def 372.9 a 421.2 a 31.0 a 231.7
Means followed by same letter do not significantly differ (P=.05, LSD)
lbs K
RemovedTreatment Undersize Marketable Total Bonus %
CV 2.41 0.63 0.53 1.69
LSD (P=.05) 6.2 11.5 NSD NSD
Yield (cwt)
Treatment Prob(F) 0.0027 0.0189 0.4357 0.0967
Results – Quality (Table 6 and Table 7)
At four out of five sites, the addition of potassium fertilizer reduced specific gravity. The
exception was the Macdonald site, which had the highest concentration of residual soil
potassium (Table 1). An analysis of combined data from 5 sites indicates that specific gravity
6
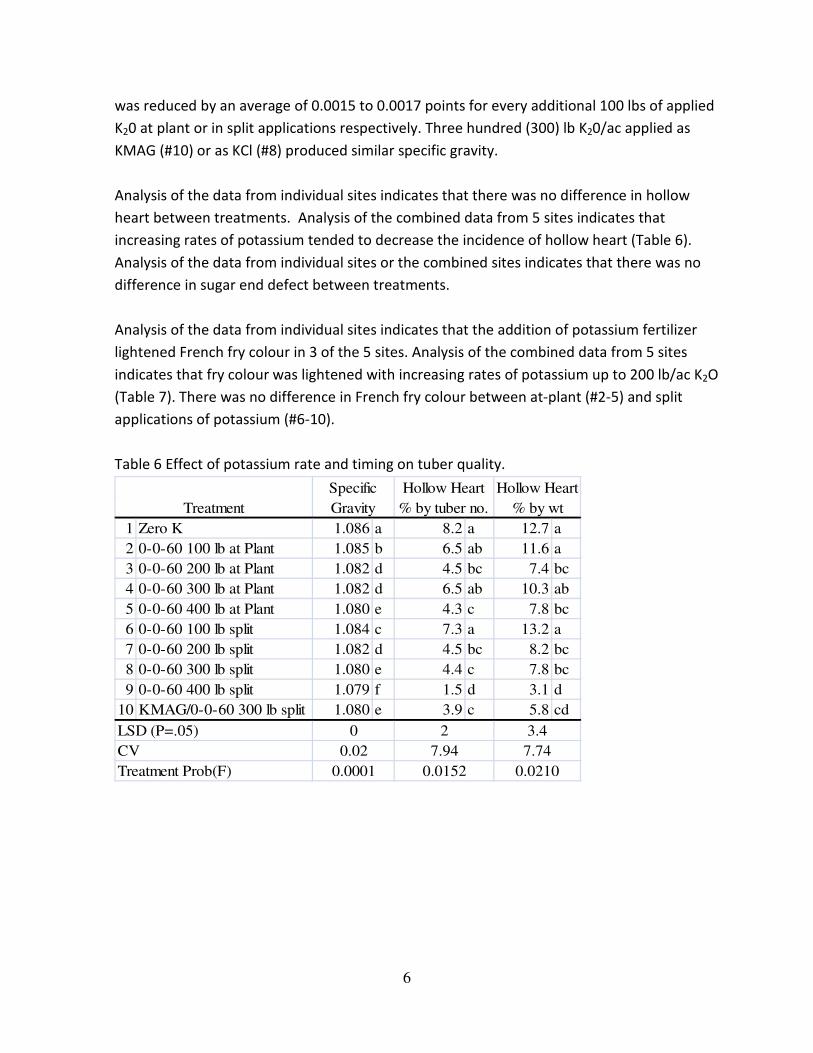
was reduced by an average of 0.0015 to 0.0017 points for every additional 100 lbs of applied
K20 at plant or in split applications respectively. Three hundred (300) lb K20/ac applied as
KMAG (#10) or as KCl (#8) produced similar specific gravity.
Analysis of the data from individual sites indicates that there was no difference in hollow
heart between treatments. Analysis of the combined data from 5 sites indicates that
increasing rates of potassium tended to decrease the incidence of hollow heart (Table 6).
Analysis of the data from individual sites or the combined sites indicates that there was no
difference in sugar end defect between treatments.
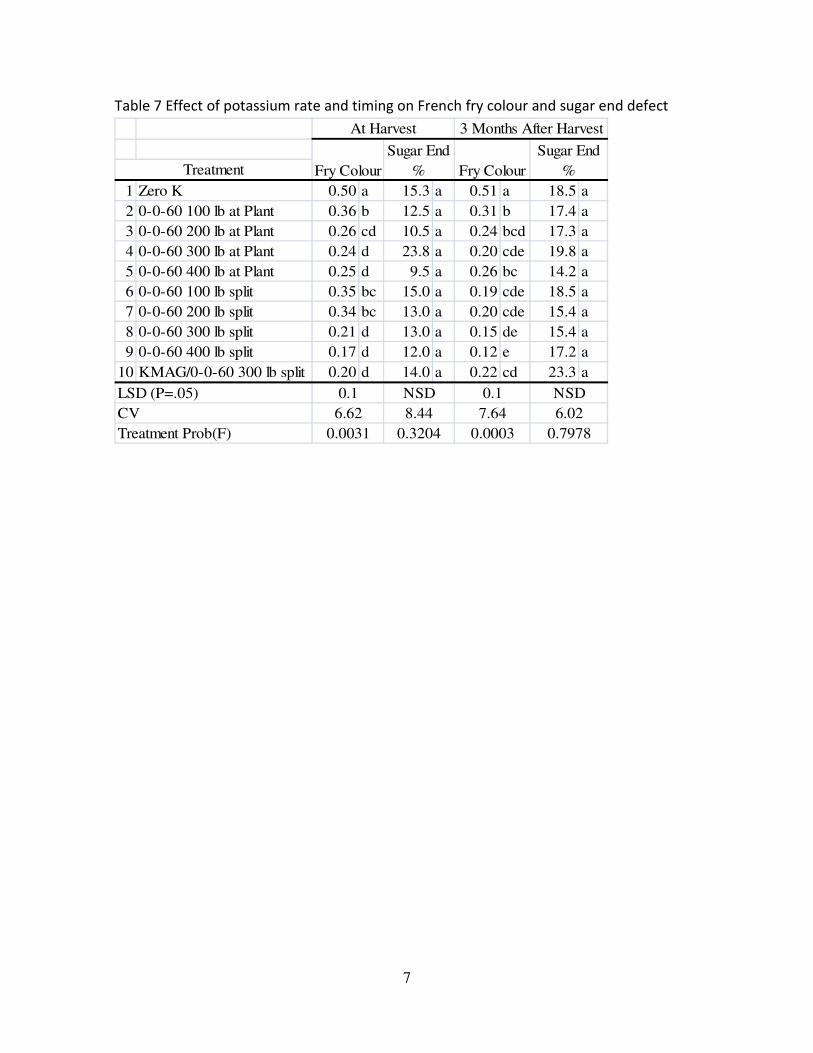
Analysis of the data from individual sites indicates that the addition of potassium fertilizer
lightened French fry colour in 3 of the 5 sites. Analysis of the combined data from 5 sites
indicates that fry colour was lightened with increasing rates of potassium up to 200 lb/ac K2O
(Table 7). There was no difference in French fry colour between at-plant (#2-5) and split
applications of potassium (#6-10).
Table 6 Effect of potassium rate and timing on tuber quality.
1 Zero K 1.086 a 8.2 a 12.7 a
2 0-0-60 100 lb at Plant 1.085 b 6.5 ab 11.6 a
3 0-0-60 200 lb at Plant 1.082 d 4.5 bc 7.4 bc
4 0-0-60 300 lb at Plant 1.082 d 6.5 ab 10.3 ab
5 0-0-60 400 lb at Plant 1.080 e 4.3 c 7.8 bc
6 0-0-60 100 lb split 1.084 c 7.3 a 13.2 a
7 0-0-60 200 lb split 1.082 d 4.5 bc 8.2 bc
8 0-0-60 300 lb split 1.080 e 4.4 c 7.8 bc
9 0-0-60 400 lb split 1.079 f 1.5 d 3.1 d
10 KMAG/0-0-60 300 lb split 1.080 e 3.9 c 5.8 cd
Treatment
Specific
Gravity
Hollow Heart
% by tuber no.
Hollow Heart
% by wt
LSD (P=.05) 0 2 3.4
CV 0.02 7.94 7.74
Treatment Prob(F) 0.0001 0.0152 0.0210
7
Table 7 Effect of potassium rate and timing on French fry colour and sugar end defect
1 Zero K 0.50 a 15.3 a 0.51 a 18.5 a
2 0-0-60 100 lb at Plant 0.36 b 12.5 a 0.31 b 17.4 a
3 0-0-60 200 lb at Plant 0.26 cd 10.5 a 0.24 bcd 17.3 a
4 0-0-60 300 lb at Plant 0.24 d 23.8 a 0.20 cde 19.8 a
5 0-0-60 400 lb at Plant 0.25 d 9.5 a 0.26 bc 14.2 a
6 0-0-60 100 lb split 0.35 bc 15.0 a 0.19 cde 18.5 a
7 0-0-60 200 lb split 0.34 bc 13.0 a 0.20 cde 15.4 a
8 0-0-60 300 lb split 0.21 d 13.0 a 0.15 de 15.4 a
9 0-0-60 400 lb split 0.17 d 12.0 a 0.12 e 17.2 a
10 KMAG/0-0-60 300 lb split 0.20 d 14.0 a 0.22 cd 23.3 a
At Harvest 3 Months After Harvest
Fry Colour
Sugar End
% Fry Colour
Sugar End
%Treatment
LSD (P=.05) 0.1 NSD 0.1
CV 6.62 8.44 7.64 6.02
NSD
Treatment Prob(F) 0.0031 0.3204 0.0003 0.7978
8
Manitoba Potato Variety Adaptation Trial – Umatilla
Funding: ARDI Agricultural Research and Development Initiative
Keystone Potato Producers Association
Simplot Canada Limited
McCain Foods Limited
Principal Investigators: Blair Geisel, Darin Gibson and Donovan Fehr, Gaia Consulting Ltd.
Progress: Year 4
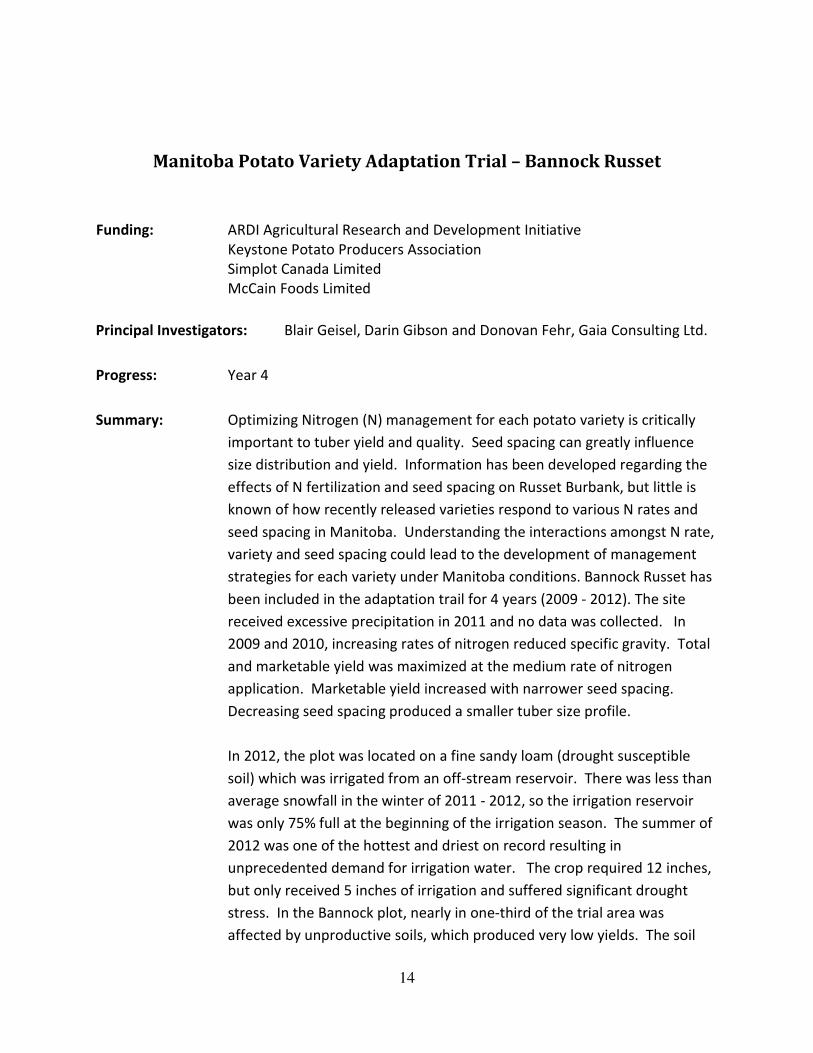
Summary: Optimizing Nitrogen (N) management for each potato variety is critically
important to tuber yield and quality. Seed spacing can greatly influence
size distribution and yield. Information has been developed regarding the
effects of N fertilization and seed spacing on Russet Burbank, but little is
known of how recently released varieties respond to various N rates and
seed spacing in Manitoba. Understanding the interactions amongst N rate,
variety and seed spacing could lead to the development of management
strategies for each variety under Manitoba conditions.
Umatilla has been included in the adaptation trail for 4 years (2009 - 2012).
The site received excessive precipitation in 2011 and no data was collected.
In 2009 and 2010, increasing rates of nitrogen and wider seed spacing
reduced specific gravity. Seed spacing did not affect total or marketable
yield, however a narrow spacing produced a smaller tuber profile.
Increasing rates of N tended to produce darker French fry colour. In 2012,
the plot was located on a fine sandy loam (drought susceptible soil) which
was irrigated from an off-stream reservoir. There was less than average
snowfall in the winter of 2011 - 2012, so the irrigation reservoir was only
75% full at the beginning of the irrigation season. The summer of 2012 was
one of the hottest and driest on record resulting in unprecedented demand
for irrigation water. The crop required 12 inches, but only received 5
inches of irrigation and suffered significant drought stress. In the Umatilla
plot, nearly in one-third of the trial area was affected by unproductive soils,
which produced very low yields. The soil problem was not evident when
the site was chosen in the fall of 2011.
9
Objectives:
1. To test potato varieties to determine their potential as replacement
varieties for those presently grown in Manitoba for French fry
processing.
2. To determine yield, grade and quality response of Umatilla to three
levels of N fertility and three in-row seed spacings.
3. To evaluate the interaction between seed piece spacing and N fertility.
4. To develop management strategies for Umatilla under Manitoba
conditions.
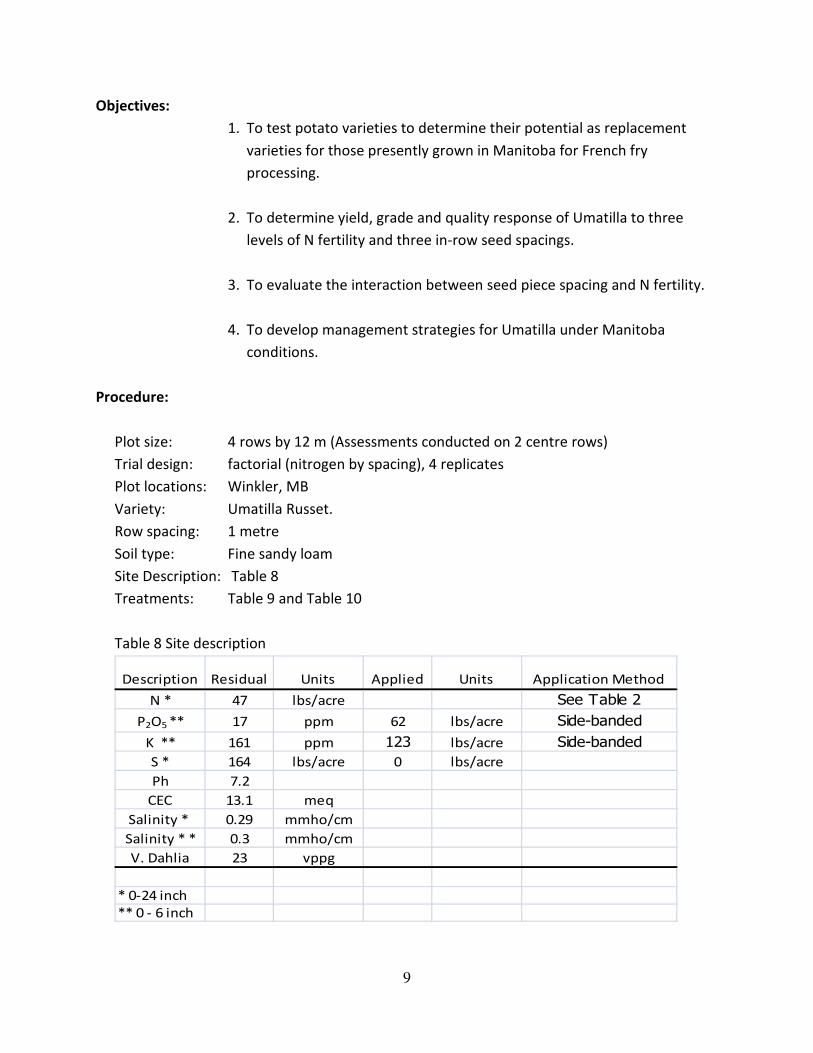
Procedure:
Plot size: 4 rows by 12 m (Assessments conducted on 2 centre rows)
Trial design: factorial (nitrogen by spacing), 4 replicates
Plot locations: Winkler, MB
Variety: Umatilla Russet.
Row spacing: 1 metre
Soil type: Fine sandy loam
Site Description: Table 8
Treatments: Table 9 and Table 10
Table 8 Site description
Description Residual Units Applied Units Application Method
N * 47 lbs/acre See Table 2
P2O5 ** 17 ppm 62 lbs/acre Side-banded
K ** 161 ppm 123 lbs/acre Side-banded
S * 164 lbs/acre 0 lbs/acre
Ph 7.2
CEC 13.1 meq
Salinity * 0.29 mmho/cm
Salinity * * 0.3 mmho/cm
V. Dahlia 23 vppg
* 0-24 inch
** 0 - 6 inch
10
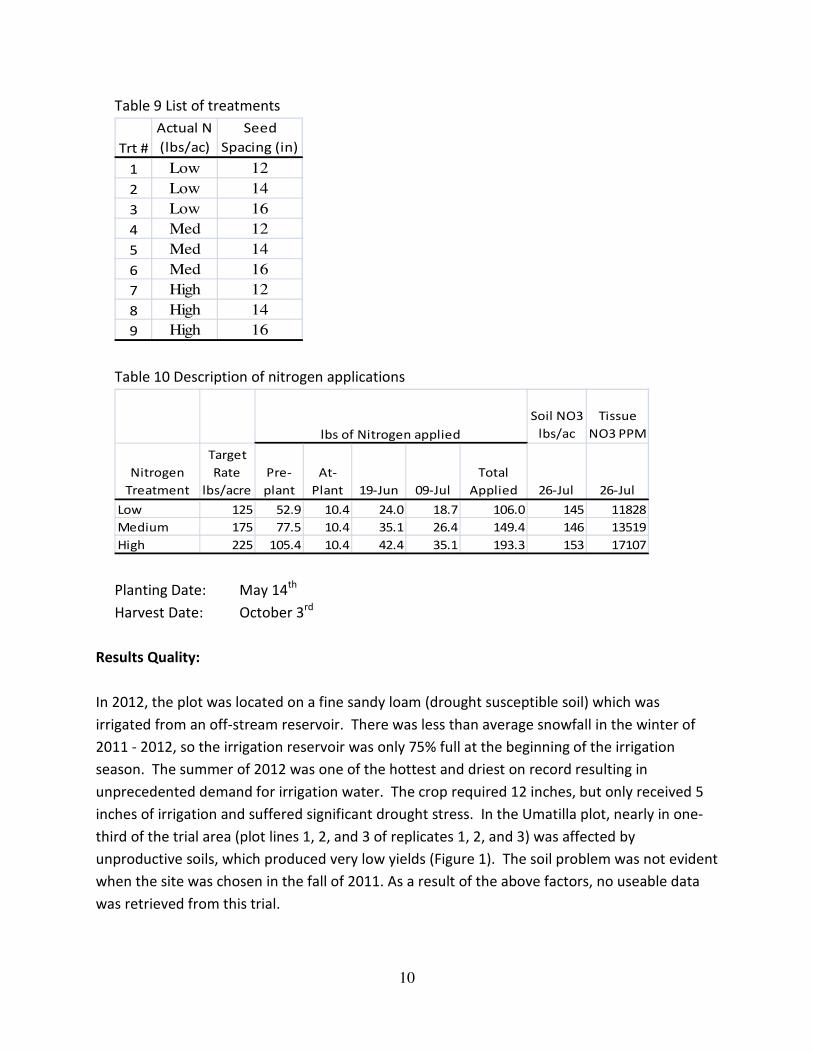
Table 9 List of treatments
Trt #
Actual N
(lbs/ac)
Seed
Spacing (in)
1 Low 12
2 Low 14
3 Low 16
4 Med 12
5 Med 14
6 Med 16
7 High 12
8 High 14
9 High 16
Table 10 Description of nitrogen applications
Soil NO3
lbs/ac
Tissue
NO3 PPM
Nitrogen
Treatment
Target
Rate
lbs/acre
Pre-
plant
At-
Plant 19-Jun 09-Jul
Total
Applied 26-Jul 26-Jul
Low 125 52.9 10.4 24.0 18.7 106.0 145 11828
Medium 175 77.5 10.4 35.1 26.4 149.4 146 13519
High 225 105.4 10.4 42.4 35.1 193.3 153 17107
lbs of Nitrogen applied
Planting Date: May 14th
Harvest Date: October 3rd
Results Quality:
In 2012, the plot was located on a fine sandy loam (drought susceptible soil) which was
irrigated from an off-stream reservoir. There was less than average snowfall in the winter of
2011 - 2012, so the irrigation reservoir was only 75% full at the beginning of the irrigation
season. The summer of 2012 was one of the hottest and driest on record resulting in
unprecedented demand for irrigation water. The crop required 12 inches, but only received 5
inches of irrigation and suffered significant drought stress. In the Umatilla plot, nearly in one-
third of the trial area (plot lines 1, 2, and 3 of replicates 1, 2, and 3) was affected by
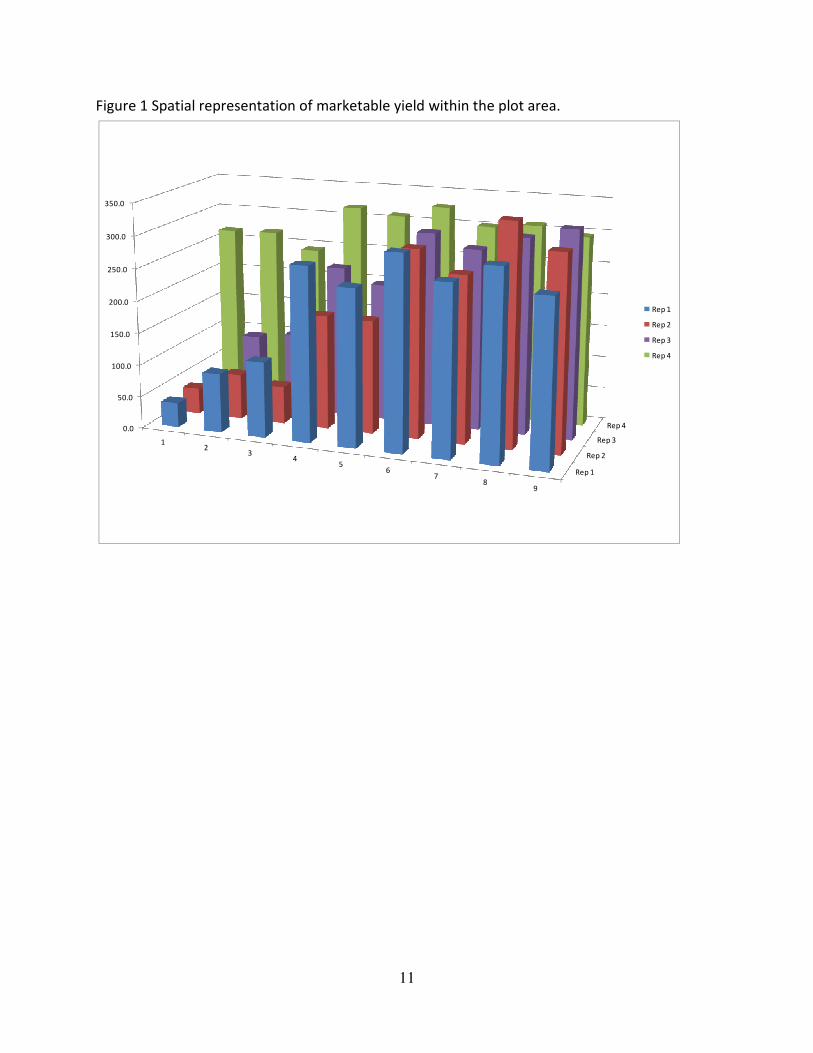
unproductive soils, which produced very low yields (Figure 1). The soil problem was not evident
when the site was chosen in the fall of 2011. As a result of the above factors, no useable data
was retrieved from this trial.
11
Figure 1 Spatial representation of marketable yield within the plot area.
Rep 1
Rep 2
Rep 3
Rep 40.0
50.0
100.0
150.0
200.0
250.0
300.0
350.0
12
34
56
78
9
Rep 1
Rep 2
Rep 3
Rep 4
12
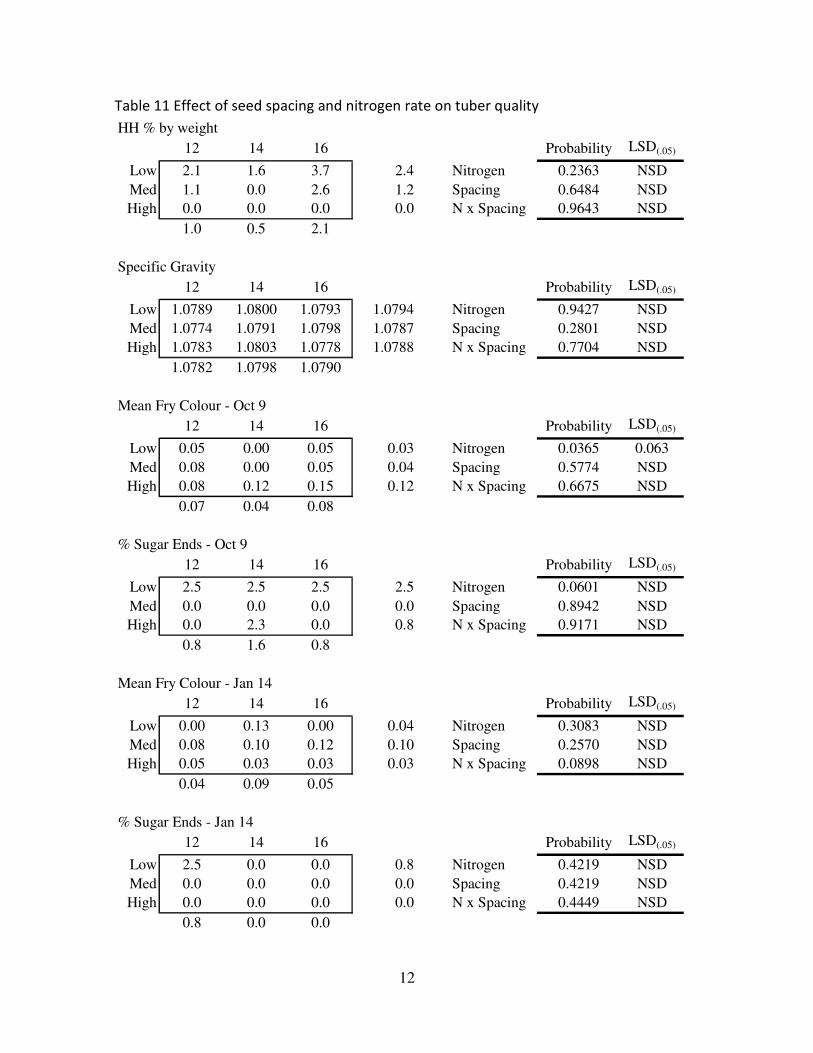
Table 11 Effect of seed spacing and nitrogen rate on tuber quality
HH % by weight
12 14 16 Probability LSD(.05)
Low 2.1 1.6 3.7 2.4 Nitrogen 0.2363 NSD
Med 1.1 0.0 2.6 1.2 Spacing 0.6484 NSD
High 0.0 0.0 0.0 0.0 N x Spacing 0.9643 NSD
1.0 0.5 2.1
Specific Gravity
12 14 16 Probability LSD(.05)
Low 1.0789 1.0800 1.0793 1.0794 Nitrogen 0.9427 NSD
Med 1.0774 1.0791 1.0798 1.0787 Spacing 0.2801 NSD
High 1.0783 1.0803 1.0778 1.0788 N x Spacing 0.7704 NSD
1.0782 1.0798 1.0790
Mean Fry Colour - Oct 9
12 14 16 Probability LSD(.05)
Low 0.05 0.00 0.05 0.03 Nitrogen 0.0365 0.063
Med 0.08 0.00 0.05 0.04 Spacing 0.5774 NSD
High 0.08 0.12 0.15 0.12 N x Spacing 0.6675 NSD
0.07 0.04 0.08
% Sugar Ends - Oct 9
12 14 16 Probability LSD(.05)
Low 2.5 2.5 2.5 2.5 Nitrogen 0.0601 NSD
Med 0.0 0.0 0.0 0.0 Spacing 0.8942 NSD
High 0.0 2.3 0.0 0.8 N x Spacing 0.9171 NSD
0.8 1.6 0.8
Mean Fry Colour - Jan 14
12 14 16 Probability LSD(.05)
Low 0.00 0.13 0.00 0.04 Nitrogen 0.3083 NSD
Med 0.08 0.10 0.12 0.10 Spacing 0.2570 NSD
High 0.05 0.03 0.03 0.03 N x Spacing 0.0898 NSD
0.04 0.09 0.05
% Sugar Ends - Jan 14
12 14 16 Probability LSD(.05)
Low 2.5 0.0 0.0 0.8 Nitrogen 0.4219 NSD
Med 0.0 0.0 0.0 0.0 Spacing 0.4219 NSD
High 0.0 0.0 0.0 0.0 N x Spacing 0.4449 NSD
0.8 0.0 0.0
13
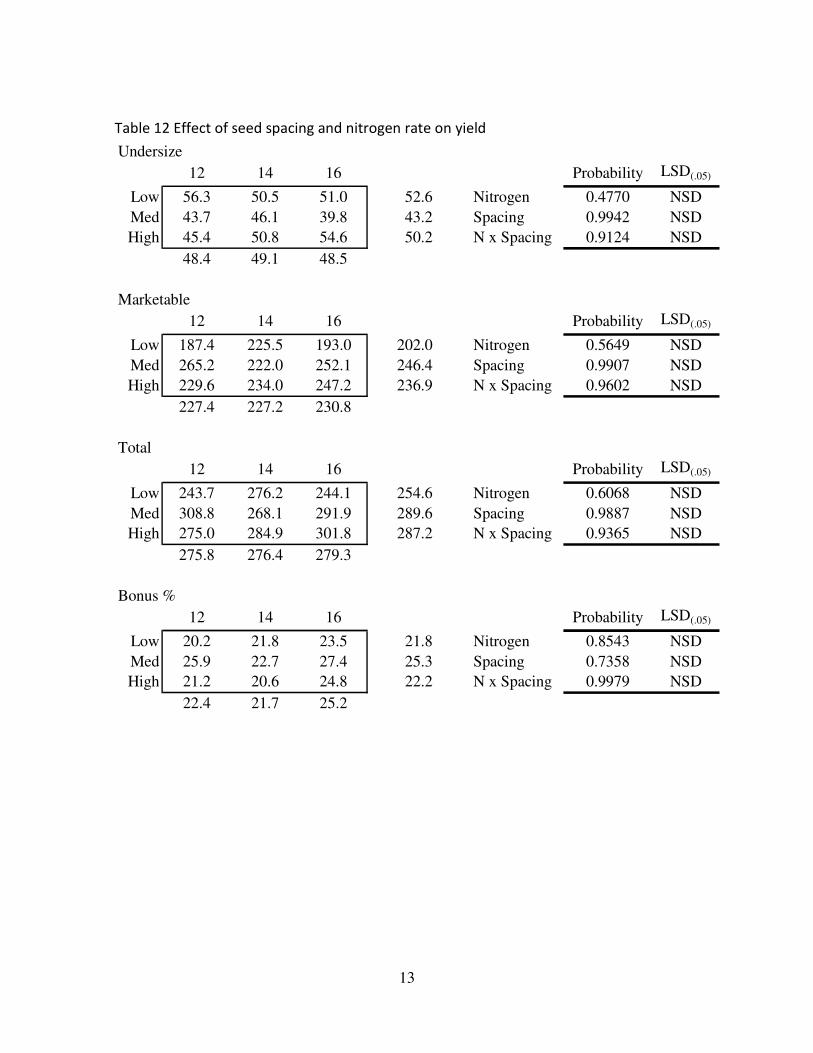
Table 12 Effect of seed spacing and nitrogen rate on yield
Undersize
12 14 16 Probability LSD(.05)
Low 56.3 50.5 51.0 52.6 Nitrogen 0.4770 NSD
Med 43.7 46.1 39.8 43.2 Spacing 0.9942 NSD
High 45.4 50.8 54.6 50.2 N x Spacing 0.9124 NSD
48.4 49.1 48.5
Marketable
12 14 16 Probability LSD(.05)
Low 187.4 225.5 193.0 202.0 Nitrogen 0.5649 NSD
Med 265.2 222.0 252.1 246.4 Spacing 0.9907 NSD
High 229.6 234.0 247.2 236.9 N x Spacing 0.9602 NSD
227.4 227.2 230.8
Total
12 14 16 Probability LSD(.05)
Low 243.7 276.2 244.1 254.6 Nitrogen 0.6068 NSD
Med 308.8 268.1 291.9 289.6 Spacing 0.9887 NSD
High 275.0 284.9 301.8 287.2 N x Spacing 0.9365 NSD
275.8 276.4 279.3
Bonus %
12 14 16 Probability LSD(.05)
Low 20.2 21.8 23.5 21.8 Nitrogen 0.8543 NSD
Med 25.9 22.7 27.4 25.3 Spacing 0.7358 NSD
High 21.2 20.6 24.8 22.2 N x Spacing 0.9979 NSD
22.4 21.7 25.2
14
Manitoba Potato Variety Adaptation Trial – Bannock Russet
Funding: ARDI Agricultural Research and Development Initiative
Keystone Potato Producers Association
Simplot Canada Limited
McCain Foods Limited
Principal Investigators: Blair Geisel, Darin Gibson and Donovan Fehr, Gaia Consulting Ltd.
Progress: Year 4
Summary: Optimizing Nitrogen (N) management for each potato variety is critically
important to tuber yield and quality. Seed spacing can greatly influence
size distribution and yield. Information has been developed regarding the
effects of N fertilization and seed spacing on Russet Burbank, but little is
known of how recently released varieties respond to various N rates and
seed spacing in Manitoba. Understanding the interactions amongst N rate,
variety and seed spacing could lead to the development of management
strategies for each variety under Manitoba conditions. Bannock Russet has
been included in the adaptation trail for 4 years (2009 - 2012). The site
received excessive precipitation in 2011 and no data was collected. In
2009 and 2010, increasing rates of nitrogen reduced specific gravity. Total
and marketable yield was maximized at the medium rate of nitrogen
application. Marketable yield increased with narrower seed spacing.
Decreasing seed spacing produced a smaller tuber size profile.
In 2012, the plot was located on a fine sandy loam (drought susceptible
soil) which was irrigated from an off-stream reservoir. There was less than
average snowfall in the winter of 2011 - 2012, so the irrigation reservoir
was only 75% full at the beginning of the irrigation season. The summer of
2012 was one of the hottest and driest on record resulting in
unprecedented demand for irrigation water. The crop required 12 inches,
but only received 5 inches of irrigation and suffered significant drought
stress. In the Bannock plot, nearly in one-third of the trial area was
affected by unproductive soils, which produced very low yields. The soil
15
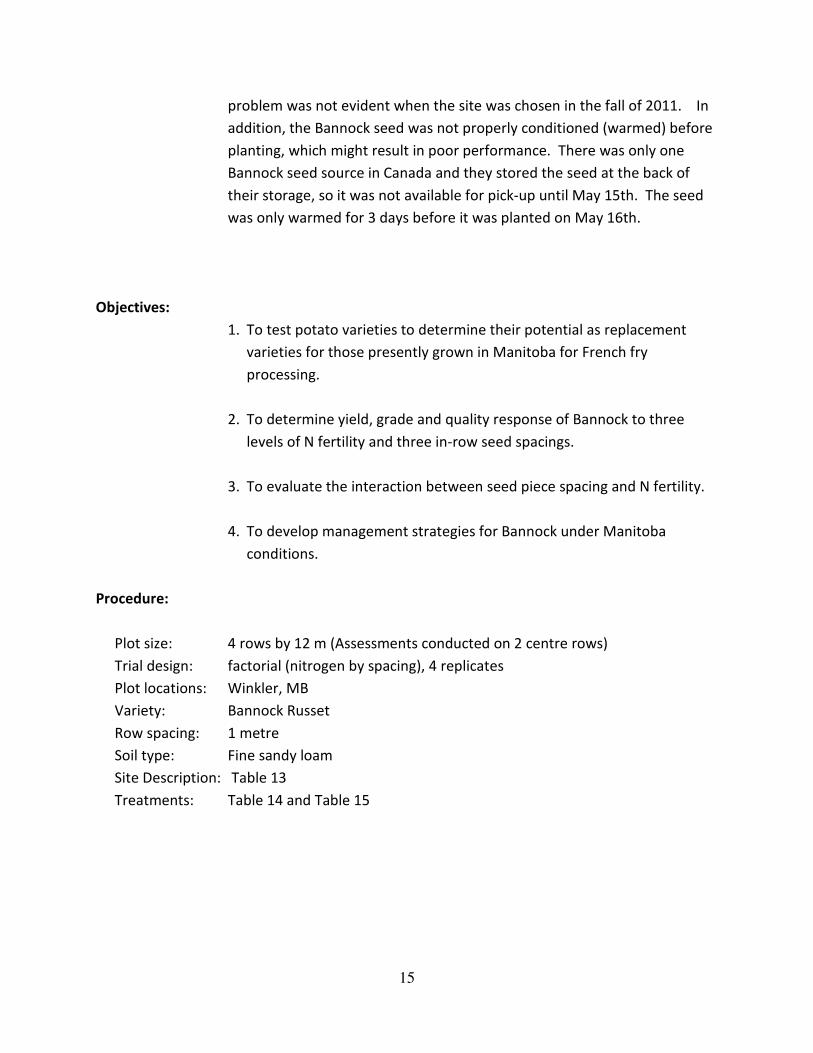
problem was not evident when the site was chosen in the fall of 2011. In
addition, the Bannock seed was not properly conditioned (warmed) before
planting, which might result in poor performance. There was only one
Bannock seed source in Canada and they stored the seed at the back of
their storage, so it was not available for pick-up until May 15th. The seed
was only warmed for 3 days before it was planted on May 16th.
Objectives:
1. To test potato varieties to determine their potential as replacement
varieties for those presently grown in Manitoba for French fry
processing.
2. To determine yield, grade and quality response of Bannock to three
levels of N fertility and three in-row seed spacings.
3. To evaluate the interaction between seed piece spacing and N fertility.
4. To develop management strategies for Bannock under Manitoba
conditions.
Procedure:
Plot size: 4 rows by 12 m (Assessments conducted on 2 centre rows)
Trial design: factorial (nitrogen by spacing), 4 replicates
Plot locations: Winkler, MB
Variety: Bannock Russet
Row spacing: 1 metre
Soil type: Fine sandy loam
Site Description: Table 13
Treatments: Table 14 and Table 15
16
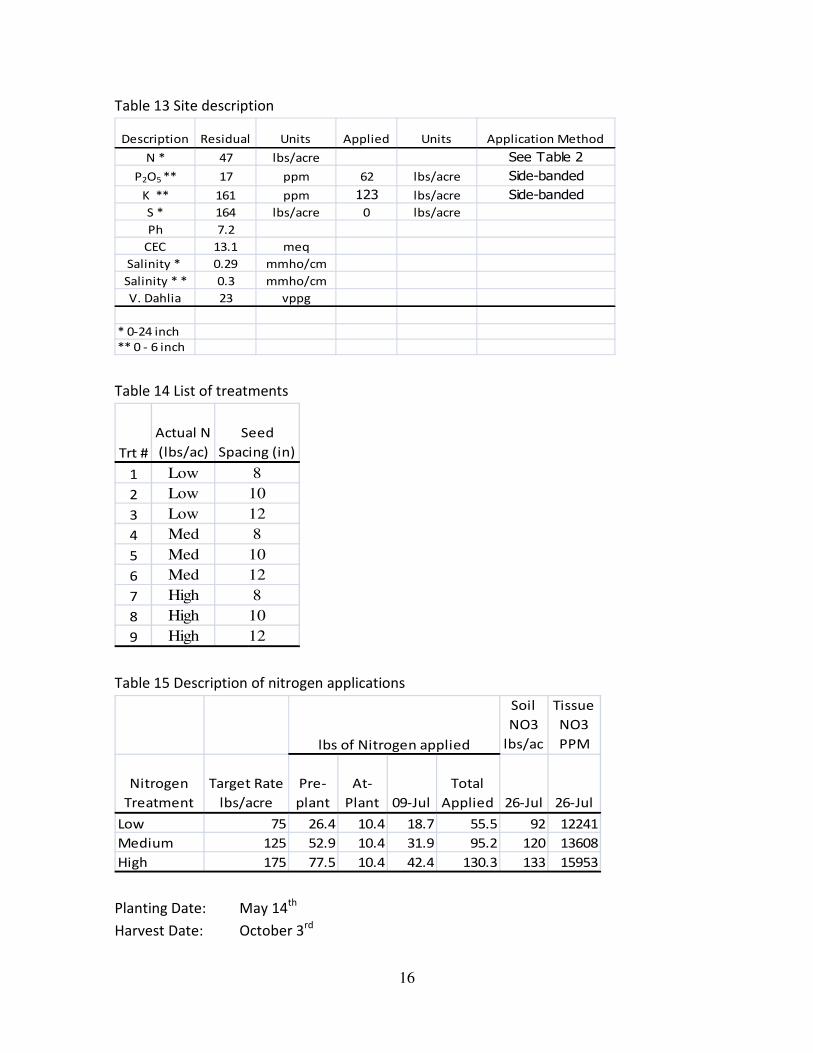
Table 13 Site description
Description Residual Units Applied Units Application Method
N * 47 lbs/acre See Table 2
P2O5 ** 17 ppm 62 lbs/acre Side-banded
K ** 161 ppm 123 lbs/acre Side-banded
S * 164 lbs/acre 0 lbs/acre
Ph 7.2
CEC 13.1 meq
Salinity * 0.29 mmho/cm
Salinity * * 0.3 mmho/cm
V. Dahlia 23 vppg
* 0-24 inch
** 0 - 6 inch
Table 14 List of treatments
Trt #
Actual N
(lbs/ac)
Seed
Spacing (in)
1 Low 8
2 Low 10
3 Low 12
4 Med 8
5 Med 10
6 Med 12
7 High 8
8 High 10
9 High 12
Table 15 Description of nitrogen applications
Soil
NO3
lbs/ac
Tissue
NO3
PPM
Nitrogen
Treatment
Target Rate
lbs/acre
Pre-
plant
At-
Plant 09-Jul
Total
Applied 26-Jul 26-Jul
Low 75 26.4 10.4 18.7 55.5 92 12241
Medium 125 52.9 10.4 31.9 95.2 120 13608
High 175 77.5 10.4 42.4 130.3 133 15953
lbs of Nitrogen applied
Planting Date: May 14th
Harvest Date: October 3rd
17
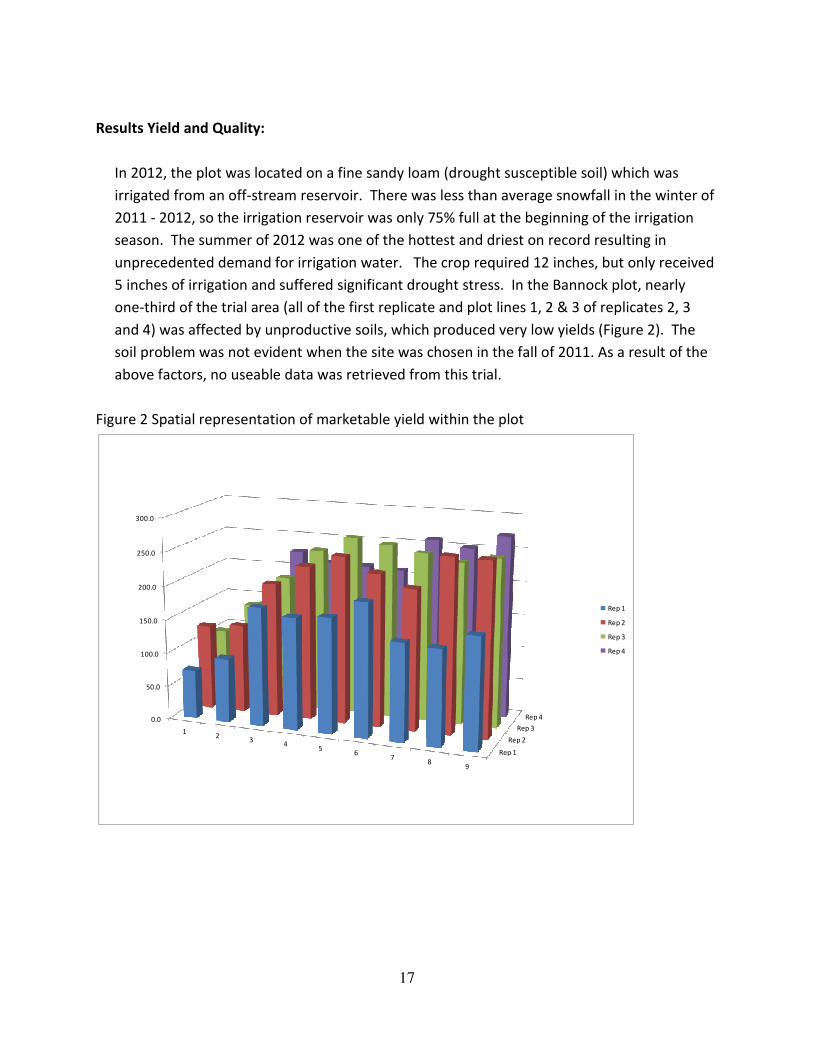
Results Yield and Quality:
In 2012, the plot was located on a fine sandy loam (drought susceptible soil) which was
irrigated from an off-stream reservoir. There was less than average snowfall in the winter of
2011 - 2012, so the irrigation reservoir was only 75% full at the beginning of the irrigation
season. The summer of 2012 was one of the hottest and driest on record resulting in
unprecedented demand for irrigation water. The crop required 12 inches, but only received
5 inches of irrigation and suffered significant drought stress. In the Bannock plot, nearly
one-third of the trial area (all of the first replicate and plot lines 1, 2 & 3 of replicates 2, 3
and 4) was affected by unproductive soils, which produced very low yields (Figure 2). The
soil problem was not evident when the site was chosen in the fall of 2011. As a result of the
above factors, no useable data was retrieved from this trial.
Figure 2 Spatial representation of marketable yield within the plot
Rep 1
Rep 2
Rep 3
Rep 40.0
50.0
100.0
150.0
200.0
250.0
300.0
12
34
56
78
9
Rep 1
Rep 2
Rep 3
Rep 4
18
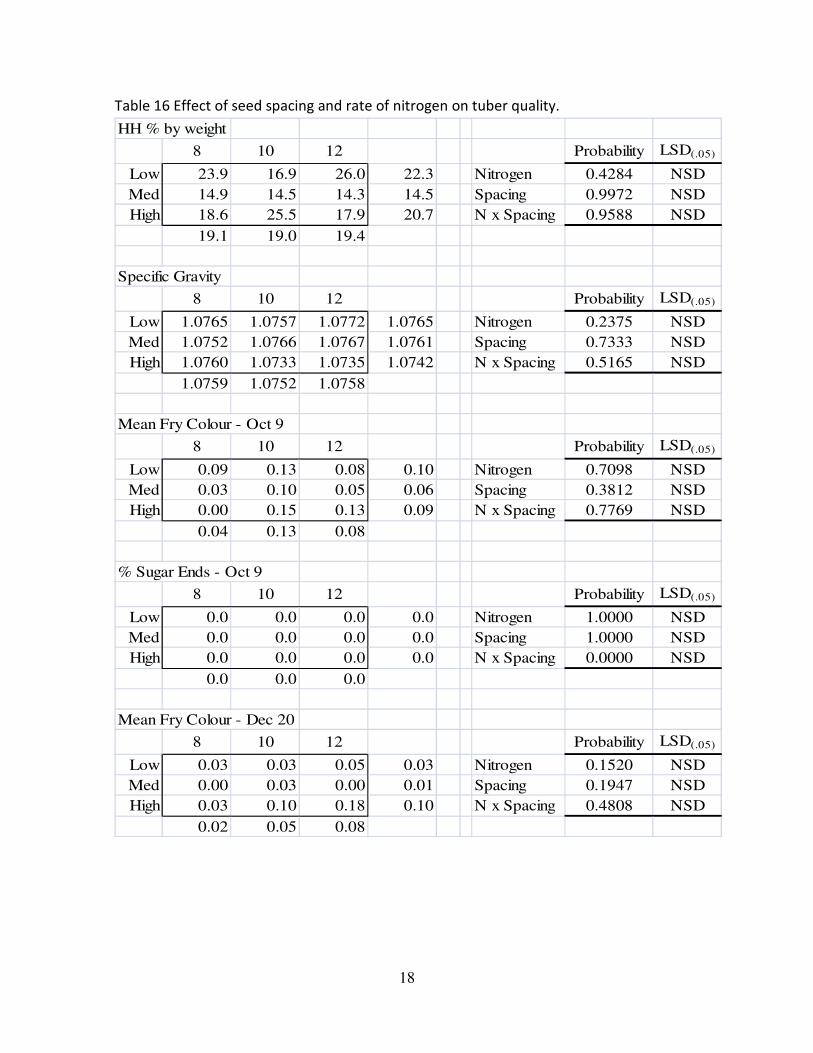
Table 16 Effect of seed spacing and rate of nitrogen on tuber quality.
HH % by weight
8 10 12 Probability LSD(.05)
Low 23.9 16.9 26.0 22.3 Nitrogen 0.4284 NSD
Med 14.9 14.5 14.3 14.5 Spacing 0.9972 NSD
High 18.6 25.5 17.9 20.7 N x Spacing 0.9588 NSD
19.1 19.0 19.4
Specific Gravity
8 10 12 Probability LSD(.05)
Low 1.0765 1.0757 1.0772 1.0765 Nitrogen 0.2375 NSD
Med 1.0752 1.0766 1.0767 1.0761 Spacing 0.7333 NSD
High 1.0760 1.0733 1.0735 1.0742 N x Spacing 0.5165 NSD
1.0759 1.0752 1.0758
Mean Fry Colour - Oct 9
8 10 12 Probability LSD(.05)
Low 0.09 0.13 0.08 0.10 Nitrogen 0.7098 NSD
Med 0.03 0.10 0.05 0.06 Spacing 0.3812 NSD
High 0.00 0.15 0.13 0.09 N x Spacing 0.7769 NSD
0.04 0.13 0.08
% Sugar Ends - Oct 9
8 10 12 Probability LSD(.05)
Low 0.0 0.0 0.0 0.0 Nitrogen 1.0000 NSD
Med 0.0 0.0 0.0 0.0 Spacing 1.0000 NSD
High 0.0 0.0 0.0 0.0 N x Spacing 0.0000 NSD
0.0 0.0 0.0
Mean Fry Colour - Dec 20
8 10 12 Probability LSD(.05)
Low 0.03 0.03 0.05 0.03 Nitrogen 0.1520 NSD
Med 0.00 0.03 0.00 0.01 Spacing 0.1947 NSD
High 0.03 0.10 0.18 0.10 N x Spacing 0.4808 NSD
0.02 0.05 0.08
19
Table 17 Effect of seed spacing and rate of nitrogen on yield
Undersize
8 10 12 Probability LSD(.05)
Low 54.5 45.1 30.1 43.2 Nitrogen 0.3745 NSD
Med 41.6 40.1 40.3 40.7 Spacing 0.0028 5.1
High 51.7 52.7 40.7 48.4 N x Spacing 0.8076 NSD
49.3 46.0 37.0
Marketable
8 10 12 Probability LSD(.05)
Low 184.0 207.3 234.3 208.5 Nitrogen 0.6882 NSD
Med 205.9 191.2 167.4 188.2 Spacing 0.9352 NSD
High 205.7 182.2 199.9 195.9 N x Spacing 0.6455 NSD
198.5 193.6 200.5
Total
8 10 12 Probability LSD(.05)
Low 238.6 252.3 264.4 251.7 Nitrogen 0.4939 NSD
Med 247.5 231.3 207.7 228.8 Spacing 0.8464 NSD
High 257.3 235.0 240.5 244.2 N x Spacing 0.6406 NSD
247.8 239.5 237.5
Bonus %
8 10 12 Probability LSD(.05)
Low 11.6 16.9 26.5 18.3 Nitrogen 0.5010 NSD
Med 17.2 15.1 16.4 16.2 Spacing 0.1269 NSD
High 13.0 12.1 17.2 14.1 N x Spacing 0.2812 NSD
13.9 14.7 20.0
20
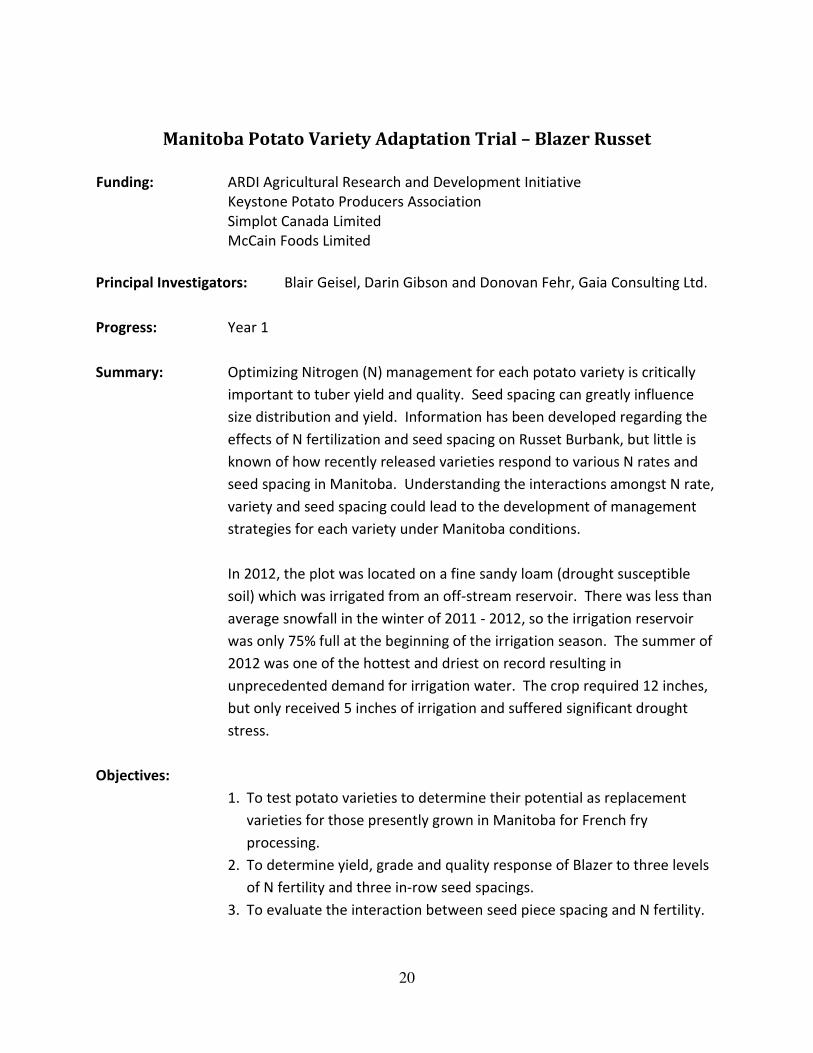
Manitoba Potato Variety Adaptation Trial – Blazer Russet
Funding: ARDI Agricultural Research and Development Initiative
Keystone Potato Producers Association
Simplot Canada Limited
McCain Foods Limited
Principal Investigators: Blair Geisel, Darin Gibson and Donovan Fehr, Gaia Consulting Ltd.
Progress: Year 1
Summary: Optimizing Nitrogen (N) management for each potato variety is critically
important to tuber yield and quality. Seed spacing can greatly influence
size distribution and yield. Information has been developed regarding the
effects of N fertilization and seed spacing on Russet Burbank, but little is
known of how recently released varieties respond to various N rates and
seed spacing in Manitoba. Understanding the interactions amongst N rate,
variety and seed spacing could lead to the development of management
strategies for each variety under Manitoba conditions.
In 2012, the plot was located on a fine sandy loam (drought susceptible
soil) which was irrigated from an off-stream reservoir. There was less than
average snowfall in the winter of 2011 - 2012, so the irrigation reservoir
was only 75% full at the beginning of the irrigation season. The summer of
2012 was one of the hottest and driest on record resulting in
unprecedented demand for irrigation water. The crop required 12 inches,
but only received 5 inches of irrigation and suffered significant drought
stress.
Objectives:
1. To test potato varieties to determine their potential as replacement
varieties for those presently grown in Manitoba for French fry
processing.
2. To determine yield, grade and quality response of Blazer to three levels
of N fertility and three in-row seed spacings.
3. To evaluate the interaction between seed piece spacing and N fertility.
21
4. To develop management strategies for Blazer under Manitoba
conditions.
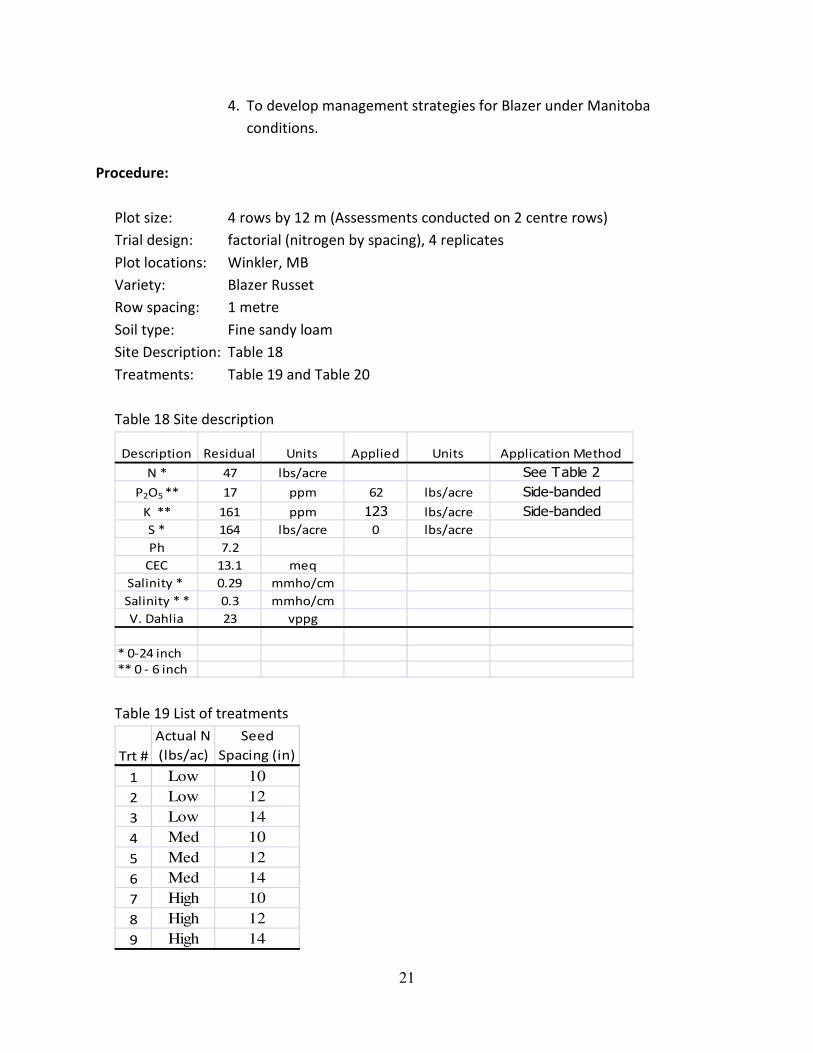
Procedure:
Plot size: 4 rows by 12 m (Assessments conducted on 2 centre rows)
Trial design: factorial (nitrogen by spacing), 4 replicates
Plot locations: Winkler, MB
Variety: Blazer Russet
Row spacing: 1 metre
Soil type: Fine sandy loam
Site Description: Table 18
Treatments: Table 19 and Table 20
Table 18 Site description
Description Residual Units Applied Units Application Method
N * 47 lbs/acre See Table 2
P2O5 ** 17 ppm 62 lbs/acre Side-banded
K ** 161 ppm 123 lbs/acre Side-banded
S * 164 lbs/acre 0 lbs/acre
Ph 7.2
CEC 13.1 meq
Salinity * 0.29 mmho/cm
Salinity * * 0.3 mmho/cm
V. Dahlia 23 vppg
* 0-24 inch
** 0 - 6 inch
Table 19 List of treatments
Trt #
Actual N
(lbs/ac)
Seed
Spacing (in)
1 Low 10
2 Low 12
3 Low 14
4 Med 10
5 Med 12
6 Med 14
7 High 10
8 High 12
9 High 14
22
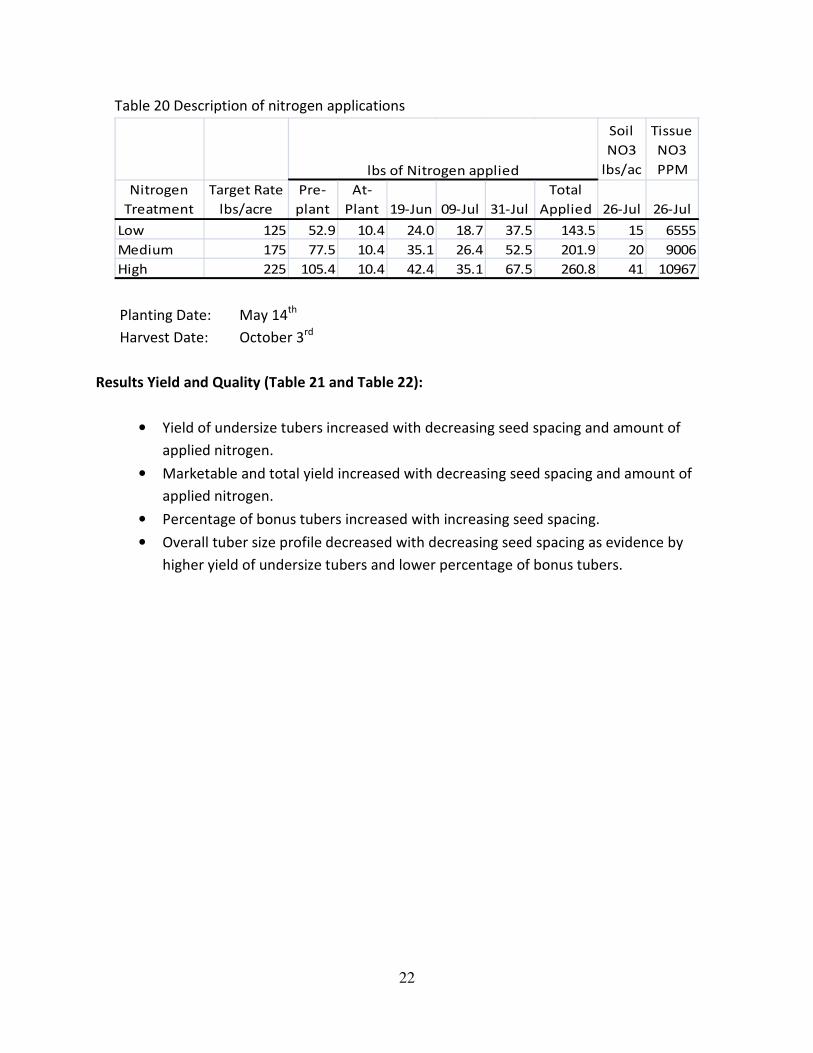
Table 20 Description of nitrogen applications
Soil
NO3
lbs/ac
Tissue
NO3
PPM
Nitrogen
Treatment
Target Rate
lbs/acre
Pre-
plant
At-
Plant 19-Jun 09-Jul 31-Jul
Total
Applied 26-Jul 26-Jul
Low 125 52.9 10.4 24.0 18.7 37.5 143.5 15 6555
Medium 175 77.5 10.4 35.1 26.4 52.5 201.9 20 9006
High 225 105.4 10.4 42.4 35.1 67.5 260.8 41 10967
lbs of Nitrogen applied
Planting Date: May 14th
Harvest Date: October 3rd
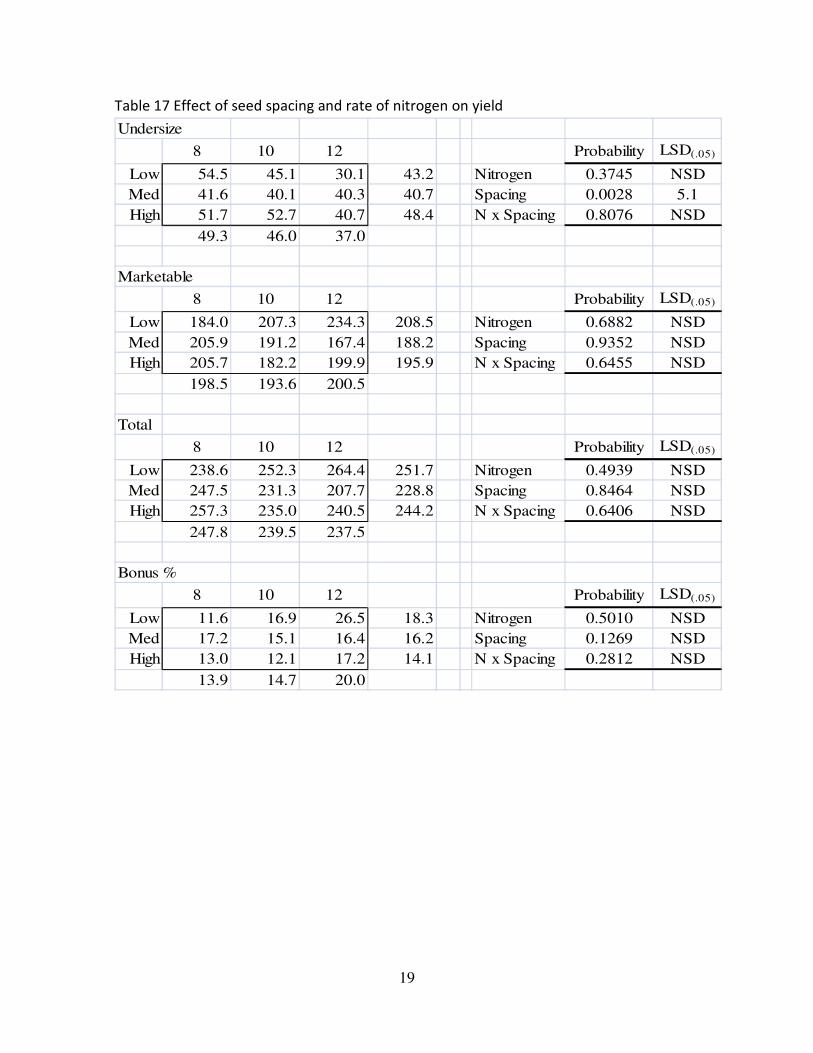
Results Yield and Quality (Table 21 and Table 22):
• Yield of undersize tubers increased with decreasing seed spacing and amount of
applied nitrogen.
• Marketable and total yield increased with decreasing seed spacing and amount of
applied nitrogen.
• Percentage of bonus tubers increased with increasing seed spacing.
• Overall tuber size profile decreased with decreasing seed spacing as evidence by
higher yield of undersize tubers and lower percentage of bonus tubers.
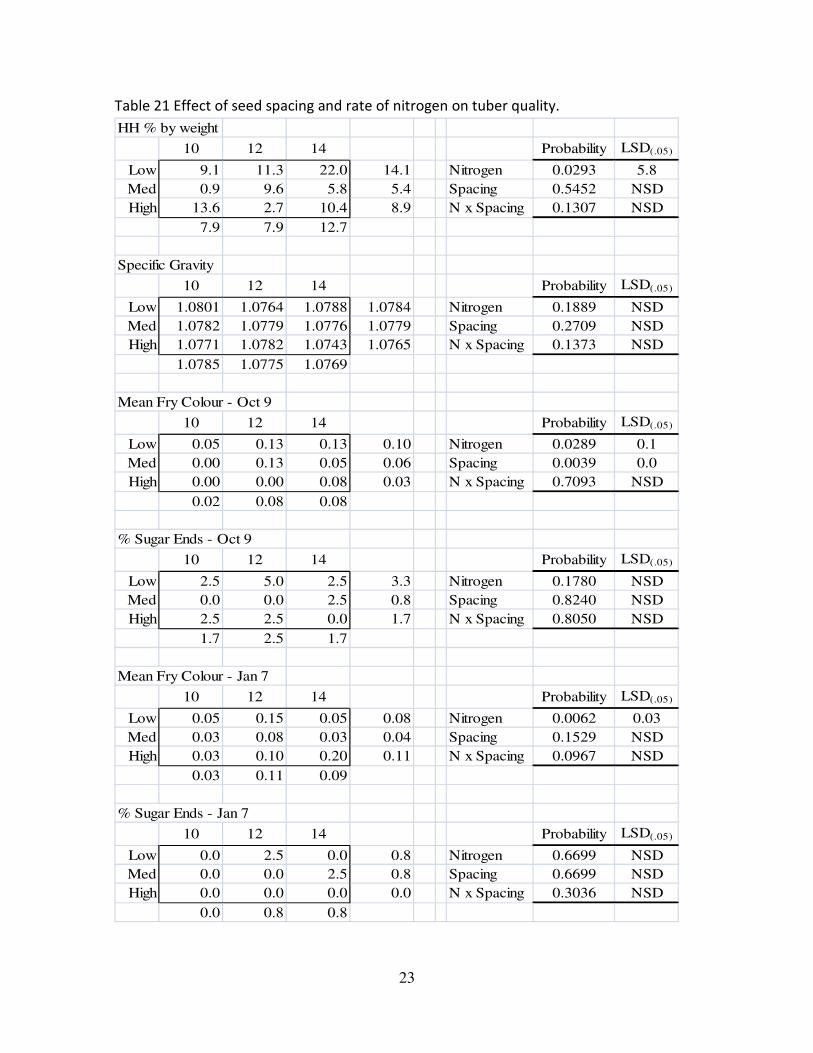
23
Table 21 Effect of seed spacing and rate of nitrogen on tuber quality.
HH % by weight
10 12 14 Probability LSD(.05)
Low 9.1 11.3 22.0 14.1 Nitrogen 0.0293 5.8
Med 0.9 9.6 5.8 5.4 Spacing 0.5452 NSD
High 13.6 2.7 10.4 8.9 N x Spacing 0.1307 NSD
7.9 7.9 12.7
Specific Gravity
10 12 14 Probability LSD(.05)
Low 1.0801 1.0764 1.0788 1.0784 Nitrogen 0.1889 NSD
Med 1.0782 1.0779 1.0776 1.0779 Spacing 0.2709 NSD
High 1.0771 1.0782 1.0743 1.0765 N x Spacing 0.1373 NSD
1.0785 1.0775 1.0769
Mean Fry Colour - Oct 9
10 12 14 Probability LSD(.05)
Low 0.05 0.13 0.13 0.10 Nitrogen 0.0289 0.1
Med 0.00 0.13 0.05 0.06 Spacing 0.0039 0.0
High 0.00 0.00 0.08 0.03 N x Spacing 0.7093 NSD
0.02 0.08 0.08
% Sugar Ends - Oct 9
10 12 14 Probability LSD(.05)
Low 2.5 5.0 2.5 3.3 Nitrogen 0.1780 NSD
Med 0.0 0.0 2.5 0.8 Spacing 0.8240 NSD
High 2.5 2.5 0.0 1.7 N x Spacing 0.8050 NSD
1.7 2.5 1.7
Mean Fry Colour - Jan 7
10 12 14 Probability LSD(.05)
Low 0.05 0.15 0.05 0.08 Nitrogen 0.0062 0.03
Med 0.03 0.08 0.03 0.04 Spacing 0.1529 NSD
High 0.03 0.10 0.20 0.11 N x Spacing 0.0967 NSD
0.03 0.11 0.09
% Sugar Ends - Jan 7
10 12 14 Probability LSD(.05)
Low 0.0 2.5 0.0 0.8 Nitrogen 0.6699 NSD
Med 0.0 0.0 2.5 0.8 Spacing 0.6699 NSD
High 0.0 0.0 0.0 0.0 N x Spacing 0.3036 NSD
0.0 0.8 0.8
24
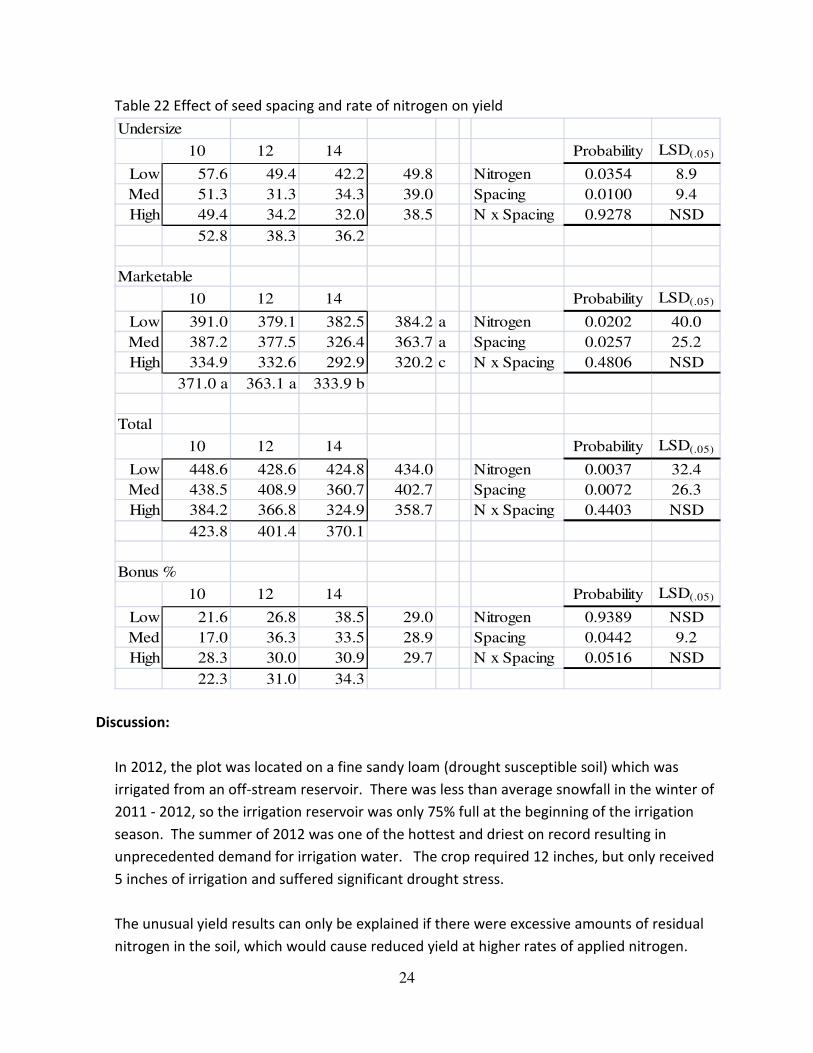
Table 22 Effect of seed spacing and rate of nitrogen on yield
Undersize
10 12 14 Probability LSD(.05)
Low 57.6 49.4 42.2 49.8 Nitrogen 0.0354 8.9
Med 51.3 31.3 34.3 39.0 Spacing 0.0100 9.4
High 49.4 34.2 32.0 38.5 N x Spacing 0.9278 NSD
52.8 38.3 36.2
Marketable
10 12 14 Probability LSD(.05)
Low 391.0 379.1 382.5 384.2 a Nitrogen 0.0202 40.0
Med 387.2 377.5 326.4 363.7 a Spacing 0.0257 25.2
High 334.9 332.6 292.9 320.2 c N x Spacing 0.4806 NSD
371.0 a 363.1 a 333.9 b
Total
10 12 14 Probability LSD(.05)
Low 448.6 428.6 424.8 434.0 Nitrogen 0.0037 32.4
Med 438.5 408.9 360.7 402.7 Spacing 0.0072 26.3
High 384.2 366.8 324.9 358.7 N x Spacing 0.4403 NSD
423.8 401.4 370.1
Bonus %
10 12 14 Probability LSD(.05)
Low 21.6 26.8 38.5 29.0 Nitrogen 0.9389 NSD
Med 17.0 36.3 33.5 28.9 Spacing 0.0442 9.2
High 28.3 30.0 30.9 29.7 N x Spacing 0.0516 NSD
22.3 31.0 34.3
Discussion:
In 2012, the plot was located on a fine sandy loam (drought susceptible soil) which was
irrigated from an off-stream reservoir. There was less than average snowfall in the winter of
2011 - 2012, so the irrigation reservoir was only 75% full at the beginning of the irrigation
season. The summer of 2012 was one of the hottest and driest on record resulting in
unprecedented demand for irrigation water. The crop required 12 inches, but only received
5 inches of irrigation and suffered significant drought stress.
The unusual yield results can only be explained if there were excessive amounts of residual
nitrogen in the soil, which would cause reduced yield at higher rates of applied nitrogen.

25
Soil analysis in the fall of 2012 did not indicate that there was excessive residual N. Both the
grower’s and Gaia Consulting’s soil analysis indicated that there was less than 50 lbs of
residual nitrogen. Two other variety adaptation trials were located at this site and spatial
differences in the soil were identified as confounding factors. These differences may also be
influencing the results in the Blazer evaluation.
26
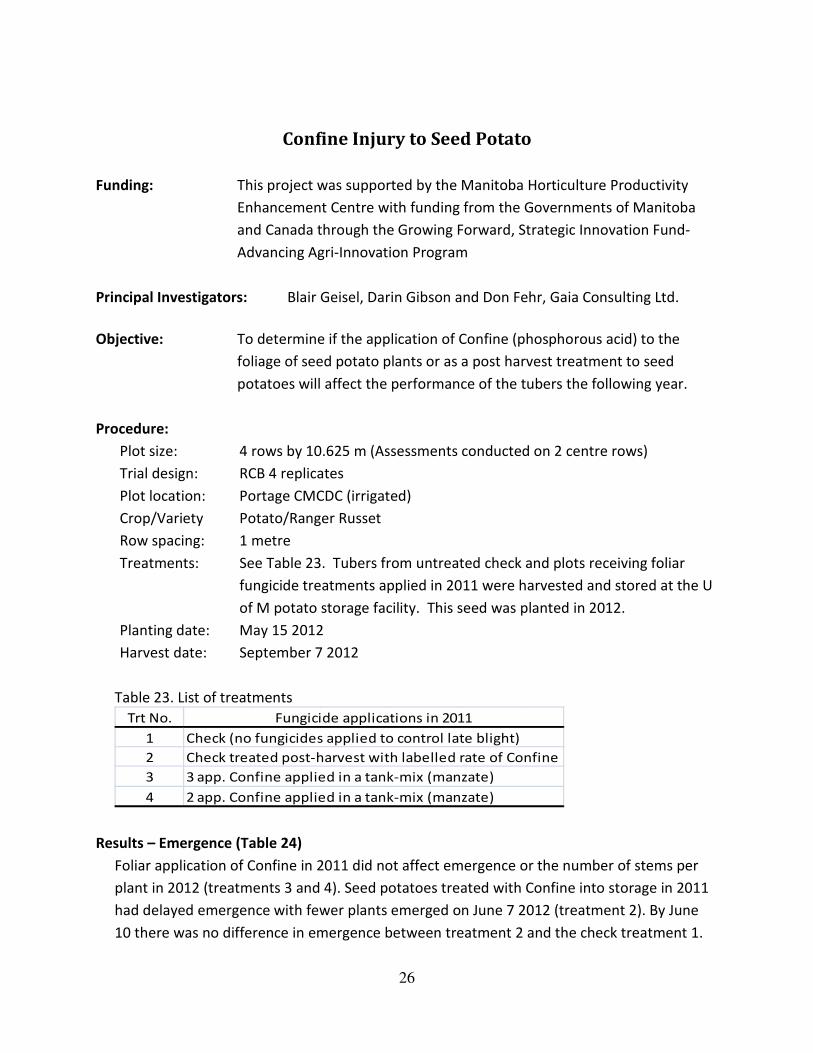
Confine Injury to Seed Potato
Funding: This project was supported by the Manitoba Horticulture Productivity
Enhancement Centre with funding from the Governments of Manitoba
and Canada through the Growing Forward, Strategic Innovation Fund-
Advancing Agri-Innovation Program
Principal Investigators: Blair Geisel, Darin Gibson and Don Fehr, Gaia Consulting Ltd.
Objective: To determine if the application of Confine (phosphorous acid) to the
foliage of seed potato plants or as a post harvest treatment to seed
potatoes will affect the performance of the tubers the following year.
Procedure:
Plot size: 4 rows by 10.625 m (Assessments conducted on 2 centre rows)
Trial design: RCB 4 replicates
Plot location: Portage CMCDC (irrigated)
Crop/Variety Potato/Ranger Russet
Row spacing: 1 metre
Treatments: See Table 23. Tubers from untreated check and plots receiving foliar
fungicide treatments applied in 2011 were harvested and stored at the U
of M potato storage facility. This seed was planted in 2012.
Planting date: May 15 2012
Harvest date: September 7 2012
Table 23. List of treatments
Trt No.
1
2
3
4 2 app. Confine applied in a tank-mix (manzate)
Fungicide applications in 2011
Check (no fungicides applied to control late blight)
Check treated post-harvest with labelled rate of Confine
3 app. Confine applied in a tank-mix (manzate)
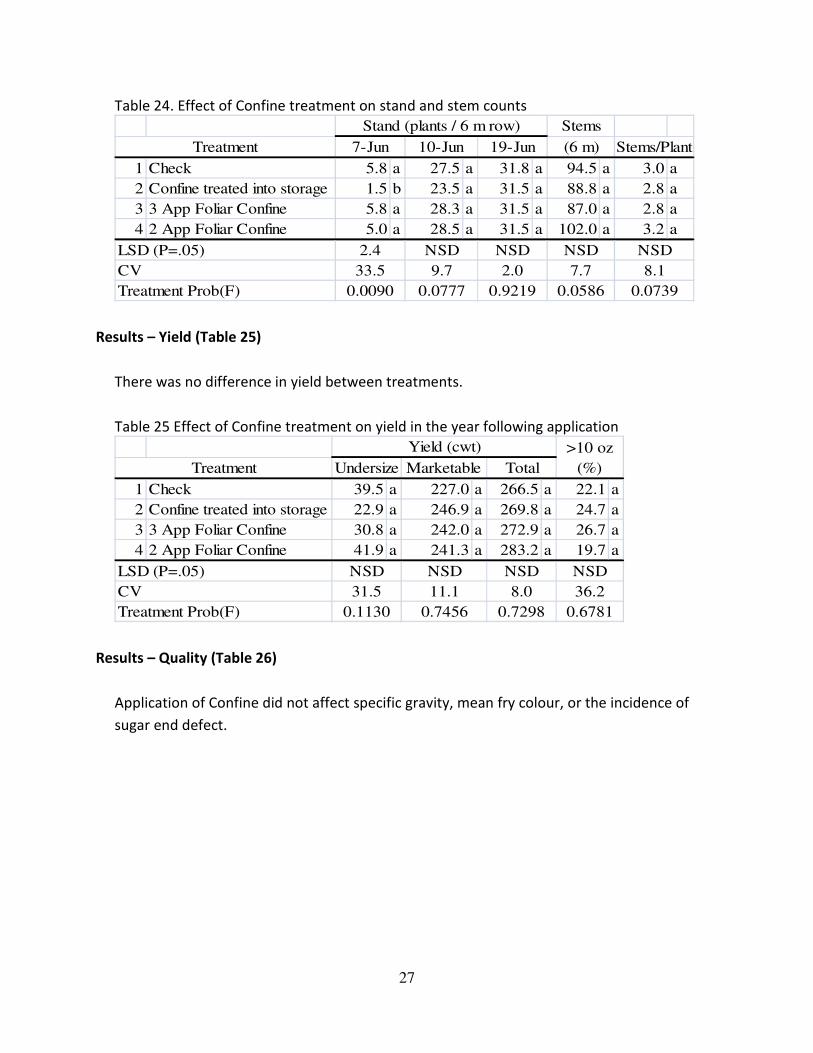
Results – Emergence (Table 24)
Foliar application of Confine in 2011 did not affect emergence or the number of stems per
plant in 2012 (treatments 3 and 4). Seed potatoes treated with Confine into storage in 2011
had delayed emergence with fewer plants emerged on June 7 2012 (treatment 2). By June
10 there was no difference in emergence between treatment 2 and the check treatment 1.
27
Table 24. Effect of Confine treatment on stand and stem counts
1 Check 5.8 a 27.5 a 31.8 a 94.5 a 3.0 a
2 Confine treated into storage 1.5 b 23.5 a 31.5 a 88.8 a 2.8 a
3 3 App Foliar Confine 5.8 a 28.3 a 31.5 a 87.0 a 2.8 a
4 2 App Foliar Confine 5.0 a 28.5 a 31.5 a 102.0 a 3.2 a
Treatment 7-Jun 10-Jun 19-Jun
33.5 9.7 2.0
Stand (plants / 6 m row)
8.1
NSD
(6 m) Stems/Plant
Stems
0.0739
LSD (P=.05) 2.4 NSD NSD NSD
CV
Treatment Prob(F) 0.0090 0.0777 0.9219 0.0586
7.7
Results – Yield (Table 25)
There was no difference in yield between treatments.
Table 25 Effect of Confine treatment on yield in the year following application
1 Check 39.5 a 227.0 a 266.5 a 22.1 a
2 Confine treated into storage 22.9 a 246.9 a 269.8 a 24.7 a
3 3 App Foliar Confine 30.8 a 242.0 a 272.9 a 26.7 a
4 2 App Foliar Confine 41.9 a 241.3 a 283.2 a 19.7 a
>10 oz
(%)
Yield (cwt)
Treatment Undersize Marketable Total
CV 31.5 11.1 8.0 36.2
LSD (P=.05) NSD NSD NSD NSD
Treatment Prob(F) 0.1130 0.7456 0.7298 0.6781
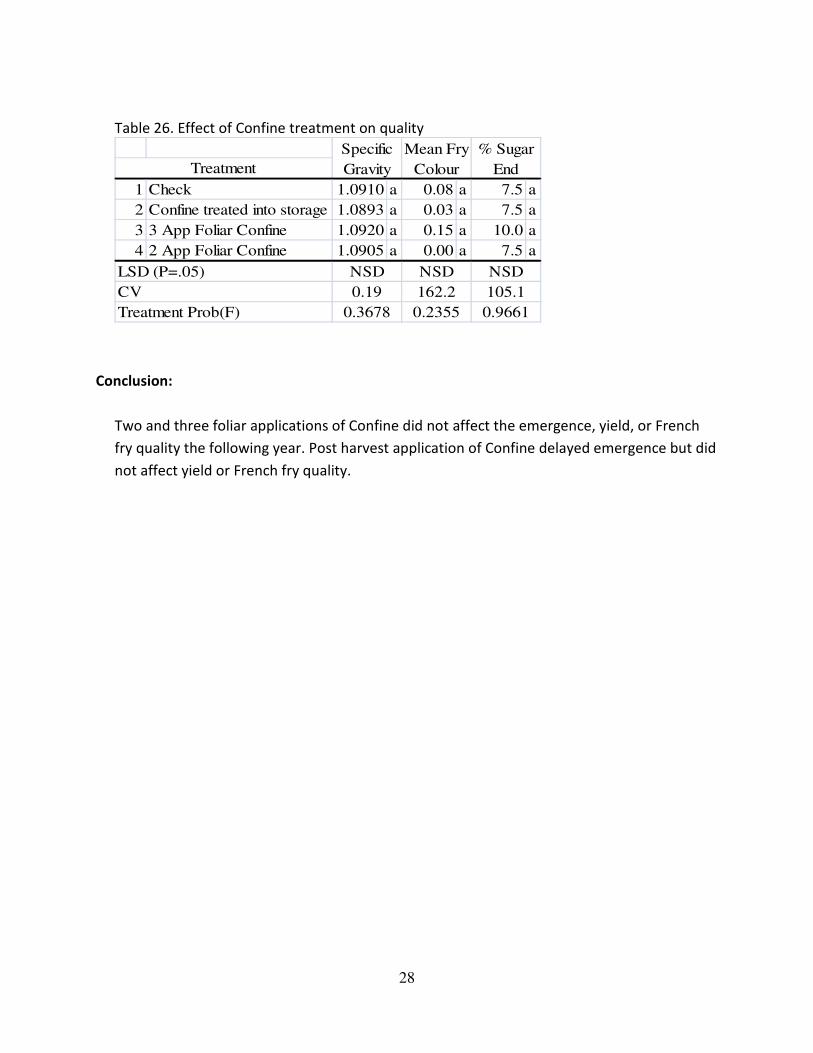
Results – Quality (Table 26)
Application of Confine did not affect specific gravity, mean fry colour, or the incidence of
sugar end defect.
28
Table 26. Effect of Confine treatment on quality
1 Check 1.0910 a 0.08 a 7.5 a
2 Confine treated into storage 1.0893 a 0.03 a 7.5 a
3 3 App Foliar Confine 1.0920 a 0.15 a 10.0 a
4 2 App Foliar Confine 1.0905 a 0.00 a 7.5 a
Treatment Prob(F) 0.3678 0.2355 0.9661
Specific
Gravity
Mean Fry
Colour
% Sugar
End
LSD (P=.05) NSD NSD NSD
CV 0.19 162.2 105.1
Treatment
Conclusion:
Two and three foliar applications of Confine did not affect the emergence, yield, or French
fry quality the following year. Post harvest application of Confine delayed emergence but did
not affect yield or French fry quality.
29
Evaluation of Conventional Ridged-row (CRR) and 5-row Bed (BED)
Planting Methods
Funding: This project was supported by the Manitoba Horticulture Productivity
Enhancement Centre with funding from the Governments of Manitoba and
Canada through the Growing Forward, Strategic Innovation Fund-Advancing
Agri-Innovation Program MHPEC (Advancing Agri-Innovation Program)
In Kind: Under the Hill- Chad Berry – Planted bed treatments
Hood Farms - Kevin Hood – Planted and hilled CRR treatments
KPPA – Andrew Ronald – Assisted in writing protocol and establishing plots
CMCDC –Brian Baron – site management and irrigation
Progress: Second year
Principal Investigators: Blair Geisel, Darin Gibson and Donovan Fehr of Gaia Consulting
Ltd.
Summary:
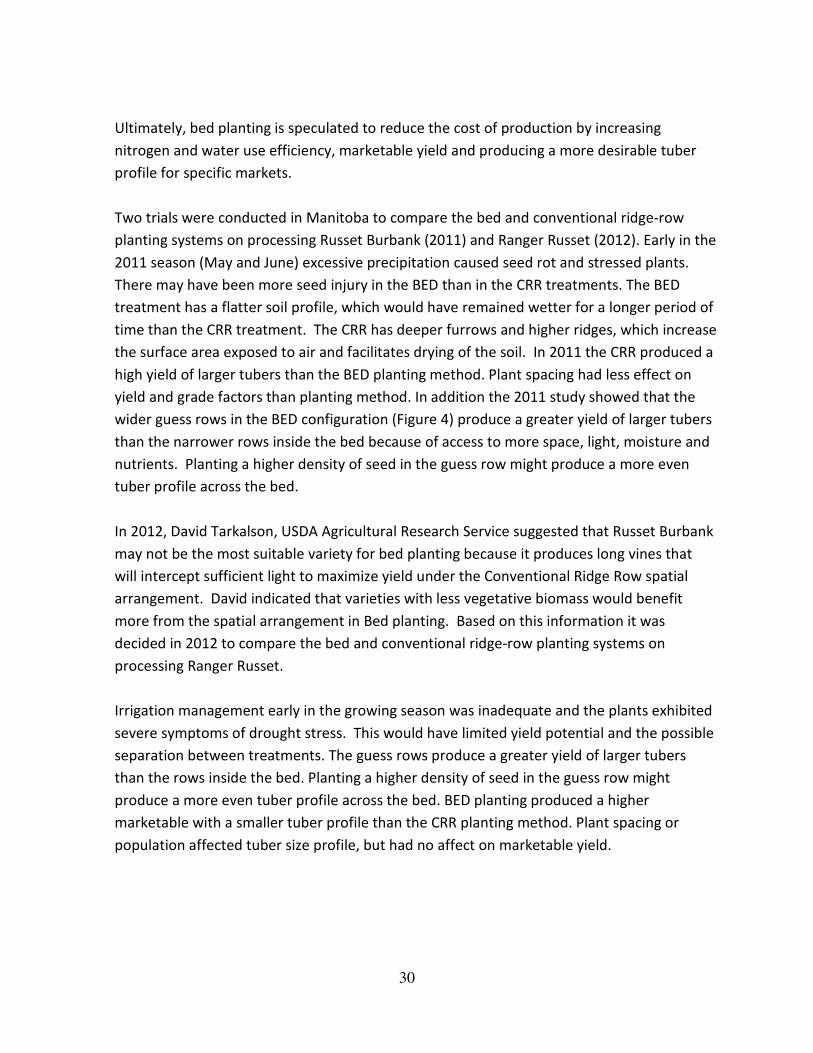
Bed planting, an alternative to the conventional ridged-row (CRR) planting system, has been
studied in North America and Europe since the 1940s. It is speculated that the benefits of
bed planting system come from producing a more level soil profile and improving the spatial
distribution of plants in the field (Figure 3).
In a conventional ridged-row configuration with 36 or 38 inches between rows, more than
50% of the land area is occupied by ridges and furrow space. In 5-row beds with 26 inches
between rows, the space occupied by ridges and furrows is reduced to less than 30%.
Reducing the amount of furrow creates a flatter bed allowing roots to grow more
horizontally, resulting in increased nitrogen and water use efficiency.
Improving the spatial distribution increases a plant’s ability to intercept sunlight and
influences tuber size profile. Sunlight is an important factor in tuber growth and yield
development. Better spatial distribution of plants produces a more uniform tuber size
profile, which is important in processing markets. Higher plant populations can be achieved
in beds than conventional ridge row resulting in a smaller tuber size profile, which is
desirable in table and seed markets.
30
Ultimately, bed planting is speculated to reduce the cost of production by increasing
nitrogen and water use efficiency, marketable yield and producing a more desirable tuber
profile for specific markets.
Two trials were conducted in Manitoba to compare the bed and conventional ridge-row
planting systems on processing Russet Burbank (2011) and Ranger Russet (2012). Early in the
2011 season (May and June) excessive precipitation caused seed rot and stressed plants.
There may have been more seed injury in the BED than in the CRR treatments. The BED
treatment has a flatter soil profile, which would have remained wetter for a longer period of
time than the CRR treatment. The CRR has deeper furrows and higher ridges, which increase
the surface area exposed to air and facilitates drying of the soil. In 2011 the CRR produced a
high yield of larger tubers than the BED planting method. Plant spacing had less effect on
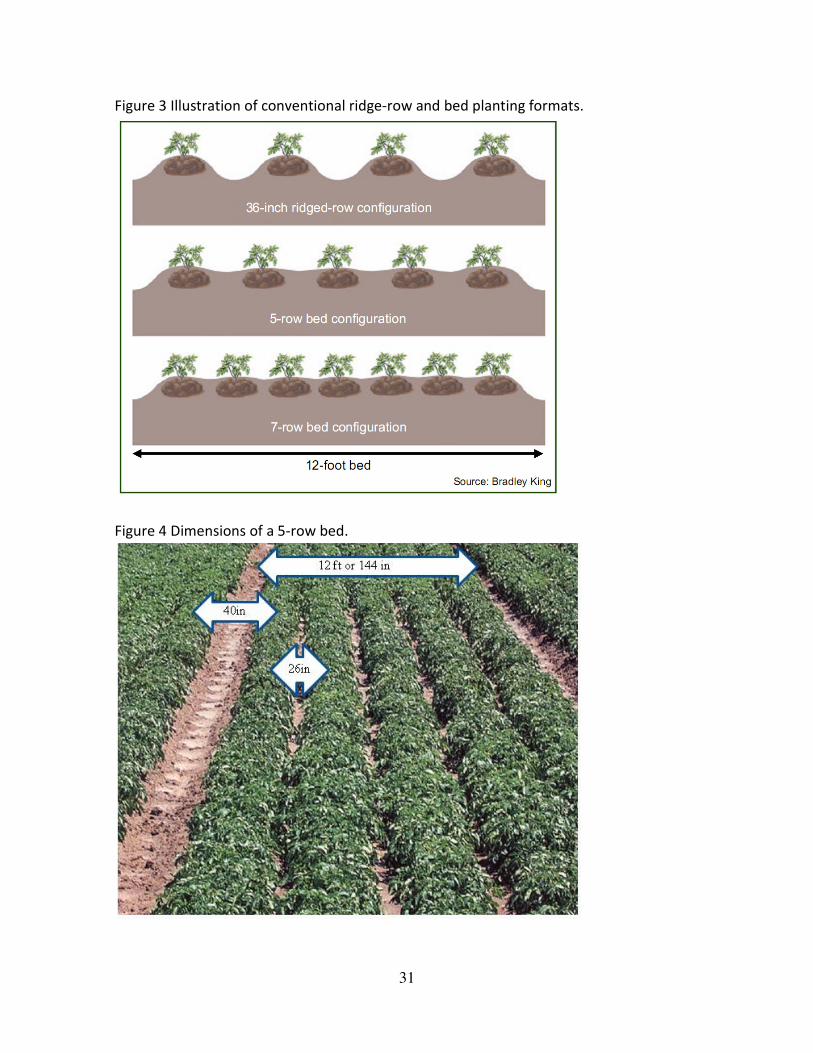
yield and grade factors than planting method. In addition the 2011 study showed that the
wider guess rows in the BED configuration (Figure 4) produce a greater yield of larger tubers
than the narrower rows inside the bed because of access to more space, light, moisture and
nutrients. Planting a higher density of seed in the guess row might produce a more even
tuber profile across the bed.
In 2012, David Tarkalson, USDA Agricultural Research Service suggested that Russet Burbank
may not be the most suitable variety for bed planting because it produces long vines that
will intercept sufficient light to maximize yield under the Conventional Ridge Row spatial
arrangement. David indicated that varieties with less vegetative biomass would benefit
more from the spatial arrangement in Bed planting. Based on this information it was
decided in 2012 to compare the bed and conventional ridge-row planting systems on
processing Ranger Russet.
Irrigation management early in the growing season was inadequate and the plants exhibited
severe symptoms of drought stress. This would have limited yield potential and the possible
separation between treatments. The guess rows produce a greater yield of larger tubers
than the rows inside the bed. Planting a higher density of seed in the guess row might
produce a more even tuber profile across the bed. BED planting produced a higher
marketable with a smaller tuber profile than the CRR planting method. Plant spacing or
population affected tuber size profile, but had no affect on marketable yield.
31
Figure 3 Illustration of conventional ridge-row and bed planting formats.
Figure 4 Dimensions of a 5-row bed.
32
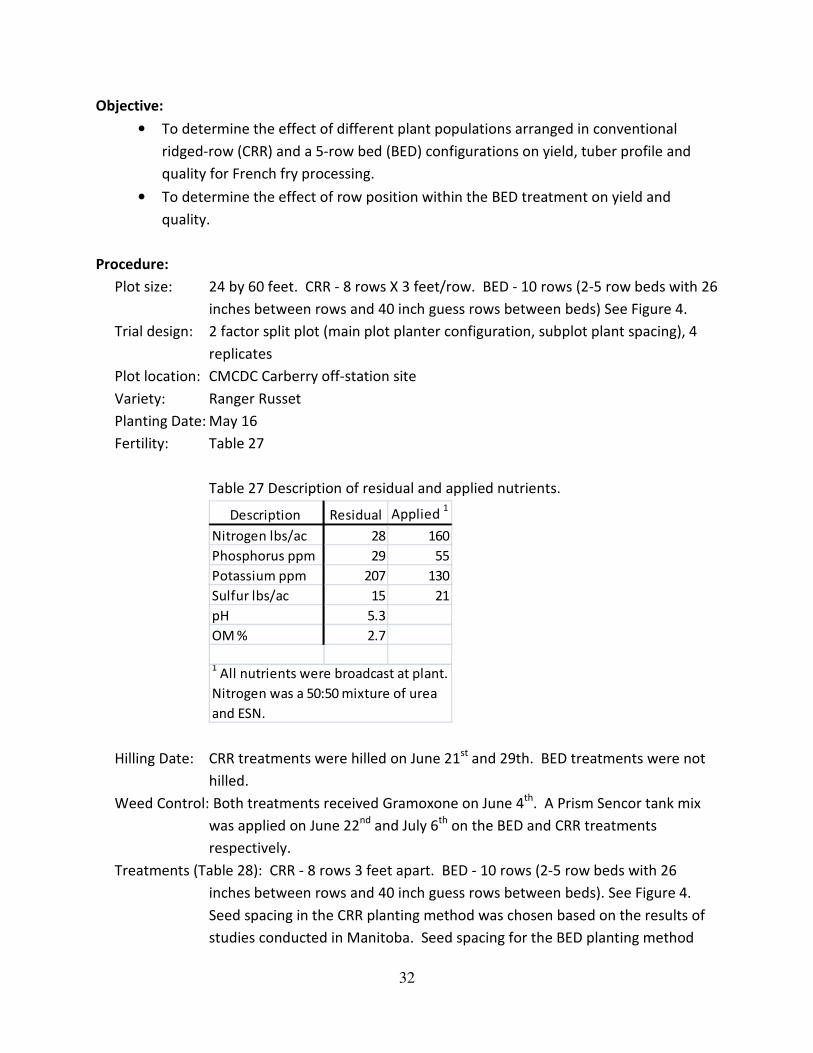
Objective:
• To determine the effect of different plant populations arranged in conventional
ridged-row (CRR) and a 5-row bed (BED) configurations on yield, tuber profile and
quality for French fry processing.
• To determine the effect of row position within the BED treatment on yield and
quality.
Procedure:
Plot size: 24 by 60 feet. CRR - 8 rows X 3 feet/row. BED - 10 rows (2-5 row beds with 26
inches between rows and 40 inch guess rows between beds) See Figure 4.
Trial design: 2 factor split plot (main plot planter configuration, subplot plant spacing), 4
replicates
Plot location: CMCDC Carberry off-station site
Variety: Ranger Russet
Planting Date: May 16
Fertility: Table 27
Table 27 Description of residual and applied nutrients.
Description Residual Applied 1
Nitrogen lbs/ac 28 160
Phosphorus ppm 29 55
Potassium ppm 207 130
Sulfur lbs/ac 15 21
pH 5.3
OM % 2.7
1 All nutrients were broadcast at plant.
Nitrogen was a 50:50 mixture of urea
and ESN.
Hilling Date: CRR treatments were hilled on June 21st and 29th. BED treatments were not
hilled.
Weed Control: Both treatments received Gramoxone on June 4th. A Prism Sencor tank mix
was applied on June 22nd and July 6th on the BED and CRR treatments
respectively.
Treatments (Table 28): CRR - 8 rows 3 feet apart. BED - 10 rows (2-5 row beds with 26
inches between rows and 40 inch guess rows between beds). See Figure 4.
Seed spacing in the CRR planting method was chosen based on the results of
studies conducted in Manitoba. Seed spacing for the BED planting method
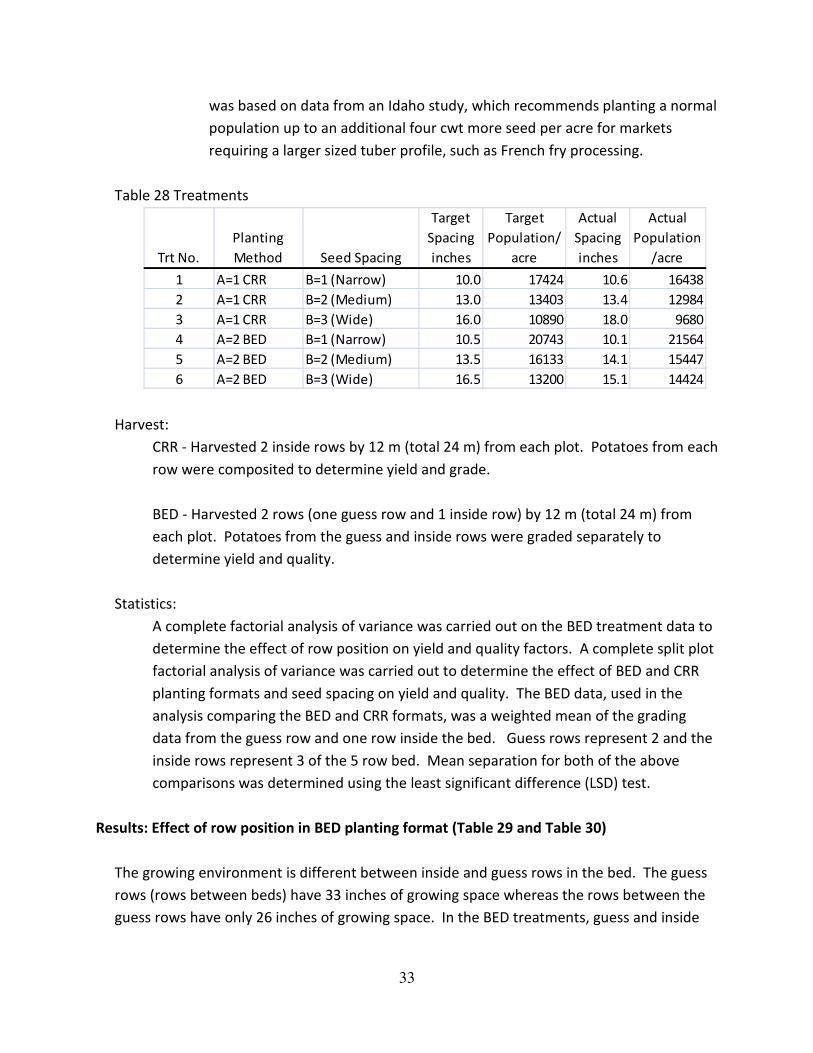
33
was based on data from an Idaho study, which recommends planting a normal
population up to an additional four cwt more seed per acre for markets
requiring a larger sized tuber profile, such as French fry processing.
Table 28 Treatments
Trt No.
Planting
Method Seed Spacing
Target
Spacing
inches
Target
Population/
acre
Actual
Spacing
inches
Actual
Population
/acre
1 A=1 CRR B=1 (Narrow) 10.0 17424 10.6 16438
2 A=1 CRR B=2 (Medium) 13.0 13403 13.4 12984
3 A=1 CRR B=3 (Wide) 16.0 10890 18.0 9680
4 A=2 BED B=1 (Narrow) 10.5 20743 10.1 21564
5 A=2 BED B=2 (Medium) 13.5 16133 14.1 15447
6 A=2 BED B=3 (Wide) 16.5 13200 15.1 14424
Harvest:
CRR - Harvested 2 inside rows by 12 m (total 24 m) from each plot. Potatoes from each
row were composited to determine yield and grade.
BED - Harvested 2 rows (one guess row and 1 inside row) by 12 m (total 24 m) from
each plot. Potatoes from the guess and inside rows were graded separately to
determine yield and quality.
Statistics:
A complete factorial analysis of variance was carried out on the BED treatment data to
determine the effect of row position on yield and quality factors. A complete split plot
factorial analysis of variance was carried out to determine the effect of BED and CRR
planting formats and seed spacing on yield and quality. The BED data, used in the
analysis comparing the BED and CRR formats, was a weighted mean of the grading
data from the guess row and one row inside the bed. Guess rows represent 2 and the
inside rows represent 3 of the 5 row bed. Mean separation for both of the above
comparisons was determined using the least significant difference (LSD) test.
Results: Effect of row position in BED planting format (Table 29 and Table 30)
The growing environment is different between inside and guess rows in the bed. The guess
rows (rows between beds) have 33 inches of growing space whereas the rows between the
guess rows have only 26 inches of growing space. In the BED treatments, guess and inside
34
rows were harvested and graded separately. These data were analyzed to determine the
effect of row position on yield, grade and quality.
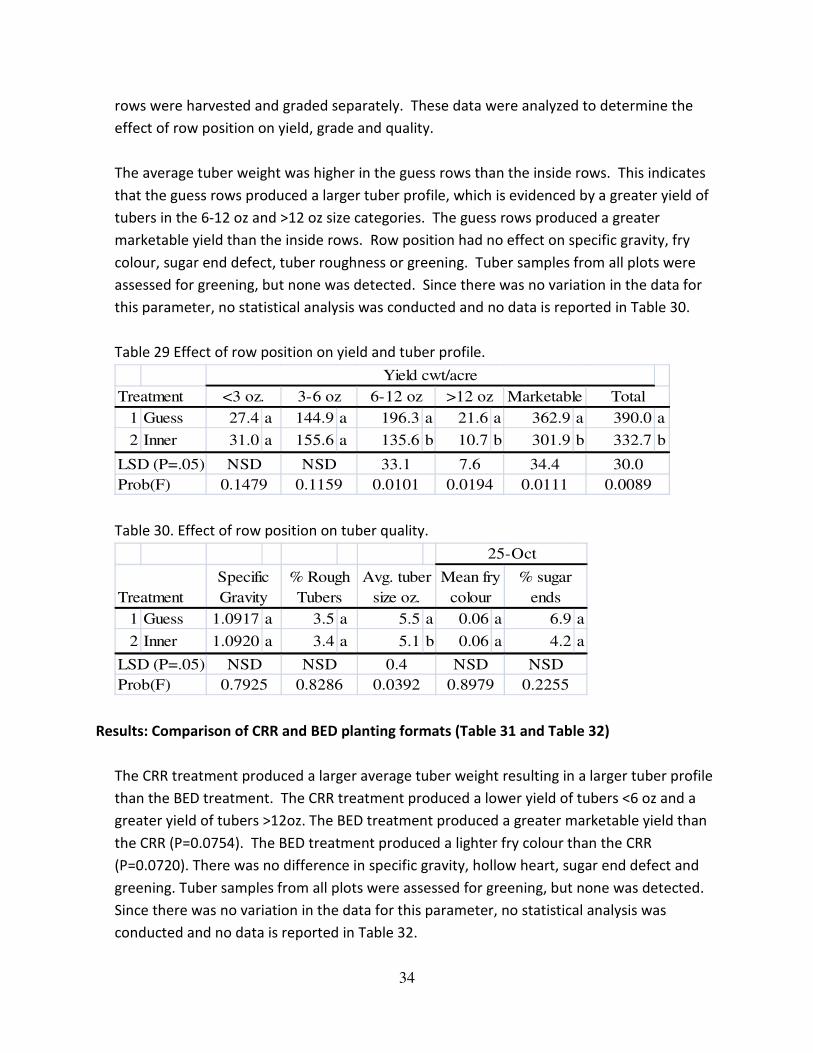
The average tuber weight was higher in the guess rows than the inside rows. This indicates
that the guess rows produced a larger tuber profile, which is evidenced by a greater yield of
tubers in the 6-12 oz and >12 oz size categories. The guess rows produced a greater
marketable yield than the inside rows. Row position had no effect on specific gravity, fry
colour, sugar end defect, tuber roughness or greening. Tuber samples from all plots were
assessed for greening, but none was detected. Since there was no variation in the data for
this parameter, no statistical analysis was conducted and no data is reported in Table 30.
Table 29 Effect of row position on yield and tuber profile.
1 Guess 27.4 a 144.9 a 196.3 a 21.6 a 362.9 a 390.0 a
2 Inner 31.0 a 155.6 a 135.6 b 10.7 b 301.9 b 332.7 b
Yield cwt/acre
Treatment <3 oz. 3-6 oz 6-12 oz >12 oz Marketable Total
34.4 30.0
Prob(F) 0.1479 0.1159 0.0101 0.0194 0.0111 0.0089
LSD (P=.05) NSD NSD 33.1 7.6
Table 30. Effect of row position on tuber quality.
1 Guess 1.0917 a 3.5 a 5.5 a 0.06 a 6.9 a
2 Inner 1.0920 a 3.4 a 5.1 b 0.06 a 4.2 a
25-Oct
Treatment
Specific
Gravity
% Rough
Tubers
Avg. tuber
size oz.
Mean fry
colour
% sugar
ends
NSD
Prob(F) 0.7925 0.8286 0.0392 0.8979 0.2255
LSD (P=.05) NSD NSD 0.4 NSD
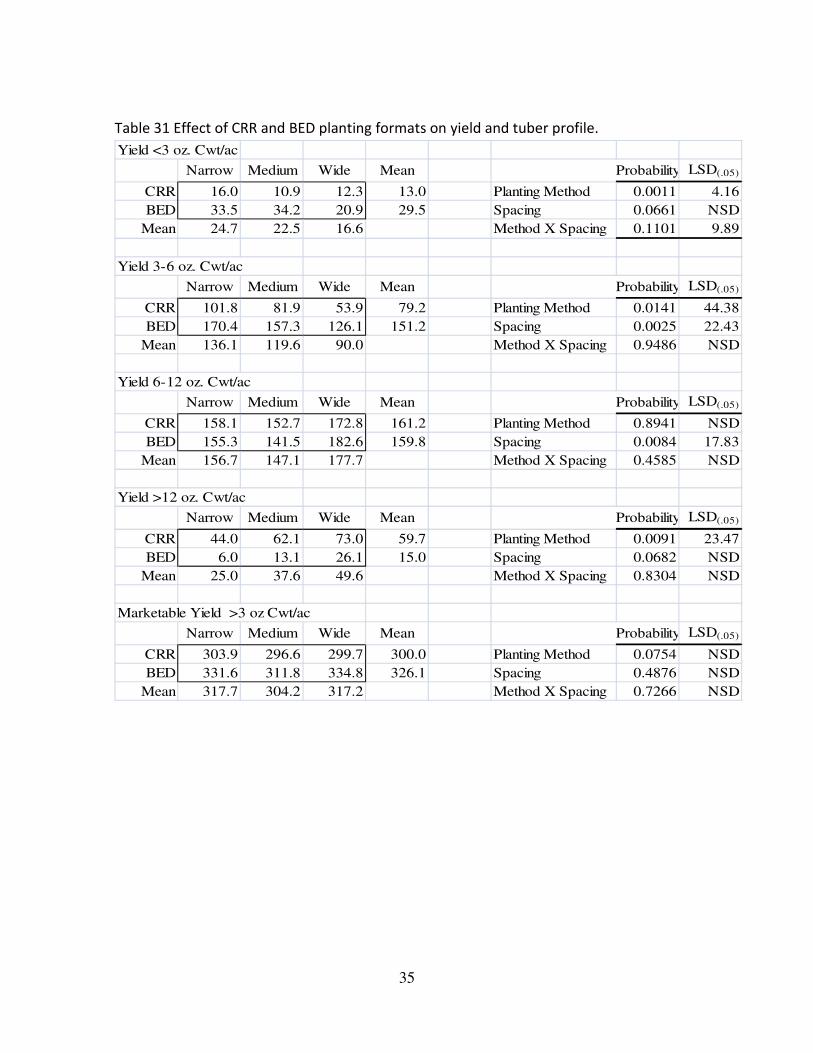
Results: Comparison of CRR and BED planting formats (Table 31 and Table 32)
The CRR treatment produced a larger average tuber weight resulting in a larger tuber profile
than the BED treatment. The CRR treatment produced a lower yield of tubers <6 oz and a
greater yield of tubers >12oz. The BED treatment produced a greater marketable yield than
the CRR (P=0.0754). The BED treatment produced a lighter fry colour than the CRR
(P=0.0720). There was no difference in specific gravity, hollow heart, sugar end defect and
greening. Tuber samples from all plots were assessed for greening, but none was detected.
Since there was no variation in the data for this parameter, no statistical analysis was
conducted and no data is reported in Table 32.
35
Table 31 Effect of CRR and BED planting formats on yield and tuber profile.
Yield <3 oz. Cwt/ac
Narrow Medium Wide Mean Probability LSD(.05)
CRR 16.0 10.9 12.3 13.0 Planting Method 0.0011 4.16
BED 33.5 34.2 20.9 29.5 Spacing 0.0661 NSD
Mean 24.7 22.5 16.6 Method X Spacing 0.1101 9.89
Yield 3-6 oz. Cwt/ac
Narrow Medium Wide Mean Probability LSD(.05)
CRR 101.8 81.9 53.9 79.2 Planting Method 0.0141 44.38
BED 170.4 157.3 126.1 151.2 Spacing 0.0025 22.43
Mean 136.1 119.6 90.0 Method X Spacing 0.9486 NSD
Yield 6-12 oz. Cwt/ac
Narrow Medium Wide Mean Probability LSD(.05)
CRR 158.1 152.7 172.8 161.2 Planting Method 0.8941 NSD
BED 155.3 141.5 182.6 159.8 Spacing 0.0084 17.83
Mean 156.7 147.1 177.7 Method X Spacing 0.4585 NSD
Yield >12 oz. Cwt/ac
Narrow Medium Wide Mean Probability LSD(.05)
CRR 44.0 62.1 73.0 59.7 Planting Method 0.0091 23.47
BED 6.0 13.1 26.1 15.0 Spacing 0.0682 NSD
Mean 25.0 37.6 49.6 Method X Spacing 0.8304 NSD
Marketable Yield >3 oz Cwt/ac
Narrow Medium Wide Mean Probability LSD(.05)
CRR 303.9 296.6 299.7 300.0 Planting Method 0.0754 NSD
BED 331.6 311.8 334.8 326.1 Spacing 0.4876 NSD
Mean 317.7 304.2 317.2 Method X Spacing 0.7266 NSD
36
Table 32 Effect of CRR and BED planting formats on tuber quality and tuber number
Average Tuber Size oz.
Narrow Medium Wide Mean Probability LSD(.05)
CRR 6.3 6.9 7.3 6.8 Planting Method 0.0027 0.54
BED 4.9 5.2 5.8 5.3 Spacing 0.0157 0.63
Mean 5.6 6.0 6.6 Method X Spacing 0.9021 NSD
% Rough Tubers
Narrow Medium Wide Mean Probability LSD(.05)
CRR 5.7 4.8 4.5 5.0 Planting Method 0.1104 NSD
BED 2.2 3.5 4.6 3.5 Spacing 0.8031 NSD
Mean 3.9 4.2 4.6 Method X Spacing 0.2175 NSD
Specific Gravity
Narrow Medium Wide Mean Probability LSD(.05)
CRR 1.0893 1.0901 1.0924 1.0906 Planting Method 0.3864 NSD
BED 1.0912 1.0936 1.0910 1.0919 Spacing 0.4453 NSD
Mean 1.0902 1.0918 1.0917 Method X Spacing 0.2400 NSD
Mean fry colour - Oct 25
Narrow Medium Wide Mean Probability LSD(.05)
CRR 0.24 0.45 0.33 0.34 Planting Method 0.0007 0.06
BED 0.06 0.05 0.07 0.06 Spacing 0.5371 NSD
Mean 0.15 0.25 0.20 Method X Spacing 0.4661 NSD
% Sugar End - Oct 25
Narrow Medium Wide Mean Probability LSD(.05)
CRR 18.0 7.5 5.0 10.2 Planting Method 0.0720 NSD
BED 7.0 4.5 4.3 5.3 Spacing 0.0901 NSD
Mean 12.5 6.0 4.6 Method X Spacing 0.3309 NSD
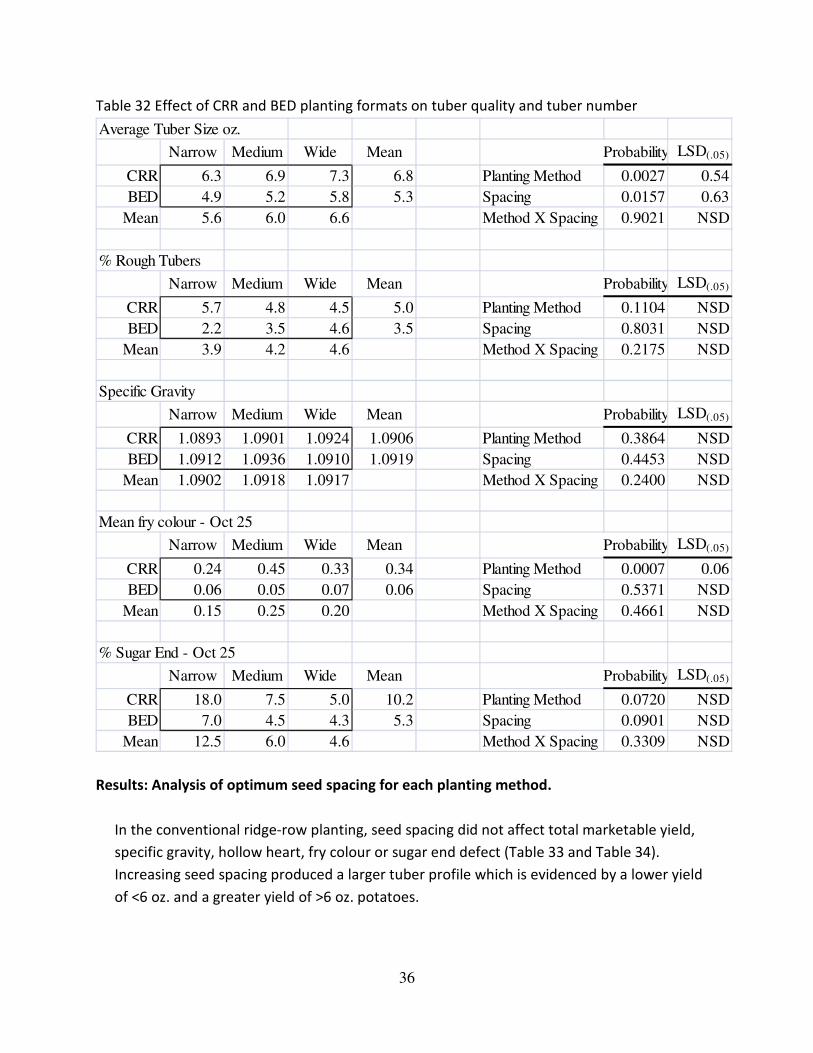
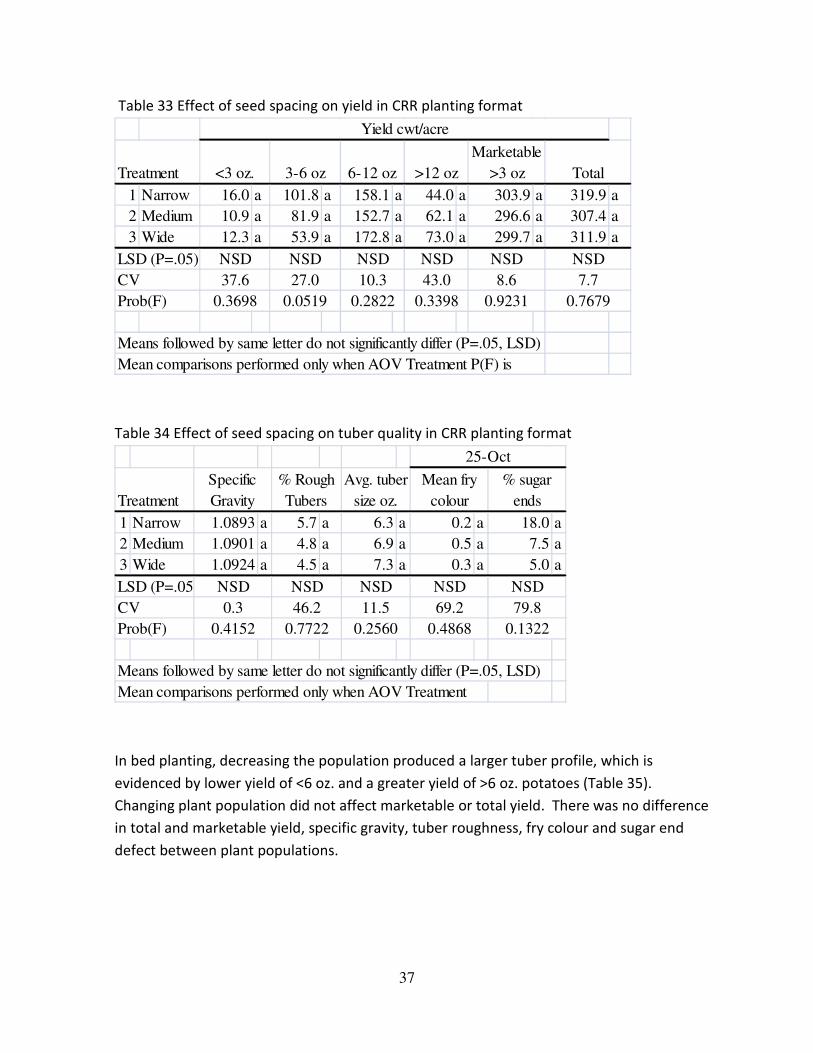
Results: Analysis of optimum seed spacing for each planting method.
In the conventional ridge-row planting, seed spacing did not affect total marketable yield,
specific gravity, hollow heart, fry colour or sugar end defect (Table 33 and Table 34).
Increasing seed spacing produced a larger tuber profile which is evidenced by a lower yield
of <6 oz. and a greater yield of >6 oz. potatoes.
37
Table 33 Effect of seed spacing on yield in CRR planting format
1 Narrow 16.0 a 101.8 a 158.1 a 44.0 a 303.9 a 319.9 a
2 Medium 10.9 a 81.9 a 152.7 a 62.1 a 296.6 a 307.4 a
3 Wide 12.3 a 53.9 a 172.8 a 73.0 a 299.7 a 311.9 a
Means followed by same letter do not significantly differ (P=.05, LSD)
Mean comparisons performed only when AOV Treatment P(F) is
Prob(F) 0.3698 0.0519 0.2822 0.3398 0.9231
CV 37.6 27.0 10.3 43.0 8.6
LSD (P=.05) NSD NSD NSD NSD NSD NSD
Treatment <3 oz. 3-6 oz 6-12 oz >12 oz
Marketable
>3 oz Total
Yield cwt/acre
7.7
0.7679
Table 34 Effect of seed spacing on tuber quality in CRR planting format
1 Narrow 1.0893 a 5.7 a 6.3 a 0.2 a 18.0 a
2 Medium 1.0901 a 4.8 a 6.9 a 0.5 a 7.5 a
3 Wide 1.0924 a 4.5 a 7.3 a 0.3 a 5.0 a
Means followed by same letter do not significantly differ (P=.05, LSD)
0.4868 0.1322
Mean comparisons performed only when AOV Treatment
Prob(F) 0.4152 0.7722 0.2560
CV 0.3
NSD NSDLSD (P=.05) NSD NSD NSD
69.2 79.846.2 11.5
Treatment
Specific
Gravity
25-Oct
% sugar
ends
Avg. tuber
size oz.
% Rough
Tubers
Mean fry
colour
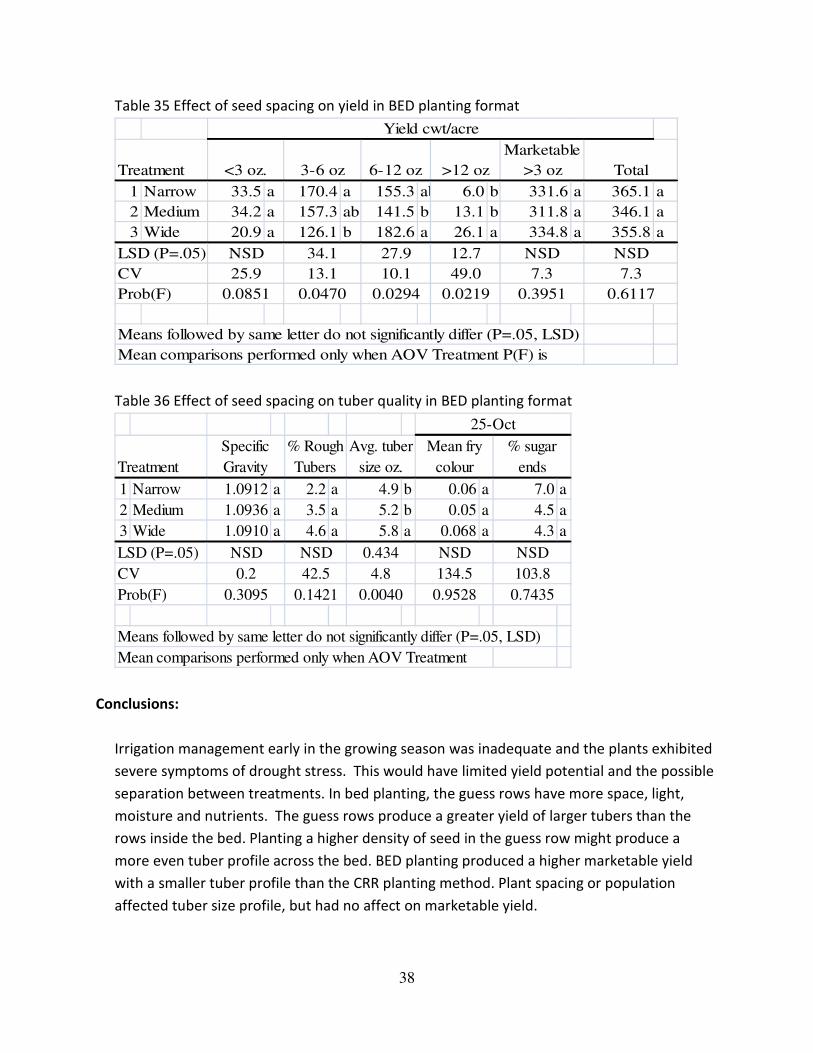
In bed planting, decreasing the population produced a larger tuber profile, which is
evidenced by lower yield of <6 oz. and a greater yield of >6 oz. potatoes (Table 35).
Changing plant population did not affect marketable or total yield. There was no difference
in total and marketable yield, specific gravity, tuber roughness, fry colour and sugar end
defect between plant populations.
38
Table 35 Effect of seed spacing on yield in BED planting format
1 Narrow 33.5 a 170.4 a 155.3 ab 6.0 b 331.6 a 365.1 a
2 Medium 34.2 a 157.3 ab 141.5 b 13.1 b 311.8 a 346.1 a
3 Wide 20.9 a 126.1 b 182.6 a 26.1 a 334.8 a 355.8 a
Means followed by same letter do not significantly differ (P=.05, LSD)
Mean comparisons performed only when AOV Treatment P(F) is
0.6117Prob(F) 0.0851 0.0470 0.0294 0.0219 0.3951
7.3 7.3CV 25.9 13.1 10.1 49.0
12.7 NSD NSD
Treatment <3 oz. 3-6 oz 6-12 oz >12 oz
Marketable
>3 oz Total
Yield cwt/acre
LSD (P=.05) NSD 34.1 27.9
Table 36 Effect of seed spacing on tuber quality in BED planting format
1 Narrow 1.0912 a 2.2 a 4.9 b 0.06 a 7.0 a
2 Medium 1.0936 a 3.5 a 5.2 b 0.05 a 4.5 a
3 Wide 1.0910 a 4.6 a 5.8 a 0.068 a 4.3 a
Means followed by same letter do not significantly differ (P=.05, LSD)
0.0040 0.9528 0.7435
Mean comparisons performed only when AOV Treatment
42.5
0.1421Prob(F) 0.3095
4.8 134.5 103.8CV 0.2
0.434NSD NSD NSDLSD (P=.05) NSD
Specific
Gravity
% Rough
Tubers
Avg. tuber
size oz.
Mean fry
colour
% sugar
ends
25-Oct
Treatment
Conclusions:
Irrigation management early in the growing season was inadequate and the plants exhibited
severe symptoms of drought stress. This would have limited yield potential and the possible
separation between treatments. In bed planting, the guess rows have more space, light,
moisture and nutrients. The guess rows produce a greater yield of larger tubers than the
rows inside the bed. Planting a higher density of seed in the guess row might produce a
more even tuber profile across the bed. BED planting produced a higher marketable yield
with a smaller tuber profile than the CRR planting method. Plant spacing or population
affected tuber size profile, but had no affect on marketable yield.
39
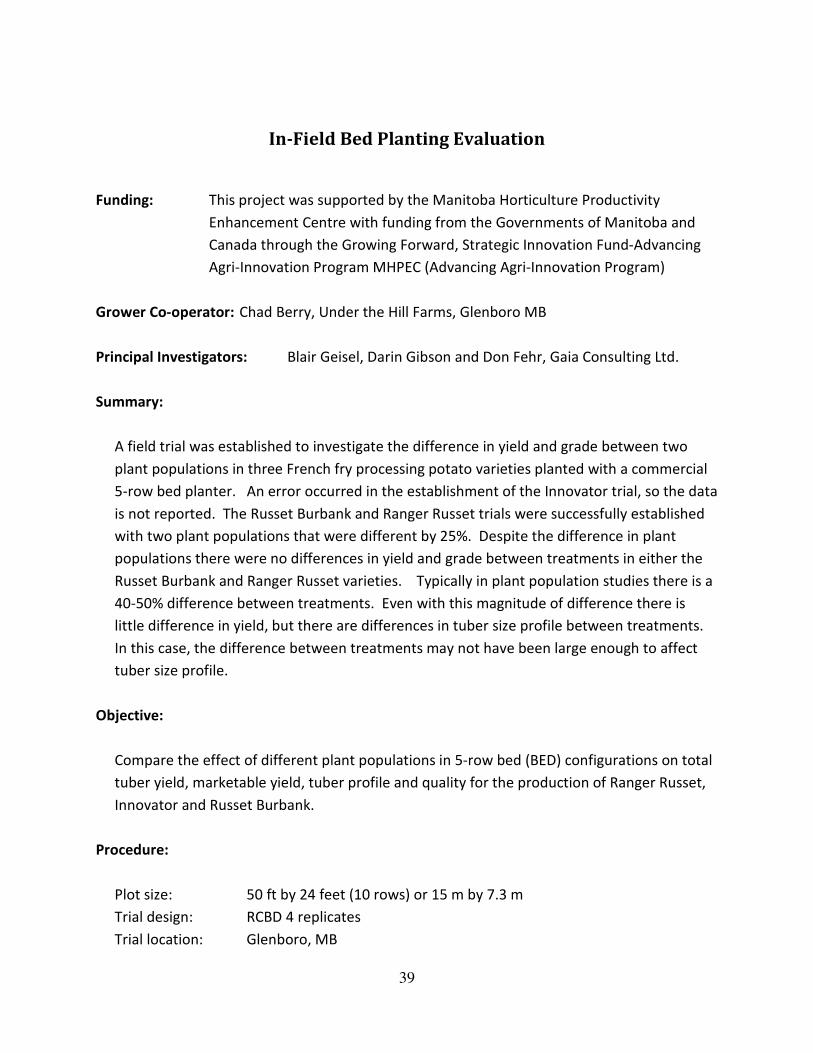
In-Field Bed Planting Evaluation
Funding: This project was supported by the Manitoba Horticulture Productivity
Enhancement Centre with funding from the Governments of Manitoba and
Canada through the Growing Forward, Strategic Innovation Fund-Advancing
Agri-Innovation Program MHPEC (Advancing Agri-Innovation Program)
Grower Co-operator: Chad Berry, Under the Hill Farms, Glenboro MB
Principal Investigators: Blair Geisel, Darin Gibson and Don Fehr, Gaia Consulting Ltd.
Summary:
A field trial was established to investigate the difference in yield and grade between two
plant populations in three French fry processing potato varieties planted with a commercial
5-row bed planter. An error occurred in the establishment of the Innovator trial, so the data
is not reported. The Russet Burbank and Ranger Russet trials were successfully established
with two plant populations that were different by 25%. Despite the difference in plant
populations there were no differences in yield and grade between treatments in either the
Russet Burbank and Ranger Russet varieties. Typically in plant population studies there is a
40-50% difference between treatments. Even with this magnitude of difference there is
little difference in yield, but there are differences in tuber size profile between treatments.
In this case, the difference between treatments may not have been large enough to affect
tuber size profile.
Objective:
Compare the effect of different plant populations in 5-row bed (BED) configurations on total
tuber yield, marketable yield, tuber profile and quality for the production of Ranger Russet,
Innovator and Russet Burbank.
Procedure:
Plot size: 50 ft by 24 feet (10 rows) or 15 m by 7.3 m
Trial design: RCBD 4 replicates
Trial location: Glenboro, MB
40
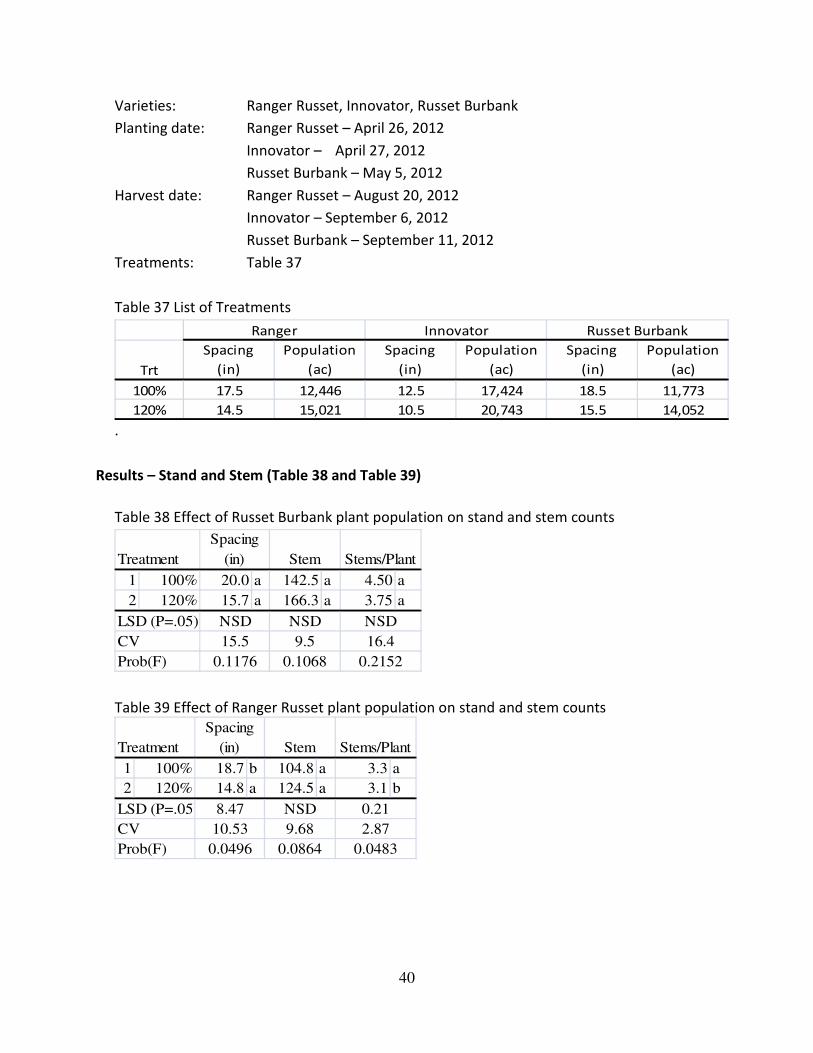
Varieties: Ranger Russet, Innovator, Russet Burbank
Planting date: Ranger Russet – April 26, 2012
Innovator – April 27, 2012
Russet Burbank – May 5, 2012
Harvest date: Ranger Russet – August 20, 2012
Innovator – September 6, 2012
Russet Burbank – September 11, 2012
Treatments: Table 37
Table 37 List of Treatments
Trt
Spacing
(in)
Population
(ac)
Spacing
(in)
Population
(ac)
Spacing
(in)
Population
(ac)
100% 17.5 12,446 12.5 17,424 18.5 11,773
120% 14.5 15,021 10.5 20,743 15.5 14,052
Ranger Innovator Russet Burbank
.
Results – Stand and Stem (Table 38 and Table 39)
Table 38 Effect of Russet Burbank plant population on stand and stem counts
1 100% 20.0 a 142.5 a 4.50 a
2 120% 15.7 a 166.3 a 3.75 a
Treatment
Spacing
(in) Stem Stems/Plant
CV 15.5 9.5 16.4
LSD (P=.05) NSD NSD NSD
Prob(F) 0.1176 0.1068 0.2152
Table 39 Effect of Ranger Russet plant population on stand and stem counts
1 100% 18.7 b 104.8 a 3.3 a
2 120% 14.8 a 124.5 a 3.1 b
0.21
2.87
0.0483
Stems/Plant
LSD (P=.05) 8.47 NSD
Treatment
Spacing
(in) Stem
Prob(F) 0.0496 0.0864
CV 10.53 9.68
41
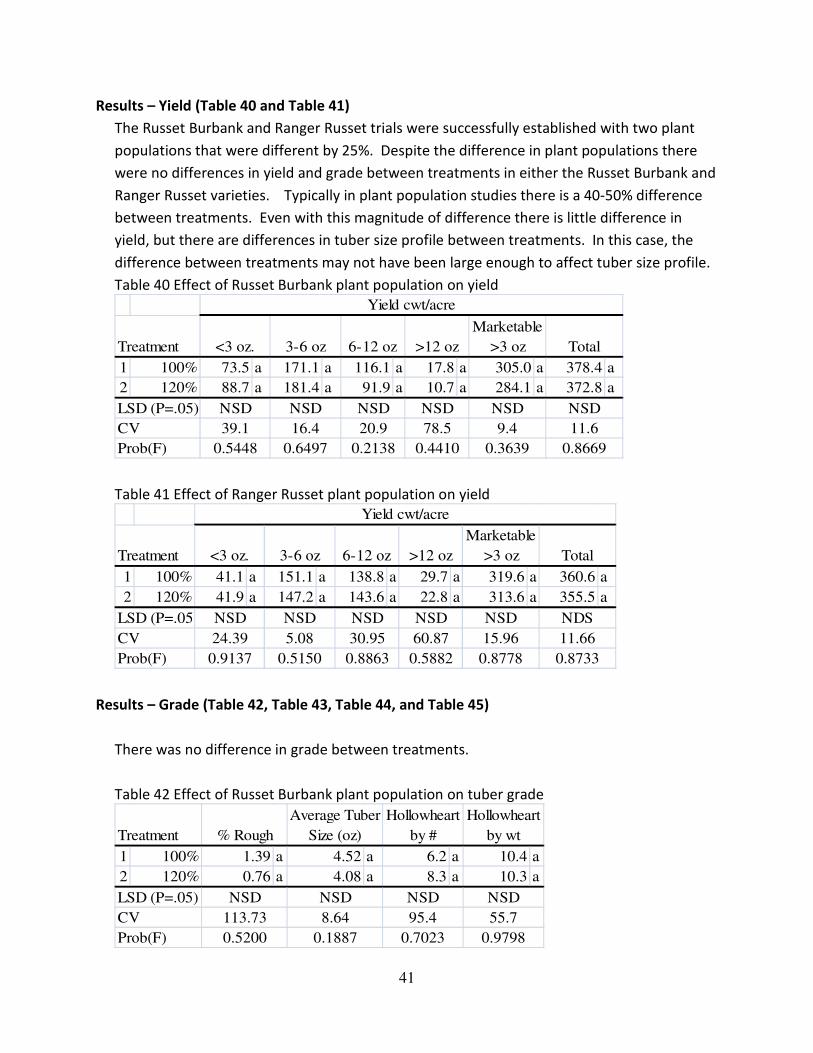
Results – Yield (Table 40 and Table 41)
The Russet Burbank and Ranger Russet trials were successfully established with two plant
populations that were different by 25%. Despite the difference in plant populations there
were no differences in yield and grade between treatments in either the Russet Burbank and
Ranger Russet varieties. Typically in plant population studies there is a 40-50% difference
between treatments. Even with this magnitude of difference there is little difference in
yield, but there are differences in tuber size profile between treatments. In this case, the
difference between treatments may not have been large enough to affect tuber size profile.
Table 40 Effect of Russet Burbank plant population on yield
1 100% 73.5 a 171.1 a 116.1 a 17.8 a 305.0 a 378.4 a
2 120% 88.7 a 181.4 a 91.9 a 10.7 a 284.1 a 372.8 a
Total Treatment
Yield cwt/acre
<3 oz. 3-6 oz 6-12 oz >12 oz
Marketable
>3 oz
NSDLSD (P=.05) NSD NSD NSD NSD NSD
20.9 78.5 9.4 11.6CV 39.1 16.4
0.8669Prob(F) 0.5448 0.6497 0.2138 0.4410 0.3639
Table 41 Effect of Ranger Russet plant population on yield
1 100% 41.1 a 151.1 a 138.8 a 29.7 a 319.6 a 360.6 a
2 120% 41.9 a 147.2 a 143.6 a 22.8 a 313.6 a 355.5 a
Yield cwt/acre
6-12 oz >12 oz
Marketable
>3 oz Total Treatment <3 oz. 3-6 oz
11.66CV
NSD NSD NSD NSD NDSLSD (P=.05) NSD
0.8733Prob(F) 0.9137
24.39 5.08 30.95 60.87 15.96
0.5150 0.8863 0.5882 0.8778
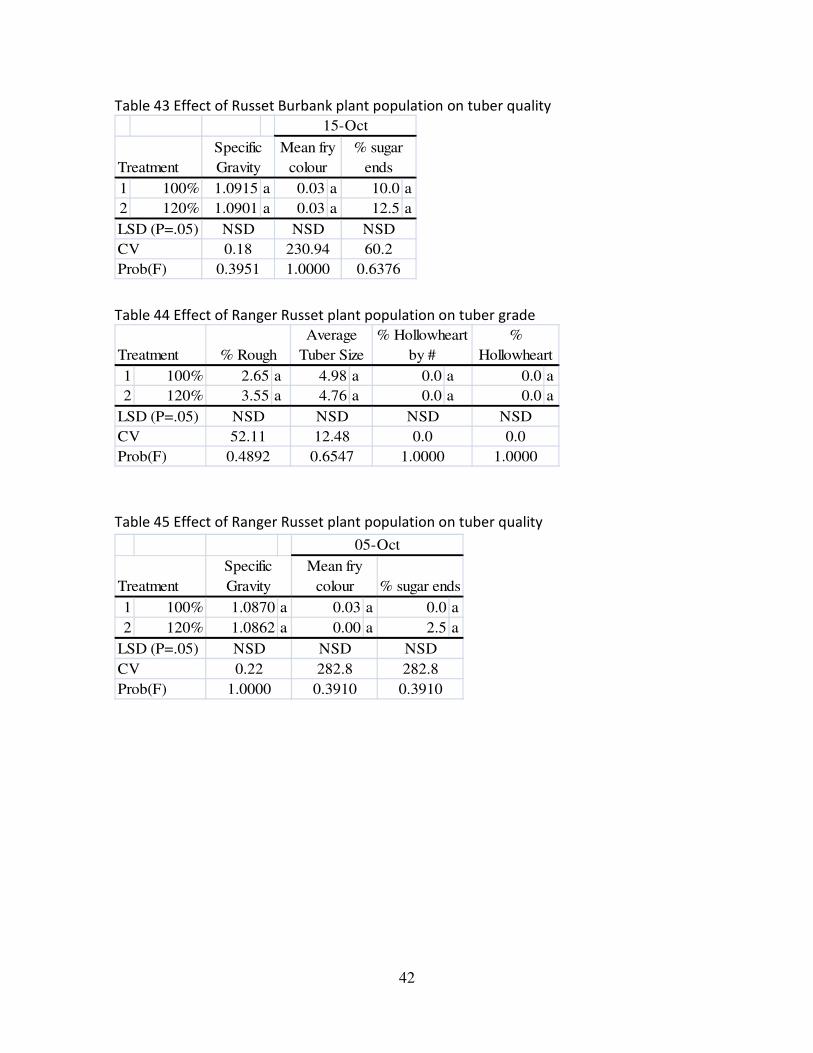
Results – Grade (Table 42, Table 43, Table 44, and Table 45)
There was no difference in grade between treatments.
Table 42 Effect of Russet Burbank plant population on tuber grade
1 100% 1.39 a 4.52 a 6.2 a 10.4 a
2 120% 0.76 a 4.08 a 8.3 a 10.3 a
Hollowheart
by #
Hollowheart
by wtTreatment
Average Tuber
Size (oz)% Rough
NSD NSD NSDLSD (P=.05) NSD
55.7CV 8.64113.73 95.4
0.5200 0.7023 0.9798Prob(F) 0.1887
42
Table 43 Effect of Russet Burbank plant population on tuber quality
1 100% 1.0915 a 0.03 a 10.0 a
2 120% 1.0901 a 0.03 a 12.5 a
Specific
Gravity
Mean fry
colour
% sugar
ends
15-Oct
Treatment
230.94 60.2CV 0.18
NSD NSD NSDLSD (P=.05)
0.3951 1.0000 0.6376Prob(F)
Table 44 Effect of Ranger Russet plant population on tuber grade
1 100% 2.65 a 4.98 a 0.0 a 0.0 a
2 120% 3.55 a 4.76 a 0.0 a 0.0 a
NSDLSD (P=.05) NSD
% Hollowheart
by #
%
Hollowheart Treatment
Average
Tuber Size % Rough
NSD NSD
0.0 0.0
1.0000 1.00000.4892Prob(F) 0.6547
12.4852.11CV
Table 45 Effect of Ranger Russet plant population on tuber quality
1 100% 1.0870 a 0.03 a 0.0 a
2 120% 1.0862 a 0.00 a 2.5 a
Specific
Gravity
Mean fry
colour % sugar ends
05-Oct
Treatment
0.22 282.8 282.8CV
NSD NSD NSDLSD (P=.05)
1.0000 0.3910 0.3910Prob(F)
43
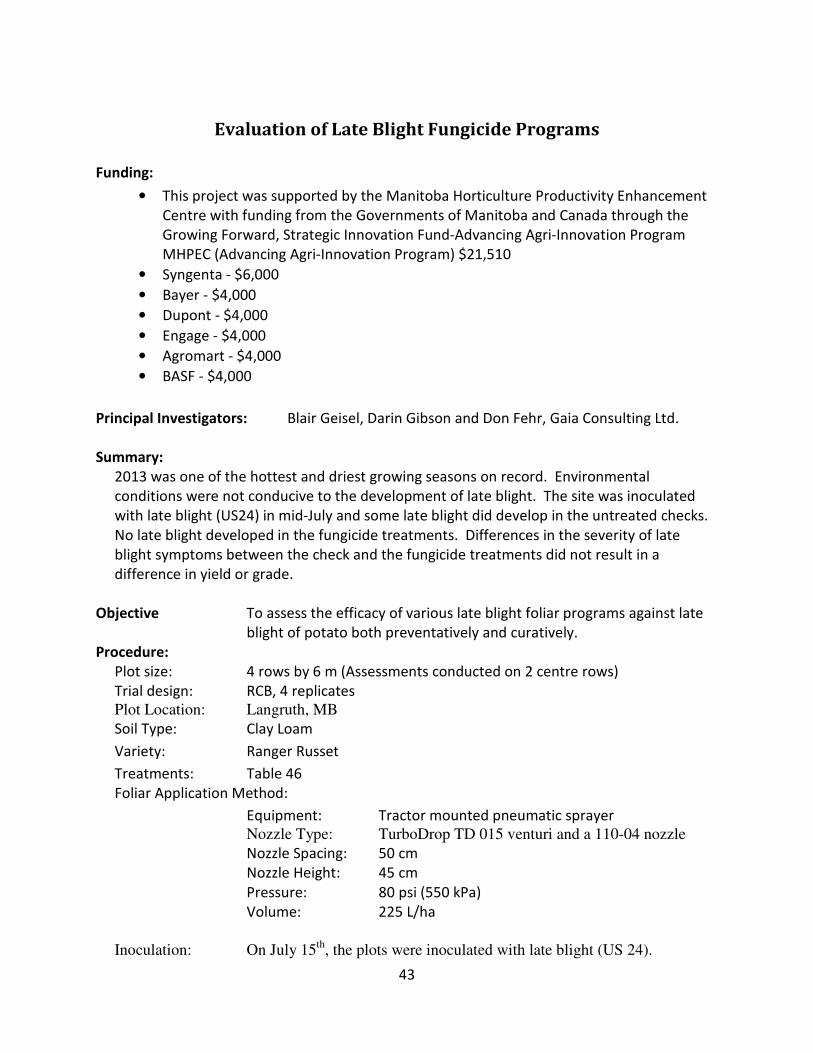
Evaluation of Late Blight Fungicide Programs
Funding:
• This project was supported by the Manitoba Horticulture Productivity Enhancement
Centre with funding from the Governments of Manitoba and Canada through the
Growing Forward, Strategic Innovation Fund-Advancing Agri-Innovation Program
MHPEC (Advancing Agri-Innovation Program) $21,510
• Syngenta - $6,000
• Bayer - $4,000
• Dupont - $4,000
• Engage - $4,000
• Agromart - $4,000
• BASF - $4,000
Principal Investigators: Blair Geisel, Darin Gibson and Don Fehr, Gaia Consulting Ltd.
Summary:
2013 was one of the hottest and driest growing seasons on record. Environmental
conditions were not conducive to the development of late blight. The site was inoculated
with late blight (US24) in mid-July and some late blight did develop in the untreated checks.
No late blight developed in the fungicide treatments. Differences in the severity of late
blight symptoms between the check and the fungicide treatments did not result in a
difference in yield or grade.
Objective To assess the efficacy of various late blight foliar programs against late
blight of potato both preventatively and curatively.
Procedure:
Plot size: 4 rows by 6 m (Assessments conducted on 2 centre rows)
Trial design: RCB, 4 replicates
Plot Location: Langruth, MB
Soil Type: Clay Loam
Variety: Ranger Russet
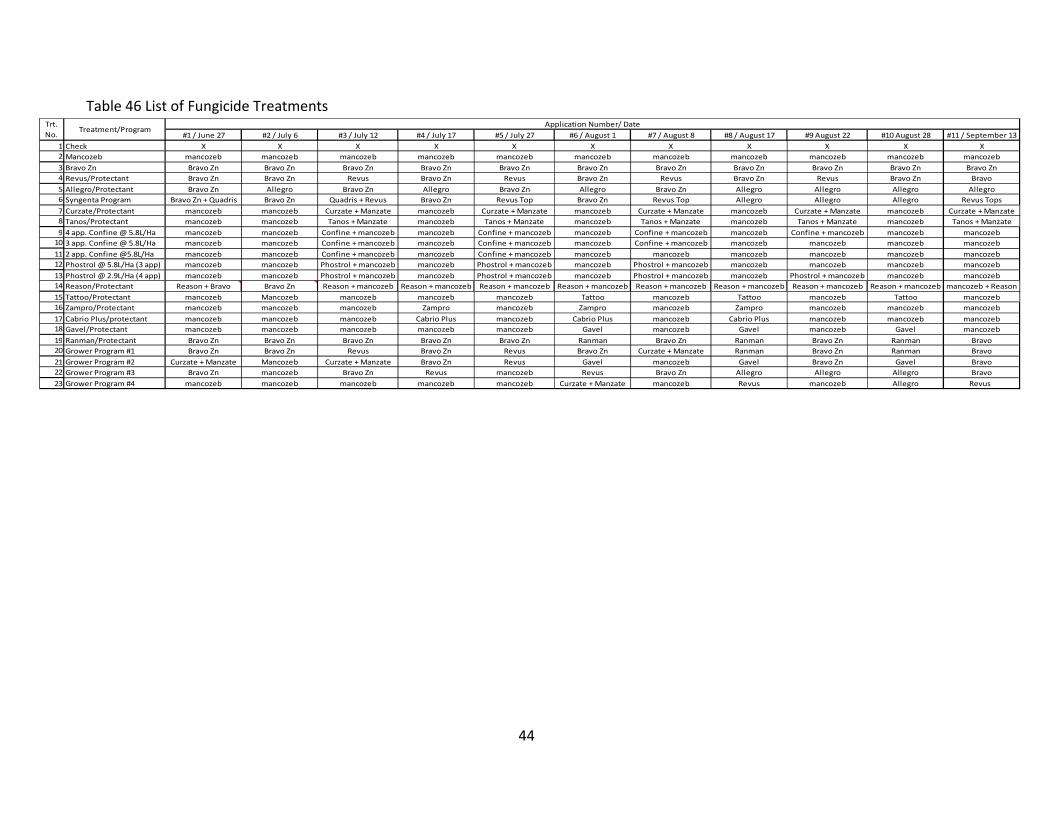
Treatments: Table 46
Foliar Application Method:
Equipment: Tractor mounted pneumatic sprayer
Nozzle Type: TurboDrop TD 015 venturi and a 110-04 nozzle
Nozzle Spacing: 50 cm
Nozzle Height: 45 cm
Pressure: 80 psi (550 kPa)
Volume: 225 L/ha
Inoculation: On July 15th
, the plots were inoculated with late blight (US 24).
44
Table 46 List of Fungicide Treatments
#1 / June 27 #2 / July 6 #3 / July 12 #4 / July 17 #5 / July 27 #6 / August 1 #7 / August 8 #8 / August 17 #9 August 22 #10 August 28 #11 / September 13
1 Check X X X X X X X X X X X
2 Mancozeb mancozeb mancozeb mancozeb mancozeb mancozeb mancozeb mancozeb mancozeb mancozeb mancozeb mancozeb
3 Bravo Zn Bravo Zn Bravo Zn Bravo Zn Bravo Zn Bravo Zn Bravo Zn Bravo Zn Bravo Zn Bravo Zn Bravo Zn Bravo Zn
4 Revus/Protectant Bravo Zn Bravo Zn Revus Bravo Zn Revus Bravo Zn Revus Bravo Zn Revus Bravo Zn Bravo
5 Allegro/Protectant Bravo Zn Allegro Bravo Zn Allegro Bravo Zn Allegro Bravo Zn Allegro Allegro Allegro Allegro
6 Syngenta Program Bravo Zn + Quadris Bravo Zn Quadris + Revus Bravo Zn Revus Top Bravo Zn Revus Top Allegro Allegro Allegro Revus Tops
7 Curzate/Protectant mancozeb mancozeb Curzate + Manzate mancozeb Curzate + Manzate mancozeb Curzate + Manzate mancozeb Curzate + Manzate mancozeb Curzate + Manzate
8 Tanos/Protectant mancozeb mancozeb Tanos + Manzate mancozeb Tanos + Manzate mancozeb Tanos + Manzate mancozeb Tanos + Manzate mancozeb Tanos + Manzate
9 4 app. Confine @ 5.8L/Ha mancozeb mancozeb Confine + mancozeb mancozeb Confine + mancozeb mancozeb Confine + mancozeb mancozeb Confine + mancozeb mancozeb mancozeb
10 3 app. Confine @ 5.8L/Ha mancozeb mancozeb Confine + mancozeb mancozeb Confine + mancozeb mancozeb Confine + mancozeb mancozeb mancozeb mancozeb mancozeb
11 2 app. Confine @5.8L/Ha mancozeb mancozeb Confine + mancozeb mancozeb Confine + mancozeb mancozeb mancozeb mancozeb mancozeb mancozeb mancozeb
12 Phostrol @ 5.8L/Ha (3 app) mancozeb mancozeb Phostrol + mancozeb mancozeb Phostrol + mancozeb mancozeb Phostrol + mancozeb mancozeb mancozeb mancozeb mancozeb
13 Phostrol @ 2.9L/Ha (4 app) mancozeb mancozeb Phostrol + mancozeb mancozeb Phostrol + mancozeb mancozeb Phostrol + mancozeb mancozeb Phostrol + mancozeb mancozeb mancozeb
14 Reason/Protectant Reason + Bravo Bravo Zn Reason + mancozeb Reason + mancozeb Reason + mancozeb Reason + mancozeb Reason + mancozeb Reason + mancozeb Reason + mancozeb Reason + mancozeb mancozeb + Reason
15 Tattoo/Protectant mancozeb Mancozeb mancozeb mancozeb mancozeb Tattoo mancozeb Tattoo mancozeb Tattoo mancozeb
16 Zampro/Protectant mancozeb mancozeb mancozeb Zampro mancozeb Zampro mancozeb Zampro mancozeb mancozeb mancozeb
17 Cabrio Plus/protectant mancozeb mancozeb mancozeb Cabrio Plus mancozeb Cabrio Plus mancozeb Cabrio Plus mancozeb mancozeb mancozeb
18 Gavel/Protectant mancozeb mancozeb mancozeb mancozeb mancozeb Gavel mancozeb Gavel mancozeb Gavel mancozeb
19 Ranman/Protectant Bravo Zn Bravo Zn Bravo Zn Bravo Zn Bravo Zn Ranman Bravo Zn Ranman Bravo Zn Ranman Bravo
20 Grower Program #1 Bravo Zn Bravo Zn Revus Bravo Zn Revus Bravo Zn Curzate + Manzate Ranman Bravo Zn Ranman Bravo
21 Grower Program #2 Curzate + Manzate Mancozeb Curzate + Manzate Bravo Zn Revus Gavel mancozeb Gavel Bravo Zn Gavel Bravo
22 Grower Program #3 Bravo Zn mancozeb Bravo Zn Revus mancozeb Revus Bravo Zn Allegro Allegro Allegro Bravo
23 Grower Program #4 mancozeb mancozeb mancozeb mancozeb mancozeb Curzate + Manzate mancozeb Revus mancozeb Allegro Revus
Treatment/ProgramTrt.
No.
Application Number/ Date
45
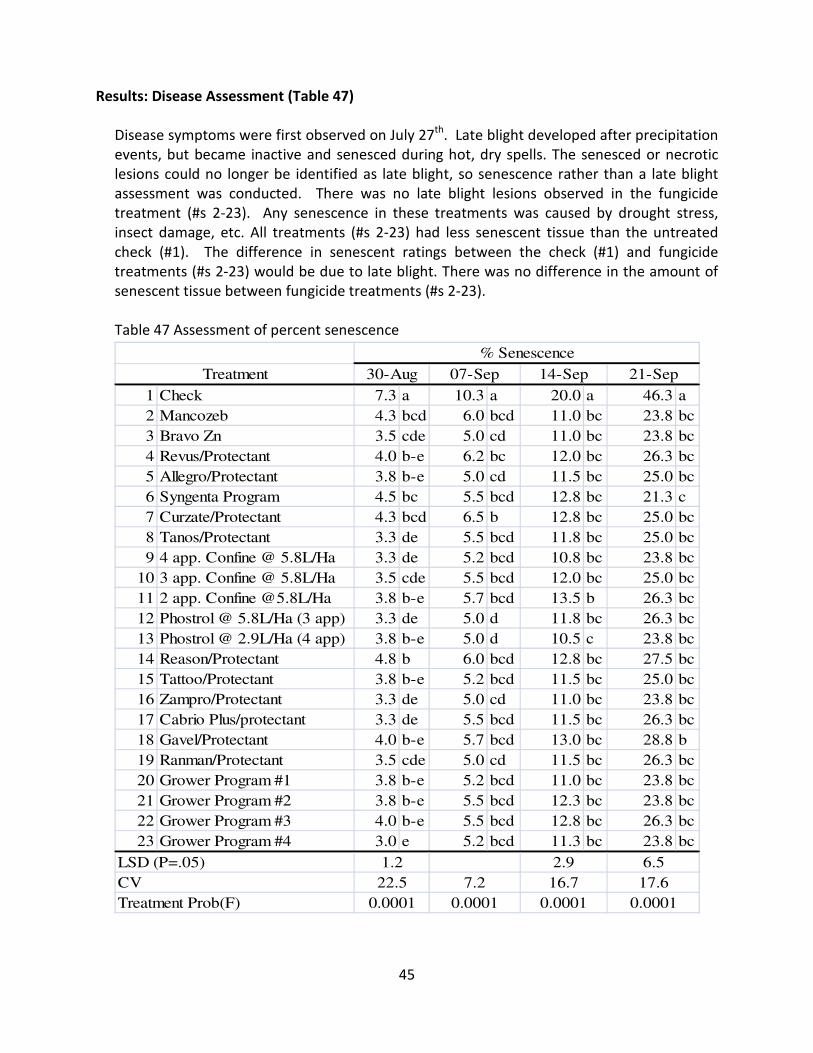
Results: Disease Assessment (Table 47)
Disease symptoms were first observed on July 27th. Late blight developed after precipitation
events, but became inactive and senesced during hot, dry spells. The senesced or necrotic
lesions could no longer be identified as late blight, so senescence rather than a late blight
assessment was conducted. There was no late blight lesions observed in the fungicide
treatment (#s 2-23). Any senescence in these treatments was caused by drought stress,
insect damage, etc. All treatments (#s 2-23) had less senescent tissue than the untreated
check (#1). The difference in senescent ratings between the check (#1) and fungicide
treatments (#s 2-23) would be due to late blight. There was no difference in the amount of
senescent tissue between fungicide treatments (#s 2-23).
Table 47 Assessment of percent senescence
1 Check 7.3 a 10.3 a 20.0 a 46.3 a
2 Mancozeb 4.3 bcd 6.0 bcd 11.0 bc 23.8 bc
3 Bravo Zn 3.5 cde 5.0 cd 11.0 bc 23.8 bc
4 Revus/Protectant 4.0 b-e 6.2 bc 12.0 bc 26.3 bc
5 Allegro/Protectant 3.8 b-e 5.0 cd 11.5 bc 25.0 bc
6 Syngenta Program 4.5 bc 5.5 bcd 12.8 bc 21.3 c
7 Curzate/Protectant 4.3 bcd 6.5 b 12.8 bc 25.0 bc
8 Tanos/Protectant 3.3 de 5.5 bcd 11.8 bc 25.0 bc
9 4 app. Confine @ 5.8L/Ha 3.3 de 5.2 bcd 10.8 bc 23.8 bc
10 3 app. Confine @ 5.8L/Ha 3.5 cde 5.5 bcd 12.0 bc 25.0 bc
11 2 app. Confine @5.8L/Ha 3.8 b-e 5.7 bcd 13.5 b 26.3 bc
12 Phostrol @ 5.8L/Ha (3 app) 3.3 de 5.0 d 11.8 bc 26.3 bc
13 Phostrol @ 2.9L/Ha (4 app) 3.8 b-e 5.0 d 10.5 c 23.8 bc
14 Reason/Protectant 4.8 b 6.0 bcd 12.8 bc 27.5 bc
15 Tattoo/Protectant 3.8 b-e 5.2 bcd 11.5 bc 25.0 bc
16 Zampro/Protectant 3.3 de 5.0 cd 11.0 bc 23.8 bc
17 Cabrio Plus/protectant 3.3 de 5.5 bcd 11.5 bc 26.3 bc
18 Gavel/Protectant 4.0 b-e 5.7 bcd 13.0 bc 28.8 b
19 Ranman/Protectant 3.5 cde 5.0 cd 11.5 bc 26.3 bc
20 Grower Program #1 3.8 b-e 5.2 bcd 11.0 bc 23.8 bc
21 Grower Program #2 3.8 b-e 5.5 bcd 12.3 bc 23.8 bc
22 Grower Program #3 4.0 b-e 5.5 bcd 12.8 bc 26.3 bc
23 Grower Program #4 3.0 e 5.2 bcd 11.3 bc 23.8 bc
16.7
Treatment 30-Aug 07-Sep 14-Sep
Treatment Prob(F) 0.0001
17.6
6.5
% Senescence
21-Sep
0.0001 0.0001 0.0001
LSD (P=.05) 1.2 2.9
CV 22.5 7.2
46
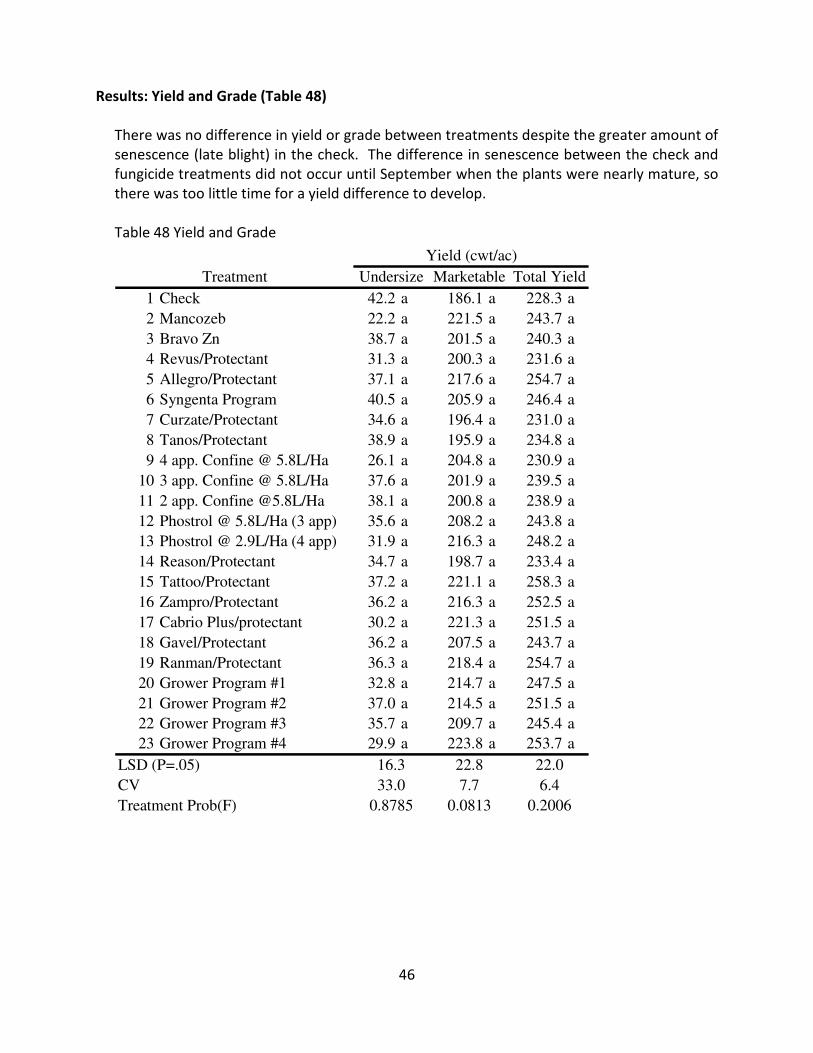
Results: Yield and Grade (Table 48)
There was no difference in yield or grade between treatments despite the greater amount of
senescence (late blight) in the check. The difference in senescence between the check and
fungicide treatments did not occur until September when the plants were nearly mature, so
there was too little time for a yield difference to develop.
Table 48 Yield and Grade
1 Check 42.2 a 186.1 a 228.3 a
2 Mancozeb 22.2 a 221.5 a 243.7 a
3 Bravo Zn 38.7 a 201.5 a 240.3 a
4 Revus/Protectant 31.3 a 200.3 a 231.6 a
5 Allegro/Protectant 37.1 a 217.6 a 254.7 a
6 Syngenta Program 40.5 a 205.9 a 246.4 a
7 Curzate/Protectant 34.6 a 196.4 a 231.0 a
8 Tanos/Protectant 38.9 a 195.9 a 234.8 a
9 4 app. Confine @ 5.8L/Ha 26.1 a 204.8 a 230.9 a
10 3 app. Confine @ 5.8L/Ha 37.6 a 201.9 a 239.5 a
11 2 app. Confine @5.8L/Ha 38.1 a 200.8 a 238.9 a
12 Phostrol @ 5.8L/Ha (3 app) 35.6 a 208.2 a 243.8 a
13 Phostrol @ 2.9L/Ha (4 app) 31.9 a 216.3 a 248.2 a
14 Reason/Protectant 34.7 a 198.7 a 233.4 a
15 Tattoo/Protectant 37.2 a 221.1 a 258.3 a
16 Zampro/Protectant 36.2 a 216.3 a 252.5 a
17 Cabrio Plus/protectant 30.2 a 221.3 a 251.5 a
18 Gavel/Protectant 36.2 a 207.5 a 243.7 a
19 Ranman/Protectant 36.3 a 218.4 a 254.7 a
20 Grower Program #1 32.8 a 214.7 a 247.5 a
21 Grower Program #2 37.0 a 214.5 a 251.5 a
22 Grower Program #3 35.7 a 209.7 a 245.4 a
23 Grower Program #4 29.9 a 223.8 a 253.7 a
Treatment Prob(F) 0.8785 0.0813 0.2006
LSD (P=.05) 16.3 22.8 22.0
CV 33.0 7.7 6.4
Yield (cwt/ac)
Treatment Undersize Marketable Total Yield
47
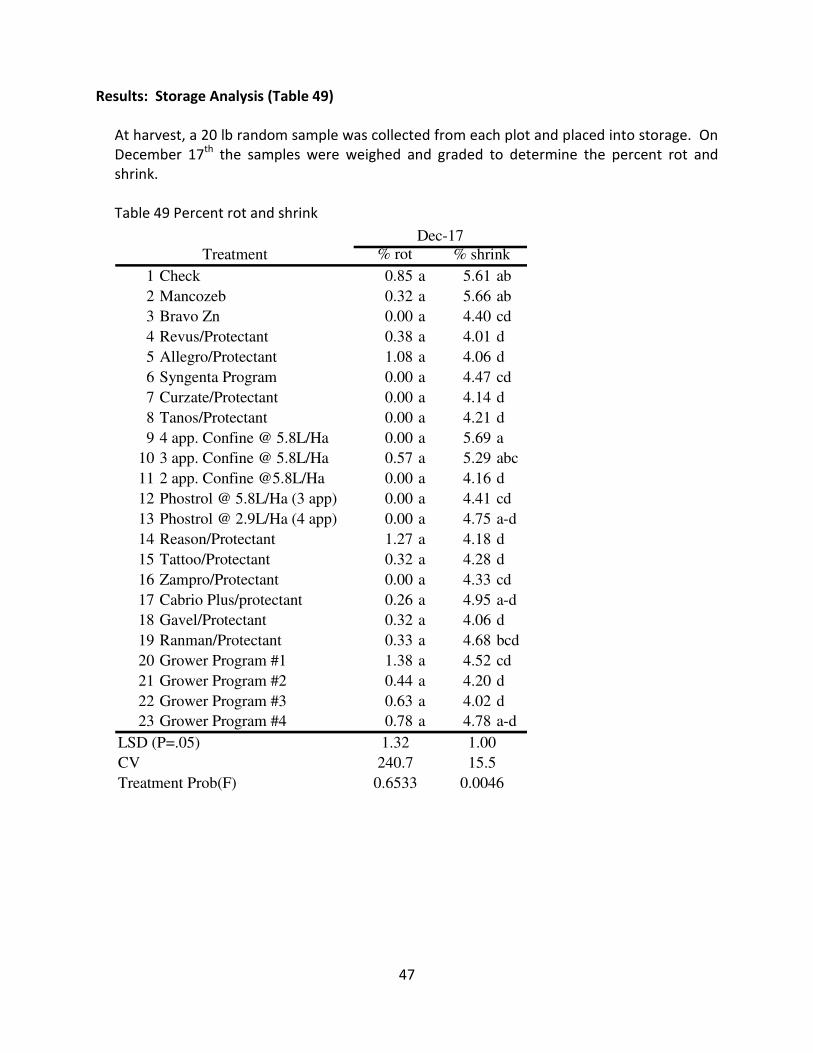
Results: Storage Analysis (Table 49)
At harvest, a 20 lb random sample was collected from each plot and placed into storage. On
December 17th the samples were weighed and graded to determine the percent rot and
shrink.
Table 49 Percent rot and shrink
1 Check 0.85 a 5.61 ab
2 Mancozeb 0.32 a 5.66 ab
3 Bravo Zn 0.00 a 4.40 cd
4 Revus/Protectant 0.38 a 4.01 d
5 Allegro/Protectant 1.08 a 4.06 d
6 Syngenta Program 0.00 a 4.47 cd
7 Curzate/Protectant 0.00 a 4.14 d
8 Tanos/Protectant 0.00 a 4.21 d
9 4 app. Confine @ 5.8L/Ha 0.00 a 5.69 a
10 3 app. Confine @ 5.8L/Ha 0.57 a 5.29 abc
11 2 app. Confine @5.8L/Ha 0.00 a 4.16 d
12 Phostrol @ 5.8L/Ha (3 app) 0.00 a 4.41 cd
13 Phostrol @ 2.9L/Ha (4 app) 0.00 a 4.75 a-d
14 Reason/Protectant 1.27 a 4.18 d
15 Tattoo/Protectant 0.32 a 4.28 d
16 Zampro/Protectant 0.00 a 4.33 cd
17 Cabrio Plus/protectant 0.26 a 4.95 a-d
18 Gavel/Protectant 0.32 a 4.06 d
19 Ranman/Protectant 0.33 a 4.68 bcd
20 Grower Program #1 1.38 a 4.52 cd
21 Grower Program #2 0.44 a 4.20 d
22 Grower Program #3 0.63 a 4.02 d
23 Grower Program #4 0.78 a 4.78 a-d
Treatment Prob(F) 0.6533 0.0046
LSD (P=.05) 1.32 1.00
CV 240.7 15.5
Treatment % rot % shrink
Dec-17
48
Starch Variety Evaluation for the Manitoba Potato Industry
Funding: Growing Forward
Progress: First Year
Principal Investigators: Blair Geisel, Darin Gibson and Don Fehr, Gaia Consulting Ltd.
Summary:
Potato production for starch extraction is a key segment of the potato market in Europe.
There, production is regulated by a quota system and almost 2 million tons of potato starch
can be produced each year from 250,000 hectares producing a harvest of around 10 million
tons of starch potatoes. Europe is the world leader for potato starch, accounting for 80%
of global production. The European potato starch industry consists of 14,000 farmers and
4000 employees in the starch industry. The key production regions are in Germany, the
Netherlands, France, Denmark, Poland and Sweden due to EU subsidies that support this
industry. In North America, potato starch is mainly extracted from surplus potatoes or
potato waste byproduct from French fry potato processing industry. Contracting potato
production specifically for starch production hasn’t been economically feasible in North
America as it is not possible to compete with the subsidized European starch production.
Phasing out of EU subsidies could change the economics of growing potatoes for starch. If
potatoes are to be contracted for starch production in Manitoba in the future, it will be
necessary to identify suitable varieties.
Objectives:
1. To identify varieties that might be suitable for starch production in Manitoba
2. Evaluate varieties under Manitoba conditions for production of starch.
3. Establish a seed nursery to localize potato varieties for future trials.
Procedure:
Plot size: 4 rows by 12 m (Assessments conducted on 2 centre rows)
Trial design: RCB 4 replicates
Plot location: Yield Trial: CMCDC Carberry Nursery: CMCDC Portage la Prairie
Crop: Potatoes
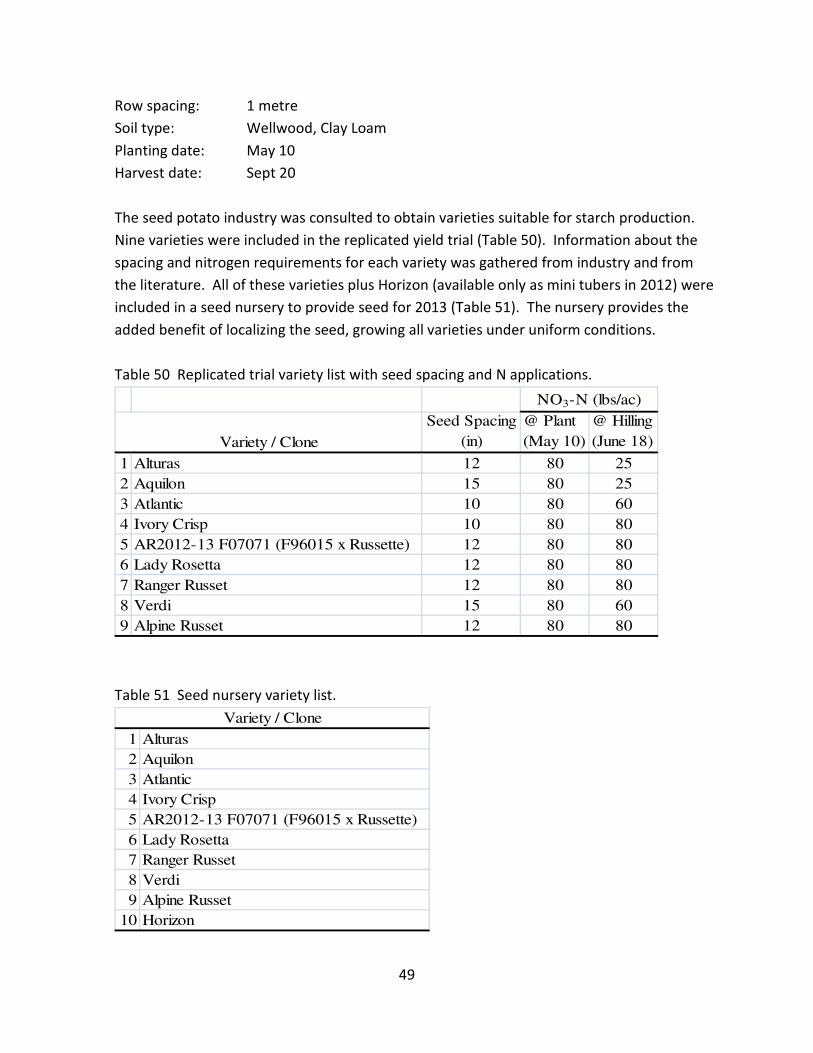
49
Row spacing: 1 metre
Soil type: Wellwood, Clay Loam
Planting date: May 10
Harvest date: Sept 20
The seed potato industry was consulted to obtain varieties suitable for starch production.
Nine varieties were included in the replicated yield trial (Table 50). Information about the
spacing and nitrogen requirements for each variety was gathered from industry and from
the literature. All of these varieties plus Horizon (available only as mini tubers in 2012) were
included in a seed nursery to provide seed for 2013 (Table 51). The nursery provides the
added benefit of localizing the seed, growing all varieties under uniform conditions.
Table 50 Replicated trial variety list with seed spacing and N applications.
Seed Spacing
(in)
@ Plant
(May 10)
@ Hilling
(June 18)
1 Alturas 12 80 25
2 Aquilon 15 80 25
3 Atlantic 10 80 60
4 Ivory Crisp 10 80 80
5 AR2012-13 F07071 (F96015 x Russette) 12 80 80
6 Lady Rosetta 12 80 80
7 Ranger Russet 12 80 80
8 Verdi 15 80 60
9 Alpine Russet 12 80 80
Variety / Clone
NO3-N (lbs/ac)
Table 51 Seed nursery variety list.
1 Alturas
2 Aquilon
3 Atlantic
4 Ivory Crisp
5 AR2012-13 F07071 (F96015 x Russette)
6 Lady Rosetta
7 Ranger Russet
8 Verdi
9 Alpine Russet
10 Horizon
Variety / Clone
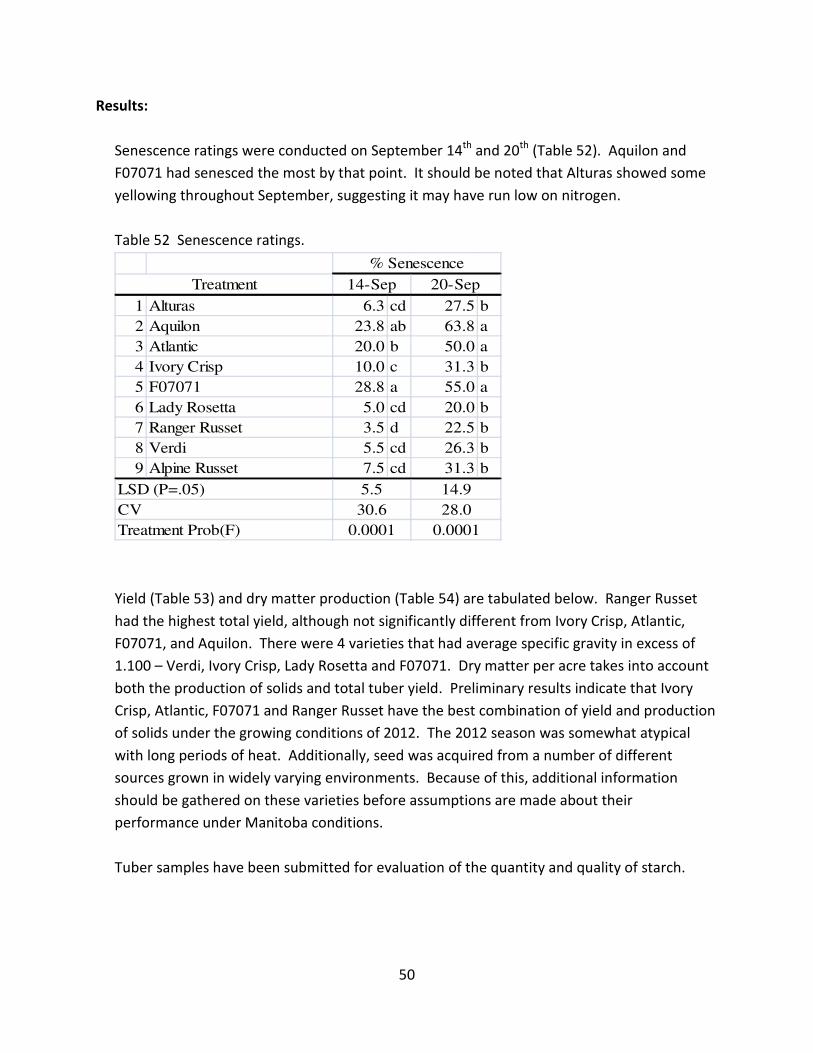
50
Results:
Senescence ratings were conducted on September 14th and 20th (Table 52). Aquilon and
F07071 had senesced the most by that point. It should be noted that Alturas showed some
yellowing throughout September, suggesting it may have run low on nitrogen.
Table 52 Senescence ratings.
1 Alturas 6.3 cd 27.5 b
2 Aquilon 23.8 ab 63.8 a
3 Atlantic 20.0 b 50.0 a
4 Ivory Crisp 10.0 c 31.3 b
5 F07071 28.8 a 55.0 a
6 Lady Rosetta 5.0 cd 20.0 b
7 Ranger Russet 3.5 d 22.5 b
8 Verdi 5.5 cd 26.3 b
9 Alpine Russet 7.5 cd 31.3 b
% Senescence
Treatment 14-Sep 20-Sep
Treatment Prob(F) 0.0001 0.0001
LSD (P=.05) 5.5 14.9
CV 30.6 28.0
Yield (Table 53) and dry matter production (Table 54) are tabulated below. Ranger Russet
had the highest total yield, although not significantly different from Ivory Crisp, Atlantic,
F07071, and Aquilon. There were 4 varieties that had average specific gravity in excess of
1.100 – Verdi, Ivory Crisp, Lady Rosetta and F07071. Dry matter per acre takes into account
both the production of solids and total tuber yield. Preliminary results indicate that Ivory
Crisp, Atlantic, F07071 and Ranger Russet have the best combination of yield and production
of solids under the growing conditions of 2012. The 2012 season was somewhat atypical
with long periods of heat. Additionally, seed was acquired from a number of different
sources grown in widely varying environments. Because of this, additional information
should be gathered on these varieties before assumptions are made about their
performance under Manitoba conditions.
Tuber samples have been submitted for evaluation of the quantity and quality of starch.
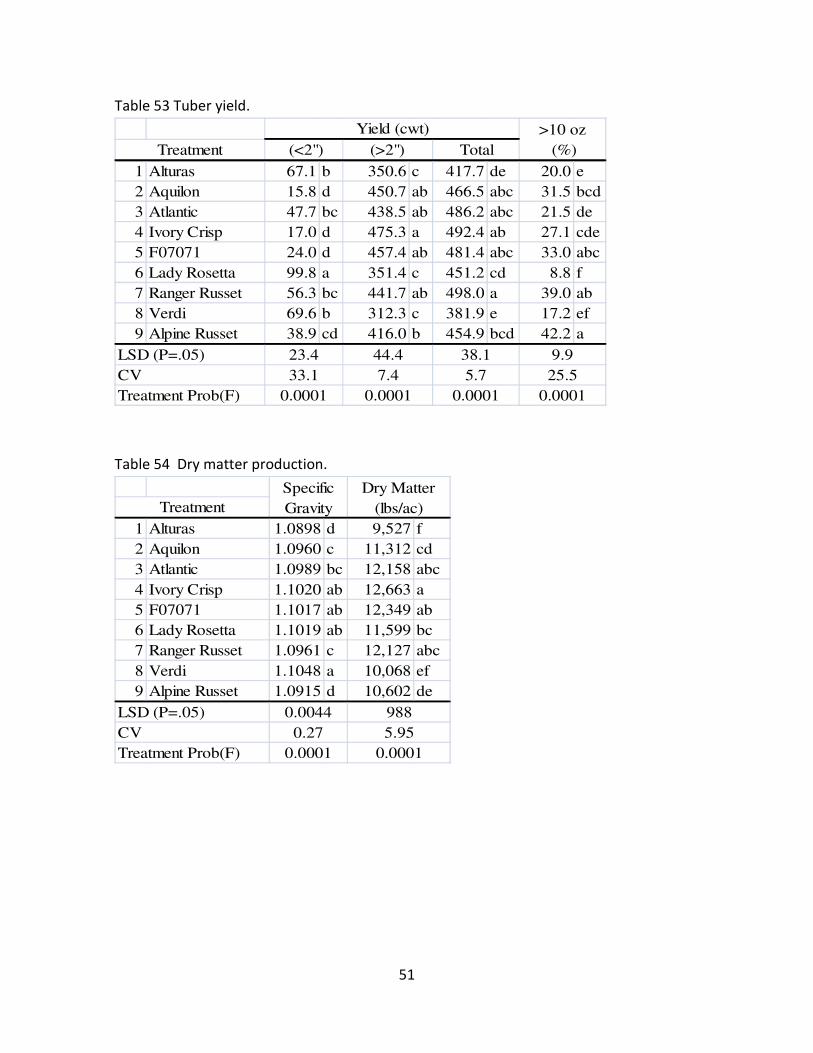
51
Table 53 Tuber yield.
1 Alturas 67.1 b 350.6 c 417.7 de 20.0 e
2 Aquilon 15.8 d 450.7 ab 466.5 abc 31.5 bcd
3 Atlantic 47.7 bc 438.5 ab 486.2 abc 21.5 de
4 Ivory Crisp 17.0 d 475.3 a 492.4 ab 27.1 cde
5 F07071 24.0 d 457.4 ab 481.4 abc 33.0 abc
6 Lady Rosetta 99.8 a 351.4 c 451.2 cd 8.8 f
7 Ranger Russet 56.3 bc 441.7 ab 498.0 a 39.0 ab
8 Verdi 69.6 b 312.3 c 381.9 e 17.2 ef
9 Alpine Russet 38.9 cd 416.0 b 454.9 bcd 42.2 a
>10 oz
(%)
CV 33.1 7.4 5.7 25.5
LSD (P=.05) 23.4 44.4 38.1 9.9
Yield (cwt)
Treatment (<2") (>2") Total
Treatment Prob(F) 0.0001 0.0001 0.0001 0.0001
Table 54 Dry matter production.
1 Alturas 1.0898 d 9,527 f
2 Aquilon 1.0960 c 11,312 cd
3 Atlantic 1.0989 bc 12,158 abc
4 Ivory Crisp 1.1020 ab 12,663 a
5 F07071 1.1017 ab 12,349 ab
6 Lady Rosetta 1.1019 ab 11,599 bc
7 Ranger Russet 1.0961 c 12,127 abc
8 Verdi 1.1048 a 10,068 ef
9 Alpine Russet 1.0915 d 10,602 de
Treatment
LSD (P=.05) 0.0044 988
Specific
Gravity
Dry Matter
(lbs/ac)
CV 0.27 5.95
Treatment Prob(F) 0.0001 0.0001
52
Effect of Fall Soil Preparation on Potato Yield and Grade 2010 - 2012
Funding: ARDI 50%
Keystone Vegetable Producers 16.6%
Simplot Canada 16.6%
McCain Foods 16.7%
In Kind: Under the Hill, Glenboro, MB
Spud Plains, Carberry, MB
Progress: Final Year
Principal Investigators: Blair Geisel, Darin Gibson and Donovan Fehr of Gaia Consulting
Ltd.
Summary:
Several Manitoba potato growers are subsoiling, shaping beds and forming reservoir pockets
(dikes) in the fall prior to a potato crop. The expectation is that these procedures will
improve the soil environment and increase yield. Raised beds are more exposed to the air
and sunlight and may warm up quicker in the spring allowing for earlier planting. Reservoir
pockets will capture snowmelt preventing runoff into lower areas of the field, which causes
saturated soils. This will allow the field to dry more quickly and also facilitate earlier tillage
and planting in the spring. Earlier planting provides a longer growing season with the
potential to produce greater yields. The use of sub-soil tillage is expected to reduce soil
compaction and improve water infiltration and root development. This will improve water
and nutrient uptake by the plant ultimately leading to greater yields.
Compacted soils occur when the stress (weight) on the soil from farm equipment exceeds
the ability of the soil to support that stress. The soil is "squeezed" into a smaller volume (i.e.
compacted) at the expense of the larger soil pores. The potential for traffic to cause soil
compaction is greatest when the soil moisture content is high because water acts as a
lubricant allowing soil particles to slide past each other as the soil is compressed.
There are three types of soil compaction. Shallow compaction is limited to the upper 10 cm
(4 inches) of soil. A second type of compaction is plow pan or tillage pan formation, in which
a dense layer forms just below the depth of normal tillage. The third type of compaction is
deep compaction in the wheel tracks of heavy farm equipment under wet soil conditions. If

53
the soil is dry, deep subsoil compaction is less likely, even with high axle loads. Shallow soil
compaction is of short duration since the soil will loosen as it undergoes wetting and drying,
freezing and thawing, or normal tillage. Tillage pan and deep compaction are of longer
duration and cannot be solved with normal tillage. Subsoil tillage or deep ripping to a depth
of 30-45 cm (12-18 inches) may be required to break up compacted layers.
The symptoms of soil compaction are excessive clod formation and slower water infiltration,
especially in wheel tracks. Potatoes are sensitive to the physical condition of the soil. Dense
or compacted soil interferes with root penetration as well as water and nutrient uptake. The
plant will display symptoms of stress resulting in lower yield and poor quality (malformed
tubers, sugar end defect). Compacted soil zones can be identified by carefully inspecting root
growth patterns and soil texture in a 3-foot (0.9 m) deep trench.
In the fall of 2009, 2010 and 2011, a Dammer Diker was used to perform subsoil tillage,
shape beds and form reservoir pockets. In 2010, 2011 and 2012, the effect of these
operations was evaluated on potato yield and quality. Soil temperature readings indicated
that fall bedding did not cause soil to warm faster in the spring than conventional tillage
methods. Penetrometer readings in July and August indicated that sub-soil tillage
significantly reduced soil density in the 0-12 inch profile in 3 of the 6 sites; however this
effect diminished over time due to tillage, traffic, precipitation and irrigation. There were no
differences in yield or grade between treatments at any of the sites.
Objective: Determine the effect of fall soil preparation on:
1. Soil temperature
2. Time of planting
3. Soil Moisture
4. Soil Compaction
5. Yield and Quality
Procedure:
Trial design: Strip trial - 4 replicates
Plot location: Cooperator fields in Carberry and Glenboro production areas
Variety: Russet Burbank
Treatments: Table 56
1) Unconventional fall tillage (subsoiled tillage and formation of hills and
reservoir pockets (dikes)).
2) Conventional tillage
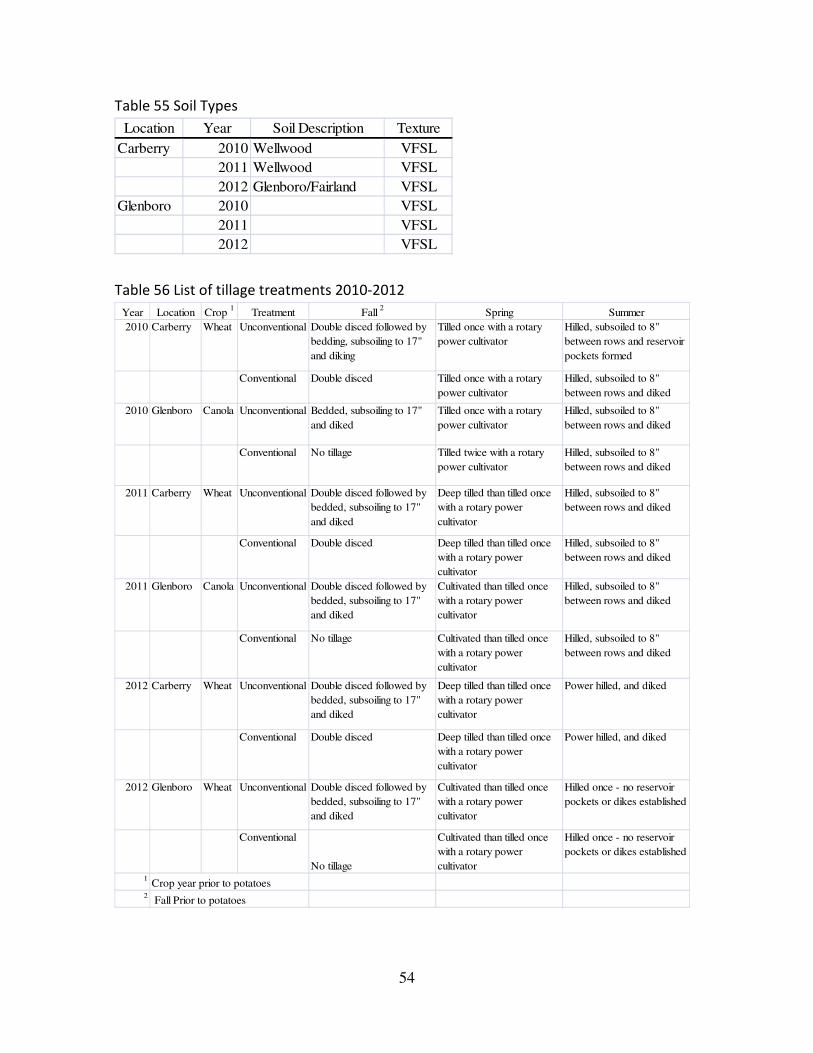
54
Table 55 Soil Types
Location Year Soil Description Texture
Carberry 2010 Wellwood VFSL
2011 Wellwood VFSL
2012 Glenboro/Fairland VFSL
Glenboro 2010 VFSL
2011 VFSL
2012 VFSL
Table 56 List of tillage treatments 2010-2012
Year Location Crop 1
Treatment Fall 2
Spring Summer
2010 Carberry Wheat Unconventional Double disced followed by
bedding, subsoiling to 17"
and diking
Tilled once with a rotary
power cultivator
Hilled, subsoiled to 8"
between rows and reservoir
pockets formed
Conventional Double disced Tilled once with a rotary
power cultivator
Hilled, subsoiled to 8"
between rows and diked
2010 Glenboro Canola Unconventional Bedded, subsoiling to 17"
and diked
Tilled once with a rotary
power cultivator
Hilled, subsoiled to 8"
between rows and diked
Conventional No tillage Tilled twice with a rotary
power cultivator
Hilled, subsoiled to 8"
between rows and diked
2011 Carberry Wheat Unconventional Double disced followed by
bedded, subsoiling to 17"
and diked
Deep tilled than tilled once
with a rotary power
cultivator
Hilled, subsoiled to 8"
between rows and diked
Conventional Double disced Deep tilled than tilled once
with a rotary power
cultivator
Hilled, subsoiled to 8"
between rows and diked
2011 Glenboro Canola Unconventional Double disced followed by
bedded, subsoiling to 17"
and diked
Cultivated than tilled once
with a rotary power
cultivator
Hilled, subsoiled to 8"
between rows and diked
Conventional No tillage Cultivated than tilled once
with a rotary power
cultivator
Hilled, subsoiled to 8"
between rows and diked
2012 Carberry Wheat Unconventional Double disced followed by
bedded, subsoiling to 17"
and diked
Deep tilled than tilled once
with a rotary power
cultivator
Power hilled, and diked
Conventional Double disced Deep tilled than tilled once
with a rotary power
cultivator
Power hilled, and diked
2012 Glenboro Wheat Unconventional Double disced followed by
bedded, subsoiling to 17"
and diked
Cultivated than tilled once
with a rotary power
cultivator
Hilled once - no reservoir
pockets or dikes established
Conventional
No tillage
Cultivated than tilled once
with a rotary power
cultivator
Hilled once - no reservoir
pockets or dikes established
1Crop year prior to potatoes
2 Fall Prior to potatoes
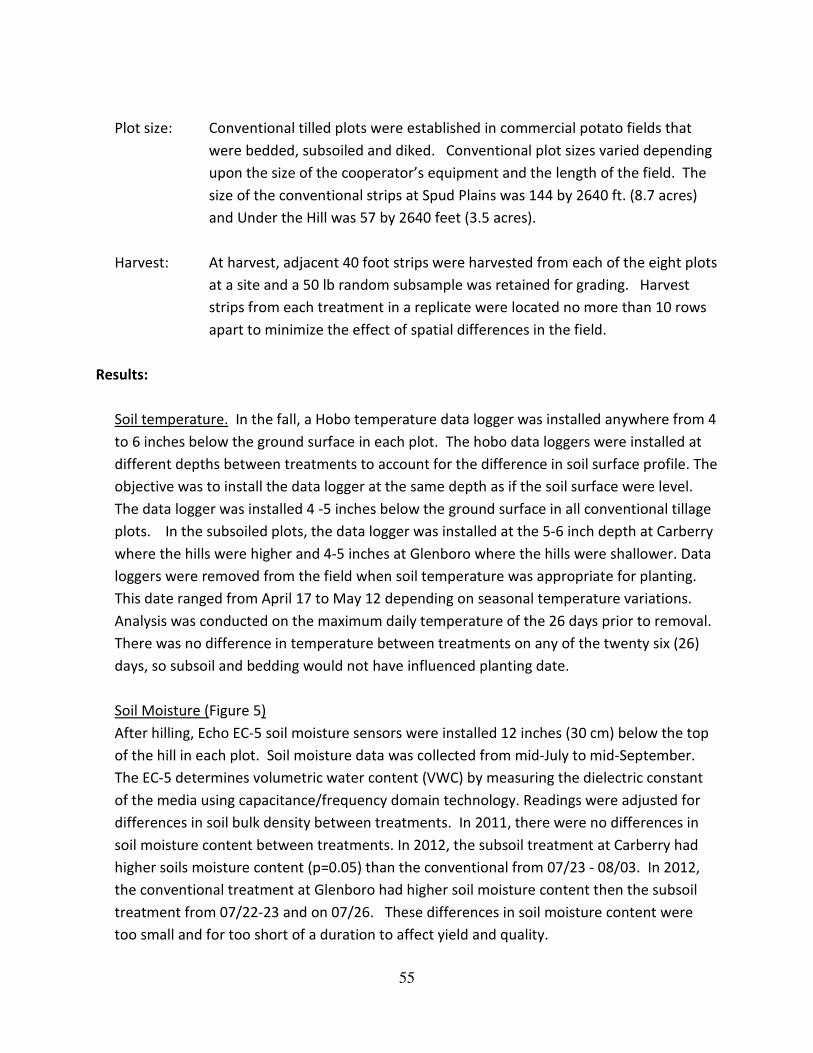
55
Plot size: Conventional tilled plots were established in commercial potato fields that
were bedded, subsoiled and diked. Conventional plot sizes varied depending
upon the size of the cooperator’s equipment and the length of the field. The
size of the conventional strips at Spud Plains was 144 by 2640 ft. (8.7 acres)
and Under the Hill was 57 by 2640 feet (3.5 acres).
Harvest: At harvest, adjacent 40 foot strips were harvested from each of the eight plots
at a site and a 50 lb random subsample was retained for grading. Harvest
strips from each treatment in a replicate were located no more than 10 rows
apart to minimize the effect of spatial differences in the field.
Results:
Soil temperature. In the fall, a Hobo temperature data logger was installed anywhere from 4
to 6 inches below the ground surface in each plot. The hobo data loggers were installed at
different depths between treatments to account for the difference in soil surface profile. The
objective was to install the data logger at the same depth as if the soil surface were level.
The data logger was installed 4 -5 inches below the ground surface in all conventional tillage
plots. In the subsoiled plots, the data logger was installed at the 5-6 inch depth at Carberry
where the hills were higher and 4-5 inches at Glenboro where the hills were shallower. Data
loggers were removed from the field when soil temperature was appropriate for planting.
This date ranged from April 17 to May 12 depending on seasonal temperature variations.
Analysis was conducted on the maximum daily temperature of the 26 days prior to removal.
There was no difference in temperature between treatments on any of the twenty six (26)
days, so subsoil and bedding would not have influenced planting date.
Soil Moisture (Figure 5)
After hilling, Echo EC-5 soil moisture sensors were installed 12 inches (30 cm) below the top
of the hill in each plot. Soil moisture data was collected from mid-July to mid-September.
The EC-5 determines volumetric water content (VWC) by measuring the dielectric constant
of the media using capacitance/frequency domain technology. Readings were adjusted for
differences in soil bulk density between treatments. In 2011, there were no differences in
soil moisture content between treatments. In 2012, the subsoil treatment at Carberry had
higher soils moisture content (p=0.05) than the conventional from 07/23 - 08/03. In 2012,
the conventional treatment at Glenboro had higher soil moisture content then the subsoil
treatment from 07/22-23 and on 07/26. These differences in soil moisture content were
too small and for too short of a duration to affect yield and quality.
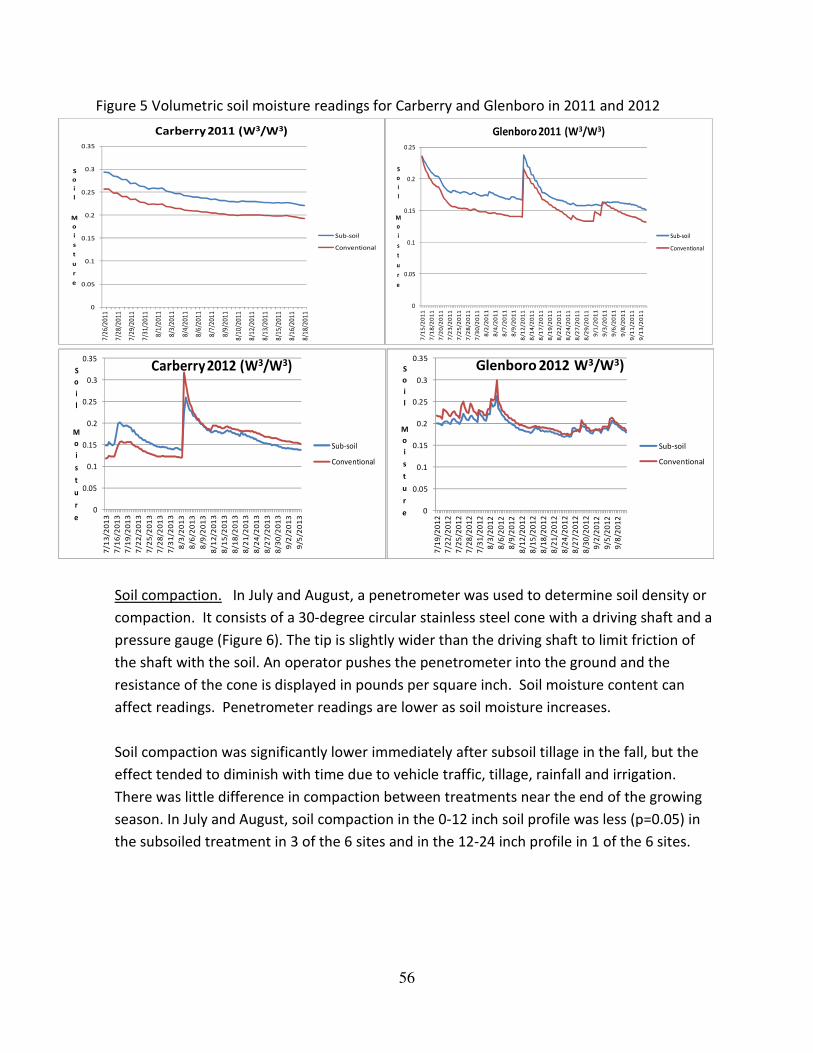
56
Figure 5 Volumetric soil moisture readings for Carberry and Glenboro in 2011 and 2012
0
0.05
0.1
0.15
0.2
0.25
0.3
0.35
7/2
6/2
01
1
7/2
8/2
01
1
7/2
9/2
01
1
7/3
1/2
01
1
8/1
/20
11
8/3
/20
11
8/4
/20
11
8/6
/20
11
8/7
/20
11
8/9
/20
11
8/1
0/2
01
1
8/1
2/2
01
1
8/1
3/2
01
1
8/1
5/2
01
1
8/1
6/2
01
1
8/1
8/2
01
1
S
o
i
l
M
o
i
s
t
u
r
e
Carberry 2011 (W3/W3)
Sub-soil
Conventional
0
0.05
0.1
0.15
0.2
0.25
7/1
5/2
01
1
7/1
8/2
01
1
7/2
0/2
01
1
7/2
3/2
01
1
7/2
5/2
01
1
7/2
8/2
01
1
7/3
0/2
01
1
8/2
/20
11
8/4
/20
11
8/7
/20
11
8/9
/20
11
8/1
2/2
01
1
8/1
4/2
01
1
8/1
7/2
01
1
8/1
9/2
01
1
8/2
2/2
01
1
8/2
4/2
01
1
8/2
7/2
01
1
8/2
9/2
01
1
9/1
/20
11
9/3
/20
11
9/6
/20
11
9/8
/20
11
9/1
1/2
01
1
9/1
3/2
01
1
S
o
i
l
M
o
i
s
t
u
r
e
Glenboro 2011 (W3/W3)
Sub-soil
Conventional
0
0.05
0.1
0.15
0.2
0.25
0.3
0.35
7/1
3/2
01
3
7/1
6/2
01
3
7/1
9/2
01
3
7/2
2/2
01
3
7/2
5/2
01
3
7/2
8/2
01
3
7/3
1/2
01
3
8/3
/20
13
8/6
/20
13
8/9
/20
13
8/1
2/2
01
3
8/1
5/2
01
3
8/1
8/2
01
3
8/2
1/2
01
3
8/2
4/2
01
3
8/2
7/2
01
3
8/3
0/2
01
3
9/2
/20
13
9/5
/20
13
S
o
i
l
M
o
i
s
t
u
r
e
Carberry 2012 (W3/W3)
Sub-soil
Conventional
0
0.05
0.1
0.15
0.2
0.25
0.3
0.35
7/1
9/2
01
2
7/2
2/2
01
2
7/2
5/2
01
2
7/2
8/2
01
2
7/3
1/2
01
2
8/3
/20
12
8/6
/20
12
8/9
/20
12
8/1
2/2
01
2
8/1
5/2
01
2
8/1
8/2
01
2
8/2
1/2
01
2
8/2
4/2
01
2
8/2
7/2
01
2
8/3
0/2
01
2
9/2
/20
12
9/5
/20
12
9/8
/20
12
S
o
i
l
M
o
i
s
t
u
r
e
Glenboro 2012 W3/W3)
Sub-soil
Conventional
Soil compaction. In July and August, a penetrometer was used to determine soil density or
compaction. It consists of a 30-degree circular stainless steel cone with a driving shaft and a
pressure gauge (Figure 6). The tip is slightly wider than the driving shaft to limit friction of
the shaft with the soil. An operator pushes the penetrometer into the ground and the
resistance of the cone is displayed in pounds per square inch. Soil moisture content can
affect readings. Penetrometer readings are lower as soil moisture increases.
Soil compaction was significantly lower immediately after subsoil tillage in the fall, but the
effect tended to diminish with time due to vehicle traffic, tillage, rainfall and irrigation.
There was little difference in compaction between treatments near the end of the growing
season. In July and August, soil compaction in the 0-12 inch soil profile was less (p=0.05) in
the subsoiled treatment in 3 of the 6 sites and in the 12-24 inch profile in 1 of the 6 sites.
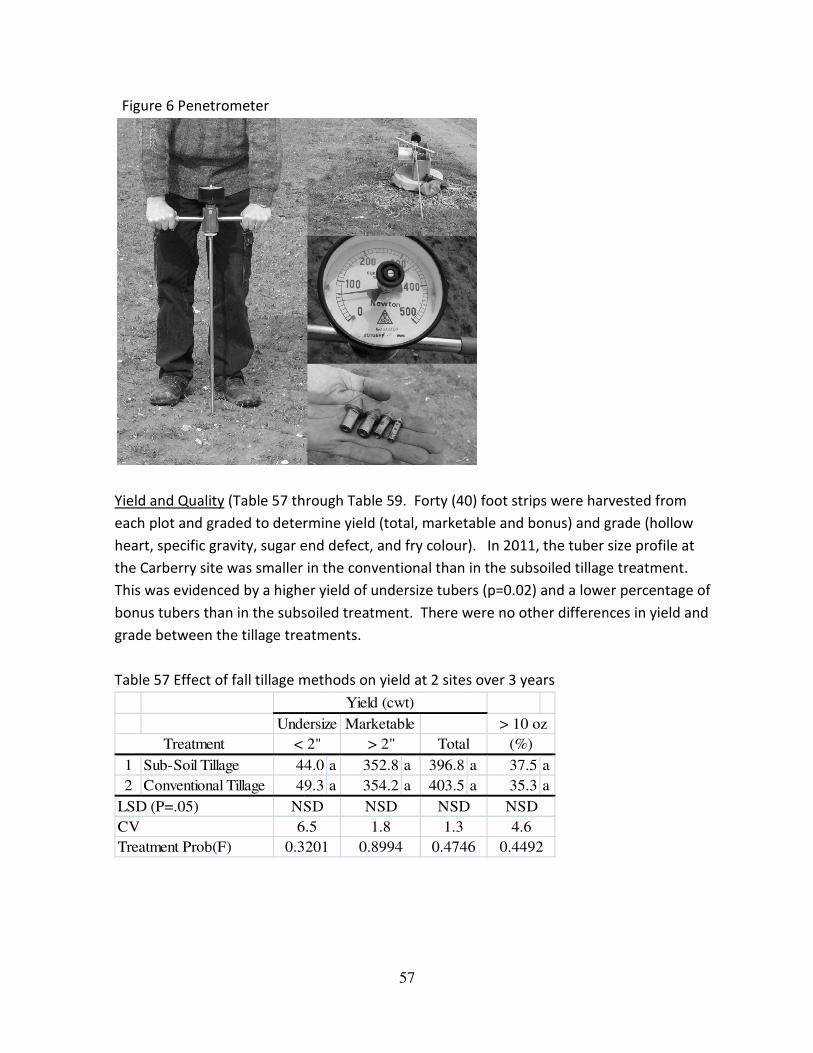
Figure 6 Penetrometer
Yield and Quality (Table 57 through
each plot and graded to determine yield (total, marketable and bonus) and grade (hollow
heart, specific gravity, sugar end defect, and fry colour). In 2011, the tuber size profile at
the Carberry site was smaller in the conventional than in the subsoiled tillage treatment.
This was evidenced by a higher yield of undersize tubers (p=0.02) and a lower percentage of
bonus tubers than in the subsoiled treatment. There were no other differences in yield and
grade between the tillage treatments.
Table 57 Effect of fall tillage methods on yield
1 Sub-Soil Tillage 44.0
2 Conventional Tillage 49.3
Treatment < 2"
Undersize
CV 6.5
LSD (P=.05) NSD
Treatment Prob(F) 0.3201
57
through Table 59. Forty (40) foot strips were harvested from
determine yield (total, marketable and bonus) and grade (hollow
heart, specific gravity, sugar end defect, and fry colour). In 2011, the tuber size profile at
the Carberry site was smaller in the conventional than in the subsoiled tillage treatment.
s was evidenced by a higher yield of undersize tubers (p=0.02) and a lower percentage of
bonus tubers than in the subsoiled treatment. There were no other differences in yield and
grade between the tillage treatments.
ect of fall tillage methods on yield at 2 sites over 3 years
44.0 a 352.8 a 396.8 a 37.5 a
49.3 a 354.2 a 403.5 a 35.3 a
< 2" > 2" Total (%)
Yield (cwt)
Undersize Marketable > 10 oz
6.5 1.8 1.3 4.6
NSD NSD NSD NSD
0.3201 0.8994 0.4746 0.4492
. Forty (40) foot strips were harvested from
determine yield (total, marketable and bonus) and grade (hollow
heart, specific gravity, sugar end defect, and fry colour). In 2011, the tuber size profile at
the Carberry site was smaller in the conventional than in the subsoiled tillage treatment.
s was evidenced by a higher yield of undersize tubers (p=0.02) and a lower percentage of
bonus tubers than in the subsoiled treatment. There were no other differences in yield and
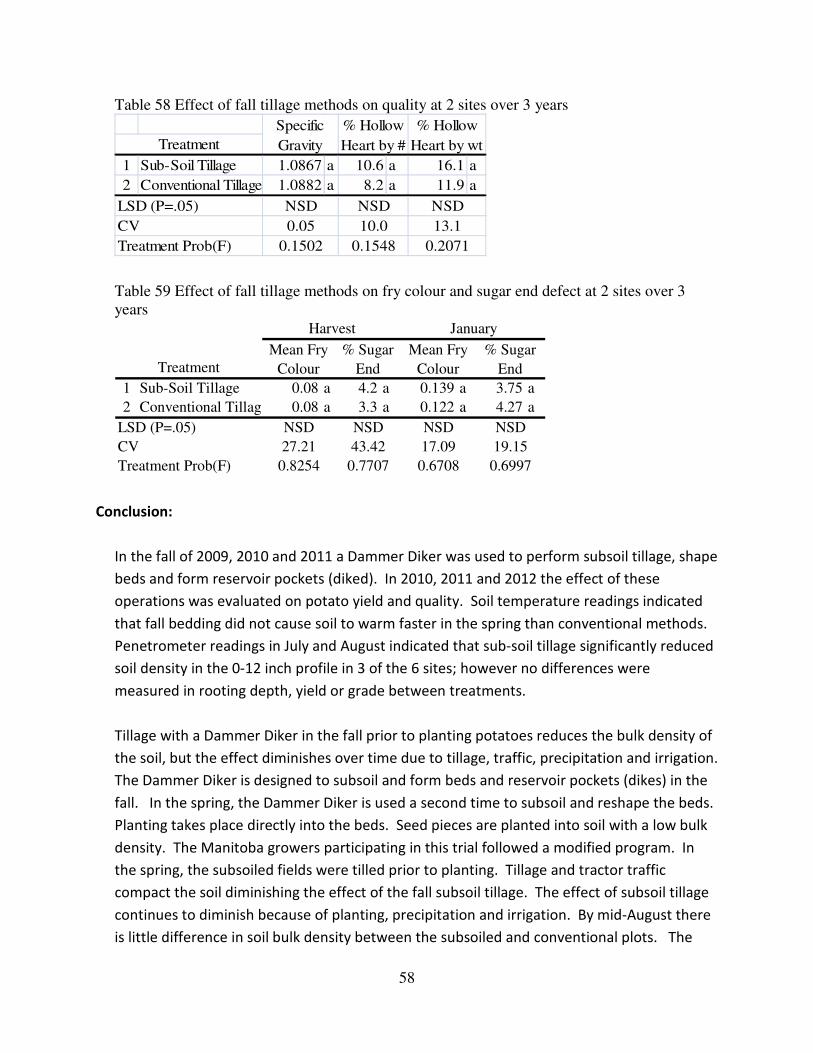
58
Table 58 Effect of fall tillage methods on quality at 2 sites over 3 years
1 Sub-Soil Tillage 1.0867 a 10.6 a 16.1 a
2 Conventional Tillage 1.0882 a 8.2 a 11.9 a
Specific
Gravity
% Hollow
Heart by #
% Hollow
Heart by wtTreatment
LSD (P=.05) NSD NSD NSD
CV 0.05 10.0 13.1
Treatment Prob(F) 0.1502 0.1548 0.2071
Table 59 Effect of fall tillage methods on fry colour and sugar end defect at 2 sites over 3
years
1 Sub-Soil Tillage 0.08 a 4.2 a 0.139 a 3.75 a
2 Conventional Tillage 0.08 a 3.3 a 0.122 a 4.27 a
Treatment
LSD (P=.05) NSD NSD NSD
CV 27.21 43.42 17.09
Treatment Prob(F) 0.8254 0.7707 0.6708
% Sugar
End
Harvest January
Mean Fry
Colour
% Sugar
End
Mean Fry
Colour
NSD
19.15
0.6997
Conclusion:
In the fall of 2009, 2010 and 2011 a Dammer Diker was used to perform subsoil tillage, shape
beds and form reservoir pockets (diked). In 2010, 2011 and 2012 the effect of these
operations was evaluated on potato yield and quality. Soil temperature readings indicated
that fall bedding did not cause soil to warm faster in the spring than conventional methods.
Penetrometer readings in July and August indicated that sub-soil tillage significantly reduced
soil density in the 0-12 inch profile in 3 of the 6 sites; however no differences were
measured in rooting depth, yield or grade between treatments.
Tillage with a Dammer Diker in the fall prior to planting potatoes reduces the bulk density of
the soil, but the effect diminishes over time due to tillage, traffic, precipitation and irrigation.
The Dammer Diker is designed to subsoil and form beds and reservoir pockets (dikes) in the
fall. In the spring, the Dammer Diker is used a second time to subsoil and reshape the beds.
Planting takes place directly into the beds. Seed pieces are planted into soil with a low bulk
density. The Manitoba growers participating in this trial followed a modified program. In
the spring, the subsoiled fields were tilled prior to planting. Tillage and tractor traffic
compact the soil diminishing the effect of the fall subsoil tillage. The effect of subsoil tillage
continues to diminish because of planting, precipitation and irrigation. By mid-August there
is little difference in soil bulk density between the subsoiled and conventional plots. The

59
effect of subsoil tillage on yield may be greater if the Dammer Diker system was followed,
which maximizes the effect of subsoil tillage ensuring the lowest bulk density at the time of
planting.
60
Effect of Reservoir Tillage on Potato Yield and Grade
Funding: ARDI 50%
Keystone Vegetable Producers 16.6%
Simplot Canada 16.6%
McCain Foods 16.7%
In Kind: Spud Plains Farms
Under the Hill
Hasket Farms
Progress: Third and final year
Principal Investigators: Blair Geisel, Darin Gibson and Donovan Fehr of Gaia Consulting
Ltd.
Summary
There are 60,000 acres of irrigated potatoes in Manitoba. Runoff from precipitation or
irrigation can be a problem in many of these irrigated fields with significant slope and fine
textured soils.
The rate at which a soil can absorb or take in water is called the infiltration rate. The rate at
which rainfall occurs or a sprinkler system applies water is called the application rate. If the
application rate is higher than the soil’s infiltration rate, some of the water will collect on the
surface, creating a potential for runoff. If there is a path downhill, the water will not stand,
but will form runoff stream carrying water away from where it was applied. Although the
stream may not leave the field boundary, it can create a problem since the water no longer
will be where it can effectively provide crop water needs. Runoff water is wasted water. It
also wastes energy, wastes topsoil, and can be a pollutant by carrying off sediments,
fertilizer, and pesticides. Ultimately yield and quality is lost. Runoff causes high knolls and
slopes to suffer drought conditions and for depressions to become saturated. Both
conditions cause crop stress and yield loss. In addition, water trapped in field depressions
seeps through the soil and leaches nitrogen into the ground water.
Soil texture, soil structure, and slope have the largest impact on infiltration rate. Water
moves by gravity into the open pore spaces in the soil, and the size of the soil particles and
their spacing determines how much water can flow in. Wide pore spacing at the soil surface
61
increases the rate of water infiltration, so coarse soils have a higher infiltration rate than fine
soils. Considerable runoff can occur where there is significant slope combined with a fine
texture soil.
There are several strategies for controlling runoff. Reduce the application rate of irrigation
equipment, use tillage methods that leave crop residue on the soil surface, which shields the
soil from water droplets or perform reservoir tillage, which alters the soil surface so that the
infiltration rate is increased and excess water is retained giving more time for infiltration.
Reservoir tillage consists of a sub-soil or ripper shank pulled at a depth of about 8 inches,
followed by a paddle wheel which penetrates to the depth of the shank, forming pits
(reservoirs) with small dikes between the pits (Figure 7). The reservoirs trap water allowing
it to infiltrate into the soil thus preventing runoff down slopes into field depressions. A five
year Idaho study demonstrated that the percent runoff from conventional tillage was 14%
compared to only 4% for reservoir tillage. Reservoir tillage increased yield by an average of
15%.
A three year (five site years) study commenced in 2010 comparing reservoir tillage to
conventional tillage practices in Manitoba. In 2010, two sites were established. Reservoir
tillage was observed to prevent runoff into field depressions. In 2011 only one site was
established due to excessive precipitation in early summer. In 2010 and 2011 it was
observed that by mid-season rainfall and irrigation eroded the reservoirs on slopes rendering
them ineffective in preventing runoff. Erosion was most pronounced on the steeper slopes
composed of coarse sand. It is not practical to reestablish the depressions because the
operation would damage the foliage and root system of the crop. In 2012, two sites were
established on fields with less slope than previous sites. These sites received below average
amounts of rainfall throughout the growing season. The reservoir pockets were still present
at harvest in September. In all 5 station years there was no difference in yield and quality
between treatments, with the exception of lower specific gravity in the reservoir tillage
treatment at the 2010 Carberry site.
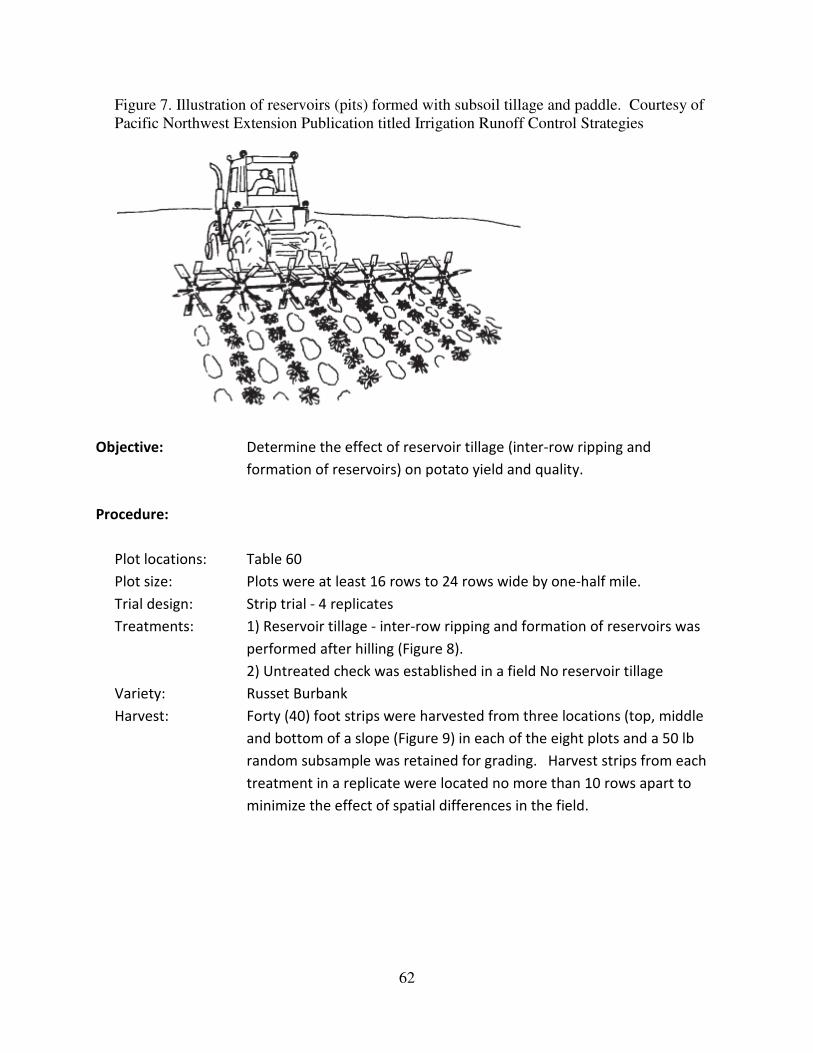
62
Figure 7. Illustration of reservoirs (pits) formed with subsoil tillage and paddle. Courtesy of
Pacific Northwest Extension Publication titled Irrigation Runoff Control Strategies
Objective: Determine the effect of reservoir tillage (inter-row ripping and
formation of reservoirs) on potato yield and quality.
Procedure:
Plot locations: Table 60
Plot size: Plots were at least 16 rows to 24 rows wide by one-half mile.
Trial design: Strip trial - 4 replicates
Treatments: 1) Reservoir tillage - inter-row ripping and formation of reservoirs was
performed after hilling (Figure 8).
2) Untreated check was established in a field No reservoir tillage
Variety: Russet Burbank
Harvest: Forty (40) foot strips were harvested from three locations (top, middle
and bottom of a slope (Figure 9) in each of the eight plots and a 50 lb
random subsample was retained for grading. Harvest strips from each
treatment in a replicate were located no more than 10 rows apart to
minimize the effect of spatial differences in the field.
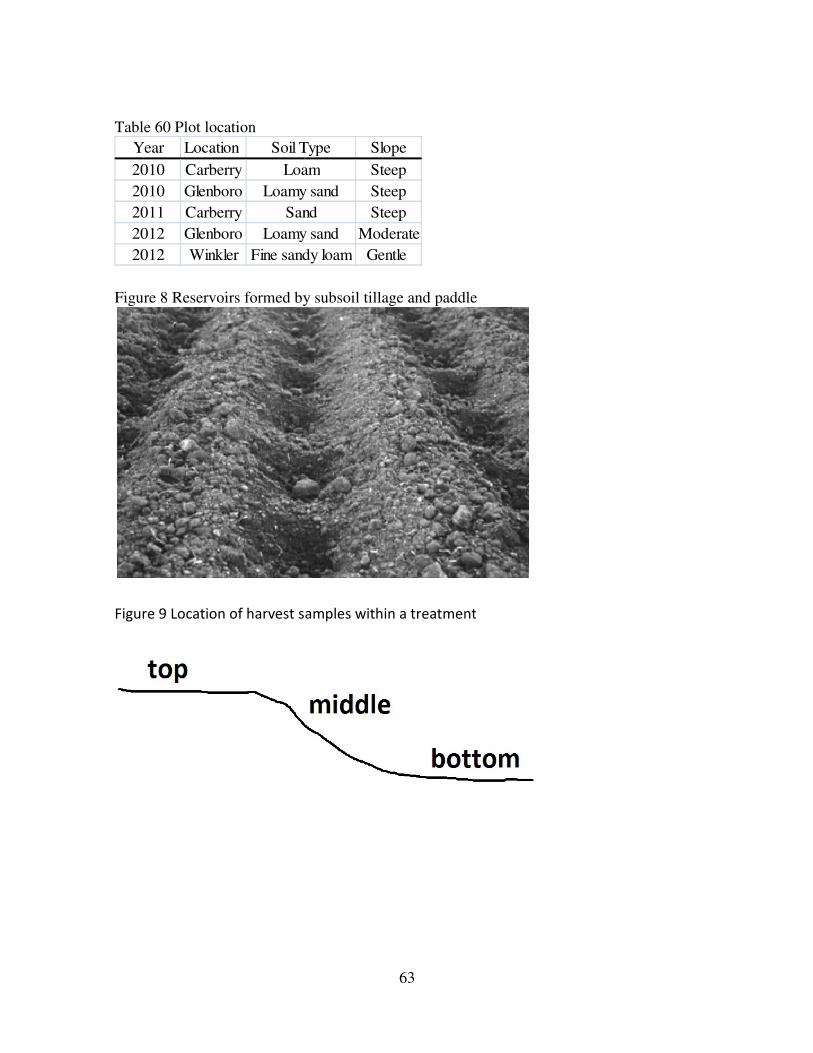
Table 60 Plot location
Year Location Soil Type
2010 Carberry Loam
2010 Glenboro Loamy sand
2011 Carberry Sand
2012 Glenboro Loamy sand
2012 Winkler Fine sandy loam
Figure 8 Reservoirs formed by subsoil
Figure 9 Location of harvest samples within a treatment
63
Soil Type Slope
Loam Steep
Loamy sand Steep
Sand Steep
Loamy sand Moderate
Fine sandy loam Gentle
Reservoirs formed by subsoil tillage and paddle
Location of harvest samples within a treatment
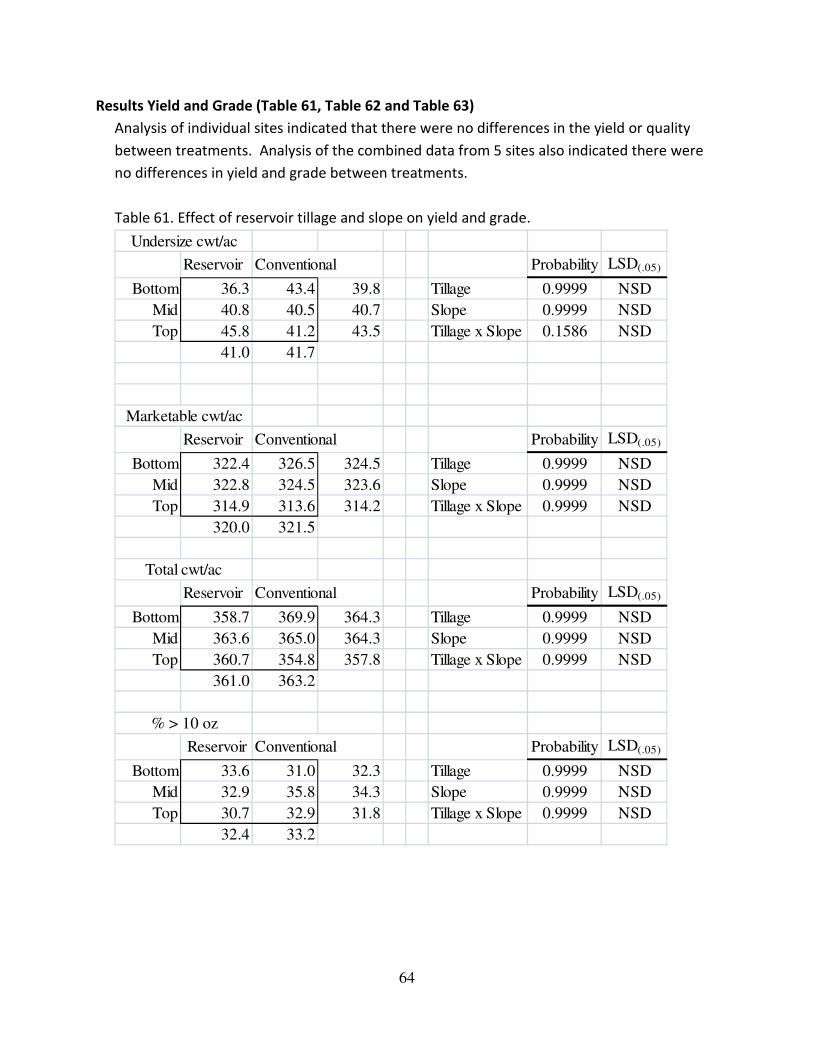
64
Results Yield and Grade (Table 61, Table 62 and Table 63)
Analysis of individual sites indicated that there were no differences in the yield or quality
between treatments. Analysis of the combined data from 5 sites also indicated there were
no differences in yield and grade between treatments.
Table 61. Effect of reservoir tillage and slope on yield and grade.
Reservoir Conventional Probability LSD(.05)
Bottom 36.3 43.4 39.8 Tillage 0.9999 NSD
Mid 40.8 40.5 40.7 Slope 0.9999 NSD
Top 45.8 41.2 43.5 Tillage x Slope 0.1586 NSD
41.0 41.7
Reservoir Conventional Probability LSD(.05)
Bottom 322.4 326.5 324.5 Tillage 0.9999 NSD
Mid 322.8 324.5 323.6 Slope 0.9999 NSD
Top 314.9 313.6 314.2 Tillage x Slope 0.9999 NSD
320.0 321.5
Reservoir Conventional Probability LSD(.05)
Bottom 358.7 369.9 364.3 Tillage 0.9999 NSD
Mid 363.6 365.0 364.3 Slope 0.9999 NSD
Top 360.7 354.8 357.8 Tillage x Slope 0.9999 NSD
361.0 363.2
Reservoir Conventional Probability LSD(.05)
Bottom 33.6 31.0 32.3 Tillage 0.9999 NSD
Mid 32.9 35.8 34.3 Slope 0.9999 NSD
Top 30.7 32.9 31.8 Tillage x Slope 0.9999 NSD
32.4 33.2
Undersize cwt/ac
Marketable cwt/ac
Total cwt/ac
% > 10 oz
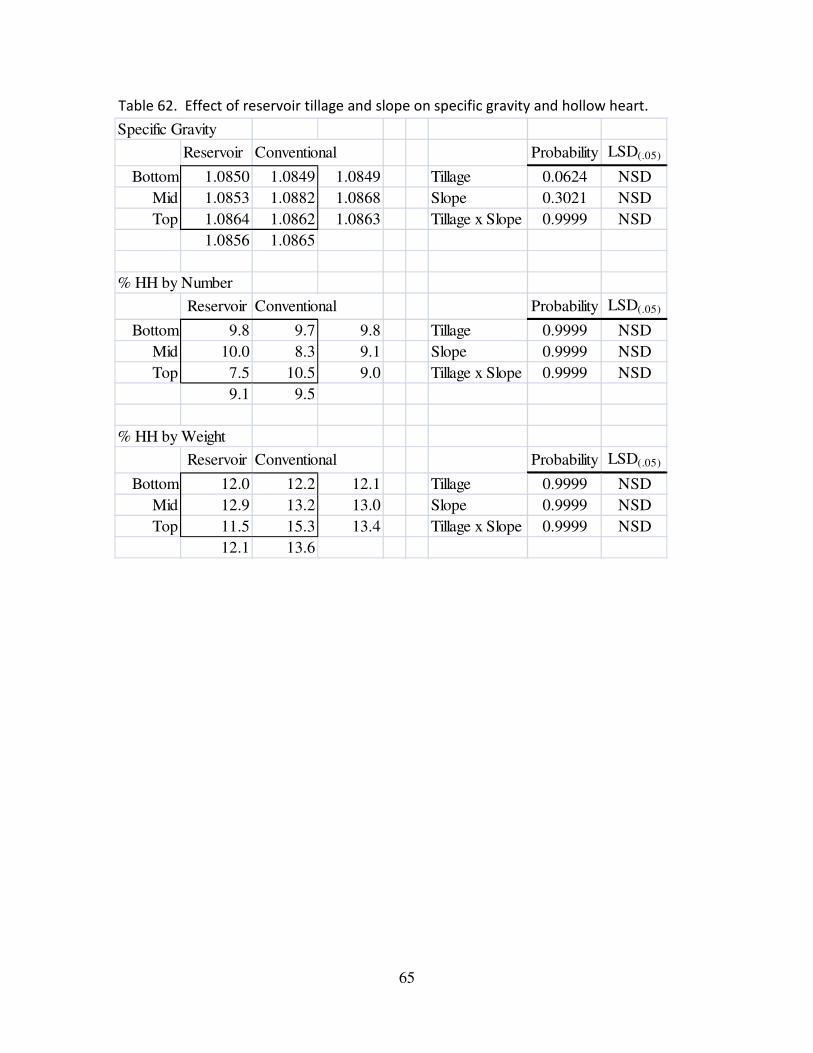
65
Table 62. Effect of reservoir tillage and slope on specific gravity and hollow heart.
Reservoir Conventional Probability LSD(.05)
Bottom 1.0850 1.0849 1.0849 Tillage 0.0624 NSD
Mid 1.0853 1.0882 1.0868 Slope 0.3021 NSD
Top 1.0864 1.0862 1.0863 Tillage x Slope 0.9999 NSD
1.0856 1.0865
Reservoir Conventional Probability LSD(.05)
Bottom 9.8 9.7 9.8 Tillage 0.9999 NSD
Mid 10.0 8.3 9.1 Slope 0.9999 NSD
Top 7.5 10.5 9.0 Tillage x Slope 0.9999 NSD
9.1 9.5
Reservoir Conventional Probability LSD(.05)
Bottom 12.0 12.2 12.1 Tillage 0.9999 NSD
Mid 12.9 13.2 13.0 Slope 0.9999 NSD
Top 11.5 15.3 13.4 Tillage x Slope 0.9999 NSD
12.1 13.6
% HH by Number
Specific Gravity
% HH by Weight
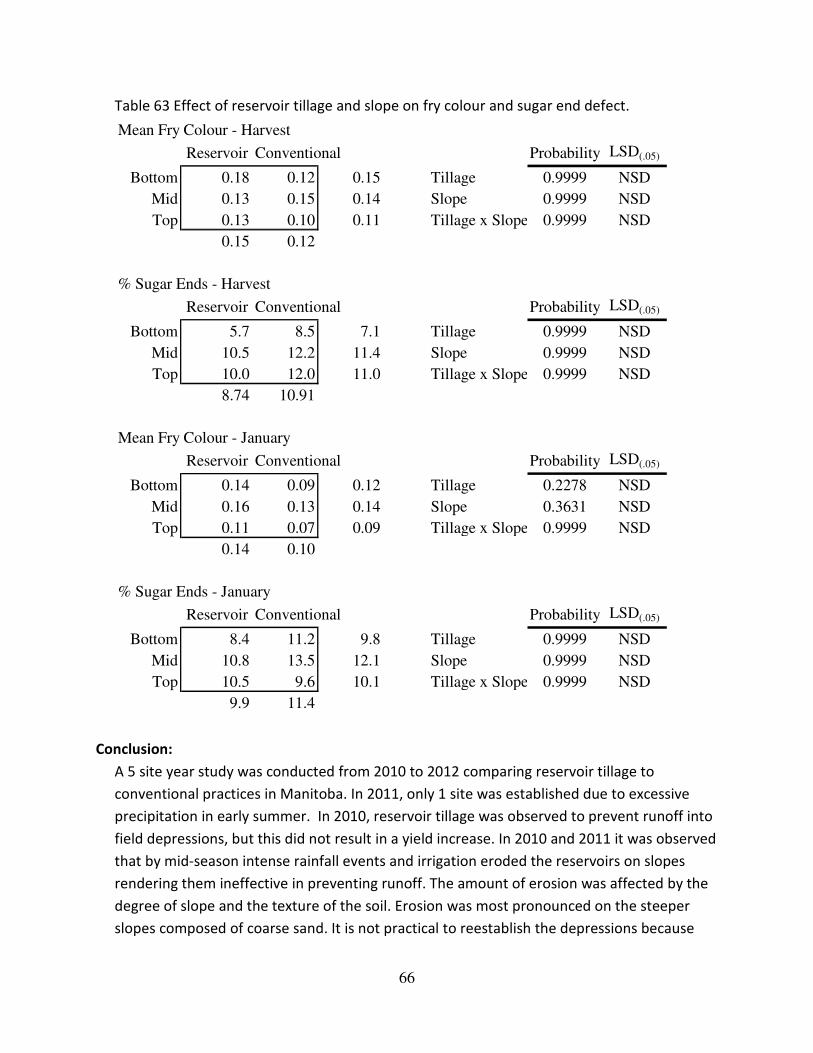
66
Table 63 Effect of reservoir tillage and slope on fry colour and sugar end defect.
Reservoir Conventional Probability LSD(.05)
Bottom 0.18 0.12 0.15 Tillage 0.9999 NSD
Mid 0.13 0.15 0.14 Slope 0.9999 NSD
Top 0.13 0.10 0.11 Tillage x Slope 0.9999 NSD
0.15 0.12
Reservoir Conventional Probability LSD(.05)
Bottom 5.7 8.5 7.1 Tillage 0.9999 NSD
Mid 10.5 12.2 11.4 Slope 0.9999 NSD
Top 10.0 12.0 11.0 Tillage x Slope 0.9999 NSD
8.74 10.91
Mean Fry Colour - January
Reservoir Conventional Probability LSD(.05)
Bottom 0.14 0.09 0.12 Tillage 0.2278 NSD
Mid 0.16 0.13 0.14 Slope 0.3631 NSD
Top 0.11 0.07 0.09 Tillage x Slope 0.9999 NSD
0.14 0.10
% Sugar Ends - January
Reservoir Conventional Probability LSD(.05)
Bottom 8.4 11.2 9.8 Tillage 0.9999 NSD
Mid 10.8 13.5 12.1 Slope 0.9999 NSD
Top 10.5 9.6 10.1 Tillage x Slope 0.9999 NSD
9.9 11.4
Mean Fry Colour - Harvest
% Sugar Ends - Harvest
Conclusion:
A 5 site year study was conducted from 2010 to 2012 comparing reservoir tillage to
conventional practices in Manitoba. In 2011, only 1 site was established due to excessive
precipitation in early summer. In 2010, reservoir tillage was observed to prevent runoff into
field depressions, but this did not result in a yield increase. In 2010 and 2011 it was observed
that by mid-season intense rainfall events and irrigation eroded the reservoirs on slopes
rendering them ineffective in preventing runoff. The amount of erosion was affected by the
degree of slope and the texture of the soil. Erosion was most pronounced on the steeper
slopes composed of coarse sand. It is not practical to reestablish the depressions because

67
the operation would damage the foliage and root system of the crop. In 2012, two sites were
established on fields with less slope than previous sites. These sites received below average
amounts of rainfall throughout the growing season, so reservoir pockets were still present at
harvest. In all 5 station years there was no difference in yield and quality between
treatments, with the exception of lower specific gravity in the reservoir tillage treatment at
the 2010 Carberry site.