key insights and digital trends shaping the indian online...
TRANSCRIPT
© comScore, Inc. Proprietary. © comScore, Inc. Proprietary.
Key Insights and Digital Trends Shaping the Indian Online Space
22 August 2013
Key Insights and Digital Trends Shaping the Indian Online Space
© comScore, Inc. Proprietary. 2
Introduction
Executive Summary
Media fragmentation is occurring at light speed in
today’s multi-platform environment, which features
not only computers, but smartphones, tablets,
gaming platforms and a seemingly ever-increasing
number of emerging devices.
The strong swelling of mobile audiences, devices
and consumption habits have shown us that
consumers have become more platform agnostic in
their digital media consumption and happily switch
devices throughout the day and into the night to stay
up to date on email, news, social media etc.
comScore has been preparing for a future
scenario where most people will consume content
on the go and PCs would no longer be the centre
of the digital universe. This future is quickly
becoming a reality.
The following report examines how the latest
trends in web usage, online video, mobile and
search, social and shopping are currently shaping
the Indian digital marketplace and what that
means for the coming year, as comScore helps
bring the digital future in focus.
FOR FURTHER INFORMATION, PLEASE CONTACT:
A Singh
#FutureinFocus
© comScore, Inc. Proprietary. 3
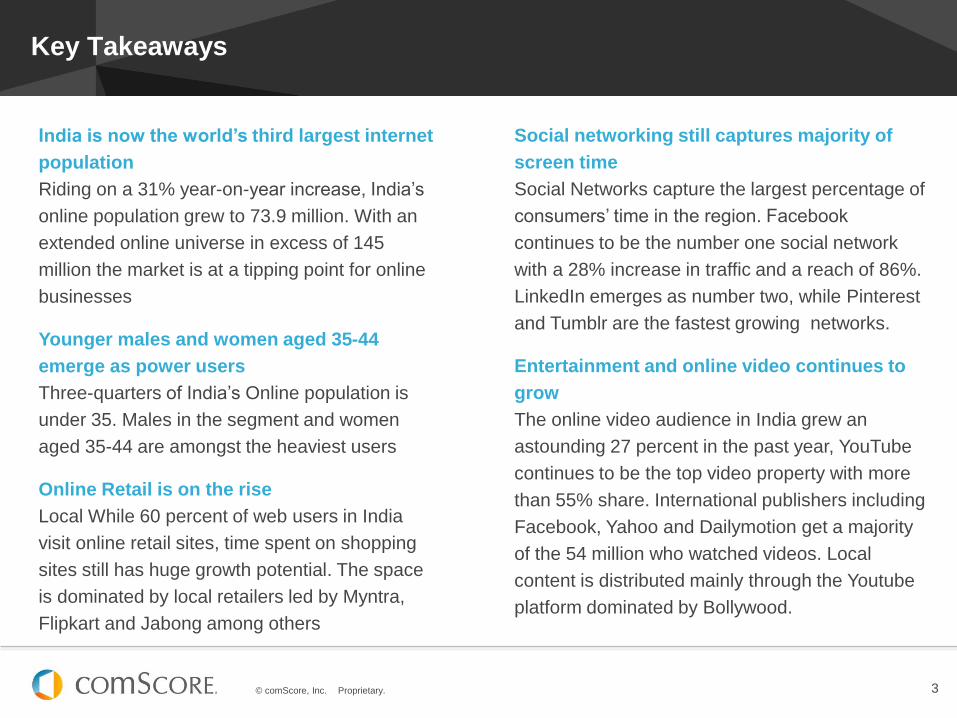
Key Takeaways
Social networking still captures majority of
screen time
Social Networks capture the largest percentage of
consumers’ time in the region. Facebook
continues to be the number one social network
with a 28% increase in traffic and a reach of 86%.
LinkedIn emerges as number two, while Pinterest
and Tumblr are the fastest growing networks.
Entertainment and online video continues to
grow
The online video audience in India grew an
astounding 27 percent in the past year, YouTube
continues to be the top video property with more
than 55% share. International publishers including
Facebook, Yahoo and Dailymotion get a majority
of the 54 million who watched videos. Local
content is distributed mainly through the Youtube
platform dominated by Bollywood.
India is now the world’s third largest internet
population
Riding on a 31% year-on-year increase, India’s
online population grew to 73.9 million. With an
extended online universe in excess of 145
million the market is at a tipping point for online
businesses
Younger males and women aged 35-44
emerge as power users
Three-quarters of India’s Online population is
under 35. Males in the segment and women
aged 35-44 are amongst the heaviest users
Online Retail is on the rise
Local While 60 percent of web users in India
visit online retail sites, time spent on shopping
sites still has huge growth potential. The space
is dominated by local retailers led by Myntra,
Flipkart and Jabong among others
© comScore, Inc. Proprietary. 4
Content
SETTING THE SCENE
Global Overview 5
Indian Online Landscape 9
Indian Mobile Landscape 16
2013 INDIA DIGITAL FUTURE IN FOCUS
Digital Audience Behaviour 19
Social Networking 23
Online Retail 27
Entertainment and Online Video 31
News and Information 35
Online Travel 41
Sports 44
Real Estate 48
Search 52
Conclusion 56
Tweet-bits 60
Methodology 61
About comScore 63
© comScore, Inc. Proprietary. © comScore, Inc. Proprietary.
GLOBAL OVERVIEW
#FutureinFocus
© comScore, Inc. Proprietary. 6
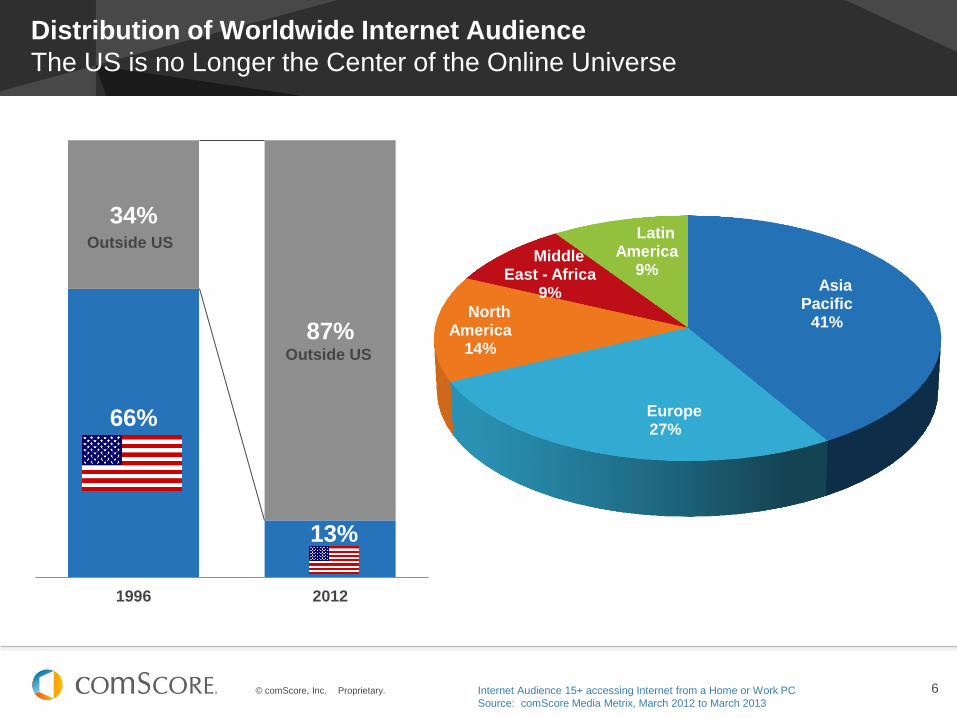
Distribution of Worldwide Internet Audience
The US is no Longer the Center of the Online Universe
66%
13%
34%
87%
1996 2012
Outside US
Asia Pacific
41%
Europe 27%
North America
14%
Middle East - Africa
9%
Latin America
9%
Outside US
Internet Audience 15+ accessing Internet from a Home or Work PC
Source: comScore Media Metrix, March 2012 to March 2013
© comScore, Inc. Proprietary. 7
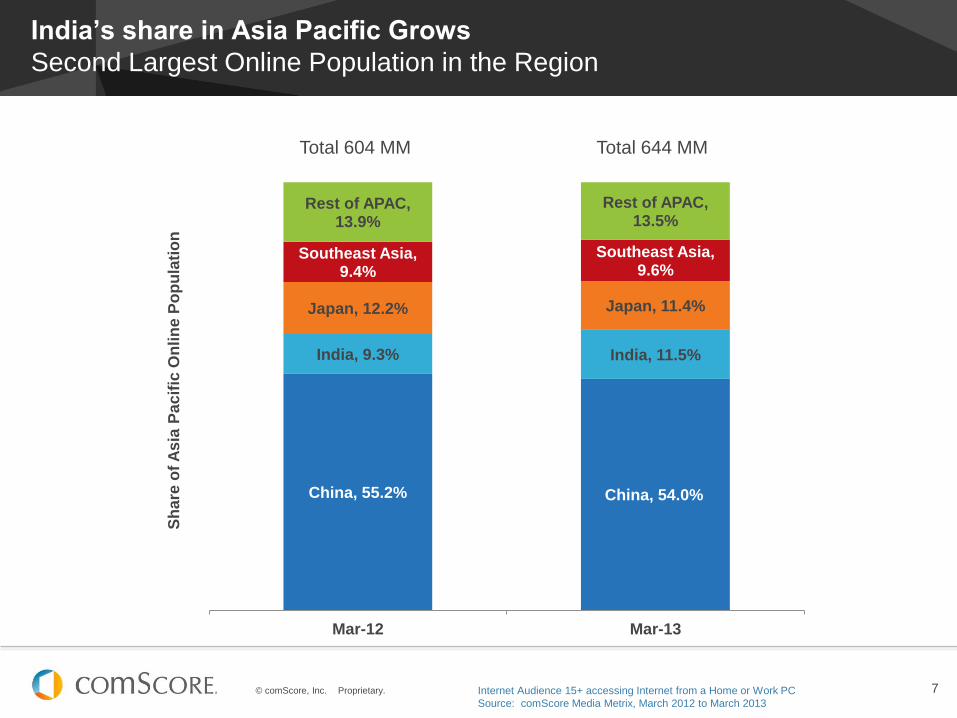
India’s share in Asia Pacific Grows
Second Largest Online Population in the Region
China, 55.2% China, 54.0%
India, 9.3% India, 11.5%
Japan, 12.2% Japan, 11.4%
Southeast Asia, 9.4%
Southeast Asia, 9.6%
Rest of APAC, 13.9%
Rest of APAC, 13.5%
Mar-12 Mar-13
Sh
are
of
As
ia P
ac
ific
On
lin
e P
op
ula
tio
n
Total 604 MM Total 644 MM
Internet Audience 15+ accessing Internet from a Home or Work PC
Source: comScore Media Metrix, March 2012 to March 2013
© comScore, Inc. Proprietary. 8
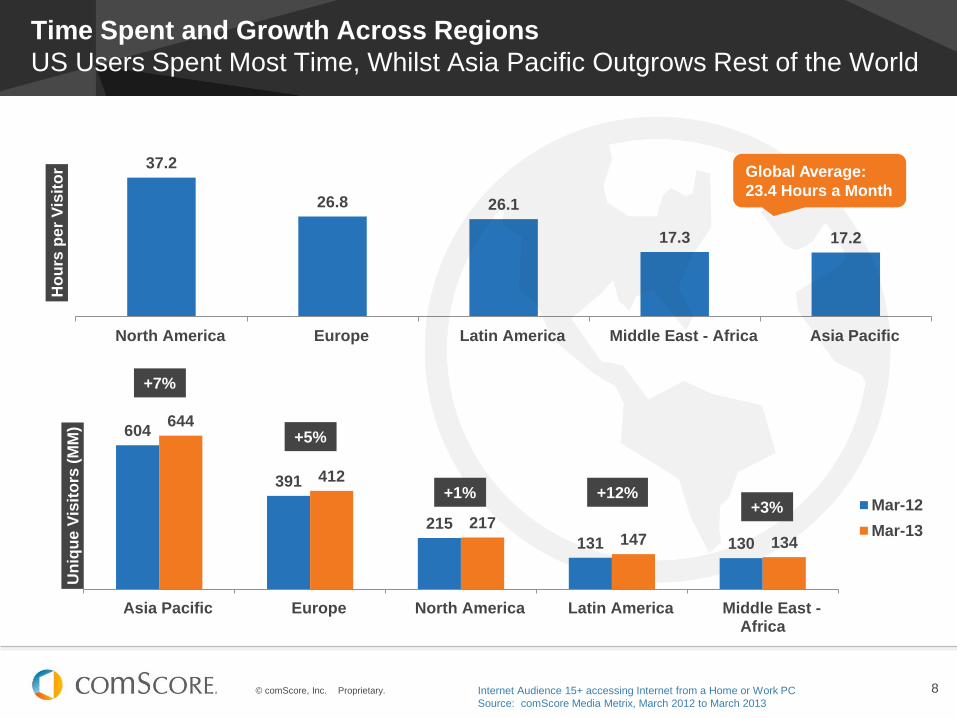
37.2
26.8 26.1
17.3 17.2
North America Europe Latin America Middle East - Africa Asia Pacific
Ho
urs
per
Vis
ito
r
Time Spent and Growth Across Regions
US Users Spent Most Time, Whilst Asia Pacific Outgrows Rest of the World
Global Average:
23.4 Hours a Month
604
391
215
131 130
644
412
217 147 134
Asia Pacific Europe North America Latin America Middle East -Africa
Un
iqu
e V
isit
ors
(M
M)
Mar-12
Mar-13
+7%
+5%
+1% +12% +3%
Internet Audience 15+ accessing Internet from a Home or Work PC
Source: comScore Media Metrix, March 2012 to March 2013
© comScore, Inc. Proprietary. © comScore, Inc. Proprietary.
INDIAN ONLINE LANDSCAPE
#FutureinFocus
© comScore, Inc. Proprietary. 10
34
8,1
77
19
1,3
74
73
,87
2
73
,64
0
62
,61
7
62
,12
2
52
,70
1
43
,02
1
39
,14
7
28
,92
9
China UnitedStates
India Japan RussianFederation
Brazil Germany France UnitedKingdom
Italy
To
tal
Un
iqu
e V
isit
ors
(000)
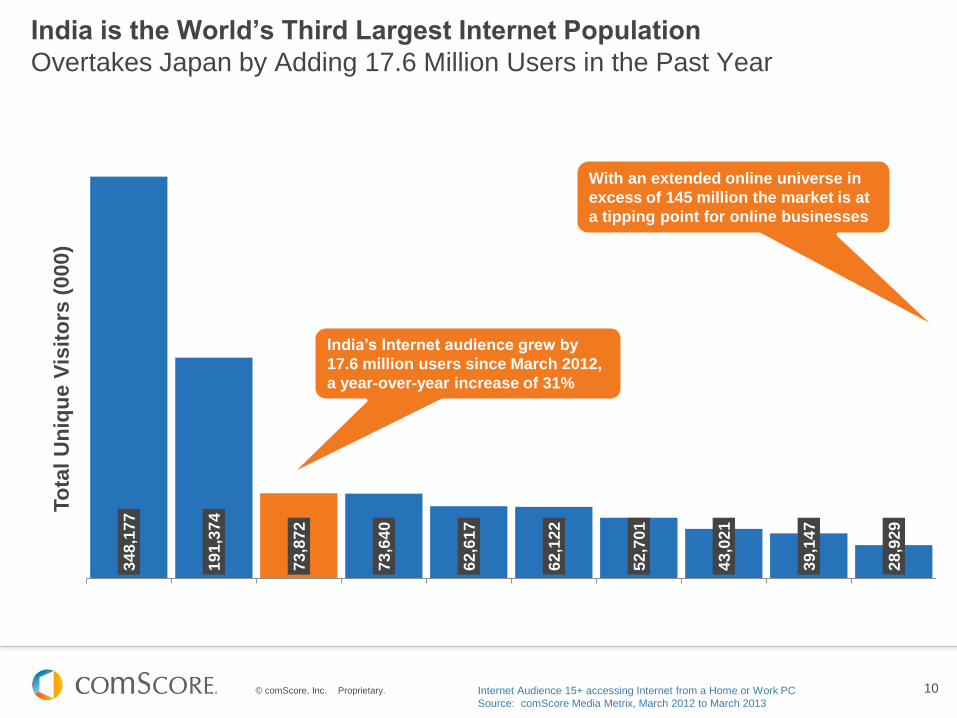
India is the World’s Third Largest Internet Population
Overtakes Japan by Adding 17.6 Million Users in the Past Year
India’s Internet audience grew by
17.6 million users since March 2012,
a year-over-year increase of 31%
Internet Audience 15+ accessing Internet from a Home or Work PC
Source: comScore Media Metrix, March 2012 to March 2013
With an extended online universe in
excess of 145 million the market is at
a tipping point for online businesses
© comScore, Inc. Proprietary. 11
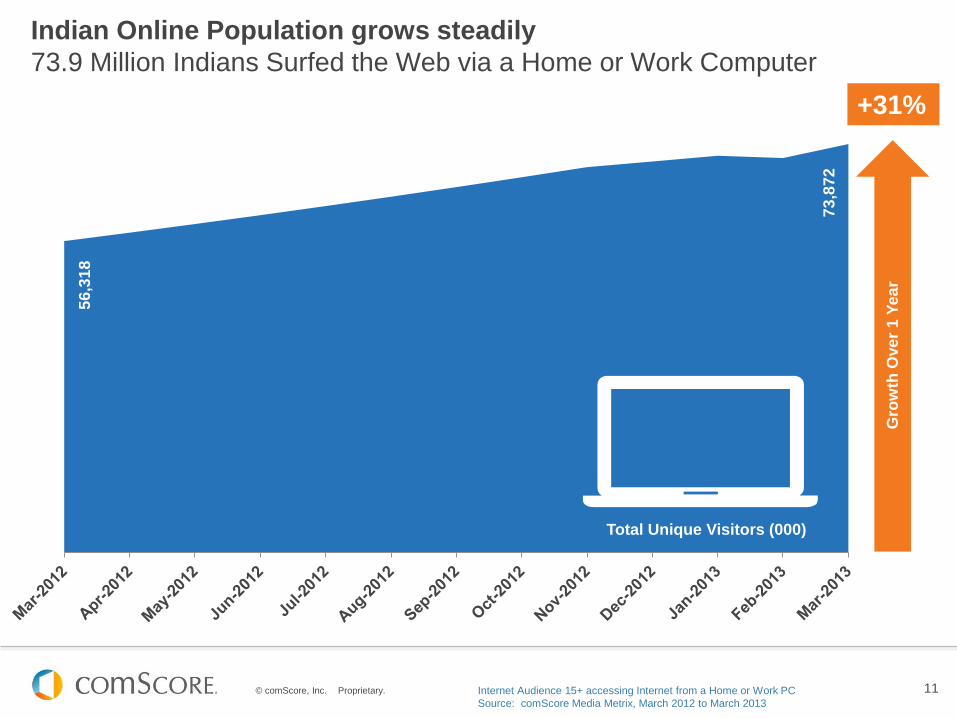
Indian Online Population grows steadily
73.9 Million Indians Surfed the Web via a Home or Work Computer
Gro
wth
Ove
r 1
Ye
ar
+31% 5
6,3
18
73
,87
2
Total Unique Visitors (000)
Internet Audience 15+ accessing Internet from a Home or Work PC
Source: comScore Media Metrix, March 2012 to March 2013
© comScore, Inc. Proprietary. 12
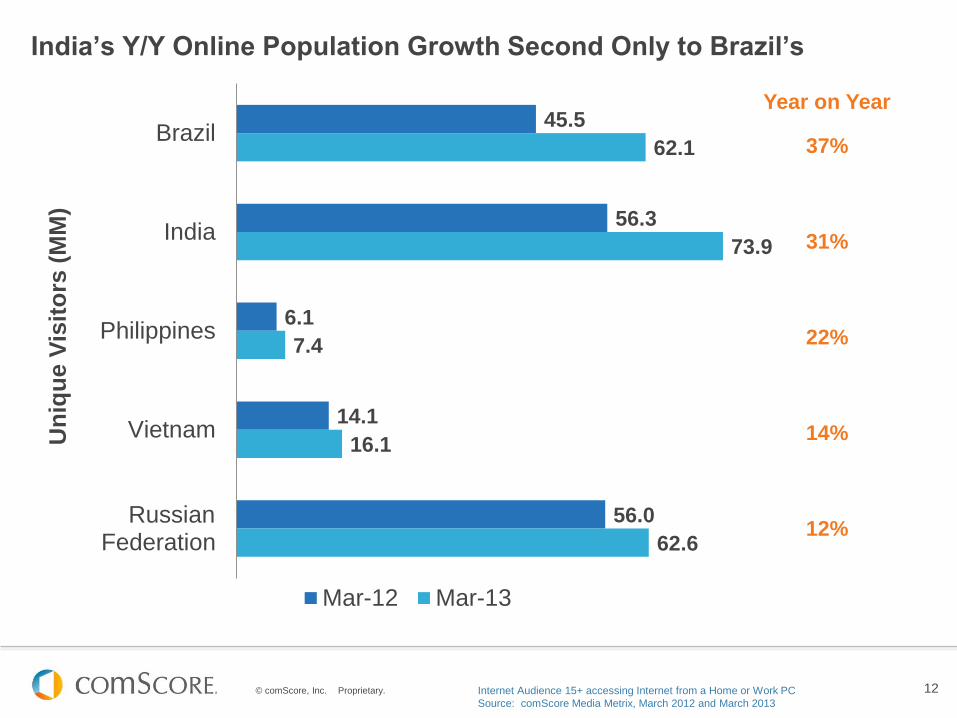
India’s Y/Y Online Population Growth Second Only to Brazil’s
45.5
56.3
6.1
14.1
56.0
62.1
73.9
7.4
16.1
62.6
Brazil
India
Philippines
Vietnam
RussianFederation
Un
iqu
e V
isit
ors
(M
M)
Mar-12 Mar-13
Internet Audience 15+ accessing Internet from a Home or Work PC
Source: comScore Media Metrix, March 2012 and March 2013
37%
31%
22%
14%
12%
Year on Year
© comScore, Inc. Proprietary. 13
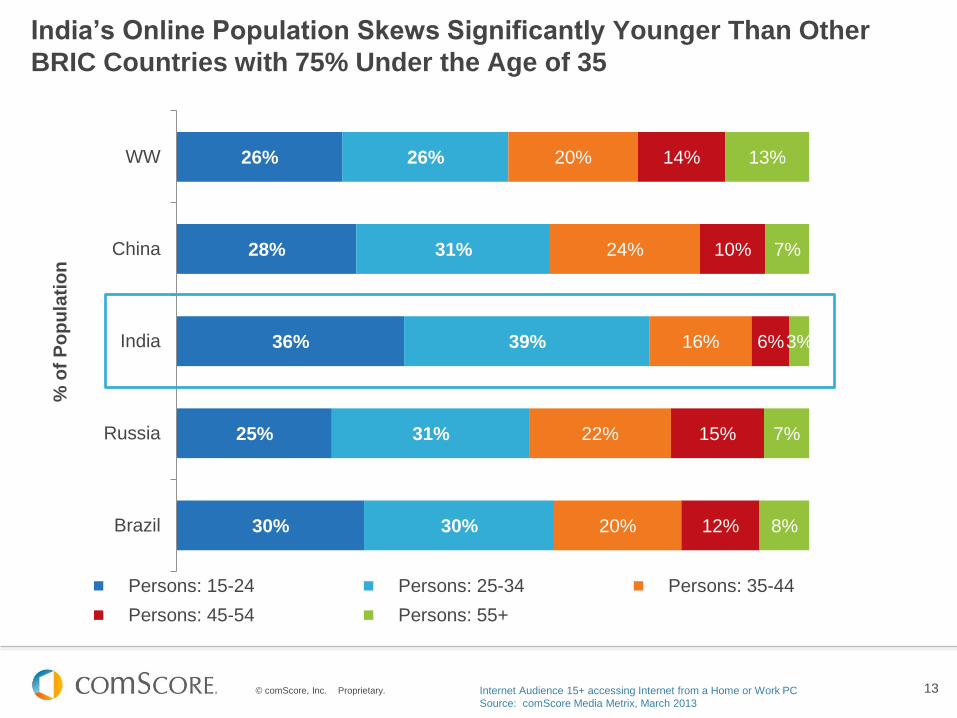
26%
28%
36%
25%
30%
26%
31%
39%
31%
30%
20%
24%
16%
22%
20%
14%
10%
6%
15%
12%
13%
7%
3%
7%
8%
WW
China
India
Russia
Brazil
% o
f P
op
ula
tio
n
Persons: 15-24 Persons: 25-34 Persons: 35-44
Persons: 45-54 Persons: 55+
India’s Online Population Skews Significantly Younger Than Other
BRIC Countries with 75% Under the Age of 35
Internet Audience 15+ accessing Internet from a Home or Work PC
Source: comScore Media Metrix, March 2013
© comScore, Inc. Proprietary. 14
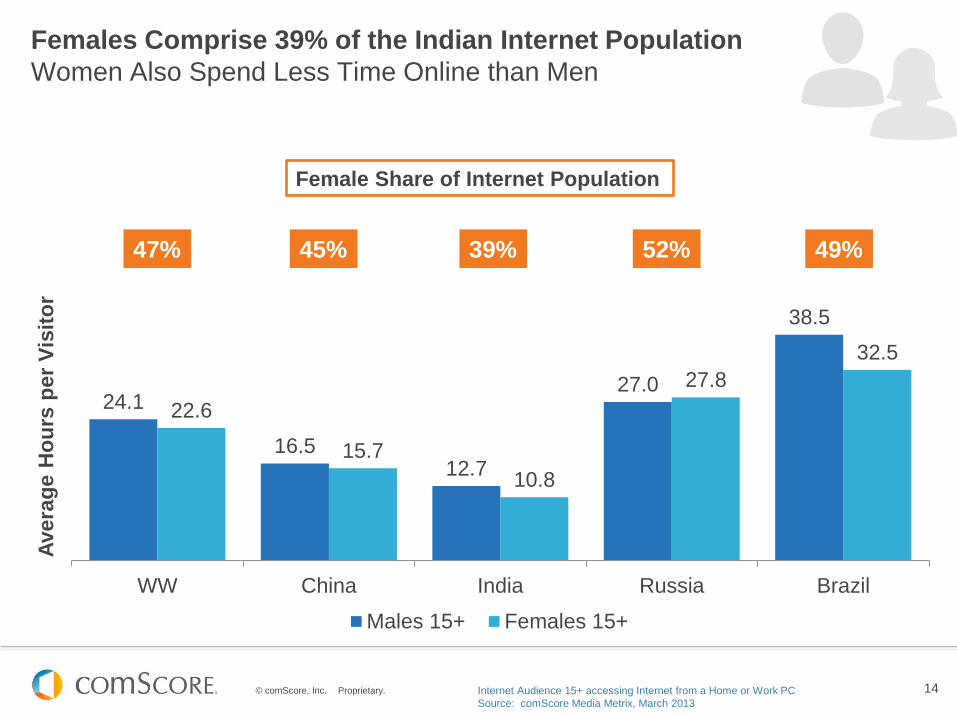
24.1
16.5 12.7
27.0
38.5
22.6
15.7
10.8
27.8
32.5
WW China India Russia Brazil
Avera
ge H
ou
rs p
er
Vis
ito
r
Males 15+ Females 15+
Females Comprise 39% of the Indian Internet Population
Women Also Spend Less Time Online than Men
Female Share of Internet Population
47% 45% 39% 52% 49%
Internet Audience 15+ accessing Internet from a Home or Work PC
Source: comScore Media Metrix, March 2013
© comScore, Inc. Proprietary. 15
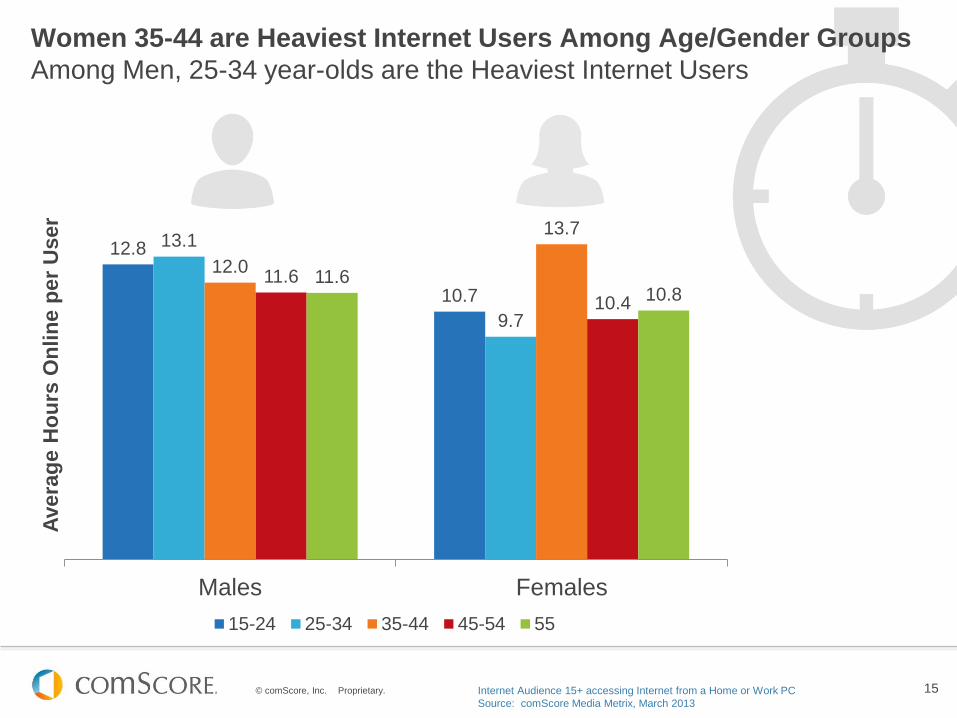
Women 35-44 are Heaviest Internet Users Among Age/Gender Groups
Among Men, 25-34 year-olds are the Heaviest Internet Users
12.8
10.7
13.1
9.7
12.0
13.7
11.6
10.4
11.6 10.8
Males Females
Avera
ge H
ou
rs O
nlin
e p
er
User
15-24 25-34 35-44 45-54 55
Internet Audience 15+ accessing Internet from a Home or Work PC
Source: comScore Media Metrix, March 2013

© comScore, Inc. Proprietary. © comScore, Inc. Proprietary.
INDIAN MOBILE LANDSCAPE
#FutureinFocus
© comScore, Inc. Proprietary. 17
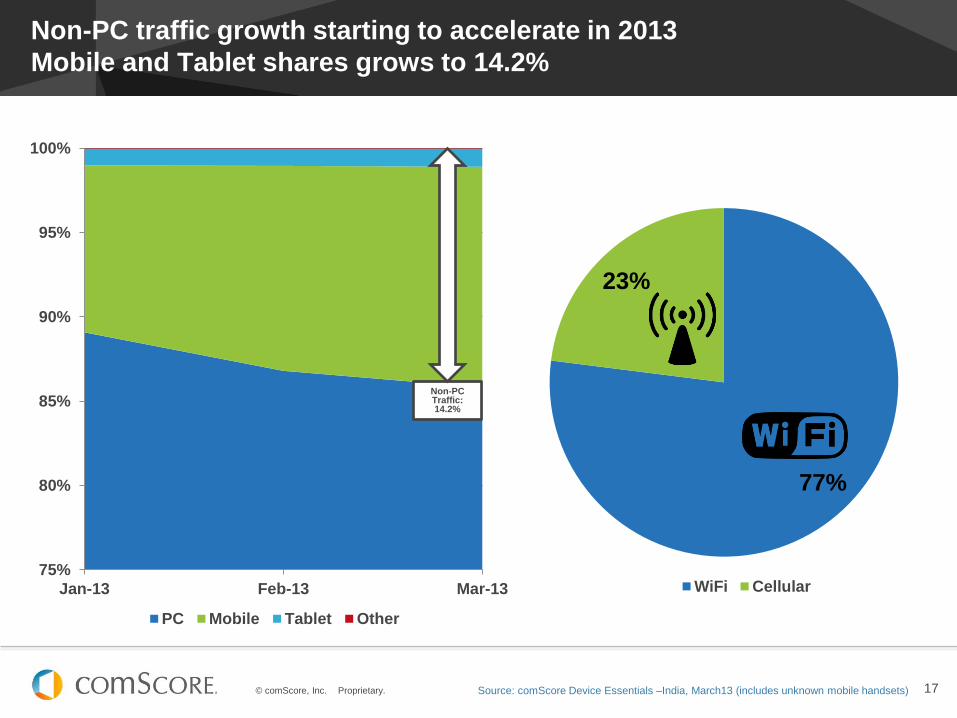
77%
23%
WiFi Cellular
Non-PC traffic growth starting to accelerate in 2013
Mobile and Tablet shares grows to 14.2%
75%
80%
85%
90%
95%
100%
Jan-13 Feb-13 Mar-13
PC Mobile Tablet Other
Non-PC Traffic: 14.2%
Source: comScore Device Essentials –India, March13 (includes unknown mobile handsets)
© comScore, Inc. Proprietary. 18
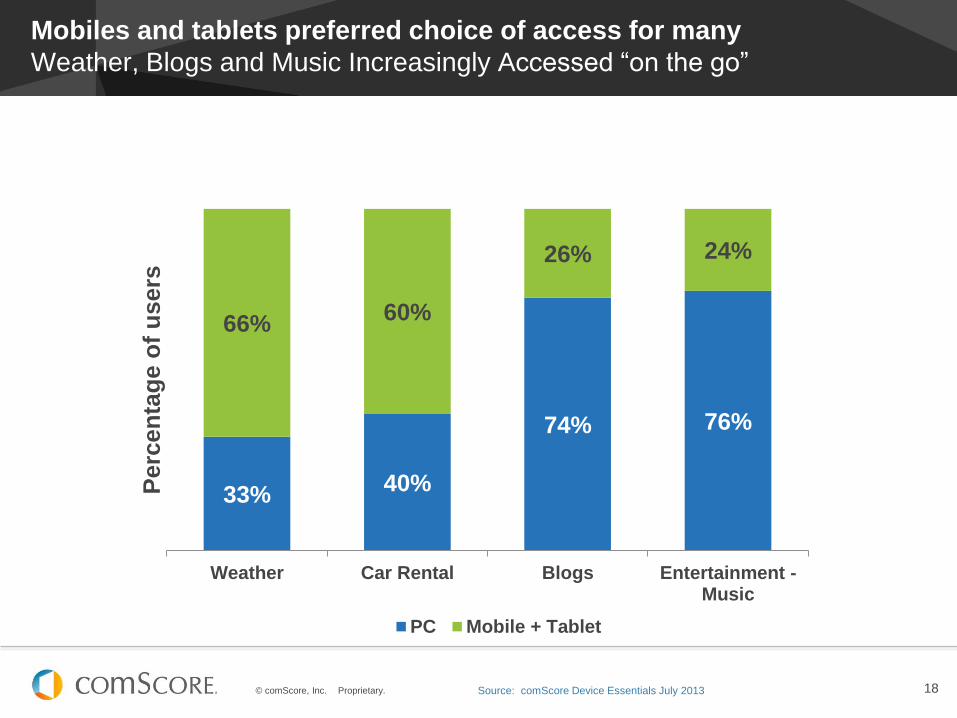
Mobiles and tablets preferred choice of access for many
Weather, Blogs and Music Increasingly Accessed “on the go”
Source: comScore Device Essentials July 2013
33% 40%
74% 76%
66% 60%
26% 24%
Weather Car Rental Blogs Entertainment -Music
Perc
en
tag
e o
f u
sers
PC Mobile + Tablet
© comScore, Inc. Proprietary. © comScore, Inc. Proprietary.
DIGITAL AUDIENCE BEHAVIOUR
#FutureinFocus
© comScore, Inc. Proprietary. 20
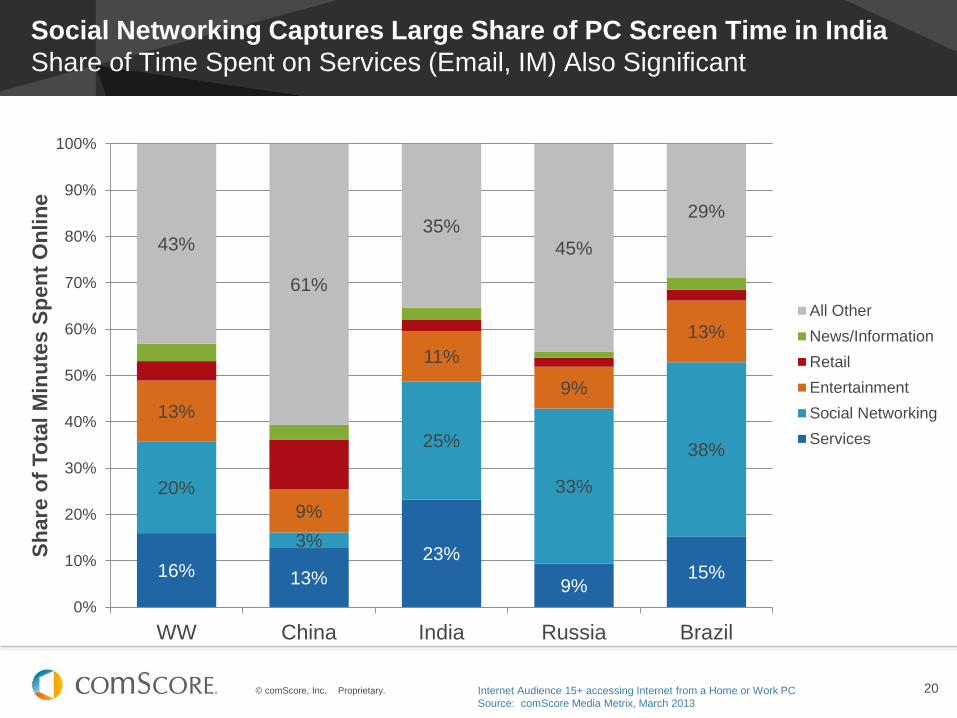
Social Networking Captures Large Share of PC Screen Time in India
Share of Time Spent on Services (Email, IM) Also Significant
Internet Audience 15+ accessing Internet from a Home or Work PC
Source: comScore Media Metrix, March 2013
16% 13%
23%
9% 15%
20%
3%
25%
33%
38%
13%
9%
11%
9%
13%
43%
61%
35%
45%
29%
0%
10%
20%
30%
40%
50%
60%
70%
80%
90%
100%
WW China India Russia Brazil
Sh
are
of
To
tal
Min
ute
s S
pen
t O
nlin
e
All Other
News/Information
Retail
Entertainment
Social Networking
Services
© comScore, Inc. Proprietary. 21
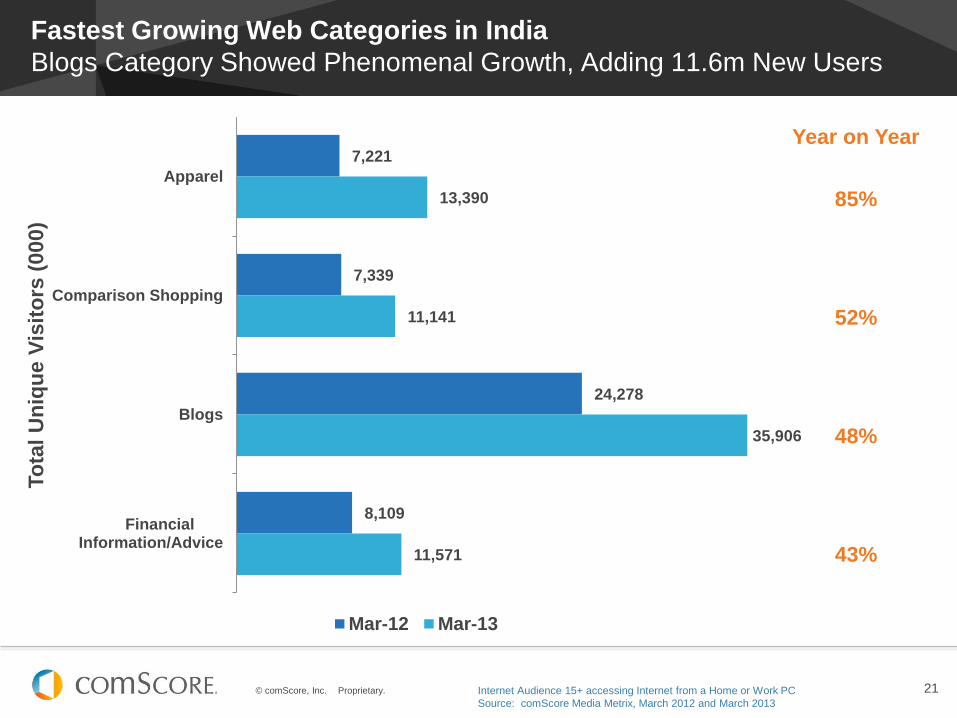
Fastest Growing Web Categories in India
Blogs Category Showed Phenomenal Growth, Adding 11.6m New Users
7,221
7,339
24,278
8,109
13,390
11,141
35,906
11,571
Apparel
Comparison Shopping
Blogs
FinancialInformation/Advice
To
tal
Un
iqu
e V
isit
ors
(000)
Mar-12 Mar-13
Internet Audience 15+ accessing Internet from a Home or Work PC
Source: comScore Media Metrix, March 2012 and March 2013
85%
52%
48%
43%
Year on Year
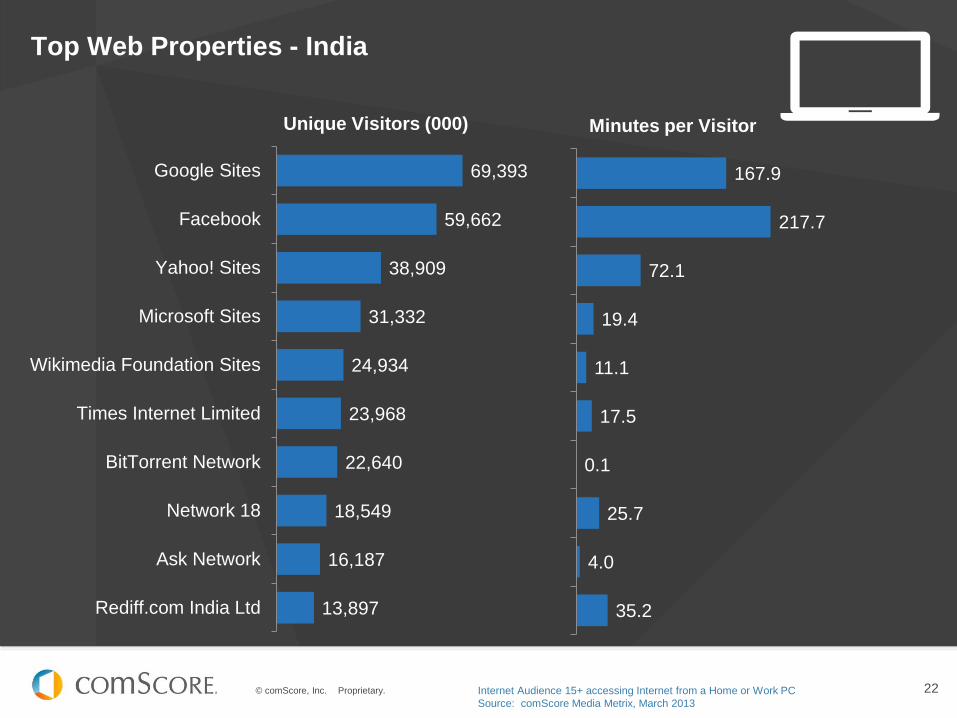
© comScore, Inc. Proprietary. 22
Top Web Properties - India
69,393
59,662
38,909
31,332
24,934
23,968
22,640
18,549
16,187
13,897
Google Sites
Yahoo! Sites
Microsoft Sites
Wikimedia Foundation Sites
Times Internet Limited
BitTorrent Network
Network 18
Ask Network
Rediff.com India Ltd
167.9
217.7
72.1
19.4
11.1
17.5
0.1
25.7
4.0
35.2
Unique Visitors (000) Minutes per Visitor
Internet Audience 15+ accessing Internet from a Home or Work PC
Source: comScore Media Metrix, March 2013
© comScore, Inc. Proprietary. © comScore, Inc. Proprietary.
SOCIAL NETWORKING
#FutureinFocus
© comScore, Inc. Proprietary. 24
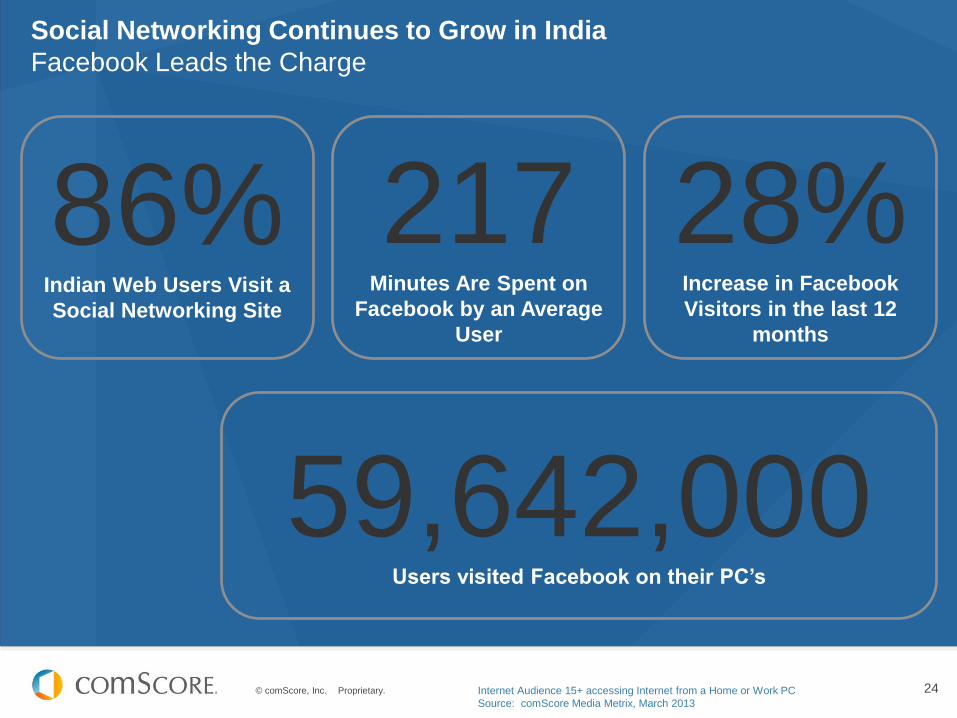
Social Networking Continues to Grow in India
Facebook Leads the Charge
86% Indian Web Users Visit a
Social Networking Site
59,642,000 Users visited Facebook on their PC’s
217 Minutes Are Spent on
Facebook by an Average
User
28% Increase in Facebook
Visitors in the last 12
months
Internet Audience 15+ accessing Internet from a Home or Work PC
Source: comScore Media Metrix, March 2013
© comScore, Inc. Proprietary. 25
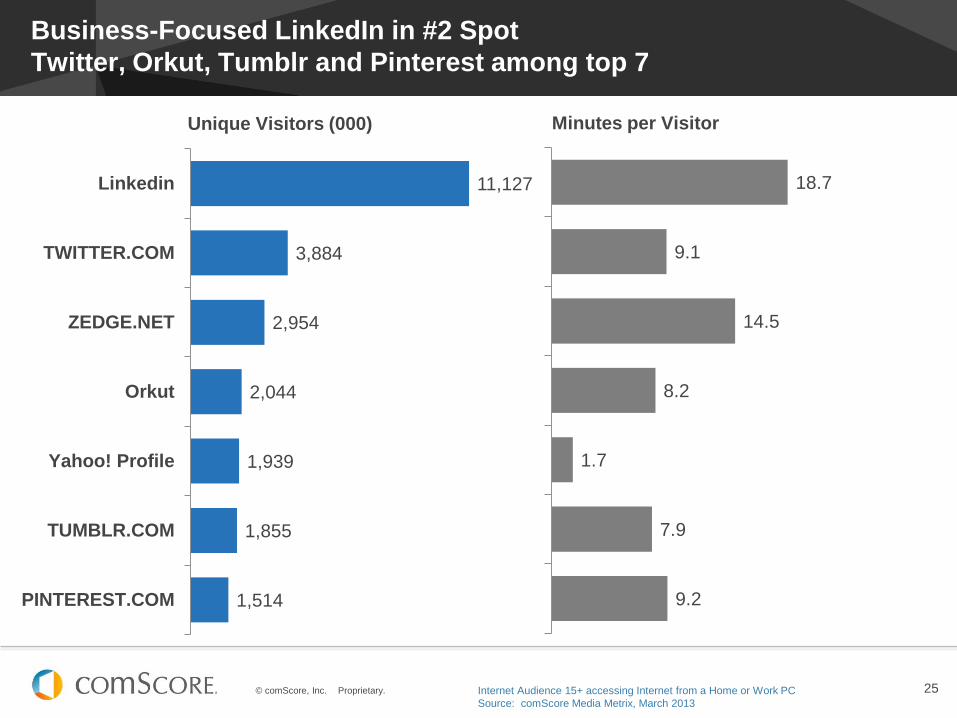
18.7
9.1
14.5
8.2
1.7
7.9
9.2
Business-Focused LinkedIn in #2 Spot
Twitter, Orkut, Tumblr and Pinterest among top 7
11,127
3,884
2,954
2,044
1,939
1,855
1,514
TWITTER.COM
ZEDGE.NET
Orkut
Yahoo! Profile
TUMBLR.COM
PINTEREST.COM
Unique Visitors (000) Minutes per Visitor
Internet Audience 15+ accessing Internet from a Home or Work PC
Source: comScore Media Metrix, March 2013
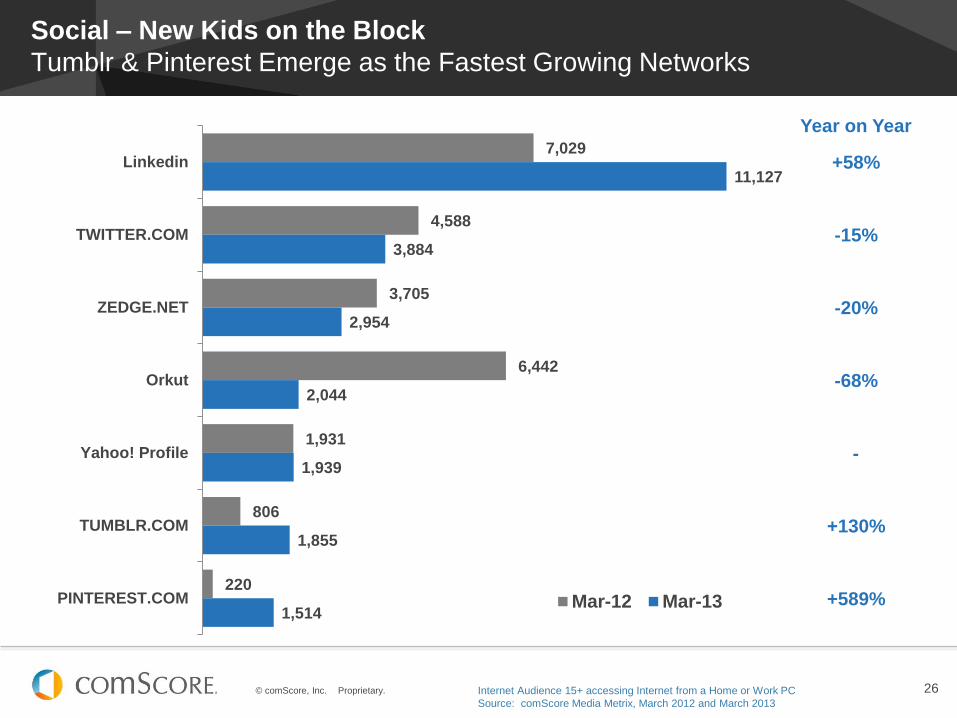
© comScore, Inc. Proprietary. 26
7,029
4,588
3,705
6,442
1,931
806
220
11,127
3,884
2,954
2,044
1,939
1,855
1,514
TWITTER.COM
ZEDGE.NET
Orkut
Yahoo! Profile
TUMBLR.COM
PINTEREST.COM Mar-12 Mar-13
Social – New Kids on the Block
Tumblr & Pinterest Emerge as the Fastest Growing Networks
Internet Audience 15+ accessing Internet from a Home or Work PC
Source: comScore Media Metrix, March 2012 and March 2013
+58%
-15%
-20%
-68%
-
+130%
+589%
Year on Year
© comScore, Inc. Proprietary. © comScore, Inc. Proprietary.
ONLINE RETAIL ON THE RISE
#FutureinFocus
© comScore, Inc. Proprietary. 28
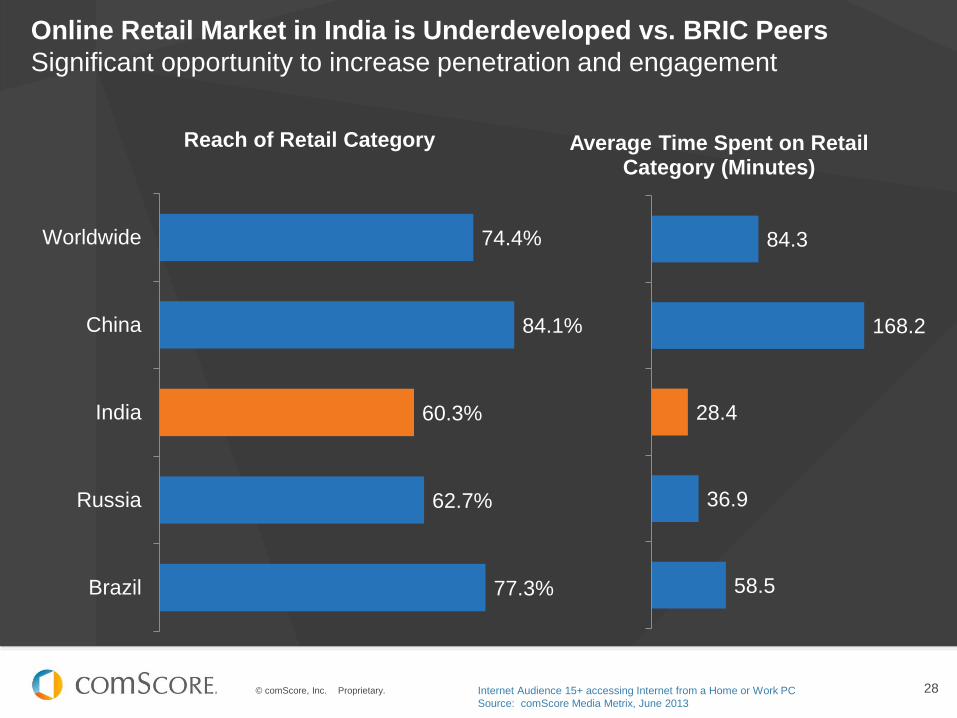
74.4%
84.1%
60.3%
62.7%
77.3%
Worldwide
China
India
Russia
Brazil
Reach of Retail Category
Online Retail Market in India is Underdeveloped vs. BRIC Peers
Significant opportunity to increase penetration and engagement
84.3
168.2
28.4
36.9
58.5
Average Time Spent on Retail Category (Minutes)
Internet Audience 15+ accessing Internet from a Home or Work PC
Source: comScore Media Metrix, June 2013
© comScore, Inc. Proprietary. 29
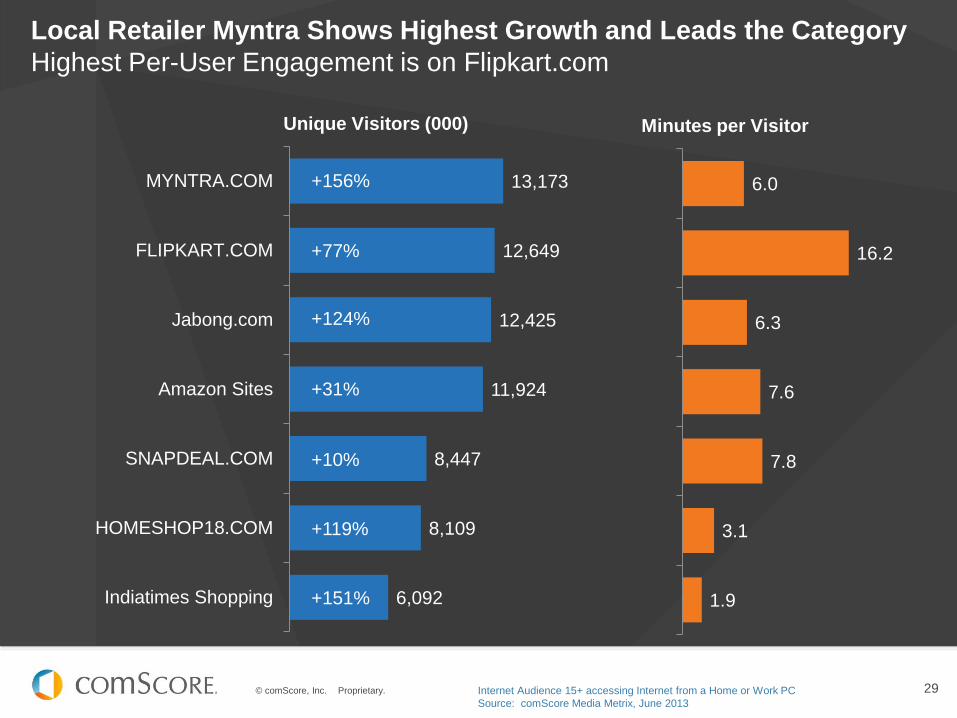
Local Retailer Myntra Shows Highest Growth and Leads the Category
Highest Per-User Engagement is on Flipkart.com
Internet Audience 15+ accessing Internet from a Home or Work PC
Source: comScore Media Metrix, June 2013
13,173
12,649
12,425
11,924
8,447
8,109
6,092
MYNTRA.COM
FLIPKART.COM
Jabong.com
Amazon Sites
SNAPDEAL.COM
HOMESHOP18.COM
Indiatimes Shopping
6.0
16.2
6.3
7.6
7.8
3.1
1.9
Unique Visitors (000) Minutes per Visitor
+156%
+77%
+124%
+31%
+10%
+119%
+151%
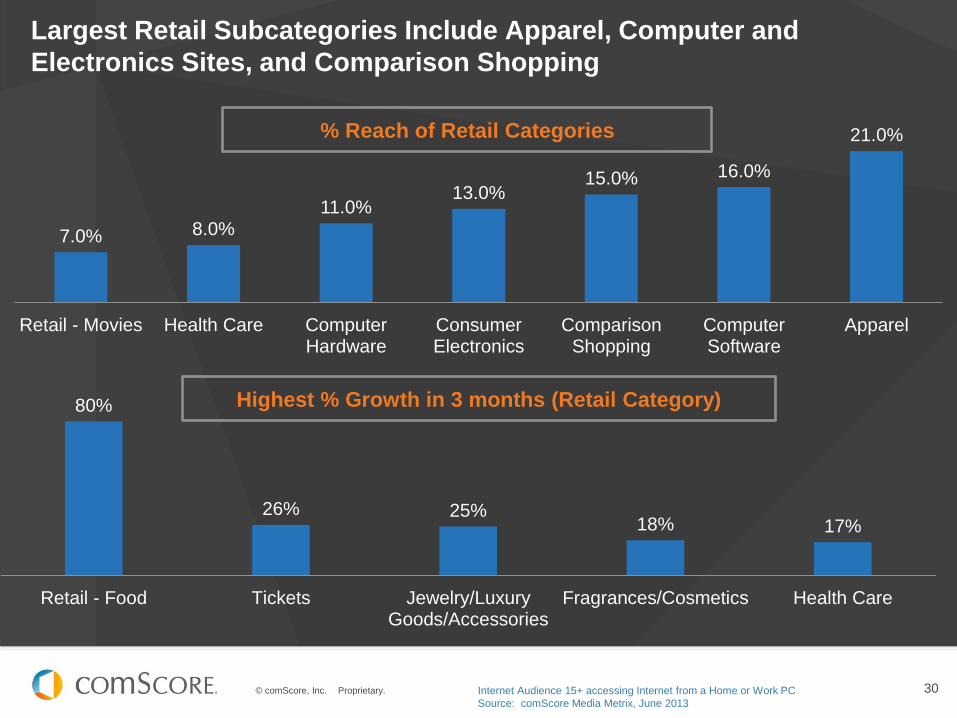
© comScore, Inc. Proprietary. 30
Largest Retail Subcategories Include Apparel, Computer and
Electronics Sites, and Comparison Shopping
Internet Audience 15+ accessing Internet from a Home or Work PC
Source: comScore Media Metrix, June 2013
21.0%
16.0% 15.0% 13.0%
11.0% 8.0% 7.0%
ApparelComputerSoftware
ComparisonShopping
ConsumerElectronics
ComputerHardware
Health CareRetail - Movies
% Reach of Retail Categories
17% 18% 25% 26%
80%
Health CareFragrances/CosmeticsJewelry/LuxuryGoods/Accessories
TicketsRetail - Food
Highest % Growth in 3 months (Retail Category)
© comScore, Inc. Proprietary. © comScore, Inc. Proprietary.
ENTERTAINMENT & ONLINE VIDEO
#FutureinFocus
© comScore, Inc. Proprietary. 32
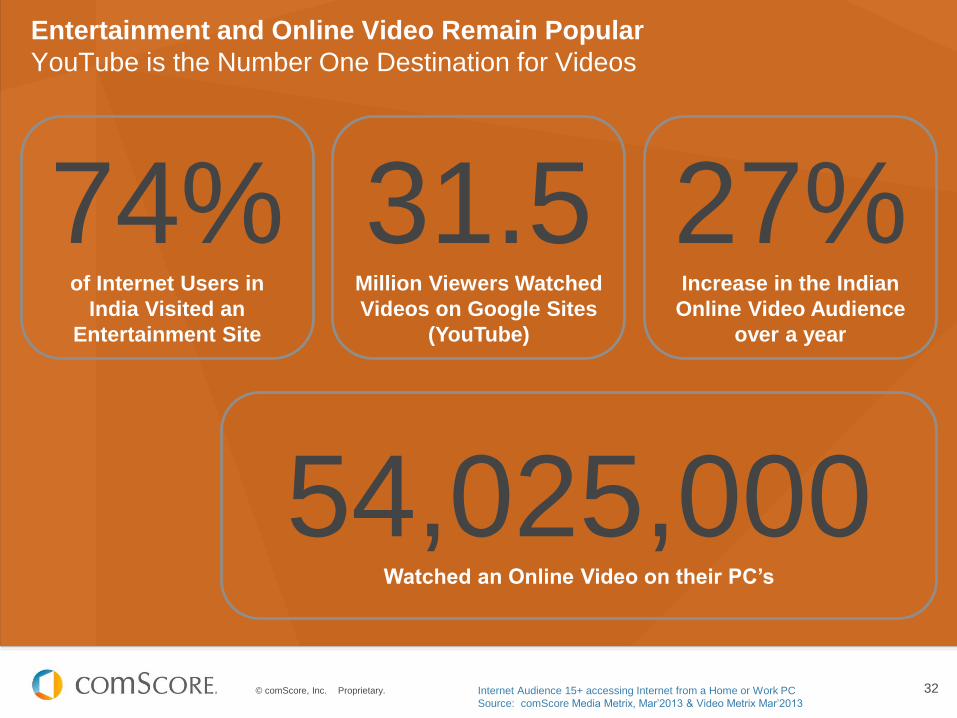
Entertainment and Online Video Remain Popular
YouTube is the Number One Destination for Videos
74% of Internet Users in
India Visited an
Entertainment Site
54,025,000 Watched an Online Video on their PC’s
31.5 Million Viewers Watched
Videos on Google Sites
(YouTube)
27% Increase in the Indian
Online Video Audience
over a year
Internet Audience 15+ accessing Internet from a Home or Work PC
Source: comScore Media Metrix, Mar’2013 & Video Metrix Mar’2013

© comScore, Inc. Proprietary. 33
Facebook,Yahoo! And YouTube Grow Further
Metacafe,Times Internet and Vdopia lose
Unique Visitors (000)
Internet Audience 15+ accessing Internet from a Home or Work PC
Source: comScore Video Metrix, March 2013
+24%
+182%
+100%
-10%
-6%
+11%
-34%
+23%
-58%
+32%
31,519
18,606
8,243
6,444
4,275
2,880
2,388
2,095
1,511
1,397
Google Sites
Yahoo! Sites
VDOPIA.COM
DAILYMOTION.COM
VEVO
Times Internet Limited
Amazon Sites
Metacafe
Vimeo
55.7% Of All Videos Viewed
were on Google Sites
(YouTube)
Year on Year
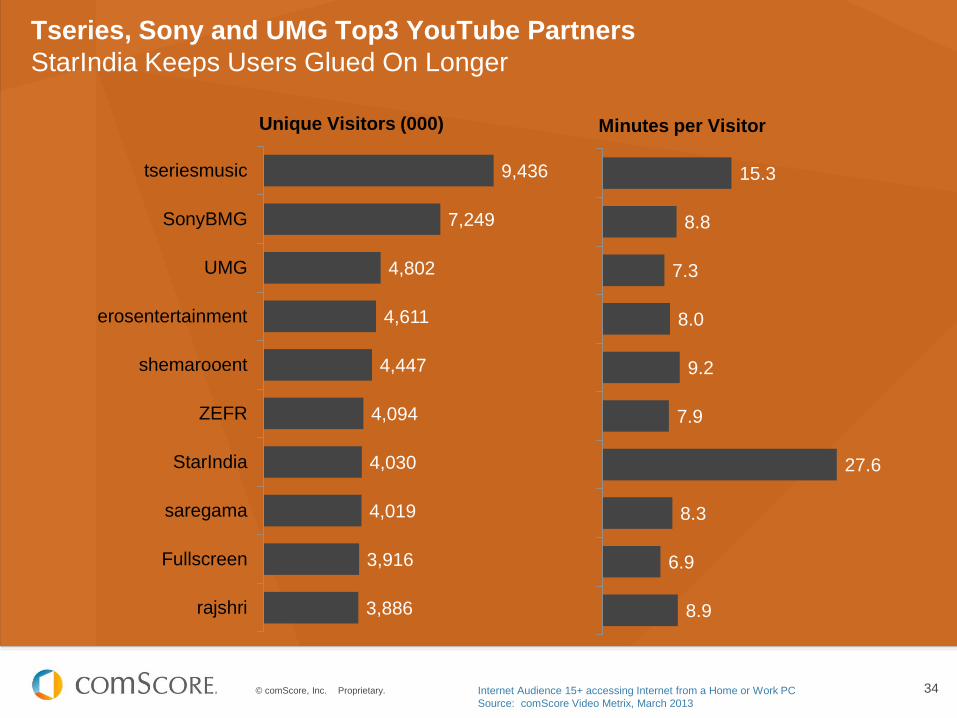
© comScore, Inc. Proprietary. 34
Tseries, Sony and UMG Top3 YouTube Partners
StarIndia Keeps Users Glued On Longer
9,436
7,249
4,802
4,611
4,447
4,094
4,030
4,019
3,916
3,886
tseriesmusic
SonyBMG
UMG
erosentertainment
shemarooent
ZEFR
StarIndia
saregama
Fullscreen
rajshri
15.3
8.8
7.3
8.0
9.2
7.9
27.6
8.3
6.9
8.9
Unique Visitors (000) Minutes per Visitor
Internet Audience 15+ accessing Internet from a Home or Work PC
Source: comScore Video Metrix, March 2013

© comScore, Inc. Proprietary. © comScore, Inc. Proprietary.
NEWS/INFORMATION
#FutureinFocus
© comScore, Inc. Proprietary. 36
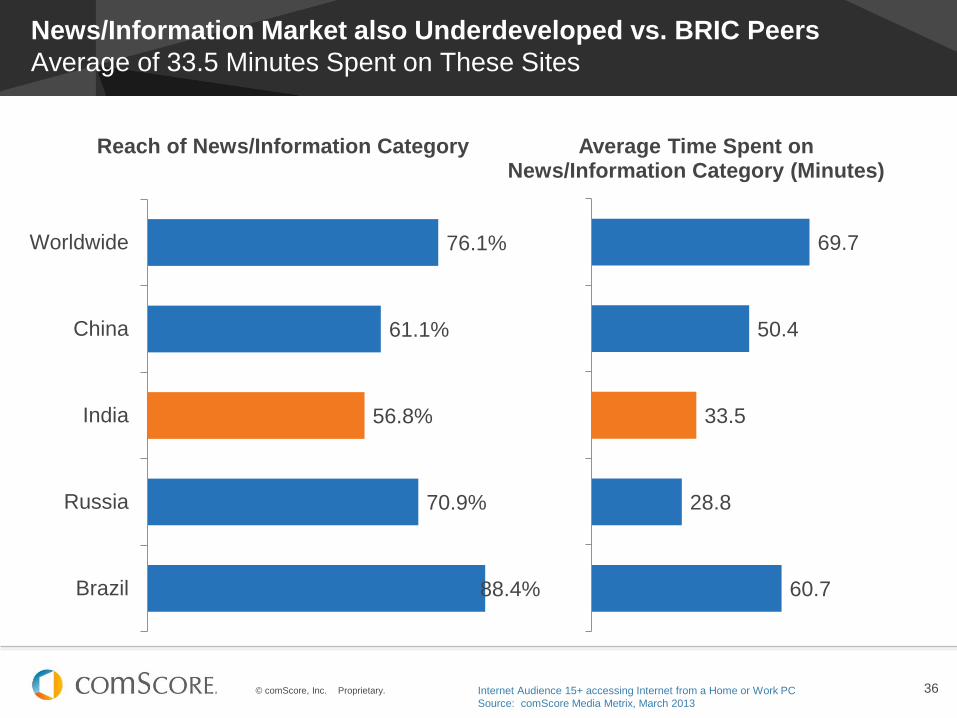
News/Information Market also Underdeveloped vs. BRIC Peers
Average of 33.5 Minutes Spent on These Sites
76.1%
61.1%
56.8%
70.9%
88.4%
Worldwide
China
India
Russia
Brazil
Reach of News/Information Category
69.7
50.4
33.5
28.8
60.7
Average Time Spent on News/Information Category (Minutes)
Internet Audience 15+ accessing Internet from a Home or Work PC
Source: comScore Media Metrix, March 2013
© comScore, Inc. Proprietary. 37
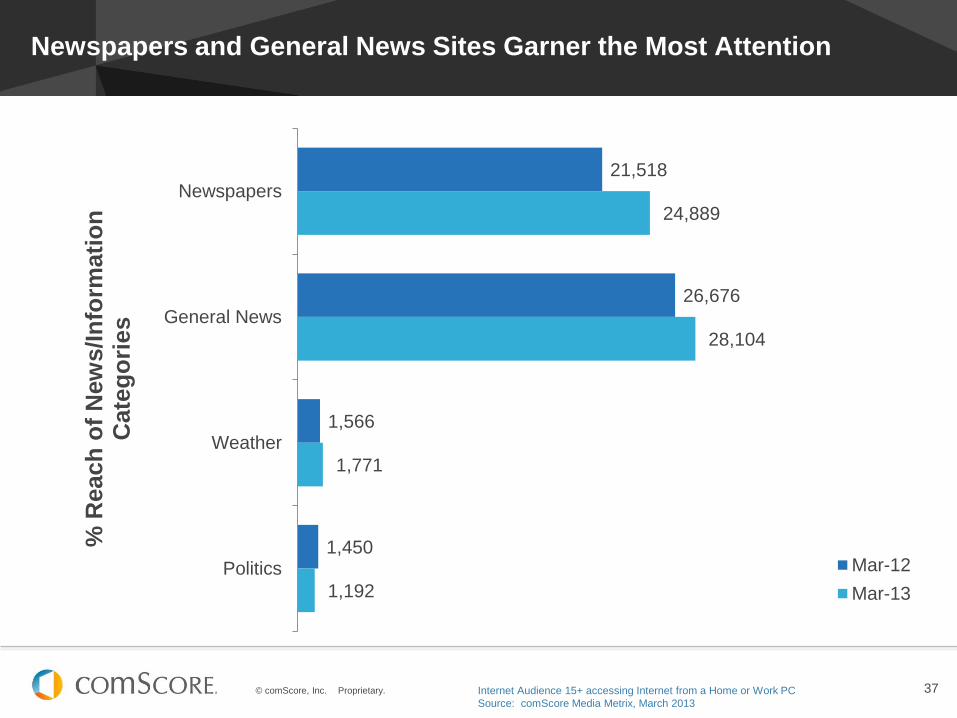
Newspapers and General News Sites Garner the Most Attention
21,518
26,676
1,566
1,450
24,889
28,104
1,771
1,192
Newspapers
General News
Weather
Politics
% R
each
of
New
s/In
form
ati
on
C
ate
go
ries
Mar-12
Mar-13
Internet Audience 15+ accessing Internet from a Home or Work PC
Source: comScore Media Metrix, March 2013
© comScore, Inc. Proprietary. 38
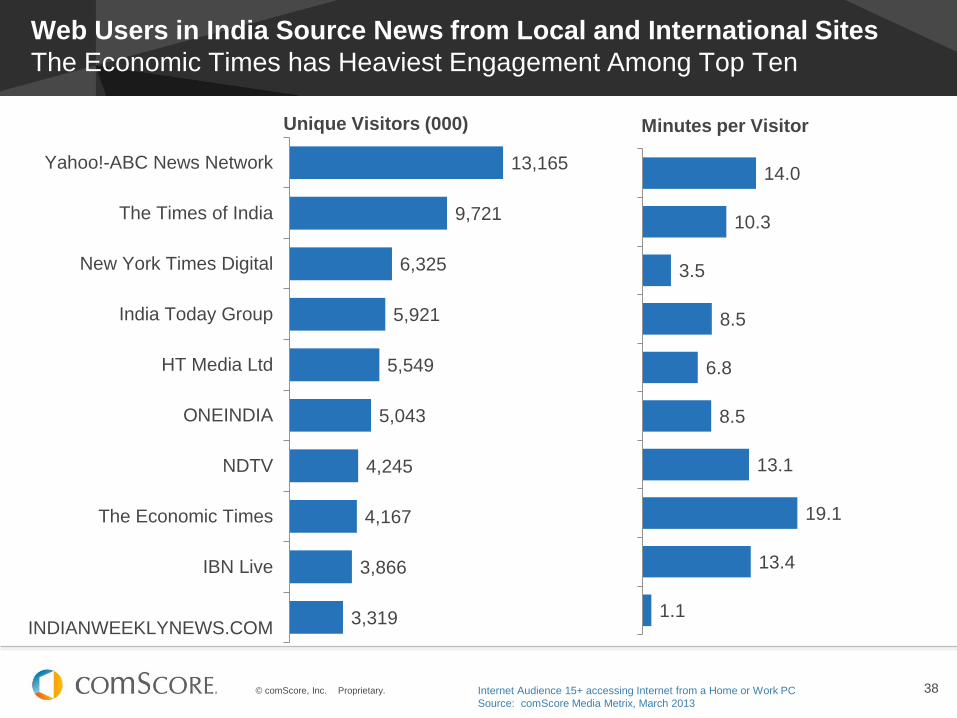
Web Users in India Source News from Local and International Sites
The Economic Times has Heaviest Engagement Among Top Ten
13,165
9,721
6,325
5,921
5,549
5,043
4,245
4,167
3,866
3,319
Yahoo!-ABC News Network
The Times of India
New York Times Digital
India Today Group
HT Media Ltd
ONEINDIA
NDTV
The Economic Times
IBN Live
INDIANWEEKLYNEWS.COM
14.0
10.3
3.5
8.5
6.8
8.5
13.1
19.1
13.4
1.1
Unique Visitors (000) Minutes per Visitor
Internet Audience 15+ accessing Internet from a Home or Work PC
Source: comScore Media Metrix, March 2013
© comScore, Inc. Proprietary. 39
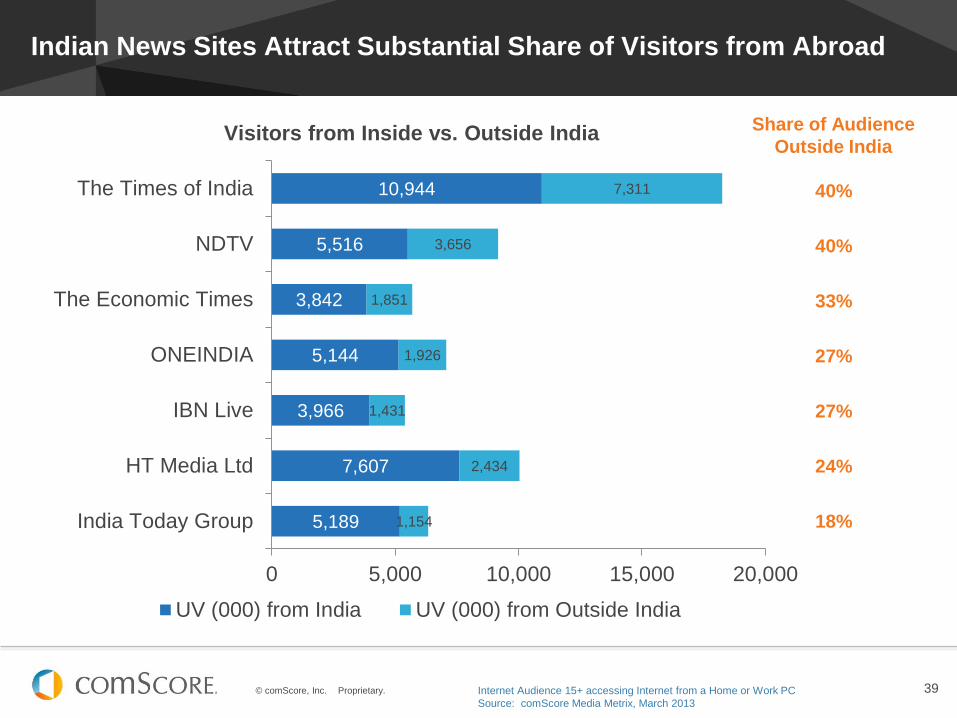
Indian News Sites Attract Substantial Share of Visitors from Abroad
5,189
7,607
3,966
5,144
3,842
5,516
10,944
1,154
2,434
1,431
1,926
1,851
3,656
7,311
0 5,000 10,000 15,000 20,000
India Today Group
HT Media Ltd
IBN Live
ONEINDIA
The Economic Times
NDTV
The Times of India
UV (000) from India UV (000) from Outside India
Visitors from Inside vs. Outside India
40%
40%
33%
27%
27%
24%
18%
Share of Audience
Outside India
Internet Audience 15+ accessing Internet from a Home or Work PC
Source: comScore Media Metrix, March 2013
© comScore, Inc. Proprietary. 40
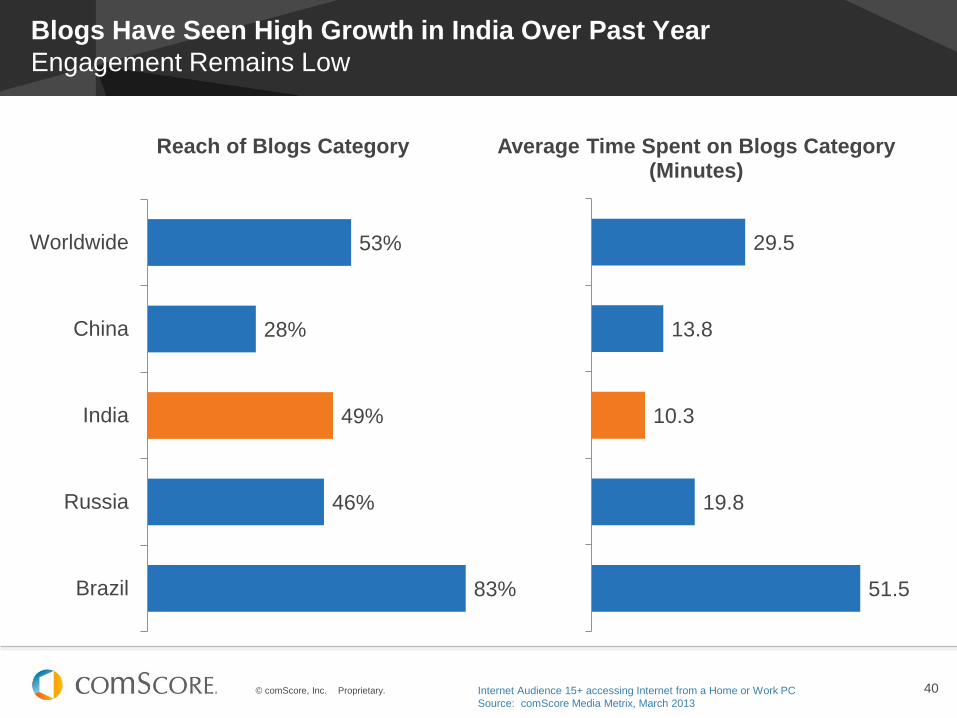
Blogs Have Seen High Growth in India Over Past Year
Engagement Remains Low
53%
28%
49%
46%
83%
Worldwide
China
India
Russia
Brazil
Reach of Blogs Category
29.5
13.8
10.3
19.8
51.5
Average Time Spent on Blogs Category (Minutes)
Internet Audience 15+ accessing Internet from a Home or Work PC
Source: comScore Media Metrix, March 2013
© comScore, Inc. Proprietary. © comScore, Inc. Proprietary.
ONLINE TRAVEL
#FutureinFocus
© comScore, Inc. Proprietary. 42
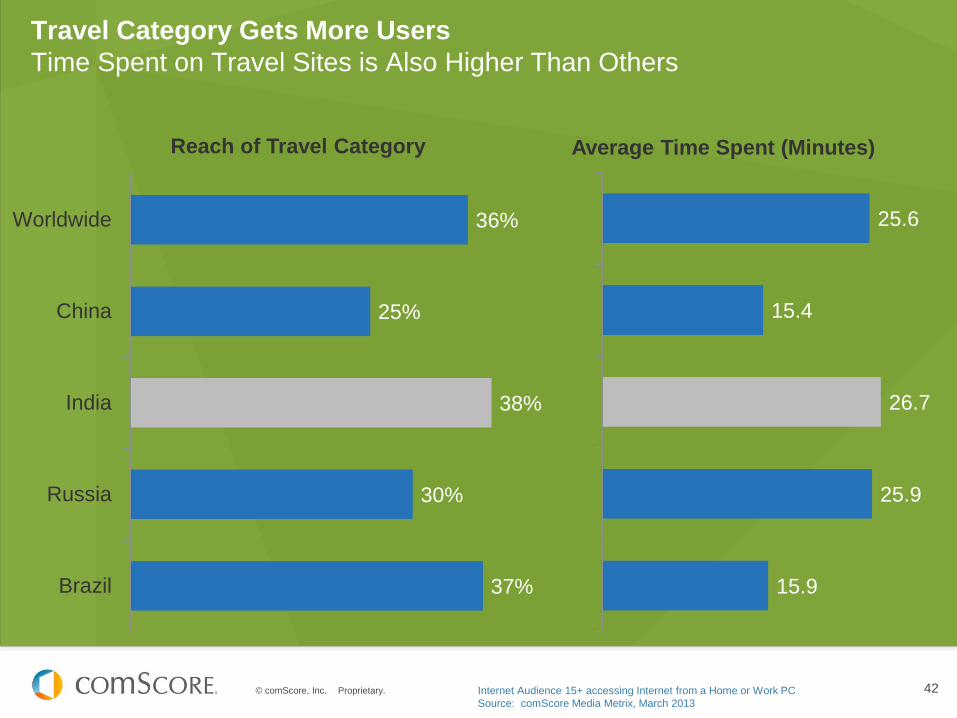
Travel Category Gets More Users
Time Spent on Travel Sites is Also Higher Than Others
36%
25%
38%
30%
37%
Worldwide
China
India
Russia
Brazil
Reach of Travel Category
25.6
15.4
26.7
25.9
15.9
Average Time Spent (Minutes)
Internet Audience 15+ accessing Internet from a Home or Work PC
Source: comScore Media Metrix, March 2013
© comScore, Inc. Proprietary. 43
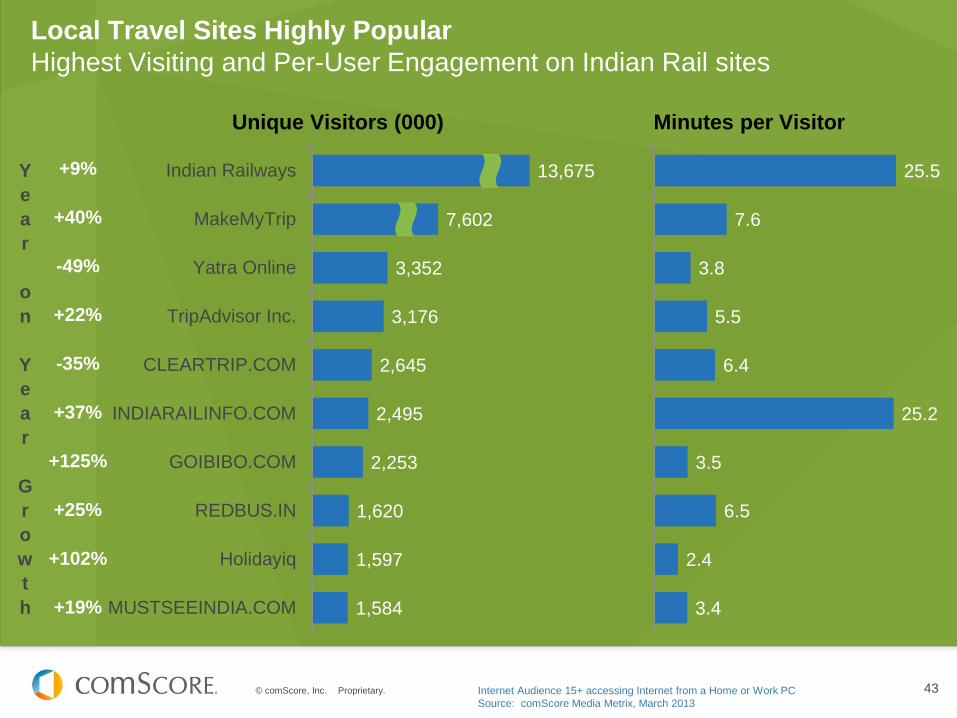
Local Travel Sites Highly Popular
Highest Visiting and Per-User Engagement on Indian Rail sites
13,675
7,602
3,352
3,176
2,645
2,495
2,253
1,620
1,597
1,584
Indian Railways
MakeMyTrip
Yatra Online
TripAdvisor Inc.
CLEARTRIP.COM
INDIARAILINFO.COM
GOIBIBO.COM
REDBUS.IN
Holidayiq
MUSTSEEINDIA.COM
25.5
7.6
3.8
5.5
6.4
25.2
3.5
6.5
2.4
3.4
Unique Visitors (000) Minutes per Visitor
Internet Audience 15+ accessing Internet from a Home or Work PC
Source: comScore Media Metrix, March 2013
Y
e
a
r
o
n
Y
e
a
r
G
r
o
w
t
h
+9%
+40%
-49%
+22%
-35%
+37%
+125%
+25%
+102%
+19%
© comScore, Inc. Proprietary. © comScore, Inc. Proprietary.
SPORTS
#FutureinFocus
© comScore, Inc. Proprietary. 45
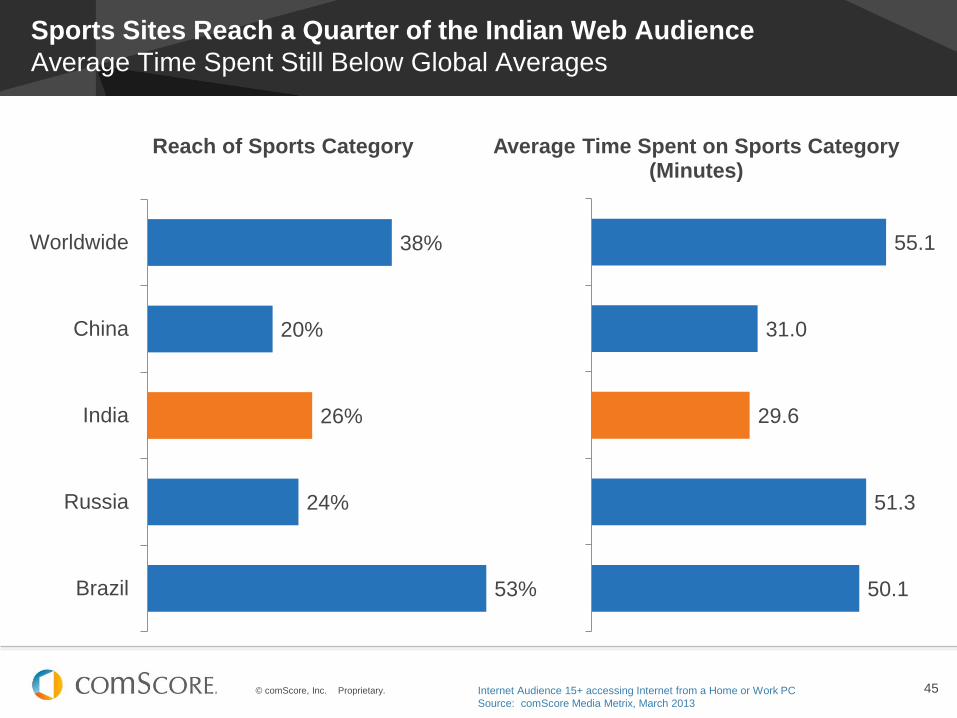
Sports Sites Reach a Quarter of the Indian Web Audience
Average Time Spent Still Below Global Averages
38%
20%
26%
24%
53%
Worldwide
China
India
Russia
Brazil
Reach of Sports Category
55.1
31.0
29.6
51.3
50.1
Average Time Spent on Sports Category (Minutes)
Internet Audience 15+ accessing Internet from a Home or Work PC
Source: comScore Media Metrix, March 2013
© comScore, Inc. Proprietary. 46
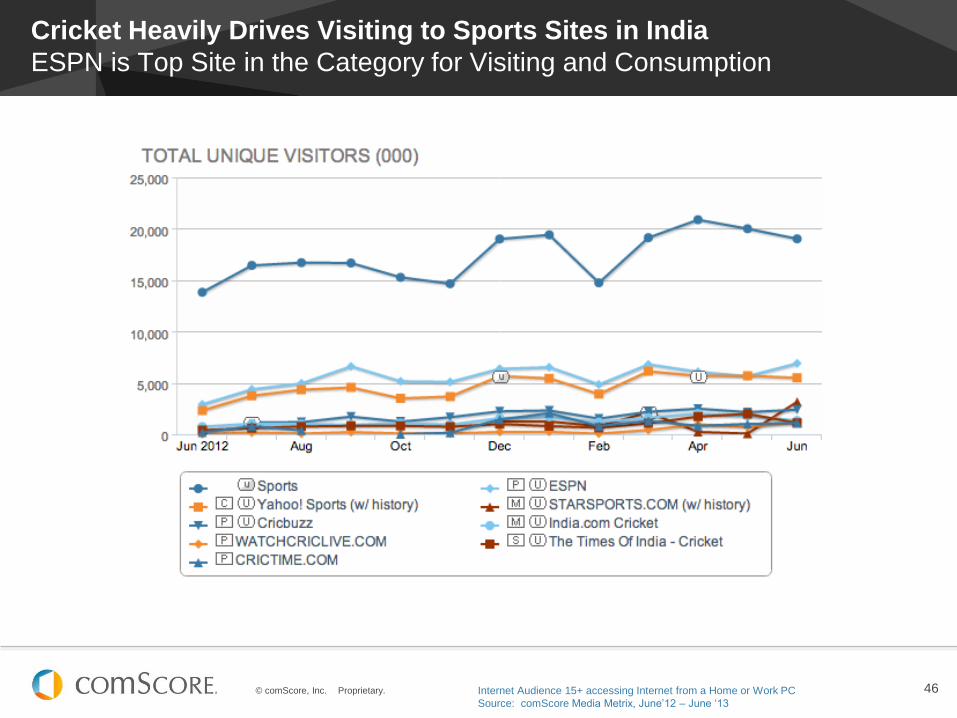
Cricket Heavily Drives Visiting to Sports Sites in India
ESPN is Top Site in the Category for Visiting and Consumption
Internet Audience 15+ accessing Internet from a Home or Work PC
Source: comScore Media Metrix, June’12 – June ‘13
© comScore, Inc. Proprietary. 47
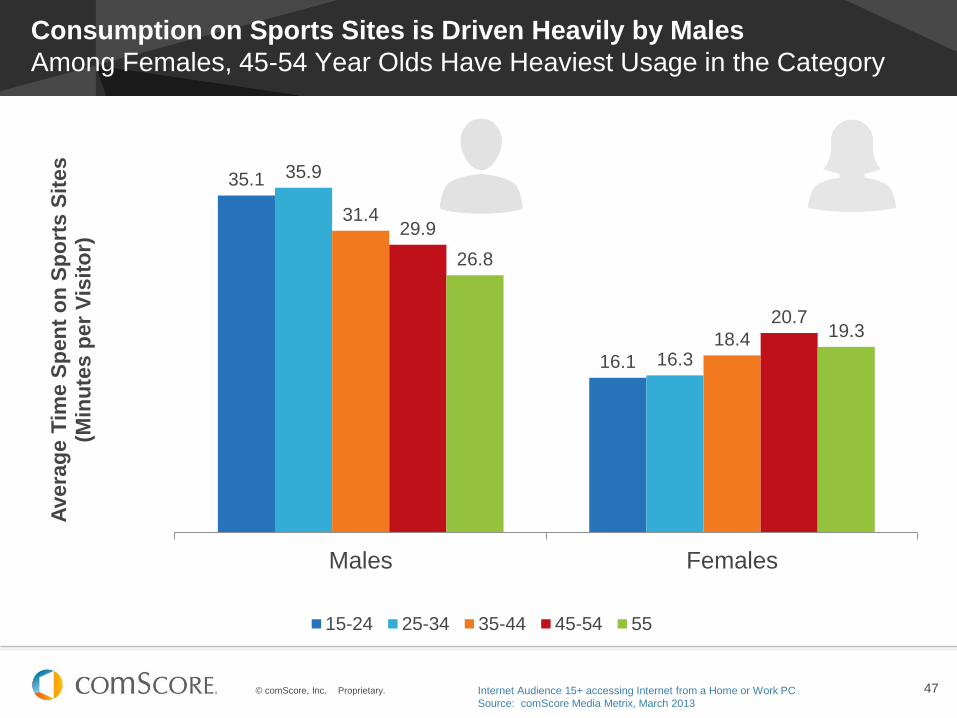
Consumption on Sports Sites is Driven Heavily by Males
Among Females, 45-54 Year Olds Have Heaviest Usage in the Category
35.1
16.1
35.9
16.3
31.4
18.4
29.9
20.7
26.8
19.3
Males Females
Avera
ge T
ime S
pen
t o
n S
po
rts S
ites
(Min
ute
s p
er
Vis
ito
r)
15-24 25-34 35-44 45-54 55
Internet Audience 15+ accessing Internet from a Home or Work PC
Source: comScore Media Metrix, March 2013
© comScore, Inc. Proprietary. © comScore, Inc. Proprietary.
REAL ESTATE
#FutureinFocus
© comScore, Inc. Proprietary. 49
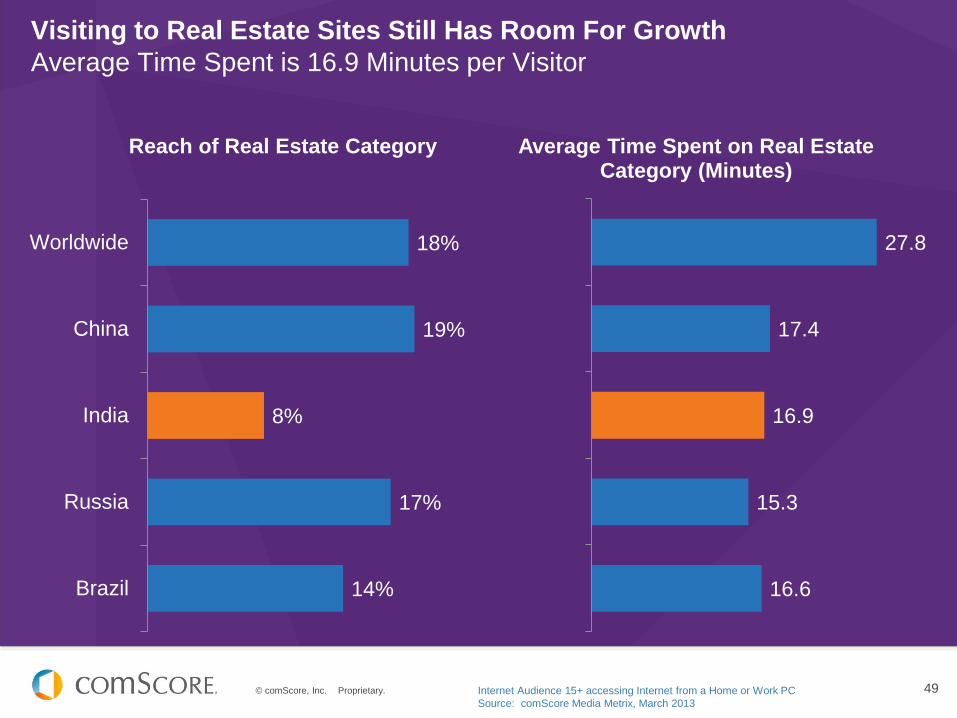
Visiting to Real Estate Sites Still Has Room For Growth
Average Time Spent is 16.9 Minutes per Visitor
18%
19%
8%
17%
14%
Worldwide
China
India
Russia
Brazil
Reach of Real Estate Category
27.8
17.4
16.9
15.3
16.6
Average Time Spent on Real Estate Category (Minutes)
Internet Audience 15+ accessing Internet from a Home or Work PC
Source: comScore Media Metrix, March 2013
© comScore, Inc. Proprietary. 50
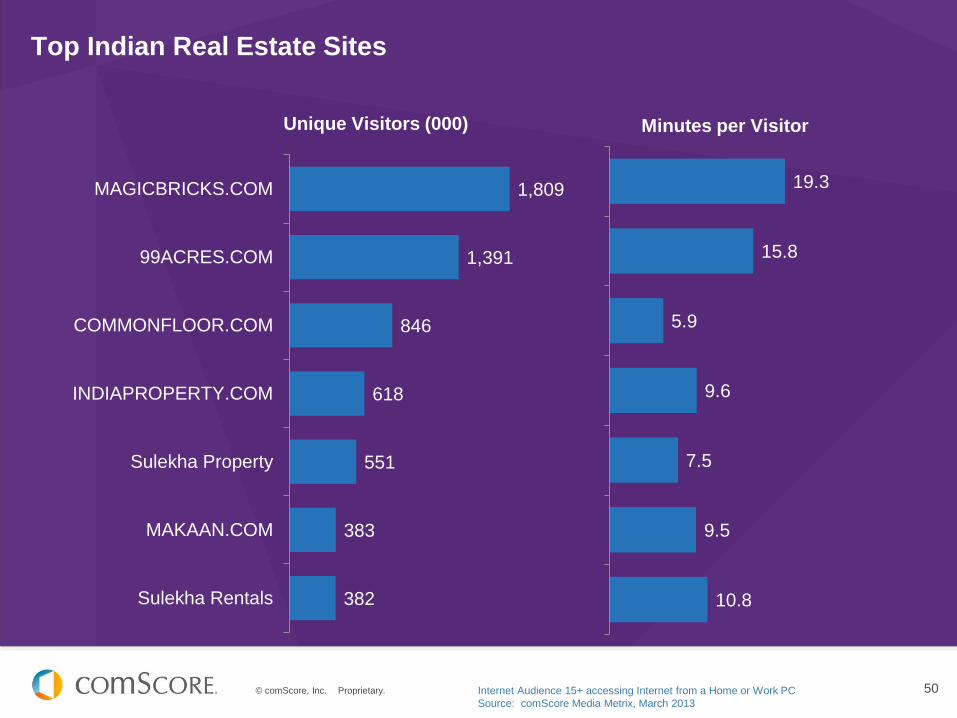
Top Indian Real Estate Sites
1,809
1,391
846
618
551
383
382
MAGICBRICKS.COM
99ACRES.COM
COMMONFLOOR.COM
INDIAPROPERTY.COM
Sulekha Property
MAKAAN.COM
Sulekha Rentals
19.3
15.8
5.9
9.6
7.5
9.5
10.8
Unique Visitors (000) Minutes per Visitor
Internet Audience 15+ accessing Internet from a Home or Work PC
Source: comScore Media Metrix, March 2013
© comScore, Inc. Proprietary. 51
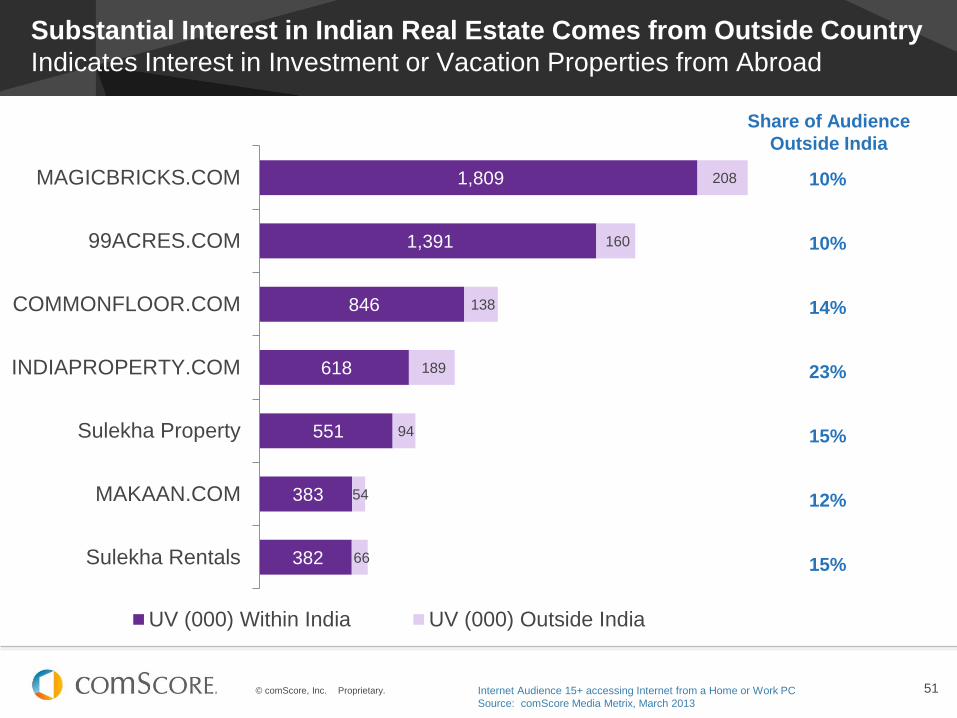
Substantial Interest in Indian Real Estate Comes from Outside Country
Indicates Interest in Investment or Vacation Properties from Abroad
Internet Audience 15+ accessing Internet from a Home or Work PC
Source: comScore Media Metrix, March 2013
382
383
551
618
846
1,391
1,809
66
54
94
189
138
160
208
Sulekha Rentals
MAKAAN.COM
Sulekha Property
INDIAPROPERTY.COM
COMMONFLOOR.COM
99ACRES.COM
MAGICBRICKS.COM
UV (000) Within India UV (000) Outside India
10%
10%
14%
23%
15%
12%
15%
Share of Audience
Outside India
© comScore, Inc. Proprietary. © comScore, Inc. Proprietary.
SEARCH
#FutureinFocus
© comScore, Inc. Proprietary. 53
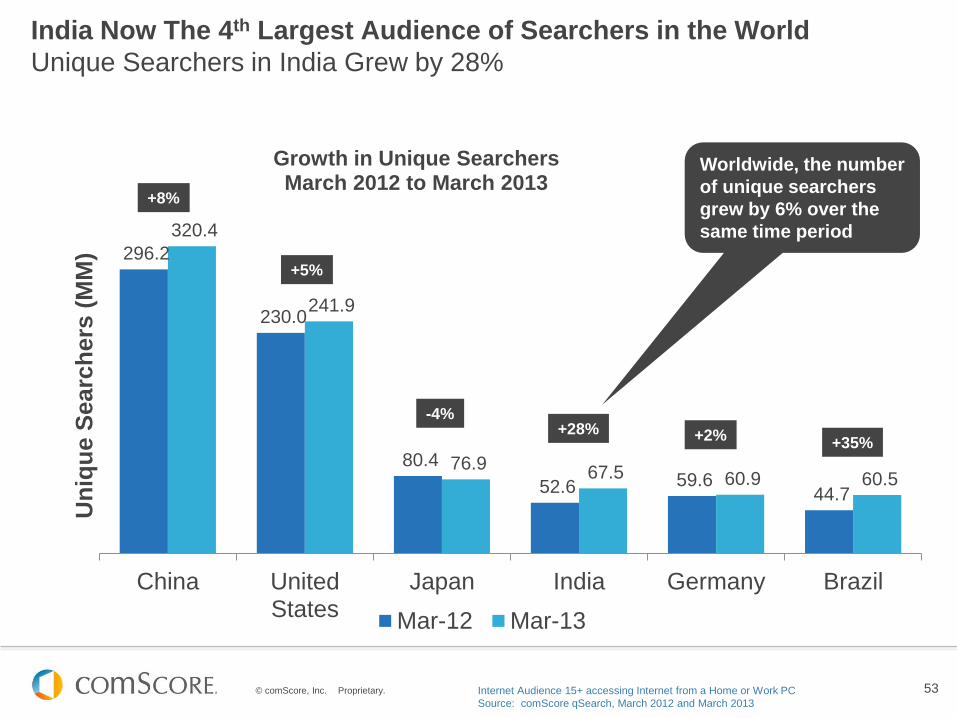
296.2
230.0
80.4
52.6 59.6 44.7
320.4
241.9
76.9 67.5 60.9 60.5
China UnitedStates
Japan India Germany Brazil
Un
iqu
e S
earc
hers
(M
M)
Growth in Unique Searchers March 2012 to March 2013
Mar-12 Mar-13
India Now The 4th Largest Audience of Searchers in the World
Unique Searchers in India Grew by 28%
Internet Audience 15+ accessing Internet from a Home or Work PC
Source: comScore qSearch, March 2012 and March 2013
+8%
+5%
-4% +28% +2%
Worldwide, the number
of unique searchers
grew by 6% over the
same time period
+35%
© comScore, Inc. Proprietary. 54
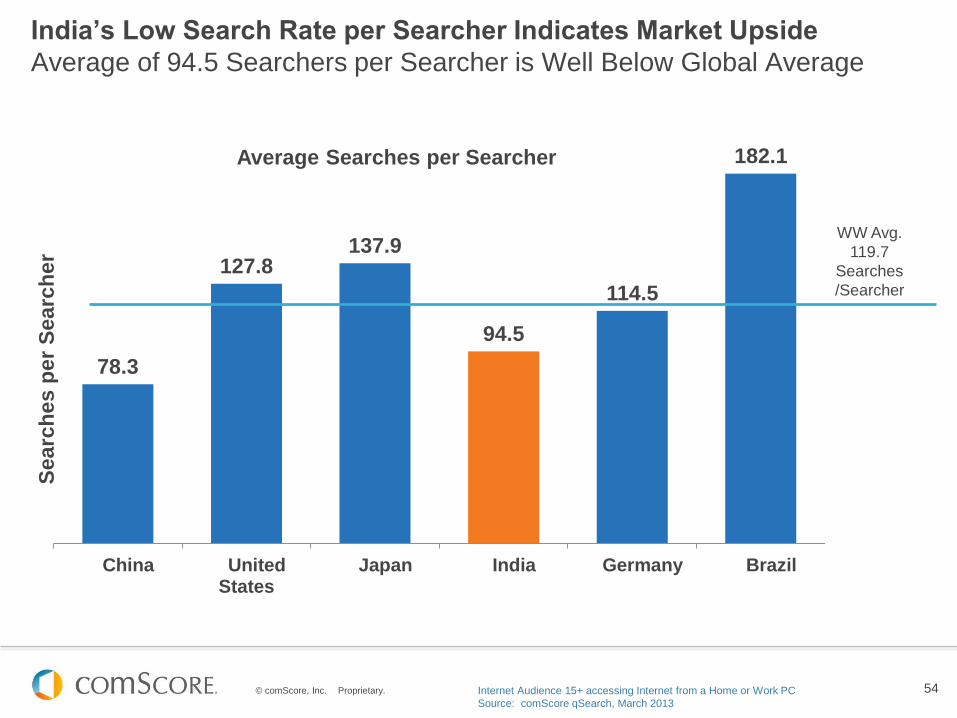
India’s Low Search Rate per Searcher Indicates Market Upside
Average of 94.5 Searchers per Searcher is Well Below Global Average
78.3
127.8 137.9
94.5
114.5
182.1
China UnitedStates
Japan India Germany Brazil
Searc
hes p
er
Searc
her
Average Searches per Searcher
Internet Audience 15+ accessing Internet from a Home or Work PC
Source: comScore qSearch, March 2013
WW Avg.
119.7
Searches
/Searcher
© comScore, Inc. Proprietary. 55
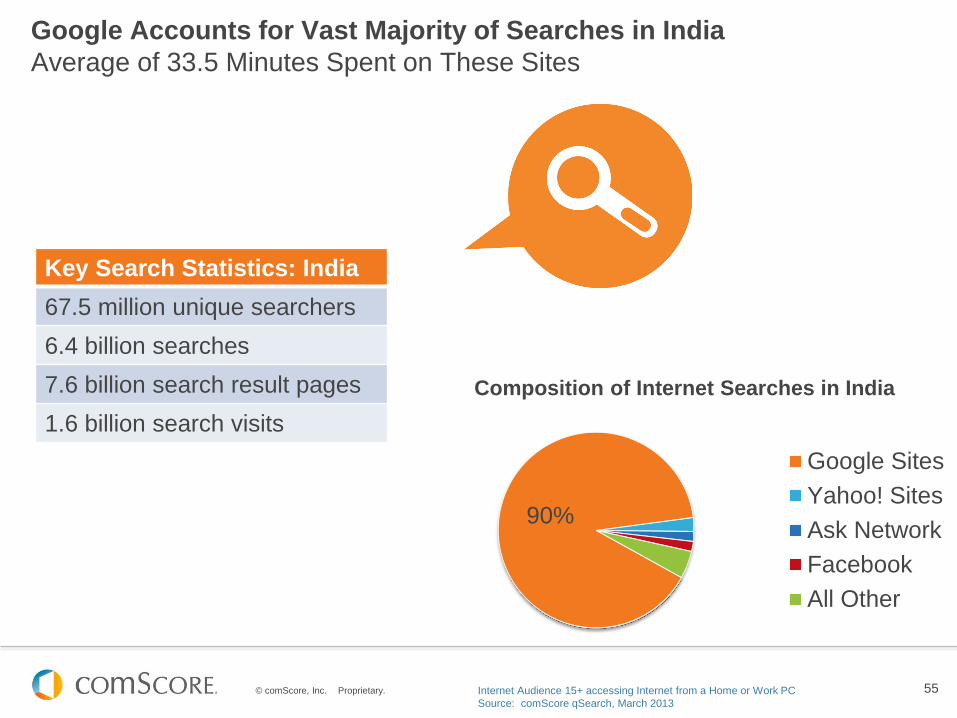
Google Accounts for Vast Majority of Searches in India
Average of 33.5 Minutes Spent on These Sites
90%
Composition of Internet Searches in India
Google Sites
Yahoo! Sites
Ask Network
All Other
Key Search Statistics: India
67.5 million unique searchers
6.4 billion searches
7.6 billion search result pages
1.6 billion search visits
Internet Audience 15+ accessing Internet from a Home or Work PC
Source: comScore qSearch, March 2013
© comScore, Inc. Proprietary. © comScore, Inc. Proprietary.
CONCLUSION
#FutureinFocus
© comScore, Inc. Proprietary. 57
2013: Putting the Future in Focus
ADAPTABLE ANALYTICS REQUIRED
This past year saw digital media’s continued rise
in prominence as part of peoples’ personal lives
and in business environments. Consumers are
quickly becoming platform agnostic in their digital
media consumption and in today’s world they can
choose when and how they’d like to consume
content. It might be that they started watching a
film at home on their TV, continued watching it on
their smartphone on the way to work, and finished
watching it in bed at night on their tablet.
It’s the pinnacle of convenience for consumers,
but an utter headache from an audience
measurement and advertising analytics
standpoint. comScore has adapted to this
changing digital world to become a trusted
resource for understanding cross-platform
consumer behaviour and enabling multi-platform
unification of all data.
Consumers have already adopted multiple
platforms and devices – now it’s the businesses
who need to follow if they desire a unified,
platform-agnostic view of consumer behaviour.
© comScore, Inc. Proprietary. 58
2013: Putting the Future in Focus
MULTI-PLATFORM TAKES CENTER STAGE
With the platform shift in full swing, businesses will
be challenged in the coming year to stay ahead of
consumers’ usage curve and deliver them with the
content they want, when and where they want it. It
will also be imperative to maintain revenue
streams in the core digital channels while
capturing market share and monetizing emerging
channels. Doing so will require businesses to get
even smarter in how they scale their content to
other platforms by developing integration
strategies that deliver unique offerings to
advertisers.
Integration between delivery of content and the
ability to deliver campaigns in a multi-platform
fashion remains a challenge, but the companies
who facilitate this form of platform agnostic
strategy will enhance value to marketers,
simplify campaign management for agencies
and foster greater pricing equilibrium between
their content channels. As the bridge between
traditional and digital platforms, online video will
play an important leading role in how these
integration strategies materialize.
© comScore, Inc. Proprietary. 59
2013: Putting the Future in Focus
VALIDATION MATTERS
In the last quarter (Apr-Jun’13) more than 111
billion display ad impressions were delivered
across India’s websites. This number, set to go up
by approximately 20% over a year, indicates an
increasing level of comfort with a medium capable
of delivering strong marketing ROI.
While delivering advertising at scale remains
important, an increased premium on accountability
and performance means advertisers may be
sacrificing quantity for quality – whether that
means leveraging more rich media, experimenting
with larger ad units, or demanding ad viewability.
comScore’s vCE benchmark study about
viewable impressions over 1000’s of
campaigns, showed that an average of 54%
ads were never actually seen by their target
audiences. It is more important than ever for
advertisers to evaluate campaign viewability to
improve optimisation and maximise the return
on their media spend.
Look for advertisers to demand more
accountability and publishers to reconfigure site
design and ad inventory to improve
performance in the coming year.
© comScore, Inc. Proprietary. 60
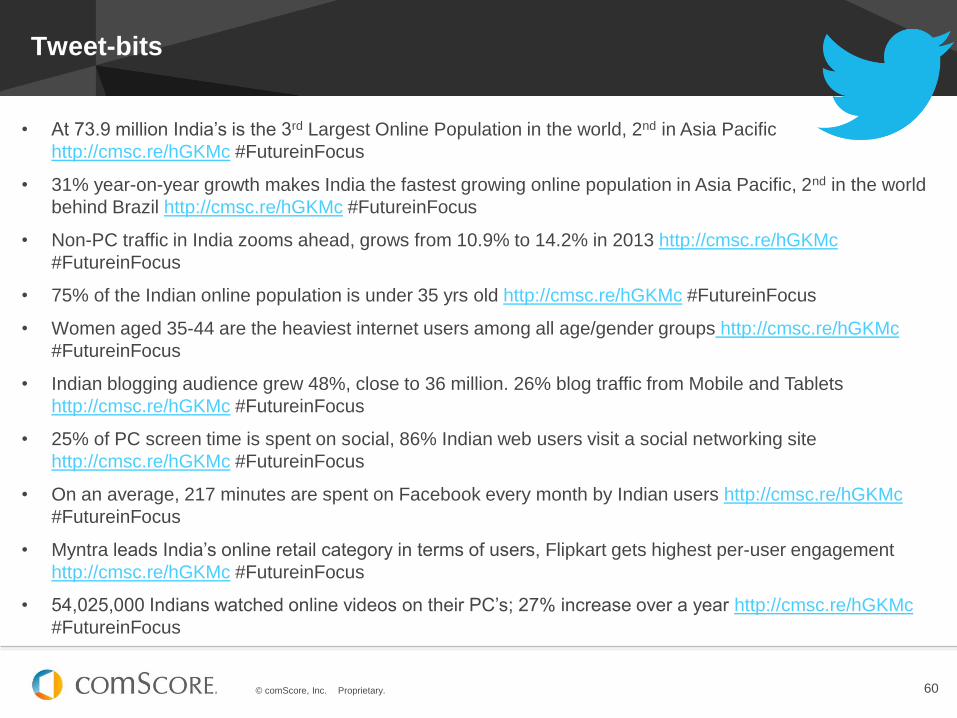
Tweet-bits
• At 73.9 million India’s is the 3rd Largest Online Population in the world, 2nd in Asia Pacific
http://cmsc.re/hGKMc #FutureinFocus
• 31% year-on-year growth makes India the fastest growing online population in Asia Pacific, 2nd in the world
behind Brazil http://cmsc.re/hGKMc #FutureinFocus
• Non-PC traffic in India zooms ahead, grows from 10.9% to 14.2% in 2013 http://cmsc.re/hGKMc
#FutureinFocus
• 75% of the Indian online population is under 35 yrs old http://cmsc.re/hGKMc #FutureinFocus
• Women aged 35-44 are the heaviest internet users among all age/gender groups http://cmsc.re/hGKMc
#FutureinFocus
• Indian blogging audience grew 48%, close to 36 million. 26% blog traffic from Mobile and Tablets
http://cmsc.re/hGKMc #FutureinFocus
• 25% of PC screen time is spent on social, 86% Indian web users visit a social networking site
http://cmsc.re/hGKMc #FutureinFocus
• On an average, 217 minutes are spent on Facebook every month by Indian users http://cmsc.re/hGKMc
#FutureinFocus
• Myntra leads India’s online retail category in terms of users, Flipkart gets highest per-user engagement
http://cmsc.re/hGKMc #FutureinFocus
• 54,025,000 Indians watched online videos on their PC’s; 27% increase over a year http://cmsc.re/hGKMc
#FutureinFocus

© comScore, Inc. Proprietary. © comScore, Inc. Proprietary.
METHODOLOGY
#FutureinFocus
© comScore, Inc. Proprietary. 62
Methodology and Definitions
This report utilises data from the comScore suite of products, including
comScore MMX Multi-Platform (Beta), comScore qSearch, comScore
Video Metrix, comScore MobiLens, and comScore Device Essentials.
comScore MMX
The comScore MMX suite of syndicated products sets the standard for
digital audience measurement and media planning. Powered by Unified
Digital Measurement™, the revolutionary measurement approach that
bridges panel-based and website server-based metrics to account for 100
percent of a site’s audience, MMX delivers the most accurate and
comprehensive suite of audience metrics, providing valuable demographic
measures, such as age, gender, household income and household size.
MMX reports on more than 70,000 entities, with audience measurement for
43 individual countries and 6 global regions, as well as worldwide totals.
The comScore MMX product suite includes individual products utilised
within this report including comScore MMX Multi-Platform (Beta),
comScore qSearch, comScore Ad Metrix and comScore Video Metrix.
http://www.comscore.com/Products/Audience_Analytics/MMX
© comScore, Inc. Proprietary. 63
comScore, Inc. (NASDAQ: SCOR) is a global leader in digital measurement and analytics, delivering insights on web,
mobile and TV consumer behaviour that enable clients to maximise the value of their digital investments.
A preferred source of digital audience measurement, comScore offers a variety of on-demand software and custom
services within its four analytics pillars: Audience Analytics, Advertising Analytics, Digital Business Analytics and
Mobile Operator Analytics. By leveraging a world-class technology infrastructure, the comScore Census Network™
(CCN) captures trillions of digital interactions a month to power big data analytics on a global scale for its more than
2,000 clients, which include leading companies such as AOL, Baidu, BBC, Best Buy, Carat, Deutsche Bank, ESPN,
France Telecom, Financial Times, Fox, LinkedIn, Microsoft, MediaCorp, Nestle, Starcom, Terra Networks, Universal
McCann, Verizon, ViaMichelin and Yahoo!.
STAY CONNECTED
www.comscore.com
www.facebook.com/comscoreinc
www.linkedin.com/company/comscore-inc
www.youtube.com/user/comscore
ABOUT COMSCORE
© comScore, Inc. Proprietary. © comScore, Inc. Proprietary.
www.comscore.com
www.facebook.com/comscoreinc
@comScore
India Digital
Future in Focus 2013
#FutureinFocus
Key Insights and Digital Trends from India
@comScoreAPAC
www.comscore.com
www.facebook.com/comscoreinc
Email:
Media Requests: [email protected]