kevin mcmullen why omnova solutions? a look … omnova solutions? a look forward global innovator of...
TRANSCRIPT
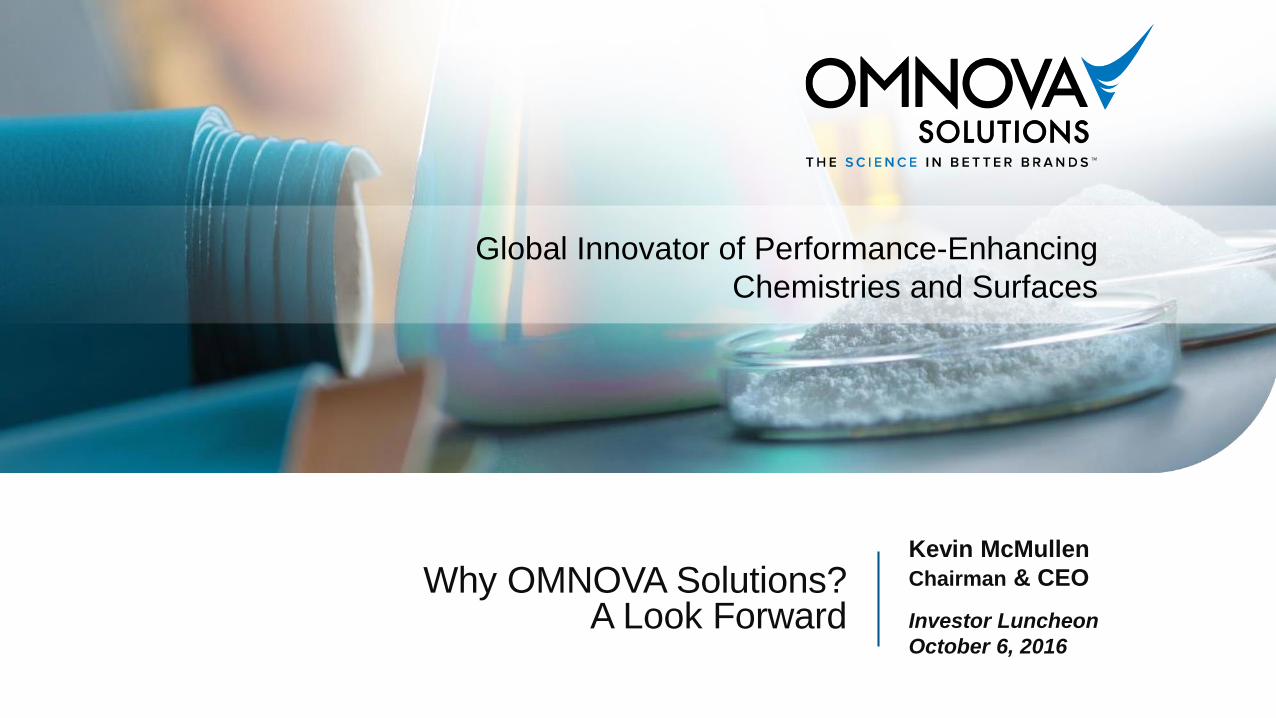
Why OMNOVA Solutions?A Look Forward
Global Innovator of Performance-Enhancing
Chemistries and Surfaces
Kevin McMullen
Chairman & CEO
Investor Luncheon
October 6, 2016
Cautionary Statements
2
Forward-Looking Statements
Today’s presentations include descriptions of OMNOVA's current business, operations, assets and other matters affecting the Company as well as "forward-looking statements" as defined by federal securities laws. All forward-looking statements by the Company, including verbal statements, are intended to qualify for the protections afforded forward-looking statements under the Private Securities Litigation Reform Act of 1995. Forward-looking statements reflect management's current expectation, judgment, belief, assumption, estimate or forecast about future events, circumstances or results and may address business conditions and prospects, strategy, capital structure, debt and cash levels, sales, profits, earnings, markets, products, technology, operations, customers, raw materials, claims and litigation, financial condition, and accounting policies among other matters. Words such as, but not limited to, "will," "may," "should," "projects," "forecasts," "seeks," "believes," "expects," "anticipates," "estimates," "intends," "plans," "targets," "optimistic," "likely," "would," "could," "committed," and similar expressions or phrases identify forward-looking statements.
All descriptions of OMNOVA's current business, operations and assets, as well as all forward-looking statements, involve risks and uncertainties. Many risks and uncertainties are inherent in business generally. Other risks and uncertainties are more specific to the Company's businesses and strategy, or to any new businesses the Company may enter into or acquire. There also may be risks and uncertainties not currently known to the Company. The occurrence of any such risks and uncertainties and the impact of such occurrences is often not predictable or within the Company's control. Such impacts could adversely affect the Company's business, operations or assets as well as the Company's results and the value of your investment in the Company. In some cases, such impact could be material. Certain risks and uncertainties facing the Company are described below or in the Company's Quarterly Report on Form 10-Q and Annual Report and the value of your investment in the Company on Form 10-K.
All written and verbal descriptions of OMNOVA's current business, operations and assets and all forward-looking statements attributable to the Company or any person acting on the Company's behalf are expressly qualified in their entirety by the risks, uncertainties, and cautionary statements contained or referenced herein. All such descriptions and any forward-looking statement speak only as of the date on which such description or statement is made, and the Company undertakes no obligation, and specifically declines any obligation, other than that imposed by law, to publicly update or revise any such description or forward-looking statements whether as a result of new information, future events or otherwise.
The Company's actual results and the value of your investment in OMNOVA may differ, perhaps materially, from expectations due to a number of risks and uncertainties including, but not limited to: (1) the Company's exposure to general economic, business, and industry conditions; (2) the risk of doing business in foreign countries and markets; (3) changes in raw material prices and availability; (4) the highly competitive markets the Company serves; (5) extraordinary events such as natural disasters, political disruptions, terrorist attacks and acts of war; (6) extensive and increasing United States and international governmental regulation, including environmental, health and safety regulations; (7) the Company's failure to protect its intellectual property or defend itself from intellectual property claims; (8) claims and litigation; (9) changes in accounting policies, standards, and interpretations; (10) the actions of activist shareholders; (11) the Company's inability to achieve, or achieve in a timely manner, the objectives and benefits of cost reduction initiatives; (12) the Company's ability to develop and commercialize new products at competitive prices; (13) the concentration of OMNOVA's Performance Chemicals business and certain Engineered Surfaces market segments, among several large customers; (14) the creditworthiness of the Company's customers; (15) the failure of a joint venture partner to meet its commitments; (16) the Company's ability to identify and complete strategic transactions; (17) the Company's ability to successfully integrate acquired companies; (18) unanticipated capital expenditures; (19) risks associated with the use, production, storage, and transportation of chemicals; (20) information system failures and breaches in security; (21) continued increases in healthcare costs; (22) the Company's ability to retain or attract key employees; (23) the Company's ability to renew collective bargaining agreements with employees on acceptable terms and the risk of work stoppages; (24) the Company's contribution obligations under its U.S. pension plan; (25) the Company's reliance on foreign financial institutions to hold some of its funds; (26) the effect of goodwill impairment charges; (27) the volatility in the market price of the Company's common shares; (28) the Company's substantial debt position; (29) the decision to incur additional debt; (30) the operational and financial restrictions contained in the Company's indenture; (31) a default under the Company's term loan or revolving credit facility; and (32) the Company's ability to generate sufficient cash to service its outstanding debt.
OMNOVA Solutions provides greater detail regarding these risks and uncertainties in its 2015 Form 10-K and subsequent filings, which are available online at www.omnova.com and www.sec.gov.
OMNOVA Solutions Inc. is a global innovator of performance-enhancing chemistries and surfaces used in products for a variety of commercial, industrial and residential applications. As a strategic business-to-business supplier, OMNOVA provides The Science in Better Brands, with emulsion polymers, specialty chemicals, and functional and decorative surfaces that deliver critical performance attributes to top brand-name, end-use products sold around the world. OMNOVA's sales for the fiscal year ended August 31, 2016, were $773 million. The Company has a global workforce of approximately 1,950. Visit OMNOVA Solutions on the internet at www.omnova.com.
Non-GAAP Financial Measures
Today’s presentations refer to certain non-GAAP financial measures as defined by the Securities and Exchange Commission, such as Adjusted Segment Operating Profit, Adjusted Segment EBITDA, Adjusted Income from Continuing Operations, Adjusted Diluted Earnings Per Share from Continuing Operations, Adjusted Consolidated EBITDA and Net Leverage Ratio. For a reconciliation to the most directly comparable GAAP financial measures, refer to the Appendix.

3

4

5

6
7
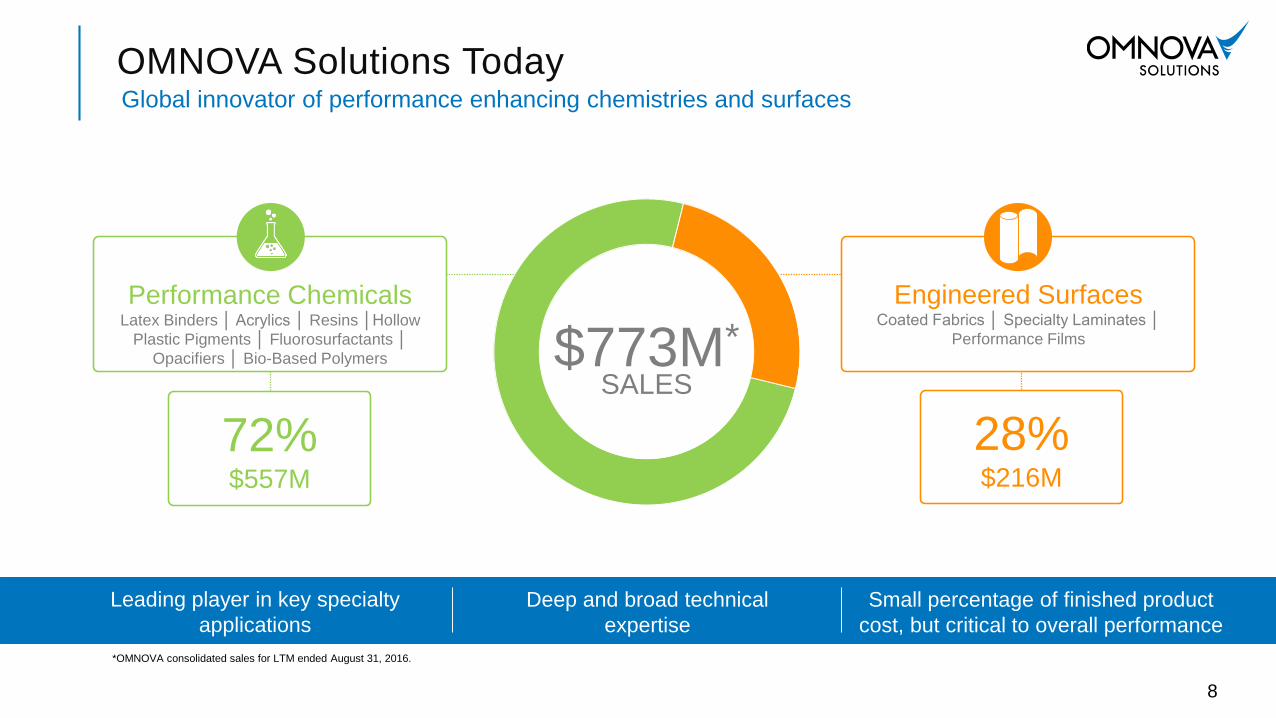
OMNOVA Solutions Today Global innovator of performance enhancing chemistries and surfaces
8
$773M*
SALES
26%
Performance ChemicalsLatex Binders │ Acrylics │ Resins │Hollow
Plastic Pigments │ Fluorosurfactants │
Opacifiers │ Bio-Based Polymers
Engineered SurfacesCoated Fabrics │ Specialty Laminates │
Performance Films
*OMNOVA consolidated sales for LTM ended August 31, 2016.
Deep and broad technical
expertise
Leading player in key specialty
applications
Small percentage of finished product
cost, but critical to overall performance
28%$216M
72%$557M
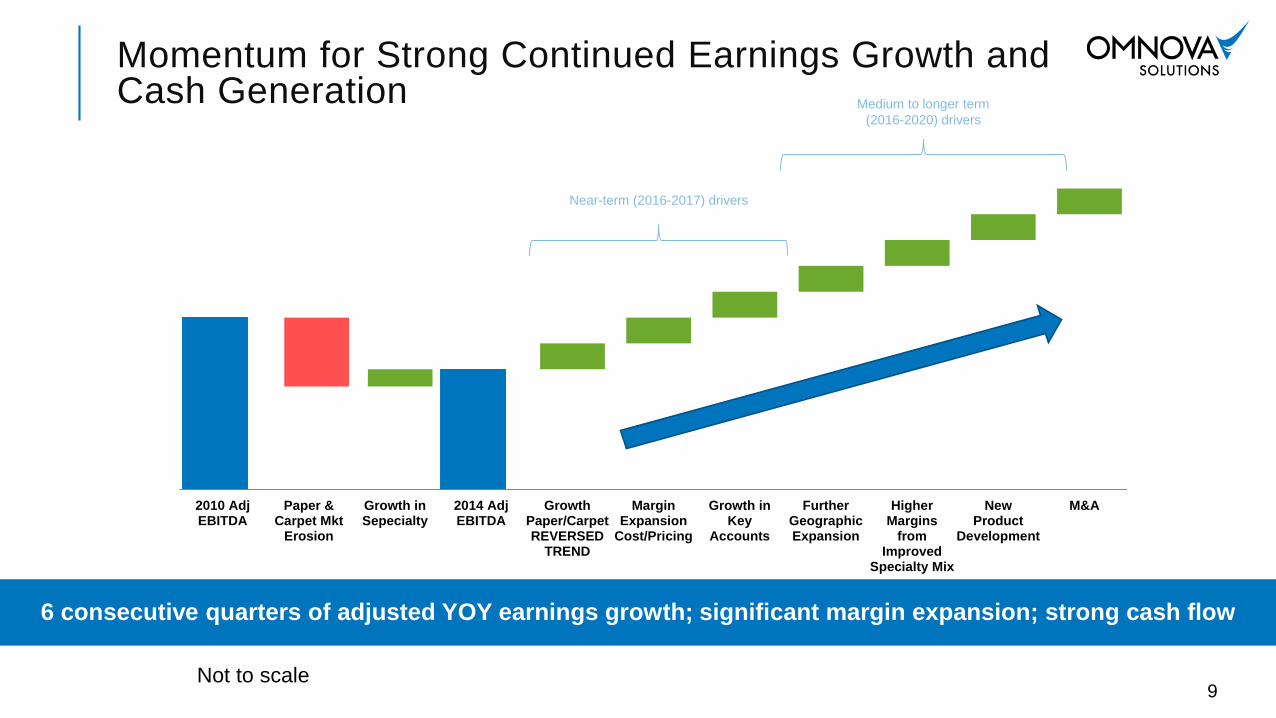
2010 AdjEBITDA
Paper &Carpet Mkt
Erosion
Growth inSepecialty
2014 AdjEBITDA
GrowthPaper/CarpetREVERSED
TREND
MarginExpansion
Cost/Pricing
Growth inKey
Accounts
FurtherGeographicExpansion
HigherMargins
fromImproved
Specialty Mix
NewProduct
Development
M&A
Momentum for Strong Continued Earnings Growth and Cash Generation
9
6 consecutive quarters of adjusted YOY earnings growth; significant margin expansion; strong cash flow
Not to scale
Near-term (2016-2017) drivers
Medium to longer term
(2016-2020) drivers
10
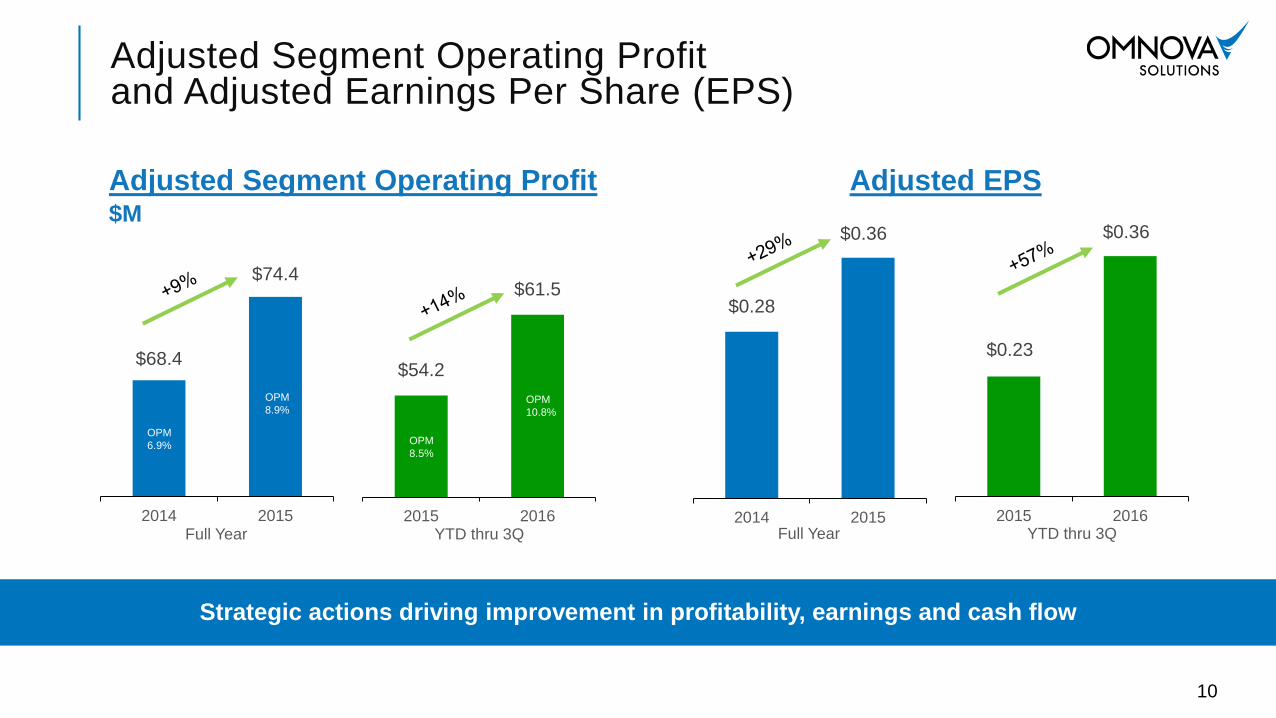
Adjusted Segment Operating Profit and Adjusted Earnings Per Share (EPS)
Strategic actions driving improvement in profitability, earnings and cash flow
Adjusted Segment Operating Profit Adjusted EPS
$68.4
$74.4
2014 2015
$M
$54.2
$61.5
2015 2016Full Year YTD thru 3Q
$0.28
$0.36
2014 2015Full Year YTD thru 3Q
$0.23
$0.36
2015 2016
OPM
6.9%
OPM
8.9%
OPM
8.5%
OPM
10.8%
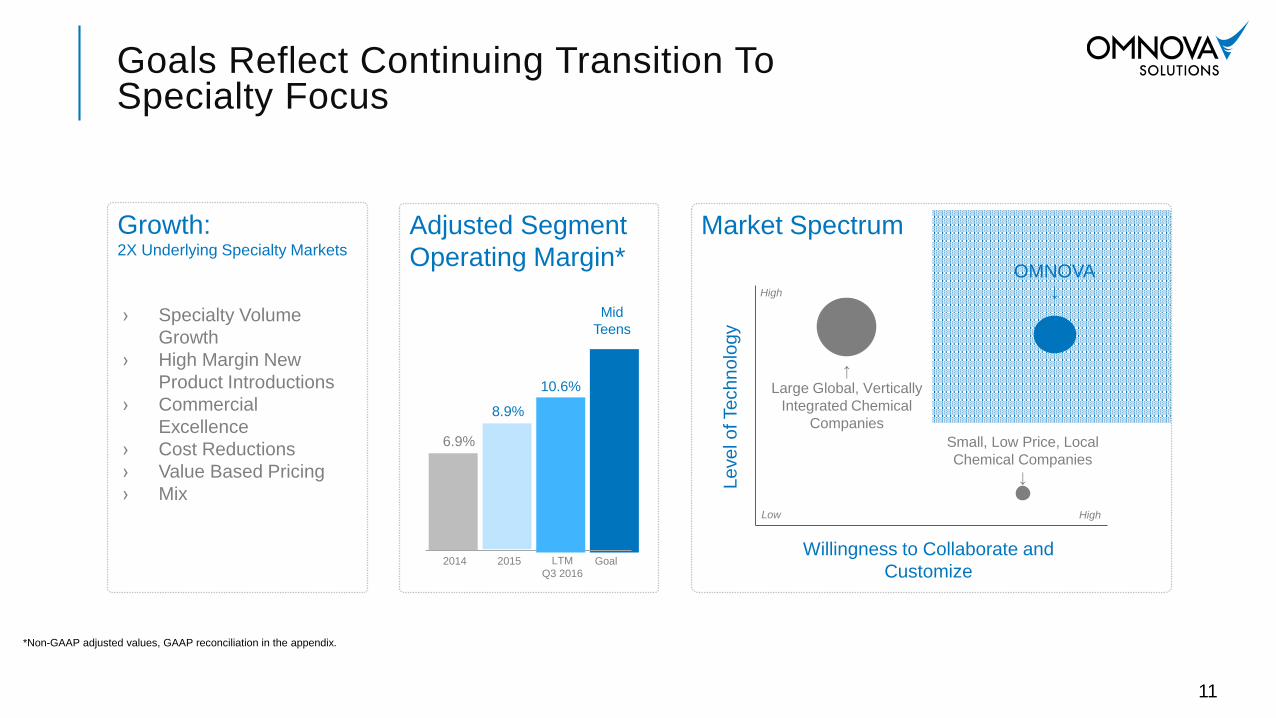
Goals Reflect Continuing Transition To Specialty Focus
Adjusted Segment
Operating Margin*
6.9%
8.9%
Mid
Teens
*Non-GAAP adjusted values, GAAP reconciliation in the appendix.
11
2014 2015 Goal
Growth:2X Underlying Specialty Markets
› Specialty Volume
Growth
› High Margin New
Product Introductions
› Commercial
Excellence
› Cost Reductions
› Value Based Pricing
› Mix
Market Spectrum
Small, Low Price, Local
Chemical Companies
↓Le
ve
l o
f Te
ch
no
log
y
Willingness to Collaborate and
Customize
HighLow
High
↑
Large Global, Vertically
Integrated Chemical
Companies
OMNOVA↓
10.6%
LTM
Q3 2016
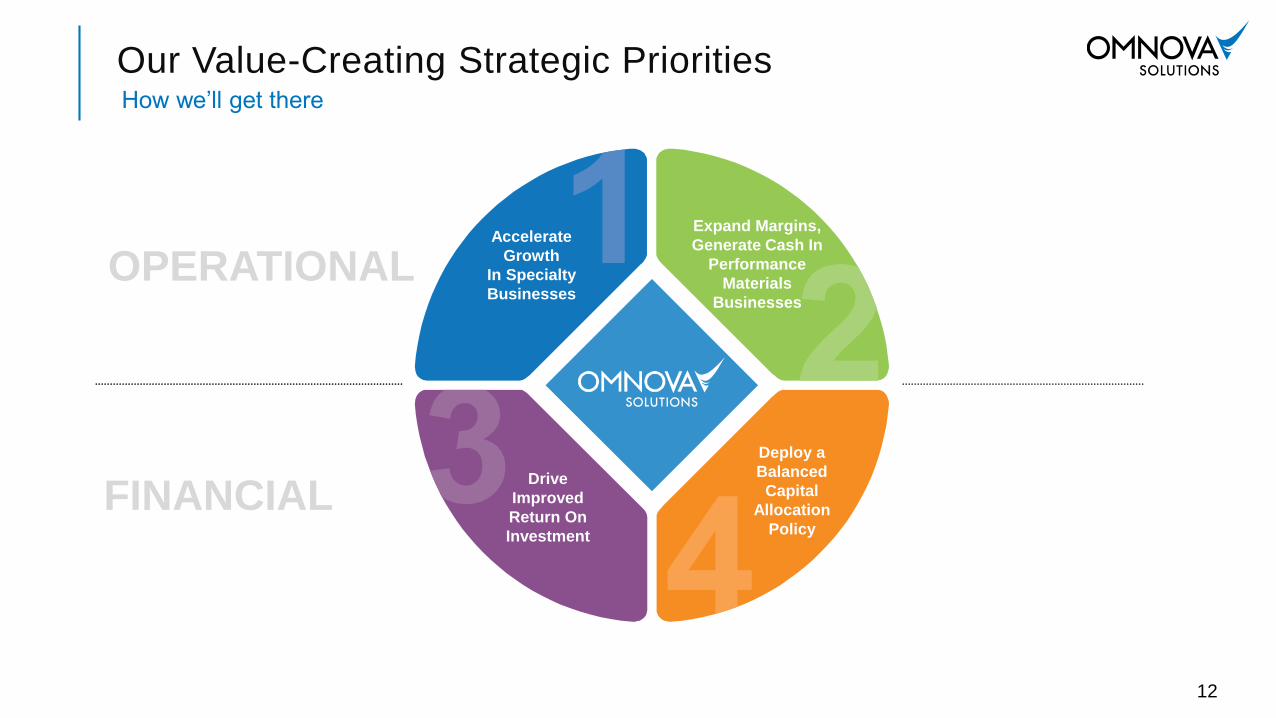
Drive
Improved
Return On
Investment
Accelerate
Growth
In Specialty
Businesses
Deploy a
Balanced
Capital
Allocation
Policy
Our Value-Creating Strategic PrioritiesHow we’ll get there
12
OPERATIONAL
FINANCIAL
Expand Margins,
Generate Cash In
Performance
Materials
Businesses
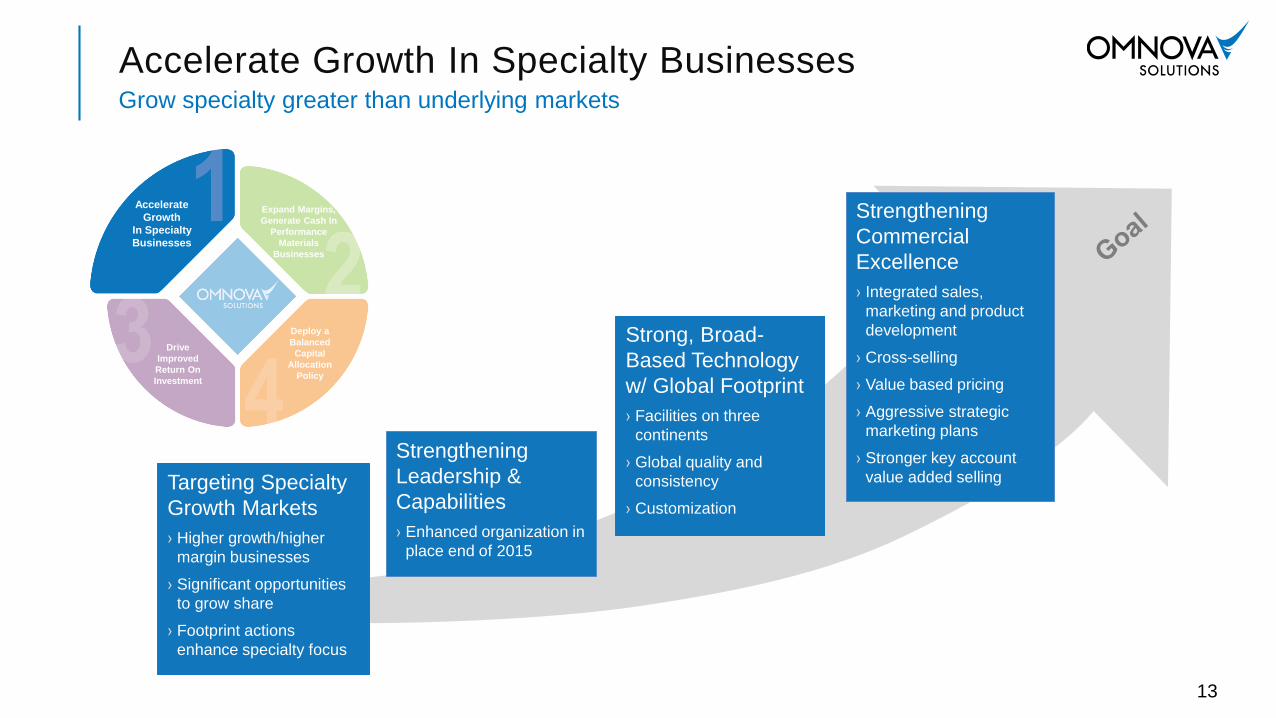
Accelerate Growth In Specialty BusinessesGrow specialty greater than underlying markets
13
Targeting Specialty
Growth Markets
› Higher growth/higher
margin businesses
› Significant opportunities
to grow share
› Footprint actions
enhance specialty focus
Strengthening
Commercial
Excellence
› Integrated sales,
marketing and product
development
› Cross-selling
› Value based pricing
› Aggressive strategic
marketing plans
› Stronger key account
value added selling
Accelerate
Growth
In Specialty
Businesses
Strengthening
Leadership &
Capabilities
› Enhanced organization in
place end of 2015
Strong, Broad-
Based Technology
w/ Global Footprint
› Facilities on three
continents
› Global quality and
consistency
› Customization
Deploy a
Balanced
Capital
Allocation
Policy
Drive
Improved
Return On
Investment
Expand Margins,
Generate Cash In
Performance
Materials
Businesses
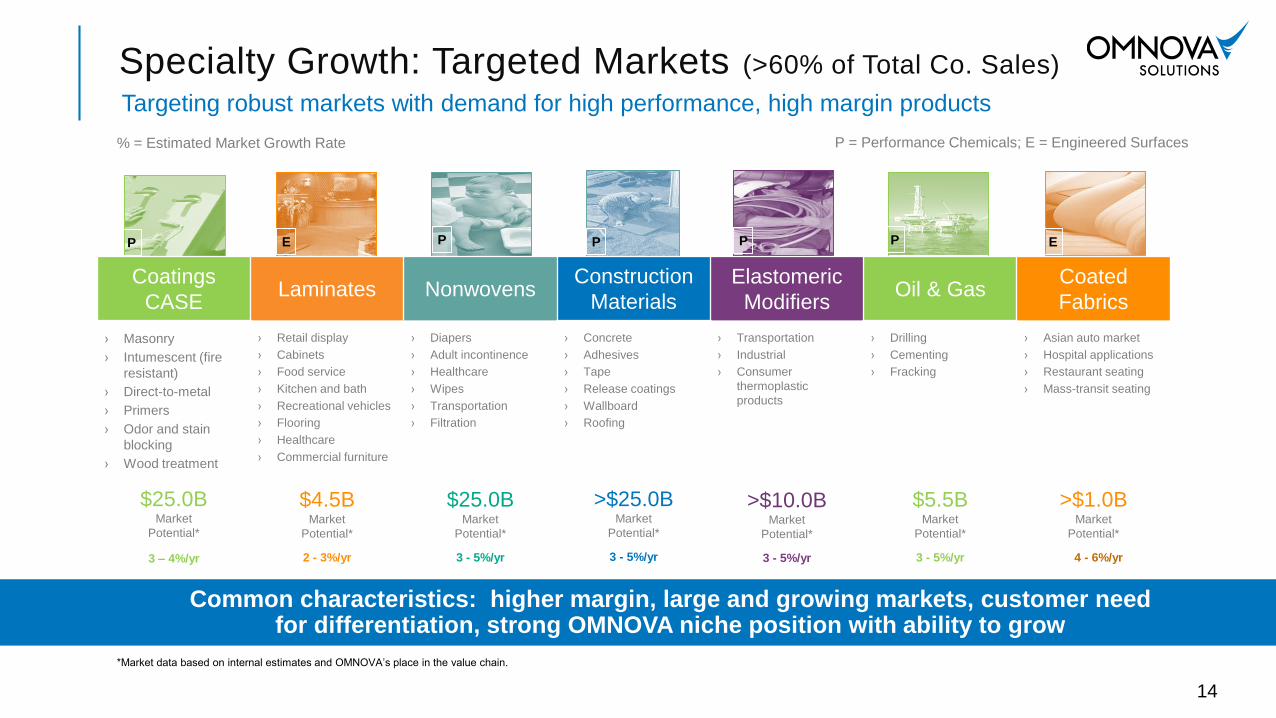
Specialty Growth: Targeted Markets (>60% of Total Co. Sales)
Targeting robust markets with demand for high performance, high margin products
14
% = Estimated Market Growth Rate
*Market data based on internal estimates and OMNOVA’s place in the value chain.
PC ES PC PC/ES PC PC ES
Common characteristics: higher margin, large and growing markets, customer need for differentiation, strong OMNOVA niche position with ability to grow
Coatings
CASELaminates Nonwovens
Construction
Materials
Elastomeric
ModifiersOil & Gas
Coated
Fabrics
› Masonry
› Intumescent (fire
resistant)
› Direct-to-metal
› Primers
› Odor and stain
blocking
› Wood treatment
$25.0BMarket
Potential*
3 – 4%/yr
› Retail display
› Cabinets
› Food service
› Kitchen and bath
› Recreational vehicles
› Flooring
› Healthcare
› Commercial furniture
$4.5BMarket
Potential*
2 - 3%/yr
› Diapers
› Adult incontinence
› Healthcare
› Wipes
› Transportation
› Filtration
$25.0BMarket
Potential*
3 - 5%/yr
› Concrete
› Adhesives
› Tape
› Release coatings
› Wallboard
› Roofing
>$25.0BMarket
Potential*
3 - 5%/yr
› Transportation
› Industrial
› Consumer
thermoplastic
products
>$10.0BMarket
Potential*
3 - 5%/yr
› Drilling
› Cementing
› Fracking
$5.5BMarket
Potential*
3 - 5%/yr
› Asian auto market
› Hospital applications
› Restaurant seating
› Mass-transit seating
>$1.0BMarket
Potential*
4 - 6%/yr
PP P P P EE
P = Performance Chemicals; E = Engineered Surfaces
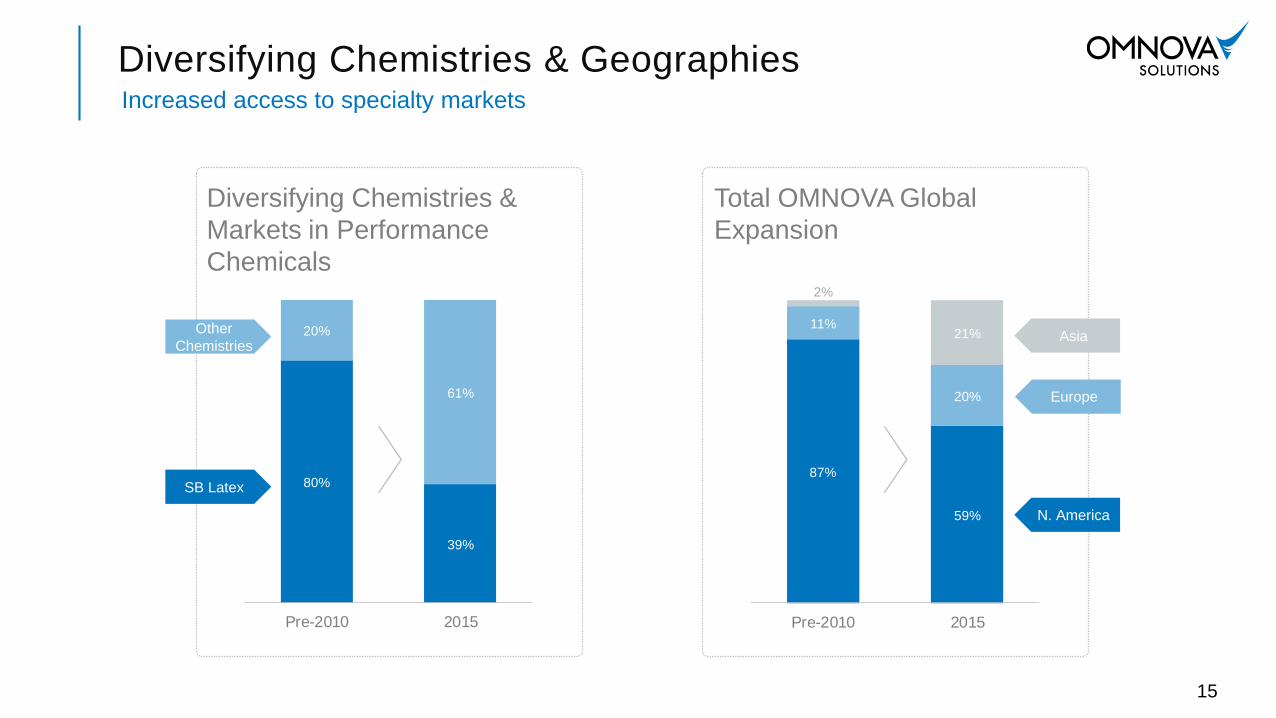
80%
39%
20%
61%
Pre-2010 2015
87%
59%
11%
20%
2%
21%
Pre-2010 2015
Diversifying Chemistries & GeographiesIncreased access to specialty markets
15
Other
Chemistries
SB Latex
Asia
Europe
N. America
Diversifying Chemistries &
Markets in Performance
Chemicals
Total OMNOVA Global
Expansion
OMNOVAPerformance*
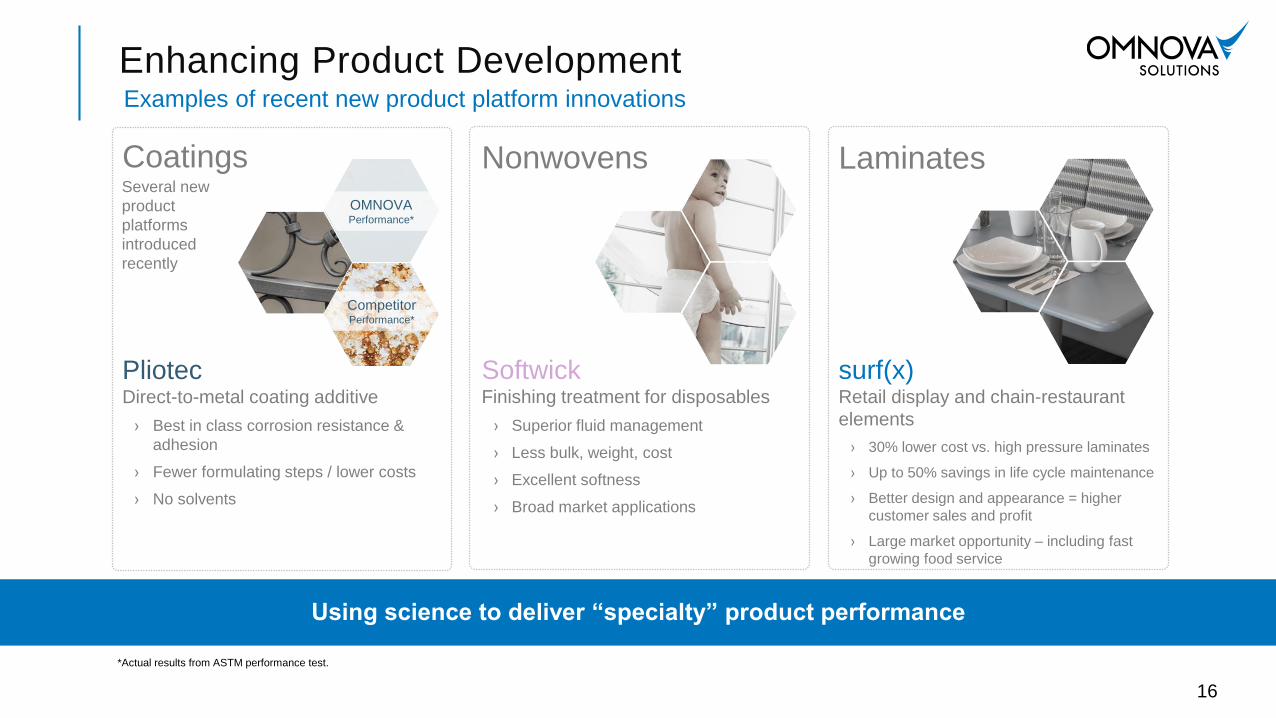
Enhancing Product DevelopmentExamples of recent new product platform innovations
16
Using science to deliver “specialty” product performance
SoftwickFinishing treatment for disposables
› Superior fluid management
› Less bulk, weight, cost
› Excellent softness
› Broad market applications
PliotecDirect-to-metal coating additive
› Best in class corrosion resistance &
adhesion
› Fewer formulating steps / lower costs
› No solvents
surf(x)Retail display and chain-restaurant
elements
› 30% lower cost vs. high pressure laminates
› Up to 50% savings in life cycle maintenance
› Better design and appearance = higher
customer sales and profit
› Large market opportunity – including fast
growing food service
NonwovensCoatings Laminates
CompetitorPerformance*
*Actual results from ASTM performance test.
Several new
product
platforms
introduced
recently
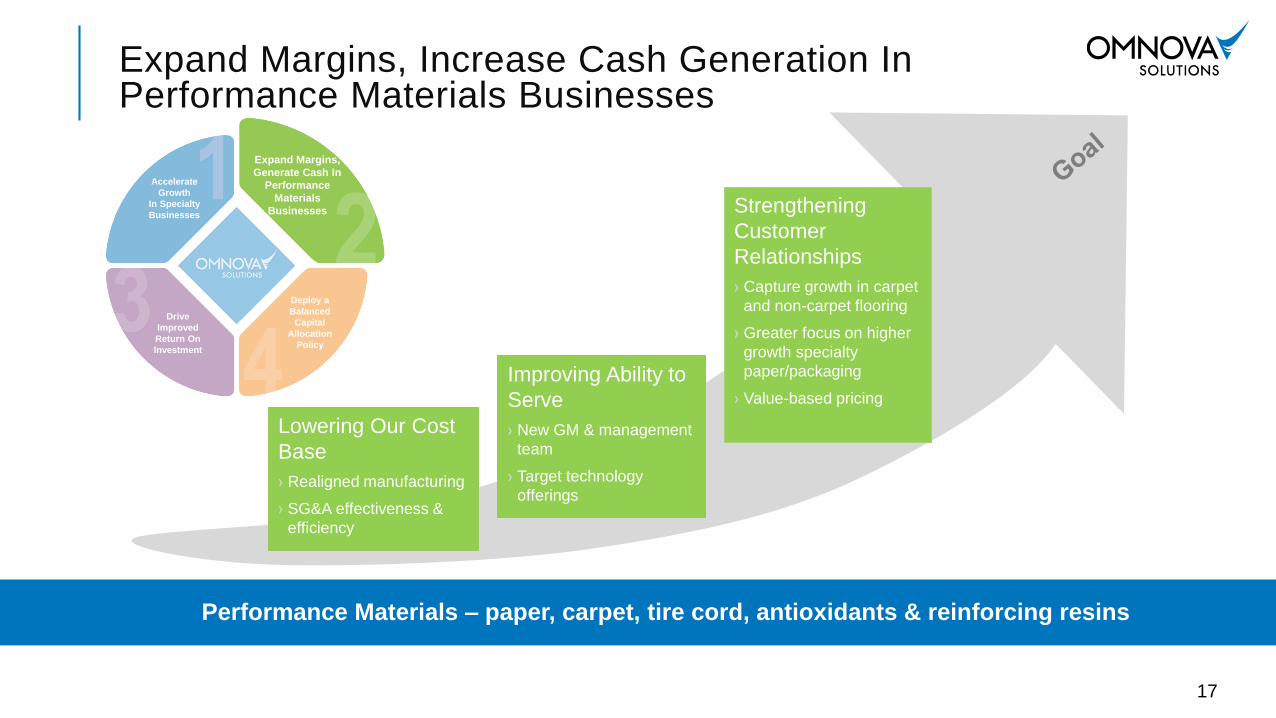
Strengthening
Customer
Relationships
› Capture growth in carpet
and non-carpet flooring
› Greater focus on higher
growth specialty
paper/packaging
› Value-based pricing
Expand Margins, Increase Cash Generation In Performance Materials Businesses
17
Performance Materials – paper, carpet, tire cord, antioxidants & reinforcing resins
Lowering Our Cost
Base
› Realigned manufacturing
› SG&A effectiveness &
efficiency
Improving Ability to
Serve
› New GM & management
team
› Target technology
offerings
Expand Margins,
Generate Cash In
Performance
Materials
Businesses
Deploy a
Balanced
Capital
Allocation
Policy
Accelerate
Growth
In Specialty
Businesses
Drive
Improved
Return On
Investment
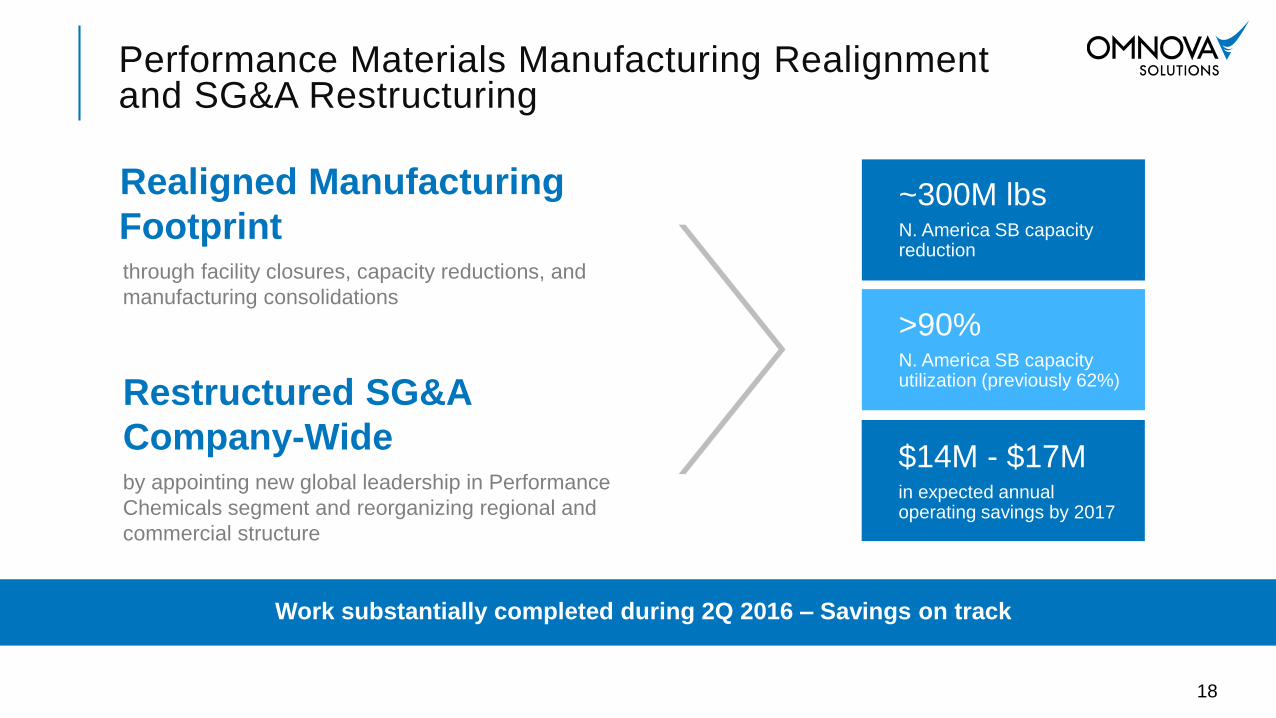
18
Performance Materials Manufacturing Realignment and SG&A Restructuring
Work substantially completed during 2Q 2016 – Savings on track
~300M lbsN. America SB capacity reduction
>90%N. America SB capacity utilization (previously 62%)
$14M - $17Min expected annual operating savings by 2017
Realigned Manufacturing
Footprintthrough facility closures, capacity reductions, and
manufacturing consolidations
Restructured SG&A
Company-Wideby appointing new global leadership in Performance
Chemicals segment and reorganizing regional and
commercial structure
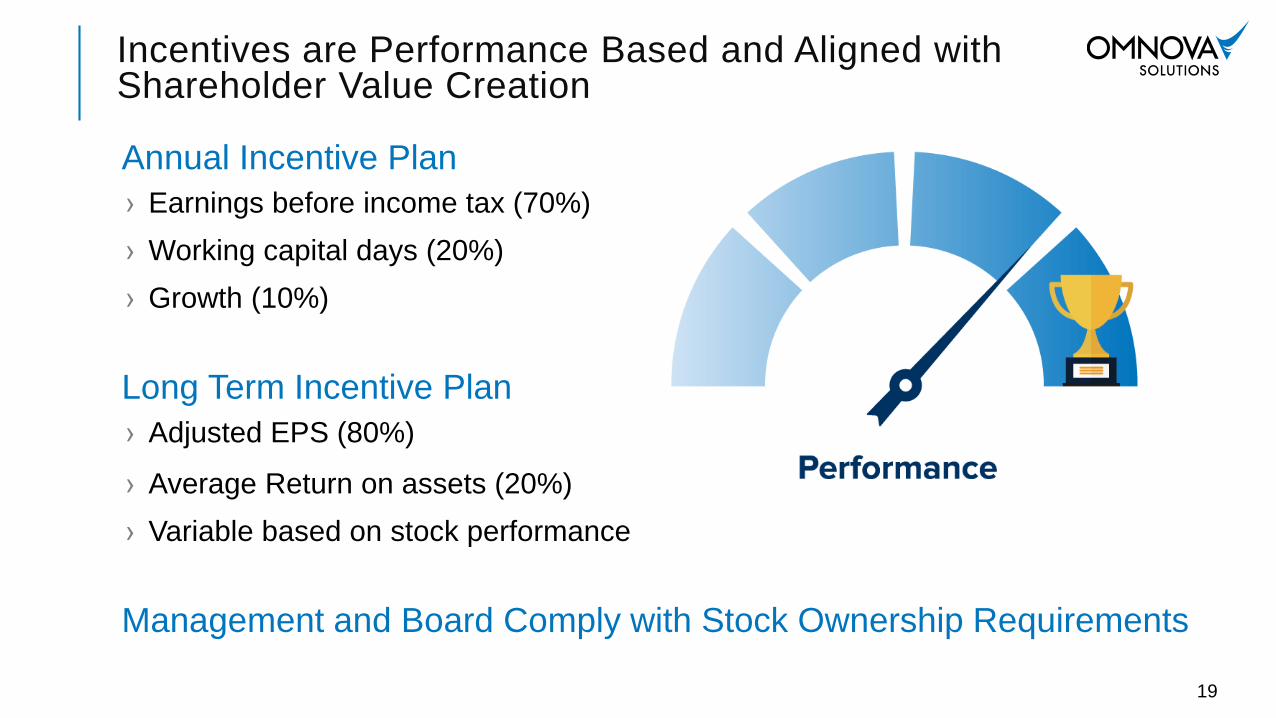
Annual Incentive Plan
› Earnings before income tax (70%)
› Working capital days (20%)
› Growth (10%)
Long Term Incentive Plan
› Adjusted EPS (80%)
› Average Return on assets (20%)
› Variable based on stock performance
Management and Board Comply with Stock Ownership Requirements
Incentives are Performance Based and Aligned with Shareholder Value Creation
19
› Exciting opportunities to grow higher margin Specialty businesses
› Strengthened innovation and commercial excellence process
› Significantly lowered cost base and reconfigured manufacturing footprint
› Diverse technologies, global footprint, and enhanced corporate
development to accelerate profitable growth
› Upgraded leadership team
› Positive momentum in margin expansion, earnings growth and cash
generation
› 6 consecutive quarters of year-over-year growth in Adjusted EPS
Why OMNOVA Solutions?Well positioned to achieve long term goals
20