kerala - irc · 4 density of population of kerala 1951 -1991 5 sex ratio, 195m991 (females per 1000...
TRANSCRIPT

Kerala
'mtk

-LibraIRC Iritermi!-'.;:,.
T.3I.:-:,., fl0
I
Iindex is low.
First started as pure technical interventions in 1978, Indc-Dutch projects have
today evolved into programmes with strong social objectives. These programmes,
initiated by the Women in Development (WID) desk at the Netherlands Embassy,
adhere to AVM* policy guidelines, seeking, through innovative ways, to overcome
obstacles to Women's participation in the development process. They also aim at
strengthening the influence of women over projects implemented in their vicinities.
jWith experience in projects accumulating, it is becoming exceedingly clear that the ;
role of men and women are complementary, often even overlapping. What has \I
also emerged is a gender awareness that is enabling the agents of change j
(viz. consultants, activists, WID experts and others) to shape the process of planning
and methods of implementation for schemes related to poverty alleviation, health ii
and sanitation, and primary education, in areas where the gender development
This gender profile provides information for intermediaries who wish to know about
the status of women in states where Indo-Dutch programmes are being implemented.
And since knowledge is power, we hope the gender specific information compiled
here will prove useful in making intervention beneficial for both men and women,
and towards bringing about a positive change in the community.
First Secretary, Women in Development
NuutiniPraMd
Programme Officer, WID Section.
ATOM*. YtauMft. Millita (Porertj, Women, Eawmattt )
L IRC, International Water 4 Stnltttion CentreF P,O. Box 93190 -L 2509 AD The Hague, ThoNeti
;.**
CONTENTS
1
2
3
4
S
6
7
8
9
10
11
12
Looking Back into Histoiy
Demography
Education
Employment
Unemployment
Health
Housing
Poverty
Households
Women's Role in Movements and Politics
Appendix
Bibliography
Page No.
1
14
22
27
32
35
39
43
47
49
52
64

Sl.No ftbleNo. Title Page No.
1. 2.1 Population growth in Kerala and India 142. 2.2 Population under different Religions in Kerala (1971-1981) 163. 2.3 Sex Ratio in Kerala and India ,1901-1991 174. 2.4 Population Growth in Kerala 175. 2.5 TFR estimate for Kerala and India 196. 2.6 Expectation of life at birth for Kerala and India. 207. 3.1 Growth of literacy in Kerala and India, 1901-1991 228. 3.2 Female Literacy Rates in Rural and Urban areas of Kerala, 1971-1991 229. 3.3 Distribution of literate women according to educational level (1986-87) 23
10. 3.4 Percapita Expenditure by Households on Education 1986-87 2511. 4.1 WPR by Gender for Kerala and India (in %) 2812. 4.2 Work Participation Rate by Gender and Sector (in %) 2813. 4.3 Main and Marginal Workers in Kerala 1981 & 1991 (100,000) 2814. 4.4 Sectoral Distribution of Main Workers by Gender-19814 1991 2915. 4.5 Industry-wise distribution of Female Workers-1981 and 1991 2916. 4.6 Distribution of Female Workers in Kerala
according to level of education, 1987-88 31Incidence of Unemployment • India-Kerala 1987-88 32Changes in the Incidence of Unemployment in Kerala 33Unemployed by Age Groups, 1987-88.61 33Medical Institutions under the government sector 35Rural / Urban availability of medical facilities by system of medicine 36Number of patients at government hospitals (allopathic) in Kerala 37Housing available in Kerala by nature of construction 39Housing shortage in Kerala, 1991 40Incidence of Female Headed Households in Kerala, 1961-81 48Inter-District differences in Reproductive Health and Health Care 52Inter-district differences in Illiteracy.Work participation and per capita income 53
17.18.19.20.21.22.23.2425.26.27.
5.15.25.36.16.26.37.17.29.111111.2

Appendix No. Title
1 District-wise population growth2 District-wise population by religion of head of households3 District-wise population of Scheduled
Castes and Scheduled Tribes4 Density of population of Kerala 1951 -19915 Sex ratio, 195M991 (Females per 1000 males)6 Rural-urban sex ratios in districts, 19917 Birth Rate and Death Rate & Infant
Mortality Rate in Kerala & India8 Birth Rates by Districts9 Age Specific Fertility Rates in Kerala-Rural
10 Percentage distribution of live birth by orderof birth 1991 (Sample Registration) Kerala
11 Percentage distribution of current live birthsby birth interval 1991 (Sample Registration) Kerala
12 Percentage distribution of populationby marital status -KERALA
131415
1617
18192021
2223
24252627
282930
Mean age at marriage for men & women, 1901-81IMR estimates from 1981 censusAge-wise distribution of population in Kerala,
1981 (census), 1991 (Sample Registration)Effective literacy rate (percent)Number of females usually engaged in (principal States)Domestic duties and carrying out specified activities perfemales engaged in domestic duties
Industry-wise distribution of main workers • 1981 and 1991District-wise number of factories and employment (1993)Registrants at employment exchanges by district and gender, 1993District-wise population coverage of
allopathic infrastructure 1981 and 1991District-wise area coverage of allopathic institutions, 1991Inter district variations in beds per
population in government allopathic hospitalsInter district differences in female hospital patients, 1992Inter district coverage by immunization, 1993District wise coverage under the drinking water supply schemesInter-district distribution of householdsbelow poverty line in rural Kerala
Average household siteInter-district differences in female headednessl ist of Women %luntary Organisations engaged in
implementing Development Programmes

Gender ProfileKERALA
Leela GulatiRamalingam
I.S.Gulati
ROYAL NETHERLANDS EMBASSY6/50 F, Shantipath, Chanakyapuri,
New Delhi-110 021, INDIA

This monograph is meant to provide an overview of the positionof women in Kerala.The views expressed are solely of the authors.

LOOKING BACK INTO HISTORY
Ijartt constellation* burning, mellowmoon* and happy ikiet, Brtadtkt of tropic•hade and clutter hnott ofparadite; Drooptthe heavy bUtuomed tower, hangt the heavyfruited tree, Summer itk$ of Eden tying inthe purple tpken of tea."(Pannikar, 1981)
1.1. Among the Indian states, Kerala is one ofthe most interesting state. Every aspect of its lifeand society is fascinating and puzzling at thesame time. This is particularly so when wediscuss the status of women. What is it thatmakes Kerala so fascinating and different? Whyis the status of women which looks, on thesuperficial level, DO different from women in therest of India yet very distinct, different anddifficult to comprehend? These are questions,answers to which will have to be attempted toget any meaningful understanding of the societyparticularly its women, their status and develop-ment
1.2. The varied and the very unusual charac-teristics of the state, with its unique social anddemographic indicators, and the very specialstatus of its women, can be understood only in ahistorical context For this purpose we need totake into account at least the last two hundredyears to comprehend the transformation thestate and its society have gone through.
1.3. lb begin with a brief introduction aboutthe state, Kerala is one of the smaller Indianstates occupying only 1.2% of India's land areabut accommodating 3.4 per cent of India'spopulation. Its geographical contours can bedescribed as an elongated strip of land, cush-ioned between the Western Ghats and the sandyshores of the Arabian sea. It has a long unbro-ken coastline of 590 kilometers, with nine out ofits fourteen districts having a sea border. Theflora, fauna and the ecological endowment are
.also unique. The state gets its name from theinnumerable coconut palms that sway in the
breeze and is believed to be more than 2000years old.
1.4. According to the 1991 population census,the current population of the state stood at 29million. Though still predominantly rural, thepace of urbanization in recent years is thefastest among the Indian states. The rural andurban population distribution is 74% and 26%.The state also has the highest density in thecountry at 749 persons per square kilometer.Of its total land area, 57% is under agriculturalusage and 27% under forests. Serious concernsare however, felt that forest area in the state hasbeen fast depleting in recent years.
1.5. Kerala came into existence as a state, adecade after Indian Independence in conse-quence of the country's linguistic reorganisationin 1956. Two of the former princely states,Cochin and Travancore in the south and theBritish administered Malabar in the north weremerged together into one state. All the threeunits inspite of their separate identities, sharedbroadly the same social practices and language.The system of matrilineal joint famines,Malayalam language, caste and religiousdivisions and rules and rituals about purity andpollution bound them together. Still, as a resultof their separate and distinct histories andreligious composition of population, there alsoexisted wide variations in their social andeconomic development
Kerala's International Exposure
1.6. Kerala has a long historical record of itsexposure to the outside world. Its Arab connectiongoes back to a period even before recorded history.Its contact with the Western world is at least over2000yearsold. The long list of Europeancontacts started with the Romans, followed byItalians, Portuguese, Dutch, French, and finallyending with the British in 1947. It also has hadclose contacts with the Chinese and Persians.

The Vfenrtw/i, Marco Polo mated Quilon at theend of the 13th Century records that 'themerchants from liarui (China) and the Levantscome hen with their ships and make a great dealof profit from their imports and exports,'[Sreedhara Menon, 1967]
1.7. While Kerala has had virtually contiguousand successive overseas contacts because of thespice trade, its contact with the rest of India til]tike twentieth century was minimal. Thusthroughout the 19th century large parts of thestate remained virtually isolated from the rest ofIndia, but not from the outside world(Jeffrey.1992). The main deterrent to thiscontact was probably the high and densevegetation of the mountain ranges of theWestern Ghats on one side and the Arabian seaon the other. Roads were rare and it took nearlysix weeks to reach Madras from Travancore in1839. The railway did not reach Emakulam till1902 and Thiruvananthapuram til) 1918.
1.8. The many peculiar customs, caste rulesand regulations, rules of purity and pollution,organization of family and marriage customs inKerala resulting in the relatively better status ofits women, could possibly be traced to theisolation of this part from the rest of the country.Though part of the Hindu culture and society,the isolation of Kerala gave the people of thisregion an identity of their own.
Religious Composition andDenominations
1.9 All the world's major religions and theirdenominations are well represented in Kerala.Islam came early to Kerala with the Arabtraders The concentration of the Islamicpopulation however is in the three northerndistricts of Malabar, with ports commonly usedfor trade The Muslim population of Keralacomprises of two distinct groups, the descend-ants of the Arab merchants who inter-marriedwith Kerala women following matriliny and thenative converts to Islam who follow patriliny.
1.10. It is believed that around the secondcentury A.D, Greek sailing boats brought boththe Christians and Jews to Kerala. TheChristian presence is very strong in two of thecentral districts. The Christian Catholics belongto aD three main denominations, Syrian, Roman
and Latin, depending on the liturgy. Also, thereare the Protestants. Virtually one-third of theChristian community in India is located inKerala. Politically, socially and economicallytheir influence in Kerala is considered byobservers to be out of proportion to theirnumerical strength. The Jewish presence is adwindling presence and is concentrated mostlyin Emakulam.
Caste in Kerala
1.11. Another distinguishing feature of the stateis that among the Hindus comprising over 60 percent of the population, caste has played aprominent role in the social fabric of the society.Detailed and elaborate rules were laid down toidentify caste groups and deepen differencesbetween them. The concept of visual andatmospheric defilement was strongly entrenchedand the Hindu society was obsessed with rules ofpurity and pollution. In addition, there werestratified rules regarding housing, jewellery,clothing and social distances to be maintainedbetween caste groups. Castes below Nairs werenot allowed to wear even footwear or carryumbrellas and wear some types of jewellery orclothing. At Jeffrey (1992) puts it, 'old Keralawas the place of boundaries and constraints, onwhat they might do. People lived in discretegroups, with their lives regulated by rules andrestrictions.* Several of these rules andrestrictions impinged particularly on women.The status of women differed among the variouscastes. Irrespective however of whether theywere matrilineal castes, upper caste or lowcastes, all faced various kinds of peculiardisabilities.
Matriliny
1.12. No discussion of the current status androle of women can ignore the pattern of inherit-ance and family system that existed in the pastTheir position differed among the variouscategories but women of matrilineal castes,upper as well as lower castes, were subject tosome disabilities, while at the same timeenjoying rights not given to women of patrilinealgroups.
1.13. Of all its features, matriliny most distin-guished Kerala and its women from the rest ofthe country. It is believed that matrilinyoriginated in the tenth or eleventh century AD

and was wefl established by the time theEuropeans began arriving in the sixteenthcentury. No ooe is sure about the origins of thesystem but what is dear is that matrilinyexisted from the north to the south of Kerala bythe 14th century.
1.14. The matrilineal system was widespreadand accepted by practically all caste groups.Variant shades of the system however, werefollowed by different groups. Some communitieswere very flexible on what they wanted to follow.At the same time, as lower castes unproved theireconomic status they were only too anxious tofollow the matrilineal customs of the uppercastes.
1.15. The main features of the matrilinealsystem as practiced in Kerala and its implica-tions for the status and social standing of womenwere as follows:
(i) The family, called Tarawad, consisted ofall descendants of a common ancestor inthe female line.
(u) The children belonged to the wife and hernatal family.
(iii) The family property was administered bythe Karnaw (eldest male member) of theTanmad. Though he had absolute powerof decision so far as the management ofthe estate was concerned, he couldalienate no part of the property withoutthe consent of all the members.
1.17. What kind of advantages did this systemprovide for women? Though contemporarywomen in Kerala are overwhelmingly compla-cent and do not seem to be disturbed withcurrent changes in the system, there were veryclear advantages. Firstly, there was no pre-puberty or child marriage like the rest of Indiaand this resulted in a relatively mature age atmarriage in Kerala. Secondly,ceremony was a simple event performed withoutmuch ostentation, dowry transfer, or crushingexpenses for the girl's family. Thirdly, thetraumatic experience that the rest of brides inIndia had of leaving the parental home andpainstakingly rebuilding her status in her newhome was nonexistent Under this system, thebride never left her natal house. Fourthly, thequestion of legitimacy of children, the main pre-occupation in the rest of the country, wassecondary because of identifying children withthe mother only. Fifthly, for these women, therewas no question of their abdicating their rightsin the natal home and property. Sixthly, femalechildren were not only welcome but actuallydesired, to keep the family line going. Seventhly,female visibility and mobility were not con-strained. Purdah was unknown among thesecastes. Finally, the trauma of widowhood wasaltogether avoidable under this system andremarriage carried no stigma for women.
1.18. While frequent references are made, andperhaps quite rightly, to the oppressive uncleswho controlled the Tarowad, it is not correct to
Implications for Women
1.16. As a result of this very different system offamily relationship including marriage andother family practices, women in general hadmore influence over their lives in Kerala. Itgave them a unique status and importance intheir families when compared to women in therest of the country. Marriage, called*Sambandham', signified the relationshipapproved by the girl's family and lasted only aslong as both the parties wanted it [Panikkar,1918]. Whether this relationship was marriagein the conventional sense as understood inpatriarchy has remained a question. It is clearhowever that by doing away with the conven-tional type marriage and replacing it withSambandham, a host of problems Indian womenelsewhere faced were done away with.
say that women from matrilineal groups had tobe totally subservient They did enjoy ameasure of autonomy and position within thefamily unknown for women in the rest of India.One of the most important factors contributingto women's security under the system was alifetime right to inherit their ancestral property.Moreover, this right could only pass throughthem to their female descendants.
1.19. This pervasive influence of the matrilinealsystem was important in determining socialattitudes in Kerala towards women's welfare,education and health.
TheNamboodirit
1.20 All groups of Hindu women in Kerala werenot as fortunate as those following matriliny.Gender relationships in Kerala assumed very
3

different forms across caste boundaries depend-ing upon their rules and customs. The mostprominent example is that of the social organisa-tion among the Namboodiris.
1.21. The Namboodiris are considered thepurest of the pure among the Brahmins in thecountry. In Kerala, the Namboodiri Brahminswere at the apex of the caste hierarchy and thewhole of Hindu society was geared to protecttheir vastly superior position. Discussions andwritings about the Namboodiris, especiallywomen of this caste, are not that commonhowever as about other castes in Kerala. Thiswas probably due to (a) the Namboodiri castebeing in itself patriarchal and (b) the seclusionof female members in a Namboodiri family.Infact, seclusion of women from other castes andgroups was central to the organisation of theNamboodiri family life. On the other hand,Namboodiri men enjoyed not only high religiousand social status but also came to acquireconsiderable political and economic clout
1.22. The marriage and family system amongthe Namboodiris, though patriarchal, was verydifferent from not only the other castes inKerala but also the Brahmins in the rest of thecountry. Namboodiri women, by and large, livedwithin polygamous households with very rigidrules of female chastity. From the age of nine,girls were relegated to a life of religious ritualsand seclusion. They had no right to propertyand were restricted to a single marriage, if at allit was possible. A junior Namboodiri man's lotwas also not much better, except that he couldhave liaisons outside his caste without anyobligation to the children bom out of such arelationship. The younger Namboodiri men hadno rights to family property or to establish afamily life of his own. [Veiayudhan, 1994].
1.23. In order to keep their vast estates andtracts of land intact, only the eldest son wasallowed to marry. He could have up to fourwives. It is relevant in this context to quoteE.M.S Namboodiripad. (1975) the most distin-guished Marxist leader, who recalls as follows:
'Striking a personal note and recalling theconditions of the women of the community 1 wasborn into, polygamous marriages wen the ruleand bigamy tke exception half a century ago. Myown father had two wives, while only one of his
five daughters who grew up to the age of mar-riage escaped the fate of being one of two or morewives of their husbands. My stepmother, theyounger of the two wives of my father, was thedaughter of the bridegroom to whom my father'syounger suter was married! This was true alsoof every family related to ours as well as theentire community, the only modification beingthat, instead of two wives as in my father's case,most men had three.'
1.24. The rest of the Namboodiri men weredenied tie right to marry and establish aNamboodiri family. While younger Namboodirimen could nave sambandham with Nair women,the only choice open to Namboodiri women wasto be married as one of many wives to aNamboodiri man. If this was not possible, theywere to lead a cloistered life of spinsterhood intheir illams (estates). Thus large numbers ofNamboodri girls were doomed to spend theirlives in the strict seclusion of their homes andengaged m various elaborate ritualistic andreligious practices specially designed to keepthem occupied.
1.25. The lot of Namboodiri women was ratherunenviable. They had to observe a sort ofpurdah, called 'antarjanam' or 'agothamma',which literally means belonging to indoors.Once a pri attained puberty she was rarely to beseen outade of their estates.
"When compelled to travel, they are invariablypreceded by a crier in the form of a Nayarwoman coiled vrthal' who warns off maletravellert by a long drawn shout of Ahayi"[Sardammi.1983],
Since spiosterhood was imposed on them, manywere doomed to remain unmarried and lead alife of rehpous worship and rituals.
1.26. Since, numerically, Namboodris consti-tuted onh one percent of the region's populationthe problems their women faced affected a smallminority, h cannot be overlooked, however, thatthis small Minority belonged to a caste thatenjoyed the highest social and religious status inthe region. So it should be of interest that bothNamboodiri men and women fought against thissystem a* it affected them, and won their equalrights to • a n y within caste only as late as 1930.

In this struggMhe younger Namboodiri mentook an active part and interest side by aide withwomen. Their desire and justificationa weredisseminated through literature and theatre.The paradox of the tremendoot freedom ofmatrilineal women and the restrictions placedupon Namboodiri women made this societyenigmatic.
Other Csstes
1.27. Ezhavas comprise another major castegroup. In numerical strength, they are muchlarger than any other lower caste group. Ezhavamen and women formed the majority of theagricultural and industrial workers involved intraditional industries. In the northern districts,they are called Tiyyas. While the Nadare,another low caste group with considerablestrength in Tamilnadu converted in largenumbers to Christianity, only a few Ezhavas didthat. Ezhavas were divided between matrilinealand non-matrilineal groups and the former facedsome of the same problem of other matrilinealgroups in Kerala. As a caste group, Ezhavaswere subject to a great many social disabilities,including those relating to worship and access totemples (Parameshwaran, 1971].
1.28. The role ofEzhavas was quite central inthe social emancipation movement Under theleadership of Shri. Narayana Guru, Ezhavasfought for not only the removal of caste barrierand access to temples for worship but also theright to government employment and education.They also fought for the reform of marriagepractices and the system of succession. Asaresult, in 1925 in Travancore state was promul-gated a law on marriage and succession amongthe Ezhavas.
The still Lower Casts
1.29. The position and the status of women fromthe lower castes of Pulayas and Parayas werefar from satisfactory. Until the abolition ofslavery in 1843, the Pulayas and Parayas wereknown as the slave castes. They togetherconstituted approximately 10 % of the popula-tion of the state. Women as well as men of theselower castes suffered from severe civil disabili-ties. As Le Mercenier (1983) described theirsituation:
The distance* between them group* wenexpressed in the pollution rules and Mtablyin the number of paea which had to bemaintained between them in the prohibitionagainst certain group* using the roadsleading to the ttmples, and (even more)entering the templet The distance* men a/soexpressed by variations in costume, especiallyin the ease of women, by the covering atbaring of the breast The ensemble of theseregulations was legally enforced by a series ofpenalties, which might go as far as deathitself
The Right of Dress
1.30. In old Kerala, since people lived in theirdiscrete groups with their lives regulated byrules and restrictions on their movements andvisibility, in order to facilitate the functioning ofthis system, identification of people by theirmodes of dress and hair styles was quiteimportant. The rules and regulations forwomen's dress till the nineteenth century weredifferent among the castes. Going by the dressrestrictions imposed during that time all womenhad to go without an upper garment before theirsuperiors, but the lower caste women, had to gobare breasted before every one.
1.31. During the first half of 19th century, 1813-1858, the privilege of women to cover theirbodies with an upper cloth became a volatileissue in Kerala. In the drama that ensued, allcastes and communities got involved. Thedebate symbolised great discontent with thevarious kinds of social humiliations heaped onthe lower castes and the right of women to covertheir breasts became an issue of status than ofdecency.
1.32. It is relevant to refer here to the role ofthe European missionaries who with theirnotions of decency were very anxious that atleast women who became Christians should be"decently* covered. They could win for thewomen of Christian faith the right to cover theirbreast from the British Resident attached to theprincely states of Travancore and Cochin in1813. But it provoked violent protest from thehigher caste Hindus.

In 1822 the casU Hindu women reactedviolently against this violation of taboos.They began by tearing off the bloum of thelouhtatU Christian women, which led toriots, anon and even murdm.'[Qoisar,1968].
Some time later, Nadars, lower caste Hindusfrom whom a Urge number got converted toChristianity, suffering as they were from variousindignities including those requiring women notto wear any clothing above the waist, cany anumbrella, wear footwear or gold ornaments orcarry water on their hips, rose in protest Withthe support of the Church and the Britishrepresentatives they organised "Maru MarakkalSamaram", which has come to be known also asthe "Upper Cloth Revolt* Ultimately, the right tocover their breasts was granted first to Christianwomen and then to women of all castes by 1859.Infect, the proclamation on the subject stipulated*punishment for the women who continued inuncovered freedom' (Madhavi, 1994].
1.33. Putting the 'Upper Cloth Movement" in thecontext of the period, one must add that evenNamboodiri women went bare breasted in theprivacy of their homes or before temple deities.Nair women had to uncover themselves beforetemple deities and upper caste superiors. Lowercaste women however had to go bare breasted atall times. Bare breastedness was thus regardedas a mark of humility rather than humiliation,according to the customs prevailing in thosedays. As Woodcock (1967) explains,
The real explanation is doubtless to be foundin the view fostered by the Namboodiris andaccepted by other Mohyalis that splendourbelongs only to the Gods, a view expressedmost dramatically in the great annualprocession when the image ofSitPadmanabha is taken from the temple ofThiruvananthapuram to the sea coast,adorned in jewelled richness while theMaharajah accompanies it bare breasted andban footed, clad only in a simple whitemundu, the humble dress in which thedevotee must always present himself to theGod in a Kerala temple.'
1.34. Whatever the original rationale behindthe practice, the fact remains that by the early19th century it had come to be regarded as a
humiliation heaped on women, particularly oflower castes. Tbe breast cloth controversy andthe ensuing struggle were in a way the startingpoint of low caste asserttveneas and broaderreform movement in Kerala. It is also signifi-cant that the start was made with protestagainst rules and regulations imposing restric-tions and prohibitions on women.
1.35. lite Breast cloth controversy was reaUyonly the tip of the iceberg. Several otherdisabilities and discontents among both men andwomen were brewing, waiting for an outlet ofexpression. The period between 1850 to 1910,was a period of great revolutionary changes inKerala. Nowhere else in the country were thereforms so profound and so all pervasive,redefining social conventions and family lifebeyond recognition.
1.36. Major and rapid amelioration took place inKerala due to an interplay of factors that tookplace independently of each other but at thesame time. The more significant ones being thedevelopment of the print medium, an awakeningof political consciousness an awareness of socialdisabilities and reform movements. Thedevelopment of the novel and prose in thecontext of the nationalist agitation created aclimate for unprecedented upheavals in thesociety.
Christian Influence
1.37. It is probably not an exaggeration toattribute a major role in the initiation of socialchange to the Christian missionaries in Kerala.While Christian influence came to Kerala longtime back (in the second century A.D) missionar-ies came much later. All Christian denomina-tions, early or later, were possibly unanimous inwanting change in what they considered wrongand unethical with the social practices inKerala. They also genuinely felt that at leastthose who got converted to Christianity shouldnot be encumbered by the oppression of caste,family and kinship systems. But it was only withthe comming of Christian missions and theiractive involvement in the field of education thatsocial reform got a chance to spread out to thelarger community.
1.38. The Jesuits were the first missionariesto come to India. In 1542 i.e within two years of
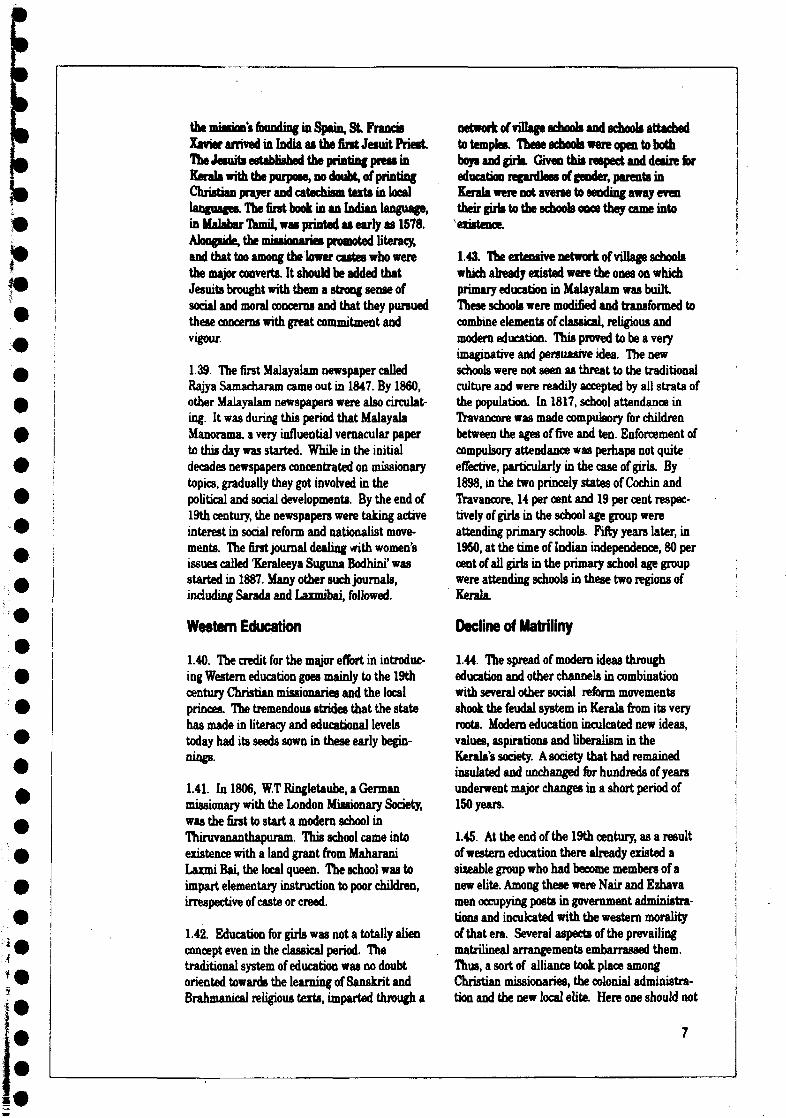
the minion's founding in Spain, S t FrancisXavier arrived in India at the first Jesuit PriestThe Jesuits established the printing press inKerala with the purpose, no doubt, of printingChristian prayer and catechism texts in locallanguages. The first book in an Indian language,in Malabar Tamil, was printed as early as 1578.Alongside, the missionaries promoted literacy,and that too among the lower castes who werethe major converts. It should be added thatJesuits brought with them a strong sense ofsocial and moral concerns and that they pursuedthese concerns with great commitment andvigour.
139. The first Malayalam newspaper calledRajya Samacharam came out in 1847. By 1860,other Malayalam newspapers were also circulat-ing. It was during this period that MalayalaManorama, a very influential vernacular paperto this day was started. While in the initialdecades newspapers concentrated on missionarytopics, gradually they got involved in thepolitical and social developments. By the end of19th century, the newspapers were taking activeinterest in social reform and nationalist move-ments. The first journal dealing with women'sissues called "Keraleeya Suguna Bodhini' wasstarted in 1887. Many other such journals,including Sarada and Laxmibai, followed.
Western Education
1.40. The credit for the major effort in introduc-ing Western education goes mainly to the 19thcentury Christian missionaries and the localprinces. The tremendous strides that the statehas made in literacy and educational levelstoday had its seeds sown in these early begin-nings.
1.41. In 1806, W.T Ringletaube, a Germanmissionary with the London Missionary Society,was the first to start a modern school inThiruvananthapuram. This school came intoexistence with a land grant from MaharaniLaxmi Bai, the local queen. The school was toimpart elementary instruction to poor children,irrespective of caste or creed.
1.42. Education for girls was not a totally alienconcept even in the classical period. Thetraditional system of education was no doubtoriented towards the learning of Sanskrit andBrahmankal religious texts, imparted through a
network of village schools and schools attachedto temples. These schools were open to bothboys and giria. Given this respect and desire foreducation regardless of gender, parents inKerala were not averse to sending away eventheir girls to the schools once they came into
1.43. The extensive network of village schoolswhich already existed were the ones on whichprimary education in Malayalam was builtThese schools were modified and transformed tocombine elements of classical, religious andmodern education. This proved to be a veryimaginative and persuasive idea. The newschools were not seen as threat to the traditionalculture and were readily accepted by all strata ofthe population. In 1817, school attendance inTravancore was made compulsory for childrenbetween the ages of five and ten. Enforcement ofcompulsory attendance was perhaps not quiteeffective, particularly in the case of girls. By1898, in the two princely states of Cochin andTravancore, 14 per cent and 19 per cent respec-tively of girls in the school age group wereattending primary schools. Fifty years later, in1950, at the time of Indian independence, 80 percent of all girls in the primary school age groupwere attending schools in these two regions ofKerala.
Decline of Matriliny
1.44. The spread of modern ideas througheducation and other channels in combinationwith several other social reform movementsshook the feudal system in Kerala from its veryroots. Modern education inculcated new ideas,values, aspirations and liberalism in theKerala's society. A society that had remainedinsulated and unchanged for hundreds of yearsunderwent major changes in a short period of150 years.
1.45. At the end of the 19th century, as a resultof western education there already existed asizeable group who had become members of anew elite. Among these were Nair and Ezhavamen occupying posts in government administra-tions and inculcated with the western moralityof that era. Several aspects of the prevailingmatrilineal arrangements embarrassed them.Thus, a sort of alliance took place amongChristian missionaries, the colonial administra-tion and the new local elite. Here one should not

underestimate the pombfeautquews of •greater exposure of the region to Indians fromother parts of the county when patriiiny wasflft Awninant family i
1.46. By the turn of the century, owrtmatrilin.eal men and women found their customsincreasingly inappropriate and ware only toottimwin to rp-"rgfln?** thttr fc"»«iy iifr andinheritance on patrilineal patterns followedelsewhere. The intense ridicule and relentlessattacks that the old system invoked ensured itsdemise. The missionaries were in the forefrontof this process.
1.47. Almost all of the social ills of Kerala inthe past were attributed to matriliny and itsallegedly debilitating effects on the population.The following quote encompasses the attitudeprevalent towards matnliny prior to its aboli-tion. The relationship arrangements in aTarawad were considered ridiculous andimmoral (Jeffrey, 1992).
The Malayalis as a dost are the most idleand homesick of the whole Hindu communityowing to the enervating influence exercisedon their character by their peculiar system ofinheritance and their obnoxious system ofpromiscuous marriage or rather no mar-riage'[Hindu, Feb. 6,18911
1.48. While the women were either passive ortheir voices were being ignored, the men werethe principal protagonists of change. Juniormen among the Nairs and the Namboodiris whohad margin*) roles in the family felt humiliatedin the light 'of comparisons to men from othernon-Kerala background. For the women ofKerala, the disappearance of matnliny and itsreplacement by patrilineal monogamoushouseholds should have represented a retro-grade step. A system that, as noted above, onthe whole allocated strength and advantages toKerala's women was to be completely disman-tled. Women didnt realise then what they werebeing asked to give up.
1.49. Concentrated and continuous efforts weremade to reconstruct the social relationships andfamily life as new influences became moredominant Introducing a revised concept ofmarriage in place of Sambandham as well aspromoting monogamy and patriiiny were the
major objectives.
Legislate and Ittrttny
1.50. Legislative attempts to reform matnlinybegan in the 189Cs and have continued eversines. Within a short period of 25-30 years, thethree regions of Kerala had legislation recognis-ing marriage and permitting inheritancethrough fathers. These legislation whilerecognising ^ainhfn/fl"ni as marriage »k"»permitted a man to bequeath half (later legisla-tion permitted all) his self acquired property(but not his share in his matrilineal joint family)to his wife and children. Previously, his ownproperty passed automatically into the collectiveproperty of his matrilineal joint family.
1.51. Polygamy was outlawed and familybranches were permitted to divide. While thefirst legislations covered only Nairs, subsequentlegislations on the subject extended the provi-sions to other groups and communities. Also,the right to bequeath was extended to all self-acquired property.
1.52. Additionally, first branches of families andlater individual members were given the right todemand division of joint family assets. TheHindu Succession Act of 1956, applicable towhole of India, specifically gave the right to
matrilineal famines also. The final blow wasstruck, however, through the legislation of 1976whereby all surviving matrilineal joint families
wereThus, legally speaking, matnliny was finallyabolished.
1.53. But has matrUiny dissipated in reality?Have relational and sentimental family attach-ments and attitudes changed ? Has patriiinyreally taken over in Kerala? These are ques-tions to which definitive answers will take timeto arrive a t Writing about the early 60*s,Mencher (1975) noted as follows:
"While there has been a breakdown oftraditional Nayar tarawad' into smallfamily units... there is no indication of a shiftin the direction of the traditional patrilineal,patrilocal pattern found elsewhere in India.'
1.54. In regard particularly to women's affini-ties, Mencher observed that 'matrilineal
8

sentiment* continue to take precedence; matrilin-eal kin an aitiad for the determination ofresidence and the major sources of support inemergencies'. Nakane (1962) writing about thesame times, also observed that 'the presentNayarstiUlii^ in Ae matrilineal atmosphere*.Speculating about the neit generation, she feltthat 'it would not shift to a patrUineal system,though it could pottibly take the patrilinealsystem with a kind of bilateral arrangement *Writing about change* among Mappilas ofMalabar, Koya (1983) says: •Matrilinealhomesteads have become father controlled, butchildren still belong to the mother's family. *
1.55. With matriliny abolished legally, theimpact on the women's right among matrilinealgroups was possibly the maximum AsSardamoni puts it, the security they enjoyed asa birth right was substituted by protection byhusbands." They lost in consequence of the so-called progressive switch over from the matrilin-eal system, the certainty of the house' of whichthey were previously an unquestionable partand where they were entitled to live respectablyall their lives. The right to divorce and the rightto the ancestral home had all been a part ofwomen's matrilineal rights. Previously, if herhusband died, she merely lived on in her familyhome, a full member of the tarawad, instead ofhaving to endure the humiliating treatmentmeted out by the husband's family to mostIndian widows. [Woodcock, 1967). NowSaradamoni (1983) notes, 'itUnot uncommon tofind old women • especially widows, with orwithout children whose existence depends on themercy of others* TTi«ramang»lam« (1994) aptlysum up the present position of Kerala's womenthus: 'Kerala's women appeared to have sufferedloss of freedom, status and security despite stillenjoying the best position accorded to womenamong all the states of India (itself a result of thematrilineal tradition and culture).'
1.56. The fact remains however that very fewwomen in Kerala really look back on matrilinywith nostalgia. The crushing of the self-image ofthe Kerala men and women was so omnipotentthat even to this day, one cannot say if they havecompletely recovered and realized what theyhave lost On the contrary women seemconvinced that monogamy and the institution ofpatrilineal marriages give them more security.Also more importantly, they feel that these newpractices conform to the norms of men and
women in the rest of India and the majority ofthe world cultures and that they do not want tobe different
1.57. Additionally, it cannot be overlooked thatunder reformed patriliny now in force in Kerala,women of the present generation feel that theyhave both access to their natal homes, ouaov-able property and legal daim to their husband'sproperty. A new synthesis is believed to haveevolved of the old and new which meant thatwomen have improved their material positioneven further.
158. At the same time, what they have tot interms of sexual freedom and security of the natalhome is considered to have been amply compen-sated by emotional security that living mth thehusband is supposed to lend.
Peasant and Trade Union Movements
1.59. It was around this time that other changesin land and labour relations were also taringplace in Kerala. A hundred years startingaround 1830 saw the arrival of unions and theirstruggle for better wages and working conditionsin Kerala. This was a period of agrariandisturbances in all parts of Kerala. Amongseveral other reasons, one was the tremendousconcentration of ownership of land in the handsof a small section of people or institutions the
Namboodiris, Nairs and the Devasoms ie.temples. The second reason was the oppresivenature of the land tenure system, with amultiplicity of land tenures.
1.60. In 1838 an uprising against landlords tookplace as the first of what is referred to as TheMappila Rebellions' because of the involvementof Muslim agricultural workers of Malabarregion. Only in 1882, did the British adminis-tration of Malabar, take serious notice of theunrest and institute an agrarian enquiry. Asaresult, some minor changes were introduced inland relations.
1.61. In Trayancore region, the local princelyadministration showed greater sensitivity in thegrant of tenurial security and other land rightsto tenants. Reforms in Cochin region weresomewhat tardier, but still not so tardy as in thedirectly British administered Malabar, wheremaximum eruption of unrest was witnessed for a
9

• I
B
I
wholecentury. The rebellion of 1921 in which asmany as one thousand peopb a n believed tohave d ^ was probably the wont of the upris-ings witnessed far a whole notary.
1.62. It was also mataiabar that communistscould establish a fintstroof base, whichsubsequently was possible to extend to otherparts of Kerala. Significant in this context wasthe organised struggle, led by the communists,of the agricultural workers of Kuttanad area, aunique rice tract, where capitalist agriculturedominated. A numerically small number ofenterprising landlords managed paddy cultiva-tion with the help of a large number of landlesslabourers. The workers were entirely from lowcaste, and seventy percent women.
1.63. Around the early part of the twentiethcentury, the beginnings of the organised labourmovement were made. It was around 1912 thatthe biography of Karl Marx appeared for thefirst time in an Indian language, Malayalam,with the subtitle "a great man who dedicated hislife to the uplift of wage labourers.* (Nair, 1994].This book had a great impact on the people andinfluenced the thinking of that time.
1.64. The decade from 1940 to 1950 witnessedquite a few struggles by the agricultural workersof Travancore and the participation of women inthese struggles was quite significant Jeffrey(1992) cites the report of a police official postedin Kuttanad in 1947 about *a procession oflabouring women who marched on a localofficial to extract a promise of a wage rise and asix hour day*, behaviour that would have beenunthinkable ten years before."
'Stories of numerous women workers whostopped thejenmis in the paddy fields andforced them to grant their demands wenheard in those days, "toe agricultural womenworkers of Kuttanad had started the 'gherao*[encircling] (though it was not known thus atthe time) form of struggle'[George, 1975].
1.66. Every elected government in Kerala sinceearly 1950*8 had to confront the question of landreform, but it took more than 20 years to achievesomething substantial. Land Reform Act waspassed in 1969. By 1980, significant changeshad occured in land relations, the most signifi-cant of these being the abolition of tenancy ofland and the bestowal of ownership on tens of
thousands of hut dweUen. In 198344, anestimated 97 per cent of rural agriculturallabour households owned the land on whichtheir huts stood, a marked increase from the1960*8 when the corresponding proportion waa67 per cent
Other Organtod Struggle*
1.66. Outside of agriculture, two major avenueaof employment (leaving out government service)have been coir and cashew industries. Someestimates put the number engaged in these twotraditional low skills, low paying industries at3.2 lakh and 1 lakh respectively.
1.67. Coir industry accounts for 85% of the totalcoir production in India. The raw material forthis industry is the coconut husk which coversthe fruit Retting in the backwaters, called'Kayals', is the basic process involved in theprocessing of raw husk. The practice of rettingemits a certain foul smelling (hydrogen sul-phide) gas and pollutes the stagnant "Kayal1
waters. Women constitute ninety percent of theworkers engaged in this industry, concentratedthough they are in the two sectors of defibringand spinning. The wage rates have been lowand working conditions deplorable. Processingof retted husks which is foul smelling and indamp surroundings is a major health hazardthat women who work in this occupation face.
1.68 The production of coir fibre, yarn andropes have important uses from time immemo-rial. The 1931 Census of Travancore has this tosay about this industry:
"The importance of coir industry can begauged from the fact that out of 3 lakhindustrial workers, 1.3 lakh or 36 per centare empoloyed in this industry alone, andthat out of the total export trade ofRs.11.25crores in 1930, the value of the products ofcoir yarn industry exported from the countryamounted to more than Rs.2 crores.' [Censusof Travancore, 1931]
1.69. The overwhelming majority (80 per cent)of the workers in coir factories came from thesocially background Ezhava community andthey are mostly women. As a result of certainindustrial advantages that the coir industryreceived in the 1850*8, it got concentrated in thedistrict of Alleppy. This concentration helped
10
i !

IAlleppgr to become the centre of the workingclass movement The coir workers organisedinto unions shortly after the agriculture onionswere founded.
1.70. In the cashew industry also, ninetypercent of the workers are women. The industryis concentrated in the district of KoUam.
'the expansion in the cashew industry tookplace from the mid-thirties onward. From amere 237 workers in 1921 the number rose tomore than 8000 in 1931 and continued togrow during the subsequent three decadesreaching around 100,000 workers by thesixties.' [Kannan, 1988}.
1.71. The working conditions in the industrywere deplorable. Long hours of work, unhealthysurroundings and meagre remunerationcharacterised the industry. To fight for betterwages and working conditions, organised actionsby the workers date back to 1920*8 and 1930*8.While various struggles for unproved conditionssaw active participation by women, it cannot beoverlooked that even in these two industrieswhere women far outnumbered men, leader-snip remained predominantly male.Kannan (1988) has the following observations tomake regarding women's participation inleadership roles in trade union movements:
"Despite their numerical strength, womenagricultual labourers remained, and still remainlargely absent from both local and state levelorganisations. Whenever they are represented itis meraly symbolic. This is despite the activeparticipation of women agricultural labourers inKuttanad and their effectiveness in confrontingland owners to concede wage demands...invarying degrees, the absence of any real partici-pation by all women at all levels of leadershiphas continued to this day. While their help wasactively sought and second during the earlystages of mobilization and organization, theywere not incorporated into the important levels ofleadership and decisionmaking though womencontinue to be active in rural struggles. '
Women and Work
1.72. While old ideas about family and society,work and wages were giving place to new ones,not necessarily to the advantage of women, there
was one area, namely education, in whichwomen of Kerala were to make a perceptibleadvance over the past hundred years. The valuefor education including that for women wasJnfUlcatffl through vrnvnin rhnnnok Novelsand other literary works in Malayalam aboundin extolling the desirability of education.Chandu Menon's Indukkha, published in 1891,celebrates women's education. KumaranAsan'sDuravastha', published in 1922, was builtaround the theme of education of low castes.These were two most influential pieces ofwriting of the time.
1.73 By 1930, not only were women in Keralagoing in Urge numbers for school level educationbut also families were wiling to send theirdaughters for even higher education if it wasevident that it would result in salaried work.(Unemployment Enquiry Committee ofTravancore, 1928). Salaried women workerswere becoming increasingly common. Thus notonly was there already little opposition toeducating women but also the taboo againstsalaried employment had gone. Indeed, womenwho gained distinction in education werepublicly acclaimed and applauded. Drawing onthe life story of Mary Poonen (1886-1976) adoctor with a very distinguished academic andservice careeer, Jeffrey (1992) notes as follows:
'Just as matriliny had provided models ofbehaviours in old Kerala, British practicesoften mediated through Syrian Christianslike the Poonens provided models for the newKerala. But under both old and new codeswomen had room for manoeuvre that wasunique in India and most parts of the worldat that time.'
1.74. The number of working women in Keralahad become large enough by early 1930*8, indeedso large that an enquiry into education in 1933lamented that girls were going to schools inlarge numbers not because of the 'cultural value'of education "but as direct means of securingemployment and competing with men in theopen market'(Travancore Educational ReformsCommittee, 19331
Health Interventions
1.75. The story of health interventions issomewhat similar to that of education in Kerala.They started quite early and their impact was
11
IT

wideqmad. The princrif n l a n of Itavancontook an early interest a t only in the spread ofwestern education bttf afao in wasteni medicine,pieventwe as well as cmtive. The first modemhospital was built in 1B1T inTniruvananthapuram a d by 1886 there were 31niedieal institutions m Travancore. As early as1878 all government waken, students andhospital patients in Trarancore were required toget themselves vaccinttd against small pox.
1.76. When the Rockefeller Foundation came toTravancore in 1927 to act up a health centre inNeyyattinkara, then a najor village nearThiruvananthapuram awn, ita representativesreported that Travanccw already had featureswhich endowed it with ^cmendous potential forsuccessful public heart* work. First, a sufficientnumber of suitable nurses and female healthworkers existed, unlike B the rest of India.Second, equality between men and womenexisted in the social, educational and politicalrealms. Third, Travanore had the mostefficient system of hospxals and dispensariesfound in India. There «as a medical insitutionwithin six miles of mos !arge villages andmedical aid, including ings , was free to all. Infact, the Foundation vismrs were so impressedthat they went so far at a suggest Travancoreas a Training Centre far malaria officers andsanitary engineers for d e Far East and fortraining nurses for the s s t of India. Though theFoundation had undertaken similar activity inboth Madras and Trarocore, the much greatersuccess achieved in Trmncore was due torelatively better levels it* women's education andlack of inhibition to takr to medical work.
1.77. The Rockefellar Frandation wound up itsactivity in 1937, after a fccade of work. Infantmortality was recorded is 83 per 1,000 livebirths in Neyyattinkara. where their work wasbased. For the corresponding census period,infant mortality rate for India as a whole was207. That the attention paid to health care inTravancore-Cochin had s lasting impact canalso be seen from the tool mortality rates of thetime. It is estimated thic during 1957-60, crudedeath rate in Travancore-Cochin was about 12per 1000 population wbea the correspondingrate for Malabar was 430 per 1000 populationIU.N, 1983).
Education
1.78. Health edn spatialimportance in the educational pny^mm* forgirls, leschen were required to take a course inhygiene. By 1943, all government school textsincluded lessons in hygiene. Also a course inhygiene was made compulsory in all primaryand secondary schools. Housekeeping andnursing were made compulsory subjects for girtsin the final examination for high schools. Thuseducation was used explicitly to promote ideasrelating to health and hygiene and attendingschools meant a great deal more than learningthe three R'slGulati, 1991).
Training in Nursing
1.79. Formal nursing courses were started in1920 in both Travancore and Cochin states. Theintake in these courses increased however onlywith the expansion of health services when therewas a reasonable assurance of jobs. Until 1950,around 75 nurses were graduating annuallyfrom these courses. By 1977 there were 9government and 17 private nursing schoolsturning out 450 nurses a year. Today Keralasupplies nurses not only to the rest of India butalso to the many parts of the world.
1.80. Women were inducted as health workersas early as 1871 when four "obstetric nurses ofNair caste* completed their training and startedattending on women in child birth and other sickwomen [Jeffrey, 1992|. It would appear that fromthen onwards women were enrolled to work ashealth workers in maternal and child welfarecentres. Efforts were made both in Cochin aswell as Travancore parts of Kerala to trainwomen as qualified midwives. Already in 1901,there were 32 licensed midwives, six nursesaffiliated with the State Medical Departmentand eight female vaecinators attached to theSanitary Department in Travancore [Gulati,1991). The women and children's hospital wasestablished in Thiruvananthapuram in 1916. Itwas run by women and by 1938, treated close to150,00 patients in a year [Jeffrey, 1992).
Summing up
1.81. Given the above socio-economic back-ground in the state in the areas of women'sstatus, education, work and health, what one
12

observes is that Kerala society b a shown theresilience to make and nwintiW major changesand that these can be effected vrthin a reason-able period of time What follows now is adetailed analysis of the contemywy situationas it affects women in the variosi sectors.
13

p
Growth of Population
2.1 Demographic changes in a populationhave a direct bearing on the growth anddevelopment of the women in the population. InKerala, rapid demographic changes have takenplace within a short span of two decades. Thestate is now in the forefront of the demographi-cally advanced areas because of factors likedeclining birth rates, low death rates, low infantmortality rates and high literacy rates especiallyof women. What is the impact on the growth ofthe state's female and male population? What isthe current status of the demographic factorslike birth rate, death rate, etc.? What are theimportant demographic features like sex ratio,marital status of females, fertility rates etc ofthis population? This section deals with theseissues.
2.2 Successive enumeration of the populationof the state indicated an acceleration in its
growth since the beginning of this century till1971 (see table 2.1). While the nations' popula-tion had increased by 2.3 times that of Keralahad increased by 3.34 times. The increasingtrend in the rate of growth of state's populationwas halted by 1971. The growth record in thedecade of 1961*71 can be reckoned as thedemographic watershed of great significance.From 1971 to 81, the decadal growth rate fell byabout 27 per cent Though expectation was ofrather slower decline in the next decade, thedemographic transition in Kerala in 1980*8turned out to be more dynamic than that of1970*8. During this period the growth rateregistered another 26% reduction. At thenational level the growth rate continued itsaccelerating trend during 1971-81 and a slightdeceleration in 1981-91. In Kerala howeversince 1971 the growth rate of population hasshown steady decline and has reached an annualgrowth rate of 1.3% by 1991.
f
Year
190119511961197119811991
Source
Table 2 .1 : Population growth in Kerala and India.
Kerala (000)
TotalPopul-ation
63961354916904213472545429099
Decadalgrowth%
•
24.7626.2819.2414.32
FemalePopulation
320568678542
107601292614810
1
Decadal- growths
(million)
-24.3925.9720.1314.58
: Statistics for Planning, 1993, DBS.
ndia (million)
Total•> Popul-ation
238361439548685846
Decadalgrowth%
•
21.5124.8025.0023.50
FemalePopula-tion
117176213264331407
Decadalgrowth
%
-21.0223.9425.3822.96
14

2.3 The declining tread s u m 1971 i« notice-able in the growth rate of female population aawell The growth in female population of thestate wa> however slightly higher than that ofmales throughout the 20th century. Whilefemales outnumbered males by over 13,000 in1901, the gap had steeply increased to 520,000by 1991. However during the period 1951-71when the total population increased by 58%, thefemale population registered a slightly low rateof (57%) increase. A reversal can be noticed inthe two decades that followed. As against 36.3%growth in total population, female populationregistered a growth of 37.6% during this period.During 1981-91, female population increased by14.6% whereas total population showed anincrease of 14.3%.
2.4 Thus, while in 1901 the female populationof Kerala constituted 2.4% of the total femalepopulation of the country and this percentagehad sharply increased to 3.6% in 1991.
District-wise Population Growth
2.5 Of the 14 districts listed in Appendix. 1,the first six formed part of the formerTravancore state while the succeeding twocomprised the entire former Cochin State andthe remaining six districts formed part oferstwhile Madras Province. It can be seen thatthe six districts in the Travancore regionregistered the lowest population growth ratesduring 1981-91. It varied between 5.60%(Pathanamthitta District) and 13.05%(Thiruvananthapuram District). Populationgrowth in the two districts of former Cochinstate was moderate (11.12 and 12.21). All thedistricts in the Malabar region registeredrelatively high growth rates, ranging from16.53% to 28.87%. The highest growth was inMalappuram District (28.87%) and the lowest inPalakkad District (16.53%). Compared to thedecade of 1971-81, all the districts in the stateshowed a clear and noticeable declining trend intheir population growth rates. One can saytherefore that while all the three regionsunderwent demographic transition during thisperiod the pace was distinctly different. Thiswas attributable to the fact that parameters likebasic literacy and health in the three regionsdiffered widely. When compared to Malabarregion, Travancore and Cochin regions hadsignificantly lower levels of mortality and
higher life expectations. Malabar region laggedbehind not only in infrastructure but abo in thechange* in the institutional social and economicstructures which were so important for thistransformation (Kabir and Krishnan, 1992).
2.6 The female growth rate observed in 1981-91 more or less followed the same tread in thetotal growth rate. In all the districts exceptKasargode and Thrissur, female growth ratesexceeded the total growth rate. In Kasargodedistrict while the total growth rate was 22.78%,female growth rate was slightly lower, ie 22.30%and in Thrissur against the total populationgrowth of 12.21%, female growth rate was11.5%. The highest growth in female populationwas registered (28.9%) in Malappuram districtand the lowest increase of 5.88% inPathanamthitta District Thus the highestincrease in the females was nearly Five timesthe lowest rate of increase.
Religion-wise Population
2.7 Table 2.2 presents the breakup of Kerala'spopulation by major religions. It can be seenthat the state's population is quite diversified.Further, during the decade 1971-81 the growthof Muslim Population was significantly higherthan that of Hindus and Christians. However,as is noticed later in this chapter that differencein population growth are much more closelyrelated to the socio-economic level of the districtrather than religion. The district-wise distribu-tion of population by religion of head of house-hold is presented in Appendix.2. It shows thatthere are significant differences between thedistricts in regard to the religious composition.It may be mentioned that scheduled castesconstitute 9.92% of the total population, whileScheduled Tribes 1.1%.
The term *Scheduled Castes* / 'ScheduledTribes* (SCVST) are an expression standardisedin the Constitution of India. Under the directiveprinciples of the State policy in Article 46 of theConstitution, it is laid down that the state shallpromote with special care the educational andeconomic interests of the weaker section of thepeople in particular of the Sc's andSf s and shallprotect them from social justice and all forms ofexploitation. The district-wise distribution ofSC/ST population is presented in Appendix 3.
15

Table 2.2: Popol^k. under different RcUgkni te
fo«U (1171-1981).
Religion Population Percentage to Tbtal Decadal Growth Setin 1971 1981 1971-81 Ratio
million Females1981 per 1000
Hindus
Christians
Muslims
Others
Total
14.802
5.234
5.413
0.005
25.454
59.41
21.05
19.50
0.03
100.00
58.15
20.56
21.27
0.02
10000
Source: Various Census Reports, 1971 and
16.70
16.46
29.96
20.44
100.00
1981.
1037
1014
1036
797
1034
Density of Population
2.8 Among the states in India, Kerala rankssecond in population density, of 749 persons persq.km as against the national average of 267:The fact that Kerala's population densityincreased from the estimated figure of 165 for1901 to 749 for 1991 means that the number ofpeople occupying one sq.km of land area inKerala increased by 584 during the last ninedecades.
2.9 District-wise population density figuresare presented in Appendix.4. It can be seen fromthe appendix that nine districts had a popula-tion density higher than the state average.Throughout this period while Alapuzha districtcontinued to be most densely populated, thedistrict of Idukki registered the lowest density.When compared to toe national average offemale density of 121, the state has nearly threetimes more women per sq.km.
2.10 As a result of these demographic trends,Kerala achieved the distinction of one of themost densely populated states in the country, atrend noticeable even at the commencement ofthis century.
RuraHJrban Density
2.11 One of the distinguishing features ofKerala state is the absence of strong rural-urban
distinctions. This is so in terms of the topogra-phy of its land or settlement pattern. Also thehabitabtion pattern in Kerala is quite differentin that the houses in this state are not clusteredin one portion of the village; instead they arescattered with plenty of space in between thestructures and with compound walls oftenseparating them. Yet the urban areas are moredensely populated. According to 1991 census,26.4 per cent of the population live in urbanareas and they account for 9.13 per cent of thetotal geographical area. The urban areas consistof 93 towns and 16 urban agglomerations (as percensus definition). It is noteworthy that thisstate has only one city having a populationexceeding one million (Cochin city -1.14 millionpopulation). It has two cities with a populationof 0.8 million and other cities or towns arehaving population of less than 0.5 million.
Structural Features of the PopulationSex Ratio
2.12 In the population composition of India,males have consistently exceeded females inevery census period. Even according to thelatest population census of 1991, the sex ratio,females per 1000 males, registered a furtherdecline from 934 in 1981 to 929 in 1991. ThisIndian pattern is in contrast with the positionobtaining in most developed countries. Kerala,it seems, follows the pattern of the developedcountries. The sex ratio of Kerala is unique in
16

the country. It is the only state in India havingan excess of females over males.
2.13 As can be seen from the Table 2.3, thistrend was there from 1901 onwards. At thenational level there has been a steady decline inthe sex ratio over the last nine decades. InKerala, a steady increase in the sex ratio wasnoticeable till 1951, then there wat a slightdecline over the next two decades followed by a
fast decline in the female infant mortality ratesand the increase in life expectancy of women.
2.15 District-wise sex ratioe are given inAppendix.5. It is noteworthy that whereas in1951 five districts had reported sex ratiosadvene to females in
1991 only two districts fell under this category.Of the former five, four belonged to the erst-
reversal upwards in the subsequent two decades,from 1971 to 91, when there was a steepincrease in the sex ratio.
Table 2.3 Sex Ratio in Kerala and India,1901-
while Travancore region and one belonged toMalabar region.
Table 2.4: Population Growth in Kerala
Population of Kerala 1000) Decadal Growth Rate
Sex Ratio (Females Per 1000 males)Census Year Sex Ratio
Kerala India Gap
Year Tbtal FemalesPopulation
Tbtal FemalesPopulation
1901191119211931194119511961197119811991
100100810111022102710281022101610341036
972964955950945945941930934929
3244567282838186100107
1901191119211931194119511961197119811991
63%714878029507110321354916904213472545429099
3205358839234804558868678542107601292614810
-11.769.1521.8516.0422.8124.7626.2819.2414.32
-1195
9.3422.4616.3222.8924.3925.9720.1314.58
Source: Census of India, 1981 and 1991,
2.14 The gap with the national level sex ratiokept widening all through the first fifty years ofthe 20th century. The gap in 1991 was morethan twice as large as in 1901 between Keralaand India. Between the decades, from 1901 to1951, sex ratio, in Kerala gained only 24 points,roughly 0.5 point per annum, as against 20points or 1 point per annum, gained during theperiod of 20 years from 1971-91. As pointed outearlier, though the state bad experienced thehighest female growth rates during 1951-71period it was still slightly lower than the growthrate of total population. Also, despite a signifi-cant drop in the subsequent decades in bothoverall population and female growth, femalegrowth was slightly higher, see Table 2.4. Whatcould be the factors that have contributed to theincrease in sex ratio in Kerala? Among severalother factors to explain this trend could be the
Source: Women, Men and Development inKerala, 1995
By 1991 three out of four districts in Travancoreregion could reverse the trend in sex ratio andreported increased number of females overmales. Even the remaining two districts, Idukkiand Wayanad can be seen to have registeredsignificant improvement in their sex ratiobetween 1951 and 1991.
2.16 Rural-Urban differentials in sex ratios arealso found to be significant in some of thedistricts, although for the state as a whole thegap is rather small. This can be seen fromAppendix 6.
2.17 In 10 out of 14 districts, the urban sexratio in 1991 was lower than the rural sex ratio.At the state level also this is so though thedifference was only of 3 points. Out of the 10districts with higher rural sex ratio, two happen
17

to be thoee with below par overall sex ratio, andin one, Wyanad, rural H E ntio w higher by SOpoint*. It is the district with the knrest urbana n ratio, (917) in the state. InnoaeofthelSdistricts is the rural set ratio w km as that,even though, as pointed out above, in fourdistricts rural sex ratio is lower than the urbanaex ratio.
Birthrates
2.18 Despite the existence of the system ofcompulsory registration of all births and deathsin this state for a very long period, it is stillgrossly deficient and cannot form a dependablesource of data for any meaningful analysis.However under the supervision of the RegistrarGeneral of India a sample registration survey(SRS) is conducted under which birth and deathregistration is being carried out in selectedsample villages and towns in each state of India.This continuous survey by the Registrar Generalof India provides annual estimates of both crudebirth and death rates for all the states. Thaisthe most reliable source of assessment of birthsand deaths at the all India level. Appendix. 7presents the crude birth and death ratesestimated on the basis of inter-censal growth ofpopulation during 1951,61,71 and 81 censusperiods and those thrown up by the sampleregistration system for the period, 1966-93.
Decline in fertility
2.19 Fertility, it is generally believed, is closelylinked with socio-economic actors. In Kerala, by1991 these relationships seem to have becomeweaker in the sense that in order to see the linksone has to look at the disaggregated picture bydistricts. It is the socio-economic situation of thedistrict a woman lives in, which makes a greatdifference [Zacharia e t a l 1994). Kerala hasexperienced the sharpest fertility decline inIndia in recent yean. Despite its levels ofincome and nutrition being among the lowest,the state has achieved results in controllingpopulation growth comparable to those in themost successful middle income countries.During the course of past 30 years, the fertilityrate in Kerala declined from an average level ofabout 6 children/couple to less than 2 children,a level that could, it is feared, cause Kerala'spopulation to decline if allowed to persist for asufficiently long time.
120 In the fifties KeraU'i birth rate was one ofthe highest in the country and by 1990 it becamethe lowest From 1961-61 to 1985 the nationalbirth rate declined by 9 points whereas thedecline in Kerala's birth rate was by 20.6 pointsduring the same period. If we consider the lasttwo decades, the birth rate of Kerala declined by4.3 points during 1971-80 and 6.6 points during1961-90, showing an acceleration in the declineof birth rates in recent yean. For the sameperiod, the all-India birth rate came down by 3.2points and 4 points respectively. During 1985-91, the fall in Kerala birth rate was by nearly 5points as against only 3.6 points in the nationalbirth rate, (Appendix-7),
Inter-district Differences.
2.21 For understanding the dedine of birthrates, an analysis at the district level has to bemade. Appendix.8 gives the district wise birthrates obtained from S.RS. It is to be noted hereby way of caution, that the district-wise samplesize under S.R.S is not large enough to drawstrong inferences. In the absence of any othersource however the data obtained from SRS forthe years 1983-88 are relied upon for ouranalysis.
2.22 It can be seen that there is a dear regionalgradient to fertility. In 1983 three districts ofMalabar region (Malappuram, Wayanad andKannur) had birth rates exceeding the stateaverage rate of 24.9. The same trend wasnoticeable in 1988 also but barring Wyanad inwhose place Kasargode registered a higher rate.In all the districts of Travancore and Cochinregions birth rates ranged between 18.1 to 21 in1983 and 14.8 to 20.5 in 1988.
2.23 At the time of formation of the Keralastate, the birth rate in Malabar region was 45.6and that for Travancore-Cochin region waB 35.Inspite of a rapid reduction in the overall birthrate of the state, the gap between the above tworegions has persisted, though at a reduced level.A recent study shows however that the declinein fertility cuts across all classes and groups ofpopulation [Zacharia, 1994).
Total Fertility Rate
124 In addition to the crude birth rate, thefertility measure most commonly used is the
18

total fertility rate (TFR). TFR measures theaverage number of children • woman couldexpect to have before reaching the age of 50years, given the prevailing levels of age specificfertility rates. It is an important measurebecause it is standardised for the population agecomposition. Table 2.5 presents comparativeTPR estimates for Kerala and India. In the 20-yearperiod of 1971-91 there was a decline of 2.3children per woman in Kerala as against 1.6 inIndia.
2.25 Appendix, 9 gives the age specific fertilityrates in rural Kerala. These rates reveal thatwhile in 1971 the maximum number of birthsoccurred in the age group of 25-29, from 1981onwards there has been a notable backwardshift to the age group of 20-24. It also showsthat child bearing in Kerala in recent years isconfined more and more to a relatively shortspan of woman's fertile period. Nearly 80% ofchildren in Kerala are bom to women in the agegroup of 20-29.
Year
19711981198219831984198519861991
Source:
Table 2.S: TFR estimate forKerala and IndU.
Kerala
4.12.82.92.62.62.62.31.8
S.RS Bulletin Annual,]Welfare Programme Year Book •'Kerala.
India
5.24.54.54.54.5.3.63.6
992 & FamilyGovernment of
2.26 The order of birth statistics presented inAppendix. 10 for 1991 is also revealing. Amongthe births that occurred during the year 1991nearly 80% comprised of first and second orderbirths. The birth interval data given in Appen-dix. 11 shows that for more than half themultiple order births the spacing was of morethan 30 months.
2.27 While a woman's reproductive span inKerala has been reduced drastically in recent
part significant differences between districtsremain. In (act according to one recent study,district of birth has become a very strongindicator of a woman's fertility even when all therelevant socio-economic factors are taken intoconsideration. A woman born in Malappuram islikely to have a large family irrespective of herreligion, level of education or work status(Zachaha, 1994).
2.28 The same study has shown that there isconsiderable dynamism in the demographicprocess even in Malappuram District (thedistrict with the highest birth rate]. During thelast decade, the TFR in that district declined by2.0 children per woman from 3.7 (compared to1.3 in Ernakuiam Dist) Likewise, the infantmortaliy rate (IMR), in that district declined by48%. If the rate is maintained for anotherdecade the IMR would be only 17, the 1990 ratefor the whole of Kerala.
Marital Status
2.29 The proportion of never married women intotal population is one of the measures ofmarital status. By this measure, there haslately been a decline in Kerala in the proportionof never married women from 51 percent in 1981to 46 per cent in 1991. If women above 14 yearsof age alone are considered, the never marriedwomen accounted for 24.8% in 1991 as against25.4% in 1981. Clearly the proportion of marriedwomen has increased in the state. Leaving outwomen less than 15 years of age the increase inthe married females is from 58.6% in 1981 to60% in 1991. It is relevant to note in thiscontext that the proportion of younger femalepopulation less than 15 yean of age has declinedfrom 34.1% of total in 1981 to 28.4% in 1991. Asfor the category covering widowed/divorced/separated, its percentage increased from 10.5 in1981 to 10.8 in 1991, leaving out female popula-tion less than 15 years of age.
'2.30 Age-wise marital status of female andmale population is presented in Appendix 12.The changes from 1981 to 1991 can be said to bein the expected, direction. The proportion of"never married" men and women between 15-39increased during 1981-91. It is noteworthythat lew than 10 p«r cent of women inKerala in the age group 15-19 were marriedin 1991. This itself points to a significantincrease in the age at manage of females during
19

this period. Also, upto age 49 there was a declinein the proportion of the widowedAffivorad/separated. This could be a reflection oftsubstantial improvement in the longevity of bothmen and women.
Age at Marriage
2.31 In Appendix. 13 are presented the changesin age at marriage in Kerala and India from1901-1981. As can readily be seen, even at thecommencement of this century the average ageat marriage of women in Kerala was quite high,being 17.1 years as against 13.2 years in India.By 1981, the female age at marriage had risen inKerala to 21.9 years as against 18.3 years inIndia. In a study of demographic transition inKerala in 1980s which had relied mainly on thefertility changes noted in the selected 3 districtsof Kerala, it has been pointed out that Nnthevery increase of an year in the age at marriage,the total number of children ever born to awoman decreased by 0.11 to 0.22 child accordingto the district*
2.32 It will be recalled that between 1971 and1981 the TFR for Kerala registered a drop, by1.1. During the same period there was anincrease of 1.1 year in the average age atmarriage of women. This indicates dosecorrespondence between the rise in female age atmarriage and the decline in fertility, at least forKerala.
Mortality
2.33 It is generally recognised that in the firststage of demographic transition, mortality ratesstart declining while the fertility rates wouldcontinue to remain high. The decline in fertilityfollows with a time lag. Kerala also experiencedmore or less the same pattern of change. Thecrude death rate in Kerala declined from 19.7during 1951-60 to 11 in 1966,6.6 in 1981 and 6.0in 1991 (see Appendix 7). During this periodIMR declined even more sharply, from 120 in1951-60 to 66 per 1000 in 1961-70 and to 17 in1991. Thus there can be no doubt that deathrates for Kerala declined steeply in a relativelyshort period. By comparison, the reduction inbirth rate was at a slower pace from 43.9 in1951-60 to 37.1 in 1961-70, to 25.6 in 1981 and18.1 in 1991.
2.34 As a consequence of the decline inmortality there has been an appreciableimprovement in the expectation of life at birth inKerala. The values of expectation of life at birthfor Kerala and India are given in Table 2.6.
2.35 The gain in expectation of life at birth inKerala for women during the period 1951-61 to1986-88 works out to 27.7 years which is higherthan the gain of 23.2 years for men. Thecorresponding figure of gain during the periodfor India works out to 21 years for both men andwomen. Thus the gap between the state levellife expectancy and that at the country level haswidened for both the sexes, especially so forwomen, during the period.
Infant Mortality
2.36 Reference has been made above to the factthat IMR has dropped significantly in Kerala inthe last three decades. The latest figure is 13 for1993. This steep reduction in 1MB to a levelcomparable to some of the best in the world alsocontributed to a substantial fall in the crudedeath rate for the state.
Table 2.6: Expectation of life at birth forKerala and India.
Period
Prom Census1951-6161-7171-81
FromSRS
71-7576-8081-8586-8887-8988-90
KeralaM
44.354.160.6
60.563.565.267.567.667.3
F
45.357.462.6
63.067.471.573.073.974.7
IndiaM
35.543.249.8
49.751.754.556.0
F
35.743.549.3
48.351.854.956.5
Source: Demographic Transition in Kerala inthe 1980s CDS-Monograph Series k EconomicReview, 1994
2.37 The district-wise IMR estimates are notavailable from SRS. The Registrar General ofIndia has published district wise IMR values
20

based oo 1981 census data. Tbe relevantestimates are presented in Appendix 14.
2.38 It may be mentioned that the aboveestimate of IMR of 52 for Kerala does not tallywith tbe SRS estimate of 37.4 far 1981. But itdearly shows that high infant mortalityconditions prevailed in certain districts likeIdukki, Palakkad and Wayanad. According tothe three district study, the WR values for theperiod 1985-89 in the districts of Ernakulam,Palakkad and Malappuram had declined to 11,34 and 28 respectively. This indicates that thewide variations in the IMR values among tbedistricts even now continue.
Age Composition
2 39 The age composition ofa population is aproduct of the birth, death and migration ratesthat have operated over a period of three to fourgenerations. A comparison of the 1981 and 1991age distribution of Kerala's population {Appen-dix. 15) shows that the proportion of populationunder 15 years of age declined sharply from 35per cent in 1981 to 30 per cent in 1991. Thefemale population under 15 declined from 34.1%to 28.5%. From the age group 20-24 yearsonwards the proportion has increased in all theage groups. In fact the proportion of above 20years women increased steeply from 53.8% in1981 to 61.4% in 1991. It is interesting to notethat there were 72 females under 15 and over 60years of age for every 100 females 15 to 60 yearsof age in 1981. The corresponding number offemales in 1991 had come down to 59. This wasbecause there was a significant drop in tbe shareof the youth population in the total population in1991. Though there had been a decline in thepercentage of females below 15 years of ageduring 1981-91, female population above 60years increased from 7.8% in 1981 to 8.5% in1991. The question that has suddenly startedbothering the demographers and other socialscientists in the state concerns the alarming rateof growth of the elderly (60+).
Summing Up
2.40 What are the major highlights of thischapter and what are its implication for womenin this state ? Most importantly, fertility level inthe state has already reached replacement level.The deceleration in population growth ratesstarted during 1961-71. Inter-district differ-
ences in fertiltiy levels are, however, importantto take note of. The'district effect meaningthereby the whole garnet of factors like aware-ness, efficiency of and access to services, is veryimportant While the overall infant mortalityrate for the state is quite low, wide inter-districtvariations still persist
2.41 Family size norms have changed acrossdistricts and consequently narrowed thereproductive span to around ten years betweenthe ages of 20-29 years. The age distribution ofwomen is also going through a major structuralchange with those below fifteen years decliningand those above 60 increasing. Among the ageda very high proportion are widows who are likelyto be totally dependent on the family.
2.42 The major implications of these transfor-mations are that women will be enteringmarriage at a later stage in their lives and willbe released early from child bearing duties.Therefore they will become available forproductive work for a longer number of years.So the question of generating adequate workopportunities for women assumes increasingimportance. In this context one has to remem-ber that the burden on the working age womenwill be higher and higher with the need to carefor elderly widowed women with no income andpoor health.
21

3.1 Long before the attainment of the coun-try's Independence the state of Kerala had agood record in the field of education. This, ashas been noted earlier, was mainly possiblebecause of the progressive educational policyfollowed by the rulers of the erstwhileTravancore-Cochin region and the educationalactivities of the Christian missionaries.
Literacy and Literacy Level*
3.2 Literacy rate in any country indicates thebasic educational background of the population.Female literacy indicate women's comparativeposition in relation to men's literacy status. Theposition in Kerala since the beginning of thiscentury in regard to total and female literacy ispresented in Table 3.1.
Table 3.1 Growth of literacy in Kerala and India, 1901-1991
Percentage of literate* among the total population
1901 1911 1921 1931 1951 1961 1971 1981 1991
Kerala 1114 13.31 19.02 21.34 40.47 56.85 60.42 70.42 77.96
India 5.35 5.92 7.16 9.50 16.67 24.02 29.45 36.03 52.31
Percentage of literate* among women.
Kerala 3.15 4.43 10.26 11.00 31.41 38.90 54.31 65.7 75.25
India 0.60 1.06 1.81 2.93 7.93 12.95 18.68 24.73 39.29
Source: Economic Review (1994)
3.3 It may be noted that the literacy rat% offemale population in Kerala in 1991 stood at75% while the corresponding number was only39 at the national level. Literacy level, femalesas well at general, was higher in Kerala than inIndia even at the beginning of the century butmajor progress has been made in the state in the
second half of this century and the progress hasbeen particularly rapid in female literacy so thatthe gap between total literacy has narrowedconsiderably. The gap in 1991 was 2.7 percent-age points in Kerala as against 13.02 for India.
3.4 It is significant "1*° that after excludingchildren in the age group 0-6 years, totalnumber of illiterates in the remaining popula-tion of the state in 1991 comprised of 1.79million females and 0.79 million males. Thusilliterate women outnumbered illiterate men inthe ratio of nine to four.
Differences in literacy level*
3.5 Interestingly, while gender difference inliterary level in the state at the aggregate levelhas been considerably reduced, it does existamong certain groups. The rural-urban gap infemale literacy level of the state was of 4.3percentage points in 1991, which as can be seenfrom Table 3.2, was almost half the gap of 7.9percentage points in 1981. So, there wasconsiderable narowing of this gap within adecade. The same cannot be said of the gap infemale literacy among the Scheduled Tribe (SDpopulation of the state.
Table 3.2 Female literacy Rates in Ruraland Urban areas of Kerala, 1971-1991
Year Rural Urban
197119811991
53.164.374.1
60.672.278.4
Source: Economic Review • 1994.
3.6 The gap in female literacy among STpopulation should be a cause for real concern,even in Kerala. While female literacy in 1991among the Scheduled Caste (SC) population wasdoM to that of the entire state (74.31% as
22

f
h
against 75.25%), that among STwis only 41%and this should be a cauae far concern. Abo, ofconcent should be the iter-district differences infemafe literacy.
biter-district Differences
3.7 In Appendix. 16 district-wise effectiveliteracy rates are presented. For the calculationof the effective literacy rates, population in theage group below 0-6 years has been excluded.Two districts, in the erstwhile Travancore-Cochin region and four districts in the Malabarregion are having a female literacy rate belowthe state average of 86.17%, with Kasargod,WayanaH and Palakkad accounting for themajority of illiterate women of the state.
Educational Attainments.
3.8 It may be of interest to know the educa-tional attainments of those women in Keralawho are literate. The National Sample Surveyresults for 1986-87 indicate that of the literatefemale population of Kerala 59% had not gonebeyond primary level, 25% had acquired middleschool education, and only 16% had qualified formatriculation and above. In this last category,urban areas do much better than rural areassince every second household in the former hadone woman with this qualification whereas inthe latter this was true of every fourth house-hold (see Table 3.3)
Table 3.3: Distribution of literate women according toeducational level (1986-87)
Literate, includingPrimary / educationPrimary/junior basicMiddle/Senior baskTechnical vocationalschool courseMatric/school leavingcertificate and aboveHigher secondary/pre university/intermediateAbove intermediate
Total literates
Rural
18.3027.9218.64
0.07
7.27
1.572.40
76.17
Level of Education
Urban
3.835.744.77
0.05
2.37
0.611.18
18.55
State
22.1333.6623.41
0.12
9.64
2.183.58
94.72
Distribution %
23.435.524.7
0.1
10.1 *
2.33.8
100.0
Source. Results of NSS 42nd Round, July,1986*7,Samkahana, April-June, 1993.Note : Out oftotal estimated women of 125.49lakh, 6.39 lakh have not reported their level ofedncation.They have been excluded in workingout the percentage distribution.
3.9 It is noteworthy that the expansion inoverall literacy level (ie. of men as well aswomen) in Kerala has taken place alongside theexpansion of educational institutions as well asthe increase in goverment expenditure oneducation. At the school level, accent inexpansion has been on Upper Primary Schoolsand High Schools. The number of LowerPrimary Schools in 1993-94 was no higher thanthat in 1961-62 whereas the number of UpperPrimary Schools and High Schools was higher by50 per cent and 300 per cent in 1993-94 than in1960-61. Clearly, the overall emphasis ineducation policy over the past 30 years or so hasbeen to expand facilities for education above thelower primary level. Indeed, given the demo-graphic trend, the problem now envisaged isconnected to the continuing decline in studentenrolment in the lower primary schools andseveral of the exiting schools becoming uneco-nomic.
School Enrolment
3.10 Total school enrolment of girls in the stateincreased from 2.75 million in 1983-84 to 2.86million girls in 1994-95. However, in the lowerprimary stage the number of girls enrolleddeclined from 1.22 million in 1983-84 to 1.14million in 1994-95 i.e by 5.5%. The decline wasof 5.6% for boys. It is important to note that94% of the rural population in the state is servedby a lower primary school within a distance ofone kilometer and 98% within a distance of twokilometers. As much as 96% of the ruralpopulation is served by an Upper Primary schoolwithin a distance of three kilometres. Theproportion of the rural population with access toa high school within a radius of 8 kilometres is98%; It is this widespread educational infra-structure facilities, built up over the years, thathas helped the state achieve one of the highestrates of school enrolment (Economic Review,1994). It is pertinent to highlight here that girlsconstituted more than 52 per cent of the total
23

number of students who appeared for thematriculation examination in 1994. It is alsorelevant to note that school enrolment ratio ofgirts in the various district* more or lesscorresponds to the overall state pattern.
Disadvantage*! Groups
311 It will be recalled that of the two disad-vantaged caste groups, the one that is stilllagging behind significantly in female literacy isthe Scheduled Tribe. It is pertinent to ask nowhow this particular group is faring in regard toschool enrolment of girls. As against the femaleschool enrolment ratio of 49.2% for all communi-ties together, that of SCs is 49.0% and that ofSTs 48.7%. ST enrolment works out to 1.1%which is the same as ST population ratio for thestate. Special incentives are provided to S.C/ST families for sending their children toschools. These are in addition to the incentiveslike exemption from tution fees and noon mealsin primary schools available to all economicallyweaker sections.
Higher Education
3.12 Enrolment for higher education i.e beyondthe matriculation stage, is only a fraction ofthose matriculating each year. What should beof interest in our context is that in Kerala theenrolment of girls at the pre-degree level was54%. degree level 60% and post graduate level64% in 1994. The corresponding figures in1981-82 were 49,50 and 48 respectively.Evidently, over the years, there has been asubstantial increase in the enrolment of girls atall the three levels of higher education so thatthe girls now outnumber boys at every level.Women's enrolment in higher education inKerala far exceeds that in any other state ofIndia, with Kerala accounting for 6.3% (asagainst its 3.9% share of female population) ofthe total female enrolment for higher educationin the country.
Technical Education
3.13 The story of the participation of women inprofessional education, as distinguished fromhigher education, is quite different Theinfrastructure of technical education in Keralais comprised of 12 engineering colleges, 39polytechnics and 39 technical high schools. Inall the engineering colleges the proportion of
female students hat come down from one-quarter to one-fifth between 1992 and 1994. Inthe polytechnics, out of total student strength in1994 of 13,471 women constituted 31%.Medical Education
3.14 In medicine and related areas, the intakeof girls is much higher tl^n that in technicaleducation. There are five Medical Colleges inKerala. The total intake for various courses inall these colleges together was 448 in 1988-89.Of these the number of women was 230 showinga percentage of 51%. Of course, the proportionvaried from course to course, with 43% in thecourse in medicine proper to 88% in nnntng.
Government expenditure on education
3.15 Almost one-third of the state government'srevenue is currently spent on education. As aproportion of the government's expenditure onsocial services, it works out to 75% In percapita terms, government expenditure has beenon the increase; from Rs.85 per capita in 1980-81it increased to Rs.334 in 1992-93. After adjust-ing for overall price escalations during theperiod, per capita government expenditure oneducation in the state increased by one-third. Asa proportion of the state's domestic product,government's expenditure on education in-creased from 5.8% in 1980-81 to 7.2% in 1992-93.
3.16 The larger share of government expendi-ture on education in Kerala is, in a way, a legacyof the past. People used to contribute land,buildings and furniture for starting governmentschools and colleges and the governmentundertook to meet the running expenses. Later,in the era of the democratically elected govern-ments, the salaries and allowances of teachingand non-teaching staff of aided private schoolsand colleges were taken over as the stategovernment's responsibility. At present, nearlytwo-thirds of the schools in the state are privateschools. In higher education private collegesconstitute nearly three-fourth of the total. Therole of directly administered governmentinstitutions in the field of technical educationhas alao been comming down lately as newprivate, self-financing colleges are beingsanctioned. Out of 12 engineering colleges 5 aregovernment colleges (one of these is centrallyfinanced) but they accounted for almost 60% ofthe students in 1994.
24

Privsflt Expenditure
3.17 In addition to the expenditure that thegovernment incurs on education, households alsohave to make their contribution. From the NSS42nd round, information is available on expendi-ture incurred by the households for educatingtheir children separately for girb in primary andsecondary schooling. Household expenses oneducation include tution fee, examination fee,and other fees, payments for books and station-ery, appliances etc, uniforms, transport, privatecoaching (this item itself can be quite substan-tial in the Kerala context) and other incidentalexpenses. The results of the survey are given inTable 3.4.
3.18 The table shows that inspite of the factthat no school fee is charged upto the 10th
standard in Kerala, the households are incurringsiieable expenditure on children studying in theschools. Abo, educational expenditure incurredon boys is higher than on {iris and it is signifi-cantly less in government institutions. In thiscontext, it is relevant to note that the govern-ment cost per pupil is quite high. The estimateattempted for 1986-87 showed that the cost perpupil in primary schools was Rs.563 and in thesecondary schools Rs. 1043. At the higher level,expenditure per student is very much higher,particulary in the case of technical and medicaleducation. The proportion of government annualexpenditure on higher education includingtechnical education was over 20% where asstudents at this level comprised only 3% of thetotal number of 6 million enrolled at variouslevels in 1993-94.
Table 3.4: PereapiU Expenditure by Households onEducation 198647. (in Rupees)
Rural Urban
Female Total Female TotalChildren Children
Govt Institution 86 95Private institution 134 130
Secondary
125282
Govt Institution 264 243 314Private institution 297 299 424
129321
332478
Source:- NSS 42nd Round, July, 1986-87. Sarvekshana,April-June, 1993.
25

SunwwiQ Up
3.19 Education, no doubt, con fo enormousbenefits on a community, modi more so, theeducation of women. The education of rnothenresults in a high degree of awareness andcapability for efficient infant and child care.Educated mothers are abo better equipped inthe allocation of income on food and nutrition.All these (actors must have contributed tocreating the conditions of demographic transi-tion of Kerala, the outcome whereof is there forany one to see. Female education is stronglyassociated with a rise in the female age atmarriage, which, among other things, reducesthe proportion of married women in total femalepopulation.
3.20 The question that however remains is towhat extent the substantial participation ofwomen in education at practically every levelhas translated itself into their participation ineconomic activity in Kerala. It is to thisquestion that we turn in the next chapter.
26

4.1 Decennial census on population throwssome light on the female working population,their sectoral distribution, regional distributionetc Employment surveys conducted by theNational Sample Survey Organisation (NSS)also give detailed statistics on some of theaspects of female employment and unemploy-ment. In all these surveys a'worker'is usuallydeemed to be a person engaged in 'economicallyproductive work' including work that is remu-nerated and of work in family {arm or enter-prises for which DO separate, distinct payment ismade.
Definition of a worker
4.2. There is widespread criticism that thedefinition of 'worker' used in the populationcensus or employment surveys, tends to under-estimate women workers since many activitiesperformed by women within the householdsector do not carry monetary value and on thatbasis get excluded. A good part of women'swork falls outside the realm of wage in the formof domestic activities or subsistence farming.Household work imposes severe and shiftingconstraints on the type of employment taken upby women. Women shift jobs as part of thegender roles they need to perform in theirhouseholds.
4.3. In this context some of the results of theNSS 43rd round survey on employment andunemployment are revealing. The results showthat among Kerala women attending to domesticduties (who have been categorised in the surveyas non-workers) nearly 29% in rural areas and22% in urban areas maintain kitchen gardens.Similarly, 36.5% in rural areas and 9.5% inurban areas work in household poultry, dairyetc. Grinding of food grains is another workattended to by 31% of rural women and 52% ofurban women. Nearly 30% of rural females and13% of urban females fetch water from outsidefor domestic needs. It is interesting to note thatnearly three-fourth of rural women and 70% of
urban women are attending to one or other of the14 activities listed in the table, besides attendingto purely domestic work (see Appendix 17).
4.4 The survey results show that 37.61% ofthe total women in the state had reportedattending to domestic duties. Applying thispercentage to 1991 census population, 5.6million women come under this category. Butaccording to the census only 2.35 million womenin the state are classified as workers. This isbecause the women engaged in the listedactivities along with their domestic work arecategorised not as workers but 'non-workers."The exclusion of such a substantial number ofwomen from the category of workers is a seriouslimitation of the available data on womenworkers.
4.5. According to 1991 census, out of itspopulation of 29 million Kerala has a total workforce of 9.15 million. The work participationrate works out to 31.43% which is the lowest inIndia. This work force comprises of 8.3 millionmain workers who work for atleast 183 days anyear and 0.85 million marginal workers whowork for sometime during the year, but not for amajor part. Women workers number 2.35 millionreflecting a sex ratio of 345 female workers per1000 male workers which is lower than thenational level, the worker-sex ratio of 409 femaleworkers per 1000 male workers. It may berecalled in this context that Kerala's populationhas a sex ratio of 1036, as per 1991 census.
Participation Level
4.6. As was noted above the overall workparticipation rate (WPR) for Kerala in 1991 was31,43% taking into consideration all workers(main and marginal). If marginal workers areexcluded the WPR would be 28.53%. The WPRof women (FWPR) was only 15.85% while that ofmen was 47.58%, i.e more than three times thanthat of women. Table 4.1 presents WPR forKerala and India.
27

Table 4.1: WPK by Gender far Kerala and India (in %)
Year Kerala India*
Penoo Male Female1971 29.79 45.22 14.601981 30.53 44.89 16.611991 31.43 47.58 15.85
Penan Malt Female34.17 52.7S 14.2236.70 52.62 19.6737.68 51.56 22.73
Source: Census of India.
4.7. It is noteworthy that while FWPR forIndia registered an increase of 60% from 1971-1991, the corresponding increase for Kerala wasof only 9%. There was actually a decline of 5%in the FWPR from 1981 to 1991. The FWPR of1991 for Kerala is also far below the nationalaverage. Male WPR in Kerala fared substan-tially better, having risen from 44.89 to 47.58during the period 1981-91.
Rural-Urban Differentials
4.8. The rural and urban WPR figures forKerala and India are given in table 4.2
Table 4.2: Work Participation Rate by Gender and Sector (in %)
Kerala India
Year Male Female Male Female
Rur. Urb. Rur. Urb. Rur. Urb. Rur. Urb.
1971 45.53 43.64 15.25 11.20 53.78 48.88 15.92 7.18
1981 45.23 43.42 17.73 11.78 53.77 49.06 23.06 8.31
1991 47.88 46.76 16.86 13.02 52.50 48.95 27.20 9.74
Source: Census of India.
4.9. It may be seen that although WPR waslower in Kerala than in India all through formen as well as women, the disparity looks.sharper for women in 1991 when FWPR in ruralIndia was 27.20 as against Kerala's 16.86.FWPR as compared to MWPR in rural areas isnearly one-third in all the yean for Kerala whileit is more than half in 1991 for India. In urbanareas of Kerala the ratio is even less than one-
tliird but is still higher than that for urbanIndia. Between 1971 to 1991 the rural WPRincnaaad by 70% for India as against a marginalincrease of 10% for Kerala. In urban areas alsothere was a slight improvement in Kerala, of16% against 36% for India.
Main Wortort - Marginal Workers
4.10. The distinction between main workers andmarginal workers made for the purposes ofcensus is important to bear in mind. The latterare those who are unable to get work for morethan half the year (183 days). Table 4.3 givesgender distribution between main and marginalworkers for Kerala state in 1981 and 1991.
4.11 It may be observed that firstly theincrease in the main workers, from 1981 to 1991is considerably higher for male main workersthan female main workers and secondly thedecrease in marginal workers is distinctly lowerfor men than women. While the percentage ofmale marginal workers has come down by 18%,that of women marginal workers has fallen onlyby 10%. When 1.26 million men got additionalemployment as main workers during this period,the number of women in this category increasedby only 0.25 million
Table 4.3: Main and Marginal Workers inKerala 1961 & 1991 (100,000)
Main Workers Marginal Workers(in 00,000) (in 00,000)
Male Female Male Female
1981 51.41 16.50 4.83 4.98
1991 64.04 18.96 3.95 4.51
Source: Census of India.
Sectoral Changes
4.12 Economic development is associated withshifts in the sectoral allocation of the work forcewhich in turn is related to shifts in the produc-tion structure. It is generally accepted that withdevelopment there will be a fall in the share ofthe primary sector and a rise in the secondaryand tertiary sector activities. To examinechanges in this respect, Table 4.4 presents thesectoral distribution of workers in 1981 and1991.
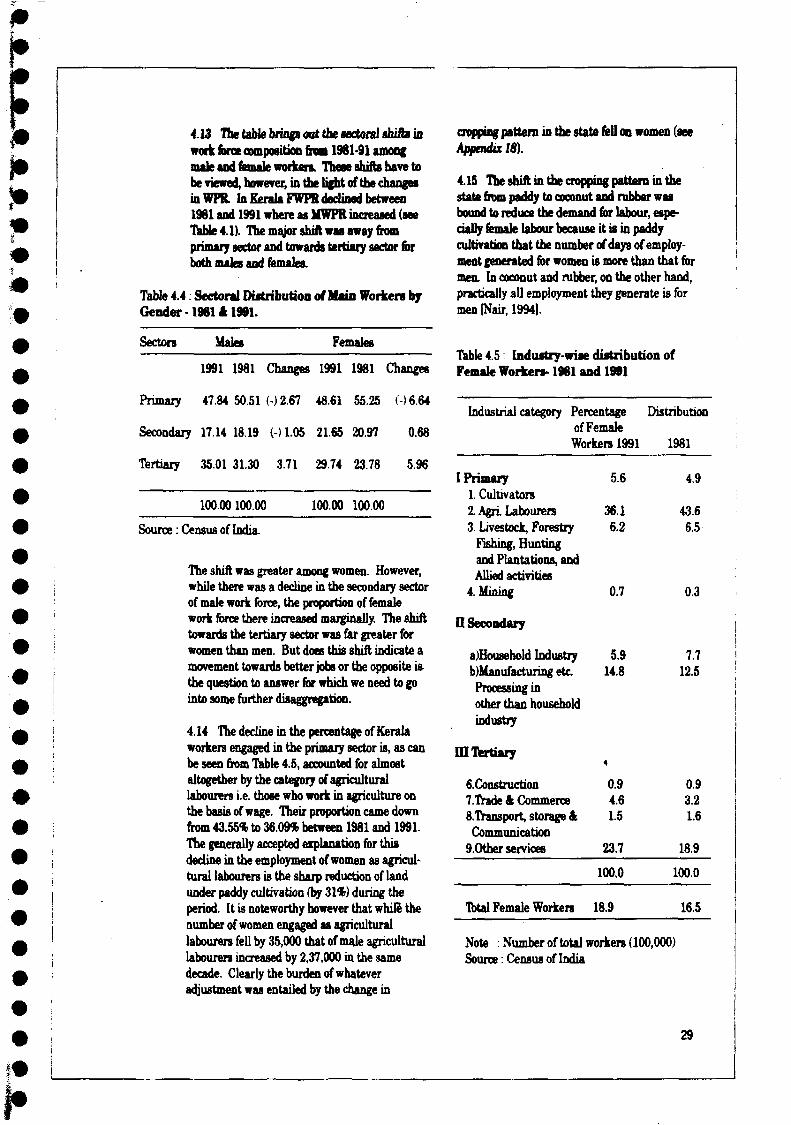
B
4.13 The table brings oat the sectoral shifts iowork force composition from 1961-91 amongmale and female workers. These shifts have tobe viewed, however, in the light of the changesinWFR In Kerala FWPR declined between1981 and 1991 where as MWPR increased (seeTable 4.1). The major shift was away fromprimary sector and towards tertiary sector forboth males and females.
Table 4.4: Sectoral Distribution of Main Workers byGender 198141991.
Sectors Males Females
1991 1981 Changes 1991 1981 Changes
Primary 47.84 50.51 (-)2.67 48.61 55.25 ()6.64
Secondary 17.14 18.19 (-) 1.05 21.65 20.97 0.68
Tertiary 35.01 31.30 3.71 29.74 23.78 5.96
100.00 100.00 100.00 100.00
Source: Census of India.
The shift was greater among women. However,while there was a decline in the secondary sectorof male work force, the proportion of femalework force there increased marginally. The shifttowards the tertiary sector was far greater forwomen than men. But does this shift indicate amovement towards better jobs or the opposite is-the question to answer for which we need to gointo some further disaggregation.
4.14 The decline in the percentage of Keralaworkers engaged in the primary sector is, as canbe seen from Table 4.5, accounted for almostaltogether by the category of agriculturallabourers i.e. those who work in agriculture onthe basis of wage. Their proportion came downfrom 43.55% to 36.09% between 1981 and 1991.The generally accepted explanation for thisdecline in the employment of women as agricul-tural labourers is the sharp reduction of landunder paddy cultivation (by 31%) during theperiod. It is noteworthy however that while thenumber of women engaged as agriculturallabourers fell by 35,000 that of male agriculturallabourers increased by 2,37,000 in the samedecade. Clearly the burden of whateveradjustment was entailed by the change in
cropping pattern in the state fell on women (seeAppendix 18).
4.15 The shift in the cropping pattern in thestate from paddy to coconut and rubber wasbound to reduce the demand for labour, espe-cially female labour because it is in paddycultivation that the number of days of employ-ment generated for women is more than that formen. In coconut and rubber, on the other hand,practically all employment they generate is formen (Nair, 1994).
Table 4.5: Industry-wise distribution ofFemale Workers-1981 and 1991
Industrial category Percentage Distributionof FemaleWorkers 1991 1981
I Primary 5.61. Cultivators2. Agri Labourers 36.13. Livestock, Forestry 6.2
Fishing, Huntingand Plantations, andAllied activities
4. Mining 0.7
II Secondary
a)Housebold Industry 5.9^Manufacturing etc 14.8Processing inother than householdindustry
m Tertiary
6.Construction 0.97Trade k Commerce 4.68.Transport, storage & 1.5Communication
4.9
43.66.5
0.3
7.712.5
0.93.21.6
9.0ther services
Total Female Workers
23.7
100.0
18.9
18.9
100.0
16.5
Note : Number of total workers (100,000)Source: Census of India
29

4.16 In the secondary sector also, oo surface,some « » " ' I T situation is mrtirfiiHf The.proportioD of women employed in householdindustry in Kerala declined from 7.65% in 1981to 5.93% in 1991. But this decline is more thanmade up by an increase over the decade in theproportion of women employed in non-householdindustry, from 12.4% in 1981 to 14.78% in 1991.An explanation offered for this change is thatsome of the traditional industries of Kerala suchas handloom, coir, beedi etc which once flour-ished as household industries are graduallychanging into non-household industries withtheir becoming part of the large cooperativesector. In 1991 census a substantial number ofthese workers got categorised under non-household industries. This is noticed in all thedistricts. It is to be highlighted here that inhousehold industry women workers outnumbermale workers.
Non-household industry
4.17 As can be seen from Table 4.5. femaleemployment in non-household industry accountsfor 15% of female work force in 1991. In 1981 thecorresponding proportion was 12.5%. In thedecade of 1981 to 1991, female workers in thissub-sector registered an increase of nearly 36%from 206,000 to 280,000. Of course, relative tothe number of men employed in non-householdindustry (also factory sector) of the state, thenumber of women in 1991 still worked out to aratio of five men to two women.
4.18 It is relevant to note in the context offactory sector employment in Kerala that thetwo districts of Kollam and Emakulam, accountfor half the employment in factory sector (seeAppendix 19). Even between Kollam andEmakulam the gap is rather large with factoryemployment in the former being more thantwice, that of the latter, the district with thesecond highest number of factory employees.Kollam's predominant position in factoryemployment, it should be pointed out, isbecause of the concentration of cashew industryin the district. Cashew industry employsapproximately 100,000 workers and of them 90%are women. Unfortunately, this industry has,for quite some years been facing difficult timesbecause of several factors, external as well as
internal and it has been problematic utUisingcapacity and maintaining employment
Service*
4.19 In the tertiary sector, the major avenues ofemployment are trade and commerce' and 'otherservices', with the Utter accounting for morethan three quarters of the total female employ-ment in the sector. In fact, after agriculturallabour, 'other services' provide the maximumfemale employment in the state. Of course,unlike agricultural labour, it is not a homogene-ous group. On the contrary, it is a notch potchcombination of several categories of employmentranging from government service to domesticservices. The proportion of women in the otherservices' increased from 18.98% of the totalfemale work force in 1981 to 23.65% in 1991; theincrease in number was by 44%, from 313,000 to449,000.
4.20 In this context, it is pertinent to note thatwomen constituted over 30% of the total number(6,48,000) employed in the public sector in 1992.In Kerala's teaching profession, which comesalmost entirely in the public sector, all employ-ees of even private aided institutions being paidout of government coffers, women constitutedclose to two-thirds of the total 191,000 in 1992.
Educational Profile ofWorking Women
4.21 It is generally accepted that the educationof women leads to occupational diversification.It enables them to move away from the agricul-tural sector to employment in the secondary andtertiary sectors. We have already seen that in1991 the female workforce in Kerala consisted ofnearly 1.9 million workers. Around 50% of themwere employed in the primary sector which issignificatnly below the corresponding figures of80%, for the whole country. On the other hand,tertiary sector accounted for a significantlyhigher proprtion of female employment inKerala (30%) than in India (10.8 %).
4.22 Possibly the educational attainments ofKerala's women enabled them to move away andtowards employment Regarding higher levels ofliteracy, NSS 43rd round Employment Surveygives the distribution of workers, in 1987-88, bylevel of education. Table 4.6 presents the
30

educational profile of the fault workers inKerala for rural and urban separately, baaed oothis survey.
4.23 It can be seen that while one out of fivefemale workers was reported as not-literate,more than one-third of theae had an educationalqualification beyond primary school level andone out of four working women had donematriculation or gone beyond that The fact thatthe proportion of women in Kerala working ingovernment services and teaching was as notedearlier, quite substantial is very much in linewith the distribution of female workers in thestate by educational level
Table 4.6 Distribution of Female Workersin Kerala according to level of education,1987-88.
engaged in work, the balk almost is accountedfor by agriculture (mostly agricultural labour)and traditional industries. No doubt, of thewomen in Kerala engaged in services, a goodproportion is accounted for by governmentservice and teaching. Still a large proportion ofwomen in Kerala, not just minimally Uterate,seem to remain outside the ambit of workparticipation. What could possibly be thereasons behind such gross under-uae of educatedwomen for economic engagement need to beexplored.
EducationFemale Workers
1. Not literate
2. Literate uptoPrimary
3. Middle
4. Secondary
5. Graduate &Above
All
Percentage
Rural
22.8
38.4
18.3
16.4
4.1
100.0
Distribution of
Urban
11.7
20.2
23.2
30.4
14.5
100.0
Total
21.2
35.7
19.0
18.5
5.6
100.0
Source: NSS 43rd Round Employment Sur-vey, 1987-88,Sarvekshana, Jan-March, 1992.
Summing Up
4.24 One of the paradoxes of Kerala that comesout clearly in this chapter is that although itleads the rest of the states in India in regard tofemale literacy and level of education, when itcomes to the engagement in economic activities,women's participation in Kerala has been asabysmally low as for the country as a whole;indeed going by the figures for 1991 only, Keralalags badly behind. Even of those women
31

#
5.1 One widely recognised major reason whywomen do not come forward to engage ineconomic activity is their perception with regardto availability of work opportunities not only ingeneral but also specifically for women. CouldQon-availabiltiy of work opportunities in Keralabe the reason for the non-participation of womenin work on such large scale as noted in theprevious chapter'' 7b answer this question, wehave to examine the available information onoverall unemployment as well as femaleunemployment levels in the state.
5.2 Unemployment in Kerala has been highand increasing among both men and women.Also the problem of unemployment in Kerala isprimarily the problem of the educated unem-ployed among both men and women. Accordingto one estimate, 91% of the unemployed inKerala are literate and two-thirds here studiedbeyond the primary school level [DES, 1988).This should not be surprising since the state hasthe highest literacy rate for both sexes, far abovethe other states of India.
5.3 NSS has used two concepts of unemploy-ment in their surveys. One relates to those whoare willing and available for work but have notbeen able to find any for the greater part of thereference period. This category of people isbranded as usually unemployed and may betaken as a rough index of chronic unemploy-ment. The other concept is that of currentunemployment which gives an idea of the totalnumber of weeks or days in an year for whichpersons in the labour force are unemployed.Both the concepts give an idea of the incidence ofopen unemployment in the economy.
5.4 From the various quinquennial rounds ofthe NSS, sufficient information is available toform an idea of the level of unemployment bygender and change in this level over the decade,1977-78 to 1987-88. The latest round for which
information is available was conducted in 1987-88. Table 5.1 gives the unemployment rates forKerala and India for 1987-88 by 'usual status'.These rates are worked out as percentages oflabour force. Byway of explanation, let it beadded here that the term labour force' usedincludes both the unemployed as well as theemployed and is therefore much wider than theterm work force'.
5 5 It can be seen that female unemploymentin rural Kerala is nearly seven times the level inrural India and four times the correspondingIndian rate in urban Kerala.
Table 5.1: Incidence of UnemploymentIndia-KeraU 1967-88
Percentage of unemployed to the labour force(1987-88)
Rural
Urban
IndiaKeralaIndiaKerala
IndiaKeralaIndiaKerala
MaleMaleFemaleFemale
MaleMaleMaleFemale
2.812.53.5
25.0
6.114.28.5
34.0
Note : Unemployed as % of labour force basedon NSS definition of'usual principal status*.Source: Sarvekshana • Sep,1990.
Comparison of latest survey results with thoseof earlier surveys (see Table 5.2) shows that inKerala the incidence of unemployment has beentwice, or nearly twice, as high on women as onmen and that such a situation has been persist-ing in the economy for some time in recentyears.
32

Table
far
1977-7819631987-88
Bund
M
13.510.6125
F
29.217.025.0
Uiban
Total M
19.216.212.611.916.614.2
F
39.525.634.0
All areas
Tbtal 11
23.5 14.0015.6 10.8019.6 12.80
F
30.618.4263
Total
19.913.117.1
Note Unemployed as percentage of labour force by usual
Source :(1) 1977-78 32nd round N.S.S ReportNo 298/10- Kerala NSS.(2) 1983-30th round report no 341/3. Kerala-NSS.(3) 87-88 - Sarvekshana 43rd round -Oct-Dec1992 and Spl.issue KerakJan-1992.
5.6 It is important also to note that theincidence of male as well as female unemploy-ment is the highest in the younger age group 15-29 (see Table 5.3) in both urban and rural Kerb.But the proportion for women is staggeringlyhigh compared to that of men. Nearly 45% ofwomen in this age group in rural areas andnearly 58% of the women in this group in urbanareas were reported as unemployed.
Table 5.3: Unemployed by Age Groups,198748.
Age Rural Urban(years) M F Total M F Total
15-29 25.7 44.9 32.4 27.9 57.8 37.5
30-44 4,7 11.7 7.1 5.8 12.1 7.3
45-59 3.0 5.5 5.5 3.7 2.9 3.6
60+ 1.4 4.9 2.3 1.3 9.4 2.7
Note : Percentage of unemployed in each agegroup.Source: (1) 1977-78 32nd round N.S.S Report No298/10- Kerala NSS.(2) 1983 - 30th round report no 341/3. Keralt-NSS.(3) 87-88 - Sarvekshana 43rd round -Oct-Dec1992 and Spl. issue Kerala Jan-1992.
We hate noted in an earher chapter that theenroh&efit ratio in secondary schools in Kerala isas high as eighty percent far not only boys butalso girls. Adding to it the finding noted above inthis chapter that more than two-third* of theunemployed in the state had studied beyond theprimary school level, it if very likely that amajority of the girls in the age group of 15-29reporting as unemployed could have completedten yeare of schooling.
District wist Trends
5.7 It is not possible to work out district wiseincidence of unemployment on the basis of NSS.An idea on that can be formed on the basis ofemployment exchange data. The hve registersmaintain^ in the employment exchanges in thestate give some idea of the magnitude andextent of unemployment in each district Thereare altogether 37 employment exchangescovering all the districts of the state. Appendix20 gives district-wise distribution of men andwomen on the live registers of the employmentexchanges.
5.8 As can be seen, the total number ofregistrants with the employment exchangesadded up to 3.9 million in 1993 in the state as awhole (by 31.5,1994, this number is reported tohave reserve to 4.0 million). This works out to22% of the estimated labour force. However, theproportion of female registrants to female labourforce (their number has been almost the same asof male registrants) works out to 54.8%, i.e twoand a half times larger than the overall ratio ofregistrants to labour force. It may be added thatthe number of female registrants has increasedfrom 622 thousand to 1933 thousand between1981 and 1993, more than three fold. Thenumber of male registrants increased from 1.28million to 1.95 million, showing an increase 52%.In 1981 there were only 485 female registrantsper 1000 males on the live registers of employ-ment exchanges. By 1993 this number hadsteeply increased to 991. It is clear that in thelast decade proportionately larger number ofwomen in Kerala came forward to take upemployment
5.9 The above appendix also shows that in fiveout of 14 districts the number of female regis-trants exceeds male registrants. Also, the twodistricts with relatively very low female registra-tion with employment exchanges are in North-
33
\f

em Kerala. Tte districts are Malappuram andKasargode. l i n y also have sizeable Muslimpopulation.
5.10 By way of caution, it is necessary to addthat all registrants with the employmentexchanges are not necesarily unemployed.According to a study of the registrants in theemployment exchanges in Kerala in 1989, alittle over 30% of female registrants were eitheroccupied as full time students (17.5%) or werehaving full time employment (12.65%); thelatter had obviously registered their names forgetting better employment [Mukerjee and Isaac1994).
Summing Up
5.11 Tb sum up, there is clearly an increasingdesire among women in Kerala, to takeupgainful employment. The problem is of provid-ing them with adequate opportunities to employthemselves gainfully. The greater such opportu-nities, the larger will be the number of womencoming forward and feeling encouraged to jointhe state's labour force. Unfortunately thecurrent unemployment situation in the statedoes not appear to be particularly encouraging.
34

6.1 The demand for health care is governed bya host of factors. Among these the most impor-tant are access to medical facilities, levels ofincome and education, awareness of health issueand cultural attitudes particularly when it comesto women's health. We must also add herewomen's own perception of their health statusand their self-image to seek health care.
6.2 Kerala has an extensive network ofmedical care institutions practising Allopathic(modern western style of medicine), Ayurvedaand Homeopathy. Ayurveda and Homeopathy arevery popular among the population of Kerala.Recognising this position, government iscommitted to encouraging development ofinstitutions under all the three systems, both inprivate as well as public sectors.
6.3 While sufficiently extensive data relatingto health care institutions and manpower in thegovernment sector are published fairly regularly,information for the private sector is not availableon that scale or with that regularity. Table 6.1gives the growth of government medical institu-tions, under the three systems, in Kerala since1981.
Table 6.1: Medical Institutions under thegovernment sector
Year
198119911994
AllopathyNo
98112261249
Index
100125127
AyurvedaNo
540633686
Index
100117127
HomeopathyNo
176342405
Index
100194230
Source: Economic Review, 1994.
6.4 It can be seen that in terms of numbers,the allopathic health care institutions exceededby a wide margin from those catering forAyurveda and Homeopathy in 1981. Thenumber of Allopathic institutions was signifi-cantly larger than the combined number of
institutions under the other two systems. Duringthe period, 1981 to 1994, Homeopathic institu-tions grew faster. Still, allopathic institutionsdominate the government sector.
6.5 Each district is served by a districthopsital located at district head quarters andhaving facilities for special care such as gynae-cology, paediatrics, ENT, general surgery etcEach taluk also is having a taluk PrimaryHealth Centre (PHC) hospital. Then there arePHCs functioning in village pauchayats. PHC isthe core institution of the rural health servicesinfrastructure. Appendix 21 presents the picturewith regard to district-wise availability ofallopathic infrastructure in the state for 1980-41and 1990-1991.
6.6 It can be observed that in the state as awhole there were on an average 4.2 allopathicinstitutions per hundred thousand of populationin 1991 as against 3.83 in 1981. The position ofpractically every district improved during thedecade with regard to the availability of theseinstitutions. Only a marginal ddine wasregistered in Thiruvananthapuram and Kollam.It is noteworthy that the two out of threedistricts whose position in this regard isdistinctly better than for the state as a whole areIdukki and Wyanad, the districts which arelocated almost totally in the highland region ofthe state and which are not as densely populatedas the state's midland and coastal regions.People in the highlands have to walk longdistances to reach the medical institutions.
6.7 District-wise spread of allopathic institu-tions per 100.sq.km area, presented in Appendix22 gives an idea of the accessibility of theseinstitutions. It can be seen that a district likeThiruvananthapuram with a rather lowpopulation coverage has the highest areacoverage whereas Idukki and Wyanad have thelowest In other words, there are fewer medicalinstitutions per square kilometre in the lattertwo districts than in the former.

6.8 A better index of availability of curativefacilities however is the ratio of population tohospital beds. Between 1981 and 1991, thenumber of hospital beds is government institu-tions inaeased by 25% and by 1994 the iacretMwas 31% in the state. In 1993-94, there were1,249 government and government aidedallopathic medical institutions in addition to fivemedical colleges. Together, they had a total bedstrength of 49,889 beds.
6.9 Moreover, 107 ayurveda hospitals had abed strength of 2,309 and 31 homeopathichospitals 950 beds. The number of bed perhundred thousand population under all thesystems of medicine in the government sectorwas 175. With the beds (65,156) available inthe 6,700 private medical institutions in thestate also included, the availability of bedswould go up to 399 per hundred thousandpopulation.
6.10 As for inter-district availability of hospitalbeds, for which information is available only forgovernment allopathic institutions, the positionis presented in Appendix 23. It may be seen thatinter-district divergence is far greater in thematter of beds than institutions. WhileKottayam and Thiruvananthapuram districtshas the highest bed availability (of over 200 bedsper 100,000 population) Kasargod, Malappuram,Idukki, Pathanamthitta and Palakkad haverather low bed availability (of below 100 bedsper 100,000 population). These figures relateonly to government allopathic institutionswithout taking into account beds in five medicalcolleges.
"9i
6.11 Asiwomen and children, it ought to be added thatthere are nine hospitals exclusively for womenand children with a bed strength of 2,693. Inaddition, the number of beds reserved exclu-sively for women and children in other govern-ment hospitals is 2,747, making a total of 5,440.
6.12 It was noted above that the number ofprivate medical institutions and hospital beds inthe state exceeds the number of governmentmedical institutions and beds. It was noted alsothat the inter-district availability of hospitalbeds in government institutions varies consider
ably. On the basis of the available information,it is possible to have an idea also of theintersectonl distribution of the facilities in thestate not only for government but also forprivate medical institutions. Table 6.2 presentsa rural-urban break up, at the state level, for theavailable medical facilities, including personnelattached to them, under the three systems ofmedicine referred to at the outset
6.13 It is clear that under allopathy thefacilities as well as personnel in the governmentsector are concentrated more in urban areas,while in the private sector the distribution ismore even between rural and urban areas.Under the other two systems of medicine,private sector facilities in rural areas are evenmore significant Commenting upon this UrbanBias' in government health care facilities, theauthors of a recent well-known study note thatsuch a bias is pronounced in the case of govern-mental health care facilities and has implica-tions for the government's policy and planning"(Kannanetal 19911.
Table 6.2: Rural / Urban availability of
Category % of share
GovernmentRural
A. AllopathyInstitutionsDoctorsBedsPara Medical
StaffB. Ayurveda
InstitutionsDoctorsBedsPara Medical
Staff
863325
39
886012
54C. Homeopathy
InstitutionsDoctorsBedsPara Medical
Staff
806626
60
Urban
146775
61
124088
46
204474
40
PrivateRural
164953
51
797779
68
807983
75
Urban
345147
49
212321
32
202117
25
Source: Kannan, et al, 1991.

Wonwn tnd Utilisation of llMlthSystem
6.14 Whik note was taken above of the healthinfrastructure specially reserved for women andchildren, it will be wrong to convey the impres-sion that the women's access to or use ofunreserved facility is less. Indeed, as can beseen from Table 6.3, women's use of facilities ingovernment hospitals dispensing allopathicmedicine is significantly higher than that ofmen. The table gives the number of inpatientsand outptients treated in government allopathichospitals.
Table 6.3: Number of patients at government hospitals(allopathic) in Kerala
In patients (100,000)
Year
1988-891989-901990-911991-921992-93
M
4.724.814.584.863.98
F
6.586.356.536.665.57
Ch
3.183.013.162.912.87
T
14.4814.1714.2714.4312.47
Out patient (100,000)
M
82.1074.4974.7579.3270.57
F
119.36119.87111.17118.6591.96
Ch
80.7075.1073.5276.9581.16
T
282.16269.46259.44274.92243.69
Source: Directorate of Health Service, KeralaM=male, F=Female, Ch=Children. T=Tbtal.
*
#
6.15 Excluding children, for evey 1000 maleinpatients in the government allopathy hospi-tals, there were 1400 female inpatients and forevery 1000 male outpatients there were 1303female outpatients in 1992-93, the year in whichoverall patients' use of government hospitalfacilities appeard to have registered somedecline. It is noteworthy that the use by womenof these facilities has significantly exceeded thatby men during the five-year period covered inthe table.
6.16 As part of 42nd NSS round (July, 86-June87), a study was undertaken on the utilisation ofmedical services and on morbidity. The results ofthe survey confirmed that the female use ofhospital facilities in rural Kerala exceeded themale use (763 thousand men and 784 thousandwomen were reported as hospitalised during theperiod). The same survey shows that for thecountry as a whole male use of hospital facilitiesfar exceeded female use (8427 thousand men asagainst 6496 thousand women were hospital-
ised). Going by the survey, both male andfemale use of hopsital facilities in Kerala was farin excess of the population ratio of 3.4% to thecountry. The female use of hospitals, in ruralKerala works out to 12.07%, while male use was9.05%.
6.17 Does this greater use of hospital facilitiesin Kerala indicate higher morbidity or greaterawareness of and access to these facilities is aquestion that is currently being discussed. Itcannot be overlooked however that Kerala ismuch better equipped with medical facilitiesthan the rest of the country and these facilitiesare reasonably well distributed (despite inter-district and inter-sectoral disparities notedabove). At the same time, Kerala's population isfar more literate than elsewhere in the countryand could therefore be considered to be far moresensitive to any abnormalities in health and theneed to have them attended to. In this context itis also relevant to bear in mind that the gap infemale literacy betwen Kerala and India is fargreater than in male literacy. Of course, one hasat the same time to bear in mind that in a statewhere the proportion of the aged in the popula-tion is significantly higher and that too ofwomen, than in the country, the incidence ofmorbidity, and that too female morbidity, couldbe high. The link between aging and morbidityis now widely accepted.
6.18 While for the state as a whole female useof hospital facilities is high, there are significantinter-district differences in the female use of thehospital facilities. This comes out from Appen-dix 24 which gives the number of female hospitalpatients (both outpatient and inpatient).
6.19 Inter-district differences, as can be seen,in female use of government hospital facilitiescome out quite sharply when the number offemale hospital patients is related to the femalepopulation of the concerned district. While forthe state as a whole the number of femalepatients per 1000 population works out to 846for 1991-92, the number varies between 336 forWayanad and 359 for Kasargode to 1239 forKottayam and 1233 for Thiruvananthapuram.In this context, it is necessary to recall that theavailability of hospitals in terms of bed-popula-tion ratio, is extremely low in districts likeWayanad and Kasargode and quite high inKottayam and Thiruvananthapuram. So, whenone speaks of the role of perception factor in
37

hospital use one has to remember that thisfactor is perhaps influenced a lot by the avail-ability of medical facilities.
6.20 A notable achievement in the matter ofwomen's health care in Kerala has been thatover 90 per cent of the deliveries take placeunder institutional care whereas at the countrylevel 'even 60 per cent of the deliveries could notbe institutionalised so far* (SPB, 1995]. Withsuch a high rate of institutional deliveries inKerala, it should not be surprising that mater-nal mortality in the state has come downsharply. For every 3000 deliveries, the reportedmaternal mortality rate is below one (SPB,1995). Such marked achievement notwith-standing, there still are an inter-districtdifferences that need to be addressed. InMalappuram district as many as 23% of thedeliveries are taking place at home; in Wayanadthe proportion is 17%.
Child Health Care
6.21 It is necessary to recall here that alreadythe infant mortality rate (IMR) in Kerala hascome down sharply along with the decline in theoverall mortality rate. The latest IMR forKerala is 13 per 1000 compared to 79 per 1000for the country as a whole. Even child mortalityrate of 4.6 in Kerala is distinctly below theIndian rate of 26.3 (these figures are for 1990).This achievement would not have been possiblebut for the attention given to not only prenataland postnatal care but also child care. Onemajor instrument of covering infants andchildren against sickness with high incidence ofmortality is immunisation. According to animmunization coverage evaluation surveyconducted during November-December 1993,while coverage of pregnant women for T.T was95.6% in the state, the full immunizationcoverage of children had not been achieved. Theoverall figures for the state was 76.7%. Also, thecoverage in some districts was rather low. InMalappuram the coverage was only 40.49 and inPalakkad and Thrissur 52.89 and 58.45 respec-tively. The proportion of those not immunised atall for the state was found to be 3.4, withproportion being as high as 15.76 forMalappuram district (see Appendix 25).
Summing Up
6.22 Major highlights of this chapter a n thatboth access and utilization of health careparticularly among women is quite high. It ishigh compared to men in the state and alsowhen comapared with women in the rest of thecountry. The problem that is still rather crucialis really the backward districts, both in terms ofbirths that are not under institutional care, like,for example, in Malappuram and Wayanad, andin infant and childcare. The proportion ofchildren fully ipimnni^ in some districts isyalso apallingly low compared to the stateaverage; Malappuram with 40.4% and Palakkadwith 53% immunization coverage are thelaggards.
38

7.1 Needless to say, conditions of housing areextremely important for both the physical andmental well being of the family. It is now widelyaccepted that the poor health status of lowincome countries is the product of inadequatenutrition, lack of water supply, overcrowded andinsanitary housing conditions. These conditionsare conducive to the prevalence of deficiencydiseases, airborne diseases, faecally related andwater-borne diseases which dominate themorbidity pattern in less developed countries[Panickar & Soman. 1984]. The incidence ofthese diseases can be particularly high amongwomen and children, both the categories beingfar more homebound than adult men.
7.2 In this chapter we discuss various aspectsrelated to housing, (a) What is the housingscenario like in Kerala ? (b) What are the basicamenities available to households in Kerala interms of potable drinking water, sanitationfacilities and clean environment?
7.3 The housing sector in Kerala haswitnessed an unprecedented growth in the lastthree decades. During the three decades, 1960to 1990, the housing stock in the stae increasedfrom 2.8 million to 5.5 million, virtually doublingitself in this period [Augusty, 1995]. The growthin housing outpaced population growth by awide margin. A combination of factors, mostimportantly, grant of ownership of land tohutment dwellers, the migration of workers tothe Gulf and their remittances, and the chang-ing notion of family and organisation of domesticspace contributed to this substantial increase inhousing stock in the state. It was as a result ofthis increase in housing stock that the hosingshortage in the state ws reduced sharply.
Table 7.1: Hooting available inKerala by nature of constructiom
Type of Structures Percentage ofdwelling (rural)
Kerala India
Pucca(permanent}Semi-Pucca
Kutcha(thatched)AU
53.43
22.06
24 51
100.00
Source: Sarvekshana,Jan-Mar, 1992.
37.72
29.77
32.51
100.00
The estimated numerical shortage that stood at1,56,000 in 1981 was brought down to 54,000 by1991, ISPB, 1995]. The resulting improvementis somewhat misleading however because it doesnot take into account the quality of housingstock.
Quality of Housing
7.4 As we have seen in table 7.1 of the stock ofhouses in Kerala, 46% are thatched (Kutcha) orof semi-permanent nature. This proportion issignificantly below the corresponding figures of63% for India. However, out of the thatchedhuts in the state 50 percent are consideredsubstandard and unfit for safe human living. Inaddition about five per cent of the other existinghouses need to be reconstructed or undergomajor repairs. If the number of substandard
39

hats and other houses that need to undergoreconstruction or major repairs are also added tothe estimated numerical shortage, the totaladditional demand far housing in Kerala worksout to 0.87 million in 1991 (see Table 7.2).
Table 7.2: Housing shortagein Kerala, 1991.
in thousand
1. Numerical Shortage(no.of households minusDO of houses) 54
2. Substandard huts needingreconstruction 550
3. Houses requiring majorrepair-aim- reconstruction 270
874
Source: Economic Review, 1994.
7.5 As can be seen dose to one-quarter of thehouses in Kerala belong to the category of whatare called TCutcha' dwellings, built out of mud,reeds, bamboos, grass etc. For the country as awhole, one-third of the shelters are of this type.In urban Kerala around four percent of thehouseholds live in slums, while the percentage forurban India is 15. It is important to bear inmind that shelters of this type require recon-struction at fairly frequent intervals.
7.6 One of the major drawbacks of the Kutchahouses is the roofing material used, which, inKerala, is made of thatched coconut palms. Theyneed to be constantly replaced, and are thereby arecurring source of expense for a poor family.They allow for many leaks in the rainy weather,get eaten up by vermin and even get infested bysnakes. Also, they catch fire easily. Until asrecently as 1970 roofing was a major problemsince only a very small proportion of houses inKerala had tiled roofs. A major change howeverhas taken place since then. By 1980,35 per centof the bouses of even rural labourers had tiledroofe fDES, 1985].
7.7 In terms of space, the average number ofliving rooms* per dwelling unit in Kerala isreported to be 2.73 and 2.79 in rural and urbanareas respectively. The corresponding figures forIndia are 1.80 and 1.77 respectively. Presumably,in Kerala housing provides scope for greaterprivacy than in India and this is so inspite of the
fact that Kerala is far more densely populatedand consequently far more land-short than therest of the country.
Availability of Drinking Water
7.8 It is estimated that almost 80% of thediseases in the world are water borne or waterrelated (Murugan, 1994). The availability of,and access to, protected drinking water is veryimportant if the morbidity level within acommunity is to be brought down. Also, easyaccess to safe water reduces the demand onwomen's time and energy. For households nothaving the facility of piped water for drinkingand other purposes, fetching water becomes amajor task for women. If water is available inthe vicinity of the house then the women arerelieved of a great burden.
7.9 There are conflicting claims, however,with respect to the latest position with regard tothe availability of drinking water in Kerala.Going by latest official claims, access to protecteddrinking water has been provided to 44% of therural population and 65% of the urban popula-tion. At the same time, it is conceded that only0.46 million out of 5.5 million houses in the state(i.e less than 10%) were connected with pipedwater supply by October, 1994. Consequently thevast majority of the households have to dependupon public taps, called stand posts, to meettheir requirement of water.
7.10 A recent independent study of rural watersupply in the state shows that 17.2% of the ruralpopulation in the state is not covered by anydrinking water supply programme, 69% arepartially covered and only 13.8% are fullycovered. Also out of the 82.8% (69% +13.8%) ofthe rural population provided with at least onepublic source of potable water, only 32% can beconsidered as covered, going by the norm of 250persons per stand post Further, out of the 32%only 19% of the rural population actually usesthis public source. According to this study Keralahas the lowest user rate among states. Thereasons given for the low user rate are longertravel distances as a result of settlement patternin the state, low per capita daily availability withuncertainty in supply and pattern and extent ofurbanisation. The study concludes that at thecurrent rate of coverage 21 more years would berequired to attain the norm-based full coverageof the state's rural population [Pushpangadan,1996].
40
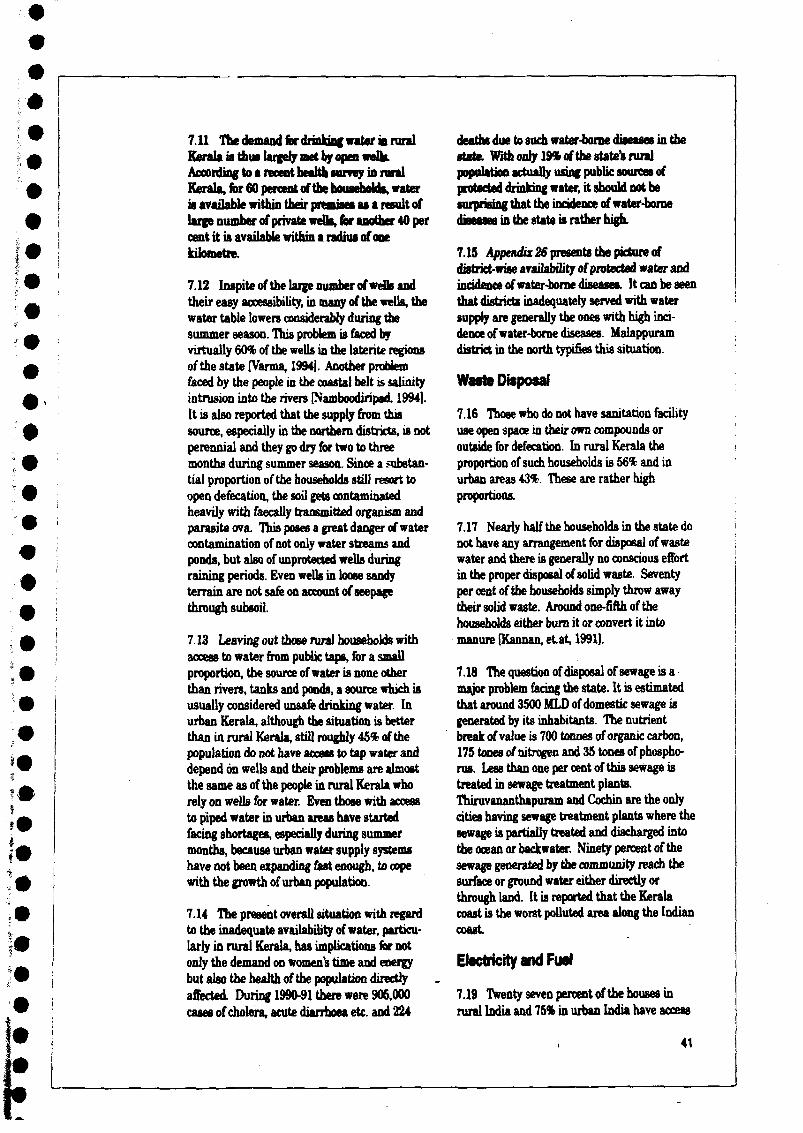
7.11 The demand for drinking water in ruralKerala is thus largely met by open wdkAccording to a recent health survey in ruralKerala, for 60 percent of the household* wateris available within their premises as a result oflarge number of private wefla, for another 40 percent it is available within a radius of onekilometre.
7.12 Inspite of the large number of weDs andtheir easy accessibility, in many of the wells, thewater table lowers considerably during thesummer season. This problem is faced byvirtually 60% of the wells in the laterite regionsof the state [Vanna, 1994). Another problemfaced by the people in the coastal belt is salinityintrusion into the rivers [Namboodiripad. 19941.It is also reported that the supply from thissource, especially in the northern districts, is notperennial and they go dry for two to threemonths during summer season. Since a substan-tial proportion of the households still resort toopen defecation, the soil gets contaminatedheavily with faecally transmitted organism andparasite ova. This poses a great danger of watercontamination of not only water streams andponds, but also of unprotected wells duringraining periods. Even wells in loose sandyterrain are not safe on account of seepagethrough subsoil.
7.13 Leaving out those rural households withaccess to water from public taps, for a smallproportion, the source of water is none otherthan rivers, tanks and ponds, a source which isusually considered unsafe drinking water. Inurban Kerala, although the situation is betterthan in rural Kerala, still roughly 45% of thepopulation do not have access to tap water anddepend on wells and their problems are almostthe same as of the people in rural Kerala whorely on wells for water. Even those with accessto piped water in urban areas have startedfacing shortages, especially during summermonths, because urban water supply systemshave not been expanding fast enough, to copewith the growth of urban population.
7.14 The present overall situation with regardto the inadequate availability of water, particu-larly in rural Kerala, has implications for notonly the demand on women's time and energybut also the health of the population directlyaffected. During 1990-91 there were 905,000cases of cholera, acute diarrhoea etc. and 224
deaths due to such water-borne diseases in thestate. With only 19% of the state's ruralpopulation actually '"ipg public sources ofprotected drinking water, it should not besurprising that the incidence of water-bornediseases in the state is rather high.
7.15 Appendix 26 presents the picture ofdistrict-wise availability of protected water andincidence of water-borne diseases. It can be seenthat districts inadequately served with watersupply are generally the ones with high inci-dence of water-borne diseases. Malappuramdistrict in the north typifies this situation.
Waste Disposal
7.16 Those who do not have sanitation facilityuse open space in their own compounds oroutside for defecation. In rural Kerala theproportion of such households is 56% and inurban areas 43%. These are rather highproportions.
7.17 Nearly half the households in the state donot have any arrangement for disposal of wastewater and there is generally no conscious effortin the proper disposal of solid waste. Seventyper cent of the households simply throw awaytheir solid waste. Around one-fifth of thehouseholds either burn it or convert it intomanure [Kannan, etat, 1991].
7.18 The question of disposal of sewage is amajor problem facing the state. It is estimatedthat around 3500 MLD of domestic sewage isgenerated by its inhabitants. The nutrientbreak of value is 700 tonnes of organic carbon,175 tones of nitrogen and 35 tones of phospho-rus. Less than one per cent of this sewage istreated in sewage treatment plants.Thiruvananthapuram and Cochin are the onlycities having sewage treatment plants where thesewage is partially treated and discharged intothe ocean or backwater. Ninety percent of thesewage generated by the community reach thesurface or ground water either directly orthrough land. It is reported that the Keralacoast is the worst polluted area along the Indiancoast
Electricity and Fuel
7.19 Twenty seven percent of the houses inrural India and 75% in urban India have access
41

to electricity. In Kerala the position is bettersince households are residing in electrifieddwellings account for 42%. In urban Keralahowever, the position is some what worse thanfor urban India, as a whole, with 70% of thestate's urban houses having access to electricity.
7.20 In Indian homes, particularly those inrural areas, electricity if available, is mainlyused for lighting. For cooking, the use ofelectricity is very minimal, in rural areas atleast There, even *a large number of economi-cally better off households still use cookingdevices which are primitive using firewood andother agricultural wastes and the beat andsmoke emitted by such devices are a hazard tothe household members, especially women."[Kannan, et al., 19911. Accoording to the 1991survey, the type of fuel used for cooking in therural houses is overwhelmingly (96%) firewoodand that too in traditional wood burning stoves.The use of modern heat efficient, smoke reduc-ing, wood burning stove is very marginal.Percentage of urban households resorting to thistype of fuel in Kerala is reported to be 40.
Summing Up
7.21 Clearly, in the field of housing and relatedfacilities the scope for improvement is enormousin Kerala, starting with housing itself. Giventhe fact that women of Kerala are very muchhome-bound and continue to engage primarily intraditional household activities, reproductiveand productive, improvement of housing andhousing facilities has to be high on the agendafor women's amelioration.
42

POVERTY
8.1 In this chapter we discuai the majorantipoverty schemes under implementation fromthe point of view of the benefits accruing to poorwomen. Estimates of households living inpoverty in the state differ considerably. All thesame, the problem of poverty and its femaledimension are far too important to be sidelinedon that score.
Integrated Rural DevelopmentProgramme (IRDP)
8.2 IRDP is one of the major anti-povertyschemes currently being implemented. This is acentrally sponsored scheme, funded by thecentre and states on 50:50 basis and is intendedto assist families identified as poor. Theprogramme has been given a prominent place insuccessive five year plans. The objective beingto assist identified poor families in the ruralareas to cross poverty line by taking up self-employment ventures, the programme aims atproviding income generating assets, includingworking capital wherever necessary, to thetarget group families through package ofassistance comprising subsidy and institutionalcredit. So, identification of target families is amajor first task to be undertaken for theimplementation of this programme. For thispurpose, a cut off point of household income wasnecessary to workout.
Poverty Line
8.3 The poverty line is defined by the Plan-ning Commission on the basis of a per capitanorm of 2400 calories per day in rural areas asthe average requirement The consumptionexpenditure level at which the average caloriesintake meets this norm is defined as povertyline. The N.S.S. household consumptionexpenditure surveys were used, with a cut offpoint of Rs.6000 income, to identify the poorhouseholds. However poverty programmes hadto first aim at the poorest of the poor who wouldbe identified by an annual household income of
Rs.4800 which was substantially lower than thecut off point of Rs.6000.
8.4 Going by this norm, at 1991-92 prices afamily with an annual income of Rs. 11000 or lesswas considered to be bekm the poverty line. Inorder to ensure timely assistance to the poorestof the poor families, the next cut off linesuggested is Rs.85O0.
8.5 For the purposes of identification offamilies eligible for assistance under theprogramme a comprehensive household surveywas conducted in 1990. This list of identifiedfamilies falling below the poverty line has beenpublished in each block.
8.6 The survey revealed that out of fourmillion rural households in Kerala 1.8 millionrural families were below the poverty line. Inproportionate terms, 44.6% of the families inrural Kerala could thus be considered as livingbelow the poverty line in 1990. This is, however,considerably higher than the estimate of theExpert Group of the National Planning Commis-sion for households below poverty line in ruralKerala.
8.7 According to state-wise estimates ofpopulation below the poverty line worked out bythe Expert Group appointed by the NationalPlanning Commission, the proportion for ruralKerala in 1987-88 was 29.10% as against 39.06%for India. The Expert Group adopted a stand-ardised commodity basket at the national levelthat would meet the normal calorie requirementof 2400 calories per person per day and thenvalued it at prices prevailing in different statesto work out state specific poverty lines.
8.8 The two estimates of the proportion ofrural households below the poverty line, that ofthe survey by state authorities and thatattempted by the Planning Commission's ExpertGroup diverge considerably. Thelatter'sestimate of 29.14% is lower than the former's44.6% by a big margin of 15.5%.
43
District~wise Poverty LOVBI
8.9 In Appendix 27 is presented district-wisedistribution of the rural houaehoids below thepoverty line separately far SCs, Sis and the restof the population. As can easily be seen, theoverall proportion varies between 3.0% in Wynadto 11.4% in Tbiruvananthapunffl and 10.4% inKollam. Trichur (9.8%), Malappuram (9.6%),Kozhikode (9.3%) and Palakkad (8.5%) are otherdistricts with high proportion of the state total.Six districts account for almost 60% of the ruralfamilies identified in the state as below thepoverty line. One has to remember, howeverthat the concentration varies between districtswhen one considers the poor among SCs andSis, particularly the latter. Thus Wynad withthe lowest proportion of the state's poor has thelargest proportion of the tribal poor, followed byIdikki and Paiakkad.
Women Beneficiaries
8.10 While oo seperate information is availableof the breakup of the famines below the povertyline by gender of head of family, it should bereasonably safe to assume that the bulk of thefemale headed families would have fallen in thiscategory of those below the poverty line. It istherefore pertinent to ask to what extent majoranti-poverty programmes address the problemsof women in poverty.
8.11 As already stated, the rural familiesidentified as falling below the poverty lineconstitute the target group of the IRDP. Thegroup consists of small farmers, marginalfarmers, agricultural labourers, rural artisansand others whose annual income is below the cutoff line. Under this programme 50% of thebeneficiaries should be from among SC and STfamilies, atleast 40% of the total beneficiariesshould be women and 3% physically handi-capped. Priority is to be given to female headedhouseholds.
8.12 IRDP assistanc consists of subsidytowards financial loans from the banks. Theassistance by way of subsidy under the schemeis fixed for each family according to certainnorms. The maximum subsidy allowed underthe scheme to a family is Rs.4,000. For SC/STand physically handicapped families the amountof subsidy could go up to Rs.6000.
8.13 Between 1980-81 and 1993-94 a total of1.2 million families in the state have beesassisted under this scheme. In 1992-93, out ofthe total of 50,517 families assisted 23,770 (47%)were reported to be women beneficiaries.However, the average financial assistance (bankloan plus subsidy) extended per female benefici-ary works out to 81% of that extended to a malebeneficiary.
Consequently, the proportion of financialassistance to women works out to 42% of thetotal.
Development of Women and Children in RuralAreas (DWCRA)
8.14 This particular programme is a sub-scheme of IRDP. The emphasis under thisprogramme is specifically to encourage andorganise groups of women to take up incomegenerating activities. In Kerala the scheme waslaunched in 1983-84 in Palakkad and Wyanaddistricts. Six more districts were added subse-quently. The scheme is being implemented atpresent in 8 districts viz Thiruvananthapuram,Alapuzha, Idukki, Palakkad, Malappuram,Kozhikode, Wyanad, and Kannur.
8.15 To attain the objectives of the programmethe following strategies are adopted:
a) Creating of employment opportunities ofrural women below the poverty line byproviding skills, vocational training, whichenhances productivity in their existingvocations or enable them to takeup newactivities so far not undertaken.
b) Organising women beneficiaries in groups.
c) Providing facilities for the children ofworking women by improved environment,care and food by establishing creches,balawadis etc
8.16 Ten to fifteen women could join togetherfor an economic activity of mutual interest to alland form a group. In addition to the IRDPfinancial assistance of subsidy - cum * bank loan,the assistance available to the group isRs. 15,000 as one time grant contributed equallyby the central government, state government,and UNICEF. The amount should be used as (i)
44

revolving fund for purchase of raw materufeand marketing (ii) honorarium to the grouporganiser which may not exceed Rs.50 permonth for one year (iii) infrastructure supprtfor income generating activities and (iv) a stime expenditure in child care facilities.
8.17 From the inception of the scheme in 383-84 till 1992-93 a total number of 1,510 gnnpiconsisting of 20,461 women have been profiledwith assistance under this scheme. Howeverthe proportion of SC and ST women amonf ±ebeneficiaries has been only 38 %, which isconsiderably lower than the 50% targeting itthese groups prescribed under IRDP. Quefconshave also been raised in evaluation studies ifthe DWCRA projects about their viability mdsustainability due to lack of infrastructure u dmarket support on the one hand and lack ofadequate skills and motivation by partiaptntwomen on the other [Haque, 1994].
Training of Rural Youth for SeHEmployment (TRYSEM)
8.18 This scheme was started in 1979 tocomplement IRDP. Its aim is to providetechnical skills to rural youth from familiesbelow poverty line so that they can take up « l femployment ventures. The target groupcomprises rural youth between the ages of 15-35. A minip""" of 50% of those trained haw tobe SC/ST and a minimum of 40% women. Also,there is a ifiinimnm target of 3% for physiailyhandicapped persons. The strategy followed isthat the identified youths will be helped toundergo a period of training, of six months,either with a training institution or under *master craftsman, for acquiring necessarytechnical skills. Trainees are eligible forstipends and a free tool kit after completion oftraining. The duration of the training dependson the nature of the trade. On successfulcompletion of training, the trainee is entitled forgetting assistance from IRDP, for the acquistionof an income generating asset
8.19 The number trained, in the state underTRYSEM during four years, 1990-91 to 19BS-94adds up to 26,251, of whom the proportion «cwomen was 51.3%, i.e higher than the target of40% although the proportion of SC/ST traineeswas only 38.6% which is far below the target of50%. The official documents also give infoma-
tionof the proportion of trainees helped to settledown in self-employment or wage employmentFor the four-year period the proportion thussettled works out to 66.6%. Unfortunately nogender or caste breakup is provided of thosesettled. It is not possible to say thereforewhether or not the women trained under thescheme could be helped in sufficient proportionto settle down in self-employment or wageemployment
Women's Industries Programme
8.20 With a view to promoting small scaleindustries in the state, the state governmentoffers several incentives. Industrial units withinvestment of upto Rs.6 million on machineryand equipments are treated as small scaleindustries. In order to encourage womenentrepreneurs to start small scale industries, thestate government is implementing a specialscheme known as "Women's Industries Pro-gramme* A small scale unit registered in thename of a woman and employing workers, 80%of whom are women, is eligible for assistanceunder this scheme. Some of the special incen-tives available for women's industrial units:
(i) Grant of 50% for the construction of thebuilding for the unit with a celing of Rs25,000.
(ii) If setup in a rented building, a centpercent grant up to a ceiling of Rs.500towards rent
(iii) Grant of 50%, towards investment onmachinery with a ceiling of Rs. 25,000.
(iv) Managerial grant
In addition, incentives like exemption from salestax for the first 7 years and training at govern-ment expense for six months to women manag-ers and enterpreneurs are also available.
8.21 According to the latest available informa-tion, of the 110,384 registered small scaleindustries units in the state, 14,742 (13.3%)were women's units. Lately, it appears that theproportion of newly registered women's units ison the increase. In 1993-94 out of 14,533 unitsnewly registered, 3,742 (25.7%) were units runby women.
45

8.22 As was noted above a women's industrialunit has to have 80 ft of its workers as women.On the basis of average number of workers perindustrial unit, it can be said that, on anaverage, five women should have got employ-ment in a women's industrial unit On thatbasis, more than 73,000 women should havebeen employed in all the women industrial unitstogether, currently registered in the state.
Summing Up
3.23 Going by the state's estimates of familiesbelow the poverty line, the problem of poverty isserious in Kerala. Equally important is to notethat there is a clear regional dimension to thisproblem with the incidence of poverty higher insome districts than other. While discussing themajor poverty alleviation schemes, currentlyunder implementation in the state, it comes outthat though targets are set for women, they areoften not fully reached.

9.1 The population of Kerala is distributedover 5.5 million households, with an averagehousehold size of 5.28. While, as can be seenfrom the Appendix 28, there are inter-districtvariations, the household size seems to bedistinctly large in the northern disricts ofMalappuram, Kannur and Kasargode. Thiscould be due, among other things, to thepersistence of joint families, and the overseasmigration of men in large numbers, especially tothe Gulf.
Family type
9.2 Prom the distribution of households byfamily type in Kerala, it would appear that thenuclear family of husband, wife and unmarriedchildren accounts for 45% of the families. Only13% of the households in Kerala live in jointfamilies. Only 3.2% ofthe households belong tothe category of women who live as singlemembers. This is a category which too comesunder the broader category of female headedfamilies but most female headed families are notsingle member families. In Kerala 19.4% ofthehouseholds, (i.e every fifth household) wereheaded by a woman in 1981 and the trend seemsto be that slowly but steadily the proportion isincreasing from one census period to the next.Between 1961 and 1981, this proportion hadincreased from 16.45% to 19.37%.
Fstrais Hstdsd Households
9.3 The Indian census has been collectingdata regarding the households headed by malesand females since 1961. The census defines thehead of the household as basically a person onwhom falls the chief responsibility for theeconomic maintenance of the family.
9.4 Households become female headed for avariety of reasons. Female headedness can betemporary or permanent and the implications
for the family are quite different in the twocases. While some households become temporar-ily female headed due to migration, the reasonsfor a household becoming permanently femaleheaded are largely death, desertion or divorce ofthe male member ofthe household.
9.5 Houses headed by women who may bewidows, divorced, or deserted (or even unmar-ried mothers) shoulder the main earningresponsibility for the family. These are usuallywomen who are forced by their particularcircumstance to take on this role and are neithertrained nor experienced in the economic activitythey take to. The greater the responsibility awoman in these circumstances has to shoulder,the more exposed she is to exploitation. Suchfemale headed families are generally the poorestof the poor. On the other hand, temporarilyfemaleheaded households, where women are notstrictly single parents, they may have themigrant husband contributing partially or fullyto the running of the family. No doubt, they stillhave to face problems of managing the familyaffairs almost on their own. But there is aqualitative as well as quantitative differencebetween the two types of female headedness.
9.6 The extent of female headedness in Kerala(19.37%) is much higher than what it is for thecountry as a whole (8.0%). There could beseveral factory contributing towards this. Mostimportant among these are perhaps thepersistance of matrilineal tradition, higherfemale literacy rates, greater access of women toproperty and regular work, and larger incidenceof ageing and widowhood in Kerala. In recentyears, male migration has also become animportant factor.
9.7 An important aspect of female headednessin Kerala is that urban areas have a relativelymuch higher concentration of female headedfamilies when compared with rural areas. Thiscan be seen from Table 9.1.
47

Table 9.1 : Incidence of FemaleHeaded Households in Kerala, 1961-81.
Typeof area
Rural
Urban
Ibtal
Percentage
1961 1971
16.23
17.87
, 16.44
17.09
18.49
17.37
1981
19.13
20.46
19.36
Source: Census of Kerala, 1961,1971,1981 Kerala Series
9.8 The districts of Kerala vary quite widelyin the incidence of female beaded households(see Appendix 29). The district of Kannur hasthe highest proportion of households headed bywomen followed by Palakkad, Kollam,Malappuram and Kozhikode. In other districtsthe incidence of female headedness was below20t in 1981. It is noteworthy that three out ofthese four districts are in the north. It isbelieved that a large number of families innorthern districts still follow matrilinealtradition and also face a high incidence of maleout-migration.
Female headedness byoccupation and religion
9.9 A study based on data collected in 1987-88for a project on cost of cultivation confirms the1981 census finding of high incidence of femaleheadedness in the state. This study reports thata very substantial proportion of female heads ofhouseholds belong to the occupational categoriesassociated with low income. It found that 49%female heads studied were engaged as agricul-tural or daily wage labourer, 27.8% werecultivators, 14.14% were engaged in retail tradeand 8.4% were in government service [Varghese,1994].
9.10 According to the same study, the propor-tion of female headed households in Kerala wasthe highest among Muslims (27.82%) followed byHindus (24.15%) and Christians (14.6%). Asurvey conducted in the two regions ofNeyyattinkara taluk of Thiruvananthapuramdistrict also showed that Muslim households hadmore female heads.
9.11 It is necessary to take note here of theview point that the census figures tend to reportonly de jure female heads, Le those who arewidowed, deserted / divorced or seperated and donot fi'lly take cognisance of the feet that inseveral other households also, the household ismaintained and supported principally out offemale earnings. But do women in thesehouseholds exercise much control in decisionmaking and family management is the question.According to the survey in Neyattinkara, around65% of the sample households were found tosurvive on female earnings. However, in only32% of the households did the women "possessthe power of financial management and decisionmaking.'
Summing Up
9.12 All in all, note has to be taken that inKerala this phenomenon of female headedness,however narrowly defined, is considerably morepronounced than in the country. Also, it has aclear regional-cum-religious dimension. At thesame time, a distinction will have to be drawn,for policy purposes, between those householdswhich are permanently female headed andthose whose female headedness is only tempo-rary, caused principally by male emigration.The former category of households would requirethe creation of special support mechanisms verydifferent than the latter category.
48

AND POLITICS
10.1 Historically, women's M U M did figure onthe agenda of the several refenn movements inKerala. The contents and focus of thesemovements were defined by die agitating groupor community, given their seperate rules andregulations. Most of these movements focussedhowever on the reform of laws relating tomarriage and property. Also, in the majororganised actions for better working conditionsand wages, industries which employed women inlarge numbers figured prominently.
10.2 The leadership, be it in social reformmovements or in organised industrial actions,remained predominantly male. While women'sparticipation at the point of organised actionwas, 'actively sought and secured, women werenot incorporated into the important levels ofleadership and decision making.' [Kannan,1988).
10.3 The question we would tike to raise here ishow active women are in the movements andpolitics of today. On a little reflection, thissimple question raises a whole gamut ofquestions. Are women in Kerala still activeparticipants in organised actions and what istheir access to positions of leadership andauthority? How active is women's participationin politics? Do they take part actively inelections and campaigns? Do they stand forelections and elected offices? Or do they stillremain largely in the background? What arewomen's issues at present and what sort oforganisations have come up to take the issues upand with what priorities?
Participation in Politics
10.4 Women's participation in politics in Keralais low and no different from the rest of thecountry. A common explanation offered toexplain this relatively low participation bywomen is that their family responsibilities comein their way. Is this purely a male defence
offered in rationalising the phenomenon, and tocover the pervasive male dominance? Whateverthe answer, the fact remains that when opportu-nities in the world outside have come their way,women have not been found wanting in takingthem up. In taking to education and profes-sional work in Kerala women have not been farbehind men.
10.5 In politics too, going by their participationin the elections to local bodies, state assemblyand parliament, it cannot be said that women ofKerala prefer to be mute witnesses to thepolitical processes. On the contrary, going by thenumbers in which they turn out for electioneer-ing and to cast vote in various elections, women'sparticipation can quite justifiably be describedas active. In practically every recent election inthe state, the proportion of votes cast by womenhas been around 50 per cent Still, the propor-tion of women among those contesting theelections and getting elected, has tended to beextremely small.
10.6 In the present state assembly, elections towhich were held in 1991, the number of womenis a mere eight in a house of 141. In 1957, theirnumber was seven in a house of 121. Of thetwenty elected representatives from the state toparliament's lower house, Lok Sabha, only twoare women.
10.7 The women's representation in the statecabinet has also remained rather nominal. Inthe present cabinet of twenty there is only onewoman minister. Important portfolios have oftengone to men. The exception has been the Left inthat whenever it was in power in the state, oneof its major portfolios was held by a woman,K.R.Gowri, who also held an important positionin the party hierarchy. She was even spoken ofas a likely nominee of her party as the state'sChief Minister, should the Left win the elections,which it did not
49

10.8 Whik a handful of woMn in Kerala havereached the top it has been possibfe onry by theirshear grit and determinarioi These have beenisolated cases without reflecting any easing ofwomen^ entry into the higher echelons ofpoljcitcal leadership in partial or governmentThat women have held high positions in theState's judiciary and bureaucracy and in largerproportions, goes to show only that whereveropportunity is available women of the state tendto take its full advantage. In politics, the doorsto higher positions have so far been virtuallyclosed to them. Some openings have latelysurfaced however, thanks to the recent amend-ments to the Indian Constitution requiringminimum one-third representation to women inlocal bodies, and among their elected officeholders.
District Councils10.9 It is worth recalling that the Kerala StateAssembly enacted a legislation in 1989 providingfor 30% reservation for women in the DistrictCouncils. In the elections to these councils in1990, the number of actually elected womenmembers constituted 34% of the total.
10.10 According to the major findings of asurvey of these elected women, while all wereliterate, 51% were graduates and 13% had postgraduate qualifications. It is noteworthy thatpractically all these elected women read onenewspaper or more daily (94% read two or morenewspapers). Thus all the women members ofDistrict Councils felt obliged to keep themselvesfully informed of the events, political, social oreconomic, in the state and did not permit theirfamily responsibilities to come in their way, atleast not in this regard.
10.11 Very soon, after elections due in Septem-ber 1995, new Panchayati Raj institutions,including District Panchayats, will startfunctioning in the state. Women will be repre-sented at all the three levels, and will also havedue numbers among elected office holders. This
, will give them an opportunity to demonstratetheir effectiveness and participation in govern-ance. It will also then demonstrate the differ-ence in the quality of governance with theparticipation of women. One thing is certainthat if the earner experience with the electionsto District Councils is any guide, the politicalparties should have little difficulty in picking up
educated women as their candidates to variouslocal bodies in Kerala.
Ofgmistions and Movements10.12 As was stated at the outset, women have,in the past been drawn into various movementsin the State. Their participation however hadbeen more as followers and less as leaders. Theyplayed a marginal role m decision making, withleadenhip almost exclusively in male hands.Even the present situation is not very differentTable 10.1 gives the membership of women infour major trade unions in the state and theirrepresentation in the state executives.
10.13 It is clear that the representation ofwomen at the state level is far below what theirnumber in these organisations would warrantThis, as can be seen, is no less true of the unionsrepresenting teachers as of those representingworkers. The membership of women in KSTA,the major union representing teachers, is morethan that of men. Still in the state levelexecutive, there are only eight women out of atotal of 75. Here, it should be added that the byelaws of the organisations require atleast 10% ofthe total members of the apex body should bewomen.
10.14 There is no dearth of organisations ofwomen functioning in Kerala. Statistics collectedin 1987 reportedly showed that almost 50,000Manila Samajams (women's associations) wereparticipating in the various governmentschftrtfls. ThfWt as(W"«*i(mfl oonw up with aview to tapping funds which become availableunder different government schemes. Theirnumber is impressive indeed but it is not certainthat all of these are genuinely involved in theadvancement of women's causes. The leadershipof these groups, its competence or motivation isnot always above suspicion and their viability isuncertain. When government funds becomeunavailable for some reason these associationsbecome defunct in no tiae.
10.15 In addition, there are other non-govern-mental organistions which, though not exclu-sively devoted to women^ issues, are known tohave taken up women's issues in the state. Onesuch organisation is Kerala Shastra SahityaParishad (KSSP), also known as People's ScienceMovement, which organised health camps forwomen in different parts of the state. The same
so

i»
organisation successfully led the Total literacyCampaign in the state in the late 19W» andcould mobilize volunteers, mostly women, towork untiringly for the purpose so that by eariy1991 Kerala became the first state in India toachieve formally total literacy.
10.16 While KSSFfc reach extends to practicallythe whole of the state Acre are organisationswhose geographical reach is not that extensivebut who too are attending to women's issues andconcerns within their limited resources andrestricted reach.
10.17 People's Community Organisation, PCO,focusses on fishermen and women. Abhaya, anorganisation set up in 1985, and born out of adeep concern for mental patients, runs a shortstay and rehabilitation home for women indistress. SEWA, an organisation of self em-ployed women functioning inThn-uvananthapuram since 1983, helps womenmembers become more self supporting throughtraining, loans, legal aid etc
10.18 Lately, the anti-liquor campaign by localrural women in Kerala has attracted widenotice. typeen island achieved notoriety in1982, when 70 persons died and 24 lost eye sightafter consuming adulterated akhohol. In 1994,women of the island got together and startedagitating against liquor and toddy shop complexlocated close to a temple and primary school.They picketed the complex to prevent menfolk;from going in and the picketing has continuedfor several months, achieving reasonablesuccess. In a few other villages of the state alsosimilar agitations by local women have producedpositive results.
Summing UP
10.19 While such local level agitations spring upfrom time to time under the leadership of localwomen in different parts of the state to fightagainst local injustices, it is probably still truethat no major movement has taken shape at thestate level to voice the specific concerns ofwomen. Although the immediate concerns ofKerala's women may not be quite the same as inthe rest of India (for example, dowry deaths andsati or immolation of widows are two majorissues in the northern parts of the country butnot in Kerala), the fact remains that even for
Kerala'ssender
ocerns about violence, rape,imin«tMM> in wages and employment
are as serious as in the other parts of thecountry. Women's organisations and movementswill be needed therefore as much in Kerala aselsewhere in India and they will need to besupported. It will not be enough to have manymore women participating hereafter in localbodies as elected members and office holders.Indeed, active socially motivated women's non-government organisations could become a sourceof great strength to the elected women membersof the local bodies in their pursuit of women'scauses.
51

11.1 It is generally recognised that theperformance of Kerala in reaped of variousaorio-demographk indication has been exem-plary despite its income level being quite tow. Interms of percapita income Kerala ranks in thelower half of the Indian states. Also, Kerala haslagged behind in terms of economic growth.Between 1980-81 and 1990-91 Kerala's growthrate was almost half the national growth rate.
11.2 Within the state however, all the districtshave Dot fared equally well even in socic-demographic indicators, particularly thoserelating to women. For meaningful interven-tions, it is necessary to isolate the backwarddistricts and identify the gaps in their perform-ance.
11.3 With this objective in mind we haveidentified a few major indicators, for which
disaggregated data with respect to women, areavailable, under four broad areas, of reproduc-tive health, health care, education and employ-ment Strictly speaking, employment would beconsidered as a major index for economic activitybut we thought it necessary to include it as anindicator because of its dose implications forsocio-demographic progress. The districts areranked according to their performance in respectof different indicators.
11.4 Under reproductive health, the indicatorschosen are birth rate and couple protection rate.Under health, we have chosen the ratio ofhospital beds to population and the utilizationof hospital facilities by women patients. Undereducation, level of female literacy is the onlyindicator we have chosen to rank districts.Under employment, the indicator chosen is thatof female work participation in conjunction withper capita income.
Table 11.1 Inter-Dutrict differences in ReproductiveHealth a r t Health Care.
District Birth Couple Hosp. beds Femalerate Protection per 100,000 patientsper Rate persons treated1000 % 1992-93 per 1000population women
(1988) 1994 (1992-93)rank rank rank rank
TVMKLMPTAALPKTMIDKEKMTHRPKDMLPKZDWYDKNNKGD
STATE
20.516.117.314.816.817.915.818.718.928.420.019.425.226.8
SOJ
n35146278141091213
1
75.471.758.668.473.551.268.467.744.043.363.6
50.858.645.4
60.9
13842
1056
13147
119
12
22488
14322621779
1591529467
16211410260
211713
1256
1013489
14
140
123388273710121239718938808824638769
336670359
846
25
931
10476
128
1411
13

nvprooucuvo nomn HtaHhCart
11.5 Tabte 10.1 raiik the districts according totheir performance in the anas of reproductivehealth and health can. The major point thatemerges in regard to reproductive health is thatdistricts difler rather sharply in their birthrates. Three districts of Malappuram, Kasargodand Kannur have birth rates that are way abovethe state average. The couple protection rate israther low in the districts of Malappuram,Palakkad and Kasargode. It is well below thestate average. The inter-district differencesinthe IMR are particularly large in Wyanad,Palakkad and Idukki A combination of factorslike high neo-natal death, low coverage ofimmunization and lack of institutional helpduring child births probably contribute to theirdifferences.
11.6 Accesstohc eems to be quitelow in districts where HfB and birth rates arehigh. The district of ltjJapparam,whkh rankedworst in terms of high birth rate, and low coupleprotection rate is also the district with very lowbed-population rate and the lowest femalehospital utilisation rate. Very nearly the same isthe case of Kasargode. The connection betweenthe reproductive health performance and theaccessibility of medical services cannot be missedin the case of those two districts. In terms ofutilization, the state average of 846 womenpatients per 1000 female population is itself quitehigh by any standard but some districts likeEbttayam, Thiruvananthapuram and Allapuzhaseem to do even better in the use made by womenof the facilities but Kasargode and Malappuramare distinctly behind in the matter of both accessand utilization of health care facilities by women.
Table U.2: Inter-district differences in IlliteracyWork partkipationand p a
Femaleilh'teracrate(%)(1991)
Districts
TVMKLMPTAMLPKIMIDKEKMTHEPKDMLPKZDWYDKNNKGD
14.213.06.78.96.0
17.010.713.124.315.913.223.312.323.7
KERAIA
]fi
•femaleworkpartici-pation
'capita income.i
Female Registrants Per capita
rate (1993)%
rank
69
13121441181573
102
13.8
15.517.012.421.95.1
23.815.317.923.1
8.79.0
23.713.820.9
15.86
rank
76113
141864
1312295
As percentage offemalepopulation
(1993)
24.716.815.816.818.210.815.311.9
8.94.8
10.28.78.75.2
13.1
rank
13542867
10149
111213
income(1991-92)
(Ks)
45674613478247254775612272124660366326884609484142394273
rank
108465217
1314
93
1211
* figures relate to population of women aged six years andabove.

11.7 The backward districts of Kerala have alsoa lot of catching up to do in regard to femaleliteracy abo. It can be seen from table 11.2 thatin Palakkad, Kasargode and Wayanad femaleiltiteracy is almost twice as high as in the stateas a whole. Wayanad, it has to be noted, rankshigh in terms of per capita income. Also, inthree other districts, including surprisinglyThiruvananthapuram and Idukki both with percapita income higher than for the state, illit-eracy is greater than the state average. Withsome of the districts with relatively high percapita income also showing rather high level offemale illiteracy, the question docs arise aboutthe possibility of pockets within such districtsthat have not benefited adequately from thefacilities or have not had easy access to themand therefore requiring special attention. Thiscould be true, in particular, of the tribal commu-nities in Wayanad and Idukki.
Employment
11.8 Female work participation no doubt is lowfor the state as a whole^till there are significantinter-district differences. One known explana-tion for higher female work participation insome districts is their cropping pattern. Idukki
and Wayanad are the two district* with concen-tration of plantation crops far which femalelabour is employed in a large proportion. InPtlakkad and Alappuzha districts, paddycultivation dominates and there again femalelabour plays a major role. However, even indistricts where female work participation is low,the desire to participate in work is high.Kottayam is the district with the lowest femalework participation but is also the district wherefemale registration ratio is dose to the highestIt is also the district with the lowest level offemale illiteracy. Districts like Malappuram andKasargode, with quite high female workparticipation rates have rather low registrationratios but high illiteracy rates. These are thesort of connections that one has to bear in mindwhatever the focus of an intervention.
Summing Up
Whichever be the area of policy intervention, thefact of substantial inter-district differences inKerala in regard to women's health, literacy oremployment will have to be borne in mind inorder to ensure that districts (and even pocketswithin districts) which have, for some reason,fallen behind are helped to catch up with thosethat have gone ahead.
Appendix. 1: District-wise population growth
District Population 1991(lakhs]i
Males Females Total
1.TVM2.KLM3.PTH4. ALP5.KTM6IDK7.EKM8.THR9.PKD10.MLPll.KZD12.WYD13.KNN14.KGD
14.4811.835.769.769.135.46
14.0913.1211.5615.0812.933.4210.995.29
15.STATE 142.8!
14.9912.256.12
10.259.155.32
14.0814.2512.2615.8813.273 3011.535.43
) 148.10
29.4724.0811.8820.0118.2810.7828.1727.3723.8230.9626.20
6.7222.52
10.72
Decadal (1971-81) 1981-91growthrate
Total ]Popul-ation
18.0818.279.4511.6210.2926.6417.18146021.3029.4323.2533.8724.3427.78
290.991934
Females
18.3518.3010.00
12.1110.8326.8117.7615.5421.2730.0823.5032.9025.5028.0020.13
Growthrate
Total!
13.5010.695.607.287.71
11.2311.1212.2116.5328.8716.69
21.3216.6322.7814.32
Females
13.8211.365.887.787.77
11.5311.2211.5016.7628.9017.0222.2217.5322.3014.58
Source: Census of India - Paper 2, Kerala ft Women in Kerala - DES

i
Appeodii.2 : District-wi* population by religion of head ofhonnholdt
(1961 Census) (000) (Percentage)District Hindus Muslims Christians Others Total H M C
TVMKLMPTHALPKTMIDKEKMTHRPKDMLPKZDWYDKNNKGDSTATE
18121425610
1286807488117314641495772
1375280
1256559
14802
32S36253
1578463
340363473
1574762136464257
5413
459406445423806418
10196137657
10813621157
5234
25962193110818661697969253524402044240322455541931873
69.8064.9855.0668.9247.5550.3646.2760.0073.1432.1361.2550.5465.0464.03
25454 58.15
12.5216514.788.414.956.50
13.4114.8823.1465.5033.9424.5524.0329.4421.27
17.6818.5140.1622.6747.5043.1440.2025.123.722.374.81
24.5510.936.53
20.56
• 100.00- 100.00• 100.00- 100.00- 100.00- 100.00
0.12 100.00- 100.00• 100.00- 100.00- 100.00
0.36 100.00- 100.00- 100.00
0.02 100.00
Source: Statistics for Planning, 1988 - DESNote: Article 3411 Article 342 of the Indian Constitution declare that the President ofIndia may wtth respect to any state or union territory and where it is a state after consulta-tion with the Governor thereof, by public notification specify the castes, races or Tribeswhich shall for the purpose of the constitution be deemed to be SC/ST in relation to thatstate or union territory as the case may be. Thus SC/ST may be defined as those groupswhich are named in the SC/ST order of the Government of India, in force from time to time.
Appendix.4: Density of population of Kerala 1951 • 1991
District
TVMKLMALPPTHKTMIDKEKMTHRPKDMLPKZHWYDKNNKGD
STATE
1961
60644627282551466
57946327132447679
305206
349
1961
796587336993596115706557306391599129397257
435
1971
1003738389
1182699152899702376523777194524343
549
1981
1184873426
1319771193
1053805456677958260651438
655
1991
1344967450
1415830215
1170903532872
1118315759538
749
Source: Economic Review, 1993 and Census of India.
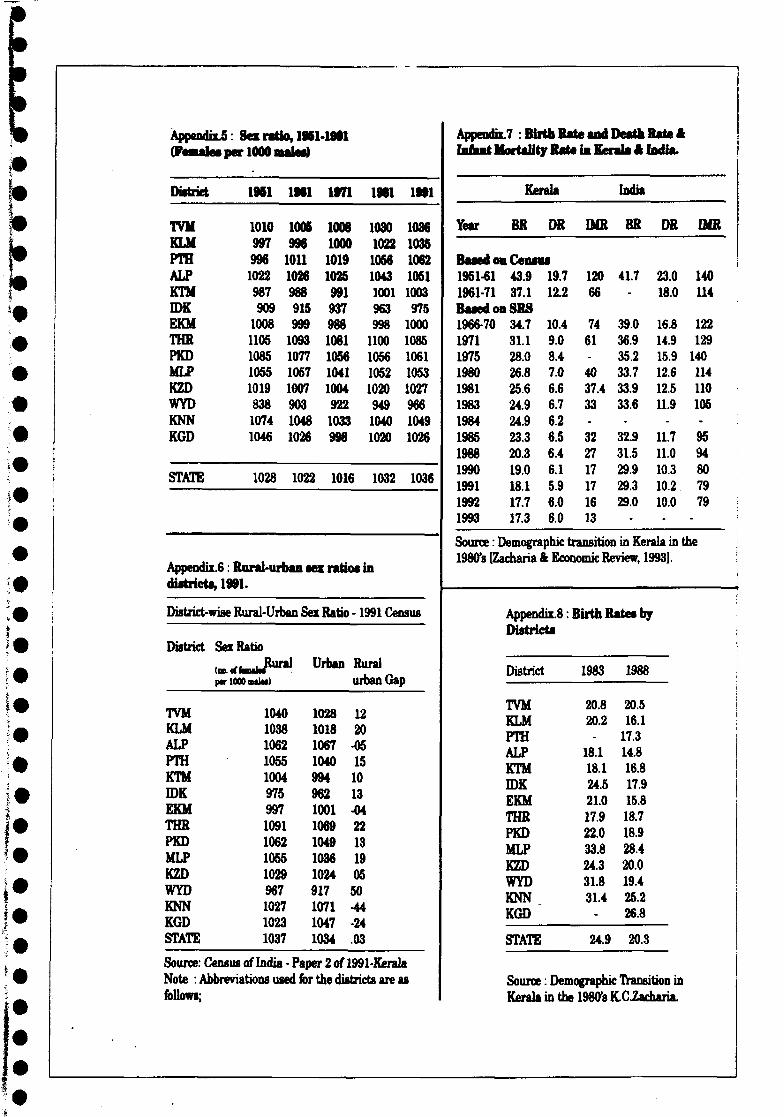
AmmMiix_9 : Sex ratio. 19S1(Feaulaa par 1000 aalea)
District
TVMKLMPTHALPKTMIDK
1961
10109979961022987909
INI
1006996
10111026988915
-1M1
1971
1008100010191025991937
1961
10301022106610431001963
1991
1036103S106210511003975
Appendix.7 : Birth Rate and Death Hate 4Infant Mortality Bate in Kerala * India.
Kerala India
Year BR DR IMR DR DIR
EKMTHRPKDMLPKZDWYDKNNKGD
1008 9991105 10931085 10771055 10571019 1007838 9031074 10481046 1026
10811056104110049221033998
998 10001100 10851056 10611052 10531020 1027949 9661040 10491020 1026
STATE 1028 1022 1016 1032 1036
Appendix.6: Rural-urban sex ratio* indistricts, 1991.
District-wise Rural-Urban Sex Ratio -1991 Census
District Sex Ratio(na r f fa i i i iJlural Urban Rural
urban Gap
TVMKLMALPPTHKTMIDKEKMTHRPKDMLPKZDWYDKNNKGDSTATE
104010381062105510049759971091106210551029967102710231037
1028 121018 201067 -051040 15994 10962 131001 -041069 221049 131036 191024 05917 501071 -441047 -241034 .03
Source: Census of India - Paper 2 of 1991-KeralaNote : Abbreviations used for the districts are asfollows;
Based on Census1951-61 43.9 19.71961-71 37.1 12.2Baaed on SRS1966-70 34.7 10.41971 31.1 9.01975 28.0 8.41980 26.8 7.01981 25.6 6.61983 24.9 6.71984 24.9 6.21985 23.3 6.51988 20.3 6.41990 19.0 6.11991 18.1 5.91992 17.7 6.01993 17.3 6.0
120 41.766
74 39.061 36.9
35.240 33.737.4 33.933 33.6
23.0 14018.0 114
16.8 12214.9 12915.9 14012.6 11412.5 11011.9 105
322717171613
32.931.529.929.329.0
11.711.010.310.210.0
9594807979
Source: Demographic transition in Kerala in the1980*8 [Zacharia & Economic Review, 1993].
Appendix.8: Birth Rates byDistricts
District 1983 1988
TVMKLMPTHALPKTMIDKEKMTHRPKDMLPKZDWYDKNNKGD
20.8 20.520.2 16.1
17.318.1 14.818.1 16.824.5 17.921.0 15.817.9 18.722.0 18.933.8 28.424.3 20.031.8 19.431.4 25.2
26.8
STATE 24.9 20.3
Source: Demographic Transition inKerala in the 1980*8 RCZacharia.

i
Appendix 12
Age Group
15-1920-2425-29.30-3435-39404445-4950-5455-5960 & aboveAll ages
:p«t«eatafB distriboUonofpopi
FEMALES
1991 (Sample Registration)
NeverMaiiKw
90.247.218.07.34.23.42.82.52.12.6
46.2
Married Widowed/
9.751.979.487.687.484.477.370.061.234.842.9
Divorced/Separated
0.10.92.65.18.412.320.027.436.750.310.8
Oatioa oyauriitalatetw-
1981 Census
NeverMarried
85.440.212.55.83.5343.03.12.82.4
50.8
Source: S.R.S Bulletin • Annual, 1992 and Census of India, 1981.
Appendix. 13190141.
Married
14.157.983.687.686.981.776.668.059.930.138.7
: Mean age at marriage for men A women,
KERALA
Year Men
1901 23.21911 23.81921 23.31931 25.61941 2561951 26.31961 23.81971 26.31981 27.2
Women
17.117.317.819.619.319.820.020.821.9
Difference
7.36.95.85.24.45.34.65.55.0
Men
20.220.518.420.219.821.421.322.723.3
INDIA
Women
13.213.612.615.015.416.116.717.218.3
Source: Women, Men and Development in Kerala -Dr.S.Radha, IMGTVM.
Difference
6.16.55.56.06.36.56.85.55.3
1994-
KERALA
Widowed/Divorced/Separated
0.52.03.96.69.7
14.920.428.937.367.610.5

p
Appendix 12
Age Group
15-1920-2425-2930-3435-3944M445-4950-5455-5960 & aboveAll ages
Percentage distribution of population by marital lUtou •
FEMALES
1991 (Sample Registration)
NeverMarried
90.247.218.07.34.23.42.82.52.12.6
46.2
Married Widowed/
9.751.979.487.687.484.477.370.061.234.842.9
Divorced/Separated
0.10.92.65.18.412.320.027.436.750.310.8
1981 Census
NeverMarried
85.440.212.55.83.53.4
3.03.12.82.4
50.8
Source: S.R.S Bulletin -Annual, 1992 and Census of India, 1981.
Appendix.131901-81.
Married
14.157.983.687.686.981.776.668.059.930.138.7
: Mean age at marriage for men & women,
KERALA
Year Men
1901 23.21911 23.81921 23.31931 25.61941 25.61951 26.31961 23.81971 26.31981 27.2
Women
17.117.317.819.619.319.820.020.821.9
Difference
7.36.95.85.24.45.34.65.55.0
Men
20.220.518.420.219.821.421.322.723.3
INDIA
Women
13.213.612.615.015.416.116.717.218.3
Source: Women, Men and Development in Kerala -Dr.S.Radha, QiGTVM.
Difference
6.16.55.56.06.36.56.85.55.3
1994-
KERALA
Widowed/Divorced/Separated
0.52.03.96.69.7
14.920.428.937.367.610.5

Appeodix 9 : A|e Specific Fertility Ratalin Kerala • Bard.
group
15-1920-2425-293044354940-4445-49GFR
1971
49.12119226.6175.8118.443.67.0
125.4
1981
39.3175.5166.298.653.919.44.994.7
1982
31.8176.5168.095.453.818.13.897.0
1983
35.0172.7161.087.542.513.6
3.191.9
1984
34.5179.2168.074.635.814.14.0
83.6
1986
33.7177.0155.473.029.614.21.8
-
1986
36.7166.1147.167.527.411.22.9
-
1991
25.5142.1122.046.915.04.40.764.4
Source : Statistics for Planning-DES, 1993 andSRS Annual Bultetin-1992.
Appendix.10: Percentage distributionof live birth by order of birth 1991(Staple Registration) Kerala.
Order of birth
123456789
Persons44.934.413.33.81.50.90.60.40.1
10 & above 0.2All 100.0
Percentge distribution
Malee46.233.213.23.81.60.90.50.40.10.2100.0
i Females43.535.713.4
3.91.30.90.70.40.10.1
100.0
Source: S R S Bulletin, Annual, 1992.
Appendix. 11: Percentage distribu-tion of current live birth* by birthinterval 1991 (Sample Begiatra.tionj Kerala.
Birth intervalin months
Percentagedistribution
10-1212-1818-2424-30303636 & aboveAll
2.68.922.013.316.636.6
100.0
Source: S R S Bulletin-Annual, 1992.

Appenda.14frmlMlc
District
TVMKLMALPPTHKTM[DKEKMTORPKDMLPKZDWYDKNNKGDSTATE
IMRwtiMtwtDM
Infant Mortality Rate
444538.366233446449547345
52
Source: Census of India, 1981.
Appendix.15: Afe-wi*e distribution ofpopulation in Kerala, 1M1 (census), 1M1
Age group(yean)
0-45-910-1415-1920-2425-293044354940-4445-4950-5455-5960-6465-6970 & aboveAll
Percentage of distributionFemales
1981
10.411.212.512.110.68.4615.64.44.63.42.92.72.13.0
100.0
1991
9.6949510.0U.59.77.86.55.44.44.0362.82.33.4
100.0
Total Population1981
10.711.512.811.810.38.2
6.25.54.54.63.52.92.72.02.8100.0
1991
10.09.7
10.010.310.89.47.96.55.44.43.93.52.82.23.2100.0
Source: S.HS Bulletin-Annual, 1992 andCensus of India, 1981.
Appendix-16: Effective literacy rate(percent).
District
TVMKLMPTHALPKTMIDKEKMTHRPKDMLPKZDWYDKNNKGD
STATE
Total
89.290.594.993.995.786.992.490.181.387.991.182.791.582.5
89.8
Male
92.894.196.696.897.590.895.593.887.292.195.687.695.689.0
93.6
Female
85.887.093.391.194.083.089.386.975.784.186.877.787.776.3
86.2
Note : Effective Literacy Rate excludes0-6 population. Source: EconomicReview, 1994.

Appendix 17: Nnaber of tauitm usually engaged in (principal State) Doaeatk duties andcarrying out specified activities perfemales engaged in domestic Auto*
Specified additional activities Number of females per 1000 female engaged
1234567891011121314
15
MninfrnftfHT if Kitchfn pirdtn rtcWork in HH Poultry, Dairy etcFree collection of fish etcFree collection of firewood etcHusking of PaddyGrinding of food grainsPreparation of gurPreservation of MeatMaking BasketsPreparation of cowdung cakesServicing, tailoring etcTutoring of own childern
Rural Urban28636557290122310
455752104569
Bringing water from outside HH premises 298Bringing water from outsidevil-premises(A) Distance uptolKm(B) Distance 2-5 KmAnyofitemltOH
11111
747
22296-68
378522
62--
254192130
---
730
Source: NSS 43rd Round, July, 1987-JuneJan, 1992
1988 published in Sarvekshana,
Appendix 18: Industry-wise distribution of main workers • 1981 and 1991
Industrial category
I Primary1. Cultivators2. Agri. Labourers3. Livestock, Forestry
Fishing, Huntingand Plantations, andAllied activities
4. Mininga)Household Industry
Processing inother than householdindustry
miertiaiy6.Construction7. Trade ft Commercea/Transport, storage 4Communication
9.0ther services
Total Main workers
1991
9.1114.36
6.49
0.69
6.82
3.159.62
4.698.11
64.04
Male1981 Difference
8.0611.99
5.42
0.50
6.22
1.896.97
3.165.96
51.41
1.052.37
1.07
0.19
0.60
1.262.65
1.532.15
12.63
Note : Number of total workers (100,000)
Source: Census of India
1991
1.056.84
1.18
0.14
2.80
0.180.8750.284.49
Females1981 1
0.827.19
1.07
0.04
2.06
0.140.53
0.263.13
Differences
0.26(-)0.35
0.11
0.1
0.74
0.040.34
0.021.36
18.97 6.50 2.47

.
• i Appendix.19: Distrkfcwte number offactories and employment (IMS).
District No.of Employmentfactories (DOB)
TVMKLMPTHALPKTMIDKEKMTHRPKDMLPKZDWYDKNNKGDSTATE
7451402344867
1136285
221718951504765
1562123
1348106
14399
27976141699
97962179717819
71966554329464227949507
299602059
243102851
412971
Source: EconomicReview-SPB-1994.
Appendix.20: Registrants at employment exchangesby district and gender, 1983.
District
TVMKLMPTHALPKTMIDKEKMTHRPKDMLPKZDWYDKNNKGDSTATE
RegistrantsMale
37210718434074577
157887143879
5916521783613716713778211820214898633086122525425671950105
Female
3700682053209669217182316623057704
215633170267109252766961355702883110071528054
> 1932855
Total No.of femalesper
7521753896601712693297103101091168694334693074342470341948982845566191622324070621
3882960
1000 males
9951114129710881155975990
1241796649910871822659991
Source: Economic Review, 1993.
Appendix.21 : District-wise population
1961 and 1991.
District
TVMKLMALPPTHKTMIDKEKMTHRPKDMLPKZDWYDKNNKGDSTATE
No of Institution per hundredthousand of population
1980-81 1990-91
3.74 3.63.45 3.4
4.73.84 4.13,83 424.73 5.83.83 4.03.85 4.13.96 4.33.58 3.62.81 3.34.64 4.25.23 6.1
5.53.83 4.2
Source: 1. Women in Kerala, 1984, DES2. Indicators of Regional Development • DES3. Economic Review, 1988.
Appendix.22: District-wise areacoverage of allopathic institu-tions 1991.
TVMKLMPTHALPKTMIDKEKMTHRPKDMLPKZDWYDKNNKGDSTATE
Source:
4.93.33.14.03.41.24.73.72.33.23.71.93.23.03.1
Economic Review, 1993.

Appendii.23 : Inter dijtrictvariations in beds per popula*tion in goveruMat allopathichospitals.
Districts Beds per 100,000
population
TVMKLMPTHALPKTMIDKEKMTHRPKDMLPKZDWYDKNNKDG
2198586199223SO133148896916411610461
STATE 129
Source: Economic Review, 1994State Planning Board (SPB, 1995)
Appendii.24: Inter district differences infemale hospital patients, 1992.
District Total no of No of femalefemale patients patients per 1000(1000) female population
TVMKLMPTHALPKTMIDKEKMTHRPKDMLPKZDWYDKNNKGD
18.4910.814.51
10.3711.34
3.8213.2211.5210.1010.1310.201.117.73
1.95
1233882737
10121239718938808824638769336670359
STATE 125.30 846
Appendix.25: Inter district eora i fe byiaauuiiation, 19M.
District Proportion Fully Proportion notIininiiniwid
TVMKLMALPPTHKTMIDKEKMTHRPKDMLPKZDWYDKNNKGD
STATE
81.779.9
80.683.178.1
73.985.558.452.840.479.479.782.588.8
76.7
4.42.8
0.50.2
0.01.10.35.22.415.73.03.04.73.6
3.4
Note : Vaccinated proportion which hasundergone ail prescribed vaccination.Source:!State Plan of Action for the Childin Kerala, GOK, 1995.
Appendiz.26: District wise coverage underthe drinking water supply schemes
District
TVMKLMPTHALPKTMIDKEKMTHRPKDMLPKZDWYDKNNKGDSTATE
Percentage ofPopulation coveredRural
494332614732525757221429213241
Urban
7370558177766675626356504310065
Incidence of water-borne diseasesAttackNo
147,24860,72925,19482,77047,78729,55186,87773,50966,984152,77259,03723,911.33.241
15,110904,720
%
16.36.72.89.15.33.39.68.17.4
16.96.52.63.71.7
100.0
Source: Administration Report of Health ServicesDepart- ment for the year, 1990-91, Kerala,Economic Review, 1994.

InteMiftrict distributorporerty line in rural Kerala.
Dotrict No of families below die poverty line
Percentage SCwithin Nodistrict
STNo.
OthenNo
TbtaJNo
1.TVM2.KLM3.PTH4.ALP5.KTM6 IDK7 EKM8THR9.MLP10.PKDll.WYD12KZD13.KNN14.KGD
49.145.930.547.136.5
34.142.245.539.340.6413
56.855.041.9
34280244581389578714454
103194208
2726513470366142023
931611427223
17.512.57.14.02.35.22.1
13.96.918.61.0
4.70.63.7
216195
72247
7496422
11843012474571
16063288196
2555
6.10.32.00.12.1
18.0
0.31.23.512.845.00.80.57.2
16681816111554710
1266041040735946411636414832115620911152635673
15693310489753965
20325918566869320134522109276762051206901760161709261527U5375916653710623563743
11.410.43.97.56.14.36.79.89.68.53.09.35.93.6
STATE 43.5 196538 100.0 33664 100.0 1556672 1786874 100.0
Based on 1990 state survey.Source: Economic Review, 1993, SPB, 1994.
Appendix.28: Avenge household size.
District No.of Average Average no.ofhouse- household women perholds size household(1991 (1991 census)census)
Appendix.29: Inter-district differ-ences in female headednem.
District 1961 1971 1981
TVMKLMPTHALPKTMIDKEKMTHRPKDMLPKZDWYDKNNKGD
619490259405362
233556522445477457135371182
4.964.924.58
4.945.054.635.075.245.356.495.744.996.075.90
2.422.502.362.532.532.282.532.732.763.332.902.443.112.98
STATE 5513 5.28 2.69
TVMKLMALPKTMEKMTRSPKDMLPKZHWYDIDKKNN
20.6713.51
13.667.479.64
18.9922.94
15.75-
25.23
21.3214.81
15.798.0610.8720.1421.6218.9016.86
25.80
10.6122.5017.2017.8210.4510.2723.0922.2721.8317.2710.4829.55
Sourer: Census of India, 1961,1971
and 1981 • Kerala Series.
Source: Census of India.

m
#
Augusty, K.G, 1994, •Housing and Social Changein Kerala*, International Congress onKerala Studies, Abstract, Vo)3, A.K.GCentre for Research and Studies,Thiruvananthapuram.
•Census of India*, 1991, Government of India,New Delhi.
"Census of India*, 1971, Government of India,New Delhi.
"Census of India", 1981, Government of India,New Delhi
"Census of India', Travancore, 1931, vol. XXVIII,Parts I k II, Thiruvananthapuram.
Department of Health Services, 1992, "FamilyPlanning Programme Year Book*,Government of Kerala, GovernmentPress, Thiruvananthapuram.
Department of Health Services, 1995, State Planof Action for the Child of Kerala,Government of Kerala,Thiruvananthapuram.
Department of Health Services, 1994, "Adminis-tration Report for the year 1990-91",Government of Kerala, GovernmentPress, Thiruvananthapuram.
Department of Health Services, "AdministrationReport, 1991-92", Government ofKerala, Government Press,Thiruvananthapuram.
Department of Economics and Statistics, 1993,"Statistics For Planning" Governmentof Kerala, Government Press,Thiruvananthapuram.
Department of Economic and Statistics, 1984,"Women in Kerala*, Government ofKerala, Government Press,Thiruvananthapuram.
Department of Economics and Statistics, 1985,Indicators for Regional Development*,Government of Kerala, GovernmentPress, Thiruvananthapuram.
Eapen, MriduL 1994, "Employment and Unem-ployment in Kerala: an overview',Centre For Development Studies,Thiruvananthapuram.
State Planning Board, Kerala, 1994. "EconomicReview*, Government of Kerala,Thiruvananthapuram.
George, K.C. 1975, "Immortal Punnapra -Vayalar", Communist Party of IndiaPublications, New Delhi.
Gulati, Leela, 1991 "Women's Role in FertilityDecline in Kerala State.* LoyolaJournal of Social Science, 5(2), pp. 117-133, Yuva Deepti Press, Manvila,Thiruvananthapuram.
Haque.T, 1994, "Impact of Development Policiesof Government on Women in Agricul-ture*, Paper submitted in the work-shop on Women in Agriculture, held on21-22 Nov, 94, Thiruvananthapuram.
Institute of Management in Government, 1994,"Women, Men and Development in Kerala*,Thiruvananthapuram.
Jeffrey, R. 1992 "Politics, Women and Well-Being*: How Kerala Became AModel', Macmillan, London.
Kabir,M and KrishnanJ, 1992, "Social Interme-diation and Health Transition- LessonsFrom Kerala*,Centre For DevelopmentStudies, Thiruvananthapuram.
Kannan, K.P, 1988 "Of Rural ProletarianStruggles: Mobilization and Organiza-tion of Rural Workers in South-WestAsia", Oxford University Press, Delhi.

Kannan, t P , et al, 1991, "Health and Deveiop-neot in Rural Kenlt*, Kerala SastiaSahityaParisnad,Thiruvananths
Mean, Rekh* and Sandauoni, K, 1983,find Burn! lftan>fornnttiflfi'
Kannan, K.P, 1996, Tublic Intervention andPoverty Alleviation: AStudyoftheDeclining Inddence of Rural Povertyin Kerala, India." Development andChange, (forthcoming).
Koya, Mohammed, 1983, "Mappila of Malabar-
Krishna Iyer, L A 1968, "Social History ofKerala, Volume II - Hie Dravidians',Book Centre, Madras.
Krishnaji, N and Krishnan, I N , 1994, fertilityVariations Among Districts -1981:Some Preliminary Notes." DiscussionPaper Series, Number Nine in thestudies on Human Development inIndia. A report prepared for theProject of The United Nations Develop-ment Programme.
Two Studies', Vina Mazumdar,Concept Publishing Co., New Delhi
Mender, JoanJ; 1975, "Changing FamilialBoles Among South Malabar Nayars*,South Western Journal of Anthropol-ogy, Soc 120, T-18.
Mukheriee,C k Isaac,T,1994, "EmploymentSituation in the Agricultural Sector ofKerala, Problems and Prospects*International Congress on KeralaStudies, Abstract, A.K.G, Centre forResearch and Studies,
MurickanyS J, 1994, "Jesuit Contribution to theCulture and Language of Kerala,*International Congress on KeralaStudies, Abstract, V.3, pp 51-2, A.K.G.Centre For Research and Studies,
Krishnan, T.N, 1994, "Access and the Burden ofTreatment: An Inter-State Compari-son.* Discussion Paper Series,Number Two in the Studies on HumanDevelopment in India. A reportpresented for the Project of the UnitedNations Development Programme.
Le Mercinier, Geneviene and Houtart, Francois,1974; "Church and Development inKerala: Analysis of the developmentalactivities of the Roman CatholicChurch', Cochin Pastoral OrientationCentre, Mimeo.
Le Mercenier, Geneviene, 1983; "Religion andIdeology in Kerala', Centre-do-Rechevches Socio-Religious, UniversiteCatholique de Louvain. Louvain-la-Neuve.
Madhavi, Ravindaranath, 1994, "An Analysis ofMedia Reaction to Social ReformLegislation vis-a-vis its effects onWomen" International Congress onKerala Studies, Abstracts, Vol 3,A.K.G, Centre For Research Studies,Thiruvananthapuram.
Thiruvananthapuran,
NairJLS, Ramachandran, 1994, "Consequencesof Social Changes in Travancore',International Congress on KeralaStudies, Abstract, V.I, A.K.G CentreFor Research and Studies,Thiruvananthapuram.
Nakane, Chie, 1962, "The Nayar Family in thedisintegrating Matrilineal System*,International Journal of ComparativeSociology, 3(1): 17-28.
Namboodiripad, E.M.S., 1995, "Perspective ofthe Women's Movement*, SocialScientist, pp.40-41 (Nov-Dec, 1995).
NamboodiripadJCD, 1994 "Water ResourcesScenario of Kerala* - InternationalCongress on Kerala Studies, Abstract,Vol 4, A.K.G Centre For Research andStudies, Thiruvananthapuram.
Panickar, P JK & Soman,C.R, 1984, "Status ofWomen and Children in Kerala* -Report of a Benchmark survey in fiveselected districts, Centre For Develop-ment Studies, Thiruvananthapuram.

PanJkkar3.il, 1918, "Some Asptdi of NayarLife", Journal of the Royal AntfcrapologialInstitute, 48 : pp254-293.
Paraumeswaran. P, 1971, "The Prophet ofReformation", NavodhanthintePrevachakan, Shri. Narayana GuruSwamikal*, pp. 11-12, JayabarathPublication, Calient
Pushpangadan, Murugan and Navaneethan,1995, "Status Report on Rural WaterSupply in Kerala State*, Centre ForDevelopment Studies,Thiruvananthapuram.
Qaisar, A. Jan. 1968, The Breast-Goth Contro-versy", The Indian Economic andSocial History Review, Vol 2, pp. 174-180.
Registrar General of India, 1994. "SampleRegistration Bulletins', Annual, 1992 •Government of India, New Delhi.
Saradamoni, K, 1983, 'Women and RuralTransformations: Two studies" Ed byVina Mazumdar, Part II-*ChangingLand Relations and Women", ConceptPublishing, New Delhi
Sarvekshana, January-March, 1992, NationalSample Survey Organisation, Depart-ment of Statistics, Ministry of Plan-ning, Government of India, New Delhi.
Sarvekshana, April-June, 1992, National SampleSurvey Organisation, Department ofStatistics, Ministry of Planning,Government of India, New Delhi.
Sarvekshana, July-September, 1990, NationalSample Survey Organisation, Depart-ment of Statistics, Ministry of Plan-ning, Government of India, New Delhi.
Sarvekshana, April-June, 1993, National SampleSurvey Organisation, Department ofStatistics, Ministry of Planning,Government of India, New Delhi.
Sooryamoothy, R, 1991, "Changing ConsumptionPattern in Kerala.* Loyola Journal ofSocial Science, 5(29), pp.146-156. YuvaDeepti Press Tbiruvananthapuram.
Sreedhara Meoon, A, 1967, 'A Survey of KeralaHistory.'National Book Stall,Kottayam.
State Planning Board, Government of Kerala,"Economic Review*, 1988, Government
State Planning Board, Government of Kerala,"Economic Review", 1992, GovernmentPress, Thiruvananthapuram.
State Planning Board, Government of Kerala,"Economic Review", 1994, GovernmentPress, Thiruvananthapuram.
State Planning Board, Government of Kerala,"Economic Review*. 1993, GovernmentPress, Thiruvananthapuram.
Hiaramangalain, Joseph and TTiaramangalain,Elzy, 1994: "Capitalism and Patriar-chy : The Transformation of theMathlineal System of Kerala,"International Congress on KeralaStudies, Abstracts. V3, AKG CentreFor Research and Studies,'nuruvananthapuram.
Travancore Educational Reforms Committee",1933, 'Report*, Government Press,Trivandrum.
Travancore, "Unemployment Enquiry Commit-tee", (Chairman. Smith) 1948, 'Report1948", Government Press, Emakulam.
United Nations, Department of Economic andSocial Affairs, 1975, "Poverty, Unem-ployment and Development Policy: ACase Study of Selected Issues withReference to Kerala", United Nations,New York, (ST/ESA/29).
Varghese, Sheela, 1994, "Economic ActivityPattern of Women in Female HeadedHouseholds of Kerala*, InternationalCongress on Kerala Studies,A.KG.Centre For Research andStudies, Thiruvananthapuram.
Varma, Ajayakumar, 1994, "Ground WaterOccurrence in the Laterite Formationof Kerala", Some Typical Problems,International Congress on KeralaStudies, Abstracts, Vbl 4, A.K.G CentreFor Research and Studies,Thiruvananthapuram.

0&
VeUyudhan, Mem, 1994,-Cootending TnA-tions: The Soriil Construction ofGetriermTravuicore,''InternationalCoogreH oo Kerala Studies, Abstracts.V.3, pp, 167-68, AKG Centre ForResearch and Studies,Tfeiroananthaptiiia.
Visaria, Pravin and Jacob, Paul, 1995, WarnLeveh, Health Can Utilization andExpenditures and Poor States ofAndra Pradesh, Kerala, MadhyaPradesh ft Punjab, 1986-87. Pre-sented at The Workshop on MorbidityMeasurement and Health ResearchThiruvananthapurain, Kerala. AUNDP Research Project on "Strategiesand Financing for Human Develop-ment conducted at the Centre ForDevelopment Studies,Thiruvao&nth&puranL
Woodcock, George, 1967, "Kerala: A Portrait ofthe Malabar Coast*, Faber and Faber,London.
Zacharia, K.C. eta], 1994, DemographicTransition in Kerala in the 1980*s,Centre For Development Studies,Thiruvananthapunun.
fm
mf
i