keeping score: kpis and metrics to measure and manage contractor wc claim programs joe picone, claim...
TRANSCRIPT
Keeping Score: KPIs and Metrics to Measure and Manage Contractor WC Claim ProgramsJoe Picone, Claim Consulting Practice Leader
Jeff Seibert, National Director Casualty Claims
September 17th 2014

Famous Football QuotesQuote
1. “Winning isn’t everything, but it beats anything that comes in second.”
2. “Winning isn’t everything, it’s the only thing”
3. “When I played pro football, I never set out to hurt anyone deliberately - unless it was, you know, important, like a league game or something.”
4. “Success is not forever and failure isn't fatal.”
5. “The road to Easy Street goes through the sewer.”
6. “When we get fancy we get beat.”
Who said it?
A. Don Shula
B. John Madden
C. Paul “Bear” Bryant
D. Vince Lombardi
E. Woody Hayes
F. Dick Butkus
2

3

4

Lombardi on Winning“If you’re not keeping score, you’re
practicing.”“Once you have established the goals
you want and the price you’re willing to pay, you can ignore the minor hurts.”
“…we will all be judged on one thing: the result.”
5
Overview
6
Metrics & KPIsProcess of Establishing Metrics and
KPIsPrimary MetricsSecondary MetricsKey Lagging/Current/Leading IndicatorsEstablishing Metrics for the ContractorPitfallsTakeaways
7
Metrics: A method of measuring somethingKey performance indicator (KPI) is a type of
performance measurement/metric:· To evaluate performance of particular
process· Rely upon a good understanding of what
is important to the organization · Depends on the department measuring
the performance
Metrics & Key Performance Indicators
8
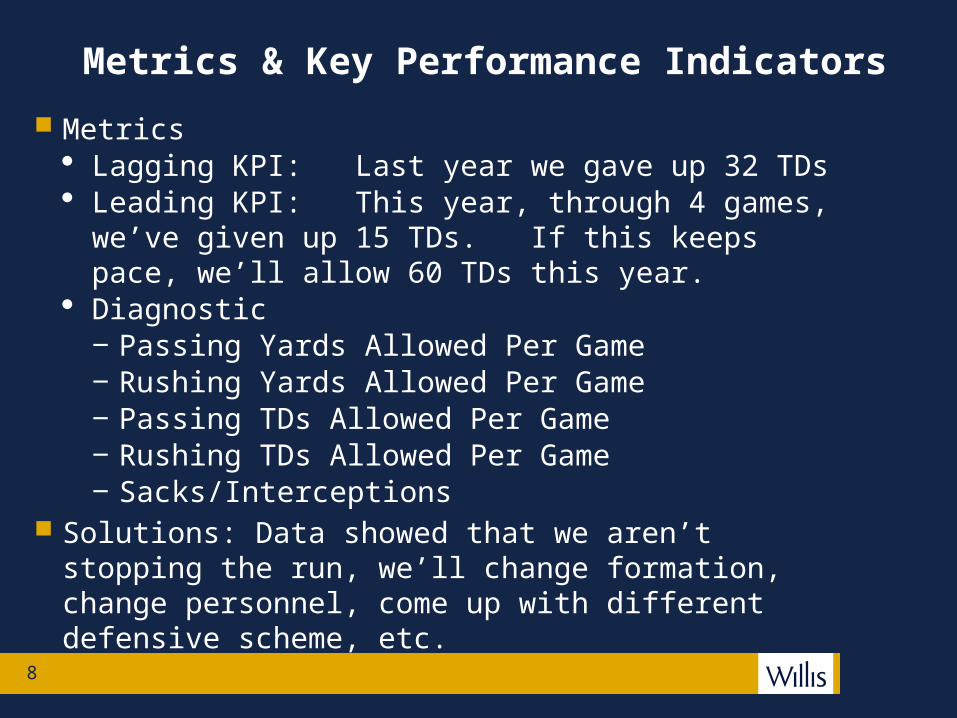
Metrics· Lagging KPI: Last year we gave up 32 TDs· Leading KPI: This year, through 4 games, we’ve given up
15 TDs. If this keeps pace, we’ll allow 60 TDs this year.· Diagnostic
‒ Passing Yards Allowed Per Game‒ Rushing Yards Allowed Per Game‒ Passing TDs Allowed Per Game‒ Rushing TDs Allowed Per Game‒ Sacks/Interceptions
Solutions: Data showed that we aren’t stopping the run, we’ll change formation, change personnel, come up with different defensive scheme, etc.
Metrics & Key Performance Indicators
9
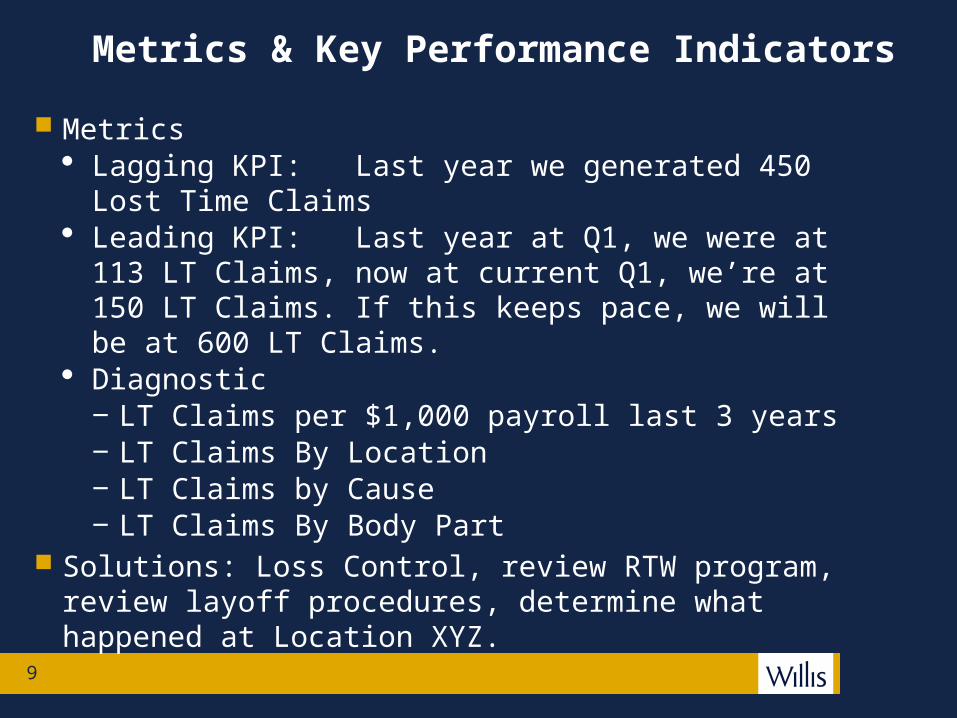
Metrics· Lagging KPI: Last year we generated 450 Lost Time
Claims· Leading KPI: Last year at Q1, we were at 113 LT Claims,
now at current Q1, we’re at 150 LT Claims. If this keeps pace, we will be at 600 LT Claims.
· Diagnostic‒ LT Claims per $1,000 payroll last 3 years‒ LT Claims By Location‒ LT Claims by Cause‒ LT Claims By Body Part
Solutions: Loss Control, review RTW program, review layoff procedures, determine what happened at Location XYZ.
Metrics & Key Performance Indicators
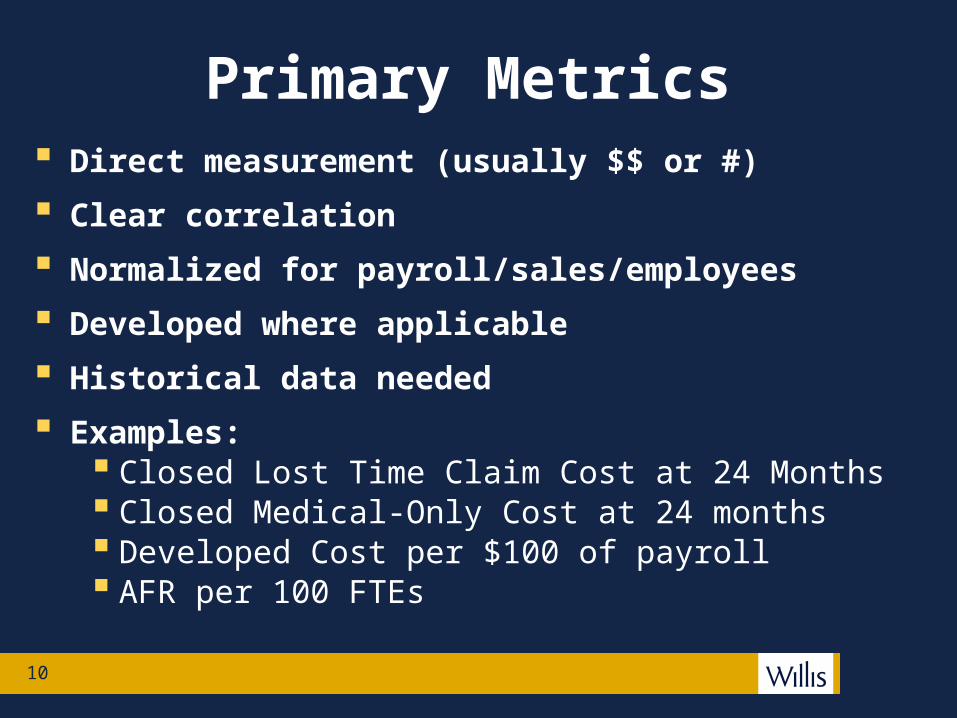
Primary Metrics Direct measurement (usually $$ or #)
Clear correlation
Normalized for payroll/sales/employees
Developed where applicable
Historical data needed
Examples: Closed Lost Time Claim Cost at 24 Months Closed Medical-Only Cost at 24 months Developed Cost per $100 of payroll AFR per 100 FTEs
10
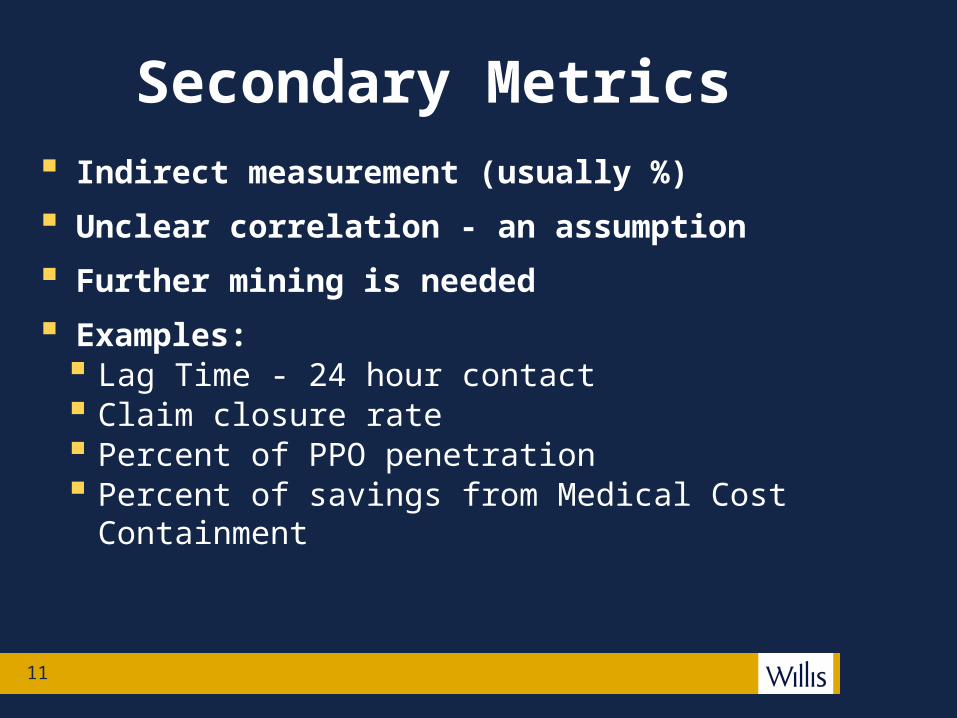
Secondary Metrics Indirect measurement (usually %)
Unclear correlation - an assumption
Further mining is needed
Examples: Lag Time - 24 hour contact Claim closure rate Percent of PPO penetration Percent of savings from Medical Cost Containment
11
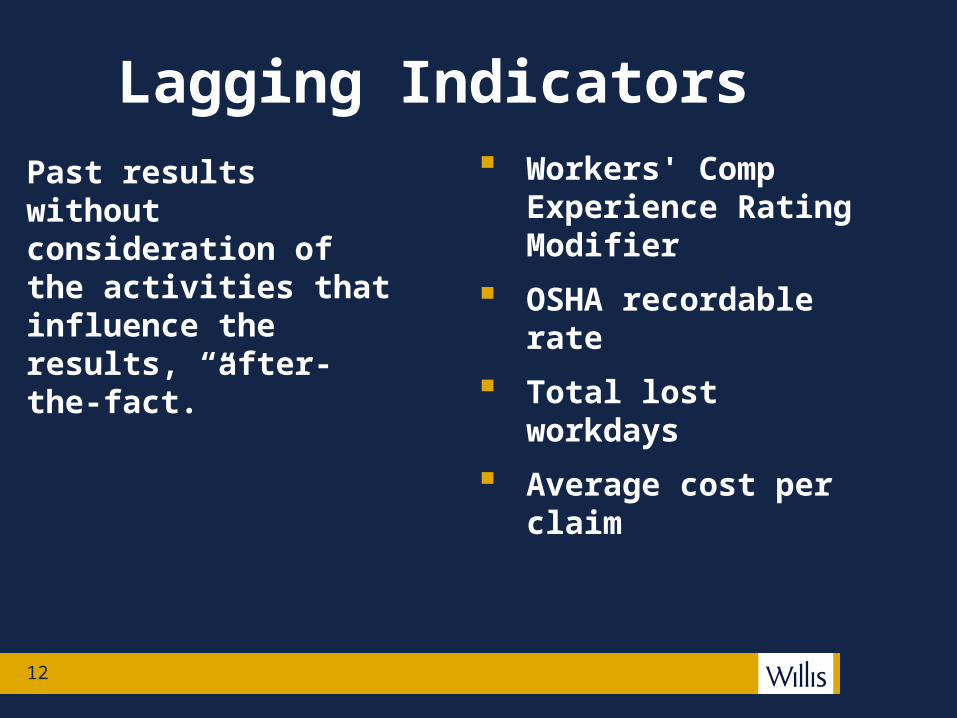
Lagging IndicatorsPast results without consideration of the activities that influence the results, “after-the-fact.”
Workers' Comp Experience Rating Modifier
OSHA recordable rate
Total lost workdays
Average cost per claim
12
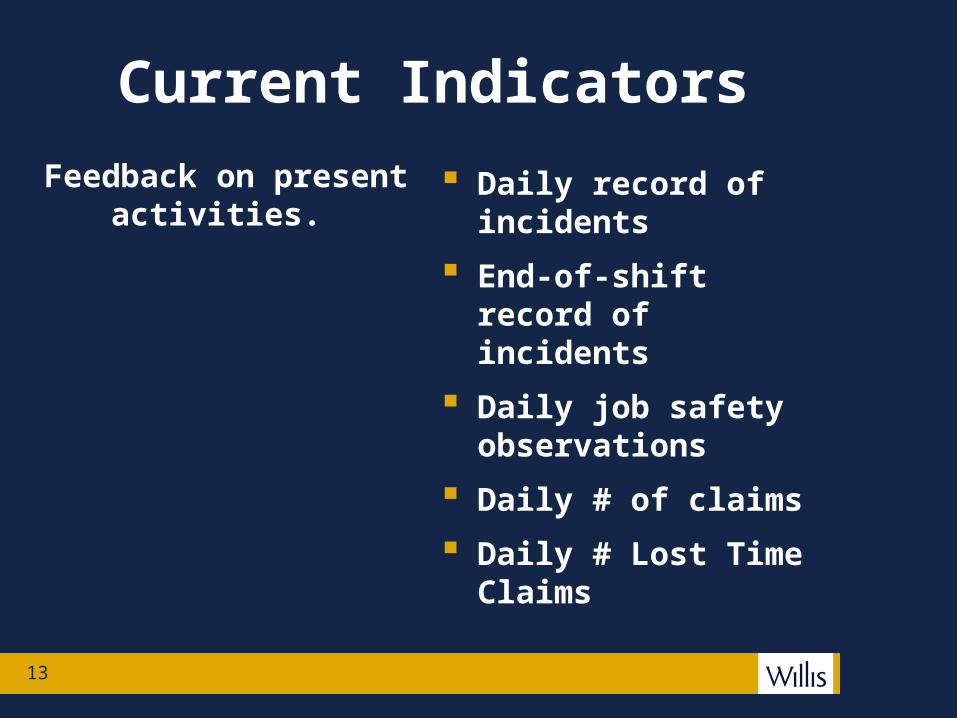
Current IndicatorsFeedback on present
activities. Daily record of
incidents
End-of-shift record of incidents
Daily job safety observations
Daily # of claims
Daily # Lost Time Claims
13
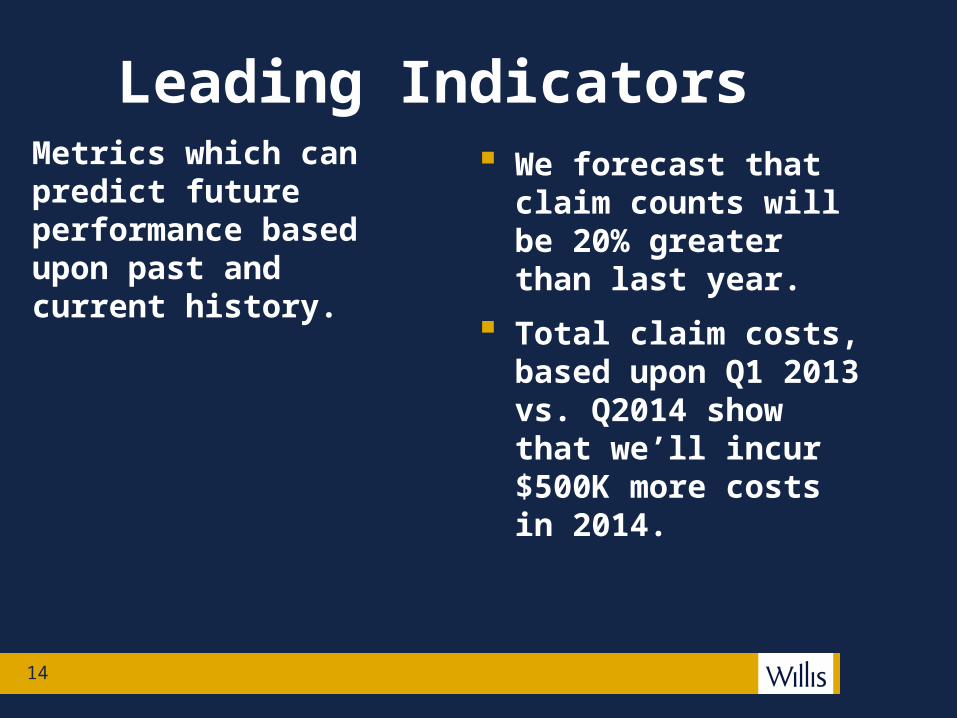
Leading IndicatorsMetrics which can predict future performance based upon past and current history.
We forecast that claim counts will be 20% greater than last year.
Total claim costs, based upon Q1 2013 vs. Q2014 show that we’ll incur $500K more costs in 2014.
14
15
Benefits of Establishing the Correct KPIs/Metrics
Better outcomes when combined with solutions
Balance sheet protectionSupports the continuous
improvement modelKPIs/Metrics + “0” Change
in Process = “0” Change in Results
16
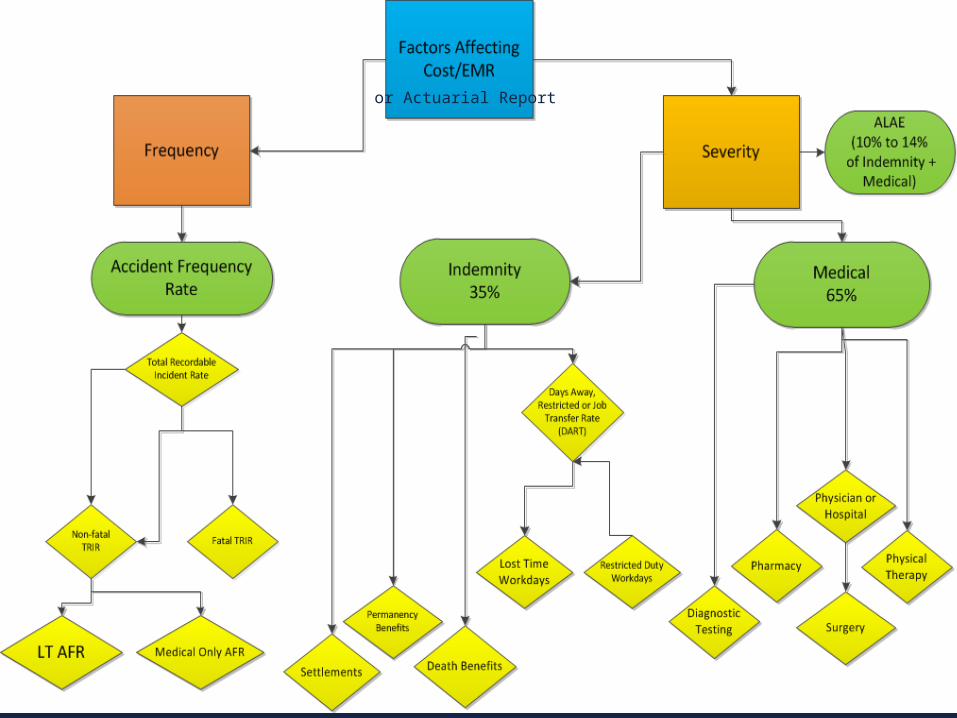
Factors To Consider When Setting KPIs/Metrics
What?Why?How will it benefit me?Who?How difficult is it to accomplish?Is the data valid?
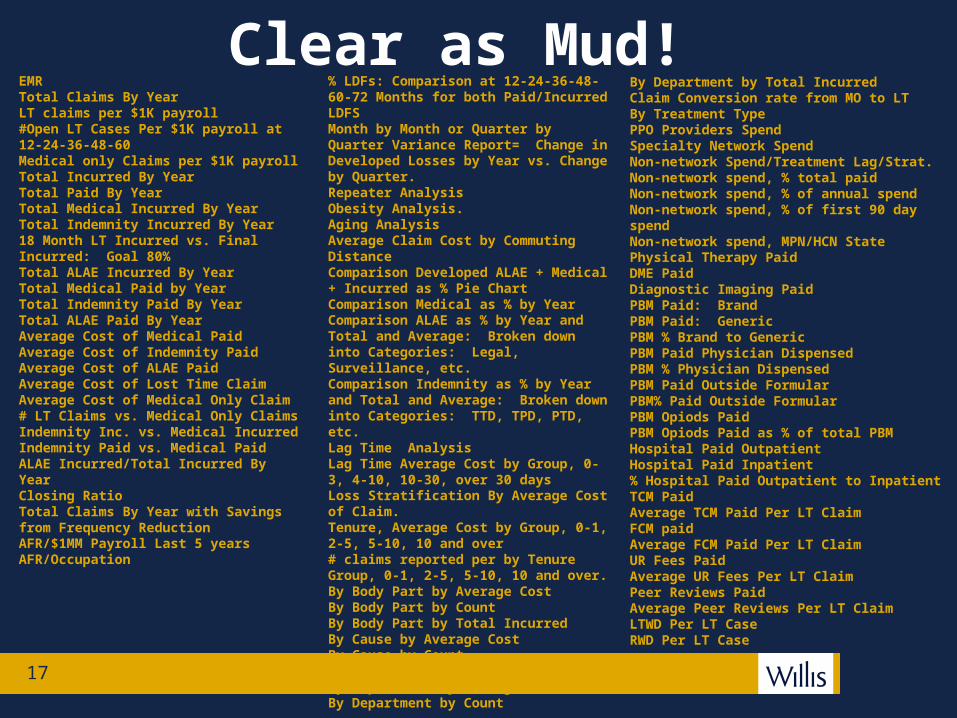
EMRTotal Claims By YearLT claims per $1K payroll#Open LT Cases Per $1K payroll at 12-24-36-48-60Medical only Claims per $1K payrollTotal Incurred By YearTotal Paid By YearTotal Medical Incurred By YearTotal Indemnity Incurred By Year18 Month LT Incurred vs. Final Incurred: Goal 80%Total ALAE Incurred By YearTotal Medical Paid by YearTotal Indemnity Paid By YearTotal ALAE Paid By YearAverage Cost of Medical PaidAverage Cost of Indemnity PaidAverage Cost of ALAE PaidAverage Cost of Lost Time ClaimAverage Cost of Medical Only Claim# LT Claims vs. Medical Only ClaimsIndemnity Inc. vs. Medical IncurredIndemnity Paid vs. Medical PaidALAE Incurred/Total Incurred By Year Closing Ratio Total Claims By Year with Savings from Frequency ReductionAFR/$1MM Payroll Last 5 yearsAFR/Occupation
By Department by Total IncurredClaim Conversion rate from MO to LTBy Treatment TypePPO Providers SpendSpecialty Network SpendNon-network Spend/Treatment Lag/Strat.Non-network spend, % total paidNon-network spend, % of annual spendNon-network spend, % of first 90 day spendNon-network spend, MPN/HCN StatePhysical Therapy PaidDME PaidDiagnostic Imaging PaidPBM Paid: BrandPBM Paid: GenericPBM % Brand to GenericPBM Paid Physician DispensedPBM % Physician DispensedPBM Paid Outside FormularPBM% Paid Outside FormularPBM Opiods PaidPBM Opiods Paid as % of total PBMHospital Paid OutpatientHospital Paid Inpatient% Hospital Paid Outpatient to InpatientTCM Paid Average TCM Paid Per LT ClaimFCM paidAverage FCM Paid Per LT ClaimUR Fees PaidAverage UR Fees Per LT ClaimPeer Reviews PaidAverage Peer Reviews Per LT ClaimLTWD Per LT CaseRWD Per LT Case
17
% LDFs: Comparison at 12-24-36-48-60-72 Months for both Paid/Incurred LDFSMonth by Month or Quarter by Quarter Variance Report= Change in Developed Losses by Year vs. Change by Quarter.Repeater AnalysisObesity Analysis.Aging AnalysisAverage Claim Cost by Commuting DistanceComparison Developed ALAE + Medical + Incurred as % Pie Chart Comparison Medical as % by Year Comparison ALAE as % by Year and Total and Average: Broken down into Categories: Legal, Surveillance, etc.Comparison Indemnity as % by Year and Total and Average: Broken down into Categories: TTD, TPD, PTD, etc.Lag Time AnalysisLag Time Average Cost by Group, 0-3, 4-10, 10-30, over 30 daysLoss Stratification By Average Cost of Claim.Tenure, Average Cost by Group, 0-1, 2-5, 5-10, 10 and over# claims reported per by Tenure Group, 0-1, 2-5, 5-10, 10 and over.By Body Part by Average CostBy Body Part by CountBy Body Part by Total IncurredBy Cause by Average CostBy Cause by CountBy Cause by Total IncurredBy Department by Average CostBy Department by Count
Clear as Mud!

Measure what’s important!
18
19
or Actuarial Report
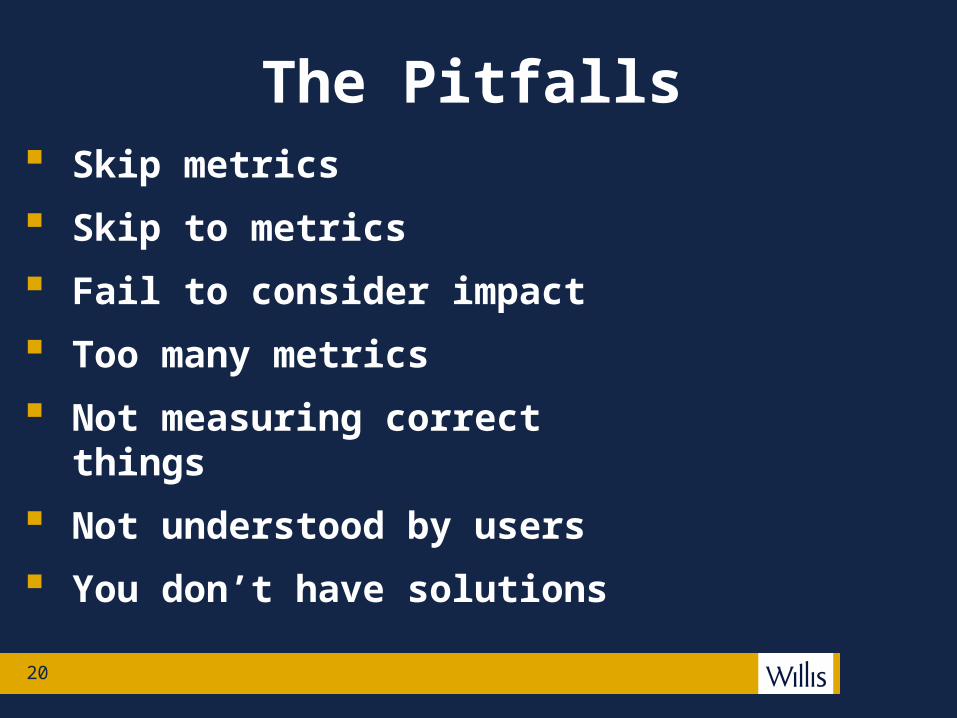
The Pitfalls Skip metrics
Skip to metrics
Fail to consider impact
Too many metrics
Not measuring correct things
Not understood by users
You don’t have solutions
20
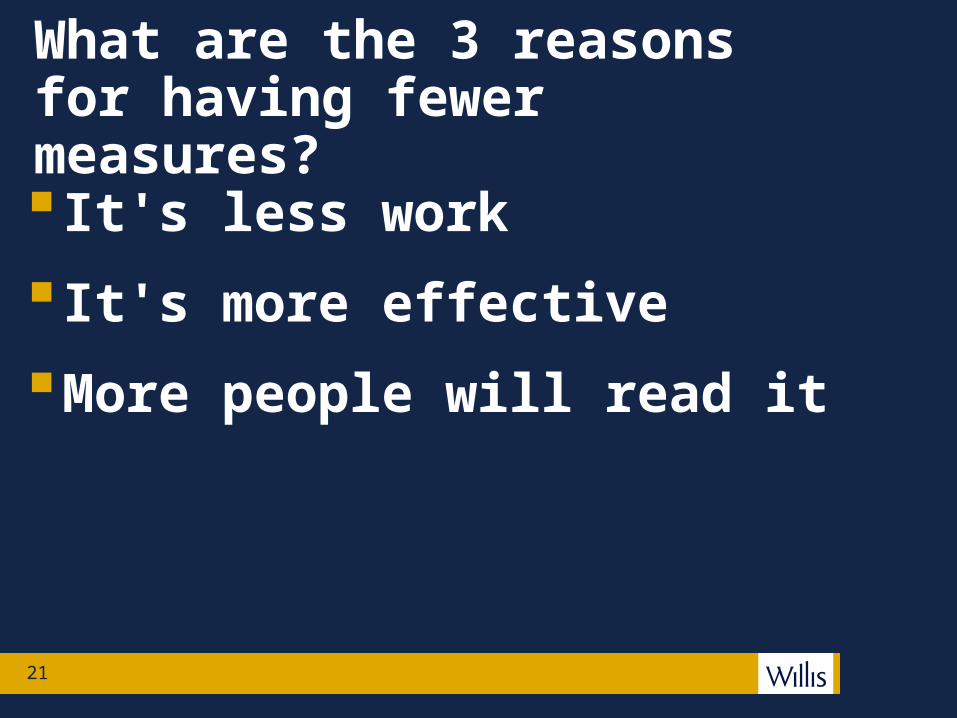
What are the 3 reasons for having fewer measures?
It's less work
It's more effective
More people will read it
21
The game is a week away, what can you do tomorrow to get ready?
What results is team producing in the past, today?
What’s the line…what does the leading KPIs look like?
What’s important based on a review of all the data?
What’s not important based on a review of the data?
What solutions will you implement, what’s your plan?
When are you going to debrief on the game?
22

23

QUESTIONS?
24