kansas city–genuinely world class: a competitive analysis
TRANSCRIPT

E S S A Y
ADVANCING LIBERTY WITH RESPONSIBILITYBY PROMOTING MARKET SOLUTIONS
FOR MISSOURI PUBLIC POLICY
EXECUTIVE SUMMARY
This report examines the competitive position of the Kansas City metropolitan area relative to other major metropolitan areas in the United States. The fundamental conclusion is that Kansas City ranks better than metropolitan areas commonly rated as the best in the world in housing affordability, traffic congestion, and productivity.
The perspective of the report is that the Kansas City metropolitan area
can experience greater economic growth that would lead to a better standard of living and reduce poverty. Kansas City can become a better place for its residents and attract new residents and businesses. In fact, with respect to two characteristics of greatest interest to typical households, housing affordability and mobility (travel times and lower levels of traffic congestion), Kansas City performs better than cities that are considered the most livable in the world.
November 2016
KANSAS CITY–Genuinely World Class:
A Competitive AnalysisBy Wendell Cox

SHOW-ME INSTITUTE I ESSAY
2
Kansas City in Context
Kansas City is the 29th-largest metropolitan area in the United States, with nearly 2.1 million residents. Approximately 23 percent of the population is in the historical core municipality of Kansas City, Missouri, while 42 percent live in the Kansas suburbs and 36 percent live in the Missouri suburbs.
The Kansas City metropolitan area is overwhelmingly suburban, which is typical of U.S. metropolitan areas. Only 11 percent of the area’s population lives in parts of the metropolitan area that reflect pre–World War II population densities and travel patterns.
In Kansas City, as has been typical throughout the high-income world, nearly all population growth since World War II has been suburban. The Kansas City metropolitan area has grown more than 100 percent since 1950, though only one percent of that growth was in the city limits of Kansas City, Missouri. All growth in Kansas City, Missouri, has been in areas that are functionally suburban.
This is unlikely to change; population projections indicate that suburban areas are likely to attract the overwhelming majority of future population growth. Likewise, most employment growth has been outside the city of Kansas City and projections indicate a continuation of this trend.
Competitive Analysis
Kansas City has considerable advantages.
The cost of living in the Kansas City metropolitan area is lower than average; this is attributed to Kansas City’s superior housing affordability. Cost-of-living differences between U.S. metropolitan areas are largely a function of differences in housing affordability.
Housing affordability tends to be better in metropolitan areas that are liberally (less restrictively) regulated, rather than those with strong land-use regulations, such as urban containment policy. Further, academic research has associated substantial economic losses with strong land use regulation. A strong trend in domestic migration away from less affordable metropolitan areas has also been identified.
With its liberal land-use regulation, Kansas City has retained its housing affordability even as similar-sized metropolitan areas such as Portland and Denver have experienced serious housing affordability losses. Migration between metropolitan areas is strongly influenced by housing affordability.
Better travel times in metropolitan areas have been associated with higher levels of economic growth.
Kansas City has a superior urban transportation system. Kansas City is rated as the least-congested metropolitan area overall in the world. Its average work trip travel times are among the shortest in the United States. Like most major metropolitan areas in the United States, Kansas City relies overwhelmingly on automobiles, and transit plays a relatively minor role. Kansas City’s success in transportation is the result of an effective freeway system, a quality arterial street system, low population density, and dispersion of employment.
Kansas City is also one of the most important freight transport and logistics centers in the United States.
Kansas City is served by interstate highways from six directions and by all four of the nation’s largest railroads. It is home to two large truck–rail logistics centers and an air freight logistics center.
KEY ADVANTAGES FOR KANSAS CITY
• Housing affordability: This is the primary driver of cost-of-living differences across the United States. Consequently, it also influences migration between metro areas.
• Liberal land-use policies: Less-restrictive land-use regulations are associated with more affordable housing.
• Mobility: Kansas City’s combination of low population density, dispersion of employment, and well-maintained roads and freeways result in commuting times that are among the shortest in the United States.

November 2016
3
Kansas City is also “livable.” Its housing affordability and the ease of travel throughout the metropolitan area provide a high quality of life for residents. Indeed, Kansas City rates better than each of The Economist’s Top 10 metropolitan areas in the world in housing affordability and traffic congestion, and better than all but seven in productivity. Kansas City is also rated as a “family-friendly” metropolitan area.
Perhaps Kansas City’s biggest disadvantage is its climate, which is not as attractive as in some other parts of the country. However, as land-use regulation has been strengthened and business environments have deteriorated in a number of metropolitan areas with better climates, Kansas City’s competitive position has improved.
Despite its slow population growth in recent decades, the city of Kansas City, Missouri, may be poised for important growth. Population projections suggest that the suburban areas of the city will add considerable population over the next 30 years. Accomplishing this will require retention of the area’s land use policies that allow housing to be developed that is attractive to households.
Competitive Assessment
Kansas City’s strongest advantages are its low cost of living (the result of superior housing affordability), superior mobility, and a complete array of lifestyle choices. Kansas City’s lower cost of living makes a high standard of living possible and leads to less poverty. Kansas City’s greater mobility can be expected to result in greater economic growth and more leisure time for residents. For middle-income households, Kansas City is genuinely world-class. The key challenge for Kansas City will be to retain its strongest advantages as it seeks economic and population growth. These advantages are, principally, its superior housing affordability and mobility, both of which contribute to its low cost of living. Kansas City has a unique opportunity to set itself apart for growth from competitor metropolitan areas that are implementing policies that make housing less affordable for middle-income households and make it more difficult to get around. It will be important for the Kansas City metropolitan area to continue policies that permit environmentally sensitive and inexpensive housing development and make sufficient improvements to the roadway system to preserve or improve mobility.
1. INTRODUCTION
The United States has suffered the most significant economic downturn since the Great Depression, and a number of metropolitan areas, including Kansas City, have experienced minimal economic growth in its aftermath. This is not surprising, since the nation’s economic progress has failed to reach its previous growth levels.
This report analyzes the competitive position of the Kansas City metropolitan area in the context of other metropolitan areas. Metropolitan areas are the functional or economic dimension of cities and will be the principal focus of this analysis.1 They are labor markets as defined by the United States Office of Management and the Budget. Labor markets are the standard unit for delineating metropolitan areas both in the United States and in the world.2
There will also be a focus on the city of Kansas City, Missouri, which is the historical core municipality. The economic and social futures of Kansas City, Missouri, and the Kansas City metropolitan area are intertwined. The best results will be achieved if all of the constituent parts of the metropolitan area perform as closely as possible to their potential.
An improved future requires public policies that serve the fundamental objectives:
Improving economic growth: The metropolitan area should achieve strong economic growth that is broadly based.
Improving the standard of living and reducing poverty: Gross household incomes should increase at a rate faster than that of gross household expenditures, so that there are higher discretionary incomes and lower rates of poverty. Discretionary income (if any) is the amount left over after paying taxes and buying necessities, such as housing, food, clothing, and transportation. The amount of discretionary income (including below zero) literally defines the standard of living and poverty in the context of the cost of living.3 It is thus important to maintain a low (competitive) cost of living while seeking to increase the gross income of households in the area.

SHOW-ME INSTITUTE I ESSAY
4
The Kansas City area must attract net new residents from other parts of the country while generating net new employment. This requires that existing businesses grow larger, that new businesses are established, and that businesses move to the area from elsewhere.
2. KANSAS CITY IN CONTEXT
For the purposes of this report, two definitions of Kansas City will be important: the Kansas City metropolitan area (referred to as “Kansas City”—see Map 1) and the core municipality of Kansas City, Missouri (referred to as the “city of Kansas City”—see Map 2).
Central cities (municipalities), such as the city of Kansas City, Missouri, have been the historical cores of
metropolitan areas. These municipalities typically contain the largest employment center in the metropolitan area, the downtown area (central business district). Through the years, core municipalities have become less dominant as residences and employment have spread to the suburbs.
Population
Kansas City Metropolitan Area The Kansas City metropolitan area had approximately 2,070,000 residents in 2014, making it the 29th-largest metropolitan area in the United States.4 In 1950, Kansas
Map 2:
Kansas City, Missouri: Annexation History, 1853-2013
Source: City Planning & Development Department Kansas City , Missouri.
KANSAS CITY
Map 1: Kansas City Metropolitan Area
Source: Adapted from 2010 United States Census Bureau

November 2016
5
City was the 19th-largest metropolitan area in the United States.5 Since that time, while the Kansas City metropolitan area has added approximately 106 percent to its population, it has not kept pace with growth in other U.S. cities.
As has been the case throughout the United States, as well as Western Europe, Japan, and Canada, most of the population growth since 1950 has been outside the core municipality (in this case Kansas City, Missouri) and in the suburbs (Figure 1). From 1950 to 2014, the Missouri suburbs grew 204 percent and the Kansas suburbs grew 185 percent. The city of Kansas City added only three percent to its population, despite massive annexations. Indeed, all growth in Kansas City, Missouri, has been functionally suburban.
In 2014, approximately 23 percent of the population was in the city of Kansas City, 36 percent was in the balance of Missouri, and 41 percent was in Kansas (Figure 2).
City of Kansas City The city of Kansas City had approximately 470,000 residents in 2014 and ranked as the 37th-largest municipality in the United States. This is little more
Figure 1: Population by Sector 1950–2010 (Kansas City Metropolitain Area)
1950 1960 1970 1980 1990 2000 2010
900,000800,000700,000600,000500,000400,000300,000200,000100,000
0
Kansas City (MO)Missouri Suburbs
Kansas Suburbs
Source: U.S. Census Bureau data.
Kansas City22.7%
MissouriSuburbs
35.9%
KansasSuburbs
41.3%
Source: U.S. Census Bureau estimates.
Figure 2: Kansas City Population by Area

SHOW-ME INSTITUTE I ESSAY
6
than the 457,000 residents it had in 1950, when Kansas City was the 20th-largest municipality in the United States. Most surprisingly, however, this small population increase occurred as the city was annexing greenfield (undeveloped) land area totaling three times the size of the 1950 municipal boundaries (refer to Figure 2 and map 2). The city’s land area expanded from approximately 80 square miles to 320 square miles between 1950 and 2014. As a result, the city’s population density dropped from 5,700 per square mile to 1,500 per square mile.6 The dispersion of population has been so great that the density of urbanization7 within the city is slightly lower than that of the suburbs.8
But these data mask a huge population decline in the core of the city. The 1950 boundaries of the city (see Map 2) had a population of less than 225,000 in 2010, indicating a loss of more than half the population.9 This means that all of Kansas City, Missouri’s population growth was in functionally post-war suburban areas, dominated by automobiles and lower-density housing.
This is not atypical for urban cores, and may be best illustrated by the city of St. Louis, which did not annex territory between 1950 and 2010 and experienced a population loss from 857,000 to 319,000. The St. Louis loss was the largest for any large municipality in the high-income world over that period. All of the larger U.S. core cities that did not annex between 1950 and 1990 experienced population declines.10
Domestic Migration Kansas City has attracted domestic migrants from other parts of the United States since 2000, though there has been a decline in recent years. Between 2000 and 2014, the Kansas City metropolitan area attracted approximately 30,000 domestic migrants. By comparison, Los Angeles, long one of the nation’s fastest growing metropolitan areas, lost 1,500,000 net domestic migrants (See Section 3.12).11
Urban Form The Kansas City metropolitan area encompasses the Kansas City urban area,12 which is the area of continuous
Figure 3: Population Growth in the Kansas City Metropolitain Area by Sector
Source: City Sector Model (U.S. Census Bureau data and ACS 2010–2014 data).
0.45
0.40
0.35
0.30
0.25
0.20
0.15
0.10
0.05
0.00Urban Core:
CBDUrban Core: Ring Early Suburb Later Suburb Exurb
Small Areas (Zip Code Tabulation Zones)
Mill
ions
2012 (ACS 2010−2014)
2000
0.1% 0.2%
6.4% 5.1%
42.1%
37.6%
22.1%
26.7%29.3% 30.5%

November 2016
7
development (“built up area”). The urban area population density is 2,200 per square mile, somewhat below the U.S. urban area average of 2,500. By comparison, Los Angeles is the most dense urban area, at 7,000 per square mile. Kansas City’s density is slightly above that of Boston and approximately one-third greater than Atlanta and Charlotte.13
Like most major U.S. metropolitan areas, Kansas City is overwhelmingly suburban. This is confirmed at the small-area level by the “Demographia City Sector Model,” which classifies zip codes based on population density and transit use (see Table 1 in the Appendix).14 The extent of the suburbanization is illustrated by, which shows that nearly 90 percent of the Kansas City metropolitan area is composed of post-war, automobile-oriented suburbs. By comparison, only 11 percent of the population lives in parts of the metropolitan area that match pre-World War II population densities and transit use.
Moreover, there was a population loss in the urban core between 2000 and 2012. The modest gain in the inner core (central business district) was more than offset by a loss in the urban core ring. All of the population growth was in suburban and exurban areas (Figure 3). It has been typical for virtually all population growth to be in suburban areas. For example, even in Portland, Oregon, with its strong densification policies that seek to discourage suburban development in favor of core development, more than 97 percent of the 2000 to 2012 population growth was outside the urban core.15
The latest census estimates indicate that movement from the core to the suburbs continues. Between 2010 and 2014 Jackson County lost a net 9,100 domestic migrants to areas elsewhere in the country. The suburban counties of Missouri (including those with portions in the Kansas City limits) gained 3,500 net domestic migrants. The Jackson County loss, however, more than offset this, as the Missouri portion of the metropolitan area lost a net 5,600 domestic migrants. The historical core of the Kansas side (Kansas City/Wyandotte County) of the metropolitan area also lost net domestic migrants (3,700). Wyandotte County's domestic migration loss was more than canceled out by gains in the other Kansas Counties. Overall, the Kansas suburbs gained 3,700 domestic migrants. Johnson County had by far the
largest net domestic migration gain, at 7,700. Despite the growth in Kansas, between 2010 and 2014 there was an overall net domestic migration loss in the metropolitan area of 1,900.16
Projected Population According to the Mid-America Regional Council, population growth will continue to be concentrated in the suburban counties.17 Between 2010 and 2040, it is projected that approximately 45 percent of the population growth will be in Johnson County, which will make up the bulk of the 55 percent of metropolitan area growth that is projected to occur in the Kansas suburbs. The Missouri counties are projected to constitute 45 percent of the metropolitan area growth, with Cass County accounting for 18 percent and Jackson County for 11 percent (Figure 4).
Source: Calculated from Mid-America Regional Council data.
Figure 4: Population Growth Projection 2010–2040 (Mid-America Regional Council Counties)
Cass17.9%
Platte8.6%
Jackson11.4%
Johnson44.6%
Miami3.9%
Leavenworth2.5%
Wyandotte4.3%
Clay6.9%

SHOW-ME INSTITUTE I ESSAY
8
Approximately 15 percent of the eight-county population growth would be in Kansas City, Missouri. This more than 90,000 projected increase to 2040 would be a substantial turnaround. By contrast, by 1970, the city’s annexations brought the last area to within two percent of its current total. Between 1970 and 2010, the city lost nearly 50,000 residents. Nearly all of the city of Kansas City’s population growth, however, is projected to be outside the urban core, in suburban Platte and Clay counties.
Employment
Between 2000 and 2007, the peak employment year before the Great Recession, employment rose by approximately 20,000 in the Kansas City metropolitan area. Employment fell during the Great Recession but by 2014 had been restored to slightly above the 2007 level, at 975,000.
Approximately 58 percent of the Kansas City metropolitan area’s employment is in Missouri. The other 42 percent is in Kansas. Jackson County has the largest share of employment, at 36 percent. Johnson County has approximately 34 percent of the
employment. However Johnson County has been rapidly catching up with Jackson County. In 2000, there were 105,000 more jobs in Jackson County than in Johnson County. This gap had dropped to 22,000 jobs by 2014.18
All of Kansas City’s employment growth has been in Kansas since 2000. Overall, there has been an increase of 47,000 in Kansas jobs and a loss of 24,000 in Missouri jobs since 2000 (Figure 5).
Downtown Kansas City’s predominantly suburban
nature is indicated by its small share of jobs downtown (the central business district). In 2010, downtown had approximately 4.0 percent of metropolitan area jobs, approximately one-half of the average for large metropolitan areas (8.4 percent).19 Kansas City ranks 39th out of the 52 large metropolitan areas in its downtown concentration of employment. This is slightly lower than St. Louis and slightly higher than Miami.20
Projected Employment Employment projections indicate a continued move of employment out of the urban core. The Mid-America Regional Council employment projections for its eight constituent counties indicate that 60 percent of the employment growth between 2010 and 2040 will be in Kansas. Johnson County would account for 49 percent of the growth, with another nearly 10 percent of the metropolitan area growth in Wyandotte County. The Missouri counties would capture 40 percent of the eight-county employment growth, with 14 percent in Jackson County, 12 percent in Platte County, and nine percent in Clay County (Figure 6). Between 2010 and 2040, Johnson County would add 157,000 jobs, more than three times the Jackson County increase of
Figure 5: Kansas City Employment by State (2000, 2007, and 2014 )
Source: Bureau of Labor Statistics data.
1,200
1,000
800
600
400
200
02000 2007 2014
Thou
sand
s
KansasMissouri
554 543 530
398 429 445

November 2016
9
46,000. Johnson County would emerge as the strongest employment center in the metropolitan area.
Approximately 19 percent of the employment growth would be in the city of Kansas City. Of this, only five percent of the growth would be in the Jackson County portions of Kansas City, which include the urban core and downtown.21 This would indicate a continuing dispersion of employment to the suburban counties.
3. COMPETITIVE ANALYSIS
Kansas City is evaluated below on its particular strengths or weaknesses. The principal perspective is the relative attractiveness of the metropolitan area to households and to businesses. Such attractiveness is important not only to retaining population and employment, but also to attracting new residents and businesses.
3.1: Cost of Living
The Kansas City metropolitan area has a relatively low cost of living. In 2013, Kansas City’s cost of living index was 93.7, compared to the average U.S. cost of living index of 100.0.22 Kansas City has the 12th-lowest cost of living among the 53 largest metropolitan areas in 2013, and is only four percent higher than Cleveland, which has the lowest cost of living. The highest cost of living indices are in San Francisco, San Jose, and New York, all of which are approximately 30 percent higher than that of Kansas City.
As a result, incomes in Kansas City purchase more than similar incomes in most other major metropolitan areas.23 In 2013, Kansas City ranked 24th in median household income on a nominal basis (not adjusted for the cost of living). But when adjusted for the cost of living, Kansas City’s median household income ranks 16th among the 53 largest metropolitan areas (see Table 2 in the Appendix).24
As is described below (Section 3.11), the key to Kansas City's lower cost of living is its superior middle-income housing affordability.
3.11 Housing Affordability
Measuring housing affordability requires a comparison to incomes, as opposed to simple comparisons among house prices. This report examines housing affordability (1) geographically among metropolitan areas and (2) over
time within the same metropolitan areas. Price-to-income ratios are often used to measure housing affordability. A higher ratio indicates that housing is less affordable, while a lower ratio indicates that it is more affordable. This report generally measures middle-income housing affordability, using the “median multiple,” a price-to-income ratio calculated by dividing the median house price25 by the median household income.
Housing and the Cost of Living: Housing costs vary across metropolitan areas more than other household expenditure items. Indeed, the difference in the cost of living between metropolitan areas is often predominantly the result of differences in housing costs.26 For this reason, the U.S. Census Bureau publishes alternative poverty rate data that adjusts for housing cost differences. 27
Source: Calculated from Mid-America Regional Council data.
Figure 6: Employment Growth Projection 2010–2040 (Mid-America Regional Council Counties)
Clay9.1%
Platte12.4%
Jackson14.4%
Johnson48.8%
Miami3.9%
Leavenworth2.5%
Wyandotte9.7%
Cass6.9%

SHOW-ME INSTITUTE I ESSAY
10
Large differences in housing affordability are a feature of recent decades. House prices around the nation varied comparatively little in relation to incomes until the 1970s. From World War II until then, there was only limited regulation on the development of new housing. During that time, house prices in the United States tended to be in a relatively narrow range (between 2 and 3 times hosehold incomes) from the end of World War II until the early 1970s (measured by the median multiple). In the 1970s, housing affordability began to deteriorate in California and in more recent decades has deteriorated in other parts of the nation, such as in Oregon, Washington, the Northeast, and some other markets. Moreover, in some of these markets, particularly in California, Oregon, and Washington, land use regulations are becoming more restrictive, not more liberal.
Housing Affordability Losses and Land Use Policy: Losses in housing affordability have been associated with restrictive land use regulations, which were adopted in the 1970s in California and Oregon and later spread to other parts of the nation.28 A typical strategy of more restrictive land use regulations has been to severely restrict or even prohibit development on the urban fringe, through urban containment devices such as urban growth boundaries. These restrictions make it difficult if not impossible to build new housing on “greenfield” sites. A principal purpose of urban containment policy is to densify urban areas (“densification”).
Severe restrictions on urban fringe land development create a shortage of land for development. The shortage of land is associated with higher prices, just as recent decades have shown that gasoline prices routinely rise as political or other constraints on oil supply are imposed (such as by OPEC).29
The association between strong land use regulation and reduced housing affordability is described by economists Richard Green of the University of Southern California and Stephen Malpezzi of the University of Wisconsin. They describe the impact of housing regulations, including urban containment boundaries: “When the supply of any commodity is restricted, the commodity’s price rises. To the extent that land-use, building codes, housing finance, or any other type of regulation is binding, it will worsen housing affordability.”30
In recent decades, the differences in housing affordability across metropolitan areas has widened substantially. By 2015, median multiples in San Francisco, San Jose, San Diego, and Los Angeles exceeded 8.0 (they were less than 3.0 in 1970). Median multiples were over 5.0 in Riverside-San Bernardino, Boston, Portland, Denver, New York, and Miami (they were less then 3.0 in 1970).31 Each of these metropolitan areas has strict land use regulation.
The affordability data and classifications are from the Demographia International Housing Affordability Survey are indicated in Table 3 in the Appendix. The 12th Annual (2016) edition provided data for more than 350 metropolitan area markets in 9 nations, including 87 with more than 1,000,000 population.32
The experience in other nations with similar economic systems and cultures (Australia, Canada, Ireland, New Zealand, and the United Kingdom) was strikingly similar. Until the adoption of similar land-use regulations, starting with the British Town and Country Planning Act of 1947, house prices tended to be three times household incomes or less. In all of these nations, with the exception of Canada, urban containment policies have been imposed at the national level or pervasively at the sub-national level. In Canada, urban containment policy has been adopted more slowly, but strong urban containment regulatory systems are in place in Vancouver, Toronto, Montréal, and Calgary.
Strong land-use policy (generally urban containment policy) exists wherever seriously unaffordable housing has arisen (median multiple above 5.0).33 This includes the most economically depressed metropolitan areas, such as Glasgow and Liverpool in the United Kingdom and Australia’s slowest growing major metropolitan area, Adelaide.
The Kansas City area has retained a relatively low housing cost, and therefore a low cost of living, exactly because it has resisted enacting strong land use regulations.
3.12 Net Domestic Migration: The Association with Housing Affordability
Net domestic migration is strongly associated with housing affordability. Generally, metropolitan areas with more severe unaffordability have lost domestic

November 2016
11
migrants to metropolitan areas where housing is affordable.34 Generally, huge domestic migration losses have occurred in California and the Northeast, while the South has made major gains. At the same time, the Midwest has performed far better than California or the Northeast. For example, Oklahoma City, Indianapolis, and Louisville attracted more domestic migrants compared to their 2000 population than Seattle, San Francisco, San Jose, San Diego, and Los Angeles (Figure 7). They also outperformed every major metropolitan area along the Northeast Corridor (Washington to Boston).
Other “middle American” metropolitan areas also performed better than all the above with the exception of Seattle. These include Cincinnati, Pittsburgh, Columbus, Grand Rapids, St. Louis, and Kansas City. Indeed, over the period, the New York metropolitan area lost more net domestic migrants than the population of Kansas City. San Jose, home of Silicon Valley, and one of the most desirable places to live in the United States, lost the largest share of its population to domestic migration out of the 53 metropolitan areas with more than 1 million population. Los Angeles, which for so long led the nation in population growth, lost more net domestic migrants than the entire population of Oklahoma City. Los Angeles and San Jose lost more net domestic migrants than were lost by Rust Belt Pittsburgh, Buffalo, Cleveland, and Detroit, The California losses were so pervasive that San Francisco lost more than Pittsburgh and Buffalo, while San Diego lost more than Pittsburgh.
The high prices of housing in the higher-cost metropolitan areas are beyond the financial capacity of most middle-income households. There is increasing press coverage of out-migration from the San Francisco Bay area, especially San Jose. In Vancouver, with Canada’s best weather, the polling firm Angus Reid indicated that a “generation” of 150,000 families is considering leaving the metropolitan area because they cannot afford the housing prices.35 Recent research by “Smart Asset” indicates that millennial home buyers are increasingly purchasing in the Midwest and South, in places like Cedar Rapids, Wichita, and Oklahoma City.36
All of these markets experiencing high net domestic outmigration have far worse housing affordability than
Figure 7: Net Domestic Migration: 2000–2014 (Selected Metropolitan Areas)
Source: U.S. Census Bureau Estimates.
-20% -10% 0% 10% 20% 30% 40%
% of 2000 Population
RaleighAustin
NashvilleAtlanta
Oklahoma CityIndianapolis
LouisvilleSeattle
ColumbusBirmingham
Kansas CityCincinnatiPittsburgh
Grand RapidsMemphis
Saint LouisSan Diego
BostonBu�alo
ClevelandChicago
DetroitLos Angeles
New YorkSan Jose

SHOW-ME INSTITUTE I ESSAY
12
average, and each of them had housing affordability similar to that of the middle-American markets before they implemented strict land-use regulation.
In addition, greater housing affordability can attract business relocation. This is illustrated by the now-in-process move of the Toyota North American headquarters from Los Angeles to Dallas-Fort Worth. Housing affordability was, by one report, the principal driver.37
3.13 Severely Unaffordable Housing: Social and Economic Consequences
There are further consequences to the nation of unaffordable housing. Recent research suggests that the rising difference in housing affordability across metropolitan areas has been associated with a significant loss in national economic output (more than 10 percent).38 This, the authors estimate, accounted for a nearly $2 trillion loss in 2009. They attribute nearly all the loss to housing regulation.
Other research indicates that virtually all of the increase in income inequality in the Western world can be traced to greater concentration of wealth in housing, which can be tied to the extraordinary house price increases associated with stricter land-use regulation. The researcher adds that: “A natural first step to combat the increasing role of housing wealth would be to re-examine these regulations and expand the housing supply.”39
Recently, Jason Furman, the chair of the White House Council of Economic Advisors, expressed concern about the impact of strong land use regulation on housing affordability, income equality, and economic growth.40
Housing affordability is likely to continue worsening where there is more restrictive land regulation, because the demand for housing continues to rise with the increase in population, while shortage of land is exacerbated by the insufficiently flexible planning policies.41 An illustration of the continuing problem of regulation-associated housing affordability losses is that just over the past two years, the average median multiple has risen 1.4 points among the 10 least affordable metropolitan areas, compared to an increase of only 0.1 points in the 10 most affordable major metropolitan areas.42
3.14 Housing Affordability in Kansas City
Many markets have retained their historic housing affordability. One of these is Kansas City, which had a median multiple of 2.9 in 2015. Kansas City was ranked as the ninth most affordable43 out of 87 major metropolitan areas in nine nations in 2015, according to the 12th Annual Demographia International Housing Affordability Survey.44 All of the most affordable major metropolitan areas are in the United States. All of these, including Kansas City, retain more liberal land use regulation, having resisted pressure to implement restrictive regulation, including urban containment policy.
By comparison, in the least affordable major metropolitan areas, residents pay from nearly three times to more than six times as much of their income for houses as in Kansas City. The median house price ranges from 8.1 times income in Los Angeles and San Diego to between 9 and 10 in San Francisco and San Jose to 10.8 times in Vancouver, 12.2 times in Sydney, and 19.0 times in Hong Kong (Figure 8). Nearly all of the difference that has developed between Kansas City and these severely unaffordable has occurred in association with the implementation of urban containment land use policy.45
Assuming that liberal regulation remains in place in Kansas City, its cost of living advantage relative to the highly regulated markets is likely to expand.
Comparing Kansas City to Denver and Portland: The differences in housing affordability trends are illustrated by comparing Kansas City with Portland and Denver. These metropolitan areas are similar in size to Kansas City, but they have adopted more restrictive land use regulations that include urban containment policy.
Denver, Kansas City’s closest major metropolitan neighbor to the west, shares the characteristic of abundant flat, developable land. Denver's urban containment policy dates from the early 2000s. Portland was the first major U.S. metropolitan area to adopt urban containment policy in the 1970s. Seattle adopted urban containment policy in the 1980s.
In 1990, the three metropolitan areas had similar housing affordability. The median multiple in both

November 2016
13
Denver and Portland was 2.4. Kansas City’s median multiple was 2.3. By 2015, the median multiples in Denver and Portland had more than doubled to 5.1.46 By comparison, the increase in the median multiple was much less in Kansas City, to 2.9 (Figure 9). Portland and Denver are not the worst examples. Sydney, Australia, which was among the earliest to adopt urban containment policy, now is among the least affordable housing markets internationally, with a median multiple of 12.2 in 2015, while San Jose and San Francisco have median multiples of 9.7 and 9.4, respectively. In these metropolitan areas, which had median multiples of under
3.0 before adopting strong land-use regulation, residents now face median multiples that are more than three times as large as those in Kansas City.47
As a result, households in Kansas City have a considerably larger percentage of their income available to purchase other goods and services. This suggests, all else equal, that the standard of living of a median-income household in Kansas City is higher than that of its counterpart in Portland and nearly as high as in Denver. Kansas City’s lower housing costs result in lower cost of living–adjusted poverty rates than would be the case if housing affordability were as severe as in Denver or Portland.48
Figure 8: Best and Worst Housing Affordability Ranked (87 Major Metropolitan Areas in 9 Nations)
Source: 12th Annual Demographia Housing Affordability Survey.
0 2 4 6 8 10 12 14 16 18 20
Median Multiple (House Price to Income Ratio)
1-Rochester, NY1- Cleveland, OH
1- Cincinnati, OH, KY, IN1- Bu�alo, NY
5- Pittsburgh, PA6- Saint Louis, MO-IL
6- Oklahoma City, OK6- Grand Rapids, MI
6- Detroit, MI10- Kansas City, MO-KS
10- Indianapolis, IN10- Columbus, OH
78- Los Angeles, CA79- San Diego, CA80- London (GLA)
81- San Francisco, CA82- Melbourne, VIC
83- Auckland, NZ84- San Jose, CA
85- Vancouver, BC86- Sydney, NSW
87- Hong Kong, CN

SHOW-ME INSTITUTE I ESSAY
14
Impact on Qualifying Incomes: Kansas City’s housing affordability advantage is illustrated by comparing the median household income required to purchase the median priced house compared to more expensive metropolitan areas. In the other markets, the median income household would not qualify for a mortgage on the median priced house.49 In Kansas City, however, the median income household can qualify for the median priced house (Figure 10).50 Among the selected metropolitan areas, all have more restrictive land-use policy than of Kansas City.
Assessment: Cost of Living
Kansas City’s lower cost of living is largely a reflection of its superior housing affordability. It can be expected that housing affordability will continue to deteriorate in the highly regulated, unaffordable metropolitan areas in the absence of fundamental land-use liberalization.51 As a result, the cost of living advantage of Kansas City could improve substantially in the future.
3.2 Transportation
Mobility is important to economic growth. Economic research indicates that job creation and economic growth seem to be greater in a metropolitan area if the average person is able to access a greater percentage of the jobs within a normal commuting time (such as 30 minutes).52 Moreover, lower urban population densities are associated with lower levels of traffic congestion.53
Kansas City is well positioned in this regard. The metropolitan area is served by a comprehensive freeway network and a good arterial street and boulevard network. Only two of the 50 largest U.S. urban areas54 have lower traffic volumes per freeway lane mile than Kansas City.55 This provides Kansas
City with a considerable advantage in both personal and freight mobility.
3.21 Passenger Transportation
Kansas City has relatively free-flowing traffic that is among the best in the world. This greater mobility is largely the result of its superior freeway and arterial street system as well as its comparatively low population density.
Traffic Congestion: According to the Tom Tom Traffic Congestion Index,56 Kansas City ranks as the least congested metropolitan area, overall, in the world among the 146 it ranks. On average, road travel is made 11 percent longer by traffic congestion in Kansas City (Figure 11). This earns a tie for the top ranking (least congestion) with Richmond, Virginia.57 According to this measure, the average trip by car that would take 30 minutes in free-flowing traffic would take approximately 33 minutes in Kansas City traffic congestion. This top
Figure 9: Housing Affordability Comparison (Kansas City, Denver, and Portland: 1990–2015)
Source: 12th Annual Demographia International Housing Affordability Survey.
6
5
4
3
2
1
0Kansas City Denver Portland
Med
ian
Mul
tiple
(Pric
e to I
ncom
e Rat
io)
2015
1990
2.3
2.9
2.4
5.1
2.4
5.1

November 2016
15
rating is particularly significant given the fact that the metropolitan area is cut in half by the Missouri River.
The U.S. average is a 21 percent time loss, indicating that a trip that would take 30 minutes without congestion would take 36 minutes during peak periods. The world average travel time loss is 27 percent. Los Angeles has the worst peak period traffic congestion in the United States, with an average travel time loss of 39 percent. Thus, in Los Angeles, a trip that would take 30 minutes in free-flowing traffic averages nearly 42 minutes. Istanbul has the worst peak period traffic congestion in the world, with a 58 percent travel time loss, indicating that a 30 minute trip without congestion averages 47 minutes. Denver and Portland, similar sized to Kansas City, have traffic congestion indices of 22 percent and 26 percent,
respectively. Thus, congestion adds between two and three times as much time to trips in Denver and Portland as in Kansas City.
Further, Kansas City’s traffic congestion trend has been favorable. The Texas A&M Transportation Institute has been measuring traffic congestion for nearly four decades.58 In the first year for which data are available, (1982), Kansas City had a four percent travel time loss during peak periods. Kansas City ranked 41st-best in the nation among the 101 urban areas included in the analysis. By 2014, Kansas City had a 15 percent travel time loss due to peak period traffic congestion. However, traffic congestion deteriorated even more rapidly outside Kansas City. As a result, in 2014, Kansas City improved to the 26th best traffic congestion out of the 101 urban areas.
Figure 10: Median Income and Qualifying Income (Median Priced Detached House: 2015)
Source: National Association of Realtors and the U.S. Census Bureau.
$0 $40,000 $80,000 $120,000 $160,000 $200,000 $240,000
San Jose
San Francisco
Los Angeles
San Diego
Seattle
Denver
Portland
Fresno
Kansas City
Median Household Income
Qualifying Income: Median House

SHOW-ME INSTITUTE I ESSAY
16
By contrast, similar sized Portland and Denver did much more poorly over the same period. In 1982, Denver’s peak hour lost travel time was 10 percent, a figure that rose to 30 percent by 2014, when Denver had the 86th best (16th worst) traffic congestion. Portland had lost travel time of 13 percent in 1982, which worsened to 35 percent by 2014. In 2014, Portland had the 95th best traffic congestion in the nation (7th worst). Portland’s traffic congestion is particularly intense for its modest population, which ranks 24th in the nation.
Even more significantly, both Denver and Portland have constructed extensive urban rail systems during the interim. Denver’s work trip transit market share59 is more than four times that of Kansas City, while Portland’s is more than six times. Yet, in Denver, the transit market share is only marginally higher than before rail was built, and in Portland it is less.60 Even without these massive and expensive transit improvements, traffic congestion is far less severe in Kansas City (Figure 12).
Figure 11: Best and Worst Traffic Congestion Ranked (146 World Metropolitan Areas)
Source: Tom Tom Traffic Congestion Scorecard 2015.
0% 10% 20% 30% 40% 50% 60%
Excess Time Lost in Tra�c Congestion
1- Kansas City1- Richmond3- Cleveland
4- Indianapolis5- Saint Louis
5- Birmingham5- Abu Dhabi
8- Salt Lake City8- Rochester
8- Pheonix8- Oklahoma City
8- Milwaukee8- Jacksonville
8- Columbus8- Cincinnati
136- Los Angeles136- Taipei
138- Warsaw139- Bucharest
140- Saint Petersburg141- Recife
142- Salvador143- Moscow
144- Rio de Janeiro145 Mexico City
146- Istanbul

November 2016
17
Kansas City’s comparatively light traffic congestion also provides an advantage to freight movement, both within and through the metropolitan area (Section 3.2). This has made it possible for Kansas City to emerge as one of the nation’s largest logistics centers (below).
Work Trip Travel Times: Generally, U.S. travel times are among the shortest in the world.61 Kansas City also has among the shortest work trip travel times among the 53 U.S. metropolitan areas with more than 1,000,000 population (Figure 13). Again, much of the reason for this superior travel time is the extensive freeway system in Kansas City and the lower urban density, which is associated with less traffic congestion.62 In 2013, the average one-way work trip travel time was 22.7 minutes in Kansas City, the sixth best among the major metropolitan areas. The best travel time was in Rochester, at 20.8 minutes, and the worst travel time was in New York at 34.9 minutes. Kansas City’s average travel time was more than three minutes below the average of the major metropolitan areas (25.9 minutes). The Kansas City metropolitan area has the largest population among the 10 major metropolitan areas with the best work trip travel time.
Automobile Use in Kansas City: Driving dominates personal travel in the Kansas City metropolitan area. Driving alone is by far the most important means of travel to work. In 2014, 82.6 percent of Kansas City commuters reached work driving alone. Those in carpools added another 10.6 percent to the commuting total. Working at home accounted for 3.5 percent of work access. Other modes, such as walking (1.5 percent), transit (1.2 percent) and cycling (0.1 percent) accounted for much smaller shares.
The distribution of travel by mode (cars, transit, walking, etc.) in Kansas City is fairly typical for major U.S. metropolitan areas. Among the 53 metropolitan areas with more than 1 million population, the median (middle) drive alone share is 80.0 percent, only slightly below that of Kansas City (83.4 percent).
Prospects: Kansas City’s competitive advantage in mobility could become even stronger as other metropolitan areas provide insufficient capacity for the amount and location of increasing highway travel demand, instead directing resources to other modes, especially rail transit, which have no reasonable prospect of attracting sufficient numbers of drivers to reduce traffic congestion.63
Transit: There have been massive transit losses in the last half-century or more as access to automobiles has become virtually universal. This is evident in the Kansas City metropolitan area, where commuting by transit has fallen more than 90 percent, from 11.0 percent in 196064 to 1.0 percent in 2014. This is despite a more than doubling of employment over the period.65
Figure 12: Traffic Congestion Comparison (Kansas City, Denver, and Portland: 1982–2014)
Source: Texas A&M Transportation Institute.
40%
35%
30%
25%
20%
15%
10%
Kansas City Denver Portland
Exce
ss Pe
ak Pe
riod T
rave
l Tim
e
2014
1982
5%
0%

SHOW-ME INSTITUTE I ESSAY
18
Automobile usage is so pervasive that it is little different among low-income employees than among the overall work force. In Kansas City, only 3.0 percent of low income employees66 commute to work by transit. This is more than the share of the overall workers using transit, but still very small. Cars are much more important to low-income workers. This small difference is less than might be expected in light of the perception that low-income residents depend substantially on transit for their mobility. In 2013, 76 percent of low-income Kansas City workers drove alone to work, nearly as high as the approximately 83 percent of all workers who drove to work.
Transit Access and Travel Times: Unlike the metropolitan areas of pre-war America, the modern metropolitan area is not suited for substantial shares of travel by transit. This is illustrated by Accessibility Observatory research at the University of Minnesota indicating that the average employee in the Kansas City metropolitan area can reach only 0.7 percent of jobs within 30 minutes by transit. A 60 minute transit trip raises the number of jobs accessible to only 2.9 percent. By comparison, 1.2 percent of the employment in 46 metropolitan areas with more than 1,000,000 population can be reached by the average employee in 30 minutes, and 5.4 percent in 60 minutes.67
Figure 13: Average Journey to Work Travel Times (One-Way: Top Major Metropolitan Areas)
Source: American Community Survey, 2009–2013.
25
20
15
10
5
0
Med
ian
Mul
tiple
(Pric
e to I
ncom
e Rat
io)
Rochester, NY
Bu�alo, NY
Grand Rapids, MI
Oklahoma City, OK
Salt Lake City, UT
Kansas City, MO-KS
Milwaukee, Wi
Hartford, CT
Columbus, OH
Louisville, KY-IN

November 2016
19
This minimal access to employment by transit is because trip origins or destinations are too far from transit service (this is called the “last mile” problem). Generally, travel by transit is slower than by car. In Kansas City, the average one-way travel time for driving alone is 22.3 minutes, somewhat more than one half the time for the average transit work trip. Similar sized metropolitan areas, such as Denver and Portland, that have built extensive rail systems, have even longer average travel times by transit. Nationally, transit’s travel time is approximately twice that of driving alone (see Table 4 in the Appendix).
New Urban Rail Systems: Indeed, infusions of funding to improved transit around the nation have made little difference. At least $100 billion dollars have been spent to build and expand urban rail systems around the nation.68 In the metropolitan areas where this has taken place, driving alone has continued to be the dominant mode of travel to work and has not declined as the rail systems were opened.69
In the modern metropolitan area, with its dispersed employment and faster travel by car, there is little realistic potential for transit to reduce automobile use.
Assessment: Passenger Transportation
Kansas City has among the least traffic congestion in the world and the shortest work travel times. This is the result of Kansas City’s extensive freeway and arterial system, its lower-density urban form, and its dispersion of employment. A continuation of Kansas City policies that provide sufficient highway capacity could improve its competitive position in the future.
3.22 Freight Transport and Logistics
Kansas City is at the virtual center of the United States, approximately midway between Houston, largest metropolitan area on the Gulf Coast, and the Canadian border and nearly one-half the way from the Atlantic Coast in the Washington–Baltimore area and San Francisco on the Pacific Coast.
One of the nation’s principal east-west interstate highways, Interstate 70, traverses the Kansas City area. A principal north–south Interstate highway, Interstate 35, crosses the metropolitan area in its route from Laredo, Texas, on
the border of Mexico to Duluth, Minnesota. This route includes Dallas-Fort Worth, the 4th largest metropolitan area in the nation, and Minneapolis-St. Paul, the 16th largest in the nation, as well as San Antonio, Austin, Oklahoma City, and Des Moines. In addition, direct interstate access is provided to Houston, with one of the nation’s largest ports, via Interstate 45, which meets Interstate 35 in the Dallas-Fort Worth area.
Kansas City is the southern terminus of Interstate 29, which traverses Omaha on the way to the Canadian border, near Winnipeg, Canada’s 8th-largest metropolitan area. Kansas City is also the northern terminus of Interstate 49, which is largely completed to its junction with Interstate 40 in Arkansas and will eventually be completed to a junction with Interstate 10 in Lafayette, Louisiana. This route will provide more direct access to New Orleans and its large port.
Kansas City is also a railroad hub. Kansas City is served by four of the largest railways in the United States, the Burlington Northern Santa Fe, the Union Pacific, the Norfolk Southern, and the Kansas City Southern. The Kansas City Southern is the principal international rail carrier between the United States and Mexico.
These facilities have contributed to making Kansas City the nation’s largest freight rail center by tonnage and the 3rd-largest trucking center. Further, Kansas City has the most foreign trade zone space in the nation.70
Kansas City’s pivotal position in the national highway system and its strong rail hub enable it to be one of the nation’s leading intermodal markets. Intermodal freight transport refers to the transfer of shipping containers from one mode to another (such as truck to rail, or air to truck).
Kansas City is home to three major logistics facilities.
A Burlington Northern Santa Fe Railroad intermodal facility (Logistics Park Kansas City71) is located in Edgerton, in Johnson County. The intermodal facility and adjacent industrial park opened in 2013 and covers nearly 1,500 acres. Logistics Park Kansas City is the largest intermodal facility between the ports of Los Angeles and Long Beach and Chicago. This rail route has the greatest containerized freight volume in the United States.

SHOW-ME INSTITUTE I ESSAY
20
A Kansas City Southern Railroad intermodal facility (Centerpoint KCS Intermodal Center72) is located in Grandview, Missouri, in Jackson County. Kansas City Southern is the principal rail provider between the United States and Mexico, and its tracks (combined with those of Kansas City Southern de Mexico) reach the port of Lazaro Cardenas in the state of Michoacan, as well as major markets such as Monterey, Mexico City, Pueblo, Toluca, and Veracruz. The Centerpoint KCS Intermodal Center opened in 2008 and includes approximately 1,300 acres, including an adjacent industrial park.
An air freight–based logistics facility (KCI Intermodal Business Centre73) is located at Kansas City International Airport. The facility covers approximately 700 acres and began operations in 2008.
Assessment: Freight Transport and Logistics
Kansas City has one of the nation’s largest logistics industries, including pivotal intermodal truck and rail facilities made possible by its central location. These facts alone can be a business driver; for example, Amazon just announced that it will occupy all of an 822,000 square foot facility to be used as a distribution center in Edgerton, Kansas.74
3.3 “Livability”
Kansas City performs very well in relation to cities that are considered the best places to live in the world (“livable cities”). These cities tend to be concentrated in Australia and Canada.
Periodically, organizations such as Mercer, The Economist and others produce lists of “most livable” cities. The press and others tend to give considerable credence to these lists, often without making it clear that the principal purpose of such reviews is to inform international companies seeking to relocate highly paid executives to other cities. Needless to say, what may make a city livable to an executive with $500,000 or more in annual income is not likely to have much relevance to middle income households, which had a median income of approximately $54,000 in the United States in 2014.
In fact, Kansas City ranks very well not only in the United States but also internationally on issues of significant interest to typical households, such as superior housing affordability (which drives the cost of living, see Section 3.11) and comparatively minimal traffic congestion (see Section 3.21).
The first principle of livability is affordability. If a household cannot afford to live in a metropolitan area, then it is not livable to them. Kansas City does very well in comparisons with The Economist’s list of the 10 most livable cities75 in 2015. Kansas City has better housing affordability than all 10. In Calgary, the most affordable metropolitan area on The Economist list, housing is 45 percent more costly relative to incomes as in Kansas City. The median income household would pay more than twice as much relative to their incomes for the median priced house in Toronto and more than four times as much in Sydney (see Table 5 in the Appendix).76
The comparison is similar with respect to traffic congestion. Kansas City’s traffic congestion is less intense than that of any of The Economist’s 10 most livable cities. With an average travel time loss of 10 percent, Kansas City is about one-half as congested as the least congested Economist livable city, Calgary. Vancouver and Toronto are nearly 3 times as congested, while Auckland (New Zealand), smaller than Kansas City, is more than three times as congested (see Table 6 in the Appendix).
Three of The Economist’s top 10 livable cities have more productive economies than Kansas City, resource-rich Calgary and Perth (Australia) as well as international banking center, Zürich. Seven of the top 10 livable cities have lower gross domestic products per capita than Kansas City, including Toronto, Sydney, and Auckland (see Table 7 in the Appendix).77
Kansas City compares favorably to all of The Economist’s 10 most livable cities in housing affordability and traffic congestion, and outperforms all but three in productivity. A middle income quality of life equal to that of Kansas City cannot be achieved in any of the most livable international cities.

November 2016
21
Another livability index ranks Kansas City highly in “middle class aspiration” factors. Building Cities for People ranks Kansas City 12th out of the 106 metropolitan areas in the United States with more than 500,000 population.78 Among the major metropolitan areas, Kansas City trails only Austin, Raleigh, Minneapolis-St. Paul, Hartford, Washington, D.C., and Salt Lake City and leads the other 46.
Livability Choices in Kansas City: Kansas City offers a high-quality suburban lifestyle. This is evident not only in the areas outside the city of Kansas City, Missouri, but also in the suburban development that has occurred since World War II in the city itself.
At the same time, Kansas City has developed an increasingly attractive urban lifestyle for residents. In recent decades, the urban core of Kansas City has become a favored location for residents interested in living a pedestrian- and transit-oriented, high-density urban lifestyle. The livability improvements in the urban core, especially downtown, have mirrored those in most other major metropolitan areas.
In this regard, Kansas City and other more liberally regulated cities around the nation (such as Austin and Atlanta) offer a complete array of lifestyle choices. These include the higher-density urban core that is particularly popular with singles and also suburban detached housing with adequate-size lots, which remain the choice of many households, especially those with children. Increasingly, more highly regulated cities have made the latter lifestyle impossible for many households. It is not surprising that the most expensive metropolitan areas in the nation have experienced significant domestic out-migration.
The resurgence of urban cores around the nation has been an important turnaround from the low points reached especially in the 1970s and 1980s. However, the development does not indicate a “return to the city” of any magnitude.79 For example, at the national level, urban cores, including downtown areas and the inner ring, accounted for only 1.2 percent of major metropolitan area growth between 2000 and 2012. The bulk of this growth was in the downtown areas (0.9 percent). Yet the entire urban core growth in the more than 50 metropolitan areas with more than 1,000,000
population was barely 250,000 over the past 12 years. This compares to the overall growth of more than 20 million in the suburban and exurban areas.80
Assessment: Livability
Kansas City rates highly as an attractive place to live. It exceeds the performance of cities considered the “most livable” in important dimensions, such as housing affordability, economic productivity, and mobility. On issues of primary importance to typical households, housing affordability and mobility, Kansas City is truly world class and exceeds the performance of cities ranked highest in the world. 3.4 Climate
Due to Kansas City’s geographic location, the climate is less moderate than in some other parts of the nation, such as the California coast and, in the winter, much of the South and Mountain West. In addition, Kansas City’s location does not provide the scenic and recreational opportunities that are available near ocean coasts and mountains. There is nothing that Kansas City can do to change this.
However, this disadvantage can be overcome. The point is made by California, which may have the nation’s most attractive climate. Yet California has seen huge domestic outmigration since 2014, with a net loss of 1.6 million net domestic migrants to other parts of the nation. The losses have been the greatest in the most attractive parts of the state, the coastal metropolitan areas (Los Angeles, San Francisco, San Diego, and San Jose). Perhaps the most important factor has been the loss of housing affordability.
Indeed, California, which grew rapidly from World War II until 2000, has lost domestic migrants to both Missouri and Kansas since 2000. The pervasiveness of this trend is illustrated by the fact that California even lost net domestic migrants to Oklahoma and Iowa, states that had huge outflows to California before World War II.
California has often been rated as being unfriendly to business, which discourages business relocation to the state, despite its superior climate (below).81 An exodus

SHOW-ME INSTITUTE I ESSAY
22
of businesses from California to other states has been evident for some time.82
Assessment: Climate
Kansas City’s principal competitive disadvantage may be its weather, yet Kansas City’s strong advantages, combined with poor performance (such as in housing affordability and traffic congestion) in some cities with better climates can do much to neutralize this disadvantage.
3.5 Business Attractiveness
One of Kansas City’s principal competitive disadvantages is its location in a region that is growing slowly. Much of the nation’s population and economic growth have shifted from the Midwest and East to the South and West in recent decades. From 1980 to 2000, 82 percent of the national population increase occurred in the South and West. This was up from the 69 percent between 1950 and 1980 and the 43 percent from 1900 to 1950. Since 1980, the Midwest has added 19 percent to its population, the East 12 percent, the South 69 percent, and the West 80 percent (Figure 14).
While Kansas City’s geographic location is an important obstacle to economic growth, it need not be definitive. Some metropolitan areas in the slow-growing East and Midwest grow faster than others. Even metropolitan areas in the fast-growing South and West have begun to experience slower growth that has been associated with their high costs of living, especially their high housing costs. At the same time, geographic location is an advantage for Kansas City for freight and logistics, as indicated earlier.
Kansas City appears to rank somewhat in the middle of major metropolitan areas in attractiveness to business. The Millkin Institute produces a report ranking the best-performing metropolitan and sub-metropolitan economies83 in the United States. Millkin ranks 200 metropolitan areas and metropolitan districts,84 evaluating employment growth, wage growth, and high-technology growth. The Kansas City metropolitan area ranked just below the top one-third of this list, at 77th.85 If the sub-metropolitan areas are eliminated, Kansas City’s ranking remains approximately the same, just below the top one-third.86
Another indicator of business climate is business tax friendliness. The Tax Foundation places Missouri as the 17th-best state in business tax friendliness, while ranking Kansas as 22nd best in its 2016 State Business Tax Climate Index.87 The 2015 “Chief Executive” ratings of the best states for business show Missouri to be ranked at 26th and Kansas at 27th.88
While the state of Missouri may rank well, the city of Kansas City, Missouri, has an unfavorable situation in its earnings tax and high sales taxes. This is likely to be a barrier to attracting new businesses (Section 3.65).
Assessment: Business Attractiveness
Kansas City has the disadvantage of being located in a slow-growth region of the nation. However, as higher-growth parts of the nation enact policies that put economic growth and job creation at risk, especially restrictive land-use policies and policies that retard mobility, Kansas City could benefit. (Sections 3.11 and 3.2)
3.6 City of Kansas City Missouri
The city of Kansas City also has important opportunities and challenges.
3.61 Suburban Development Potential
As noted earlier, the city of Kansas City, Missouri, has experienced far slower population growth and employment growth than the rest of the metropolitan area. However, the city has an important opportunity. The population and employment projections suggest better performance in the future. The population growth over the next 30 years (to 2040) is projected to be substantial, principally in the outer suburban areas of the city (especially in Clay and Platte counties), representing 15 percent of the metropolitan area’s growth.89
Less than 3 percent of the city’s residential growth is projected to be in Jackson County, which includes the urban core. Attracting this suburban growth will require the city to continue to permit the construction of housing that is attractive to consumers. As was noted earlier, the Kansas City area has a particular attraction for families, and this attraction is likely to increase in the future. The suburban areas of the city of Kansas City will need to

November 2016
23
compete with suburban areas outside the city, in part by offering housing that meets consumer tastes. The suburban areas of Platte and Clay counties are likely to be more attractive to families because of their higher school district rankings (Section 3.64).
3.62 Airport
Another opportunity is the planned renovation of Kansas City International Airport. Airport construction is largely funded by federal grants and user fees charged to airlines and airline passengers. It is important that the most cost-effective alternative be selected to make the airport more attractive for airlines, which could encourage additional service by both passenger and freight carriers. Higher levels of airline service could make the Kansas City metropolitan area more competitive for business location.
A final decision has not been made on the alternatives for improving Kansas City International Airport. One unresolved issue is whether to replace the existing, convenient, three terminals with a single terminal. Eventually, Kansas City, Missouri, voters will have the final say, when a bond election is held to approve financing for the adopted approach. There are conflicting reports about the costs and benefits of both alternatives, with the new terminal option generally expected to be more expensive than refurbishing the present configuration.90 The final expense could substantially exceed the costs emerging from plans (and presented to voters).
Cost overruns on large capital projects are common, and there is a substantial developing literature on the subject. In an extensive examination of 258 transportation infrastructure “megaprojects,” 91 Bent Flyvbjerg of Oxford University, Nils Bruzelius of the University of Stockholm, and Werner Rothengatter of the University of Karlsruhe found recurring and gross forecasting errors covering 70 years in North America, Europe, and elsewhere.92 Capital cost overruns were identified in 9 of the 10 projects reviewed. For example, Denver International Airport, completed in the middle 1990s, had a final cost that was 200 percent higher than its projections.93
The frequent cost escalation above projections of major infrastructure projects also represents a threat, to the extent that higher user fees could deter passenger and freight
carriers from expanding service. It will be important for Kansas City to choose the most cost-effective alternative for their airport.
3.63 Convention Center Hotel
Another pending proposal could represent a threat to taxpayers.
The city’s Kansas City Convention and Visitors Bureau (CVB) operates the Kansas City Convention Center. The CVB is finalizing an agreement for building an 800-room convention center hotel. The city hopes that, in the longer run, profits from the hotel will provide revenues to the city.
However, convention center–sponsored hotels have often failed to perform as well as projected.94 This is a potential concern for voters of Kansas City, Missouri, because, depending on the details of the final agreement, the city may find itself in a position to fund deficits at CVB that result from an underperforming hotel. Concerns have also been expressed that the proposed catering arrangements could increase convention costs and deter booking of important conventions.95
Such underperformance seems likely, given the great competition among cities throughout the nation for convention business. Further, there are indications that the convention market has not grown sufficiently to accommodate the new supply of convention facilities. 96
3.64 Primary and Secondary Education
The Kansas City School District has had particular performance difficulties. The District generally serves residents within the 1950 borders of the city, mainly in Jackson County and south of the Missouri River. Residents in other parts of the city are served by other school districts.
The Kansas City School District lost its state accreditation in 2000 and again in 2011, and has spent most of the new century either provisionally accredited or unaccredited. There are recent indications of improvement, with provisional accreditation having been restored in 2014.97 However, full accreditation has not been achieved. The Kansas City School District is ranked by one national

SHOW-ME INSTITUTE I ESSAY
24
education evaluation website (Niche.com) as the 96th-best performing out of 100 in the two-state metropolitan area.98 This record and performance seem likely to discourage families with school-age children from locating in the area served by the Kansas City School District.
The larger school districts that serve the areas with the greatest potential for new housing are rated higher. The Park Hill School District ranks 7th, according to Niche, in the Kansas City metropolitan area. The Platte County School District ranks 23rd and the North Kansas City School District ranks 30th out of the 100 school districts in the metropolitan area.
3.65 City Taxation
The city of Kansas City, Missouri has an earnings tax, unlike other jurisdictions in the metropolitan area. This can induce businesses to avoid locating in the city, and deter employees from seeking work in Kansas City, because their after-tax earnings will be less. Economic
research correlates slower municipal economic growth relative to suburban areas with earnings taxes: “The bottom line is that city earnings taxes do matter. Cities that wish to increase their rate of economic growth should consider reducing or eliminating their earnings taxes.”99 It is likely that Kansas City would be more competitive without the earnings tax.
In addition, income tax in the city of Kansas City is higher than the state average. Its sales tax also exceeds the state average, and in some city districts is even higher.100 Both of these make the city of Kansas City less competitive. Generally, higher income taxes create an incentive for residents to live elsewhere in the metropolitan area (or in the nation), while higher sales taxes encourage people to make purchases outside the city limits.
The city of Kansas City’s higher taxes—its earnings tax, income tax and sales taxes—may be an important contributor to the slower rates of growth that have
Figure 14: Major Metropolitan Growth: 1900-2010 (53 Largest Metropolitan Areas: 2010 )
Source: U.S. Census Bureau data.
1900 1910 1920 1930 1940 1950 1960 1970 1980 1990 2000 2010
80
70
60
50
40
30
20
10
0
East
MidwestSouth
West
Mill
ions

November 2016
25
occurred in the city relative to both the Missouri and Kansas suburbs for decades.
3.66 The Kansas City Streetcar
Another Kansas City, Missouri, project, the Kansas City Streetcar, has been characterized as both a threat and an opportunity by various interests in the community. A principal justification for the project was additional economic growth. This rationale mirrors that of other streetcar projects that have been pursued around the nation.
However there is question as to the potential of streetcar projects to generate economic development. This is illustrated by a publication by the Transportation Research Board (TRB), (National Academy of Sciences), a division of the National Research Council, which raised questions about the validity of such claims101:
The literature regarding empirical measurement of actual changes in economic activity, such as changes in retail sales, visitors, or job growth, is almost nonexistent for streetcars.
The report went on to describe an apparent exception that is used to justify streetcar economic development claims,102 noting that an often-cited report on Portland’s streetcar:
… ends with a clear statement that causality needs to be further analyzed, because other factors were in play during the period of the streetcar’s construction in downtown Portland.
The other factors in play are further described:103
Staff reported that although the Portland streetcar has been immensely popularized throughout the transit field, those engaged in economic development in Portland view the streetcar as one of many components of a longstanding and ongoing program to revitalize downtown Portland and to reshape the city as increasingly transit-oriented. Major initiatives, including an extensive light rail system (also traversing the downtown), the Fareless Square (free bus, light rail, and streetcar in the downtown), extensive streetscape improvements, substantial allowable density, fine-tuned parking regulations, strong design guidelines
and review, and a host of financial incentives offered by the Portland Development Commission (e.g., land write-downs, subsidies for affordable housing, loans and grants for economic development, and façade improvements), all have contributed to the success of downtown Portland in the areas around the streetcar routes. Staff perspective, shared by many other planners and economic development practitioners in Portland, is that it is difficult to single out the streetcar as a key factor in the downtown’s success; rather it is one among a host of urban amenities creating the conditions for success.
The financial incentives provided by the Portland Development Commission have been massive. Portland has an aggressive financing program for development and urban renewal. According to the most recent budget, Portland’s maximum bond obligation authority for urban renewal areas exceeds $2.5 billion and the currently outstanding obligations are more than $750 million.104
Perhaps the most telling indication that streetcar contributions to economic development are uncertain is in the TRB report title for the section assessing the impact: “Summary of Literature Limitations.”105
The literature on impacts on the built environment overwhelmingly focuses on heavy rail and light rail systems. The only study with quantitative analysis of a contemporary streetcar system’s impacts can be found in Portland Streetcar Development Impacts. As described in more detail in this report, the study’s findings are not necessarily applicable to other U.S. streetcar systems, owing to the unique presence in Portland of an Urban Growth Boundary (UGB) constraining development at the region’s edge (pushing development into the center), the presence of a framework for urban renewal [Urban Renewal Areas (URAs)] with substantial redevelopment incentives, and limits on the study’s analysis of causality.
The report goes on to say:
Given that federal funding for streetcars emphasizes economic development, along with many local policymakers’ objectives to stimulate economic development, the literature is particularly weak on

SHOW-ME INSTITUTE I ESSAY
26
impacts of streetcars on economic development, such as the attraction of jobs, retail sales, and tax revenue.
At the same time, there is a contentious debate on the developmental impacts of streetcars.106
Another justification for building streetcars, and one cited in Kansas City, is to attract younger people, especially “Millennials,” to live in downtown areas. Downtowns have attracted Millennials in recent years, especially as core areas of cities have seen substantial crime rate reductions.
However, the movement of Millennials to the urban core has been modest in relation to their total population. A survey of Millennials by the Urban Land Institute found that only 13 percent of Millennials lived “in or near downtowns.”107 Based on Census Bureau data, the Demographia City Sector Model reported that there had been an increase in young adult population within the historic downtown cores of major metropolitan areas between 2000 and 2011. Yet, fewer than three percent of Millennials lived in such areas in 2011, with more than 97 percent living elsewhere.108 Moreover, migration trends indicate Millennial net migration from the cities to the suburbs.109
Core revitalization is occurring in most major metropolitan areas. Many core cities, like Kansas City, seek to attract economic development and younger people by strategies such as streetcars. Yet, similar improvements are occurring with and without projects like streetcars (such as in St. Louis and Austin).
Proponents argue that projects like streetcars improve downtown environments. Opponents question the high costs and suggest that their core cities often have more pressing needs. However, it is doubtful that such projects are attracting businesses or residents from other parts of the country. As a result, they are likely to do little to improve regional competitiveness.
4. COMPETITIVE ASSESSMENT
Kansas City’s advantages could substantially outweigh its disadvantages, leading to a more prosperous future for residents and businesses.
The advantages are as follows:
Cost of living: Kansas City has a superior standard of living, made possible by a lower cost of living. This is largely a reflection of Kansas City’s superior housing affordability, which is among the best in nations for which there is comparable data. With the strong association between a lower cost of living and higher net domestic migration, Kansas City’s low cost of living is likely to be its principal advantage, consistent with the research cited above indicating the importance of housing affordability in domestic migration.
Mobility: Kansas City rates as having the least traffic congestion in the world and among the shortest work travel times. This is made possible by Kansas City’s extensive freeway and arterial system, its lower-density urban form and its dispersion of employment. Research indicates that economic performance in a city is improved by better mobility.
Freight and logistics: Kansas City has one of the nation’s largest logistics industries, made possible by its central location. Kansas City has a strong logistics industry presence, including pivotal intermodal truck and rail facilities.
Livability: Kansas City rates highly as an attractive place to live and exceeds the performance of cities considered the “most livable” in important dimensions, such as housing affordability, economic productivity, and mobility.
With the exception of its geographic location, the competitive advantages outlined above result from public policies, such as land-use regulations that retain housing affordability and keep the cost of living comparatively low and policies that have developed Kansas City’s superior road transportation system. Against these advantages are set two primary disadvantages:
Climate: Kansas City’s weather can be a major competitive disadvantage. Yet Kansas City’s strong advantages, combined with poor performance (such as in housing affordability and traffic congestion) in some

November 2016
27
cities with better climates can do much to neutralize this disadvantage.
Business Attractiveness: Kansas City also has the disadvantage of being located in a slow-growth region of the nation. However, prospects could improve as higher-growth parts of the nation enact policies that reduce job creation.
Threats
The most important opportunities and threats to Kansas City relate to whether the area retains its policies that produce in its advantages relative to other metropolitan areas. Kansas City’s land-use and transportation policies are the foundation of its two principal advantages—its low cost of living and its superior transportation system. However, these advantages are under threat.
Efforts to implement more restrictive land use planning policies are underway around the country. The urban planning profession generally supports these policies, and the dominant view in planning is that such policies should be implemented in virtually all metropolitan areas.110 These policies, as noted above, have been associated with significant losses in housing affordability. This necessarily leads to a lower standard of living and greater poverty than would otherwise be the case.
Similarly, there is strong urban planning opposition to the automobile orientation of urban areas. Kansas City, with its superior mobility performance that depends on quality freeways and arterials, would be materially disadvantaged if local and state officials were to adopt “Portland model” policies that generally fail to provide sufficient capacity for growth and instead divert financial resources to transit, which is simply incapable of providing equal mobility. Ignoring these threats could be costly to the future of Kansas City. Kansas City’s potential for a better economic future relative to other metropolitan areas is largely dependent upon retaining its superiority in housing affordability and traffic congestion.
Marketing Kansas City to the World
The fundamental conclusion is that Kansas City ranks better than metropolitan areas commonly rated as the best in the world in housing affordability, traffic congestion
and productivity. However, the advantages of Kansas City are not well known throughout the metropolitan area, the nation, or the world.
The Kansas City Area Development Council (KCADC) seeks to attract business relocation to the Kansas City metropolitan area. These efforts could be significantly strengthened by a stronger emphasis on the world-class advantages of the metropolitan area.
For example, the KCADC website correctly notes Kansas City’s lower median house prices. However, the data are considerably out of date, reflecting 2011 prices, when house prices across the nation were depressed. They have since begun rising again, but Kansas City house prices have dropped relative to the cities used in the comparison. For example, Kansas City median house prices rose $43,000 from 2011 to 2015. This is considerably less than the $210,000 increase in Los Angeles, the $122,000 increase in Denver, the $119,000 increase in Seattle, and the $88,000 increase in Atlanta.
Moreover, while there is a description of Kansas City’s road transportation system, there is no indication of its superior traffic congestion ratings. That Kansas City is tied for the best in the world among ranked cities should be at the very top of Kansas City’s marketing material.
KCADC is mentioned because of its dominant position, but all economic development organizations serving the region, including those in and outside government, should emphasize Kansas City’s greatest strengths. The Way Forward
The fundamental question is, “What competitive advantages does Kansas City have over other metropolitan areas, and how can it maintain or expand those advantages?” The answers are clear. Kansas City’s strongest advantages are its low cost of living (the result of superior housing affordability), superior mobility, and a complete array of lifestyle choices. However, each of these advantages could be threatened by policies that currently enjoy favor within urban planning circles.
The key challenge for Kansas City in the future seems likely to be retention of its strongest advantages: its low cost of living (which results from superior housing

SHOW-ME INSTITUTE I ESSAY
28
affordability) and its mobility. It will be important for the Kansas City metropolitan area to continue policies that permit environmentally sensitive and inexpensive development to occur and make sufficient improvements to the roadway system to preserve or improve mobility.
Kansas City has a unique opportunity that is not limited to its present world-class livability. As competitor metropolitan areas pursue policies that make them more expensive for middle-income households and more difficult to get around, Kansas City’s competitiveness should improve.
Kansas City’s lower cost of living can be expected to result in a higher standard of living and less poverty. Kansas City’s greater mobility can be expected to result in greater economic growth and more leisure time for residents.
ABOUT THE AUTHOR
Wendell Cox is principal of Demographia, an international public policy and demographics firm located in the Saint Louis area. He is Senior Fellow for Housing Affordability and Municipal Policy for the Frontier Centre for Public Policy (Canada) and Senior Fellow at the Center for Opportunity Urbanism (Houston). He is also a member of the Board of Advisors at the Center for Demographics and Policy at Chapman University.
Cox is co-author of the “Demographia International Housing Affordability Survey” and author of “Demographia World Urban Areas.” He was appointed to three terms on the Los Angeles County Transportation Commission by Mayor Tom Bradley. He was appointed to the Amtrak Reform Council by Speaker of the House of Representatives Newt Gingrich. He served as a visiting professor at the Conservatoire National des Arts et Metiers, a national university in Paris, and as Vice-President of COTADU, a European organization dedicated to improving mobility in developing-world cities.
He holds a BA in Government from California State University, Los Angeles, and an MBA from Pepperdine University, Los Angeles.
NOTES
1 See Cheshire P, Nathan M, Overman H. Urban Economics and Urban Policy: Challenging Conventional Policy Wisdom, 2015, Edward Elgar.
2 Generally, this report does not focus on differences between submarkets within the Kansas City market.3 The U.S. official poverty rate is not adjusted for cost of liv-ing by metropolitan area. However, the Census Bureau has begun publishing a housing cost–adjusted poverty measure. 4 Metropolitan areas are defined by the U.S. Office of Man-agement and the Budget (OMB). The OMB criteria classify any county with more than 50 percent of its population in an urban area to be a central county. Additional counties (outer counties) are included if at least 25 percent of resi-dent employees work in central counties or if 25 percent of the employees in central counties work in the county (this is the “commuting interchange requirement). See: https://www.whitehouse.gov/sites/default/files/omb/assets/fe-dreg_2010/06282010_metro_standards-Complete.pdf5 There is also another metropolitan area definition. The Kansas City combined statistical area (CSA) includes the Kansas City metropolitan area and adjacent areas. CSA’s are adjacent core-based statistical areas that meet a commuting interchange requirement that is less than that required for counties within metropolitan areas (15 percent as opposed to 25 percent; see above).6 The city reached its peak population density in 1880, at 10,500 per square mile.7 All territory in the United States is classified as either urban or rural. According to the U.S. Census Bureau: “For the 2010 Census, an urban area will comprise a densely settled core of census tracts and/or census blocks that meet minimum popu-lation density requirements, along with adjacent territory containing non-residential urban land uses as well as territory with low population density included to link outlying densely settled territory with the densely settled core. To qualify as an urban area, the territory identified according to criteria must encompass at least 2,500 people, at least 1,500 of which reside outside institutional group quarters.” This classification approach was adopted for the 2000 census. Before that, all territory within incorporated places and “census designated places” was considered urban. The 2000 and 2010 criteria al-low for territory within an incorporated place (such as Kansas City, Missouri) to be either rural or urban, with the distinc-tion made at census block or census tract level using the new criteria. For more information see: https://www.census.gov/geo/reference/ua/urban-rural-2010.html.

November 2016
29
8 2,228 per square mile in the city of Kansas City compared to 2,247 outside the city of Kansas City.9 Based on the author's analysis of 2010 zip code and census tract boundaries. The 1950 census was the first in which the borders of the city had expanded north of the Missouri River into Clay County.10 Core cities with more than 400,000 population in 1950.11 Census Bureau estimates, 2000–2009 and 2010–2014.12 An urban area is the continuous urbanization and excludes rural areas. Economic geographers consider the urban area to be the physical form of the city, and the metropolitan area (which includes economically connected area to the outside), as the economic or functional form of the city. The urban area can also be called a “built-up” urban area or an urban agglom-eration. The U.S. Census Bureau publishes data on urban ar-eas in each decennial census. Demographia World Urban Areas provides data on population, built-up urban land area, and urban population density for all identified urban areas in the world with at least 500,000 population (http://demographia.com/db-worldua.pdf). 13 Calculated from 2010 Census data.14 See Cox W. “From Jurisdictional to Functional Analysis of Urban Cores and Suburbs,” newgeography.com, June 4, 2014. This is preferable for defining functional areas of metropolitan area, as opposed to the use of municipal bound-aries, in which suburban areas are often masked within the boundaries of core municipalities (as is the case in Kansas City, Missouri). 15 From Demographia City Sector Model, based on small areas (zip codes). See: Wendell Cox, “2010–2012: More Modest Dispersion Within Metropolitan Areas,” newgeography.com, December 11, 2015.16 There was a net loss of 7,000 in the other Kansas counties.17 Projections for the eight member counties of the Mid-America Council. 18 Calculated from Bureau of Labor Statistics data.19 The 52 metropolitan areas with more than 1,000,000 resi-dents in 2010.
20 Demographia United States Central Business Districts (Down-towns), http://www.demographia.com/db-cbd2000.pdf, 2014.21 Derived from Mid-America Regional Council data.22 Regional Price Parities from the Bureau of Economic Analysis (U.S. Department of Commerce).23 Metropolitan areas with more than 1,000,000 population.24 Estimated from American Community Survey 2014 data, adjusted for the cost of living using 2013 Regional Price Parities from the U.S. Department of Commerce, Bureau of Economic Analysis. Both calculation sources are the latest data as of this writing.25 “Medians” are used to eliminate the distortions that occur in average data due to very high incomes and house prices.26 This is illustrated by U.S. Department of Commerce Bureau of Economic Analysis data. In 2013, of the cost of living index ranged from 78.0 to 122.5 (difference: 42.5) among the 380 metropolitan areas reported upon (average equals 100 and higher values mean a higher cost of living). In housing, the range was from 48.5 to 194.4 (difference 145.9); in goods, the range was from 91.2 to 112.2 (difference 20.0); and in services, excluding housing, the range was from 88.5 to 120.2 (difference of 31.7). Thus, the difference in hous-ing costs was more than three times that of the overall index, seven times the goods index and more than four times the services index. 27 Census Bureau supplemental poverty measure, https://www.census.gov/content/dam/Census/library/publica-tions/2014/demo/p60-251.pdf. 28 Cox W. A Question of Values: Middle Income Housing Af-fordability and Urban Containment Policy, Frontier Centre for Public Policy, 2015. Available at https://fcpp.org/a_ques-tion_of_values.29 The association between urban growth boundaries and higher house prices can vary substantially based upon admin-istrative practice. For example, if sufficient land is included within the urban growth boundary to maintain the competi-tive land market, there may be little or no increase in house prices relative to incomes. This occurred in Portland in 1980s; however when land became more constrained in the 1990s

SHOW-ME INSTITUTE I ESSAY
30
and sufficient additions to the urban growth boundary were not made, there were substantial housing affordability losses. On the other hand, urban growth boundaries can be associ-ated with substantial house price increases even before they are implemented, as land buyers and sellers anticipate the expected higher prices. This occurred in Seattle and in Mel-bourne, Australia and in other metropolitan areas. See, Cox, A Question of Values.
30 Green RK, Malpezzi S. A Primer on US housing markets and housing policy, The Urban Institute, 2003, p. 146. 31 Calculated from the U.S. Census Bureau, Harvard Joint Housing Center, and Demographia data. 32 12th Annual Demographia International Housing Affordabil-ity Survey, 2016. Available at http://www.demographia.com/dhi.pdf.33 12th Annual Demographia International Housing Afford-ability Survey, http://www.demographia.com/dhi.pdf. The Demographia Survey is the most comprehensive international comparison of housing affordability at the metropolitan area level.34 See: Hsieh CT, Moretti E. “Why Do Cities Matter? Lo-cal Growth and Aggregate Growth.” The National Bureau of Economic Research. May 2015. Available at http://www.nber.org/papers/w21154; and Ganong P, Shoag D. “Why Has Regional Income Convergence in the U.S. Declined?” HKS Working Paper No. RWP12-028, 2013. Available at http://papers.ssrn.com/sol3/Delivery.cfm/SSRN_ID2241069_code1638787.pdf?abstractid=2081216&mirid=5. 35 Sundstrom L. A generation of young people may leave Vancouver because they can’t afford to stay: poll, February 16, 2016, http://www.vancitybuzz.com/2016/02/young-vancou-verites-might-leave-angus-reid-poll/36 De Graaf M. Forget New York... millennials are moving to FLORIDA! Young people flock to cheaper southern states if they want to buy a home, March 3, 2016, http://www.dailymail.co.uk/news/article-3475362/Forget-New-York-millennials-moving-FLORIDA-Young-people-flock-cheaper-southern-states-want-buy-home.html37 Hethcock B. “Here’s the main reason Toyota is moving from California to Texas,” Dallas Business Journal, December 11, 2015. http://www.bizjournals.com/dallas/blog/2015/12/heres-the-main-reason-toyota-is-moving-from.html.
38 Hsieh CT, Moretti E. “Why Do Cities Matter? Local Growth and Aggregate Growth,” The National Bureau of Economic Research, May 2015. Available at http://www.nber.org/papers/w21154.
39 Rognlie M. “A Note on Piketty and Diminishing Returns to Capital,” June 15, 2014. Available at http://www.mit.edu/~mrognlie/piketty_diminishing_returns.pdf.40 Furman J. Barriers to Shared Growth: The Case of Land Use Regulation and Economic Rents, Address to the Urban Insti-tute, November 20, 2016. Available at https://www.white-house.gov/sites/default/files/page/files/20151120_barriers_shared_growth_land_use_regulation_and_economic_rents.pdf.41 See Cheshire P, Nathan M, Overman H. Urban Economics and Urban Policy: Challenging Conventional Policy Wisdom, 2015, Edward Elgar. 42 Cox W. “Best and Worst: 2015 International Housing Affordability, newgeography.com, January 25, 2016. Available at http://www.newgeography.com/content/005154-best-and-worst-2015-international-housing-affordability.43 Kansas City was tied with three other metropolitan areas, Atlanta, Louisville, and Indianapolis. 44 Demographia, 12th Annual Demographia International Housing Affordability Survey (2016). Available at http://www.demographia.com/dhi.pdf. The Demographia Survey is the most comprehensive international comparison of housing affordability at the metropolitan area level.45 Cox W. A Question of Values: Middle Income Housing Af-fordability and Urban Containment Policy, Frontier Centre for Public Policy, 2015. Available at https://fcpp.org/a_ques-tion_of_values, 2015.46 Portland’s housing affordability losses appear to have been moderated by the less restrictive land use polices existing in the state of Washington portion of the metropolitan area (see Jun M-J. “The Effects of Portland’s Urban Growth Boundary on Housing Prices,” Journal of the American Planning Associa-tion Vol. 72, Issue 2 [2006]).47 12th Annual Demographia International Housing Affordabil-ity Survey, 2016. Available at http://www.demographia.com/dhi.pdf.

November 2016
31
48 Standard poverty rates in the United States are not adjusted for the cost of living. 49 Assumes a 10 percent down payment. Qualifying income data is from the National Association of Realtors. The median household income data is as estimated in the 12th Annual Demographia International Housing Affordability Survey, based on American Community Survey data.50 It has been suggested that metropolitan areas like Kansas City have better housing affordability because of the large supply of flat land that extends well beyond the urban fringe. In fact, there are sufficiently large supplies of developable land in areas perceived to be geographically constrained, such as the San Francisco area. Further, the highly regulated Fresno, California, area (which will soon reach the 1,000,000 popula-tion threshold), with fringe land supplies at least as great as Kansas City, has a median multiple of 5.0 (well above that of Kansas City). 51 An extreme example can be seen in highly regulated Van-couver, which experienced a detached house average price increase of more than C$400,000 in just five months (from C$1,409,000 to C$1,816,000), according to data from the Real Estate Board of Metro Vancouver (September 2015 to February 2016), http://www.rebgv.org/monthly-reports?month=February&year=201652 Prud’homme R, Lee C. (1998), “Size, Sprawl, Speed, and the Efficiency of Cities,” Obervatoire de l’économic et des In-stitutions Locals; Hartgen D T, Fields G. “Accessibility, Traffic Congestion and Regional Economic Performance,” Reason Foundation, 2009. Available at http://reason.org/news/show/gridlock-and-growth-the-effect.53 Cox W. “Urban Travel and Urban Population Density.” Journeys. November, 2012. Available at http://www.lta.gov.sg/ltaacademy/doc/J12%20Nov-p19Cox_Urban%20Travel%20and%20Urban%20Population%20Density.pdf. 54 FHWA (Federal Highway Administration) urban area. These urban areas are different from urban areas as defined by the U.S. Census Bureau. They are usually somewhat larger in land area and population.55 Calculated from Table HM-72, Federal Highway Adminis-tration, Highway Statistics 2013.
56 Tom Tom Traffic Congestion Index. Available at https://www.tomtom.com/en_gb/trafficindex/.
57 Richmond’s housing affordability was considerably worse than that of Kansas City, with a median multiple of 3.7, nearly 30 percent more costly relative to incomes as Kansas City’s 2.9.58 Texas A&M Transportation Institute, Annual Mobility Index. Available at http://mobility.tamu.edu/ums/.59 Percentage of workers using transit for the work trip.60 Cox W. “Evaluating Urban Rail,” newgeography.com, De-cember 5, 2014. 61 Cox W. Improving the Competitiveness of Metropolitan Areas, Frontier Centre for Public Policy, 2012.Available at http://archive.fcpp.org/files/1/PS135_Transit_MY15F3.pdf.62 Cox W. “Urban Travel and Urban Population Density.” 63 Cox W. “Evaluating Urban Rail,” newgeography.com, De-cember 5, 2014. 64 Derived from U.S. Census Bureau data.65 Calculated from U.S. Census Bureau data. 66 Workers earning $15,000 or less annually in 2013. 67 San Francisco has the best employment access in 30 min-utes, at 3.4 percent. Salt Lake City has the highest 60 minute job access share for the average employee, at 14.5 percent.68 Thoreau Institute, “How Much Has New Rail Transit Cost?” Available at http://ti.org/RailCapitalCost.pdf. Con-verted from 2009 to 2015$. 69 Cox W. “Evaluating Urban Rail,” newgeography.com, De-cember 5, 2014. 70 Northpoint Development and BNSF Railway, Kansas City: The Crossroads of Connectivity. Available at http://www.logisticsparkkc.com/wp-content/uploads/2013/03/BNSF.LPKCKansasCity8.5x11.FINAL_.pdf71 Facility website: http://www.edgertonks.org/BNSF/ 72 Facility website: http://www.grandview.org/index.aspx?page=462 73 Facility website: http://kcilogistics.com/74 (http://www.bizjournals.com/kansascity/news/2016/03/24/amazon-fulfillment-center-edgerton.html).

SHOW-ME INSTITUTE I ESSAY
32
75 “The World’s Most Livable Cities,” The Economist, August 18, 2015, http://www.economist.com/blogs/graphicde-tail/2015/08/daily-chart-5.76 Comparable housing affordability data is not available for Vienna, Zurich, or Helsinki. However, a review of national and international housing websites makes it clear that house prices are far higher in each of these metropolitan areas than in Kansas City (based on a comparison of costs per square foot). Websites consulted: Global Property Guide (http://www.globalpropertyguide.com/) and Statistics Finland. Available at http://pxnet2.stat.fi/PXWeb/pxweb/en/StatFin/StatFin__asu__ashi/254_ashi_tau_204.px/?rxid=4580eebb-2897-44e5-9d18-65ad3f40ad85.77 U.S. metropolitan areas rank particularly well in produc-tivity. Brookings Institution data indicate that 37 of the 50 most productive metropolitan areas in the world were in the United States in 2014. See: Wendell Cox, “10 most affluent cities in the aorld: Macau and Hartford top the list,” Febru-ary 21, 2015. Available at: http://www.newgeography.com/content/004853-10-most-affluent-cities-world-macau-and-hartford-top-list/.78 Kotkin J, Cox W, Schill M, Modarres A. Building Cities for People, Chapman University Center for Demographics and Policy, 2015. Available at http://www.chapman.edu/wilkin-son/_files/CitiesforPeople%201.pdf.79 Cox W. “Flocking Elsewhere: The Downtown Growth Story,” newgeography.com, October 1, 2012. 80 Derived from Demographia City Sector Model. 81 “2015 Best and Worst State Rankings,” Chief Executive. Available at http://chiefexecutive.net/best-worst-states-busi-ness/82 Vranich J. California Business Departures: An Eight-Year Business Review 2008-2015, Spectrum Business Solutions, 2016. Available at http://www.spectrumlocationsolutions.com/pdf/Businesses-Leave-California-.pdf.83 Metropolitan divisions.84 Portions of metropolitan areas.85 DeVol R, Ratnatunga M, Bedroussian A. 2014 Best Per-forming Cities, Millkin Institute, 2015. Available at http://www.best-cities.org/2014/best-performing-cities-report-2014.pdf
86 This assumes that the highest ranking sub-metropolitan area (metropolitan district) in a metropolitan area would be generally representative of the overall metropolitan area. 87 Walczek J, Drenkard S, Henchman J. http://taxfoundation.org/article/2016-state-business-tax-climate-index.
88 “2015 Best and Worst State Rankings,” Chief Executive. Available at http://chiefexecutive.net/best-worst-states-busi-ness/89 Based on projections by the Mid-America Council.90 Miller J. “The Comparative Expense of the Proposed New Terminal Plan for Kansas City International Airport,” Show-Me Institute, July 16, 2014, http://showmeinstitute.org/publication/taxes-income-earnings/comparative-expense-proposed-new-terminal-plan-kansas-city91 Professor Rothengatter served as president of the World Conference on Transport Research Society (WCTRS). 92 Flyvbjerg B, Bruzelius N, Rothengatter W. Megaprojects and Risk: An Anatomy of Ambition, (Cambridge, UK: Cambridge University Press, 2003).93 Flyvbjerg B., Holm MS, and Bent SL. “How Common and How Large Are Cost Overruns in Transport Infrastructure Projects,” Transport Reviews 23 (2003), pp. 71-88.94 Vockrodt S. “Kansas City Wants to Keep a Convention Center Consultant’s Report Buried, Pitch News, August 11, 2015. Available at http://www.pitch.com/kansascity/kansas-city-wants-to-keep-a-convention-center-consultants-report-buried/Content?oid=5426824&showFullText=true . 95 Tuohey P. “The Conventional Center Deal May Cost Kansas City Conventions,” Show-Me Institute, November 12, 2015. Available at http://showmeinstitute.org/blog/corporate-welfare/convention-hotel-deal-may-cost-kansas-city-conventions.96 Steve Vockrodt, “Kansas City Wants to Keep a Convention Center Consultant’s Report Buried, Pitch News, August 11, 2015. Available at http://www.pitch.com/kansascity/kansas-city-wants-to-keep-a-convention-center-consultants-report-buried/Content?oid=5426824&showFullText=true 97 Robertson J. “Kansas City School District Gains Provision-al Accreditation, The Kansas City Star, August 6, 2014. Avail-able at http://www.kansascity.com/news/politics-government/article1158397.html.

November 2016
33
98 Niche, https://k12.niche.com/rankings/public-school-districts/best-overall/m/kansas-city-metro-area/99 Haslag JH. “How an Earnings Tax Harms Cities Like St. Louis and Kansas City,” Show-Me Institute, March 8, 2006. Available at http://showmeinstitute.org/sites/default/files/200704111_smi_study_1_0.pdf. 100 See Ishmael P. “Is Kansas City a Low Tax City?” Show-Me Institute, September 11, 2013, http://showmeinstitute.org/blog/local-government/kansas-city-low-tax-city.101 Golem R, Smith-Heimer J. Relationships between Streetcars and the Built Environment, Transportation Research Board, 2010. Available at http://onlinepubs.trb.org/onlinepubs/tcrp/tcrp_syn_86.pdf.
102 Ibid.103 Ibid.104 Portland Development Commission, 2014-2015 Budget. Available at http://www.pdc.us/Libraries/Budget/PDC_Ad-opted_Budget_-_FY_2014-15_pdf.sflb.ashx, p. 16.
105 Golem R, Smith-Heimer J. Relationships between Streetcars and the Built Environment, Transportation Research Board, 2010. Available at http://onlinepubs.trb.org/onlinepubs/tcrp/tcrp_syn_86.pdf.106 Horsely L. “KC streetcar plan: pricey transit or economic magnet?,” The Kansas City Star, October 22, 2012. Available at
http://www.kansascity.com/latest-news/article310017/KC-streetcar-plan-pricey-transit-or-economic-magnet.html107 Lachman ML, Brett DL. Gen Y and Housing: What They Want and Where They Want It, Urban Land Institute, 2015. Available at http://uli.org/wp-content/uploads/ULI-Docu-ments/Gen-Y-and-Housing.pdf.108 Cox W. “Urban Core Millennials, A Matter of Perspec-tive,” newgeography.com, March 6, 2015. 109 Casselman B. “Think Millennials Prefer the City, Think Again,” fivethirtyeight.com, March 20, 2015. Available at http://fivethirtyeight.com/datalab/think-millennials-prefer-the-city-think-again/
110 “Smart growth” (and “growth management, etc.) is a broad title used principally in the United States to denote the restric-tive land use policies identified in Sections 3.11 to 3.14, As is noted there, some policies, especially urban growth boundar-ies and similar strategies have been identified with huge losses in housing affordability. These policies are overwhelmingly supported by the urban planning profession, around the world. For example, the federal government has programs to encourage adoption of “smart growth” strategies at the metropolitan and local area level. These include financial incentives (https://www.epa.gov/smartgrowth). The American Planning Association also endorses smart growth: see Ameri-can Planning Association, Policy Guide on Smart Growth, April 14, 2014, https://www.planning.org/policy/guides/pdf/smartgrowth.pdf. The ongoing campaign to implement smart growth is detailed in Wendell Cox and Adrian Moore, Urban Containment: The Social and Economic Consequences of Limiting Housing and Travel Options, Reason Foundation, March 2016. Available at http://reason.org/news/show/urban-containment-the-social-travel.

SHOW-ME INSTITUTE I ESSAY
34
Table 1: City Sector Model (2015) Criteria
City Sector and Relationship to city Criteria 1 Criteria 2
Pre-WW2 urban core: downtown
(urban core-CBD) (in physical and functional
city)
Employment density >19,999 per
square mile
Pre-WW2 urban core: outside downtown
(urban core-inner ring) (in physical and functional
city)
In principal urban area (and) population density >7,499 density per square mile (and) transit, walk, and bike
share>19.9%
(or) In principal urban area
(and) median year house built
before 1946
Post-WW2 Suburban: earlier (earlier suburb) (in physical
and functional city)
Not urban core (and) not exurb
(and) Median year house built before 1980
Post-WW2 Suburban: later (later suburb) (in physical and
functional city)
Not urban core (and) not exurb
(and) Median year house built after 1979
Exurban (exurb) (in physical and functional
city)
Outside 2010 principal urban area (largest urban area in the metropolitan area
(or) Under 250 density per square mile
Source: www.demographia.com/db-citysectormodel.pdf.
APPENDIX –TABLES

November 2016
35
Table 2: Household Incomes and Cost of Living: 2014 (Major Metropolitan Areas)
Sources: American Community Survey and Bureau of Economic Analysis.
1234567891011121314151617181920212223242526272829303132333435363738394041424344454647484950515253
San Jose, CAWashington, DC-VA-MD-WVSan Francisco-Oakland, CAHartford, CTBoston, MA-NHMinneapolis-St. Paul, MN-WISeattle, WABaltimore, MDRaleigh, NCAustin, TXDenver, CORichmond, VASalt Lake City, UTSt. Louis, MO-ILCincinnati, OH-KY-INKansas City, MO-KSColumbus, OHPortland, OR-WAHouston, TXVirginia Beach-Norfolk, VA-NCDallas-Fort Worth, TXAtlanta, GASacramento, CAGrand Rapids, MIChicago, IL-IN-WIPhiladelphia, PA-NJ-DE-MDCharlotte, NC-SCOklahoma City, OKSan Diego, CAProvidence, RI-MANashville, TNSan Antonio, TXMilwaukee, WIIndianapolis. INLouisville, KY-INCleveland, OHPittsburgh, PANew York, NY-NJ-PAPhoenix, AZDetroit, MIBu�alo, NYJacksonville, FLRochester, NYBirmingham, ALLas Vegas, NVRiverside-San Bernardino, CALos Angeles, CAMemphis, TN-MS-AROrlando, FLNew Orleans. LATucson, AZTampa-St. Petersburg, FLMiami, FL
$79,539 $76,121 $69,179 $68,259 $68,230 $67,294 $66,548 $65,718 $65,181 $64,441 $63,807 $63,343 $62,830 $61,912 $61,579 $60,826 $60,290 $59,829 $59,714 $59,586 $59,058 $58,998 $58,494 $58,214 $57,784 $57,619 $57,333 $56,666 $56,286 $56,230 $56,119 $55,993 $55,845 $55,842 $55,785 $55,742 $55,513 $54,837 $54,123 $53,807 $53,384 $53,191 $52,558 $52,273 $51,627 $51,496 $51,414 $49,776 $49,305 $48,632 $47,128 $47,112 $46,063
121.3119.8120.3100.4110.9102.7107.1108.895.698.7104.896.299.789.790.593.793.5100.7100.698.8100.895.2102.693.4106.6107.993.492.5117.699.393.894.195.293.691.389.594.2122.398.697.593.896.197.29099.2106117.792.197.996.297.399.5105.2
2432071510835261432215250424418192517361645119454762340393643495338127294034315124125482832302213
$96,481 $91,193 $83,222 $68,532 $75,667 $69,111 $71,273 $71,501 $62,313 $63,603 $66,870 $60,936 $62,642 $55,535 $55,729 $56,994 $56,371 $60,248 $60,072 $58,871 $59,530 $56,166 $60,015 $54,372 $61,598 $62,171 $53,549 $52,416 $66,192 $55,836 $52,640 $52,689 $53,164 $52,268 $50,932 $49,889 $52,293 $67,066 $53,365 $52,462 $50,074 $51,117 $51,086 $47,046 $51,214 $54,586 $60,514 $45,844 $48,270 $46,784 $45,856 $46,876 $48,458
1238476514121017132928242519202322262131161532381127363534404446399333745424349413018534851525047
RankMetropolitan
Area
Median HouseholdIncome: Cost ofLiving Adjusted
Cost ofLivingIndex Rank Rank
Median Household
Income: Nominal
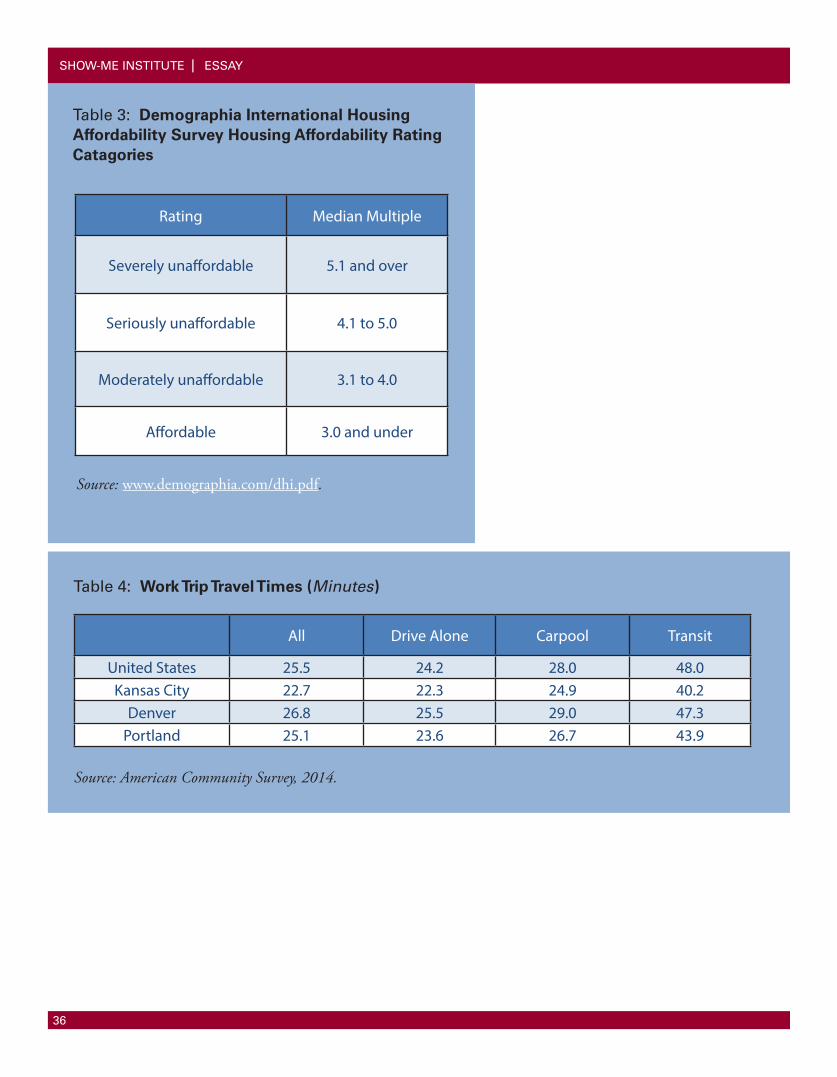
SHOW-ME INSTITUTE I ESSAY
36
Table 3: Demographia International Housing Affordability Survey Housing Affordability Rating Catagories
Rating Median Multiple
Severely unaffordable 5.1 and over
Seriously unaffordable 4.1 to 5.0
Moderately unaffordable 3.1 to 4.0
Affordable 3.0 and under
Source: www.demographia.com/dhi.pdf.
Table 4: Work Trip Travel Times (Minutes)
All Drive Alone Carpool Transit
United States 25.5 24.2 28.0 48.0Kansas City 22.7 22.3 24.9 40.2
Denver 26.8 25.5 29.0 47.3Portland 25.1 23.6 26.7 43.9
Source: American Community Survey, 2014.

November 2016
37
Table 5: Kansas City and the World's Most Livable Cities: Housing Affordability
Rank Metropolitan Area Housing Affordability (Median Multiple): 2015
The Economist Livability ranking
1 Kansas City 2.9 Not Rated2 Calgary 4.2 53 Adelaide 6.4 54 Perth 6.6 85 Toronto 6.7 46 Melbourne 9.7 16 Auckland 9.7 98 Vancouver 10.8 39 Sydney 12.2 7* Vienna Note 2* Helsinki Note 10* Zurich Note 10
Source: Data from 12th Annual Demographia International Housing Affordability Survey. *Vienna, Helsinki and Zurich are less affordable than Kansas City. See text, and also footnote 76.
Table 6: Kansas City and the World's Most Livable Cities: Traffic Congestion
Rank Metropolitan Area Time Lost in Traffic Congestion: 2015
The Economist Livability ranking
1 Kansas City 11% Not Rated2 Calgary 22% 52 Helsinki 22% 104 Adelaide 25% 55 Perth 27% 86 Melbourne 28% 17 Vienna 29% 28 Zurich 30% 109 Toronto 31% 4
10 Auckland 32% 911 Vancouver 35% 311 Sydney 35% 7
Source: Data from Tom Tom Traffic Congestion Scorecard 2014.

SHOW-ME INSTITUTE I ESSAY
38
Table 7: Kansas City and the World's Most Livable Cities: Gross Domestic Product per Capita (PPP)
Rank Metropolitan AreaGross Domestic Product Per
Capita (Purchasing Power Adjusted): 2014
The Economist Livability Ranking
1 Calgary $69,826 52 Perth $65,651 83 Zurich $56,666 104 Kansas City $51,157 Not rated5 Vienna $48,546 26 Helsinki $47,547 107 Sydney $46,344 78 Toronto $45,771 49 Vancouver $44,337 3
10 Melbourne $40,244 111 Adelaide $36,217 512 Auckland $31,766 9
Source: Data from Brookings Global Metro Monitor 2015 (Brookings Institution).

November 2016
39
NOTES

5297 Washington Place I Saint Louis, MO 63108 I 314-454-0647
Visit Us:
showmeinstitute.org
Find Us on Facebook:
facebook.com/showmeinstitute
Follow Us on Twitter:
twitter.com/showme
3645 Troost Avenue I Kansas City, MO 64109 I 816-561-1777