kanbur, s.m., ngeow, c., nikolaev, s., tanvir, n.r. …eprints.gla.ac.uk/1613/1/1613.pdf · s. m....
TRANSCRIPT
Kanbur, S.M., Ngeow, C., Nikolaev, S., Tanvir, N.R. and Hendry, M.A. (2003) The extra-galactic Cepheid distance scale from LMC and Galactic period-luminosity relations. Astronomy and Astrophysics, 411 (3). 361 -379. ISSN 0004-6361 http://eprints.gla.ac.uk/1613/
Deposited on: 14 February 2012
Enlighten – Research publications by members of the University of Glasgow http://eprints.gla.ac.uk
A&A 411, 361–379 (2003)DOI: 10.1051/0004-6361:20031373c© ESO 2003
Astronomy&
Astrophysics
The extra-galactic Cepheid distance scale from LMCand Galactic period-luminosity relations ?
S. M. Kanbur1, C. Ngeow1, S. Nikolaev2, N. R. Tanvir3, and M. A. Hendry4
1 Astronomy Department, University of Massachusetts, Amherst, MA 01003, USA2 Institute for Geophysics and Planetary Physics, Lawrence Livermore National Laboratory, Livermore, CA 94550, USA3 Department of Physical Science, University of Hertfordshire, College Lane, Hatfield, AL10 9AB, UK4 Department of Physics and Astronomy, University of Glasgow, Glasgow G12 8QQ, UK
Received 6 May 2003/ Accepted 4 September 2003
Abstract. In this paper, we recalibrate the Cepheid distance to some nearby galaxies observed by theHSTKey Project and theSandage-Tammann-Saha group. We use much of the Key Project methodology in our analysis but apply new techniques, basedon Fourier methods to estimate the mean of a sparsely sampled Cepheid light curve, to published extra-galactic Cepheid data.We also apply different calibrating PL relations to estimate Cepheid distances, and investigate the sensitivity of the distancemoduli to the adopted calibrating PL relation. We re-determine the OGLE LMC PL relations using a more conservative approachand also study the effect of using Galactic PL relations on the distance scale.For the Key Project galaxies after accounting for charge transfer effects, we find good agreement with an average discrepancyof –0.002 and 0.075 mag when using the LMC and Galaxy, respectively, as a calibrating PL relation. For NGC 4258 which hasa geometric distance of 29.28 mag, we find a distance modulus of 29.44±0.06(random) mag, after correcting for metallicity. Inaddition we have calculated the Cepheid distance to 8 galaxies observed by the Sandage-Tammann-Saha group and find shorterdistance moduli by−0.178 mag (mainly due to the use of different LMC PL relations) and−0.108 mag on average again whenusing the LMC and Galaxy, respectively, as a calibrating PL relation. However care must be taken to extrapolate these changeddistances to changes in the resulting values of the Hubble constant because STS also use distances to NGC 3368 and 4414and because STS calibration of SN Ia is often decoupled from the distance to the host galaxy through their use of differentialextinction arguments. We also calculate the distance to all these galaxies using PL relations at maximum light and find verygood agreement with mean light PL distances.However, after correcting for metallicity effects, the difference between the distance moduli obtained using the two sets ofcalibrating PL relations becomes negligible. This suggests that Cepheids in the LMC and Galaxy do follow different PL relationsand constrains the sign for the coefficient of the metallicity correction,γ, to be negative, at least at the median period log(P) ≈1.4, of the target galaxies.
Key words. galaxies: distances and redshifts – galaxies: Magellanic Clouds – stars: variables: Cepheids
1. Introduction
The extra-galactic distance scale is one of the key prob-lems in modern astronomy. One of the basic parts of thesolution is the correlation between period and mean lumi-nosity (PL) obeyed by classical Cepheids. The Hubble SpaceTelescope (HST) H0 Key Project (Freedman et al. 2001,hereafter KP) has used Cepheids (discovered either by ground-based telescopes or byHST) in 31 spiral galaxies, with 18 of
Send offprint requests to: S. Kanbur,e-mail:[email protected]? Full Table 1 is available in electronic form at the CDS via
anonymous ftp tocdsarc.u-strasbg.fr (130.79.128.5) or viahttp://cdsweb.u-strasbg.fr/cgi-bin/qcat?J/A+A/411/361
them observed originally by KP, and the PL relation to estimatethe distances to these galaxies. These distances were then usedin turn to calibrate a host of secondary distance indicators andhence estimate Hubble’s constant. In parallel with this a teamled by Sandage et al. (Saha et al. 2001b, hereafter STS) hasused theHSTto discover Cepheids in spiral galaxies which hosttype Ia supernovae. Cepheid distances to these galaxies wereused to calibrate the Hubble diagram for type Ia supernovaeand hence estimate Hubble’s constant.
Though both groups used mostlyHSTobservations to dis-cover the Cepheids and similar methodologies, the KP teamfavor a short distance scale and a larger value ofH0 (72 ±8 km s−1 Mpc−1, Freedman et al. 2001) whilst the STS groupfavor a long distance scale and smaller value ofH0 (58.7 ±6.3 km s−1 Mpc−1, Saha et al. 2001b). The discrepancy in the
Article published by EDP Sciences and available at http://www.aanda.org or http://dx.doi.org/10.1051/0004-6361:20031373
362 S. M. Kanbur et al.: Cepheid distance from LMC and Galactic PL relations
value of the Hubble constant from these two groups is stillunresolved (e.g., see Hendry & Kanbur 1996; Beaulieu et al.1997; Kochanek 1997; Sasselov et al. 1997; Tanvir et al. 1999;Caputo et al. 2000; Gibson et al. 2000; Gibson & Stetson 2001).It is due only in part to the Cepheid distance scale. We note thatthe recent WMAP results (Spergel et al. 2003) find a Hubbleconstant very similar to the value obtained by KP. Neverthelessit is still very instructive to discover the reason behind the dis-crepancies in the Cepheid distance scale from the STS and KPgroups. A proper understanding of the Cepheid PL relationin this regard is very important for an accurate local distancescale. In this paper we concentrate on recalibrating the Cepheiddistance to the target galaxies in both KP and STS groups withexisting data because of the following factors:
1. HST Cepheid data is sparsely sampled with typically 12and 4 points per Cepheid in theV and I band respectively(see Sect. 2 for details). In order to apply the Cepheid PL re-lations, it is necessary to estimate the mean magnitudesfrom these data in bothV andI bands. In this paper, we usethe techniques of Fourier expansion and interrelations toestimate theV andI mean magnitudes from sparsely popu-lated light curves. These techniques are described in detailin Ngeow et al. (2003).
2. We re-analyze the OGLE (Optical Gravitational LensingExperiment) LMC Cepheids (Udalski et al. 1999a) on thebasis of the quality of theirV band light curve, and developmore conservative LMC PL relations based on this analysisand investigate the sensitivity of extra-galactic Cepheid dis-tances to the LMC PL relation. This approach is differentto the “sigma-clipping” methods currently used by Udalskiet al. (1999a).
3. The average value of metallicities, defined as 12+log(O/H), in target galaxies is about 8.84 ± 0.31 dex(Freedman et al. 2001). This value is closer to the stan-dard Solar value of 8.87± 0.07 dex (Grevesse et al. 1996)than the LMC value of 8.50± 0.08 dex (see reference inFerrarese et al. 2000). Therefore, another approach is to useGalactic Cepheid PL relations as fundamental calibratingrelations (Feast 2001, 2003; Tammann 2003; Thim et al.2003; Fouqu´e et al. 2003). We compare the distances ob-tained when using both the LMC and Galactic PL relations.
4. Kanbur & Hendry (1996) building on the hydrodynamicalmodels of Simon et al. (1993) suggested that PL relationsat maximum light may be more accurate than PL(mean)relations. To test this idea, we compute distances usingPL(max) relations and compare with their mean light coun-terparts.
In Sect. 2 we summarize the photometric data used in thisstudy. In Sect. 3 we present and discuss the methodology usedin determining Cepheid distances, including obtaining theVandI band means and applying different PL relations. The re-sults will be presented in Sect. 4. The conclusion and the dis-cussion will be presented in Sect. 5.
2. The photometric data
The photometry data for the Cepheids in each target galaxywere directly obtained from the corresponding published pa-pers. We emphasize that we did not repeat the photometric re-duction from raw data. The target galaxies that are selectedin this study include: 16 KP galaxies, 8 STS galaxies andNGC 4258, which has an accurate geometrical distance mea-surement from water maser studies (Herrnstein et al. 1999,hereafter WM galaxy). The photometric data of 16 KP galaxieswere directly downloaded from the KP web-page1, excludingNGC 1425 (the data is not available at the time of analysis) andNGC 5457 (M101, as the observations to this galaxy includeits outer field (Kelson et al. 1996) and inner field (Stetson et al.1998b), which complicated the analysis). The photometric datafor the STS and WM galaxies were taken from the STS papers(see Saha et al. 2001b for references for each target galaxy)2
and Newman et al. (2001), respectively. The list of the targetgalaxies can be obtained from Table 4.
There are two major photometry reduction packages usedin reducing the data for these galaxies, the ALLFRAME(Stetson 1994, 1996) and a variant of the DoPHOT (Schechteret al. 1993; Saha et al. 1996) package. The KP team utilizedboth packages as a double-blind reduction process (Kennicuttet al. 1995; Freedman et al. 2001) to check the consistency be-tween the two packages. However, the final, adopted distancemoduli are based on ALLFRAME results (Freedman et al.2001). Inter-comparison of the results from these two pack-ages (galaxy-by-galaxy basis) show good agreement betweenthe two (see the KP papers for more details and Hill et al.1998). We also use the ALLFRAME photometric data down-loaded from their web-page (if available). However, the pho-tometric data for NGC 2541 and NGC 4321 are only avail-able in DoPHOT from the same web-page. Similarly, onlythe DoPHOT photometric data is available for WM galaxy,although the photometry reductions were carried out by bothpackages (Newman et al. 2001).
In contrast, the photometric data for the STS galaxieswere reduced mainly with DoPHOT, although some of thegalaxies also used an additional reduction package to checkthe DoPHOT results (e.g., reduction of NGC 4527 includedthe ROMAFOT package, see Saha et al. 2001a). Nevertheless,the available data for all STS galaxies are from the DoPHOTpackage. Although the KP team has reanalyzed the STS galax-ies with the ALLFRAME package (Gibson et al. 2000; Gibson& Stetson 2001; Stetson & Gibson 2001; Freedman et al.2001), these data are not yet available from the KP web-page(as claimed in these papers). However, most, but not all, of theCepheids are common in both STS and KP results (Gibsonet al. 2000). Hence, we only can use the DoPHOT results inour analysis of STS galaxies.
1 The URL ishttp://www.ipac.caltech.edu/H0kp/H0KeyProj.html. The reference to each KP galaxies also listed inthis URL.
2 We exclude NGC 3368 (Tanvir et al. 1999) because it’s not part ofthe STS program, and we are not calibrating the SN Ia distance in thispaper.
S. M. Kanbur et al.: Cepheid distance from LMC and Galactic PL relations 363
The next steps in the photometric reduction process are aCepheid search and period determination. Each reduction pack-age has its own algorithms to perform the period search, and theresults generally agree well. We use published Cepheid dataand periods in our analysis.
TheHSTobservations of the target galaxies generally con-sist of 24V band and 8I band cosmic-ray (CR) split images.The analysis of DoPHOT and ALLFRAME treat these imagesdifferently to deal with the cosmic-ray and point-spread func-tions. However, most of the published photometry combinedthe back-to-back CR split images together and tabulated theaveraged 12V band and 4I band data points. Therefore, weonly can use these (reduced) photometric data points to recon-struct the light curves and obtain the mean magnitudes by theFourier techniques described in the next section.
3. General methodology and analysis
The physical basis of Cepheid PL relations and their usage indetermining the distance have been covered extensively in theliterature (e.g., see Sandage & Tammann 1968; Feast & Walker1987; Madore & Freedman 1991; Freedman et al. 2001) andwould not be repeated here, only a brief description will be pre-sented. The application of the Cepheid PL relation to estimatedistances involves the discovery and appropriate observation ofCepheids sufficient to estimate their periods (in days) and meanmagnitudes. In order to correct for the extinction/reddening,observations of extra-galactic Cepheids byHSTare normallytaken in bandpassesV and I . The PL relation in bandpassλcan be expressed as:Mλ = aλ log(P) + bλ, wherea andb arethe slope and zero-point, respectively. For the measurement ofthe apparent mean magnitudes of Cepheids in a target galaxy,< mλ >, the distance modulus in bandpassλ is:
µλ =< mλ > −aλ log(P) − bλ.
Sinceµ0 = µV − AV = µI − AI , the reddening-free distancemodulus, or the Wessenheit function (Madore 1982; Moffett &Barnes 1986; Madore & Freedman 1991; Tanvir 1999), can bederived as:
µ0 = µV − R(µV − µI ), (1)
whereR ≡ AV/E(V − I ) is the ratio of total-to-selective ab-sorption. Following KP, we adoptR= 2.45 from Cardelli et al.(1989). Note that the validity of Eq. (1) is based on the assump-tion that there are no correlated measurement errors in theVandI bandpasses. Then any differences in theV andI band dis-tance moduli are due to differential reddening (see Saha et al.1996, 2001b for details).
After applying a period cut to the short period Cepheids intarget galaxies (to avoid the incompleteness bias at the faint-end of observations, see Sandage 1988; Lanoix et al. 1999a;Freedman et al. 2001), an unweighted mean of apparent dis-tance moduli to the remaining Cepheids is adopted as the dis-tance modulus to the target galaxy. The random (or statistical)error associated with Eq. (1) can be calculated via the standardformulae (i.e.σ/
√N). The reasons for taking the unweighted
mean are: (a) the photometric errors of the mean magnitudes
are smaller than the expected width of the instability strip, andare, together with other systematic errors, the dominant part ofthe weight in a weighted mean (Leonard et al. 2003); (b) this isequivalent to the fitting scheme used by KP; and (c) it can beeasily incorporated with the weighting scheme adopted by theSTS group (Tanvir 1997). Finally, due to the possible metallic-ity dependence of the Cepheid PL relation (see the discussionsand reference in, e.g., Kennicutt et al. 1998; Freedman et al.2001), metallicity corrections are added to Eq. (1):
µz = µ0 + δz, (2)
whereδz = γ([O/H]ref − [O/H]gal) with the usual definition of[O/H] ≡ 12+ log(O/H). The reference metallicity, [O/H]ref, is8.50 dex and 8.87 dex for using LMC and Galactic PL relations,respectively. Some published values ofγ range from−0.88±0.16 and−0.56 ± 0.20 (Gould 1994),−0.44+0.10
−0.20 (Beaulieuet al. 1997; Sasselov et al. 1997),−0.4 ± 0.2 (Kochanek1997),−0.32± 0.21 (Freedman & Madore 1990),−0.24± 0.16(Kennicutt et al. 1998) to 0.27 (Caputo et al. 2000). Notethat the value ofγ is method-dependent, i.e. it depends onthe bandpasses and calibrating PL relation adopted. For ex-ample, strictly speaking the metallicity dependence quoted inKennicutt et al. (1998) is only applicable when the Madore &Freedman (1991) PL relation is used, and then only for theVandI bandpasses. Although there is some debate on the valuefor γ (see Freedman et al. 2001; Tammann et al. 2001 for de-tails), we adoptγ ≡ γV,I = −0.2 ± 0.2 mag dex−1 as in KP,who note that this value is in the middle of a number of dif-ferent determinations ofγ. Changes in metallicity affect themean brightness of a Cepheid and the papers quoted abovewere aimed at quantifying this brightness shift due to metal-licity. However, we now know that the Cepheid PL relationhas a different slope in the Galaxy and LMC, and indeed mayhave two different slopes in the LMC itself. Thus it may be thatmetallicity affects not only the mean brightness of a Cepheidbut also the way that mean brightness changes with period (theslope of the PL relation). We discuss this and its implicationsfor metallicity corrections like Eq. (2) in Sect. 5.
Since we are using the published photometry data to calcu-late the distance modulus, we share the same systematic errorsas in the published results. These include the uncertainty in thezero point of the PL relation, calibration of photometric zeropoints, reddening and metallicity effects, incompleteness biasand crowding. The order of a typical systematic error is around∼0.1−0.2 mag.
3.1. The mean magnitudes
As mentioned in Sect. 2, most of theHSTobservations of extra-galactic Cepheids contain only 12V band epochs and 4 (or 5)I band epochs. These observations use a power-law time seriessampling strategy to minimize the aliasing problem and max-imize the phase coverage of the observed data points withinthe observing windows (Freedman et al. 1994; Kennicutt et al.1995). In order to reduce the bias due to sampling procedures,STS and some early KP observations used phase-weightedintensity means to find mean magnitudes in theV band.
364 S. M. Kanbur et al.: Cepheid distance from LMC and Galactic PL relations
The I band mean magnitudes were found via empirical re-lations developed by Freedman (1988) and Labhardt et al.(1997) for KP and STS observations, respectively (see, e.g.,Silbermann et al. 1996). Other KP observations used atemplate-fitting procedure (Stetson 1996) to obtain the meanmagnitudes in bothV andI band simultaneously.
In addition to the methods mentioned, Ngeow et al. (2003)recently developed an alternative method to obtain the meanmagnitudes, which is based on Fourier techniques. Ngeow et al.(2003) give specific examples of situations when such a methodcould be preferable to template based techniques. Another mo-tivation for developing these Fourier techniques is the possi-bility of reconstructing observed HST light curves to comparewith models. In Sect. 4.1, we quantitatively compare the meansobtained using our methods with existing techniques in the lit-erature.
Here, we apply the new Fourier method to all target galax-ies in order to be consistent in doing the analysis, and also totest this new method in the distance scale problem. The detailsof using the Fourier techniques are presented in Ngeow et al.(2003). Here we outline the steps:
1. The V band: The light curves of 12V band data points arereconstructed via a 4th-order Fourier expansion with theform:
m(t) = m0 +
i=4∑
i=1
[Ai cos(2iπt/P+ φi)
](3)
whereA andφ are Fourier amplitudes and phases, respec-tively, andm0 is the mean magnitude. Since the periods aredirectly taken from literature, the remaining nine parame-ters can be obtained by fitting the data with Eq. (3). Weuse the technique of simulated annealing and restrict theranges that the Fourier parameters in Eq. (3) can take toreconstruct theV band light curves. The ranges of Fourierphases are from 0 to 2π, whilst the ranges of Fourier am-plitudes are determined from the “calibrating set” Cepheidsand OGLE LMC Cepheids. The “calibrating set” Cepheidsconsist of∼100 Galactic Cepheids, mostly observed orig-inally by Moffett & Barnes (1984), and some LMC/SMCCepheids.
2. The I band: For 4 I band data points, it is clear thatEq. (3) cannot be applied to reconstruct theI band lightcurves. Therefore, we use Fourier interrelations (Ngeowet al. 2003) to reconstruct theI band light curves. TheFourier interrelations are linear relations connecting theFourier parameters in theV andI bands:
Ai(I ) = αi + βi Ai(V); φi(I ) = γi + ηiφi(V). (4)
The coefficients in Eq. (4) are determined from the “cali-brating set” Cepheids. Ngeow et al. (2003) developed suchFourier interrelations for the Galaxy, LMC and SMC sep-arately and found that they are only weakly dependent onmetallicity. This is important since it means that the inter-relations can be applied over a wide range of metallicity.Given the solution of Eq. (4), the observedI band pointsare then used to establish theI band light curves and hence
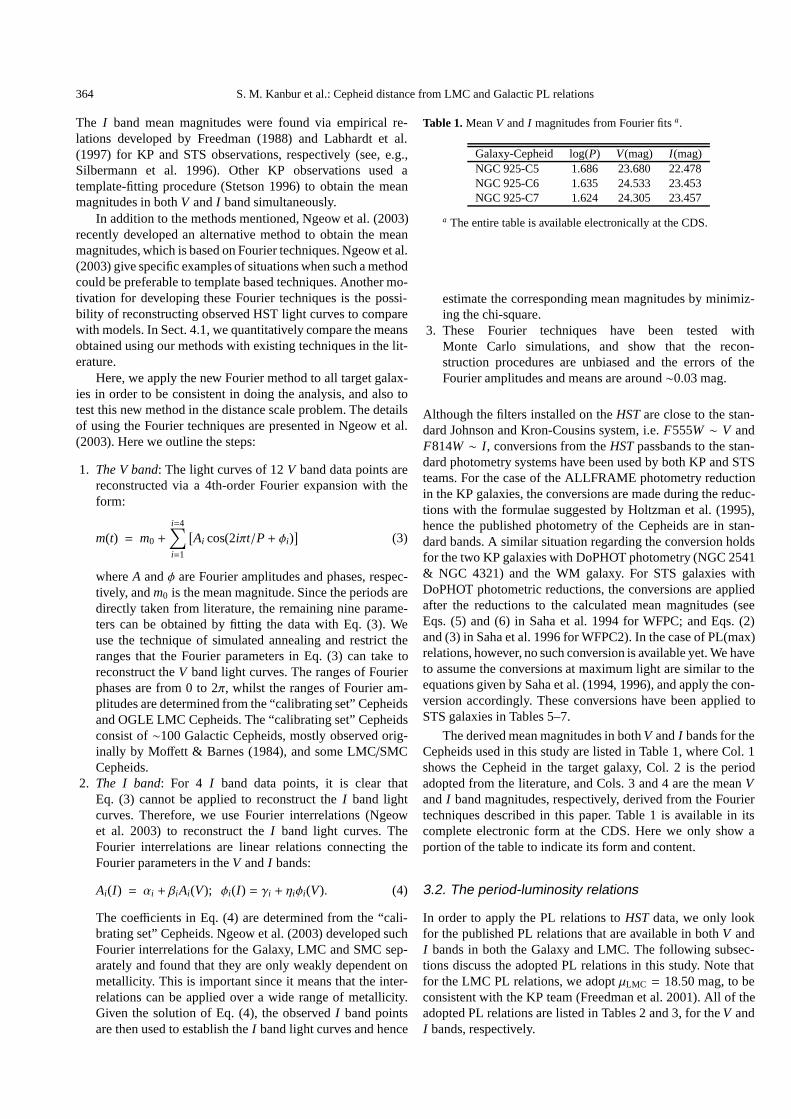
Table 1.MeanV andI magnitudes from Fourier fitsa.
Galaxy-Cepheid log(P) V(mag) I (mag)NGC 925-C5 1.686 23.680 22.478NGC 925-C6 1.635 24.533 23.453NGC 925-C7 1.624 24.305 23.457
a The entire table is available electronically at the CDS.
estimate the corresponding mean magnitudes by minimiz-ing the chi-square.
3. These Fourier techniques have been tested withMonte Carlo simulations, and show that the recon-struction procedures are unbiased and the errors of theFourier amplitudes and means are around∼0.03 mag.
Although the filters installed on theHSTare close to the stan-dard Johnson and Kron-Cousins system, i.e.F555W ∼ V andF814W ∼ I , conversions from theHSTpassbands to the stan-dard photometry systems have been used by both KP and STSteams. For the case of the ALLFRAME photometry reductionin the KP galaxies, the conversions are made during the reduc-tions with the formulae suggested by Holtzman et al. (1995),hence the published photometry of the Cepheids are in stan-dard bands. A similar situation regarding the conversion holdsfor the two KP galaxies with DoPHOT photometry (NGC 2541& NGC 4321) and the WM galaxy. For STS galaxies withDoPHOT photometric reductions, the conversions are appliedafter the reductions to the calculated mean magnitudes (seeEqs. (5) and (6) in Saha et al. 1994 for WFPC; and Eqs. (2)and (3) in Saha et al. 1996 for WFPC2). In the case of PL(max)relations, however, no such conversion is available yet. We haveto assume the conversions at maximum light are similar to theequations given by Saha et al. (1994, 1996), and apply the con-version accordingly. These conversions have been applied toSTS galaxies in Tables 5–7.
The derived mean magnitudes in bothV andI bands for theCepheids used in this study are listed in Table 1, where Col. 1shows the Cepheid in the target galaxy, Col. 2 is the periodadopted from the literature, and Cols. 3 and 4 are the meanVandI band magnitudes, respectively, derived from the Fouriertechniques described in this paper. Table 1 is available in itscomplete electronic form at the CDS. Here we only show aportion of the table to indicate its form and content.
3.2. The period-luminosity relations
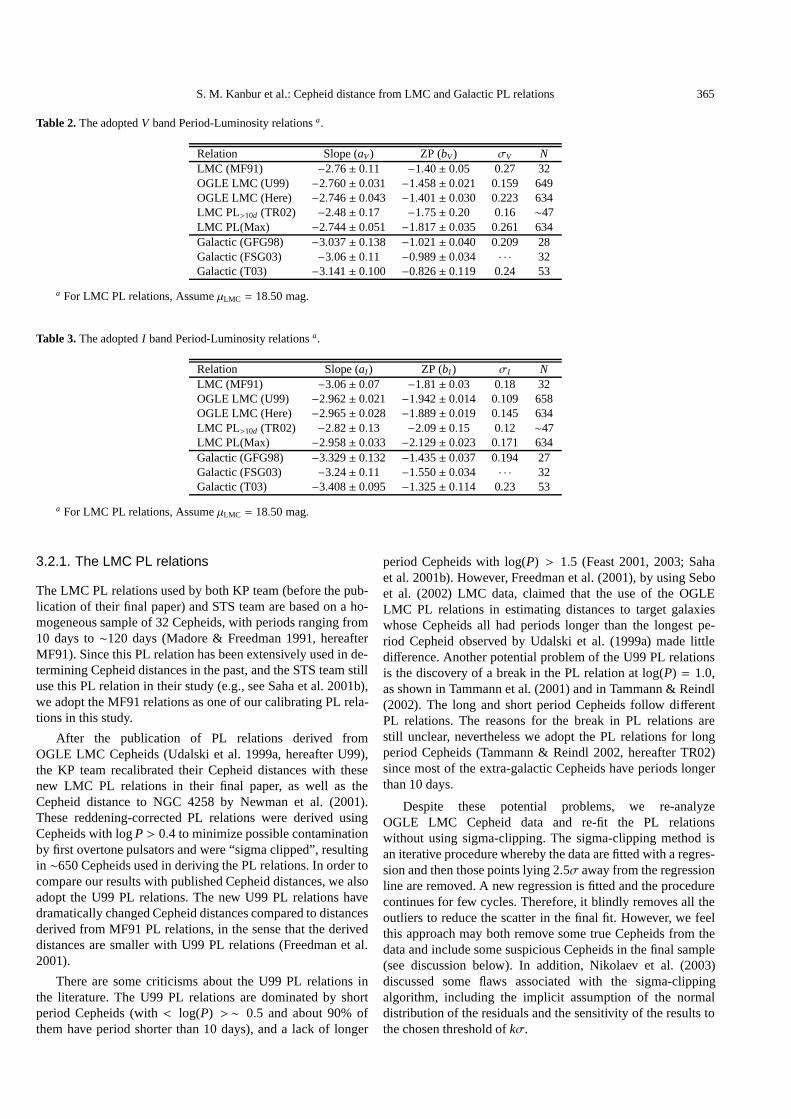
In order to apply the PL relations toHSTdata, we only lookfor the published PL relations that are available in bothV andI bands in both the Galaxy and LMC. The following subsec-tions discuss the adopted PL relations in this study. Note thatfor the LMC PL relations, we adoptµLMC = 18.50 mag, to beconsistent with the KP team (Freedman et al. 2001). All of theadopted PL relations are listed in Tables 2 and 3, for theV andI bands, respectively.
S. M. Kanbur et al.: Cepheid distance from LMC and Galactic PL relations 365
Table 2.The adoptedV band Period-Luminosity relationsa.
Relation Slope (aV) ZP (bV) σV NLMC (MF91) −2.76± 0.11 −1.40± 0.05 0.27 32OGLE LMC (U99) −2.760± 0.031 −1.458± 0.021 0.159 649OGLE LMC (Here) −2.746± 0.043 −1.401± 0.030 0.223 634LMC PL>10d (TR02) −2.48± 0.17 −1.75± 0.20 0.16 ∼47LMC PL(Max) −2.744± 0.051 −1.817± 0.035 0.261 634Galactic (GFG98) −3.037± 0.138 −1.021± 0.040 0.209 28Galactic (FSG03) −3.06± 0.11 −0.989± 0.034 · · · 32Galactic (T03) −3.141± 0.100 −0.826± 0.119 0.24 53
a For LMC PL relations, AssumeµLMC = 18.50 mag.
Table 3.The adoptedI band Period-Luminosity relationsa.
Relation Slope (aI ) ZP (bI ) σI NLMC (MF91) −3.06± 0.07 −1.81± 0.03 0.18 32OGLE LMC (U99) −2.962± 0.021 −1.942± 0.014 0.109 658OGLE LMC (Here) −2.965± 0.028 −1.889± 0.019 0.145 634LMC PL>10d (TR02) −2.82± 0.13 −2.09± 0.15 0.12 ∼47LMC PL(Max) −2.958± 0.033 −2.129± 0.023 0.171 634Galactic (GFG98) −3.329± 0.132 −1.435± 0.037 0.194 27Galactic (FSG03) −3.24± 0.11 −1.550± 0.034 · · · 32Galactic (T03) −3.408± 0.095 −1.325± 0.114 0.23 53
a For LMC PL relations, AssumeµLMC = 18.50 mag.
3.2.1. The LMC PL relations
The LMC PL relations used by both KP team (before the pub-lication of their final paper) and STS team are based on a ho-mogeneous sample of 32 Cepheids, with periods ranging from10 days to∼120 days (Madore & Freedman 1991, hereafterMF91). Since this PL relation has been extensively used in de-termining Cepheid distances in the past, and the STS team stilluse this PL relation in their study (e.g., see Saha et al. 2001b),we adopt the MF91 relations as one of our calibrating PL rela-tions in this study.
After the publication of PL relations derived fromOGLE LMC Cepheids (Udalski et al. 1999a, hereafter U99),the KP team recalibrated their Cepheid distances with thesenew LMC PL relations in their final paper, as well as theCepheid distance to NGC 4258 by Newman et al. (2001).These reddening-corrected PL relations were derived usingCepheids with logP > 0.4 to minimize possible contaminationby first overtone pulsators and were “sigma clipped”, resultingin ∼650 Cepheids used in deriving the PL relations. In order tocompare our results with published Cepheid distances, we alsoadopt the U99 PL relations. The new U99 PL relations havedramatically changed Cepheid distances compared to distancesderived from MF91 PL relations, in the sense that the deriveddistances are smaller with U99 PL relations (Freedman et al.2001).
There are some criticisms about the U99 PL relations inthe literature. The U99 PL relations are dominated by shortperiod Cepheids (with< log(P) >∼ 0.5 and about 90% ofthem have period shorter than 10 days), and a lack of longer
period Cepheids with log(P) > 1.5 (Feast 2001, 2003; Sahaet al. 2001b). However, Freedman et al. (2001), by using Seboet al. (2002) LMC data, claimed that the use of the OGLELMC PL relations in estimating distances to target galaxieswhose Cepheids all had periods longer than the longest pe-riod Cepheid observed by Udalski et al. (1999a) made littledifference. Another potential problem of the U99 PL relationsis the discovery of a break in the PL relation at log(P) = 1.0,as shown in Tammann et al. (2001) and in Tammann & Reindl(2002). The long and short period Cepheids follow differentPL relations. The reasons for the break in PL relations arestill unclear, nevertheless we adopt the PL relations for longperiod Cepheids (Tammann & Reindl 2002, hereafter TR02)since most of the extra-galactic Cepheids have periods longerthan 10 days.
Despite these potential problems, we re-analyzeOGLE LMC Cepheid data and re-fit the PL relationswithout using sigma-clipping. The sigma-clipping method isan iterative procedure whereby the data are fitted with a regres-sion and then those points lying 2.5σ away from the regressionline are removed. A new regression is fitted and the procedurecontinues for few cycles. Therefore, it blindly removes all theoutliers to reduce the scatter in the final fit. However, we feelthis approach may both remove some true Cepheids from thedata and include some suspicious Cepheids in the final sample(see discussion below). In addition, Nikolaev et al. (2003)discussed some flaws associated with the sigma-clippingalgorithm, including the implicit assumption of the normaldistribution of the residuals and the sensitivity of the results tothe chosen threshold ofkσ.
366 S. M. Kanbur et al.: Cepheid distance from LMC and Galactic PL relations
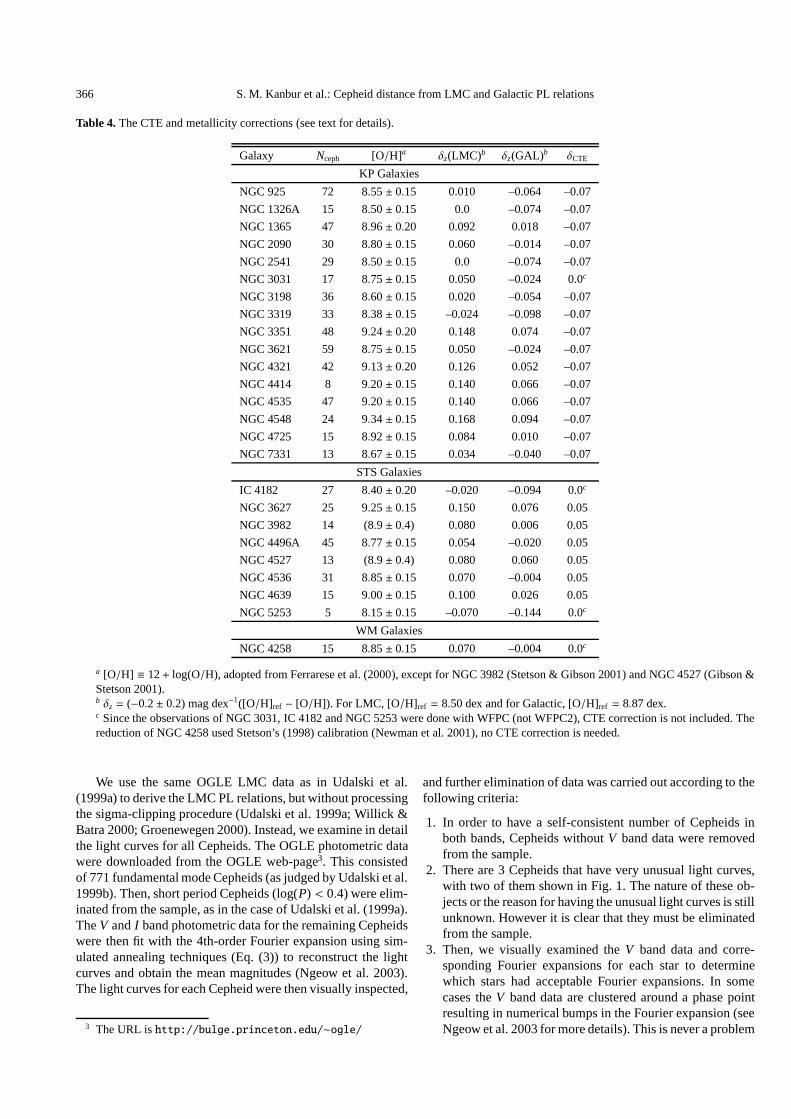
Table 4.The CTE and metallicity corrections (see text for details).
Galaxy Nceph [O/H]a δz(LMC)b δz(GAL)b δCTE
KP Galaxies
NGC 925 72 8.55± 0.15 0.010 –0.064 –0.07
NGC 1326A 15 8.50± 0.15 0.0 –0.074 –0.07
NGC 1365 47 8.96± 0.20 0.092 0.018 –0.07
NGC 2090 30 8.80± 0.15 0.060 –0.014 –0.07
NGC 2541 29 8.50± 0.15 0.0 –0.074 –0.07
NGC 3031 17 8.75± 0.15 0.050 –0.024 0.0c
NGC 3198 36 8.60± 0.15 0.020 –0.054 –0.07
NGC 3319 33 8.38± 0.15 –0.024 –0.098 –0.07
NGC 3351 48 9.24± 0.20 0.148 0.074 –0.07
NGC 3621 59 8.75± 0.15 0.050 –0.024 –0.07
NGC 4321 42 9.13± 0.20 0.126 0.052 –0.07
NGC 4414 8 9.20± 0.15 0.140 0.066 –0.07
NGC 4535 47 9.20± 0.15 0.140 0.066 –0.07
NGC 4548 24 9.34± 0.15 0.168 0.094 –0.07
NGC 4725 15 8.92± 0.15 0.084 0.010 –0.07
NGC 7331 13 8.67± 0.15 0.034 –0.040 –0.07
STS Galaxies
IC 4182 27 8.40± 0.20 –0.020 –0.094 0.0c
NGC 3627 25 9.25± 0.15 0.150 0.076 0.05
NGC 3982 14 (8.9± 0.4) 0.080 0.006 0.05
NGC 4496A 45 8.77± 0.15 0.054 –0.020 0.05
NGC 4527 13 (8.9± 0.4) 0.080 0.060 0.05
NGC 4536 31 8.85± 0.15 0.070 –0.004 0.05
NGC 4639 15 9.00± 0.15 0.100 0.026 0.05
NGC 5253 5 8.15± 0.15 –0.070 –0.144 0.0c
WM Galaxies
NGC 4258 15 8.85± 0.15 0.070 –0.004 0.0c
a [O/H] ≡ 12+ log(O/H), adopted from Ferrarese et al. (2000), except for NGC 3982 (Stetson & Gibson 2001) and NGC 4527 (Gibson &Stetson 2001).b δz = (−0.2± 0.2) mag dex−1([O/H]ref − [O/H]). For LMC, [O/H]ref = 8.50 dex and for Galactic, [O/H]ref = 8.87 dex.c Since the observations of NGC 3031, IC 4182 and NGC 5253 were done withWFPC (not WFPC2), CTE correction is not included. Thereduction of NGC 4258 used Stetson’s (1998) calibration (Newman et al. 2001), no CTE correction is needed.
We use the same OGLE LMC data as in Udalski et al.(1999a) to derive the LMC PL relations, but without processingthe sigma-clipping procedure (Udalski et al. 1999a; Willick &Batra 2000; Groenewegen 2000). Instead, we examine in detailthe light curves for all Cepheids. The OGLE photometric datawere downloaded from the OGLE web-page3. This consistedof 771 fundamental mode Cepheids (as judged by Udalski et al.1999b). Then, short period Cepheids (log(P) < 0.4) were elim-inated from the sample, as in the case of Udalski et al. (1999a).TheV andI band photometric data for the remaining Cepheidswere then fit with the 4th-order Fourier expansion using sim-ulated annealing techniques (Eq. (3)) to reconstruct the lightcurves and obtain the mean magnitudes (Ngeow et al. 2003).The light curves for each Cepheid were then visually inspected,
3 The URL ishttp://bulge.princeton.edu/∼ogle/
and further elimination of data was carried out according to thefollowing criteria:
1. In order to have a self-consistent number of Cepheids inboth bands, Cepheids withoutV band data were removedfrom the sample.
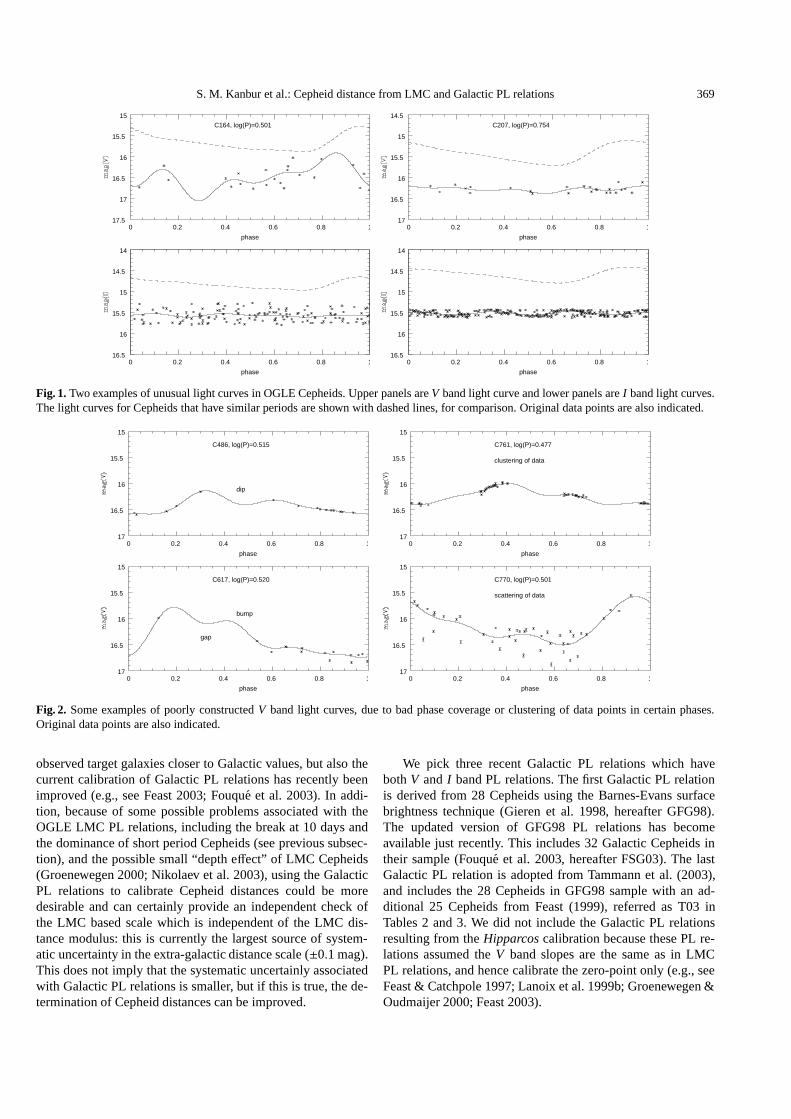
2. There are 3 Cepheids that have very unusual light curves,with two of them shown in Fig. 1. The nature of these ob-jects or the reason for having the unusual light curves is stillunknown. However it is clear that they must be eliminatedfrom the sample.
3. Then, we visually examined theV band data and corre-sponding Fourier expansions for each star to determinewhich stars had acceptable Fourier expansions. In somecases theV band data are clustered around a phase pointresulting in numerical bumps in the Fourier expansion (seeNgeow et al. 2003 for more details). This is never a problem
S. M. Kanbur et al.: Cepheid distance from LMC and Galactic PL relations 367
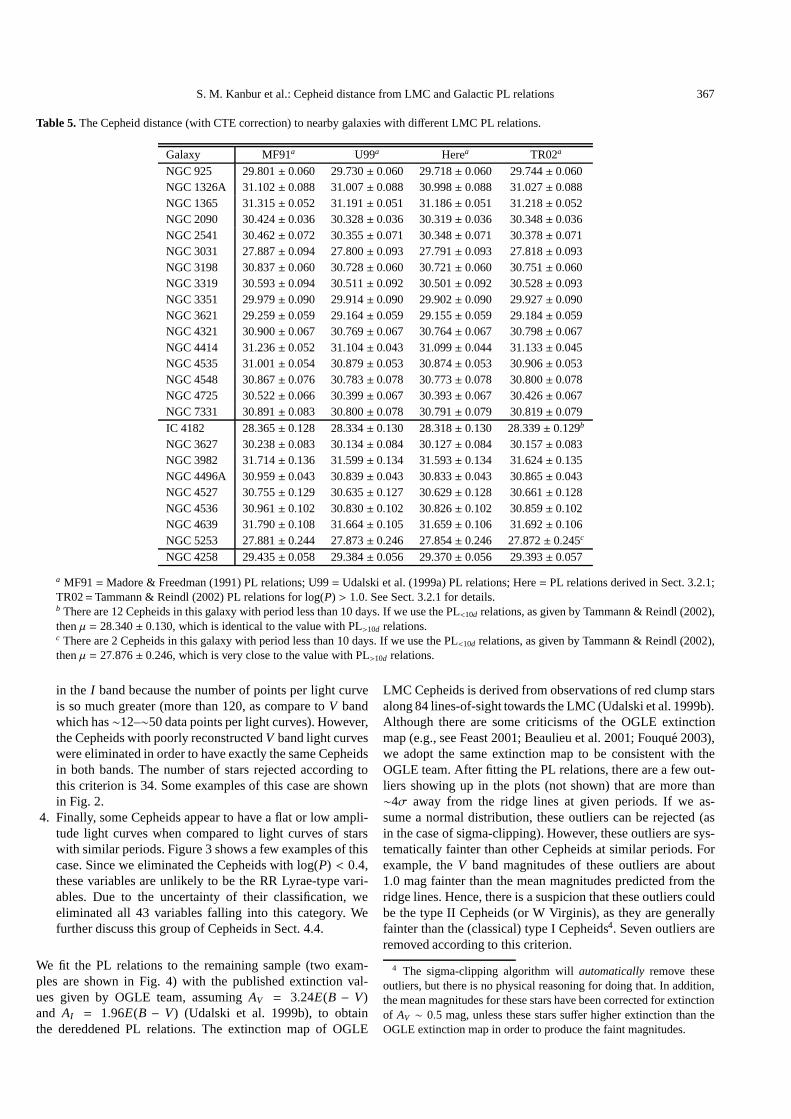
Table 5.The Cepheid distance (with CTE correction) to nearby galaxies with different LMC PL relations.
Galaxy MF91a U99a Herea TR02a
NGC 925 29.801± 0.060 29.730± 0.060 29.718± 0.060 29.744± 0.060NGC 1326A 31.102± 0.088 31.007± 0.088 30.998± 0.088 31.027± 0.088NGC 1365 31.315± 0.052 31.191± 0.051 31.186± 0.051 31.218± 0.052NGC 2090 30.424± 0.036 30.328± 0.036 30.319± 0.036 30.348± 0.036NGC 2541 30.462± 0.072 30.355± 0.071 30.348± 0.071 30.378± 0.071NGC 3031 27.887± 0.094 27.800± 0.093 27.791± 0.093 27.818± 0.093NGC 3198 30.837± 0.060 30.728± 0.060 30.721± 0.060 30.751± 0.060NGC 3319 30.593± 0.094 30.511± 0.092 30.501± 0.092 30.528± 0.093NGC 3351 29.979± 0.090 29.914± 0.090 29.902± 0.090 29.927± 0.090NGC 3621 29.259± 0.059 29.164± 0.059 29.155± 0.059 29.184± 0.059NGC 4321 30.900± 0.067 30.769± 0.067 30.764± 0.067 30.798± 0.067NGC 4414 31.236± 0.052 31.104± 0.043 31.099± 0.044 31.133± 0.045NGC 4535 31.001± 0.054 30.879± 0.053 30.874± 0.053 30.906± 0.053NGC 4548 30.867± 0.076 30.783± 0.078 30.773± 0.078 30.800± 0.078NGC 4725 30.522± 0.066 30.399± 0.067 30.393± 0.067 30.426± 0.067NGC 7331 30.891± 0.083 30.800± 0.078 30.791± 0.079 30.819± 0.079IC 4182 28.365± 0.128 28.334± 0.130 28.318± 0.130 28.339± 0.129b
NGC 3627 30.238± 0.083 30.134± 0.084 30.127± 0.084 30.157± 0.083NGC 3982 31.714± 0.136 31.599± 0.134 31.593± 0.134 31.624± 0.135NGC 4496A 30.959± 0.043 30.839± 0.043 30.833± 0.043 30.865± 0.043NGC 4527 30.755± 0.129 30.635± 0.127 30.629± 0.128 30.661± 0.128NGC 4536 30.961± 0.102 30.830± 0.102 30.826± 0.102 30.859± 0.102NGC 4639 31.790± 0.108 31.664± 0.105 31.659± 0.106 31.692± 0.106NGC 5253 27.881± 0.244 27.873± 0.246 27.854± 0.246 27.872± 0.245c
NGC 4258 29.435± 0.058 29.384± 0.056 29.370± 0.056 29.393± 0.057
a MF91=Madore & Freedman (1991) PL relations; U99= Udalski et al. (1999a) PL relations; Here= PL relations derived in Sect. 3.2.1;TR02=Tammann & Reindl (2002) PL relations for log(P) > 1.0. See Sect. 3.2.1 for details.b There are 12 Cepheids in this galaxy with period less than 10 days. If we use the PL<10d relations, as given by Tammann & Reindl (2002),thenµ = 28.340± 0.130, which is identical to the value with PL>10d relations.c There are 2 Cepheids in this galaxy with period less than 10 days. If we use the PL<10d relations, as given by Tammann & Reindl (2002),thenµ = 27.876± 0.246, which is very close to the value with PL>10d relations.
in the I band because the number of points per light curveis so much greater (more than 120, as compare toV bandwhich has∼12–∼50 data points per light curves). However,the Cepheids with poorly reconstructedV band light curveswere eliminated in order to have exactly the same Cepheidsin both bands. The number of stars rejected according tothis criterion is 34. Some examples of this case are shownin Fig. 2.
4. Finally, some Cepheids appear to have a flat or low ampli-tude light curves when compared to light curves of starswith similar periods. Figure 3 shows a few examples of thiscase. Since we eliminated the Cepheids with log(P) < 0.4,these variables are unlikely to be the RR Lyrae-type vari-ables. Due to the uncertainty of their classification, weeliminated all 43 variables falling into this category. Wefurther discuss this group of Cepheids in Sect. 4.4.
We fit the PL relations to the remaining sample (two exam-ples are shown in Fig. 4) with the published extinction val-ues given by OGLE team, assumingAV = 3.24E(B − V)and AI = 1.96E(B − V) (Udalski et al. 1999b), to obtainthe dereddened PL relations. The extinction map of OGLE
LMC Cepheids is derived from observations of red clump starsalong 84 lines-of-sight towards the LMC (Udalski et al. 1999b).Although there are some criticisms of the OGLE extinctionmap (e.g., see Feast 2001; Beaulieu et al. 2001; Fouqu´e 2003),we adopt the same extinction map to be consistent with theOGLE team. After fitting the PL relations, there are a few out-liers showing up in the plots (not shown) that are more than∼4σ away from the ridge lines at given periods. If we as-sume a normal distribution, these outliers can be rejected (asin the case of sigma-clipping). However, these outliers are sys-tematically fainter than other Cepheids at similar periods. Forexample, theV band magnitudes of these outliers are about1.0 mag fainter than the mean magnitudes predicted from theridge lines. Hence, there is a suspicion that these outliers couldbe the type II Cepheids (or W Virginis), as they are generallyfainter than the (classical) type I Cepheids4. Seven outliers areremoved according to this criterion.
4 The sigma-clipping algorithm willautomatically remove theseoutliers, but there is no physical reasoning for doing that. In addition,the mean magnitudes for these stars have been corrected for extinctionof AV ∼ 0.5 mag, unless these stars suffer higher extinction than theOGLE extinction map in order to produce the faint magnitudes.
368 S. M. Kanbur et al.: Cepheid distance from LMC and Galactic PL relations
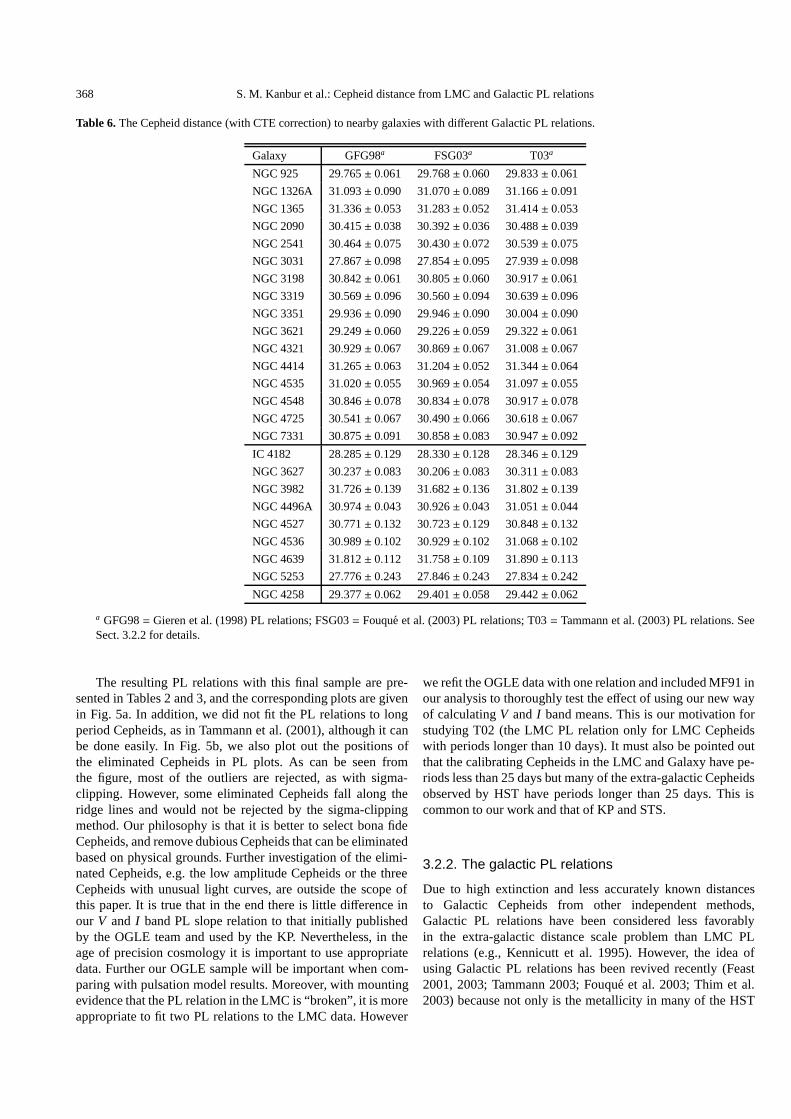
Table 6.The Cepheid distance (with CTE correction) to nearby galaxies with different Galactic PL relations.
Galaxy GFG98a FSG03a T03a
NGC 925 29.765± 0.061 29.768± 0.060 29.833± 0.061
NGC 1326A 31.093± 0.090 31.070± 0.089 31.166± 0.091
NGC 1365 31.336± 0.053 31.283± 0.052 31.414± 0.053
NGC 2090 30.415± 0.038 30.392± 0.036 30.488± 0.039
NGC 2541 30.464± 0.075 30.430± 0.072 30.539± 0.075
NGC 3031 27.867± 0.098 27.854± 0.095 27.939± 0.098
NGC 3198 30.842± 0.061 30.805± 0.060 30.917± 0.061
NGC 3319 30.569± 0.096 30.560± 0.094 30.639± 0.096
NGC 3351 29.936± 0.090 29.946± 0.090 30.004± 0.090
NGC 3621 29.249± 0.060 29.226± 0.059 29.322± 0.061
NGC 4321 30.929± 0.067 30.869± 0.067 31.008± 0.067
NGC 4414 31.265± 0.063 31.204± 0.052 31.344± 0.064
NGC 4535 31.020± 0.055 30.969± 0.054 31.097± 0.055
NGC 4548 30.846± 0.078 30.834± 0.078 30.917± 0.078
NGC 4725 30.541± 0.067 30.490± 0.066 30.618± 0.067
NGC 7331 30.875± 0.091 30.858± 0.083 30.947± 0.092
IC 4182 28.285± 0.129 28.330± 0.128 28.346± 0.129
NGC 3627 30.237± 0.083 30.206± 0.083 30.311± 0.083
NGC 3982 31.726± 0.139 31.682± 0.136 31.802± 0.139
NGC 4496A 30.974± 0.043 30.926± 0.043 31.051± 0.044
NGC 4527 30.771± 0.132 30.723± 0.129 30.848± 0.132
NGC 4536 30.989± 0.102 30.929± 0.102 31.068± 0.102
NGC 4639 31.812± 0.112 31.758± 0.109 31.890± 0.113
NGC 5253 27.776± 0.243 27.846± 0.243 27.834± 0.242
NGC 4258 29.377± 0.062 29.401± 0.058 29.442± 0.062
a GFG98= Gieren et al. (1998) PL relations; FSG03= Fouque et al. (2003) PL relations; T03= Tammann et al. (2003) PL relations. SeeSect. 3.2.2 for details.
The resulting PL relations with this final sample are pre-sented in Tables 2 and 3, and the corresponding plots are givenin Fig. 5a. In addition, we did not fit the PL relations to longperiod Cepheids, as in Tammann et al. (2001), although it canbe done easily. In Fig. 5b, we also plot out the positions ofthe eliminated Cepheids in PL plots. As can be seen fromthe figure, most of the outliers are rejected, as with sigma-clipping. However, some eliminated Cepheids fall along theridge lines and would not be rejected by the sigma-clippingmethod. Our philosophy is that it is better to select bona fideCepheids, and remove dubious Cepheids that can be eliminatedbased on physical grounds. Further investigation of the elimi-nated Cepheids, e.g. the low amplitude Cepheids or the threeCepheids with unusual light curves, are outside the scope ofthis paper. It is true that in the end there is little difference inour V and I band PL slope relation to that initially publishedby the OGLE team and used by the KP. Nevertheless, in theage of precision cosmology it is important to use appropriatedata. Further our OGLE sample will be important when com-paring with pulsation model results. Moreover, with mountingevidence that the PL relation in the LMC is “broken”, it is moreappropriate to fit two PL relations to the LMC data. However
we refit the OGLE data with one relation and included MF91 inour analysis to thoroughly test the effect of using our new wayof calculatingV and I band means. This is our motivation forstudying T02 (the LMC PL relation only for LMC Cepheidswith periods longer than 10 days). It must also be pointed outthat the calibrating Cepheids in the LMC and Galaxy have pe-riods less than 25 days but many of the extra-galactic Cepheidsobserved by HST have periods longer than 25 days. This iscommon to our work and that of KP and STS.
3.2.2. The galactic PL relations
Due to high extinction and less accurately known distancesto Galactic Cepheids from other independent methods,Galactic PL relations have been considered less favorablyin the extra-galactic distance scale problem than LMC PLrelations (e.g., Kennicutt et al. 1995). However, the idea ofusing Galactic PL relations has been revived recently (Feast2001, 2003; Tammann 2003; Fouqu´e et al. 2003; Thim et al.2003) because not only is the metallicity in many of the HST
S. M. Kanbur et al.: Cepheid distance from LMC and Galactic PL relations 369
0 0.2 0.4 0.6 0.8 117.5
17
16.5
16
15.5
15
phase
C164, log(P)=0.501
0 0.2 0.4 0.6 0.8 116.5
16
15.5
15
14.5
14
phase
0 0.2 0.4 0.6 0.8 117
16.5
16
15.5
15
14.5
phase
C207, log(P)=0.754
0 0.2 0.4 0.6 0.8 116.5
16
15.5
15
14.5
14
phase
Fig. 1.Two examples of unusual light curves in OGLE Cepheids. Upper panels areV band light curve and lower panels areI band light curves.The light curves for Cepheids that have similar periods are shown with dashed lines, for comparison. Original data points are also indicated.
0 0.2 0.4 0.6 0.8 117
16.5
16
15.5
15
phase
C486, log(P)=0.515
dip
0 0.2 0.4 0.6 0.8 117
16.5
16
15.5
15
phase
C617, log(P)=0.520
bump
gap
0 0.2 0.4 0.6 0.8 117
16.5
16
15.5
15
phase
C761, log(P)=0.477
clustering of data
0 0.2 0.4 0.6 0.8 117
16.5
16
15.5
15
phase
C770, log(P)=0.501
scattering of data
Fig. 2. Some examples of poorly constructedV band light curves, due to bad phase coverage or clustering of data points in certain phases.Original data points are also indicated.
observed target galaxies closer to Galactic values, but also thecurrent calibration of Galactic PL relations has recently beenimproved (e.g., see Feast 2003; Fouqu´e et al. 2003). In addi-tion, because of some possible problems associated with theOGLE LMC PL relations, including the break at 10 days andthe dominance of short period Cepheids (see previous subsec-tion), and the possible small “depth effect” of LMC Cepheids(Groenewegen 2000; Nikolaev et al. 2003), using the GalacticPL relations to calibrate Cepheid distances could be moredesirable and can certainly provide an independent check ofthe LMC based scale which is independent of the LMC dis-tance modulus: this is currently the largest source of system-atic uncertainty in the extra-galactic distance scale (±0.1 mag).This does not imply that the systematic uncertainly associatedwith Galactic PL relations is smaller, but if this is true, the de-termination of Cepheid distances can be improved.
We pick three recent Galactic PL relations which havebothV and I band PL relations. The first Galactic PL relationis derived from 28 Cepheids using the Barnes-Evans surfacebrightness technique (Gieren et al. 1998, hereafter GFG98).The updated version of GFG98 PL relations has becomeavailable just recently. This includes 32 Galactic Cepheids intheir sample (Fouqu´e et al. 2003, hereafter FSG03). The lastGalactic PL relation is adopted from Tammann et al. (2003),and includes the 28 Cepheids in GFG98 sample with an ad-ditional 25 Cepheids from Feast (1999), referred as T03 inTables 2 and 3. We did not include the Galactic PL relationsresulting from theHipparcoscalibration because these PL re-lations assumed theV band slopes are the same as in LMCPL relations, and hence calibrate the zero-point only (e.g., seeFeast & Catchpole 1997; Lanoix et al. 1999b; Groenewegen &Oudmaijer 2000; Feast 2003).

370 S. M. Kanbur et al.: Cepheid distance from LMC and Galactic PL relations
0 0.2 0.4 0.6 0.8 117
16.5
16
15.5
15
phase
C596, log(P)=0.762
0 0.2 0.4 0.6 0.8 115.5
15
14.5
14
13.5
phase
0 0.2 0.4 0.6 0.8 116.5
16
15.5
15
14.5
phase
C522, log(P)=0.655
0 0.2 0.4 0.6 0.8 116
15.5
15
14.5
14
phase
Fig. 3.Some examples of Cepheids that have unusually small amplitudes. The light curves for the Cepheids that have similar periods are shownin dashed lines, for comparison. Original data points are also indicated.
0 0.2 0.4 0.6 0.8 117
16.5
16
15.5
15
phase
C1, log(P)=0.531
0 0.2 0.4 0.6 0.8 1
16
15.5
15
14.5
phase
0 0.2 0.4 0.6 0.8 116
15.5
15
14.5
14
phase
C649, log(P)=0.918
0 0.2 0.4 0.6 0.8 115
14.5
14
13.5
13
phase
Fig. 4.Two examples of well reconstructed light curves. The upper panels areV band light curves and the lower panels areI band light curves.Original data points are also indicated.
3.2.3. LMC PL(Max) relations
Kanbur & Hendry (1996), on the basis of hydrodynamical pul-sation calculations (Simon et al. 1993), suggested that PL re-lations at maximum light may have smaller scatter. However,they found that for a sample of 32 stars in the LMC, the PL re-lation at maximum light (hereafter PL(Max)) in the LMC hadcomparable scatter to its counterpart at mean light. Motivatedby this, and to use it primarily as a check on our mean lightresults, we computed the distances to all target galaxies stud-ied in this paper using PL(Max) relations. Maximum lightfor Cepheids in the target galaxies are estimated using thelight curve reconstruction techniques described in Ngeow et al.(2003).
We use the same OGLE LMC Cepheid sample as in the pre-vious subsection to derive the PL(Max) relations. The estima-tion of maximum light (or the equivalent minimum magnitude)of a Cepheid from its light curve is more severely influenced
by the quality of reconstructed light curves, as compared to itsmean light counterpart. This is because bad phase coverage inthe data will result in numerical bumps in the reconstructedlight curves (Ngeow et al. 2003) which can be higher thanthe maximum light. Therefore, the elimination of poorly re-constructed light curves is more important in this aspect. Afterthe maximum light of each Cepheid in the sample has beenestimated from the reconstructed light curves, the PL(Max)relations can be obtained. For this work, we assume that thereddening at maximum light is as same as at mean light eventhough the period color relations at maximum light are differentto those at mean light (Simon et al. 1993).
3.3. CTE and metallicity corrections
The charge-transfer efficiency (CTE) for WFPC2 is a compli-cated issue. Simply speaking, it has been found that the per-formance of the WFPC2 depends on the exposure time, which
S. M. Kanbur et al.: Cepheid distance from LMC and Galactic PL relations 371
0.4 0.6 0.8 1 1.2 1.4
17
16
15
14
13
log(P)
0.4 0.6 0.8 1 1.2 1.4
16
15
14
13
12
log(P)
0.4 0.6 0.8 1 1.2 1.4
17
16
15
14
13
log(P)
0.4 0.6 0.8 1 1.2 1.4
16
15
14
13
12
log(P)
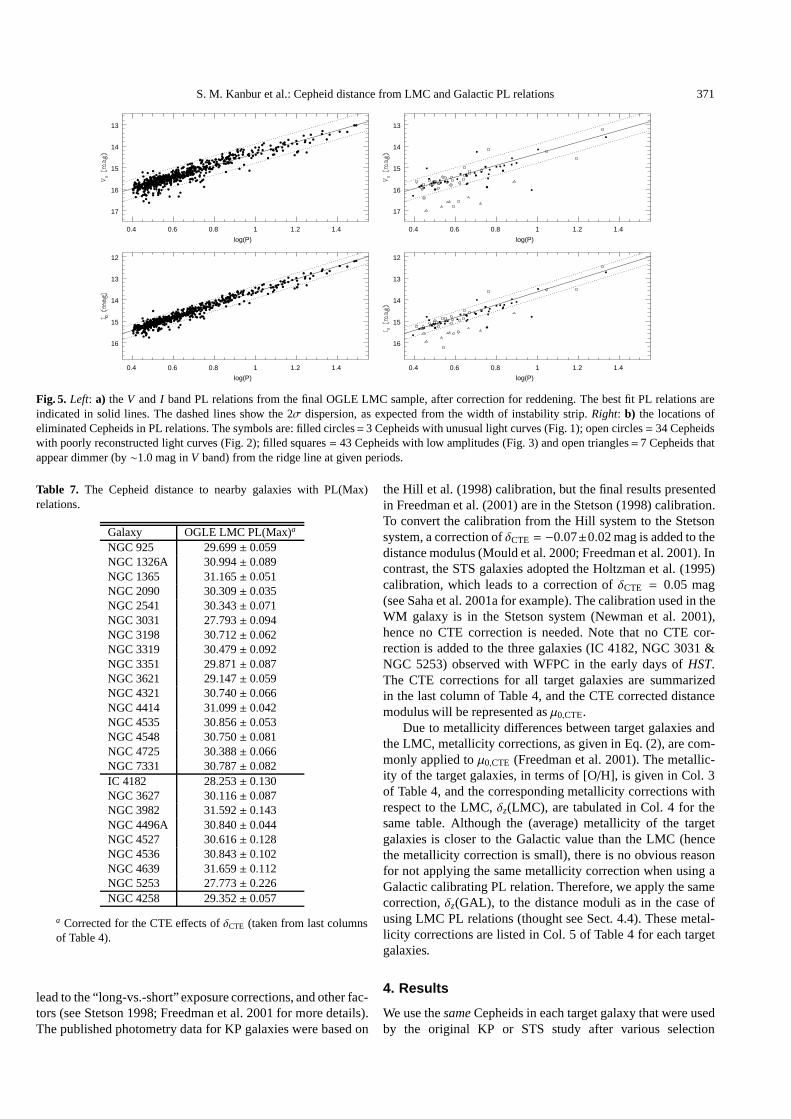
Fig. 5. Left: a) theV and I band PL relations from the final OGLE LMC sample, after correction for reddening. The best fit PL relations areindicated in solid lines. The dashed lines show the 2σ dispersion, as expected from the width of instability strip.Right: b) the locations ofeliminated Cepheids in PL relations. The symbols are: filled circles= 3 Cepheids with unusual light curves (Fig. 1); open circles= 34 Cepheidswith poorly reconstructed light curves (Fig. 2); filled squares= 43 Cepheids with low amplitudes (Fig. 3) and open triangles= 7 Cepheids thatappear dimmer (by∼1.0 mag inV band) from the ridge line at given periods.
Table 7. The Cepheid distance to nearby galaxies with PL(Max)relations.
Galaxy OGLE LMC PL(Max)a
NGC 925 29.699± 0.059NGC 1326A 30.994± 0.089NGC 1365 31.165± 0.051NGC 2090 30.309± 0.035NGC 2541 30.343± 0.071NGC 3031 27.793± 0.094NGC 3198 30.712± 0.062NGC 3319 30.479± 0.092NGC 3351 29.871± 0.087NGC 3621 29.147± 0.059NGC 4321 30.740± 0.066NGC 4414 31.099± 0.042NGC 4535 30.856± 0.053NGC 4548 30.750± 0.081NGC 4725 30.388± 0.066NGC 7331 30.787± 0.082IC 4182 28.253± 0.130NGC 3627 30.116± 0.087NGC 3982 31.592± 0.143NGC 4496A 30.840± 0.044NGC 4527 30.616± 0.128NGC 4536 30.843± 0.102NGC 4639 31.659± 0.112NGC 5253 27.773± 0.226NGC 4258 29.352± 0.057
a Corrected for the CTE effects ofδCTE (taken from last columnsof Table 4).
lead to the “long-vs.-short” exposure corrections, and other fac-tors (see Stetson 1998; Freedman et al. 2001 for more details).The published photometry data for KP galaxies were based on
the Hill et al. (1998) calibration, but the final results presentedin Freedman et al. (2001) are in the Stetson (1998) calibration.To convert the calibration from the Hill system to the Stetsonsystem, a correction ofδCTE = −0.07±0.02 mag is added to thedistance modulus (Mould et al. 2000; Freedman et al. 2001). Incontrast, the STS galaxies adopted the Holtzman et al. (1995)calibration, which leads to a correction ofδCTE = 0.05 mag(see Saha et al. 2001a for example). The calibration used in theWM galaxy is in the Stetson system (Newman et al. 2001),hence no CTE correction is needed. Note that no CTE cor-rection is added to the three galaxies (IC 4182, NGC 3031 &NGC 5253) observed with WFPC in the early days ofHST.The CTE corrections for all target galaxies are summarizedin the last column of Table 4, and the CTE corrected distancemodulus will be represented asµ0,CTE.
Due to metallicity differences between target galaxies andthe LMC, metallicity corrections, as given in Eq. (2), are com-monly applied toµ0,CTE (Freedman et al. 2001). The metallic-ity of the target galaxies, in terms of [O/H], is given in Col. 3of Table 4, and the corresponding metallicity corrections withrespect to the LMC,δz(LMC), are tabulated in Col. 4 for thesame table. Although the (average) metallicity of the targetgalaxies is closer to the Galactic value than the LMC (hencethe metallicity correction is small), there is no obvious reasonfor not applying the same metallicity correction when using aGalactic calibrating PL relation. Therefore, we apply the samecorrection,δz(GAL), to the distance moduli as in the case ofusing LMC PL relations (thought see Sect. 4.4). These metal-licity corrections are listed in Col. 5 of Table 4 for each targetgalaxies.
4. Results
We use thesameCepheids in each target galaxy that were usedby the original KP or STS study after various selection
372 S. M. Kanbur et al.: Cepheid distance from LMC and Galactic PL relations
28 29 30 31 32
28
29
30
31
32
28 29 30 31 32-0.6
-0.4
-0.2
0
0.2
0.4
0.6
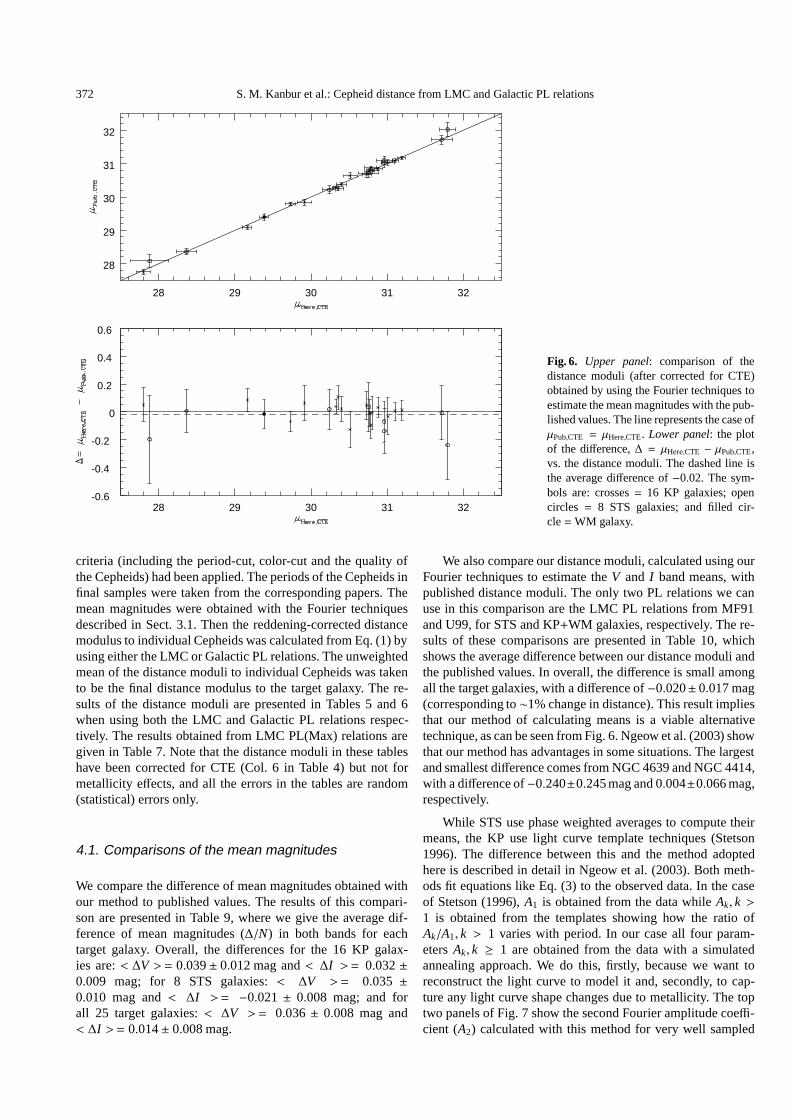
Fig. 6. Upper panel: comparison of thedistance moduli (after corrected for CTE)obtained by using the Fourier techniques toestimate the mean magnitudes with the pub-lished values. The line represents the case ofµPub,CTE = µHere,CTE. Lower panel: the plotof the difference,∆ = µHere,CTE − µPub,CTE,vs. the distance moduli. The dashed line isthe average difference of−0.02. The sym-bols are: crosses= 16 KP galaxies; opencircles = 8 STS galaxies; and filled cir-cle=WM galaxy.
criteria (including the period-cut, color-cut and the quality ofthe Cepheids) had been applied. The periods of the Cepheids infinal samples were taken from the corresponding papers. Themean magnitudes were obtained with the Fourier techniquesdescribed in Sect. 3.1. Then the reddening-corrected distancemodulus to individual Cepheids was calculated from Eq. (1) byusing either the LMC or Galactic PL relations. The unweightedmean of the distance moduli to individual Cepheids was takento be the final distance modulus to the target galaxy. The re-sults of the distance moduli are presented in Tables 5 and 6when using both the LMC and Galactic PL relations respec-tively. The results obtained from LMC PL(Max) relations aregiven in Table 7. Note that the distance moduli in these tableshave been corrected for CTE (Col. 6 in Table 4) but not formetallicity effects, and all the errors in the tables are random(statistical) errors only.
4.1. Comparisons of the mean magnitudes
We compare the difference of mean magnitudes obtained withour method to published values. The results of this compari-son are presented in Table 9, where we give the average dif-ference of mean magnitudes (∆/N) in both bands for eachtarget galaxy. Overall, the differences for the 16 KP galax-ies are:< ∆V >= 0.039± 0.012 mag and< ∆I >= 0.032±0.009 mag; for 8 STS galaxies:< ∆V >= 0.035 ±0.010 mag and< ∆I >= −0.021 ± 0.008 mag; and forall 25 target galaxies:< ∆V >= 0.036± 0.008 mag and< ∆I >= 0.014± 0.008 mag.
We also compare our distance moduli, calculated using ourFourier techniques to estimate theV and I band means, withpublished distance moduli. The only two PL relations we canuse in this comparison are the LMC PL relations from MF91and U99, for STS and KP+WM galaxies, respectively. The re-sults of these comparisons are presented in Table 10, whichshows the average difference between our distance moduli andthe published values. In overall, the difference is small amongall the target galaxies, with a difference of−0.020± 0.017 mag(corresponding to∼1% change in distance). This result impliesthat our method of calculating means is a viable alternativetechnique, as can be seen from Fig. 6. Ngeow et al. (2003) showthat our method has advantages in some situations. The largestand smallest difference comes from NGC 4639 and NGC 4414,with a difference of−0.240±0.245 mag and 0.004±0.066 mag,respectively.
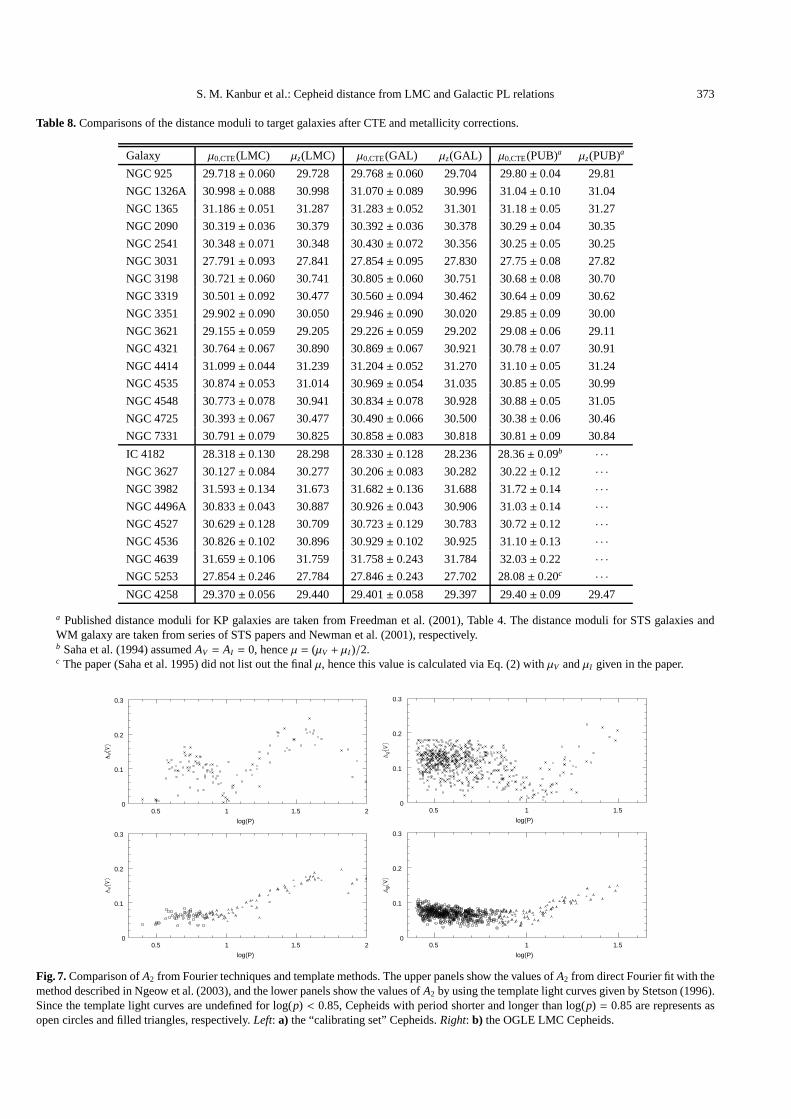
While STS use phase weighted averages to compute theirmeans, the KP use light curve template techniques (Stetson1996). The difference between this and the method adoptedhere is described in detail in Ngeow et al. (2003). Both meth-ods fit equations like Eq. (3) to the observed data. In the caseof Stetson (1996),A1 is obtained from the data whileAk, k >1 is obtained from the templates showing how the ratio ofAk/A1, k > 1 varies with period. In our case all four param-etersAk, k ≥ 1 are obtained from the data with a simulatedannealing approach. We do this, firstly, because we want toreconstruct the light curve to model it and, secondly, to cap-ture any light curve shape changes due to metallicity. The toptwo panels of Fig. 7 show the second Fourier amplitude coeffi-cient (A2) calculated with this method for very well sampled
S. M. Kanbur et al.: Cepheid distance from LMC and Galactic PL relations 373
Table 8.Comparisons of the distance moduli to target galaxies after CTE and metallicity corrections.
Galaxy µ0,CTE(LMC) µz(LMC) µ0,CTE(GAL) µz(GAL) µ0,CTE(PUB)a µz(PUB)a
NGC 925 29.718± 0.060 29.728 29.768± 0.060 29.704 29.80± 0.04 29.81
NGC 1326A 30.998± 0.088 30.998 31.070± 0.089 30.996 31.04± 0.10 31.04
NGC 1365 31.186± 0.051 31.287 31.283± 0.052 31.301 31.18± 0.05 31.27
NGC 2090 30.319± 0.036 30.379 30.392± 0.036 30.378 30.29± 0.04 30.35
NGC 2541 30.348± 0.071 30.348 30.430± 0.072 30.356 30.25± 0.05 30.25
NGC 3031 27.791± 0.093 27.841 27.854± 0.095 27.830 27.75± 0.08 27.82
NGC 3198 30.721± 0.060 30.741 30.805± 0.060 30.751 30.68± 0.08 30.70
NGC 3319 30.501± 0.092 30.477 30.560± 0.094 30.462 30.64± 0.09 30.62
NGC 3351 29.902± 0.090 30.050 29.946± 0.090 30.020 29.85± 0.09 30.00
NGC 3621 29.155± 0.059 29.205 29.226± 0.059 29.202 29.08± 0.06 29.11
NGC 4321 30.764± 0.067 30.890 30.869± 0.067 30.921 30.78± 0.07 30.91
NGC 4414 31.099± 0.044 31.239 31.204± 0.052 31.270 31.10± 0.05 31.24
NGC 4535 30.874± 0.053 31.014 30.969± 0.054 31.035 30.85± 0.05 30.99
NGC 4548 30.773± 0.078 30.941 30.834± 0.078 30.928 30.88± 0.05 31.05
NGC 4725 30.393± 0.067 30.477 30.490± 0.066 30.500 30.38± 0.06 30.46
NGC 7331 30.791± 0.079 30.825 30.858± 0.083 30.818 30.81± 0.09 30.84
IC 4182 28.318± 0.130 28.298 28.330± 0.128 28.236 28.36± 0.09b · · ·NGC 3627 30.127± 0.084 30.277 30.206± 0.083 30.282 30.22± 0.12 · · ·NGC 3982 31.593± 0.134 31.673 31.682± 0.136 31.688 31.72± 0.14 · · ·NGC 4496A 30.833± 0.043 30.887 30.926± 0.043 30.906 31.03± 0.14 · · ·NGC 4527 30.629± 0.128 30.709 30.723± 0.129 30.783 30.72± 0.12 · · ·NGC 4536 30.826± 0.102 30.896 30.929± 0.102 30.925 31.10± 0.13 · · ·NGC 4639 31.659± 0.106 31.759 31.758± 0.243 31.784 32.03± 0.22 · · ·NGC 5253 27.854± 0.246 27.784 27.846± 0.243 27.702 28.08± 0.20c · · ·NGC 4258 29.370± 0.056 29.440 29.401± 0.058 29.397 29.40± 0.09 29.47
a Published distance moduli for KP galaxies are taken from Freedman et al. (2001), Table 4. The distance moduli for STS galaxies andWM galaxy are taken from series of STS papers and Newman et al. (2001), respectively.b Saha et al. (1994) assumedAV = AI = 0, henceµ = (µV + µI )/2.c The paper (Saha et al. 1995) did not list out the finalµ, hence this value is calculated via Eq. (2) withµV andµI given in the paper.
0.5 1 1.5 20
0.1
0.2
0.3
log(P)
0.5 1 1.5 20
0.1
0.2
0.3
log(P)
0.5 1 1.50
0.1
0.2
0.3
log(P)
0.5 1 1.50
0.1
0.2
0.3
log(P)
Fig. 7.Comparison ofA2 from Fourier techniques and template methods. The upper panels show the values ofA2 from direct Fourier fit with themethod described in Ngeow et al. (2003), and the lower panels show the values ofA2 by using the template light curves given by Stetson (1996).Since the template light curves are undefined for log(p) < 0.85, Cepheids with period shorter and longer than log(p) = 0.85 are represents asopen circles and filled triangles, respectively.Left: a) the “calibrating set” Cepheids.Right: b) the OGLE LMC Cepheids.
374 S. M. Kanbur et al.: Cepheid distance from LMC and Galactic PL relations
28 29 30 31 32
28
29
30
31
32
28 29 30 31 32-0.6
-0.4
-0.2
0
0.2
0.4
0.6
28 29 30 31 32
28
29
30
31
32
28 29 30 31 32-0.6
-0.4
-0.2
0
0.2
0.4
0.6
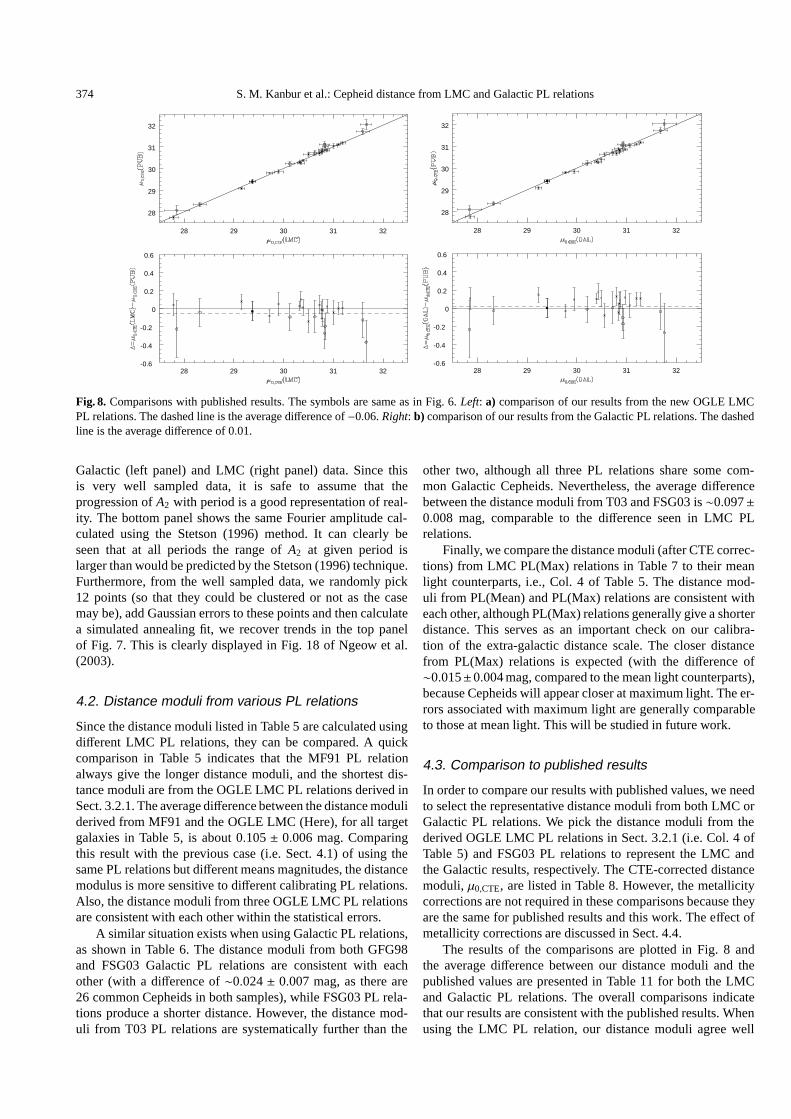
Fig. 8. Comparisons with published results. The symbols are same as in Fig. 6.Left: a) comparison of our results from the new OGLE LMCPL relations. The dashed line is the average difference of−0.06.Right: b) comparison of our results from the Galactic PL relations. The dashedline is the average difference of 0.01.
Galactic (left panel) and LMC (right panel) data. Since thisis very well sampled data, it is safe to assume that theprogression ofA2 with period is a good representation of real-ity. The bottom panel shows the same Fourier amplitude cal-culated using the Stetson (1996) method. It can clearly beseen that at all periods the range ofA2 at given period islarger than would be predicted by the Stetson (1996) technique.Furthermore, from the well sampled data, we randomly pick12 points (so that they could be clustered or not as the casemay be), add Gaussian errors to these points and then calculatea simulated annealing fit, we recover trends in the top panelof Fig. 7. This is clearly displayed in Fig. 18 of Ngeow et al.(2003).
4.2. Distance moduli from various PL relations
Since the distance moduli listed in Table 5 are calculated usingdifferent LMC PL relations, they can be compared. A quickcomparison in Table 5 indicates that the MF91 PL relationalways give the longer distance moduli, and the shortest dis-tance moduli are from the OGLE LMC PL relations derived inSect. 3.2.1. The average difference between the distance moduliderived from MF91 and the OGLE LMC (Here), for all targetgalaxies in Table 5, is about 0.105± 0.006 mag. Comparingthis result with the previous case (i.e. Sect. 4.1) of using thesame PL relations but different means magnitudes, the distancemodulus is more sensitive to different calibrating PL relations.Also, the distance moduli from three OGLE LMC PL relationsare consistent with each other within the statistical errors.
A similar situation exists when using Galactic PL relations,as shown in Table 6. The distance moduli from both GFG98and FSG03 Galactic PL relations are consistent with eachother (with a difference of∼0.024± 0.007 mag, as there are26 common Cepheids in both samples), while FSG03 PL rela-tions produce a shorter distance. However, the distance mod-uli from T03 PL relations are systematically further than the
other two, although all three PL relations share some com-mon Galactic Cepheids. Nevertheless, the average differencebetween the distance moduli from T03 and FSG03 is∼0.097±0.008 mag, comparable to the difference seen in LMC PLrelations.
Finally, we compare the distance moduli (after CTE correc-tions) from LMC PL(Max) relations in Table 7 to their meanlight counterparts, i.e., Col. 4 of Table 5. The distance mod-uli from PL(Mean) and PL(Max) relations are consistent witheach other, although PL(Max) relations generally give a shorterdistance. This serves as an important check on our calibra-tion of the extra-galactic distance scale. The closer distancefrom PL(Max) relations is expected (with the difference of∼0.015±0.004 mag, compared to the mean light counterparts),because Cepheids will appear closer at maximum light. The er-rors associated with maximum light are generally comparableto those at mean light. This will be studied in future work.
4.3. Comparison to published results
In order to compare our results with published values, we needto select the representative distance moduli from both LMC orGalactic PL relations. We pick the distance moduli from thederived OGLE LMC PL relations in Sect. 3.2.1 (i.e. Col. 4 ofTable 5) and FSG03 PL relations to represent the LMC andthe Galactic results, respectively. The CTE-corrected distancemoduli,µ0,CTE, are listed in Table 8. However, the metallicitycorrections are not required in these comparisons because theyare the same for published results and this work. The effect ofmetallicity corrections are discussed in Sect. 4.4.
The results of the comparisons are plotted in Fig. 8 andthe average difference between our distance moduli and thepublished values are presented in Table 11 for both the LMCand Galactic PL relations. The overall comparisons indicatethat our results are consistent with the published results. Whenusing the LMC PL relation, our distance moduli agree well
S. M. Kanbur et al.: Cepheid distance from LMC and Galactic PL relations 375
28 29 30 31 32
28
29
30
31
32
28 29 30 31 32-0.6
-0.4
-0.2
0
0.2
0.4
0.6
28 29 30 31 32
28
29
30
31
32
28 29 30 31 32-0.6
-0.4
-0.2
0
0.2
0.4
0.6
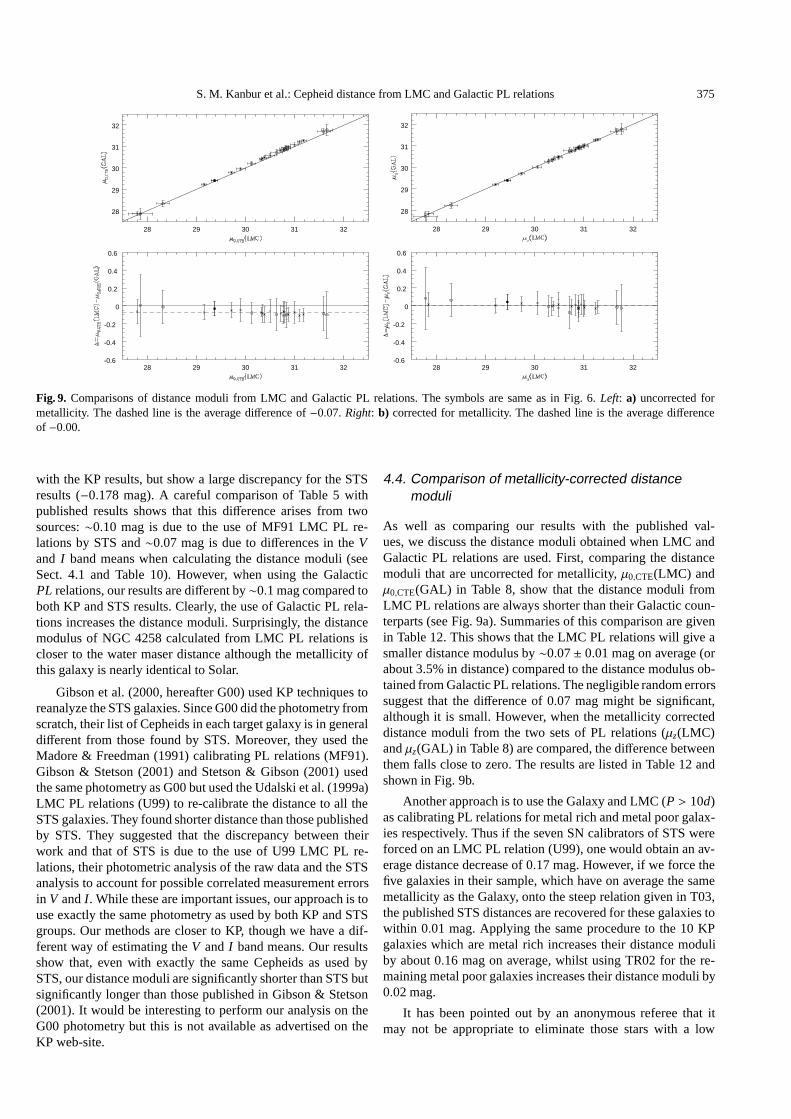
Fig. 9. Comparisons of distance moduli from LMC and Galactic PL relations. The symbols are same as in Fig. 6.Left: a) uncorrected formetallicity. The dashed line is the average difference of−0.07. Right: b) corrected for metallicity. The dashed line is the average differenceof −0.00.
with the KP results, but show a large discrepancy for the STSresults (−0.178 mag). A careful comparison of Table 5 withpublished results shows that this difference arises from twosources:∼0.10 mag is due to the use of MF91 LMC PL re-lations by STS and∼0.07 mag is due to differences in theVand I band means when calculating the distance moduli (seeSect. 4.1 and Table 10). However, when using the GalacticPL relations, our results are different by∼0.1 mag compared toboth KP and STS results. Clearly, the use of Galactic PL rela-tions increases the distance moduli. Surprisingly, the distancemodulus of NGC 4258 calculated from LMC PL relations iscloser to the water maser distance although the metallicity ofthis galaxy is nearly identical to Solar.
Gibson et al. (2000, hereafter G00) used KP techniques toreanalyze the STS galaxies. Since G00 did the photometry fromscratch, their list of Cepheids in each target galaxy is in generaldifferent from those found by STS. Moreover, they used theMadore & Freedman (1991) calibrating PL relations (MF91).Gibson & Stetson (2001) and Stetson & Gibson (2001) usedthe same photometry as G00 but used the Udalski et al. (1999a)LMC PL relations (U99) to re-calibrate the distance to all theSTS galaxies. They found shorter distance than those publishedby STS. They suggested that the discrepancy between theirwork and that of STS is due to the use of U99 LMC PL re-lations, their photometric analysis of the raw data and the STSanalysis to account for possible correlated measurement errorsin V andI . While these are important issues, our approach is touse exactly the same photometry as used by both KP and STSgroups. Our methods are closer to KP, though we have a dif-ferent way of estimating theV and I band means. Our resultsshow that, even with exactly the same Cepheids as used bySTS, our distance moduli are significantly shorter than STS butsignificantly longer than those published in Gibson & Stetson(2001). It would be interesting to perform our analysis on theG00 photometry but this is not available as advertised on theKP web-site.
4.4. Comparison of metallicity-corrected distancemoduli
As well as comparing our results with the published val-ues, we discuss the distance moduli obtained when LMC andGalactic PL relations are used. First, comparing the distancemoduli that are uncorrected for metallicity,µ0,CTE(LMC) andµ0,CTE(GAL) in Table 8, show that the distance moduli fromLMC PL relations are always shorter than their Galactic coun-terparts (see Fig. 9a). Summaries of this comparison are givenin Table 12. This shows that the LMC PL relations will give asmaller distance modulus by∼0.07± 0.01 mag on average (orabout 3.5% in distance) compared to the distance modulus ob-tained from Galactic PL relations. The negligible random errorssuggest that the difference of 0.07 mag might be significant,although it is small. However, when the metallicity correcteddistance moduli from the two sets of PL relations (µz(LMC)andµz(GAL) in Table 8) are compared, the difference betweenthem falls close to zero. The results are listed in Table 12 andshown in Fig. 9b.
Another approach is to use the Galaxy and LMC (P > 10d)as calibrating PL relations for metal rich and metal poor galax-ies respectively. Thus if the seven SN calibrators of STS wereforced on an LMC PL relation (U99), one would obtain an av-erage distance decrease of 0.17 mag. However, if we force thefive galaxies in their sample, which have on average the samemetallicity as the Galaxy, onto the steep relation given in T03,the published STS distances are recovered for these galaxies towithin 0.01 mag. Applying the same procedure to the 10 KPgalaxies which are metal rich increases their distance moduliby about 0.16 mag on average, whilst using TR02 for the re-maining metal poor galaxies increases their distance moduli by0.02 mag.
It has been pointed out by an anonymous referee that itmay not be appropriate to eliminate those stars with a low
376 S. M. Kanbur et al.: Cepheid distance from LMC and Galactic PL relations
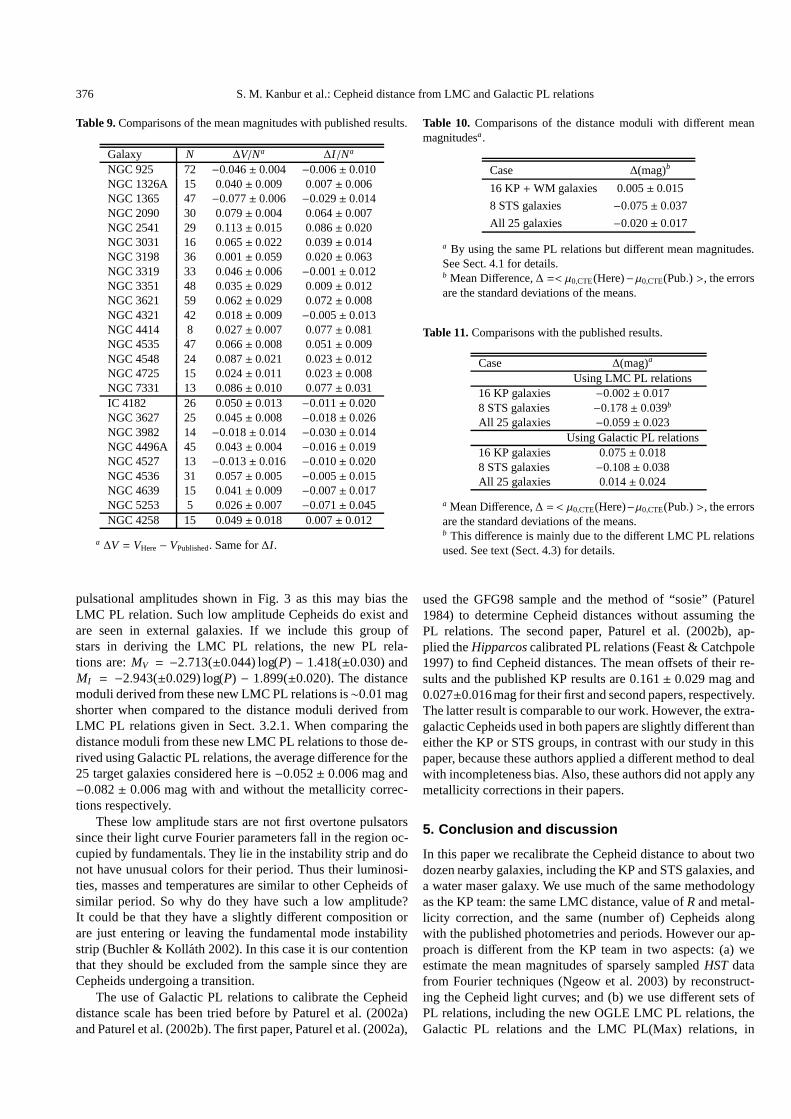
Table 9.Comparisons of the mean magnitudes with published results.
Galaxy N ∆V/Na ∆I/Na
NGC 925 72 −0.046± 0.004 −0.006± 0.010NGC 1326A 15 0.040± 0.009 0.007± 0.006NGC 1365 47 −0.077± 0.006 −0.029± 0.014NGC 2090 30 0.079± 0.004 0.064± 0.007NGC 2541 29 0.113± 0.015 0.086± 0.020NGC 3031 16 0.065± 0.022 0.039± 0.014NGC 3198 36 0.001± 0.059 0.020± 0.063NGC 3319 33 0.046± 0.006 −0.001± 0.012NGC 3351 48 0.035± 0.029 0.009± 0.012NGC 3621 59 0.062± 0.029 0.072± 0.008NGC 4321 42 0.018± 0.009 −0.005± 0.013NGC 4414 8 0.027± 0.007 0.077± 0.081NGC 4535 47 0.066± 0.008 0.051± 0.009NGC 4548 24 0.087± 0.021 0.023± 0.012NGC 4725 15 0.024± 0.011 0.023± 0.008NGC 7331 13 0.086± 0.010 0.077± 0.031IC 4182 26 0.050± 0.013 −0.011± 0.020NGC 3627 25 0.045± 0.008 −0.018± 0.026NGC 3982 14 −0.018± 0.014 −0.030± 0.014NGC 4496A 45 0.043± 0.004 −0.016± 0.019NGC 4527 13 −0.013± 0.016 −0.010± 0.020NGC 4536 31 0.057± 0.005 −0.005± 0.015NGC 4639 15 0.041± 0.009 −0.007± 0.017NGC 5253 5 0.026± 0.007 −0.071± 0.045NGC 4258 15 0.049± 0.018 0.007± 0.012
a ∆V = VHere− VPublished. Same for∆I .
pulsational amplitudes shown in Fig. 3 as this may bias theLMC PL relation. Such low amplitude Cepheids do exist andare seen in external galaxies. If we include this group ofstars in deriving the LMC PL relations, the new PL rela-tions are:MV = −2.713(±0.044) log(P) − 1.418(±0.030) andMI = −2.943(±0.029) log(P) − 1.899(±0.020). The distancemoduli derived from these new LMC PL relations is∼0.01 magshorter when compared to the distance moduli derived fromLMC PL relations given in Sect. 3.2.1. When comparing thedistance moduli from these new LMC PL relations to those de-rived using Galactic PL relations, the average difference for the25 target galaxies considered here is−0.052± 0.006 mag and−0.082± 0.006 mag with and without the metallicity correc-tions respectively.
These low amplitude stars are not first overtone pulsatorssince their light curve Fourier parameters fall in the region oc-cupied by fundamentals. They lie in the instability strip and donot have unusual colors for their period. Thus their luminosi-ties, masses and temperatures are similar to other Cepheids ofsimilar period. So why do they have such a low amplitude?It could be that they have a slightly different composition orare just entering or leaving the fundamental mode instabilitystrip (Buchler & Kollath 2002). In this case it is our contentionthat they should be excluded from the sample since they areCepheids undergoing a transition.
The use of Galactic PL relations to calibrate the Cepheiddistance scale has been tried before by Paturel et al. (2002a)and Paturel et al. (2002b). The first paper, Paturel et al. (2002a),
Table 10. Comparisons of the distance moduli with different meanmagnitudesa.
Case ∆(mag)b
16 KP+WM galaxies 0.005± 0.015
8 STS galaxies −0.075± 0.037
All 25 galaxies −0.020± 0.017
a By using the same PL relations but different mean magnitudes.See Sect. 4.1 for details.b Mean Difference,∆ =< µ0,CTE(Here)−µ0,CTE(Pub.) >, the errorsare the standard deviations of the means.
Table 11.Comparisons with the published results.
Case ∆(mag)a
Using LMC PL relations16 KP galaxies −0.002± 0.0178 STS galaxies −0.178± 0.039b
All 25 galaxies −0.059± 0.023Using Galactic PL relations
16 KP galaxies 0.075± 0.0188 STS galaxies −0.108± 0.038All 25 galaxies 0.014± 0.024
a Mean Difference,∆ =< µ0,CTE(Here)−µ0,CTE(Pub.) >, the errorsare the standard deviations of the means.b This difference is mainly due to the different LMC PL relationsused. See text (Sect. 4.3) for details.
used the GFG98 sample and the method of “sosie” (Paturel1984) to determine Cepheid distances without assuming thePL relations. The second paper, Paturel et al. (2002b), ap-plied theHipparcoscalibrated PL relations (Feast & Catchpole1997) to find Cepheid distances. The mean offsets of their re-sults and the published KP results are 0.161± 0.029 mag and0.027±0.016mag for their first and second papers, respectively.The latter result is comparable to our work. However, the extra-galactic Cepheids used in both papers are slightly different thaneither the KP or STS groups, in contrast with our study in thispaper, because these authors applied a different method to dealwith incompleteness bias. Also, these authors did not apply anymetallicity corrections in their papers.
5. Conclusion and discussion
In this paper we recalibrate the Cepheid distance to about twodozen nearby galaxies, including the KP and STS galaxies, anda water maser galaxy. We use much of the same methodologyas the KP team: the same LMC distance, value ofRand metal-licity correction, and the same (number of) Cepheids alongwith the published photometries and periods. However our ap-proach is different from the KP team in two aspects: (a) weestimate the mean magnitudes of sparsely sampledHSTdatafrom Fourier techniques (Ngeow et al. 2003) by reconstruct-ing the Cepheid light curves; and (b) we use different sets ofPL relations, including the new OGLE LMC PL relations, theGalactic PL relations and the LMC PL(Max) relations, in
S. M. Kanbur et al.: Cepheid distance from LMC and Galactic PL relations 377
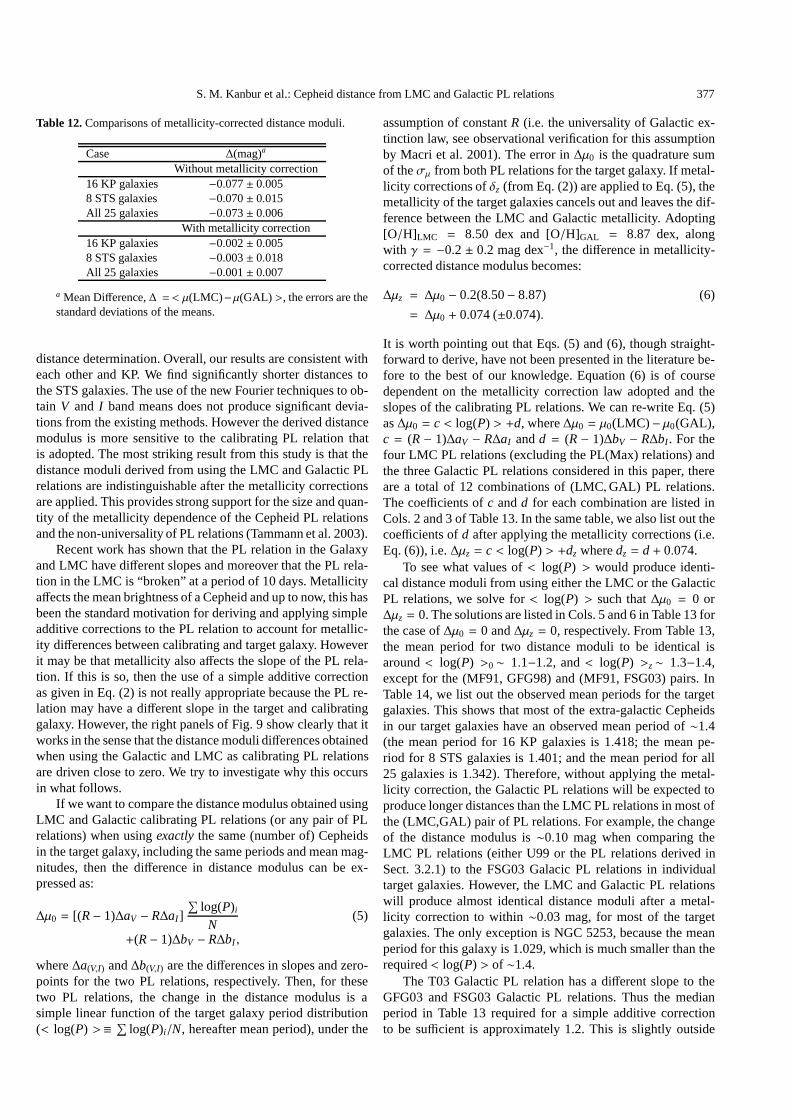
Table 12.Comparisons of metallicity-corrected distance moduli.
Case ∆(mag)a
Without metallicity correction16 KP galaxies −0.077± 0.0058 STS galaxies −0.070± 0.015All 25 galaxies −0.073± 0.006
With metallicity correction16 KP galaxies −0.002± 0.0058 STS galaxies −0.003± 0.018All 25 galaxies −0.001± 0.007
a Mean Difference,∆ =< µ(LMC)−µ(GAL) >, the errors are thestandard deviations of the means.
distance determination. Overall, our results are consistent witheach other and KP. We find significantly shorter distances tothe STS galaxies. The use of the new Fourier techniques to ob-tain V and I band means does not produce significant devia-tions from the existing methods. However the derived distancemodulus is more sensitive to the calibrating PL relation thatis adopted. The most striking result from this study is that thedistance moduli derived from using the LMC and Galactic PLrelations are indistinguishable after the metallicity correctionsare applied. This provides strong support for the size and quan-tity of the metallicity dependence of the Cepheid PL relationsand the non-universality of PL relations (Tammann et al. 2003).
Recent work has shown that the PL relation in the Galaxyand LMC have different slopes and moreover that the PL rela-tion in the LMC is “broken” at a period of 10 days. Metallicityaffects the mean brightness of a Cepheid and up to now, this hasbeen the standard motivation for deriving and applying simpleadditive corrections to the PL relation to account for metallic-ity differences between calibrating and target galaxy. Howeverit may be that metallicity also affects the slope of the PL rela-tion. If this is so, then the use of a simple additive correctionas given in Eq. (2) is not really appropriate because the PL re-lation may have a different slope in the target and calibratinggalaxy. However, the right panels of Fig. 9 show clearly that itworks in the sense that the distance moduli differences obtainedwhen using the Galactic and LMC as calibrating PL relationsare driven close to zero. We try to investigate why this occursin what follows.
If we want to compare the distance modulus obtained usingLMC and Galactic calibrating PL relations (or any pair of PLrelations) when usingexactlythe same (number of) Cepheidsin the target galaxy, including the same periods and mean mag-nitudes, then the difference in distance modulus can be ex-pressed as:
∆µ0 = [(R− 1)∆aV − R∆aI ]∑
log(P)i
N(5)
+(R− 1)∆bV − R∆bI ,
where∆a(V,I ) and∆b(V,I ) are the differences in slopes and zero-points for the two PL relations, respectively. Then, for thesetwo PL relations, the change in the distance modulus is asimple linear function of the target galaxy period distribution(< log(P) >≡ ∑ log(P)i/N, hereafter mean period), under the
assumption of constantR (i.e. the universality of Galactic ex-tinction law, see observational verification for this assumptionby Macri et al. 2001). The error in∆µ0 is the quadrature sumof theσµ from both PL relations for the target galaxy. If metal-licity corrections ofδz (from Eq. (2)) are applied to Eq. (5), themetallicity of the target galaxies cancels out and leaves the dif-ference between the LMC and Galactic metallicity. Adopting[O/H]LMC = 8.50 dex and [O/H]GAL = 8.87 dex, alongwith γ = −0.2 ± 0.2 mag dex−1, the difference in metallicity-corrected distance modulus becomes:
∆µz = ∆µ0 − 0.2(8.50− 8.87) (6)
= ∆µ0 + 0.074 (±0.074).
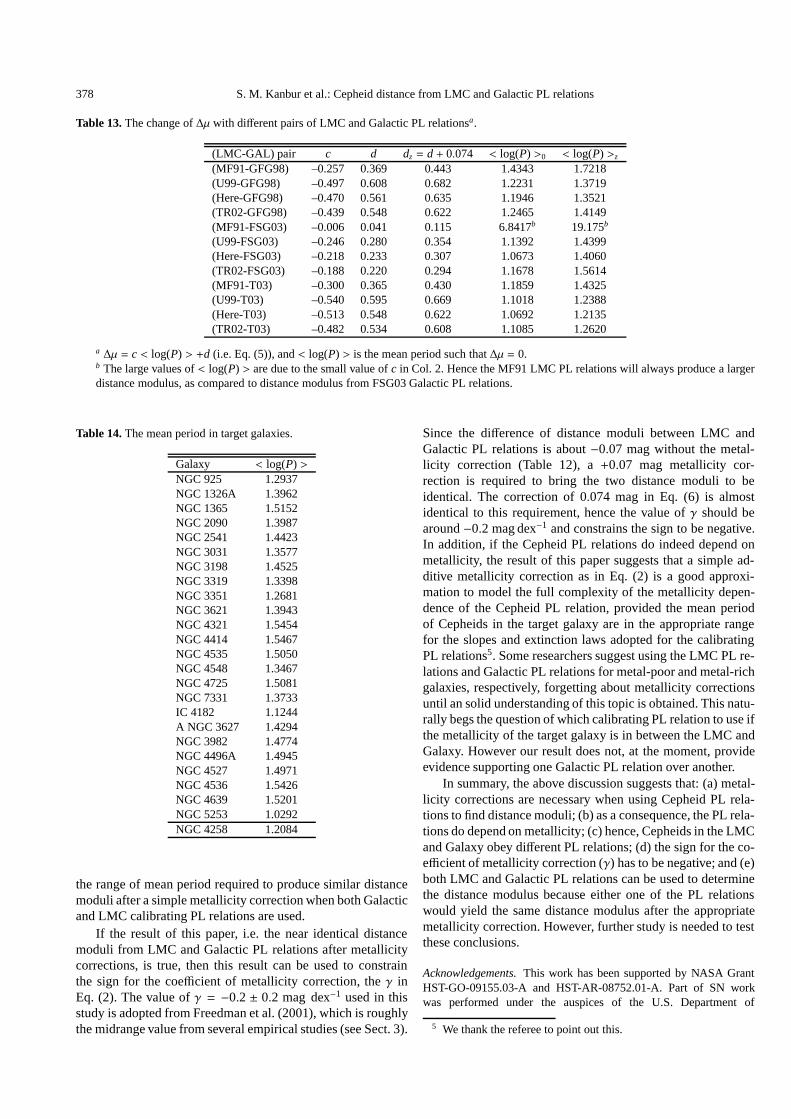
It is worth pointing out that Eqs. (5) and (6), though straight-forward to derive, have not been presented in the literature be-fore to the best of our knowledge. Equation (6) is of coursedependent on the metallicity correction law adopted and theslopes of the calibrating PL relations. We can re-write Eq. (5)as∆µ0 = c < log(P) > +d, where∆µ0 = µ0(LMC) − µ0(GAL),c = (R− 1)∆aV − R∆aI andd = (R− 1)∆bV − R∆bI . For thefour LMC PL relations (excluding the PL(Max) relations) andthe three Galactic PL relations considered in this paper, thereare a total of 12 combinations of (LMC,GAL) PL relations.The coefficients ofc andd for each combination are listed inCols. 2 and 3 of Table 13. In the same table, we also list out thecoefficients ofd after applying the metallicity corrections (i.e.Eq. (6)), i.e.∆µz = c < log(P) > +dz wheredz = d+ 0.074.
To see what values of< log(P) > would produce identi-cal distance moduli from using either the LMC or the GalacticPL relations, we solve for< log(P) > such that∆µ0 = 0 or∆µz = 0. The solutions are listed in Cols. 5 and 6 in Table 13 forthe case of∆µ0 = 0 and∆µz = 0, respectively. From Table 13,the mean period for two distance moduli to be identical isaround< log(P) >0∼ 1.1−1.2, and< log(P) >z∼ 1.3−1.4,except for the (MF91, GFG98) and (MF91, FSG03) pairs. InTable 14, we list out the observed mean periods for the targetgalaxies. This shows that most of the extra-galactic Cepheidsin our target galaxies have an observed mean period of∼1.4(the mean period for 16 KP galaxies is 1.418; the mean pe-riod for 8 STS galaxies is 1.401; and the mean period for all25 galaxies is 1.342). Therefore, without applying the metal-licity correction, the Galactic PL relations will be expected toproduce longer distances than the LMC PL relations in most ofthe (LMC,GAL) pair of PL relations. For example, the changeof the distance modulus is∼0.10 mag when comparing theLMC PL relations (either U99 or the PL relations derived inSect. 3.2.1) to the FSG03 Galacic PL relations in individualtarget galaxies. However, the LMC and Galactic PL relationswill produce almost identical distance moduli after a metal-licity correction to within∼0.03 mag, for most of the targetgalaxies. The only exception is NGC 5253, because the meanperiod for this galaxy is 1.029, which is much smaller than therequired< log(P) > of ∼1.4.
The T03 Galactic PL relation has a different slope to theGFG03 and FSG03 Galactic PL relations. Thus the medianperiod in Table 13 required for a simple additive correctionto be sufficient is approximately 1.2. This is slightly outside
378 S. M. Kanbur et al.: Cepheid distance from LMC and Galactic PL relations
Table 13.The change of∆µ with different pairs of LMC and Galactic PL relationsa.
(LMC-GAL) pair c d dz = d + 0.074 < log(P) >0 < log(P) >z
(MF91-GFG98) –0.257 0.369 0.443 1.4343 1.7218(U99-GFG98) –0.497 0.608 0.682 1.2231 1.3719(Here-GFG98) –0.470 0.561 0.635 1.1946 1.3521(TR02-GFG98) –0.439 0.548 0.622 1.2465 1.4149(MF91-FSG03) –0.006 0.041 0.115 6.8417b 19.175b
(U99-FSG03) –0.246 0.280 0.354 1.1392 1.4399(Here-FSG03) –0.218 0.233 0.307 1.0673 1.4060(TR02-FSG03) –0.188 0.220 0.294 1.1678 1.5614(MF91-T03) –0.300 0.365 0.430 1.1859 1.4325(U99-T03) –0.540 0.595 0.669 1.1018 1.2388(Here-T03) –0.513 0.548 0.622 1.0692 1.2135(TR02-T03) –0.482 0.534 0.608 1.1085 1.2620
a ∆µ = c < log(P) > +d (i.e. Eq. (5)), and< log(P) > is the mean period such that∆µ = 0.b The large values of< log(P) > are due to the small value ofc in Col. 2. Hence the MF91 LMC PL relations will always produce a largerdistance modulus, as compared to distance modulus from FSG03 Galactic PL relations.
Table 14.The mean period in target galaxies.
Galaxy < log(P) >NGC 925 1.2937NGC 1326A 1.3962NGC 1365 1.5152NGC 2090 1.3987NGC 2541 1.4423NGC 3031 1.3577NGC 3198 1.4525NGC 3319 1.3398NGC 3351 1.2681NGC 3621 1.3943NGC 4321 1.5454NGC 4414 1.5467NGC 4535 1.5050NGC 4548 1.3467NGC 4725 1.5081NGC 7331 1.3733IC 4182 1.1244A NGC 3627 1.4294NGC 3982 1.4774NGC 4496A 1.4945NGC 4527 1.4971NGC 4536 1.5426NGC 4639 1.5201NGC 5253 1.0292NGC 4258 1.2084
the range of mean period required to produce similar distancemoduli after a simple metallicity correction when both Galacticand LMC calibrating PL relations are used.
If the result of this paper, i.e. the near identical distancemoduli from LMC and Galactic PL relations after metallicitycorrections, is true, then this result can be used to constrainthe sign for the coefficient of metallicity correction, theγ inEq. (2). The value ofγ = −0.2 ± 0.2 mag dex−1 used in thisstudy is adopted from Freedman et al. (2001), which is roughlythe midrange value from several empirical studies (see Sect. 3).
Since the difference of distance moduli between LMC andGalactic PL relations is about−0.07 mag without the metal-licity correction (Table 12), a+0.07 mag metallicity cor-rection is required to bring the two distance moduli to beidentical. The correction of 0.074 mag in Eq. (6) is almostidentical to this requirement, hence the value ofγ should bearound−0.2 mag dex−1 and constrains the sign to be negative.In addition, if the Cepheid PL relations do indeed depend onmetallicity, the result of this paper suggests that a simple ad-ditive metallicity correction as in Eq. (2) is a good approxi-mation to model the full complexity of the metallicity depen-dence of the Cepheid PL relation, provided the mean periodof Cepheids in the target galaxy are in the appropriate rangefor the slopes and extinction laws adopted for the calibratingPL relations5. Some researchers suggest using the LMC PL re-lations and Galactic PL relations for metal-poor and metal-richgalaxies, respectively, forgetting about metallicity correctionsuntil an solid understanding of this topic is obtained. This natu-rally begs the question of which calibrating PL relation to use ifthe metallicity of the target galaxy is in between the LMC andGalaxy. However our result does not, at the moment, provideevidence supporting one Galactic PL relation over another.
In summary, the above discussion suggests that: (a) metal-licity corrections are necessary when using Cepheid PL rela-tions to find distance moduli; (b) as a consequence, the PL rela-tions do depend on metallicity; (c) hence, Cepheids in the LMCand Galaxy obey different PL relations; (d) the sign for the co-efficient of metallicity correction (γ) has to be negative; and (e)both LMC and Galactic PL relations can be used to determinethe distance modulus because either one of the PL relationswould yield the same distance modulus after the appropriatemetallicity correction. However, further study is needed to testthese conclusions.
Acknowledgements.This work has been supported by NASA GrantHST-GO-09155.03-A and HST-AR-08752.01-A. Part of SN workwas performed under the auspices of the U.S. Department of
5 We thank the referee to point out this.
S. M. Kanbur et al.: Cepheid distance from LMC and Galactic PL relations 379
Energy, National Nuclear Security Administration by the Universityof California, Lawrence Livermore National Laboratory under con-tract W7405-Eng-48. We thank an anonymous referee for many help-ful suggestions that made the paper more relevant. Special thanks toD. Leonard for some discussions and G. A. Tammann for letting usto read their unpublished papers and useful discussion. The authorswould like to thank R. Ciardullo for providing the reference of Solarmetallicity.
References
Beaulieu, J. P., Sasselov, D. D., Renault, C., et al. 1997, A&A, 318,L47
Beaulieu, J. P., Buchler, J. R., & Koll´ath, Z. 2001, A&A, 373, 164Buchler, R., & Kollath, Z. 2002, ApJ, 573, 324Caputo, F., Marconi, M., Musella, I., & Santolamazza, P. 2000, A&A,
359, 1059Cardelli, J. A., Clayton, G. C., & Mathis, J. S. 1989, ApJ, 345, 245Feast, M., & Walker, A. 1987, ARA&A, 25, 345Feast, M., & Catchpole, R. 1997, MNRAS, 286, L1Feast, M. 1999, PASP, 111, 775Feast, M. 2001, Odessa Astronomical Pub., 14, 144
[astro-ph/0110360]Feast, M. 2003, in Stellar Candles for Extragalactic Distance,
ed. Allan & Gieren, Springer Lecture Notes in Physics, 635[astro-ph/0301100]
Freedman, W. 1988, ApJ, 326, 691Freedman, W., & Madore, B. 1990, ApJ, 365, 186Freedman, W. L., Hughes, S. M., Madore, B. F., et al. 1994, ApJ, 427,
628Ferrarese, L., Ford, H. C., Huchra, J., et al. 2000, ApJS, 128, 431Fouque, P., Storm, J., & Gieren, W. 2003, in Stellar Candles for
Extragalactic Distance, ed. Allan & Gieren, Springer LectureNotes in Physics, 635, 21 [astro-ph/0301291]
Freedman, W. L., Madore, B. F., Gibson, B. K., et al. 2001, ApJ, 553,47 (KP)
Gibson, B. K., Stetson, P. B., Freedman, W. L., et al. 2000, ApJ, 529,723
Gibson, B., & Stetson, P. 2001, ApJ, 547, L103Gieren, W., Fouqu´e, P., & Gomez, M. 1998, ApJ, 496, 17Gould, A. 1994, ApJ, 426, 542Grevesse, N., Noels, A., & Sauval, A. J. 1996, in Cosmic Abundances,
ed. Holt, & Sonneborn, ASP Conf. Ser., 99, 117Groenewegen, M., & Oudmaijer, R. D. 2000, A&A, 356, 849Groenewegen, M. 2000, A&A, 363, 901Hendry, M., & Kanbur, S. 1996, in Mapping, Measuring, and
Modeling the Universe, ed. Coles Martinez, & Pons-Borderia,ASP Conf. Ser., 94, 357 [astro/ph-9603014]
Herrnstein, J. R., Moran, J. M., Greenhill, L. J., et al. 1999, Nature,400, 539
Hill, R. J., Ferrarese, L., Stetson, P. B., et al. 1998, ApJ, 496, 648Holtzman, J. A., Burrows, C. J., Casertano, S., et al. 1995, PASP, 107,
1065Kanbur, S., & Hendry, M. 1996, A&A, 305, 1Kelson, D. D., Illingworth, G. D., Freedman, W. F., et al. 1996, ApJ,
463, 26
Kennicutt, R., Freedman, W., & Mould, J. 1995, AJ, 110, 1476Kennicutt, R., et al. 1998, ApJ, 491, 13Kochanek, C. S. 1997, ApJ, 491, 13Labhardt, L., Sandage, A., & Tammann, G. A. 1997, A&A, 322, 751Lanoix, P., Paturel, G., & Garnier, R. 1999a, ApJ, 517, 188Lanoix, P., Paturel, G., & Garnier, R. 1999b, MNRAS, 308, 969Leonard, D., Kanbur, S., Ngeow, C., & Tanvir, N. 2003, ApJ, 594, 247Macri, L. M., Calzetti, D., Freedman, W. L., et al. 2001, ApJ, 549, 721Madore, B. 1982, PASP, 253, 575Madore, B., & Freedman, W. 1991, PASP, 103, 933Moffett, T., & Barnes, T. 1984, ApJS, 55, 389Moffett, T., & Barnes, T. 1986, ApJ, 304, 607Mould, J. R., Huchra, J. P., Freedman, W. L., et al. 2000, ApJ, 529,
786Newman, J., et al. 2001, ApJ, 553, 562Ngeow, C., Kanbur, S., Nikolaev, S., Tanvir, N., & Hendry, M. 2003,
ApJ, 586, 959Nikolaev, S., Drake, A. J., Keller, S. C., et al. 2003, ApJ, in pressPaturel, G. 1984, ApJ, 282, 382Paturel, G., Theureau, G., Fouqu´e, P., et al. 2002a, A&A, 383, 398Paturel, G., Teerikorpi, P., Theureau, G., et al. 2002a, A&A, 389, 19Saha, A., Labhardt, L., Schwengeler, H., et al. 1994, ApJ, 425, 14Saha, A., Sandage, A., Labhardt, L., et al. 1995, ApJ, 438, 8Saha, A., Sandage, A., Labhardt, L., et al. 1996, ApJ, 466, 55Saha, A., Sandage, A., Thim, F., et al. 2001a, ApJ, 551, 973Saha, A., Sandage, A., Tammann, G. A., et al. 2001b, ApJ, 562, 314
(STS)Sandage, A., & Tammann, G. A. 1968, ApJ, 151, 531Sandage, A. 1988, PASP, 100, 935Sasselov, D. D., Beaulieu, J. P., Renault, C., et al. 1997, A&A, 324,
471Schechter, P., Mateo, M., & Saha, A. 1993, PASP, 105, 1324Sebo, K. M., Rawson, D., Mould, J., et al. 2002, ApJS, 142, 71Silbermann, N. A., Harding, P., Madore, B. F., et al. 1996, ApJ, 470, 1Simon, N., Kanbur, S., & Mihalas, D. 1993, ApJ, 414, 310Spergel, D. N., Verde, L., Peiris, H. V., et al. 2003, ApJS, 148, 175Stetson, P. 1994, PASP, 106, 250Stetson, P. 1996, PASP, 108, 851Stetson, P. 1998, PASP, 110, 1448Stetson, P. B., Saha, A., Ferrarese, L., et al. 1998b, ApJ, 508, 491Stetson, P., & Gibson, B. 2001, MNRAS, 328, L1Tammann, G. A., Reindl, B., Thim, F., Saha, A., & Sandage, A. 2001,
in A New Era in Cosmology, ed. Metcalfe, & Shanks, ASP Conf.Ser., 283, 258 [astro-ph/0112489]
Tammann, G. A., & Reindl, B. 2002, Ap&SS, 280, 165[astro-ph/0208178]
Tammann, G. A. 2003, private-communicationTammann, G. A., Sandage, A., & Reindl, B. 2003, A&A, 404, 423Tanvir, N. 1997, in The Extra-galactic Distance Scale, STScI Series,
ed. Livio, 91 [astro-ph/9611027]Tanvir, N. 1999, in Harmonizing Cosmic Distance Scales in a Post-
HIPPARCOS Era, ed. Egret, & Heck, ASP Conf. Ser., 167, 84[astro-ph/9812356]
Tanvir, N., Ferguson, H., & Shanks, T. 1999, MNRAS, 310, 175Thim, F., Tammann, G. A., Saha, A., et al. 2003, ApJ, 590, 256Udalski, A., Szymanski, M., Kubiak, M., et al. 1999a, AcA, 49, 201Udalski, A., Soszynski, I., Szymanski, M., et al. 1999b, AcA, 49, 223Willick, J., & Batra, P. 2000, ApJ, 548, 564