kamrul presentation icac 2014 - icac.org - home · cotton crop calendar in bangladesh introduction...
TRANSCRIPT
6/30/14
1
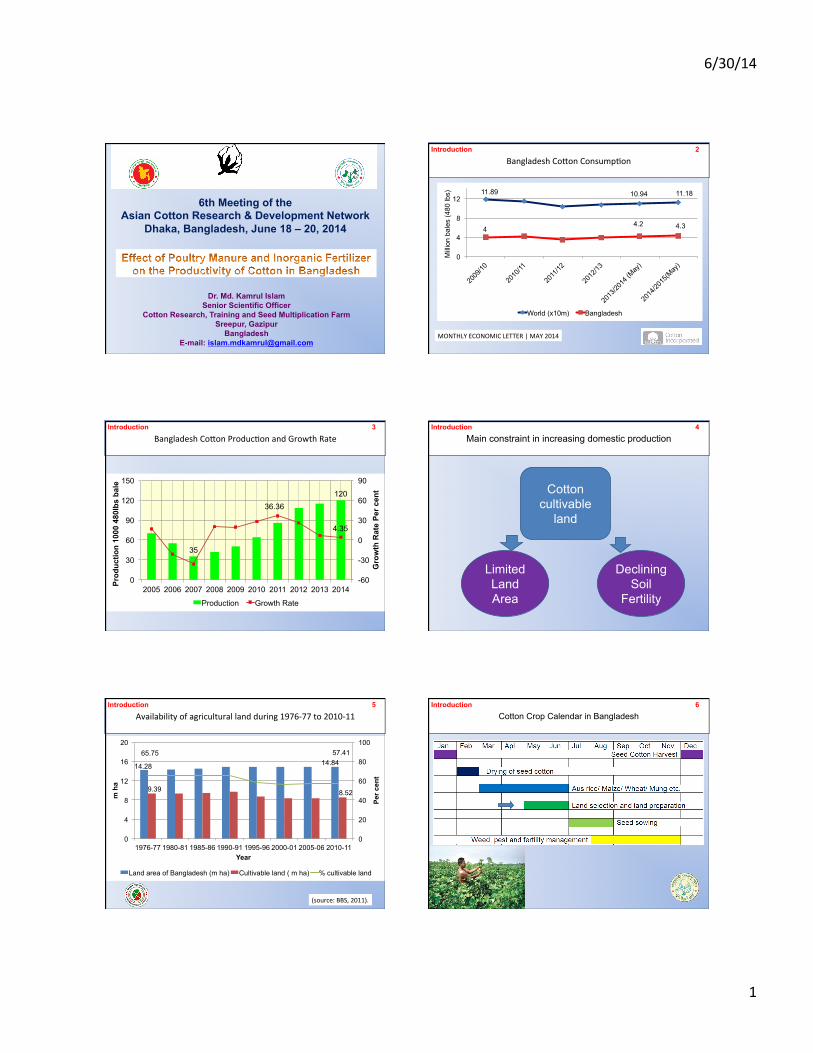
Dr. Md. Kamrul Islam Senior Scientific Officer
Cotton Research, Training and Seed Multiplication Farm Sreepur, Gazipur
Bangladesh E-mail: [email protected]
6th Meeting of the Asian Cotton Research & Development Network
Dhaka, Bangladesh, June 18 – 20, 2014
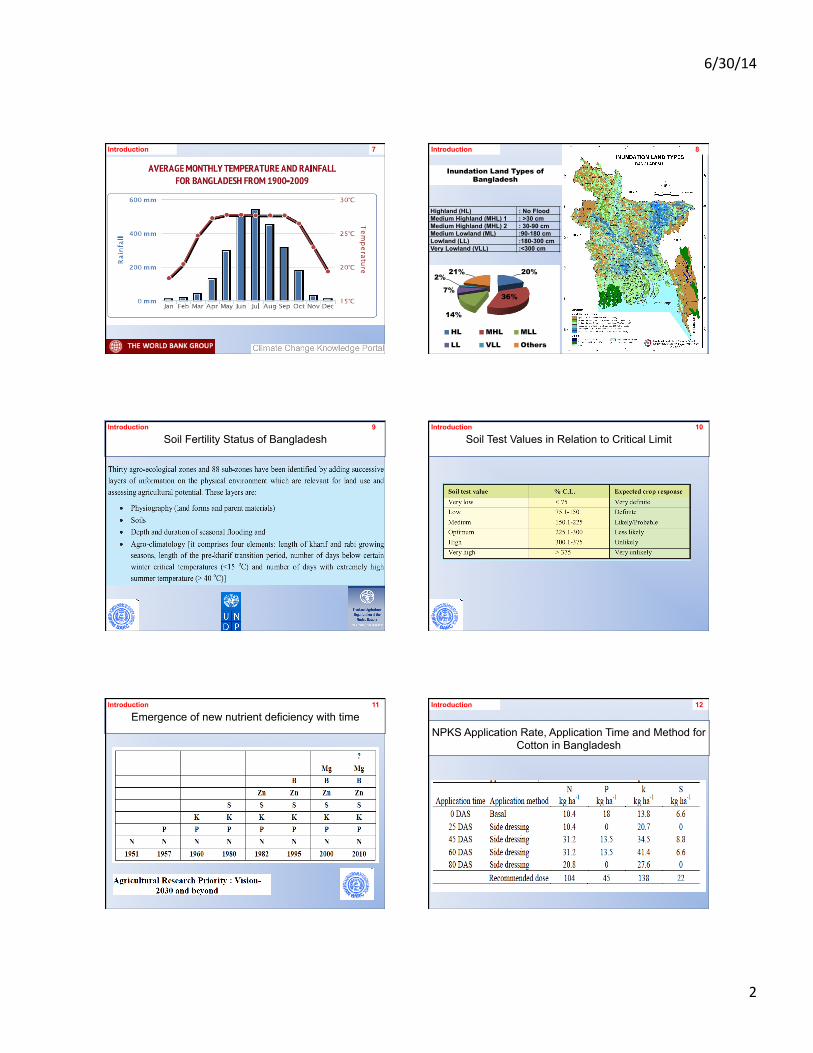
Bangladesh Co3on Consump7on
11.89 10.94 11.18
4 4.2 4.3
0
4
8
12
2009
/10
2010
/11
2011
/12
2012
/13
2013
/2014
(May
)
2014
/2015
(May
)
Mill
ion
bale
s (4
80 lb
s)
World (x10m) Bangladesh
MONTHLY ECONOMIC LETTER | MAY 2014
Introduction 2
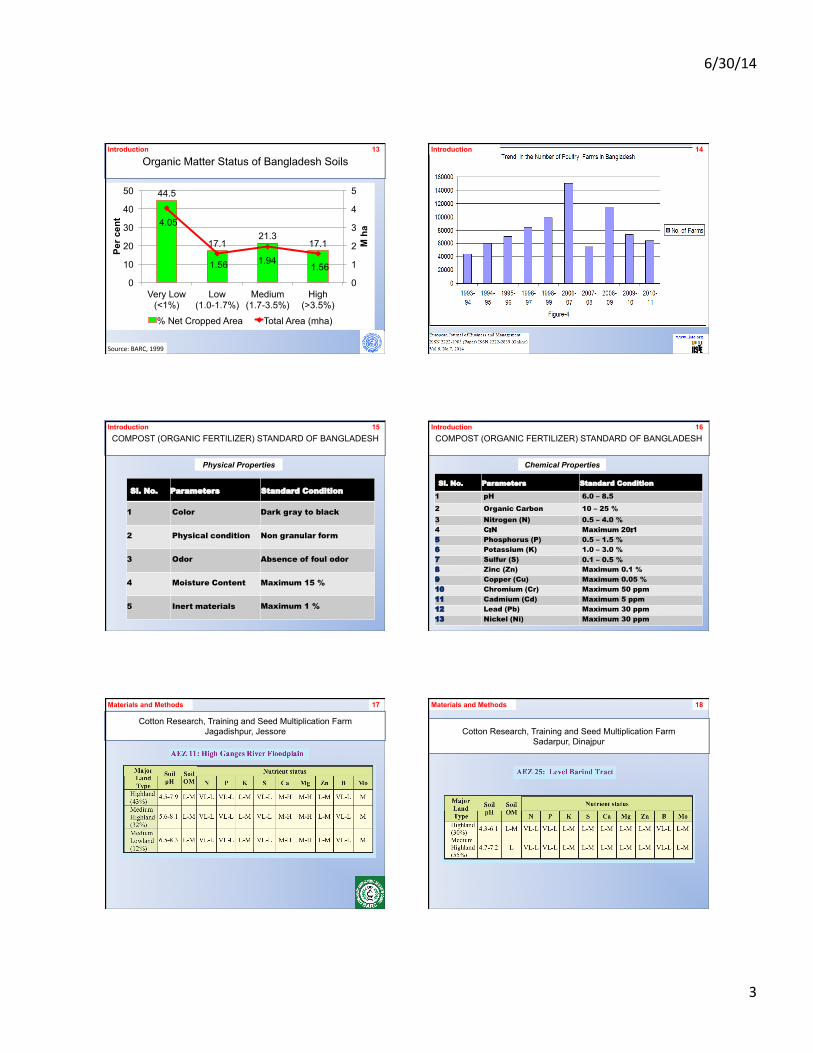
Bangladesh Co3on Produc7on and Growth Rate
35
120 36.36
4.35
-60
-30
0
30
60
90
0
30
60
90
120
150
2005 2006 2007 2008 2009 2010 2011 2012 2013 2014
Gro
wth
Rat
e Pe
r cen
t
Prod
uctio
n 10
00 4
80lb
s ba
le
Production Growth Rate
Introduction 3
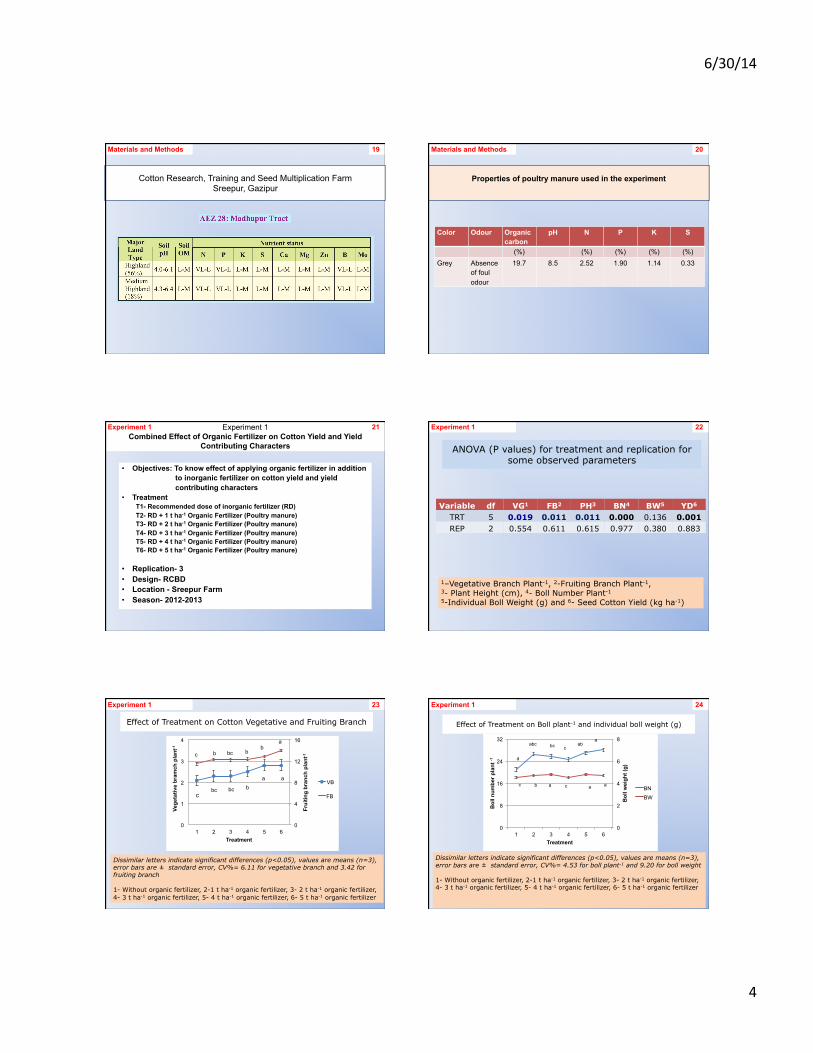
Main constraint in increasing domestic production
Cotton cultivable
land
Limited Land Area
Declining Soil
Fertility
Introduction 4
Availability of agricultural land during 1976-‐77 to 2010-‐11
(source: BBS, 2011).
14.28 14.84
9.39 8.52
65.75 57.41
0
20
40
60
80
100
0
4
8
12
16
20
1976-77 1980-81 1985-86 1990-91 1995-96 2000-01 2005-06 2010-11
Per c
ent
m h
a
Year
Land area of Bangladesh (m ha) Cultivable land ( m ha) % cultivable land
Introduction 5 Cotton Crop Calendar in Bangladesh
Introduction 6
6/30/14
2
Introduction 7
Highland (HL) : No Flood Medium Highland (MHL) 1 : >30 cm Medium Highland (MHL) 2 : 30-90 cm Medium Lowland (ML) :90-180 cm Lowland (LL) :180-300 cm Very Lowland (VLL) :<300 cm
20%
36%
14%
7%
2% 21%
HL MHL MLL
LL VLL Others
Inundation Land Types of Bangladesh
Introduction 8
Soil Fertility Status of Bangladesh Introduction 9
Soil Test Values in Relation to Critical Limit Introduction 10
Emergence of new nutrient deficiency with time Introduction 11
NPKS Application Rate, Application Time and Method for Cotton in Bangladesh
Introduction 12
6/30/14
3
Source: BARC, 1999
Organic Matter Status of Bangladesh Soils
44.5
17.1 21.3
17.1
4.05
1.56 1.94 1.56
0
1
2
3
4
5
0
10
20
30
40
50
Very Low (<1%)
Low (1.0-1.7%)
Medium (1.7-3.5%)
High (>3.5%)
M h
a
Per c
ent
% Net Cropped Area Total Area (mha)
Introduction 13 Introduction 14
COMPOST (ORGANIC FERTILIZER) STANDARD OF BANGLADESH
Physical Properties
Sl. No. Parameters Standard Condition
1 Color Dark gray to black
2 Physical condition Non granular form
3 Odor Absence of foul odor
4 Moisture Content Maximum 15 %
5 Inert materials Maximum 1 %
Introduction 15 COMPOST (ORGANIC FERTILIZER) STANDARD OF BANGLADESH
Chemical Properties
Sl. No. Parameters Standard Condition
1 pH 6.0 – 8.5
2 Organic Carbon 10 – 25 %
3 Nitrogen (N) 0.5 – 4.0 %
4 C:N Maximum 20:1
5 Phosphorus (P) 0.5 – 1.5 %
6 Potassium (K) 1.0 – 3.0 %
7 Sulfur (S) 0.1 – 0.5 %
8 Zinc (Zn) Maximum 0.1 %
9 Copper (Cu) Maximum 0.05 %
10 Chromium (Cr) Maximum 50 ppm
11 Cadmium (Cd) Maximum 5 ppm
12 Lead (Pb) Maximum 30 ppm
13 Nickel (Ni) Maximum 30 ppm
Introduction 16
Cotton Research, Training and Seed Multiplication Farm Jagadishpur, Jessore
Materials and Methods 17
Cotton Research, Training and Seed Multiplication Farm Sadarpur, Dinajpur
Materials and Methods 18
6/30/14
4
Cotton Research, Training and Seed Multiplication Farm Sreepur, Gazipur
Materials and Methods 19
Properties of poultry manure used in the experiment
Color Odour Organic carbon
pH N P K S
(%) (%) (%) (%) (%) Grey Absence
of foul odour
19.7 8.5 2.52 1.90 1.14 0.33
Materials and Methods 20
Experiment 1 Combined Effect of Organic Fertilizer on Cotton Yield and Yield
Contributing Characters
• Objectives: To know effect of applying organic fertilizer in addition to inorganic fertilizer on cotton yield and yield contributing characters • Treatment
T1- Recommended dose of inorganic fertilizer (RD) T2- RD + 1 t ha-1 Organic Fertilizer (Poultry manure) T3- RD + 2 t ha-1 Organic Fertilizer (Poultry manure) T4- RD + 3 t ha-1 Organic Fertilizer (Poultry manure) T5- RD + 4 t ha-1 Organic Fertilizer (Poultry manure) T6- RD + 5 t ha-1 Organic Fertilizer (Poultry manure)
• Replication- 3 • Design- RCBD • Location - Sreepur Farm • Season- 2012-2013
Experiment 1 21
ANOVA (P values) for treatment and replication for some observed parameters
Variable df VG1 FB2 PH3 BN4 BW5 YD6 TRT 5 0.019 0.011 0.011 0.000 0.136 0.001 REP 2 0.554 0.611 0.615 0.977 0.380 0.883
1–Vegetative Branch Plant-1, 2-Fruiting Branch Plant-1, 3- Plant Height (cm), 4- Boll Number Plant-1
5-Individual Boll Weight (g) and 6- Seed Cotton Yield (kg ha-1)
Experiment 1 22
Effect of Treatment on Cotton Vegetative and Fruiting Branch
Dissimilar letters indicate significant differences (p<0.05), values are means (n=3), error bars are ± standard error, CV%= 6.11 for vegetative branch and 3.42 for fruiting branch 1- Without organic fertilizer, 2-1 t ha-1 organic fertilizer, 3- 2 t ha-1 organic fertilizer, 4- 3 t ha-1 organic fertilizer, 5- 4 t ha-1 organic fertilizer, 6- 5 t ha-1 organic fertilizer
0
4
8
12
16
0
1
2
3
4
1 2 3 4 5 6
Frui
ting
bran
ch p
lant
-1
Vege
tativ
e br
amch
pla
nt-1
Treatment
VB
FB c bc bc b
a a
c b bc b b
a
Experiment 1 23
Effect of Treatment on Boll plant-1 and individual boll weight (g)
Dissimilar letters indicate significant differences (p<0.05), values are means (n=3), error bars are ± standard error, CV%= 4.53 for boll plant-1 and 9.20 for boll weight 1- Without organic fertilizer, 2-1 t ha-1 organic fertilizer, 3- 2 t ha-1 organic fertilizer, 4- 3 t ha-1 organic fertilizer, 5- 4 t ha-1 organic fertilizer, 6- 5 t ha-1 organic fertilizer
0
2
4
6
8
0
8
16
24
32
1 2 3 4 5 6
Bol
l wei
ght (
g)
Bol
l num
ber p
lant
-1
Treatment
BN
BW
d
abc bc c ab
a
c b a c a a
Experiment 1 24
6/30/14
5
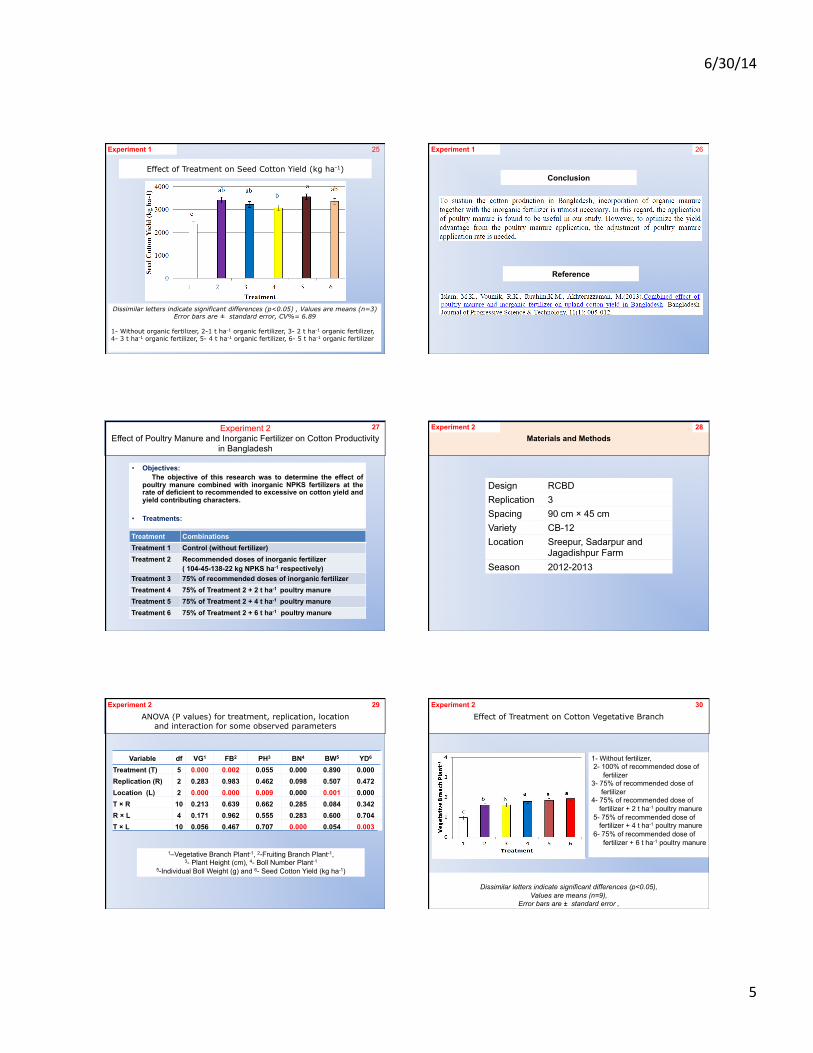
Effect of Treatment on Seed Cotton Yield (kg ha-1)
Dissimilar letters indicate significant differences (p<0.05) , Values are means (n=3) Error bars are ± standard error, CV%= 6.89
1- Without organic fertilizer, 2-1 t ha-1 organic fertilizer, 3- 2 t ha-1 organic fertilizer, 4- 3 t ha-1 organic fertilizer, 5- 4 t ha-1 organic fertilizer, 6- 5 t ha-1 organic fertilizer
Experiment 1 25
Conclusion
Experiment 1 26
Reference
Experiment 2 Effect of Poultry Manure and Inorganic Fertilizer on Cotton Productivity
in Bangladesh
• Objectives: The objective of this research was to determine the effect of
poultry manure combined with inorganic NPKS fertilizers at the rate of deficient to recommended to excessive on cotton yield and yield contributing characters.
• Treatments:
Treatment Combinations Treatment 1 Control (without fertilizer) Treatment 2 Recommended doses of inorganic fertilizer
( 104-45-138-22 kg NPKS ha-1 respectively) Treatment 3 75% of recommended doses of inorganic fertilizer Treatment 4 75% of Treatment 2 + 2 t ha-1 poultry manure Treatment 5 75% of Treatment 2 + 4 t ha-1 poultry manure Treatment 6 75% of Treatment 2 + 6 t ha-1 poultry manure
27 Materials and Methods
Design RCBD Replication 3 Spacing 90 cm × 45 cm Variety CB-12 Location Sreepur, Sadarpur and
Jagadishpur Farm Season 2012-2013
Experiment 2 28
Variable df VG1 FB2 PH3 BN4 BW5 YD6 Treatment (T) 5 0.000 0.002 0.055 0.000 0.890 0.000 Replication (R) 2 0.283 0.983 0.462 0.098 0.507 0.472 Location (L) 2 0.000 0.000 0.009 0.000 0.001 0.000 T × R 10 0.213 0.639 0.662 0.285 0.084 0.342 R × L 4 0.171 0.962 0.555 0.283 0.600 0.704 T × L 10 0.056 0.467 0.707 0.000 0.054 0.003
1–Vegetative Branch Plant-1, 2-Fruiting Branch Plant-1, 3- Plant Height (cm), 4- Boll Number Plant-1
5-Individual Boll Weight (g) and 6- Seed Cotton Yield (kg ha-1)
ANOVA (P values) for treatment, replication, location
and interaction for some observed parameters
Experiment 2 29
Dissimilar letters indicate significant differences (p<0.05),
Values are means (n=9), Error bars are ± standard error ,
CV%= 17.6
Effect of Treatment on Cotton Vegetative Branch
1- Without fertilizer, 2- 100% of recommended dose of fertilizer 3- 75% of recommended dose of fertilizer 4- 75% of recommended dose of fertilizer + 2 t ha-1 poultry manure 5- 75% of recommended dose of fertilizer + 4 t ha-1 poultry manure 6- 75% of recommended dose of fertilizer + 6 t ha-1 poultry manure
Experiment 2 30
6/30/14
6
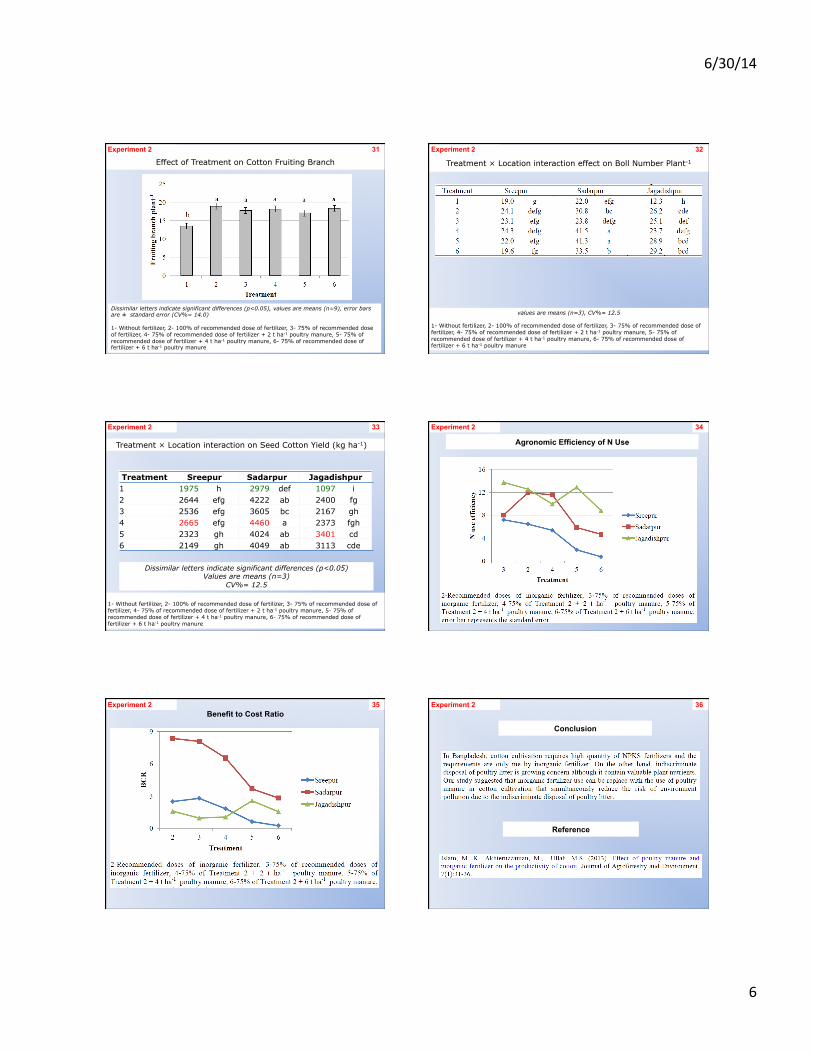
Effect of Treatment on Cotton Fruiting Branch
Dissimilar letters indicate significant differences (p<0.05), values are means (n=9), error bars are ± standard error (CV%= 14.0) 1- Without fertilizer, 2- 100% of recommended dose of fertilizer, 3- 75% of recommended dose of fertilizer, 4- 75% of recommended dose of fertilizer + 2 t ha-1 poultry manure, 5- 75% of recommended dose of fertilizer + 4 t ha-1 poultry manure, 6- 75% of recommended dose of fertilizer + 6 t ha-1 poultry manure
Experiment 2 31 Treatment × Location interaction effect on Boll Number Plant-1
values are means (n=3), CV%= 12.5 1- Without fertilizer, 2- 100% of recommended dose of fertilizer, 3- 75% of recommended dose of fertilizer, 4- 75% of recommended dose of fertilizer + 2 t ha-1 poultry manure, 5- 75% of recommended dose of fertilizer + 4 t ha-1 poultry manure, 6- 75% of recommended dose of fertilizer + 6 t ha-1 poultry manure
Experiment 2 32
Treatment Sreepur Sadarpur Jagadishpur 1 1975 h 2979 def 1097 i 2 2644 efg 4222 ab 2400 fg 3 2536 efg 3605 bc 2167 gh 4 2665 efg 4460 a 2373 fgh 5 2323 gh 4024 ab 3401 cd 6 2149 gh 4049 ab 3113 cde
Treatment × Location interaction on Seed Cotton Yield (kg ha-1)
1- Without fertilizer, 2- 100% of recommended dose of fertilizer, 3- 75% of recommended dose of fertilizer, 4- 75% of recommended dose of fertilizer + 2 t ha-1 poultry manure, 5- 75% of recommended dose of fertilizer + 4 t ha-1 poultry manure, 6- 75% of recommended dose of fertilizer + 6 t ha-1 poultry manure
Dissimilar letters indicate significant differences (p<0.05) Values are means (n=3)
CV%= 12.5
Experiment 2 33
Agronomic Efficiency of N Use
Experiment 2 34
Benefit to Cost Ratio Experiment 2 35
Conclusion
Experiment 2 36
Reference
6/30/14
7
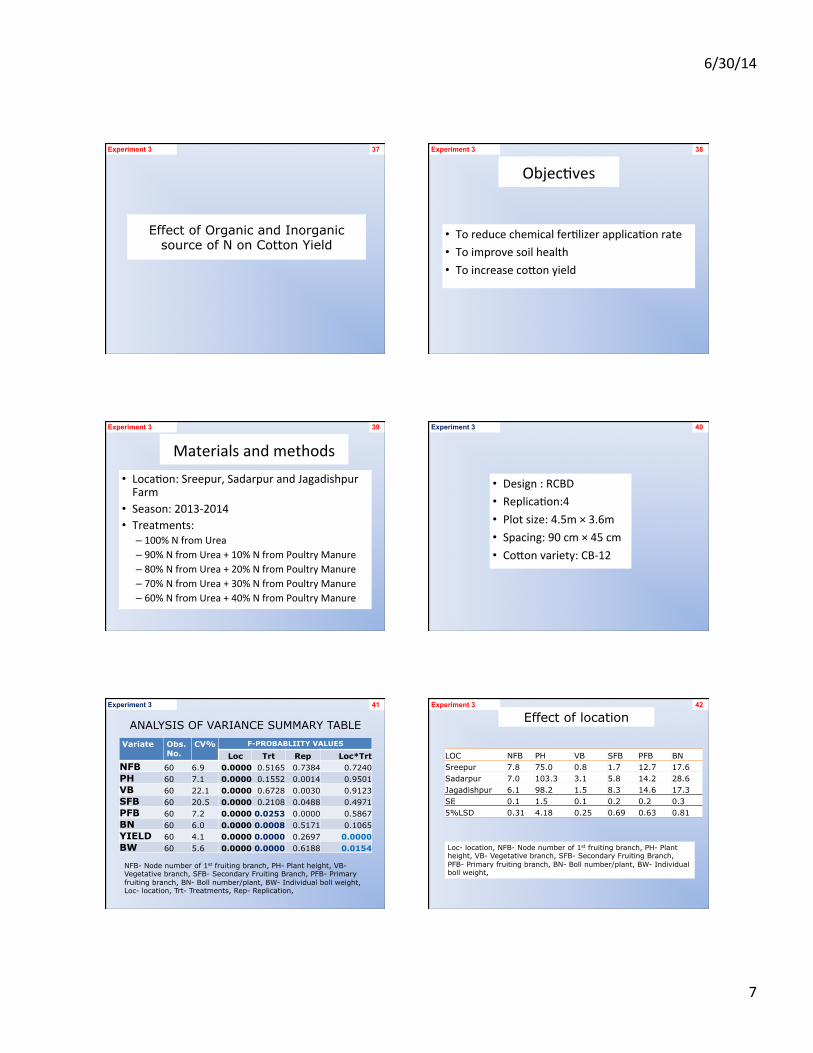
Effect of Organic and Inorganic source of N on Cotton Yield
Experiment 3 37
Objec7ves
• To reduce chemical fer7lizer applica7on rate • To improve soil health • To increase co3on yield
Experiment 3 38
Materials and methods • Loca7on: Sreepur, Sadarpur and Jagadishpur Farm
• Season: 2013-‐2014 • Treatments:
– 100% N from Urea – 90% N from Urea + 10% N from Poultry Manure – 80% N from Urea + 20% N from Poultry Manure – 70% N from Urea + 30% N from Poultry Manure – 60% N from Urea + 40% N from Poultry Manure
Experiment 3 39
• Design : RCBD • Replica7on:4 • Plot size: 4.5m × 3.6m • Spacing: 90 cm × 45 cm • Co3on variety: CB-‐12
Experiment 3 40
ANALYSIS OF VARIANCE SUMMARY TABLE Variate Obs.
No. CV% F-PROBABLIITY VALUES
Loc Trt Rep Loc*Trt NFB 60 6.9 0.0000 0.5165 0.7384 0.7240 PH 60 7.1 0.0000 0.1552 0.0014 0.9501 VB 60 22.1 0.0000 0.6728 0.0030 0.9123 SFB 60 20.5 0.0000 0.2108 0.0488 0.4971 PFB 60 7.2 0.0000 0.0253 0.0000 0.5867 BN 60 6.0 0.0000 0.0008 0.5171 0.1065 YIELD 60 4.1 0.0000 0.0000 0.2697 0.0000 BW 60 5.6 0.0000 0.0000 0.6188 0.0154
NFB- Node number of 1st fruiting branch, PH- Plant height, VB- Vegetative branch, SFB- Secondary Fruiting Branch, PFB- Primary fruiting branch, BN- Boll number/plant, BW- Individual boll weight, Loc- location, Trt- Treatments, Rep- Replication,
Experiment 3 41
Effect of location
LOC NFB PH VB SFB PFB BN Sreepur 7.8 75.0 0.8 1.7 12.7 17.6 Sadarpur 7.0 103.3 3.1 5.8 14.2 28.6 Jagadishpur 6.1 98.2 1.5 8.3 14.6 17.3 SE 0.1 1.5 0.1 0.2 0.2 0.3 5%LSD 0.31 4.18 0.25 0.69 0.63 0.81
Loc- location, NFB- Node number of 1st fruiting branch, PH- Plant height, VB- Vegetative branch, SFB- Secondary Fruiting Branch, PFB- Primary fruiting branch, BN- Boll number/plant, BW- Individual boll weight,
Experiment 3 42
6/30/14
8
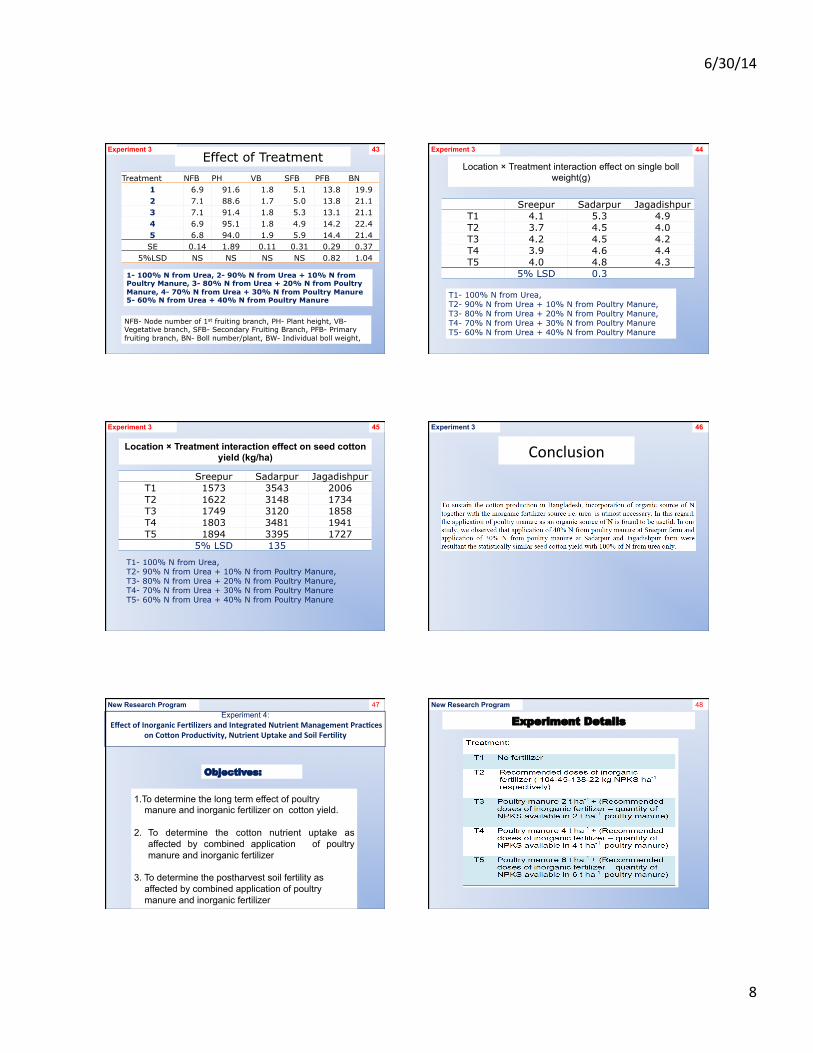
Effect of Treatment Treatment NFB PH VB SFB PFB BN
1 6.9 91.6 1.8 5.1 13.8 19.9 2 7.1 88.6 1.7 5.0 13.8 21.1 3 7.1 91.4 1.8 5.3 13.1 21.1 4 6.9 95.1 1.8 4.9 14.2 22.4 5 6.8 94.0 1.9 5.9 14.4 21.4 SE 0.14 1.89 0.11 0.31 0.29 0.37
5%LSD NS NS NS NS 0.82 1.04
NFB- Node number of 1st fruiting branch, PH- Plant height, VB- Vegetative branch, SFB- Secondary Fruiting Branch, PFB- Primary fruiting branch, BN- Boll number/plant, BW- Individual boll weight,
1- 100% N from Urea, 2- 90% N from Urea + 10% N from Poultry Manure, 3- 80% N from Urea + 20% N from Poultry Manure, 4- 70% N from Urea + 30% N from Poultry Manure 5- 60% N from Urea + 40% N from Poultry Manure
Experiment 3 43
Location × Treatment interaction effect on single boll weight(g)
Sreepur Sadarpur Jagadishpur T1 4.1 5.3 4.9 T2 3.7 4.5 4.0 T3 4.2 4.5 4.2 T4 3.9 4.6 4.4 T5 4.0 4.8 4.3
5% LSD 0.3
T1- 100% N from Urea, T2- 90% N from Urea + 10% N from Poultry Manure, T3- 80% N from Urea + 20% N from Poultry Manure, T4- 70% N from Urea + 30% N from Poultry Manure T5- 60% N from Urea + 40% N from Poultry Manure
Experiment 3 44
Location × Treatment interaction effect on seed cotton yield (kg/ha)
Sreepur Sadarpur Jagadishpur T1 1573 3543 2006 T2 1622 3148 1734 T3 1749 3120 1858 T4 1803 3481 1941 T5 1894 3395 1727
5% LSD 135
T1- 100% N from Urea, T2- 90% N from Urea + 10% N from Poultry Manure, T3- 80% N from Urea + 20% N from Poultry Manure, T4- 70% N from Urea + 30% N from Poultry Manure T5- 60% N from Urea + 40% N from Poultry Manure
Experiment 3 45
Conclusion
Experiment 3 46
Experiment 4: Effect of Inorganic Fer0lizers and Integrated Nutrient Management Prac0ces
on Co;on Produc0vity, Nutrient Uptake and Soil Fer0lity
47 New Research Program
1.To determine the long term effect of poultry manure and inorganic fertilizer on cotton yield. 2. To determine the cotton nutrient uptake as
affected by combined application of poultry manure and inorganic fertilizer
3. To determine the postharvest soil fertility as affected by combined application of poultry manure and inorganic fertilizer
Objectives:
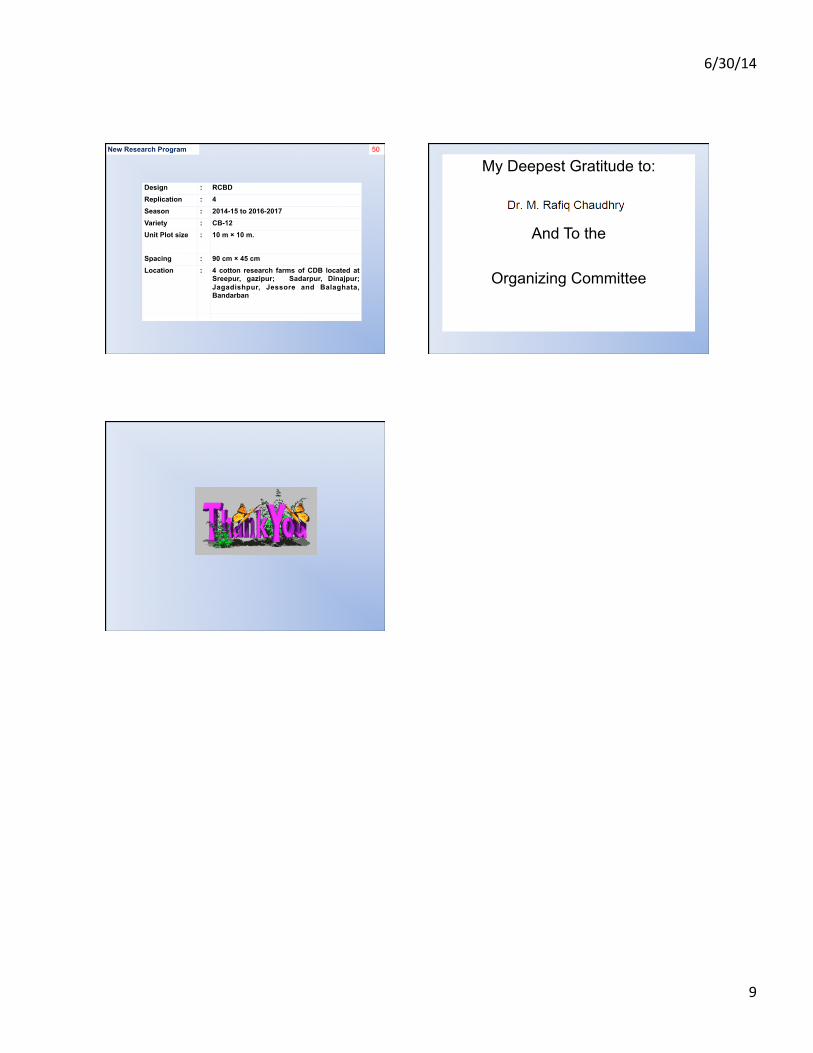
Experiment Details 48 New Research Program
6/30/14
9
Design : RCBD Replication : 4
Season : 2014-15 to 2016-2017
Variety : CB-12
Unit Plot size : 10 m × 10 m.
Spacing : 90 cm × 45 cm
Location : 4 cotton research farms of CDB located at Sreepur, gazipur; Sadarpur, Dinajpur; Jagadishpur, Jessore and Balaghata, Bandarban
New Research Program 50
My Deepest Gratitude to:
And To the
Organizing Committee