kamloops forest district fire facts - 2003. kamloops forest district fire facts - 2003 weather facts...
TRANSCRIPT
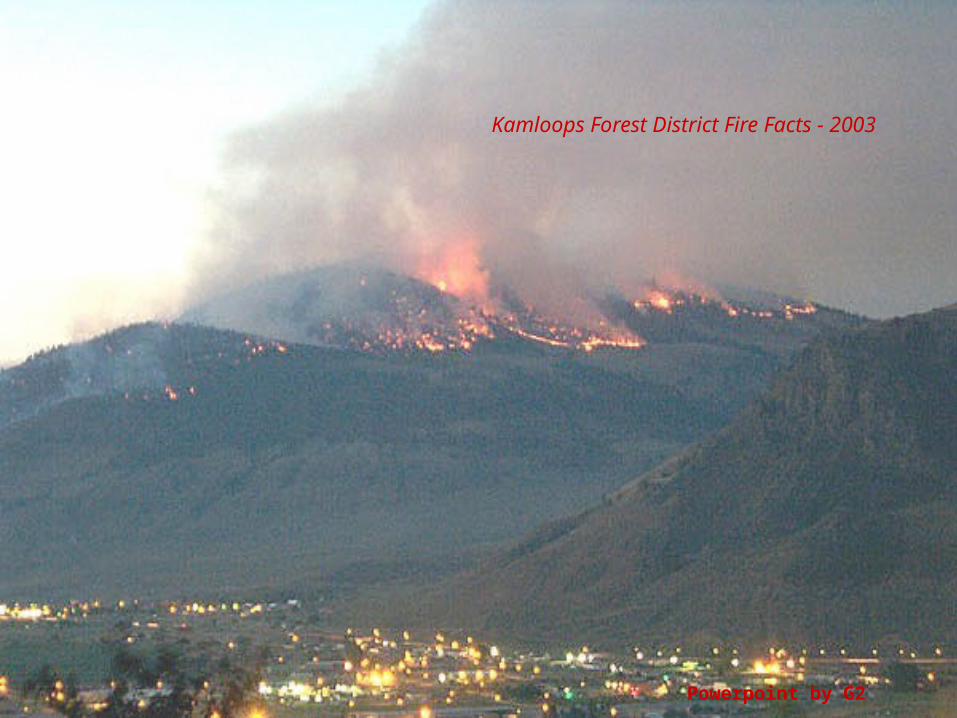
Kamloops Forest DistrictKamloops Forest DistrictFire Facts - 2003
Kamloops Forest District Fire Facts - 2003
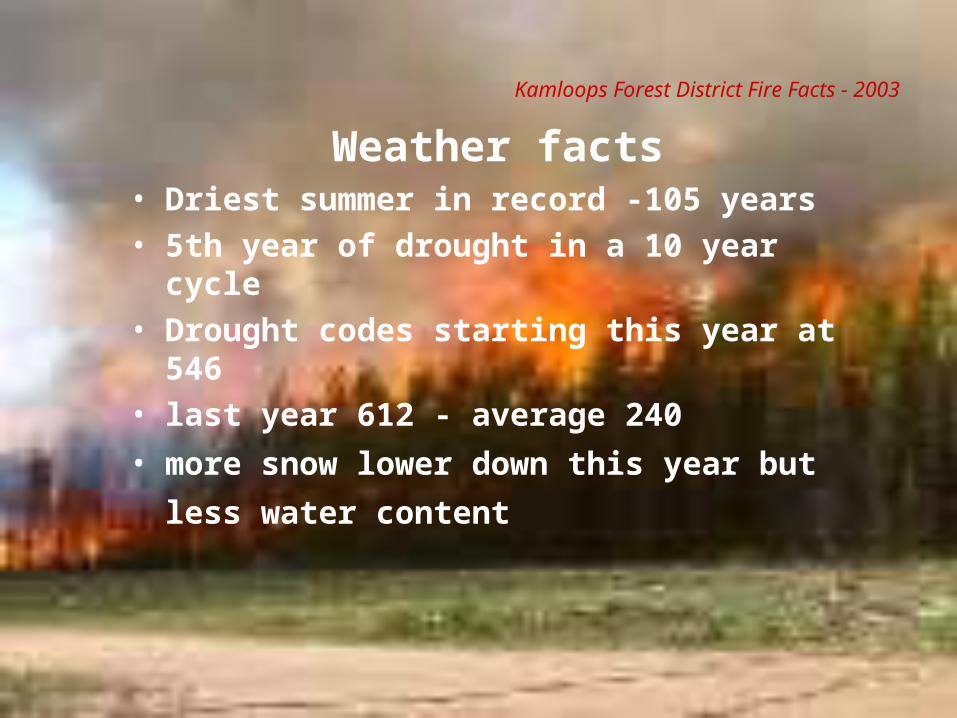
Weather facts • Driest summer in record -105 years • 5th year of drought in a 10 year cycle• Drought codes starting this year at 546• last year 612 - average 240
• more snow lower down this year but less water
content
Kamloops Forest District Fire Facts - 2003
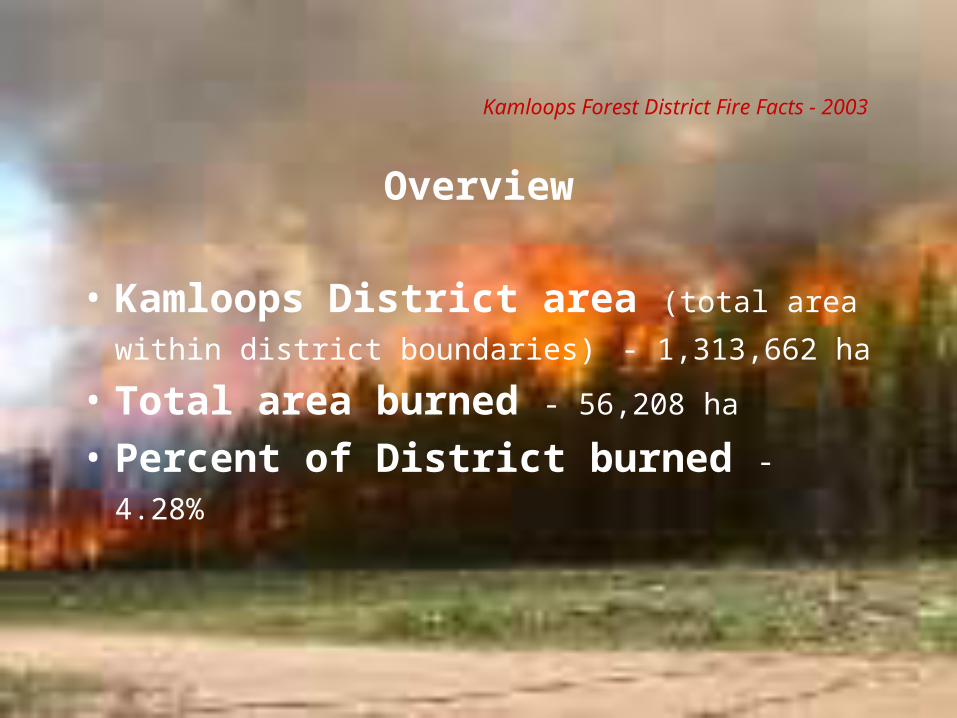
Overview
• Kamloops District area (total area within
district boundaries) - 1,313,662 ha
• Total area burned - 56,208 ha
• Percent of District burned - 4.28%
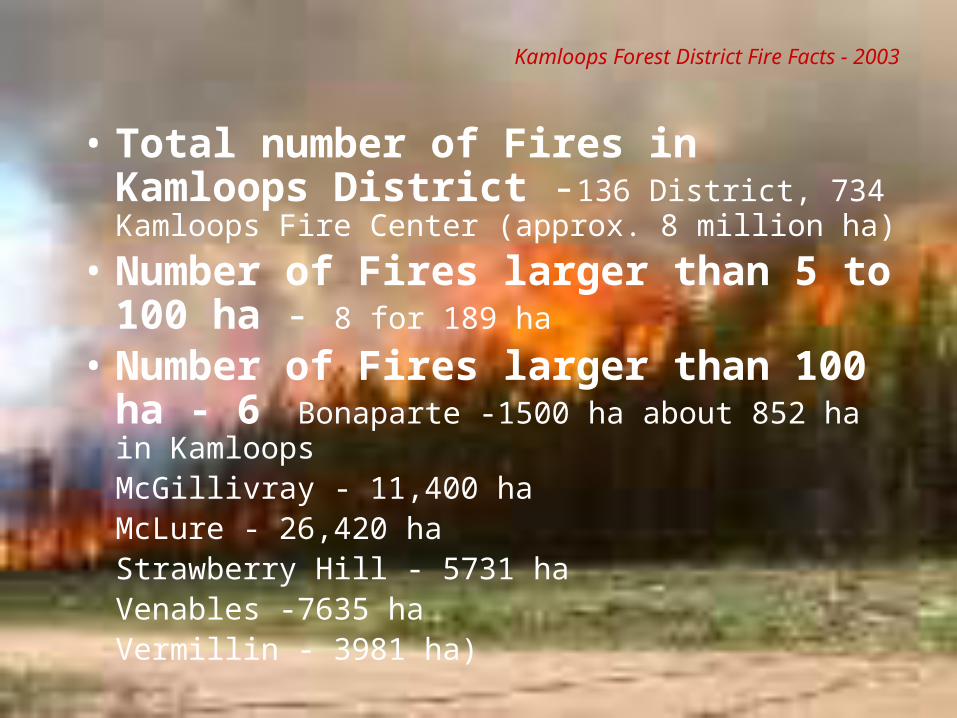
• Total number of Fires in Kamloops District -136 District, 734 Kamloops Fire Center (approx. 8 million ha)
• Number of Fires larger than 5 to 100 ha - 8 for 189 ha
• Number of Fires larger than 100 ha - 6 Bonaparte -1500 ha about 852 ha in Kamloops
McGillivray - 11,400 haMcLure - 26,420 haStrawberry Hill - 5731 haVenables -7635 haVermillin - 3981 ha)
Kamloops Forest District Fire Facts - 2003
Kamloops Forest District Fire Facts - 2003
Dollars spent on Suppression
for Kamloops District - $128 million
provincially = $430 million
$ 97 million just for helicopters
Kamloops Forest District Fire Facts - 2003
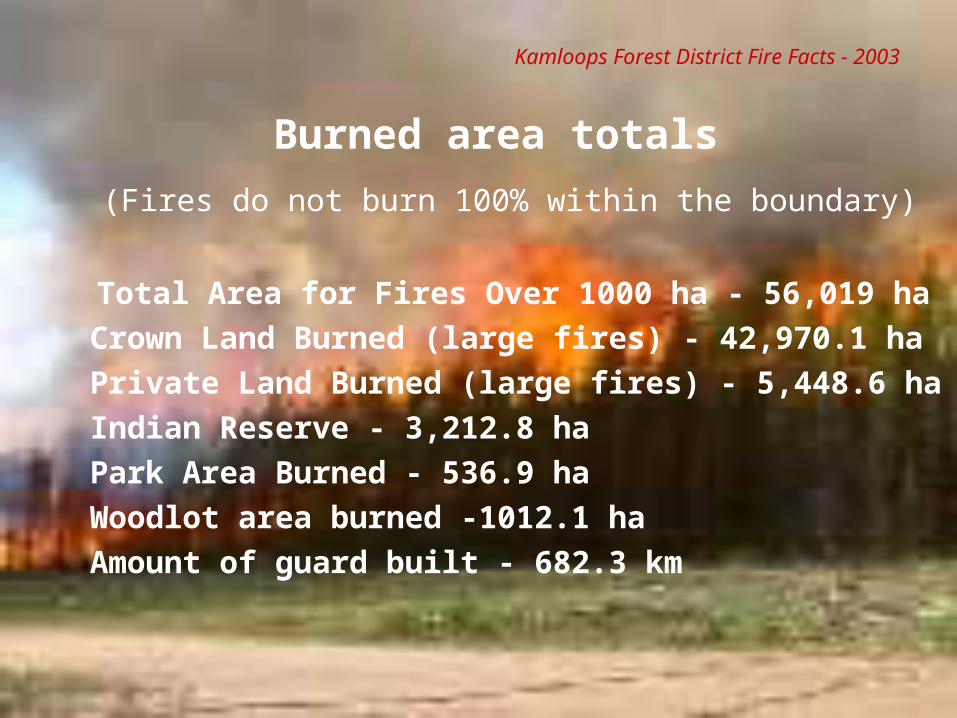
Burned area totals
(Fires do not burn 100% within the boundary)
Total Area for Fires Over 1000 ha - 56,019 ha
Crown Land Burned (large fires) - 42,970.1 ha
Private Land Burned (large fires) - 5,448.6 ha
Indian Reserve - 3,212.8 ha
Park Area Burned - 536.9 ha
Woodlot area burned -1012.1 ha
Amount of guard built - 682.3 km
Kamloops Forest District Fire Facts - 2003
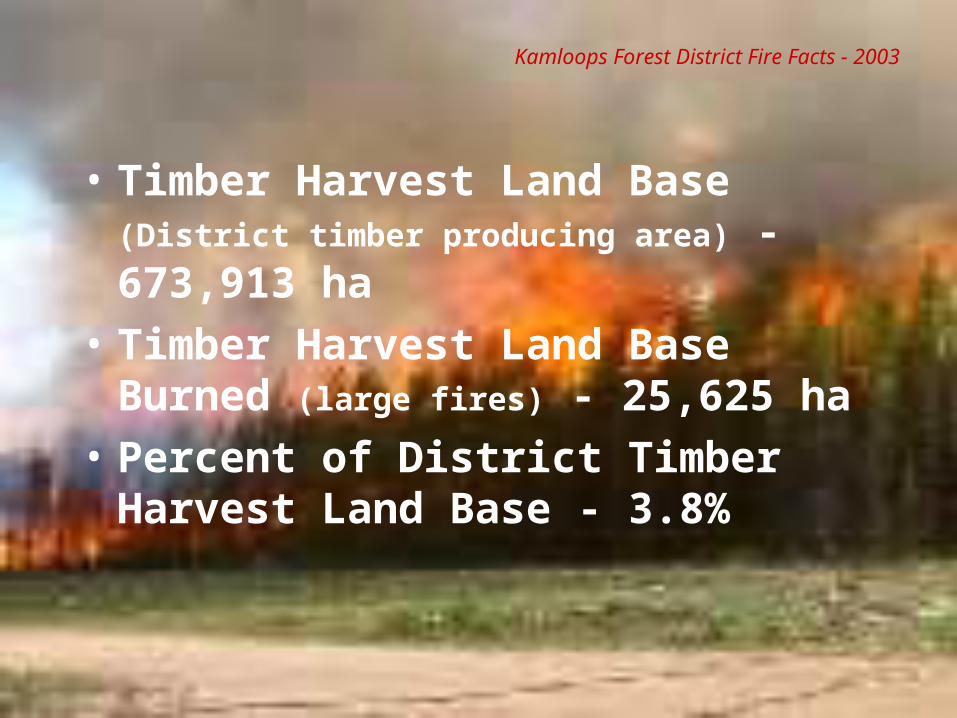
• Timber Harvest Land Base (District
timber producing area) -673,913 ha
• Timber Harvest Land Base Burned (large fires) - 25,625 ha
• Percent of District Timber Harvest Land Base - 3.8%
Kamloops Forest District Fire Facts - 2003
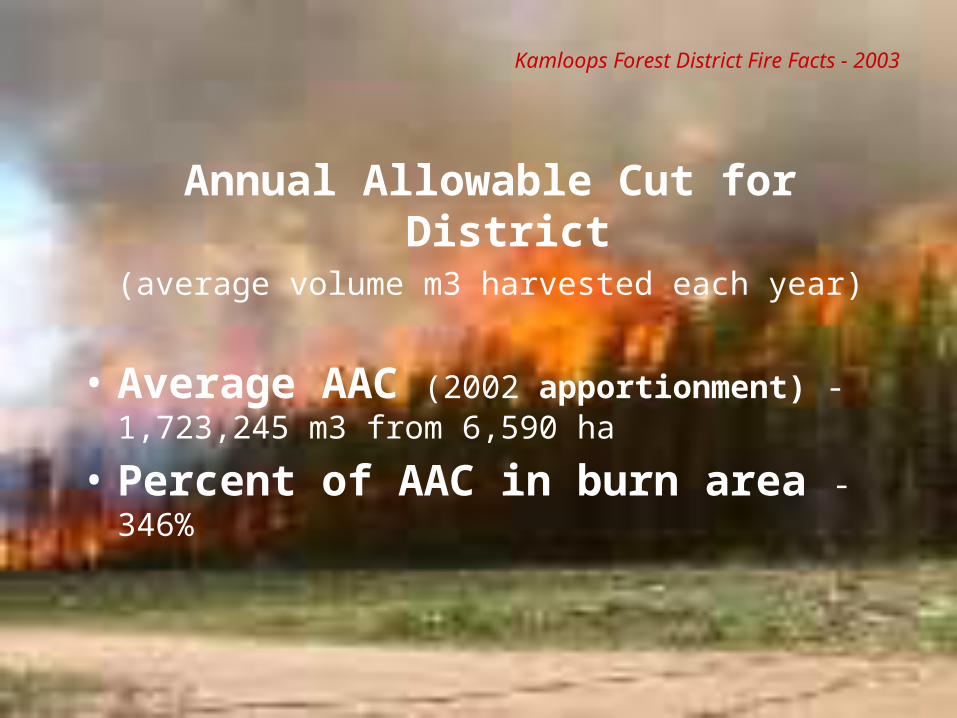
Annual Allowable Cut for District(average volume m3 harvested each year)
• Average AAC (2002 apportionment) -1,723,245 m3 from 6,590 ha
• Percent of AAC in burn area -346%
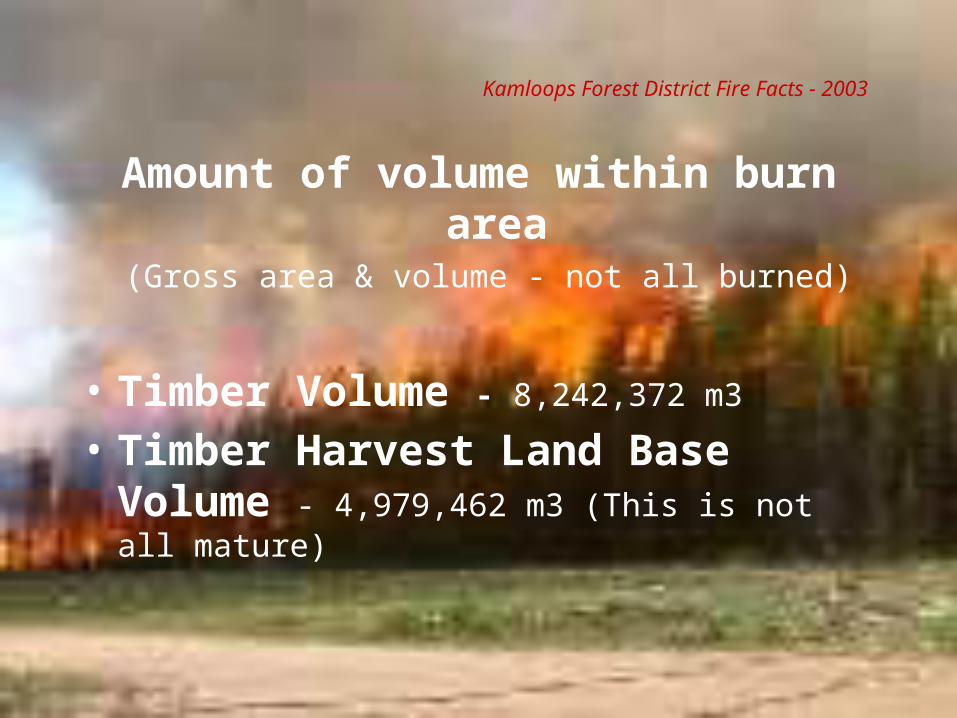
Amount of volume within burn area (Gross area & volume - not all burned)
• Timber Volume - 8,242,372 m3
• Timber Harvest Land Base Volume - 4,979,462 m3 (This is not all mature)
Kamloops Forest District Fire Facts - 2003

Amount of volume within burn area (Gross area & volume - not all burned)
• Timber Volume - 8,242,372 m3
• Timber Harvest Land Base Volume - 4,979,462 m3 (This is not all mature)
Kamloops Forest District Fire Facts - 2003
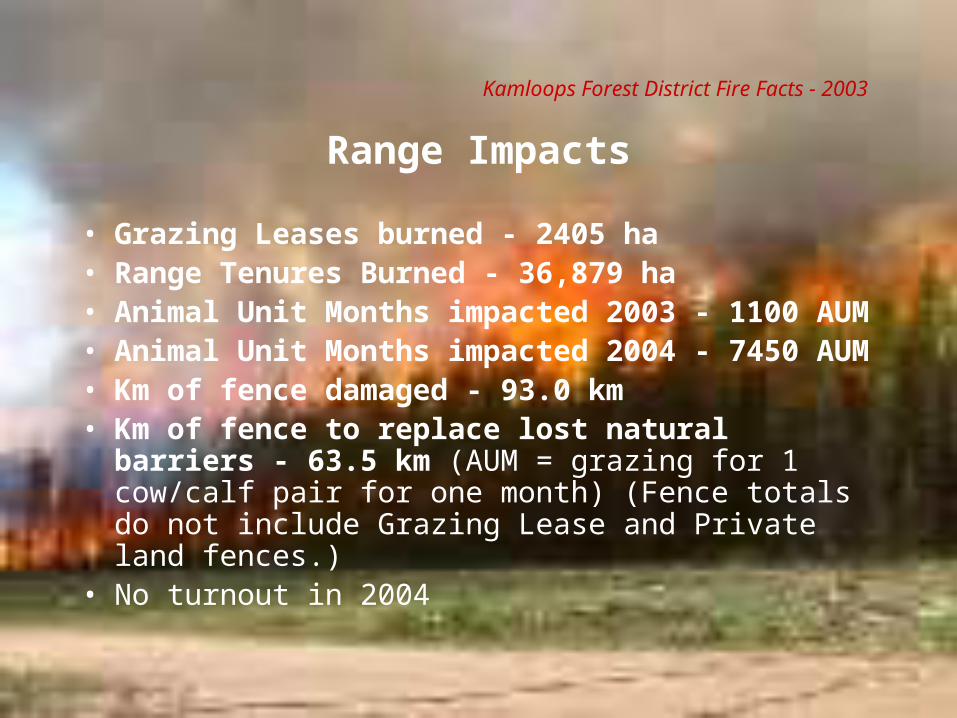
Range Impacts • Grazing Leases burned - 2405 ha• Range Tenures Burned - 36,879 ha• Animal Unit Months impacted 2003 - 1100 AUM• Animal Unit Months impacted 2004 - 7450 AUM• Km of fence damaged - 93.0 km• Km of fence to replace lost natural barriers - 63.5
km (AUM = grazing for 1 cow/calf pair for one month) (Fence totals do not include Grazing Lease and Private land fences.)
• No turnout in 2004
Kamloops Forest District Fire Facts - 2003
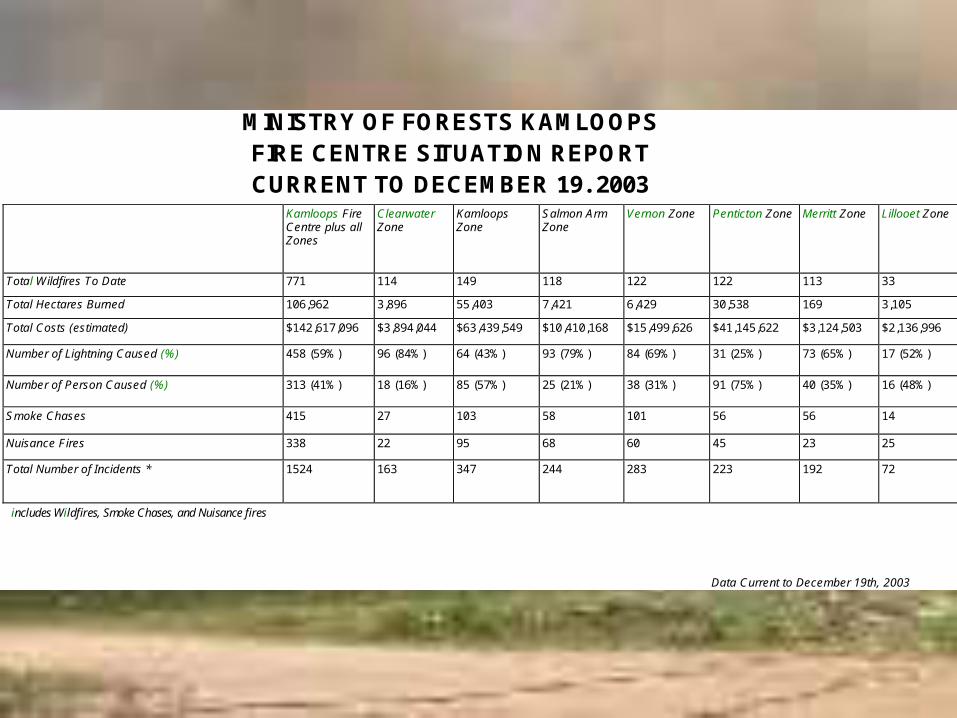
MINISTRY OF FORESTS KAMLOOPS FIRE CENTRE SITUATION REPORT CURRENT TO DECEMBER 19. 2003
Kamloops Fire Centre plus all Zones
Clearwater Zone
Kamloops Zone
Salmon Arm Zone
Vernon Zone
Penticton Zone
Merritt Zone
Lillooet Zone
Total Wildfires To Date
771
114
149
118
122
122
113
33 Total Hectares Burned
106,962
3,896
55,403
7,421
6,429
30,538
169
3,105 Total Costs (estimated)
$142,617,096
$3,894,044
$63,439,549
$10,410,168
$15,499,626
$41,145,622
$3,124,503
$2,136,996 Number of Lightning Caused (%)
458 (59%)
96 (84%)
64 (43%)
93 (79%)
84 (69%)
31 (25%)
73 (65%)
17 (52%) Number of Person Caused (%)
313 (41%)
18 (16%)
85 (57%)
25 (21%)
38 (31%)
91 (75%)
40 (35%)
16 (48%) Smoke Chases
415
27
103
58
101
56
56
14 Nuisance Fires
338
22
95
68
60
45
23
25 Total Number of Incidents *
1524
163
347
244
283
223
192
72
includes Wildfires, Smoke Chases, and Nuisance fires
Data Current to December 19th, 2003
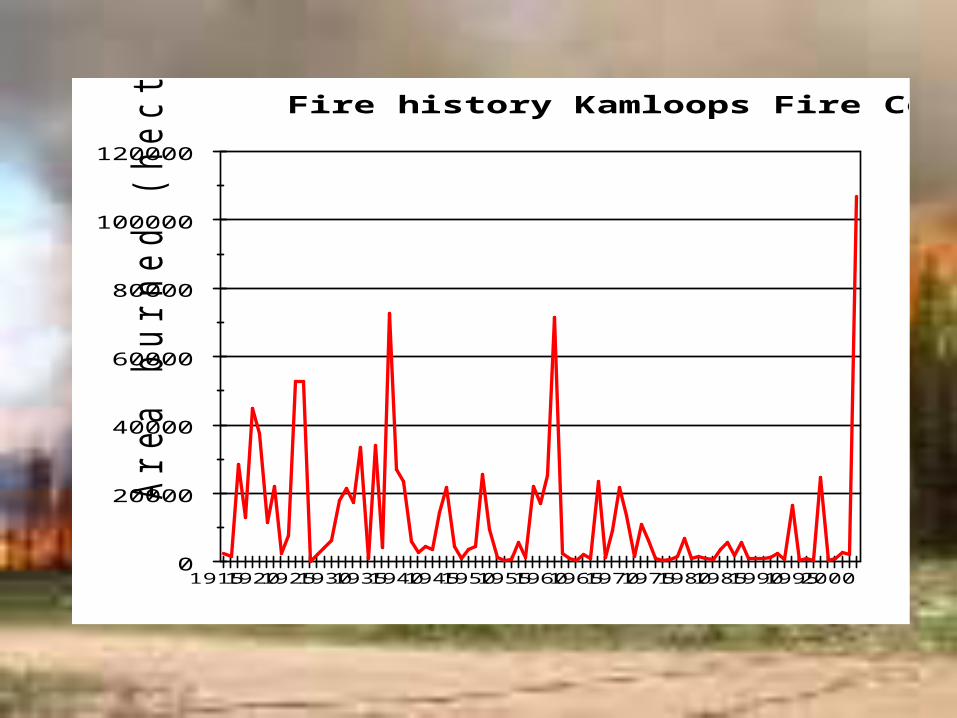
0
20000
40000
60000
80000
100000
120000 A
rea b
urn
ed (
hecta
res)
1915 1920 1925 1930 1935 1940 1945 1950 1955 1960 1965 1970 1975 1980 1985 1990 1995 2000
Fire history Kamloops Fire Centre
Kamloops Forest District Fire Facts - 2003
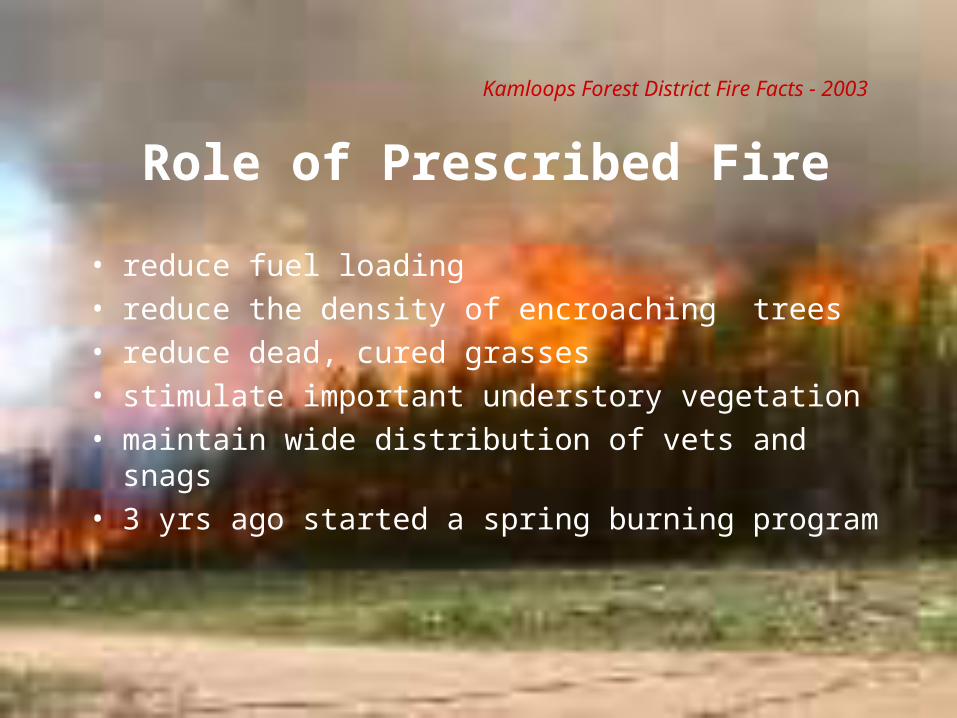
Role of Prescribed Fire
• reduce fuel loading• reduce the density of encroaching trees• reduce dead, cured grasses • stimulate important understory vegetation• maintain wide distribution of vets and snags • 3 yrs ago started a spring burning program
Kamloops Forest District Fire Facts - 2003
Kamloops Forest District Fire Facts - 2003
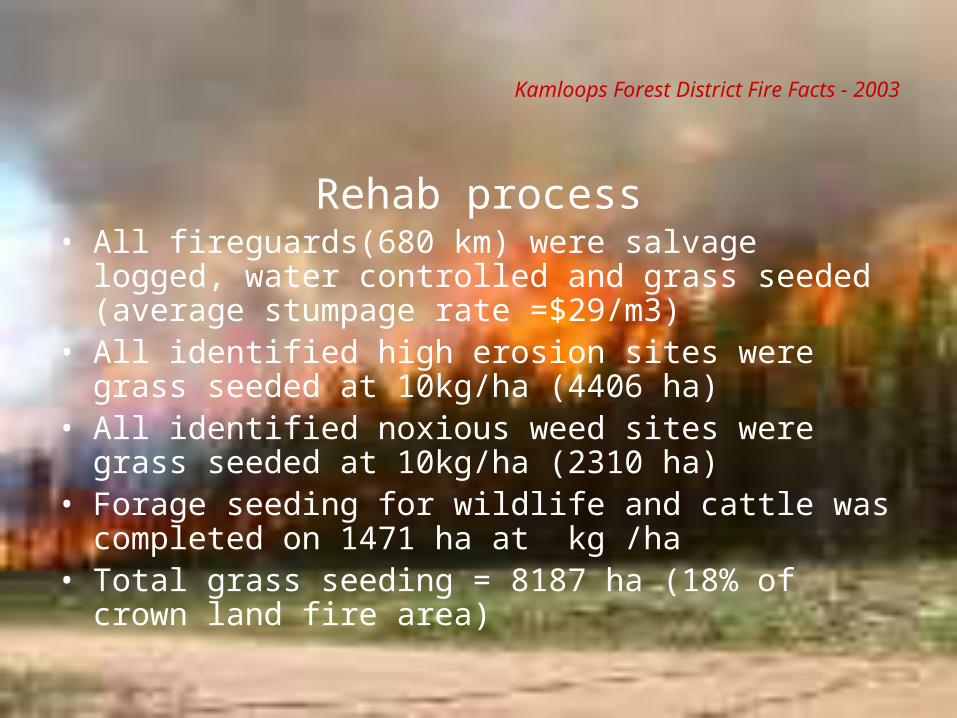
Rehab process• All fireguards(680 km) were salvage logged, water
controlled and grass seeded (average stumpage rate =$29/m3)
• All identified high erosion sites were grass seeded at 10kg/ha (4406 ha)
• All identified noxious weed sites were grass seeded at 10kg/ha (2310 ha)
• Forage seeding for wildlife and cattle was completed on 1471 ha at kg /ha
• Total grass seeding = 8187 ha (18% of crown land fire area)
Kamloops Forest District Fire Facts - 2003
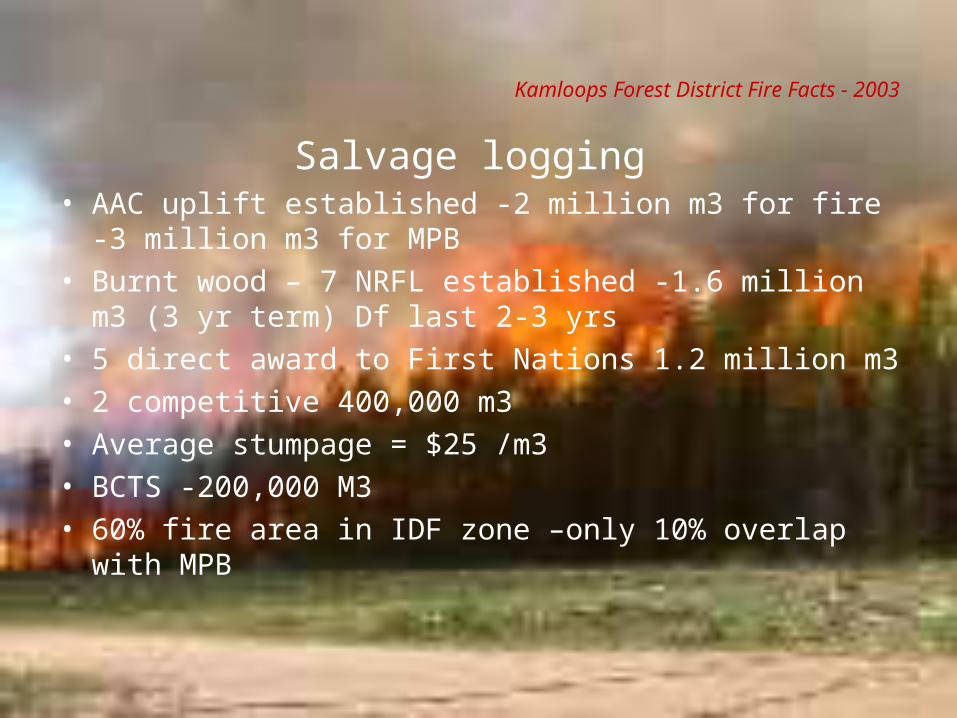
Salvage logging • AAC uplift established -2 million m3 for fire -3 million m3
for MPB• Burnt wood – 7 NRFL established -1.6 million m3 (3 yr
term) Df last 2-3 yrs• 5 direct award to First Nations 1.2 million m3• 2 competitive 400,000 m3 • Average stumpage = $25 /m3• BCTS -200,000 M3 • 60% fire area in IDF zone –only 10% overlap with MPB
Kamloops Forest District Fire Facts - 2003
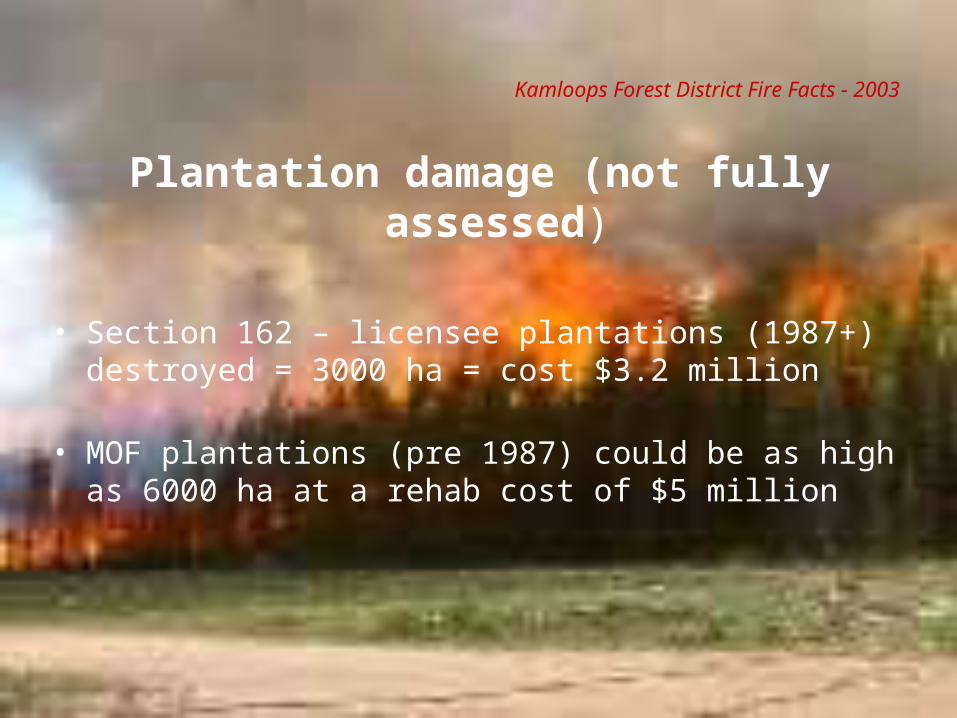
Plantation damage (not fully assessed)
• Section 162 – licensee plantations (1987+) destroyed = 3000 ha = cost $3.2 million
• MOF plantations (pre 1987) could be as high as 6000 ha at a rehab cost of $5 million
Kamloops Forest District Fire Facts - 2003
Provincially
• Average hectares burned over past 10 years 25,316ha• Hectares burned in 2003 - 265,322ha (as of Oct31)• Most hectares lost was in 1958 - 855,968ha (since
1950)• In the past ten years, the most ha lost was in 2003• Since 1950, 2003 is the 7th worst year in terms of ha lost• Since 1950, 2003 is the 21st worst in terms of # of fires
Kamloops Forest District Fire Facts - 2003
Property Costs
• 334 homes and 10 businesses, primarily in Barriere, and Kelowna;
• Other structures, ranging from summer cottages to barns to storage sheds;
• Damaged infrastructure, including utility lines, and wooden trestles;
• Significant damage to business property – e.g. the Tolko mill in Louis Creek and range fencing;
• Loss of forest and wildlife values.
Kamloops Forest District Fire Facts - 2003
Human Costs
• 3 firefighters perished - all pilots• 50,000 evacuations (44,000 people evacuated plus 6,000
re-evacuated)• Tourism industry impacted across the interior• Financial Costs• Direct costs of fighting fires estimated at $ 142,617,000• Property damage or lost business could be in tens of
millions more.
Kamloops Forest District Fire Facts - 2003
For more information contact
Peter Lishman
Kamloops Forest District
250-371-6500
Kamloops Forest District Fire Facts - 2003
Powerpoint by G2