juvenile arrests 2009...during the first decade of the 21st century (2000–2009), juvenile arrests...
TRANSCRIPT
U.S. Department of Justice
Office of Justice Programs
Office of Juvenile Justice and Delinquency Prevention
National Report Series
This bulletin is part of the Juvenile Offenders and Victims National Report Series. The National Report offers a comprehensive statistical overview of the problems of juvenile crime, violence, and victimization and the response of the juvenile justice system. During each interim year, the bulletins in the National Report Series provide access to the latest information on juvenile arrests, court cases, juveniles in custody, and other topics of interest. Each bulletin in the series highlights selected topics at the forefront of juvenile justice policymaking, giving readers focused access to statistics on some of the most critical is sues. Together, the National Report and this series provide a baseline of facts for juvenile justice professionals, policy-makers, the media, and concerned citizens.
December 2011
Juvenile Arrests 2009 Charles Puzzanchera and Benjamin Adams
A Message From OJJDP
This bulletin, which draws on data from the FBI’s Uniform Crime Reporting (UCR) program, summarizes crimes known to the police and juvenile arrests made during the 2009 reporting year. The authors use the UCR data to characterize the extent and nature of juvenile crime that comes to the attention of the justice system. This information also serves as a benchmark for juvenile justice professionals and other concerned citizens who wish to assess America’s progress in reducing juvenile delinquency.
Contrary to the popular perception that juvenile crime is on the rise, the data reported in this bulletin tell a different story. As detailed in these pages, juvenile arrests for violent offenses declined 10% between 2008 and 2009, and overall juvenile arrests fell 9% during that same period. Between 1994—when the Violent Crime Index arrest rates for juveniles hit a historic high—and 2009, the rate fell nearly 50% to its lowest level since at least 1980. Arrest rates for nearly every offense category for both male and female and white and minority youth were down in 2009.
Although such trends are encouraging, they should not lead to a misplaced sense of complacency. Juvenile crime and violence continue to plague many communities across the country. During the first decade of the 21st century (2000–2009), juvenile arrests for robbery rose 15%, and arrests for murder were unchanged. Clearly, our work is not finished.
OJJDP hopes that the information that this bulletin provides will inform our efforts to prevent and combat juvenile delinquency for the sake of our children and our nation.
Jeff Slowikowski Acting Administrator
Access OJJDP publications online at ojjdp.gov
Most information about law enforcement’s response to juvenile crime comes from the FBI’s UCR Program Since the 1930s, police agencies have reported to the UCR Program
Each year, thousands of police agencies voluntarily report the following data to the Federal Bureau of Investigation’s (FBI’s) Uniform Crime Reporting (UCR) Program:
Q Number of Index crimes reported to law enforcement (see sidebar).
Q Number of arrests and the most serious charge involved in each arrest.
Q Age, sex, and race of arrestees.
Q Proportion of reported Index crimes cleared by arrest and the proportion of these Index crimes cleared by the arrest of persons younger than 18.
Q Police dispositions of juvenile arrests.
Q Detailed victim, assailant, and circumstance information in murder cases.
What can the UCR arrest data tell us about crime and young people?
The UCR arrest data can provide estimates of the annual number of arrests of juveniles* within specific offense categories. UCR data can also provide detail on juvenile arrests by sex, race, and type of location (urban, suburban, or rural area). The data can be used to compare the relative number of arrests of adults and juveniles within offense categories, to develop estimates of change in arrests over various periods, and to monitor the proportion of crimes cleared by arrests of juveniles.
* In this bulletin, “juvenile” refers to persons younger than age 18. In 2009, this definition was at odds with the legal definition of juveniles in 13 states—10 states where all 17-year-olds are defined as adults and 3 states where all 16- and 17-year-olds are defined as adults.
What do arrest statistics count?
To interpret the material in this bulletin properly, the reader needs a clear understanding of what these statistics count. Arrest statistics report the number of arrests that law enforcement agencies made in a given year—not the number of individuals arrested nor the number of crimes committed. The number of arrests is not the same as the number of people arrested because an unknown number of individuals are arrested more than once during the year. Nor do arrest statistics represent the number of crimes that arrested individuals commit because a series of crimes that one person commits may culminate in a single arrest, and a single crime may result in the arrest of more than one person. This latter situation, where many arrests result from one crime, is relatively common in juvenile law-violating behavior because juveniles are more likely than adults to commit crimes in groups. For this reason, one should not use arrest statistics to indicate the relative proportions of crime that juveniles and adults commit. Arrest statistics are most appropriately a measure of entry into the justice system.
Arrest statistics also have limitations in measuring the volume of arrests for a particular offense. Under the UCR Program, the FBI requires law enforcement agencies to classify an arrest by the most serious offense charged in that arrest. For example, the arrest of a youth charged with aggravated assault and possession of a weapon would be reported to the FBI as an arrest for aggravated assault. Therefore, when arrest statistics show that law enforcement agencies made an estimated 33,900 arrests of young people for weapons law violations in 2009, it means that a weapons law violation was
the most serious charge in these 33,900 arrests. An unknown number of additional arrests in 2009 included a weapons charge as a lesser offense.
What are the Crime Indexes?
The designers of the UCR Program wanted to create an index (similar in concept to the Dow Jones Industrial Average or the Consumer Price Index) that would be sensitive to changes in the volume and nature of reported crime. They decided to incorporate specific offenses into the index, based on several factors: likelihood of being reported, frequency of occurrence, pervasiveness in all geographical areas of the country, and relative seriousness.
The Crime Index is divided into two components: the Violent Crime Index and the Property Crime Index.
Violent Crime Index—Includes murder and nonnegligent manslaughter, forcible rape, robbery, and aggravated assault.
Property Crime Index—Includes burglary, larceny-theft, motor vehicle theft, and arson.
Although some violent crimes, such as kidnapping and extortion, are excluded, the Violent Crime Index contains what are generally considered to be serious crimes. In contrast, a substantial proportion of the crimes in the Property Crime Index are generally considered less serious crimes, such as shoplifting, theft from motor vehicles, and bicycle theft, all of which are included in the larceny-theft category.
National Report Series Bulletin 2
What do clearance statistics count?
Clearance statistics measure the proportion of reported crimes that were cleared (or “closed”) by either arrest or other, exceptional means (such as the death of the offender or unwillingness of the victim to cooperate). A single arrest may result in many clearances. For example, 1 arrest could clear 10 burglaries if the person was charged with committing all 10 crimes. Or multiple arrests may result in a single clearance if a group of offenders committed the crime. For those interested in juvenile justice issues, the FBI also reports the proportion of clearances that involved only offenders younger than age 18. This statistic is a better indicator of the proportion of crime that this age group commits than is the proportion of arrests, although there are some concerns that even the clearance statistic overestimates the proportion of crimes that juveniles commit.
Percent involving
Most serious juveniles offense Clearance Arrest
Violent Crime Index 11% 15% Property Crime Index 15 24 Murder 5 9 Forcible rape 11 14 Robbery 15 25 Aggravated assault 10 12 Burglary 15 25 Larceny-theft 18 24 Motor vehicle theft 15 24 Arson 35 44 Data source: Crime in the United States 2009, (Washington, DC: Federal Bureau of Investigation, 2010), tables 28 and 38.
Research has shown that juvenile offenders are more easily apprehended than adult offenders; thus, the juvenile proportion of clearances probably overestimates juveniles’ responsibility for crime. To add to the difficulty in interpreting clearance statistics, the FBI’s reporting guidelines require that clearances involving both juvenile and adult offenders be classified as clearances for crimes that adults commit. Because the juvenile clearance proportions include only those clearances in
which no adults were involved, they underestimate juvenile involvement in crime. Although these data do not present a definitive picture of juvenile involvement in crime, they are the closest measure generally available of the proportion of crime known to law enforcement that is attributed to persons younger than age 18.
How are national estimates of arrests calculated?
The FBI’s Crime in the United States (CIUS) report presents a detailed snapshot of crime and arrests voluntarily reported by local law enforcement agencies. Some agencies report data for a full calendar year, other agencies are “partial reporters” (i.e., their reported data cover less than 12 months), and some agencies do not report at all. Data from 12-month reporting agencies form the basis of the tables presented in the annual CIUS report. As such, CIUS presents a sample-based portrait of arrests that law enforcement agencies report. There is an exception, however. Each CIUS report includes one table that presents national estimates of arrests for 29 offense categories (in recent years, these estimates have been presented in table 29). In short, CIUS does not include national estimates for any subpopulation groups.
For nearly 2 decades, the National Center for Juvenile Justice developed national estimates of juvenile arrests based on data presented in CIUS; these estimates have been the basis of the Juvenile Arrests series since its inception in the 1990s. However, the Bureau of Justice Statistics (BJS) recently developed a new process that supplants the estimation procedure used in prior versions of this bulletin. The method that BJS uses takes advantage of more complete sample data reported to the FBI from local law enforcement agencies. To learn more about the BJS estimation process, see Arrest in the United States, 1980–2009, which is available from the BJS Web site (bjs.gov).
Crime in the United States reports data on murder victims
Each Crime in the United States report presents estimates of the number of crimes reported to law enforcement agencies. Although many crimes are never reported to law enforcement, murder is one crime that is nearly always reported.
An estimated 15,241 murders were reported to law enforcement agencies in 2009, or 5.0 murders for every 100,000 U.S. residents. The murder rate was essentially constant between 1999 (the year with the fewest murders in the past three decades) and 2008. Prior to 1999, the last year in which the murder rate was less than 6.0 was 1966.
Of all murder victims in 2009, 89% (or 13,710 victims) were 18 years old or older. The other 1,530 murder victims were younger than age 18 (i.e., juveniles). The number of juveniles murdered in 2009 was 4% more than the average number of juveniles murdered in the prior 5-year period and 39% less than the peak year of 1993, when an estimated 2,880 juveniles were murdered. During the same prior 5-year period, the estimated number of adult murder victims fell 33%.
Of all juveniles murdered in 2009, 36% were younger than age 5, 67% were male, and 49% were white. Of all juveniles murdered in 2009, 28% of male victims, 53% of female victims, 41% of white victims, and 32% of black victims were younger than age 5.
In 2008, 67% of all murder victims were killed with a firearm. Adults were more likely to be killed with a firearm (69%) than were juveniles (51%). However, the involvement of a firearm depended greatly on the age of the juvenile victim. In 2009, 18% of murdered juveniles younger than age 13 were killed with a firearm, compared with 80% of murdered juveniles age 13 or older. The most common method of murdering children younger than age 5 was by physical assault: in 48% of these murders, the offenders’ only weapons were their hands and/or feet, compared with only 3% of juvenile victims age 13 or older and 4% of adult victims.
December 2011 3

Law enforcement agencies in the U.S. made 1.9 million arrests of persons under age 18 in 2009
The number of arrests of juveniles
Most serious offense
in 2009 was 17% fewer than the number of arrests in 2000
2009 Percent of total juvenile arrests Percent changeestimated number Younger 2000– 2005– 2008–of juvenile arrests Female than 15 White 2009 2009 2009
Total 1,906,600 30% 27% 66% –17% –11% –9%Violent Crime Index 85,890 18 26 47 –13 –10 –10Murder and nonnegligent manslaughter 1,170 7 9 40 0 –7 –7Forcible rape 3,100 2 32 65 –30 –22 –6Robbery 31,700 10 18 31 15 9 –10Aggravated assault 49,900 25 30 56 –24 –19 –11Property Crime Index 417,700 38 28 64 –19 0 –4Burglary 74,800 11 27 61 –21 –4 –10Larceny-theft 317,700 45 28 65 –12 8 –1Motor vehicle theft 19,900 17 20 54 –61 –47 –20Arson 5,300 13 59 77 –37 –33 –17NonindexOther assaults 219,700 34 37 59 –6 –12 –5Forgery and counterfeiting 2,100 30 13 67 –66 –49 –17Fraud 6,200 35 17 62 –62 –21 –15Embezzlement 600 42 7 64 –68 –47 –52Stolen property (buying, receiving,
possessing) 18,700 19 22 55 –28 –16 –10Vandalism 90,500 14 39 79 –20 –13 –15Weapons (carrying, possessing, etc.) 33,900 10 31 61 –7 –25 –15Prostitution and commercialized vice 1,400 78 12 40 –4 –16 –8Sex offense (except forcible rape and
prostitution) 13,400 11 48 71 –23 –21 –7Drug abuse violations 170,300 16 16 72 –14 –12 –5Gambling 1,800 3 11 7 67 –13 9Offenses against the family and children 4,500 36 28 74 –49 –21 –22Driving under the influence 13,500 25 2 92 –37 –25 –15Liquor laws 110,300 39 9 89 –15 –11 –15Drunkenness 13,800 25 12 88 –37 –13 –11Disorderly conduct 170,100 33 36 57 6 –17 –10Vagrancy 2,700 28 24 72 –24 –29 –32All other offenses (except traffic) 323,300 26 23 69 –17 –12 –10Suspicion (not included in totals) 200 22 27 42 –82 –61 –20Curfew and loitering 112,600 31 25 61 –27 –20 –15Runaways 93,400 55 31 65 –34 –14 –14
Q In 2009, there were an estimated 317,700 juvenile arrests for lar ceny-theft. Between 2000 and 2009, the number of such arrests fell by 12%.
Q All four offenses that make up the Violent Crime Index decreased in the last year: murder (down 7%), rape (6%), robber y (10%), and aggravated assault (11%).
Q In 2009, females accounted for 18% of juvenile Violent Crime Index arrests, 38% of juvenile Property Crime Index arrests, and 45% of juvenile larceny-theft arrests.
Q Youth younger than age 15 accounted for more than one-fourth of all juvenile arrests for Violent Crime Index offenses and Prop ertyCrime Index offenses in 2009 (26% and 28%, respectively).
Note: Detail may not add to totals because of rounding.
Data source: Analysis of Snyder, H., and Mulako-Wantota, J., Bureau of Justice Statistics, Arrest Data Analysis Tool [online, released 9/22/11].
National Report Series Bulletin 4
The number of juvenile Violent Crime Index offense arrests in 2009 was the lowest in two decades Juvenile arrests for violence declined in 2009 for the third consecutive year
The FBI assesses trends in violent crimes by monitoring four offenses that law enforcement agencies nationwide consistently report. These four crimes—murder and nonnegligent manslaughter, forcible rape, robbery, and aggravated assault— form the Violent Crime Index.
Following 10 years of declines between 1994 and 2004, juvenile arrests for Violent Crime Index offenses increased from 2004 to 2006, then declined in each of the next 3 years. Given that the number of arrests in 2004 was less than in any year since 1987, the number of juvenile Violent Crime Index arrests in 2009 was still relatively low. In fact, the number of juvenile violent crime arrests in 2009 was less than any year in the 1990s, and 14% less than the number of such arrests in 2006.
The number of juvenile arrests in 2009 for forcible rape was less than in any year since at least 1980, and the number of juvenile aggravated assault arrests in 2009 was less than in any year since 1987. In contrast, after also falling to a relatively low level in 2004, juvenile arrests for murder increased each year from 2005 to 2007, then declined 12% by 2009. However, juvenile arrests for robbery increased 43% from 2002 through 2008, then declined 10% by 2009.
Between 2000 and 2009, the number of arrests in most offense categories declined for juveniles but increased for adults:
Most serious
Percent change in arrests
offense2000–2009
Juvenile Adult
Violent Crime Index –13% –6% Murder 0 –7 Forcible rape –30 –21 Robbery 15 21 Aggravated assault –24 –10 Property Crime Index –19 19 Burglary –21 15 Larceny-theft –12 27 Motor vehicle theft –61 –37 Simple assault –6 2 Weapons law violations –7 8 Drug abuse violations –14 8 Data source: Analysis of Snyder, H., and Mulako-Wantota, J., Bureau of Justice Statistics, Arrest Data Analysis Tool [online, released 9/22/11].
Juvenile property crime arrests declined in 2009
As with violent crime, the FBI assesses trends in the volume of property crimes by monitoring four offenses that law enforcement agencies nationwide
consistently report. These four crimes, which form the Property Crime Index, are burglary, larceny-theft, motor vehicle theft, and arson.
For the period 1980–1994, during which juvenile violent crime arrests increased substantially, juvenile property crime arrests remained relatively constant. After this long period of relative stability, juvenile property crime arrests began to fall. Between 1994 and 2006, the number of juvenile Property Crime Index arrests fell by half to their lowest level since at least 1980. This long decline was interrupted briefly as the number of juvenile Property Crime Index arrests increased in 2007 and 2008. By 2009, the number of juvenile Property Crime Index arrests fell 4%, returning to the 2007 level. Between 2008 and 2009, there were declines in juvenile arrests for individual property offenses: burglary (10%), larceny-theft (1%), motor vehicle theft (20%), and arson (17%).
Most arrested juveniles were referred to court
In most states, some persons younger than age 18 are, because of their age or by statutory exclusion, under the jurisdiction of the criminal justice system. For arrested persons younger than age 18 and under the original jurisdiction of their state’s juvenile justice system, the FBI’s UCR Program monitors what happens as a result of the arrest. This is the only instance in the UCR Program in which the statistics on arrests coincide with state variations in the legal definition of a juvenile.
In 2009, 22% of arrests involving youth who were eligible in their state for
processing in the juvenile justice system were handled within law enforcement agencies and the youth were released, 67% were referred to juvenile court, and 9% were referred directly to criminal court. The others were referred to a welfare agency or to another police agency.
In 2009, the proportion of juvenile arrests sent to juvenile court in cities with a population of more than 250,000 was the same as the proportion sent to juvenile court in smaller cities (67% each).
Data source: Crime in the United States 2009 (Washington, DC: Federal Bureau of Investigation, 2010), table 68.
December 2011 5
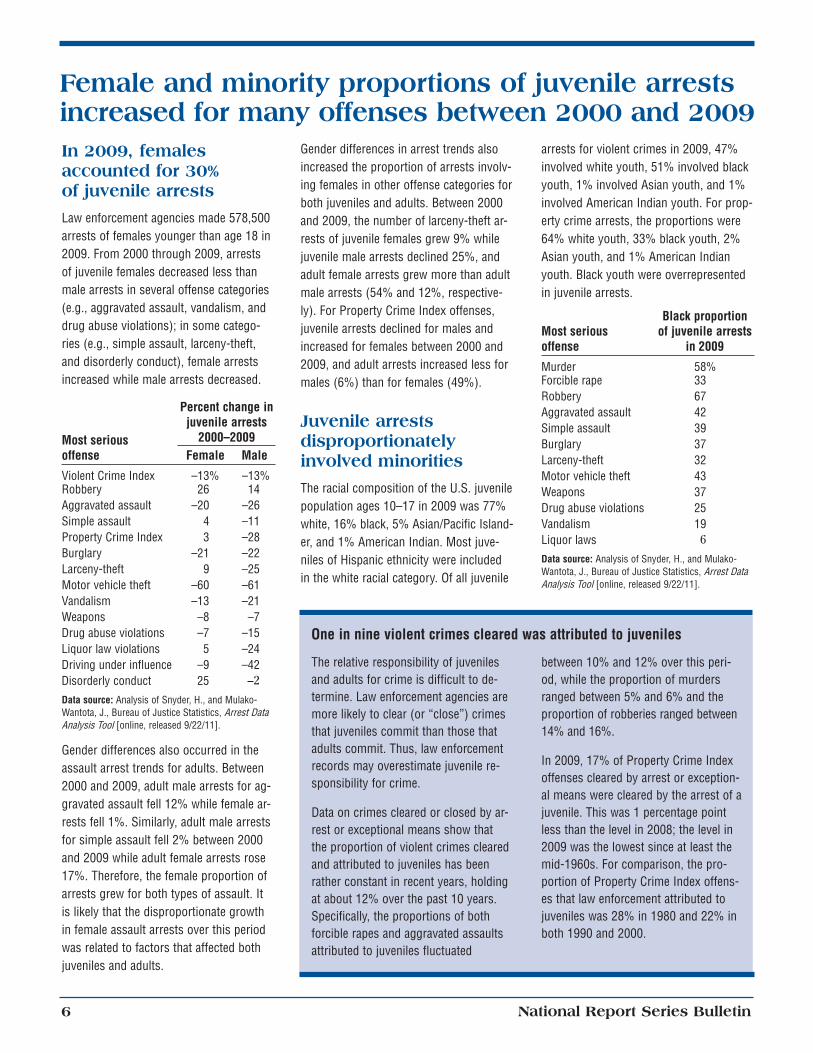
Female and minority proportions of juvenile arrests increased for many offenses between 2000 and 2009 In 2009, females accounted for 30% of juvenile arrests
Law enforcement agencies made 578,500 arrests of females younger than age 18 in 2009. From 2000 through 2009, arrests of juvenile females decreased less than male arrests in several offense categories (e.g., aggravated assault, vandalism, and drug abuse violations); in some categories (e.g., simple assault, larceny-theft, and disorderly conduct), female arrests increased while male arrests decreased.
Percent change in juvenile arrests
2000–2009Most serious offense Female Male
Violent Crime Index –13% –13% Robbery 26 14 Aggravated assault –20 –26 Simple assault 4 –11 Property Crime Index 3 –28 Burglary –21 –22 Larceny-theft 9 –25 Motor vehicle theft –60 –61 Vandalism –13 –21 Weapons –8 –7 Drug abuse violations –7 –15 Liquor law violations 5 –24 Driving under influence –9 –42 Disorderly conduct 25 –2
Data source: Analysis of Snyder, H., and Mulako-Wantota, J., Bureau of Justice Statistics, Arrest Data Analysis Tool [online, released 9/22/11].
Gender differences also occurred in the assault arrest trends for adults. Between 2000 and 2009, adult male arrests for aggravated assault fell 12% while female arrests fell 1%. Similarly, adult male arrests for simple assault fell 2% between 2000 and 2009 while adult female arrests rose 17%. Therefore, the female proportion of arrests grew for both types of assault. It is likely that the disproportionate growth in female assault arrests over this period was related to factors that affected both juveniles and adults.
Gender differences in arrest trends also increased the proportion of arrests involving females in other offense categories for both juveniles and adults. Between 2000 and 2009, the number of larceny-theft arrests of juvenile females grew 9% while juvenile male arrests declined 25%, and adult female arrests grew more than adult male arrests (54% and 12%, respectively). For Property Crime Index offenses, juvenile arrests declined for males and increased for females between 2000 and 2009, and adult arrests increased less for males (6%) than for females (49%).
Juvenile arrests disproportionately involved minorities
The racial composition of the U.S. juvenile population ages 10–17 in 2009 was 77% white, 16% black, 5% Asian/Pacific Islander, and 1% American Indian. Most juveniles of Hispanic ethnicity were included in the white racial category. Of all juvenile
arrests for violent crimes in 2009, 47% involved white youth, 51% involved black youth, 1% involved Asian youth, and 1% involved American Indian youth. For property crime arrests, the proportions were 64% white youth, 33% black youth, 2% Asian youth, and 1% American Indian youth. Black youth were overrepresented in juvenile arrests.
Most serious offense
Black proportion of juvenile arrests
in 2009
Murder 58% Forcible rape 33 Robbery 67 Aggravated assault 42 Simple assault 39 Burglary 37 Larceny-theft 32 Motor vehicle theft 43 Weapons 37 Drug abuse violations 25 Vandalism 19 Liquor laws 6
Data source: Analysis of Snyder, H., and Mulako-Wantota, J., Bureau of Justice Statistics, Arrest Data Analysis Tool [online, released 9/22/11].
One in nine violent crimes cleared was attributed to juveniles
The relative responsibility of juveniles and adults for crime is difficult to determine. Law enforcement agencies are more likely to clear (or “close”) crimes that juveniles commit than those that adults commit. Thus, law enforcement records may overestimate juvenile responsibility for crime.
Data on crimes cleared or closed by arrest or exceptional means show that the proportion of violent crimes cleared and attributed to juveniles has been rather constant in recent years, holding at about 12% over the past 10 years. Specifically, the proportions of both forcible rapes and aggravated assaults attributed to juveniles fluctuated
between 10% and 12% over this period, while the proportion of murders ranged between 5% and 6% and the proportion of robberies ranged between 14% and 16%.
In 2009, 17% of Property Crime Index offenses cleared by arrest or exceptional means were cleared by the arrest of a juvenile. This was 1 percentage point less than the level in 2008; the level in 2009 was the lowest since at least the mid-1960s. For comparison, the proportion of Property Crime Index offenses that law enforcement attributed to juveniles was 28% in 1980 and 22% in both 1990 and 2000.
National Report Series Bulletin 6
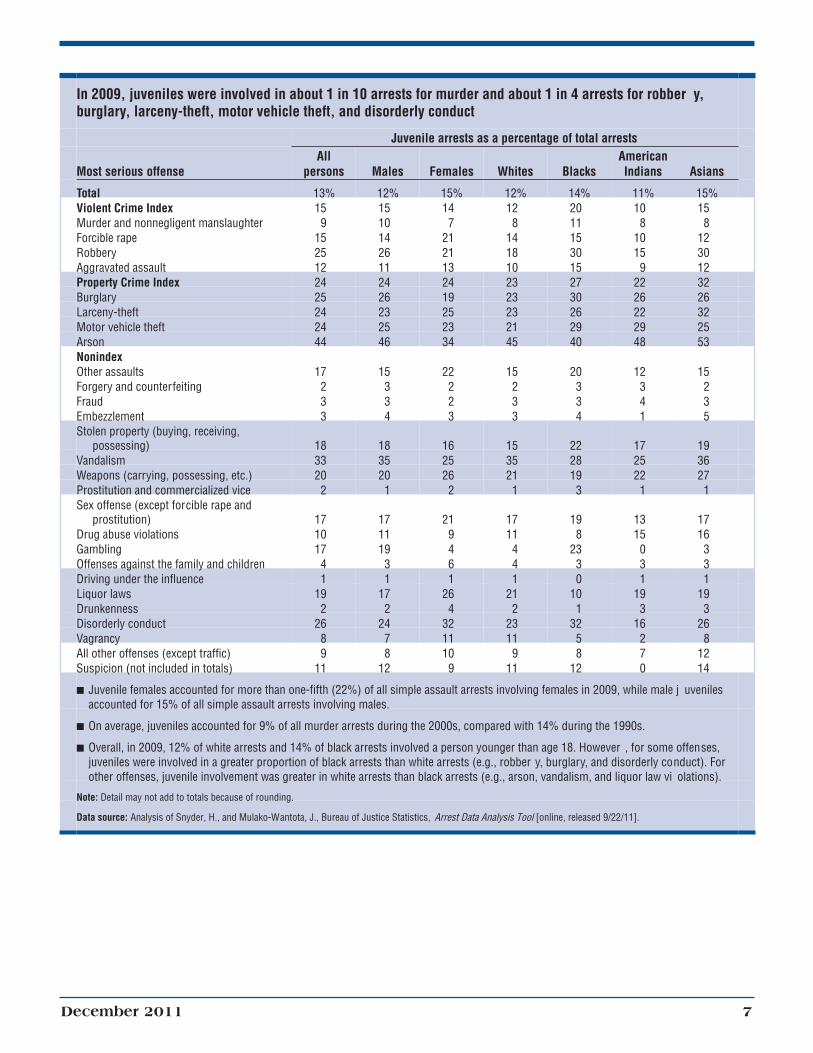
In 2009, juveniles were involved in about 1 in 10 arrests for murder and about 1 in 4 arrests for robber y, burglary, larceny-theft, motor vehicle theft, and disorderly conduct
Juvenile arrests as a percentage of total arrestsAll American
Most serious offense persons Males Females Whites Blacks Indians Asians
Total 13% 12% 15% 12% 14% 11% 15% Violent Crime Index 15 15 14 12 20 10 15 Murder and nonnegligent manslaughter 9 10 7 8 11 8 8 Forcible rape 15 14 21 14 15 10 12 Robbery 25 26 21 18 30 15 30 Aggravated assault 12 11 13 10 15 9 12 Property Crime Index 24 24 24 23 27 22 32 Burglary 25 26 19 23 30 26 26 Larceny-theft 24 23 25 23 26 22 32 Motor vehicle theft 24 25 23 21 29 29 25 Arson 44 46 34 45 40 48 53 Nonindex Other assaults 17 15 22 15 20 12 15 Forgery and counterfeiting 2 3 2 2 3 3 2 Fraud 3 3 2 3 3 4 3 Embezzlement 3 4 3 3 4 1 5 Stolen property (buying, receiving,
possessing) 18 18 16 15 22 17 19Vandalism 33 35 25 35 28 25 36 Weapons (carrying, possessing, etc.) 20 20 26 21 19 22 27 Prostitution and commercialized vice 2 1 2 1 3 1 1 Sex offense (except forcible rape and
prostitution) 17 17 21 17 19 13 17 Drug abuse violations 10 11 9 11 8 15 16 Gambling 17 19 4 4 23 0 3 Offenses against the family and children 4 3 6 4 3 3 3 Driving under the influence 1 1 1 1 0 1 1 Liquor laws 19 17 26 21 10 19 19 Drunkenness 2 2 4 2 1 3 3 Disorderly conduct 26 24 32 23 32 16 26 Vagrancy 8 7 11 11 5 2 8 All other offenses (except traffic) 9 8 10 9 8 7 12 Suspicion (not included in totals) 11 12 9 11 12 0 14
Q Juvenile females accounted for more than one-fifth (22%) of all simple assault arrests involving females in 2009, while male j uveniles accounted for 15% of all simple assault arrests involving males.
Q On average, juveniles accounted for 9% of all murder arrests during the 2000s, compared with 14% during the 1990s.
Q Overall, in 2009, 12% of white arrests and 14% of black arrests involved a person younger than age 18. However , for some offenses, juveniles were involved in a greater proportion of black arrests than white arrests (e.g., robber y, burglary, and disorderly conduct). For other offenses, juvenile involvement was greater in white arrests than black arrests (e.g., arson, vandalism, and liquor law vi olations).
Note: Detail may not add to totals because of rounding.
Data source: Analysis of Snyder, H., and Mulako-Wantota, J., Bureau of Justice Statistics, Arrest Data Analysis Tool [online, released 9/22/11].
December 2011 7
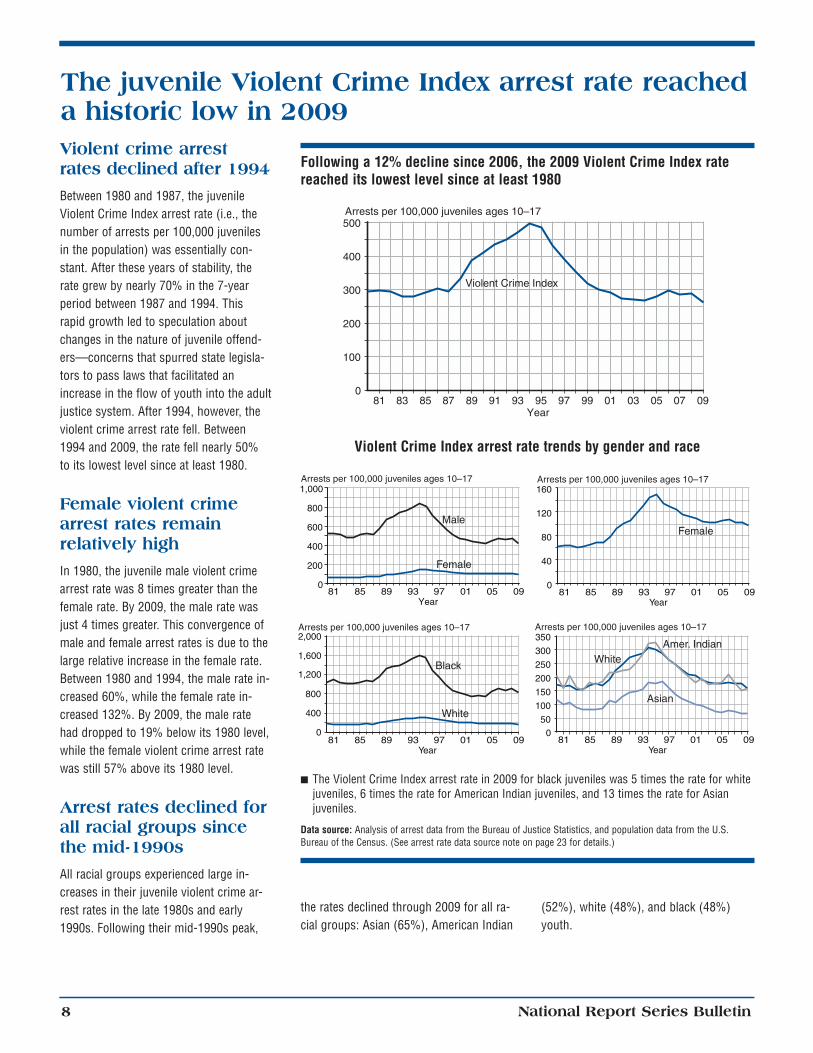
The juvenile Violent Crime Index arrest rate reached a historic low in 2009 Violent crime arrest
Following a 12% decline since 2006, the 2009 Violent Crime Index raterates declined after 1994 reached its lowest level since at least 1980
Between 1980 and 1987, the juvenile Violent Crime Index arrest rate (i.e., the
500number of arrests per 100,000 juveniles in the population) was essentially con
400 stant. After these years of stability, the rate grew by nearly 70% in the 7-year 300 period between 1987 and 1994. This rapid growth led to speculation about 200
changes in the nature of juvenile offenders—concerns that spurred state legisla- 100
tors to pass laws that facilitated an 0increase in the flow of youth into the adult
81 83 85 87 89 91 93 95 97 99 01 03 05 07 09 justice system. After 1994, however, the Year
violent crime arrest rate fell. Between 1994 and 2009, the rate fell nearly 50% Violent Crime Index arrest rate trends by gender and race to its lowest level since at least 1980.
Arrests per 100,000 juveniles ages 10–17 Arrests per 100,000 juveniles ages 10–17
Arrests per 100,000 juveniles ages 10–17
Violent Crime Index
Female violent crime arrest rates remain relatively high 400
1,000
800
600
In 1980, the juvenile male violent crime arrest rate was 8 times greater than the female rate. By 2009, the male rate was
200
0 81 85 89 93 97
Year 01 05 09 81 85 89 93 97
Year 01 05 09
just 4 times greater. This convergence of Arrests per 100,000 juveniles ages 10–17 Arrests per 100,000 juveniles ages 10–17
Male
Female
160
120
80
40
0
Female
2,000male and female arrest rates is due to the 1,600large relative increase in the female rate. 1,200Between 1980 and 1994, the male rate in
800creased 60%, while the female rate increased 132%. By 2009, the male rate 400
had dropped to 19% below its 1980 level, 0 81 85 89 93 97 01 05 09 81 85 89 93 97 01 05 09
while the female violent crime arrest rate Year Year
was still 57% above its 1980 level. Q The Violent Crime Index arrest rate in 2009 for black juveniles was 5 times the rate for white
juveniles, 6 times the rate for American Indian juveniles, and 13 times the rate for AsianArrest rates declined for juveniles.
all racial groups since Data source: Analysis of arrest data from the Bureau of Justice Statistics, and population data from the U.S. Bureau of the Census. (See arrest rate data source note on page 23 for details.) the mid-1990s
Black
White
350
300
250
200
150
100
50
White Amer. Indian
Asian
0
All racial groups experienced large increases in their juvenile violent crime arrest rates in the late 1980s and early 1990s. Following their mid-1990s peak,
the rates declined through 2009 for all racial groups: Asian (65%), American Indian
(52%), white (48%), and black (48%) youth.
8 National Report Series Bulletin
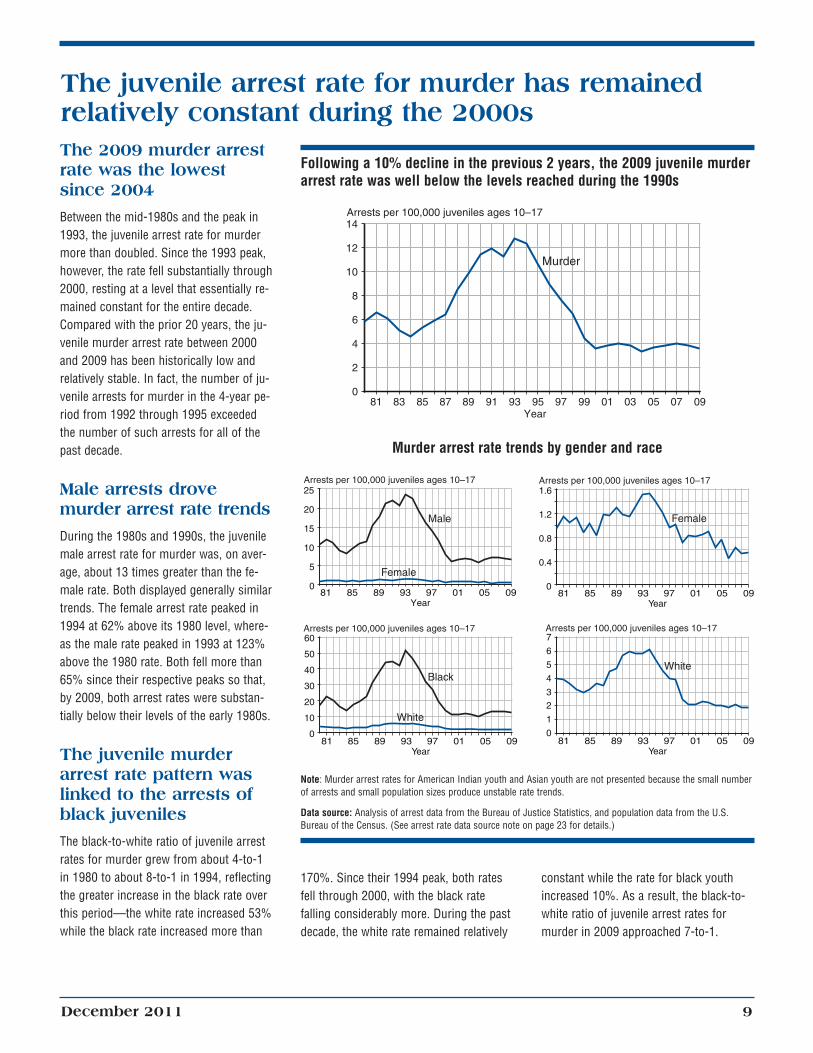
The juvenile arrest rate for murder has remained relatively constant during the 2000s The 2009 murder arrest rate was the lowest since 2004
Between the mid-1980s and the peak in 1993, the juvenile arrest rate for murder more than doubled. Since the 1993 peak, however, the rate fell substantially through 2000, resting at a level that essentially remained constant for the entire decade. Compared with the prior 20 years, the juvenile murder arrest rate between 2000 and 2009 has been historically low and relatively stable. In fact, the number of juvenile arrests for murder in the 4-year period from 1992 through 1995 exceeded the number of such arrests for all of the past decade.
Male arrests drove murder arrest rate trends
During the 1980s and 1990s, the juvenile male arrest rate for murder was, on average, about 13 times greater than the female rate. Both displayed generally similar trends. The female arrest rate peaked in 1994 at 62% above its 1980 level, whereas the male rate peaked in 1993 at 123% above the 1980 rate. Both fell more than 65% since their respective peaks so that, by 2009, both arrest rates were substantially below their levels of the early 1980s.
The juvenile murder arrest rate pattern was linked to the arrests of black juveniles
The black-to-white ratio of juvenile arrest rates for murder grew from about 4-to-1 in 1980 to about 8-to-1 in 1994, reflecting the greater increase in the black rate over this period—the white rate increased 53% while the black rate increased more than
Following a 10% decline in the previous 2 years, the 2009 juvenile murder arrest rate was well below the levels reached during the 1990s
Arrests per 100,000 juveniles ages 10–17 14
12
10
8
6
4
2
0
Murder
81 83 85 87 89 91 93 95 97 99 01 03 05 07 09 Year
Murder arrest rate trends by gender and race
Arrests per 100,000 juveniles ages 10–17 Arrests per 100,000 juveniles ages 10–17 25
Female
Male
1.6
20 1.2
15 0.8
10
0.45
0 0
Female
81 85 89 93 97 01 05 09 81 85 89 93 97 01 05 09 Year Year
Arrests per 100,000 juveniles ages 10–17 Arrests per 100,000 juveniles ages 10–17
White
Black
7
6 60
50 5
40 4
30
20 3
10 2
1
0 81 85 89 93 97 01 05 09 81 85 89 93 97 01 05 09
Year Year
0
White
Note: Murder arrest rates for American Indian youth and Asian youth are not presented because the small number of arrests and small population sizes produce unstable rate trends.
Data source: Analysis of arrest data from the Bureau of Justice Statistics, and population data from the U.S. Bureau of the Census. (See arrest rate data source note on page 23 for details.)
170%. Since their 1994 peak, both rates constant while the rate for black youth fell through 2000, with the black rate increased 10%. As a result, the black-tofalling considerably more. During the past white ratio of juvenile arrest rates for decade, the white rate remained relatively murder in 2009 approached 7-to-1.
December 2011 9
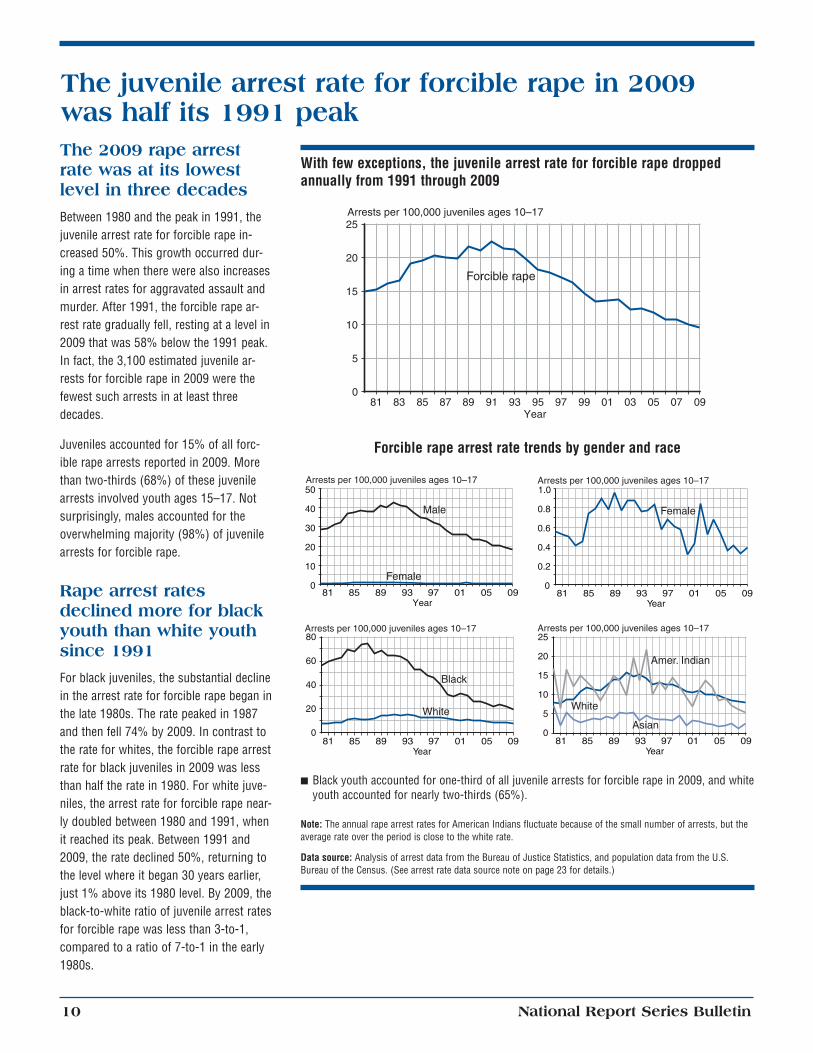
The juvenile arrest rate for forcible rape in 2009 was half its 1991 peak The 2009 rape arrest rate was at its lowest level in three decades
Between 1980 and the peak in 1991, the juvenile arrest rate for forcible rape increased 50%. This growth occurred during a time when there were also increases in arrest rates for aggravated assault and murder. After 1991, the forcible rape arrest rate gradually fell, resting at a level in 2009 that was 58% below the 1991 peak. In fact, the 3,100 estimated juvenile arrests for forcible rape in 2009 were the fewest such arrests in at least three decades.
Juveniles accounted for 15% of all forcible rape arrests reported in 2009. More than two-thirds (68%) of these juvenile arrests involved youth ages 15–17. Not surprisingly, males accounted for the overwhelming majority (98%) of juvenile arrests for forcible rape.
Rape arrest rates declined more for black youth than white youth since 1991
For black juveniles, the substantial decline in the arrest rate for forcible rape began in the late 1980s. The rate peaked in 1987 and then fell 74% by 2009. In contrast to the rate for whites, the forcible rape arrest rate for black juveniles in 2009 was less than half the rate in 1980. For white juveniles, the arrest rate for forcible rape nearly doubled between 1980 and 1991, when it reached its peak. Between 1991 and 2009, the rate declined 50%, returning to the level where it began 30 years earlier, just 1% above its 1980 level. By 2009, the black-to-white ratio of juvenile arrest rates for forcible rape was less than 3-to-1, compared to a ratio of 7-to-1 in the early 1980s.
With few exceptions, the juvenile arrest rate for forcible rape dropped annually from 1991 through 2009
Arrests per 100,000 juveniles ages 10–17 25
20
15
10
5
0
Forcible rape
81 83 85 87 89 91 93 95 97 99 01 03 05 07 09 Year
Forcible rape arrest rate trends by gender and race
Arrests per 100,000 juveniles ages 10–17 Arrests per 100,000 juveniles ages 10–17 50
Female
Male
1.0
40 0.8
30 0.6
20 0.4
10 0.2
0 0
Female
81 85 89 93 97 01 05 09 81 85 89 93 97 01 05 09 Year Year
Arrests per 100,000 juveniles ages 10–17 Arrests per 100,000 juveniles ages 10–17 80
Black
White
25
2060
40 15
10
20 5
0 0 81 85 89 93 97 01 05 09 81 85 89 93 97 01 05 09
Year Year
White
Amer. Indian
Asian
Q Black youth accounted for one-third of all juvenile arrests for forcible rape in 2009, and white youth accounted for nearly two-thirds (65%).
Note: The annual rape arrest rates for American Indians fluctuate because of the small number of arrests, but the average rate over the period is close to the white rate.
Data source: Analysis of arrest data from the Bureau of Justice Statistics, and population data from the U.S. Bureau of the Census. (See arrest rate data source note on page 23 for details.)
National Report Series Bulletin 10
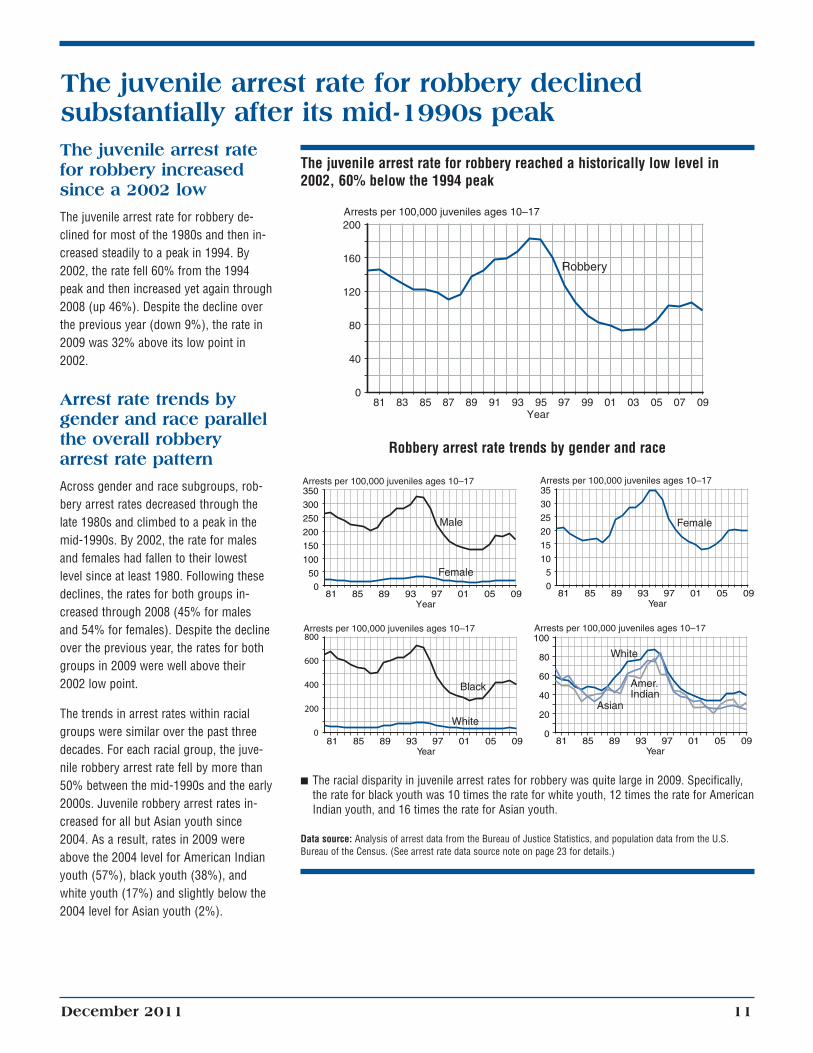
The juvenile arrest rate for robbery declined substantially after its mid-1990s peak The juvenile arrest rate for robbery increased since a 2002 low
The juvenile arrest rate for robbery declined for most of the 1980s and then increased steadily to a peak in 1994. By 2002, the rate fell 60% from the 1994 peak and then increased yet again through 2008 (up 46%). Despite the decline over the previous year (down 9%), the rate in 2009 was 32% above its low point in 2002.
Arrest rate trends by gender and race parallel the overall robbery arrest rate pattern
Across gender and race subgroups, robbery arrest rates decreased through the late 1980s and climbed to a peak in the mid-1990s. By 2002, the rate for males and females had fallen to their lowest level since at least 1980. Following these declines, the rates for both groups increased through 2008 (45% for males and 54% for females). Despite the decline over the previous year, the rates for both groups in 2009 were well above their 2002 low point.
The trends in arrest rates within racial groups were similar over the past three decades. For each racial group, the juvenile robbery arrest rate fell by more than 50% between the mid-1990s and the early 2000s. Juvenile robbery arrest rates increased for all but Asian youth since 2004. As a result, rates in 2009 were above the 2004 level for American Indian youth (57%), black youth (38%), and white youth (17%) and slightly below the 2004 level for Asian youth (2%).
The juvenile arrest rate for robbery reached a historically low level in 2002, 60% below the 1994 peak
Arrests per 100,000 juveniles ages 10–17 200
160
120
80
40
0 81 83 85 87 89 91 93 95 97 99 01 03 05 07 09
Year
Robbery arrest rate trends by gender and race
Robbery
Arrests per 100,000 juveniles ages 10–17 350
300
250
200
150
100
50 0
Male
Female
Arrests per 100,000 juveniles ages 10–17 35
30
25
20
15
10 5
0
Female
81 85 89 93 97 01 05 09 81 85 89 93 97 01 05 09 Year
Arrests per 100,000 juveniles ages 10–17 800
600
400
200
0
Black
White
Year
Arrests per 100,000 juveniles ages 10–17 100
80
60
40
20
0
White
Asian
Amer. Indian
81 85 89 93 97 01 05 09 81 85 89 93 97 01 05 09 Year Year
Q The racial disparity in juvenile arrest rates for robbery was quite large in 2009. Specifically, the rate for black youth was 10 times the rate for white youth, 12 times the rate for American Indian youth, and 16 times the rate for Asian youth.
Data source: Analysis of arrest data from the Bureau of Justice Statistics, and population data from the U.S. Bureau of the Census. (See arrest rate data source note on page 23 for details.)
December 2011 11
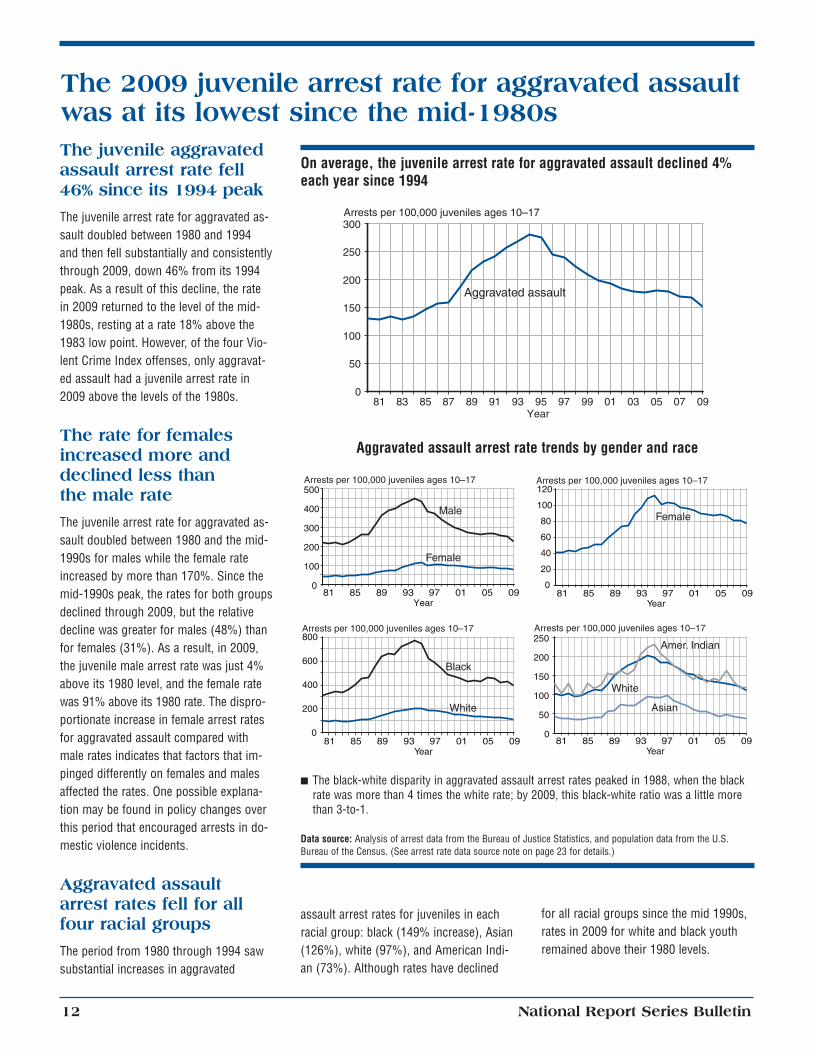
The 2009 juvenile arrest rate for aggravated assault was at its lowest since the mid-1980s The juvenile aggravated
On average, the juvenile arrest rate for aggravated assault declined 4%assault arrest rate fell each year since 199446% since its 1994 peak
The juvenile arrest rate for aggravated as300
sault doubled between 1980 and 1994 and then fell substantially and consistently 250
through 2009, down 46% from its 1994 200
peak. As a result of this decline, the rate in 2009 returned to the level of the mid- 150
1980s, resting at a rate 18% above the 1001983 low point. However, of the four Vio
lent Crime Index offenses, only aggravat- 50
ed assault had a juvenile arrest rate in 02009 above the levels of the 1980s. 81 83 85 87 89 91 93 95 97 99 01 03 05 07 09
Year
The rate for females Aggravated assault arrest rate trends by gender and raceincreased more and
declined less than Arrests per 100,000 juveniles ages 10–17 Arrests per 100,000 juveniles ages 10–17
Arrests per 100,000 juveniles ages 10–17
Aggravated assault
the male rate 500
400
The juvenile arrest rate for aggravated as 300 sault doubled between 1980 and the mid
200 1990s for males while the female rate
100 increased by more than 170%. Since the
0 mid-1990s peak, the rates for both groups 81 85 89 93 97 01 05 0981 85 89 93 97 01 05 09
Year Year declined through 2009, but the relative
Male
Female
120
100
80
60
40
Female
20
0
decline was greater for males (48%) than for females (31%). As a result, in 2009, the juvenile male arrest rate was just 4% above its 1980 level, and the female rate was 91% above its 1980 rate. The disproportionate increase in female arrest rates for aggravated assault compared with 81 85 89 93 97 01 05 09 81 85 89 93 97 01 05 09
Year Year male rates indicates that factors that impinged differently on females and males
Q The black-white disparity in aggravated assault arrest rates peaked in 1988, when the blackaffected the rates. One possible explana rate was more than 4 times the white rate; by 2009, this black-white ratio was a little more tion may be found in policy changes over than 3-to-1. this period that encouraged arrests in domestic violence incidents. Data source: Analysis of arrest data from the Bureau of Justice Statistics, and population data from the U.S.
Bureau of the Census. (See arrest rate data source note on page 23 for details.)
Aggravated assault arrest rates fell for all four racial groups
assault arrest rates for juveniles in each racial group: black (149% increase), Asian
for all racial groups since the mid 1990s, rates in 2009 for white and black youth
The period from 1980 through 1994 saw (126%), white (97%), and American Indi remained above their 1980 levels.
substantial increases in aggravated an (73%). Although rates have declined
12 National Report Series Bulletin
800 Arrests per 100,000 juveniles ages 10–17
600
400
200
Black
White
0
Arrests per 100,000 juveniles ages 10–17 250
200
150
100
50
0
Amer. Indian
White
Asian
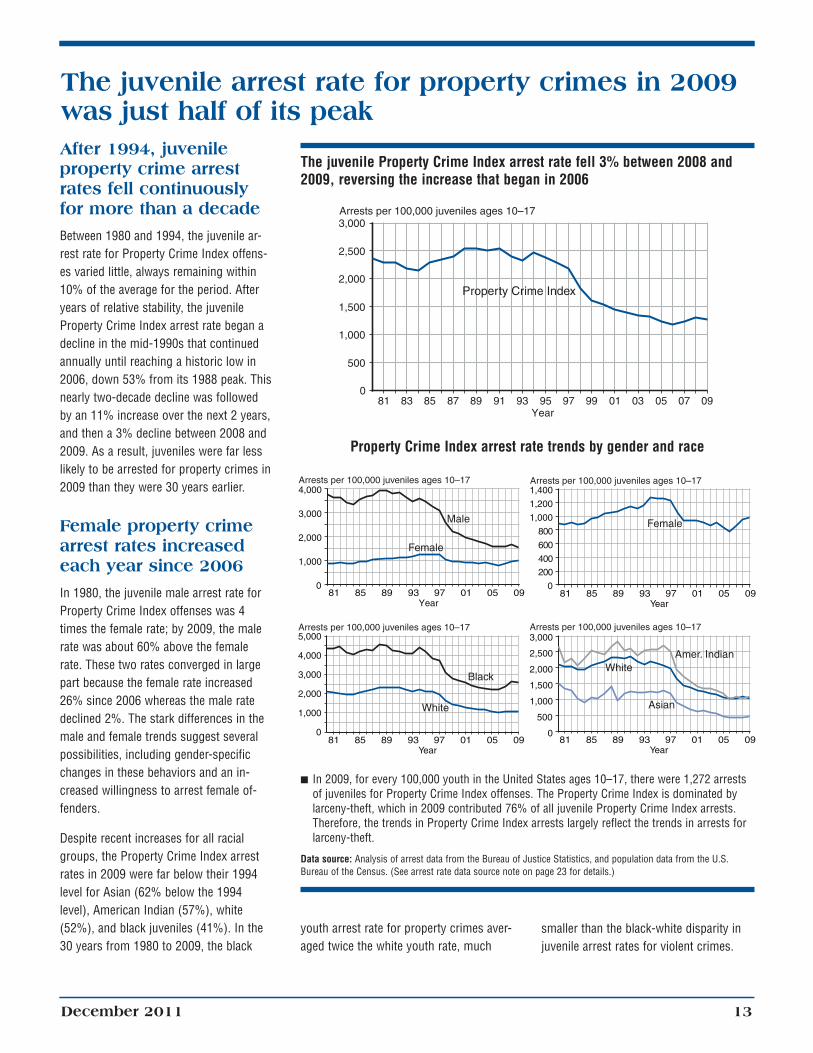
The juvenile arrest rate for property crimes in 2009 was just half of its peak After 1994, juvenile property crime arrest rates fell continuously for more than a decade
Between 1980 and 1994, the juvenile arrest rate for Property Crime Index offenses varied little, always remaining within 10% of the average for the period. After years of relative stability, the juvenile Property Crime Index arrest rate began a decline in the mid-1990s that continued annually until reaching a historic low in 2006, down 53% from its 1988 peak. This nearly two-decade decline was followed by an 11% increase over the next 2 years, and then a 3% decline between 2008 and 2009. As a result, juveniles were far less likely to be arrested for property crimes in 2009 than they were 30 years earlier.
Female property crime arrest rates increased each year since 2006
In 1980, the juvenile male arrest rate for Property Crime Index offenses was 4 times the female rate; by 2009, the male rate was about 60% above the female rate. These two rates converged in large part because the female rate increased 26% since 2006 whereas the male rate declined 2%. The stark differences in the male and female trends suggest several possibilities, including gender-specific changes in these behaviors and an increased willingness to arrest female offenders.
Despite recent increases for all racial groups, the Property Crime Index arrest rates in 2009 were far below their 1994 level for Asian (62% below the 1994 level), American Indian (57%), white (52%), and black juveniles (41%). In the 30 years from 1980 to 2009, the black
The juvenile Property Crime Index arrest rate fell 3% between 2008 and 2009, reversing the increase that began in 2006
Arrests per 100,000 juveniles ages 10–17 3,000
2,500
2,000
1,500
1,000
500
0 81 83 85 87 89 91 93 95 97 99 01 03 05 07 09
Year
Property Crime Index
Property Crime Index arrest rate trends by gender and race
Arrests per 100,000 juveniles ages 10–17 Arrests per 100,000 juveniles ages 10–17 4,000
Male
Female
1,400
1,200 3,000 1,000
8002,000
600
400 200
0
1,000
0
Female
81 85 89 93 97 01 05 09 81 85 89 93 97 01 05 09 Year Year
Arrests per 100,000 juveniles ages 10–17 Arrests per 100,000 juveniles ages 10–17 5,000
White
Black
3,000
2,5004,000
2,0003,000
2,000 1,500
1,000 1,000
500
0 0
White
Asian
Amer. Indian
81 85 89 93 97 01 05 09 81 85 89 93 97 01 05 09 Year Year
Q In 2009, for every 100,000 youth in the United States ages 10–17, there were 1,272 arrests of juveniles for Property Crime Index offenses. The Property Crime Index is dominated by larceny-theft, which in 2009 contributed 76% of all juvenile Property Crime Index arrests. Therefore, the trends in Property Crime Index arrests largely reflect the trends in arrests for larceny-theft.
Data source: Analysis of arrest data from the Bureau of Justice Statistics, and population data from the U.S. Bureau of the Census. (See arrest rate data source note on page 23 for details.)
youth arrest rate for property crimes aver- smaller than the black-white disparity in aged twice the white youth rate, much juvenile arrest rates for violent crimes.
December 2011 13
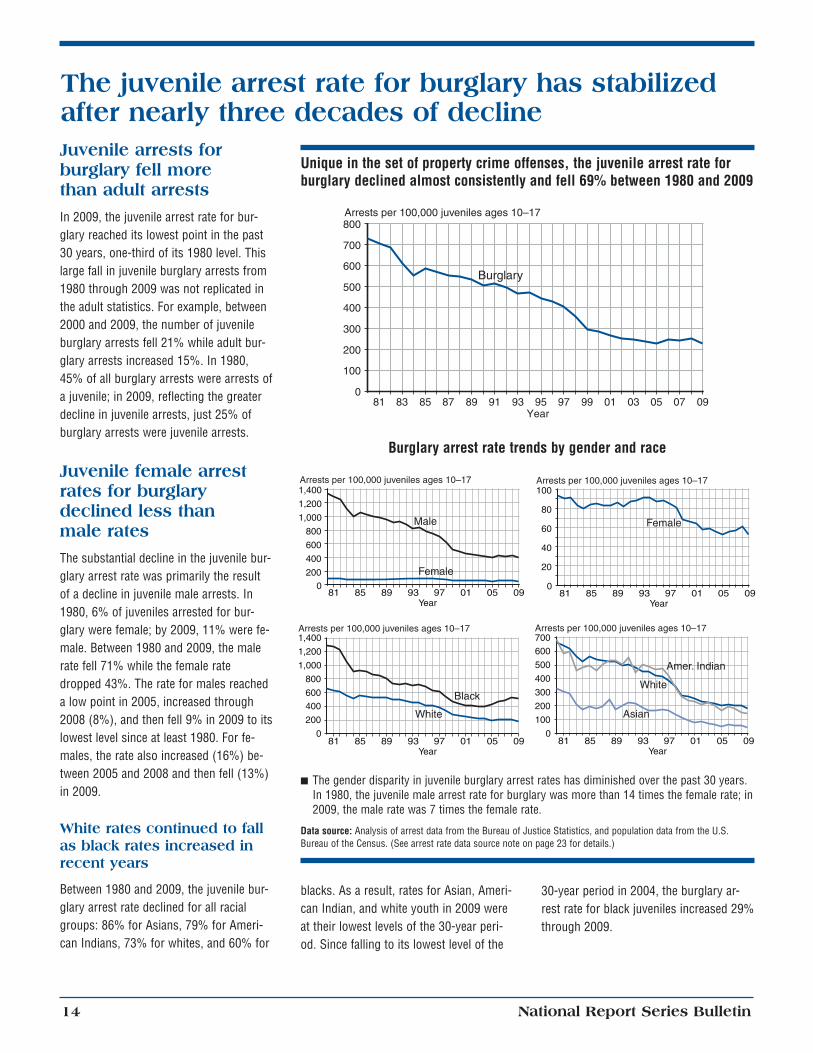
The juvenile arrest rate for burglary has stabilized after nearly three decades of decline Juvenile arrests for burglary fell more than adult arrests
In 2009, the juvenile arrest rate for burglary reached its lowest point in the past 30 years, one-third of its 1980 level. This large fall in juvenile burglary arrests from 1980 through 2009 was not replicated in the adult statistics. For example, between 2000 and 2009, the number of juvenile burglary arrests fell 21% while adult burglary arrests increased 15%. In 1980, 45% of all burglary arrests were arrests of a juvenile; in 2009, reflecting the greater decline in juvenile arrests, just 25% of burglary arrests were juvenile arrests.
Juvenile female arrest rates for burglary declined less than male rates
The substantial decline in the juvenile burglary arrest rate was primarily the result of a decline in juvenile male arrests. In 1980, 6% of juveniles arrested for burglary were female; by 2009, 11% were female. Between 1980 and 2009, the male rate fell 71% while the female rate dropped 43%. The rate for males reached a low point in 2005, increased through 2008 (8%), and then fell 9% in 2009 to its lowest level since at least 1980. For females, the rate also increased (16%) between 2005 and 2008 and then fell (13%) in 2009.
White rates continued to fall as black rates increased in recent years
Between 1980 and 2009, the juvenile burglary arrest rate declined for all racial groups: 86% for Asians, 79% for American Indians, 73% for whites, and 60% for
Unique in the set of property crime offenses, the juvenile arrest rate for burglary declined almost consistently and fell 69% between 1980 and 2009
Arrests per 100,000 juveniles ages 10–17 800
700
600
500
400
300
200
100
0 81 83 85 87 89 91 93 95 97 99 01 03 05 07 09
Year
Burglary arrest rate trends by gender and race
Arrests per 100,000 juveniles ages 10–17 Arrests per 100,000 juveniles ages 10–17 1,400
Male
Female
1,200 100
1,000 80
800
600
60
400 40
20200
0 0
Female
81 85 89 93 97 01 05 09 81 85 89 93 97 01 05 09 Year Year
Arrests per 100,000 juveniles ages 10–17 Arrests per 100,000 juveniles ages 10–17
White
Black
700
1,200
1,400
1,000
600
800
500
600
400
400
300
200
200
100
0 0
Amer. Indian
White
Asian
81 85 89 93 97 01 05 09 81 85 89 93 97 01 05 09 Year Year
Q The gender disparity in juvenile burglary arrest rates has diminished over the past 30 years. In 1980, the juvenile male arrest rate for burglary was more than 14 times the female rate; in 2009, the male rate was 7 times the female rate.
Data source: Analysis of arrest data from the Bureau of Justice Statistics, and population data from the U.S. Bureau of the Census. (See arrest rate data source note on page 23 for details.)
Burglary
blacks. As a result, rates for Asian, Ameri- 30-year period in 2004, the burglary arcan Indian, and white youth in 2009 were rest rate for black juveniles increased 29% at their lowest levels of the 30-year peri- through 2009. od. Since falling to its lowest level of the
National Report Series Bulletin 14
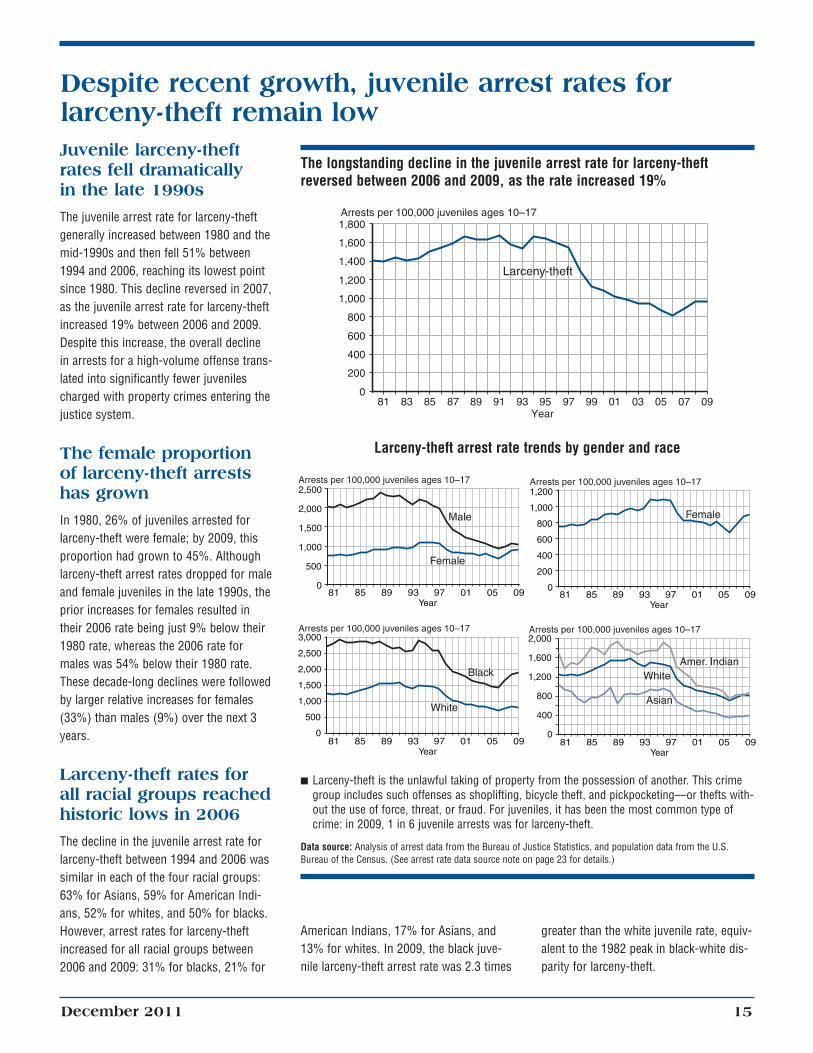
Despite recent growth, juvenile arrest rates for larceny-theft remain low Juvenile larceny-theft rates fell dramatically in the late 1990s
The juvenile arrest rate for larceny-theft generally increased between 1980 and the mid-1990s and then fell 51% between 1994 and 2006, reaching its lowest point since 1980. This decline reversed in 2007, as the juvenile arrest rate for larceny-theft increased 19% between 2006 and 2009. Despite this increase, the overall decline in arrests for a high-volume offense translated into significantly fewer juveniles charged with property crimes entering the justice system.
The female proportion of larceny-theft arrests has grown
In 1980, 26% of juveniles arrested for larceny-theft were female; by 2009, this proportion had grown to 45%. Although larceny-theft arrest rates dropped for male and female juveniles in the late 1990s, the prior increases for females resulted in their 2006 rate being just 9% below their 1980 rate, whereas the 2006 rate for males was 54% below their 1980 rate. These decade-long declines were followed by larger relative increases for females (33%) than males (9%) over the next 3 years.
Larceny-theft rates for all racial groups reached historic lows in 2006
The decline in the juvenile arrest rate for larceny-theft between 1994 and 2006 was similar in each of the four racial groups: 63% for Asians, 59% for American Indians, 52% for whites, and 50% for blacks. However, arrest rates for larceny-theft increased for all racial groups between 2006 and 2009: 31% for blacks, 21% for
The longstanding decline in the juvenile arrest rate for larceny-theft reversed between 2006 and 2009, as the rate increased 19%
Arrests per 100,000 juveniles ages 10–17 1,800
1,600
1,400
1,200
1,000
800
600
400
200
0 81 83 85 87 89 91 93 95 97 99 01 03 05 07 09
Year
Larceny-theft arrest rate trends by gender and race
Arrests per 100,000 juveniles ages 10–17 Arrests per 100,000 juveniles ages 10–17 2,500
Male
Female
1,200
1,000
800
2,000
1,500 600
1,000
500 400
200
0 0
Female
81 85 89 93 97 01 05 09 81 85 89 93 97 01 05 09 Year Year
Arrests per 100,000 juveniles ages 10–17 Arrests per 100,000 juveniles ages 10–17 3,000
White
Black
2,000
2,500
2,000 1,600
1,500 1,200
8001,000
500 400
0 0 81 85 89 93 97 01 05 09 81 85 89 93 97 01 05 09
Year Year
White
Asian
Amer. Indian
Q Larceny-theft is the unlawful taking of property from the possession of another. This crime group includes such offenses as shoplifting, bicycle theft, and pickpocketing—or thefts without the use of force, threat, or fraud. For juveniles, it has been the most common type of crime: in 2009, 1 in 6 juvenile arrests was for larceny-theft.
Data source: Analysis of arrest data from the Bureau of Justice Statistics, and population data from the U.S. Bureau of the Census. (See arrest rate data source note on page 23 for details.)
Larceny-theft
American Indians, 17% for Asians, and greater than the white juvenile rate, equiv13% for whites. In 2009, the black juve- alent to the 1982 peak in black-white dis-nile larceny-theft arrest rate was 2.3 times parity for larceny-theft.
December 2011 15
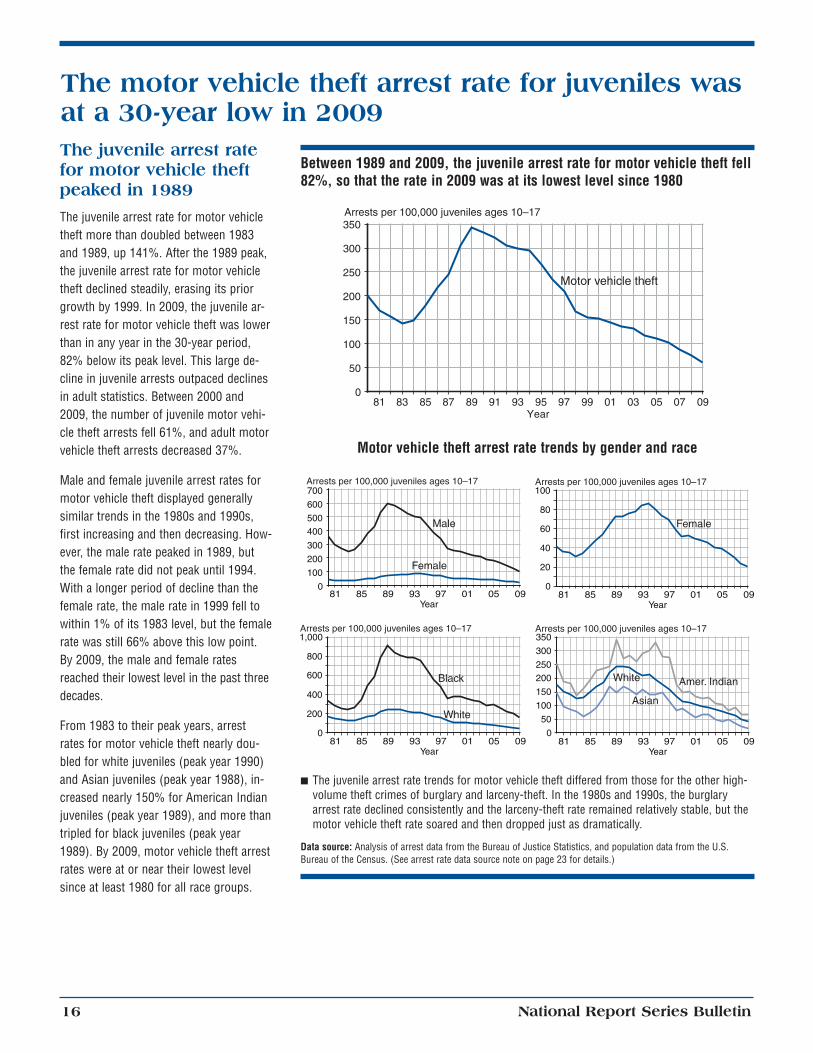
The motor vehicle theft arrest rate for juveniles was at a 30-year low in 2009 The juvenile arrest rate for motor vehicle theft peaked in 1989
The juvenile arrest rate for motor vehicle theft more than doubled between 1983 and 1989, up 141%. After the 1989 peak, the juvenile arrest rate for motor vehicle theft declined steadily, erasing its prior growth by 1999. In 2009, the juvenile arrest rate for motor vehicle theft was lower than in any year in the 30-year period, 82% below its peak level. This large decline in juvenile arrests outpaced declines in adult statistics. Between 2000 and 2009, the number of juvenile motor vehicle theft arrests fell 61%, and adult motor vehicle theft arrests decreased 37%.
Male and female juvenile arrest rates for motor vehicle theft displayed generally similar trends in the 1980s and 1990s, first increasing and then decreasing. However, the male rate peaked in 1989, but the female rate did not peak until 1994. With a longer period of decline than the female rate, the male rate in 1999 fell to within 1% of its 1983 level, but the female rate was still 66% above this low point. By 2009, the male and female rates reached their lowest level in the past three decades.
From 1983 to their peak years, arrest rates for motor vehicle theft nearly doubled for white juveniles (peak year 1990) and Asian juveniles (peak year 1988), increased nearly 150% for American Indian juveniles (peak year 1989), and more than tripled for black juveniles (peak year 1989). By 2009, motor vehicle theft arrest rates were at or near their lowest level since at least 1980 for all race groups.
Between 1989 and 2009, the juvenile arrest rate for motor vehicle theft fell 82%, so that the rate in 2009 was at its lowest level since 1980
300
Arrests per 100,000 juveniles ages 10–17 350
250
200
150
100
50
0 81 83 85 87 89 91 93 95 97 99 01 03 05 07 09
Year
Motor vehicle theft
Motor vehicle theft arrest rate trends by gender and race
Arrests per 100,000 juveniles ages 10–17 Arrests per 100,000 juveniles ages 10–17
Male
Female
100
600
700
500 80
400 60
300 40 200
20100
0 0 81 85 89 93 97 01 05 09 81 85 89 93 97 01 05 09
Year Year
Female
Arrests per 100,000 juveniles ages 10–17 Arrests per 100,000 juveniles ages 10–17
Black
White
350
300
1,000
800
600 250 200
150400
200 100
50
0 0 81 85 89 93 97 01 05 09 81 85 89 93 97 01 05 09
Year Year
White
Asian
Amer. Indian
Q The juvenile arrest rate trends for motor vehicle theft differed from those for the other high-volume theft crimes of burglary and larceny-theft. In the 1980s and 1990s, the burglary arrest rate declined consistently and the larceny-theft rate remained relatively stable, but the motor vehicle theft rate soared and then dropped just as dramatically.
Data source: Analysis of arrest data from the Bureau of Justice Statistics, and population data from the U.S. Bureau of the Census. (See arrest rate data source note on page 23 for details.)
National Report Series Bulletin 16
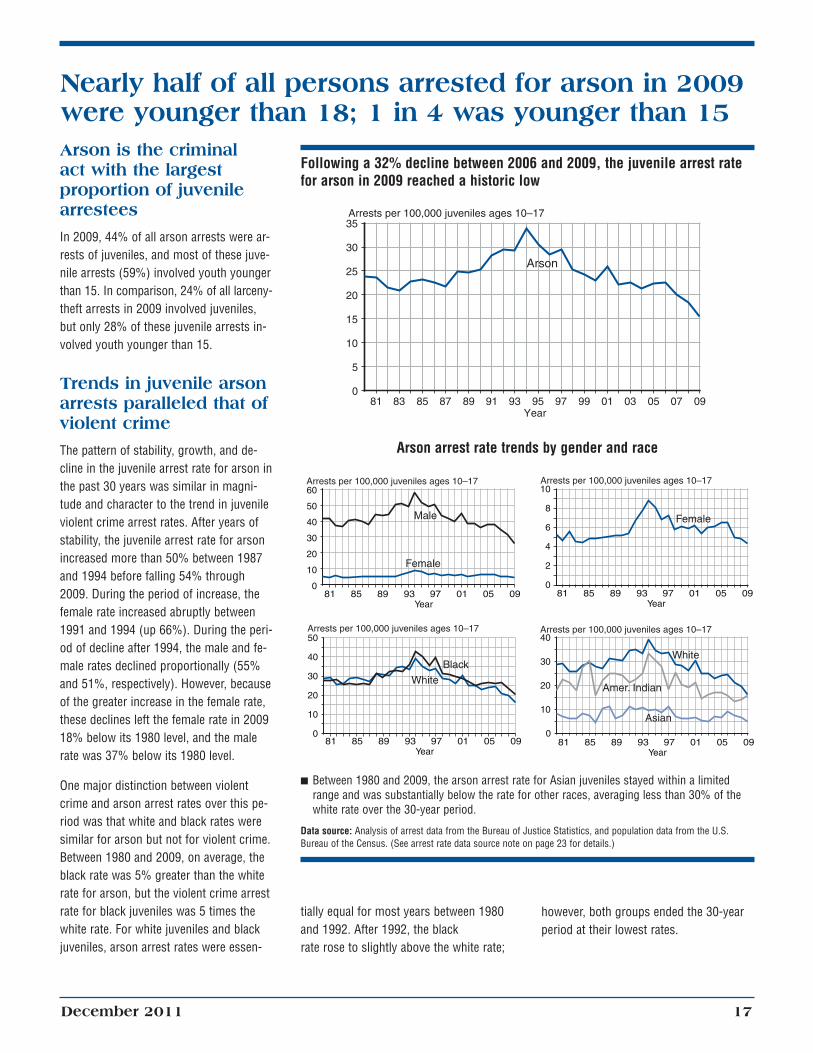
Nearly half of all persons arrested for arson in 2009 were younger than 18; 1 in 4 was younger than 15 Arson is the criminal act with the largest proportion of juvenile arrestees
In 2009, 44% of all arson arrests were arrests of juveniles, and most of these juvenile arrests (59%) involved youth younger than 15. In comparison, 24% of all larceny-theft arrests in 2009 involved juveniles, but only 28% of these juvenile arrests involved youth younger than 15.
Trends in juvenile arson arrests paralleled that of violent crime
The pattern of stability, growth, and decline in the juvenile arrest rate for arson in the past 30 years was similar in magnitude and character to the trend in juvenile violent crime arrest rates. After years of stability, the juvenile arrest rate for arson increased more than 50% between 1987 and 1994 before falling 54% through 2009. During the period of increase, the female rate increased abruptly between 1991 and 1994 (up 66%). During the period of decline after 1994, the male and female rates declined proportionally (55% and 51%, respectively). However, because of the greater increase in the female rate, these declines left the female rate in 2009 18% below its 1980 level, and the male rate was 37% below its 1980 level.
One major distinction between violent crime and arson arrest rates over this period was that white and black rates were similar for arson but not for violent crime. Between 1980 and 2009, on average, the black rate was 5% greater than the white rate for arson, but the violent crime arrest rate for black juveniles was 5 times the white rate. For white juveniles and black juveniles, arson arrest rates were essen-
Following a 32% decline between 2006 and 2009, the juvenile arrest rate for arson in 2009 reached a historic low
Arrests per 100,000 juveniles ages 10–17 35
30
25
20
15
10
5
0 81 83 85 87 89 91 93 95 97 99 01 03 05 07 09
Year
Arson
Arson arrest rate trends by gender and race
Arrests per 100,000 juveniles ages 10–17 Arrests per 100,000 juveniles ages 10–17
Male
Female
1060
50
40
8
30 6
4 20
210
0 81 85 89 93 97 01 05 09 81 85 89 93 97 01 05 09
Year Year
0
Female
Arrests per 100,000 juveniles ages 10–17 Arrests per 100,000 juveniles ages 10–17
Black
White
4050
40 30
30
20 20
1010
0 81 85 89 93 97 01 05 09 81 85 89 93 97 01 05 09
Year Year
0
White
Amer. Indian
Asian
Q Between 1980 and 2009, the arson arrest rate for Asian juveniles stayed within a limited range and was substantially below the rate for other races, averaging less than 30% of the white rate over the 30-year period.
Data source: Analysis of arrest data from the Bureau of Justice Statistics, and population data from the U.S. Bureau of the Census. (See arrest rate data source note on page 23 for details.)
tially equal for most years between 1980 however, both groups ended the 30-year and 1992. After 1992, the black period at their lowest rates. rate rose to slightly above the white rate;
December 2011 17
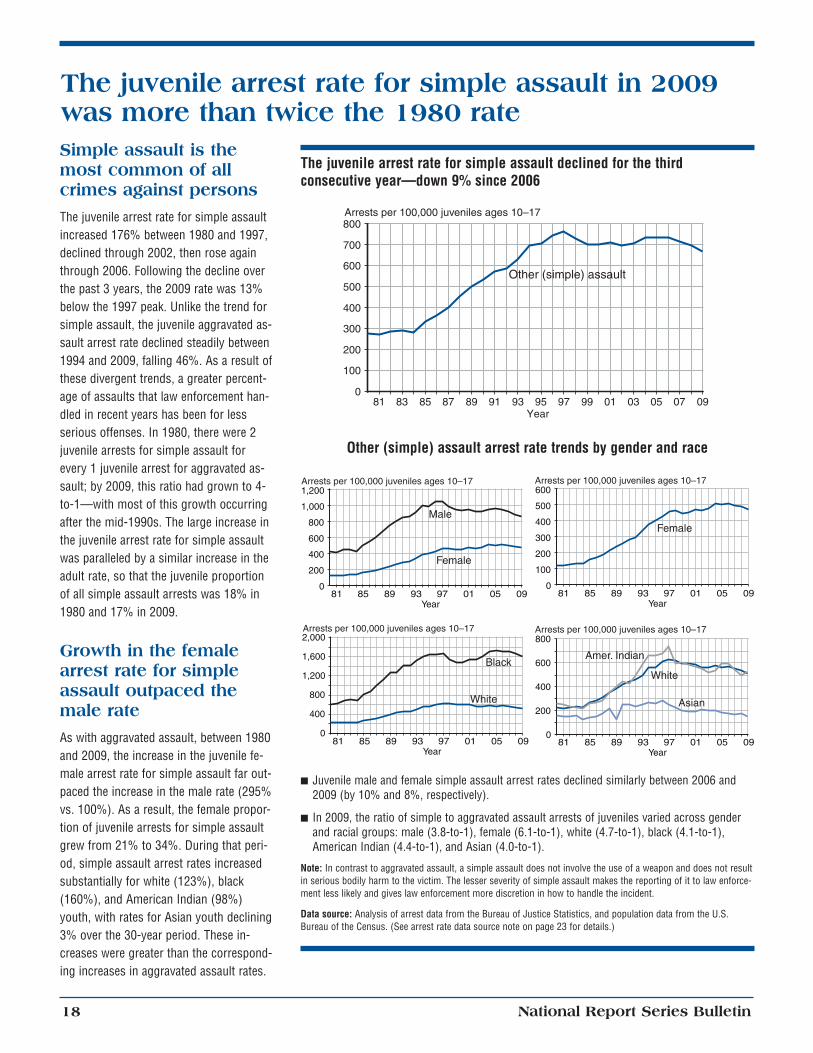
The juvenile arrest rate for simple assault in 2009 was more than twice the 1980 rate Simple assault is the most common of all crimes against persons
The juvenile arrest rate for simple assault increased 176% between 1980 and 1997, declined through 2002, then rose again through 2006. Following the decline over the past 3 years, the 2009 rate was 13% below the 1997 peak. Unlike the trend for simple assault, the juvenile aggravated assault arrest rate declined steadily between 1994 and 2009, falling 46%. As a result of these divergent trends, a greater percentage of assaults that law enforcement handled in recent years has been for less serious offenses. In 1980, there were 2 juvenile arrests for simple assault for every 1 juvenile arrest for aggravated assault; by 2009, this ratio had grown to 4to-1—with most of this growth occurring after the mid-1990s. The large increase in the juvenile arrest rate for simple assault was paralleled by a similar increase in the adult rate, so that the juvenile proportion of all simple assault arrests was 18% in 1980 and 17% in 2009.
Growth in the female arrest rate for simple assault outpaced the male rate
As with aggravated assault, between 1980 and 2009, the increase in the juvenile female arrest rate for simple assault far outpaced the increase in the male rate (295% vs. 100%). As a result, the female proportion of juvenile arrests for simple assault grew from 21% to 34%. During that period, simple assault arrest rates increased substantially for white (123%), black (160%), and American Indian (98%) youth, with rates for Asian youth declining 3% over the 30-year period. These increases were greater than the corresponding increases in aggravated assault rates.
The juvenile arrest rate for simple assault declined for the third consecutive year—down 9% since 2006
Arrests per 100,000 juveniles ages 10–17 800
700
600
500
400
300
200
100
0 81 83 85 87 89 91 93 95 97 99 01 03 05 07 09
Year
Other (simple) assault
Other (simple) assault arrest rate trends by gender and race
Arrests per 100,000 juveniles ages 10–17 Arrests per 100,000 juveniles ages 10–17
Male
Female
600
1,000
1,200
800
500
600
400
400
300
200
200
100
0 0
Female
81 85 89 93 97 01 05 09 81 85 89 93 97 01 05 09 Year Year
Arrests per 100,000 juveniles ages 10–17 Arrests per 100,000 juveniles ages 10–17 2,000
Black
White
1,600
800
1,200
800
600
400
200400
0 0
Amer. Indian
White
Asian
81 85 89 93 97 01 05 09 81 85 89 93 97 01 05 09 Year Year
Q Juvenile male and female simple assault arrest rates declined similarly between 2006 and 2009 (by 10% and 8%, respectively).
Q In 2009, the ratio of simple to aggravated assault arrests of juveniles varied across gender and racial groups: male (3.8-to-1), female (6.1-to-1), white (4.7-to-1), black (4.1-to-1), American Indian (4.4-to-1), and Asian (4.0-to-1).
Note: In contrast to aggravated assault, a simple assault does not involve the use of a weapon and does not result in serious bodily harm to the victim. The lesser severity of simple assault makes the reporting of it to law enforcement less likely and gives law enforcement more discretion in how to handle the incident.
Data source: Analysis of arrest data from the Bureau of Justice Statistics, and population data from the U.S. Bureau of the Census. (See arrest rate data source note on page 23 for details.)
National Report Series Bulletin 18
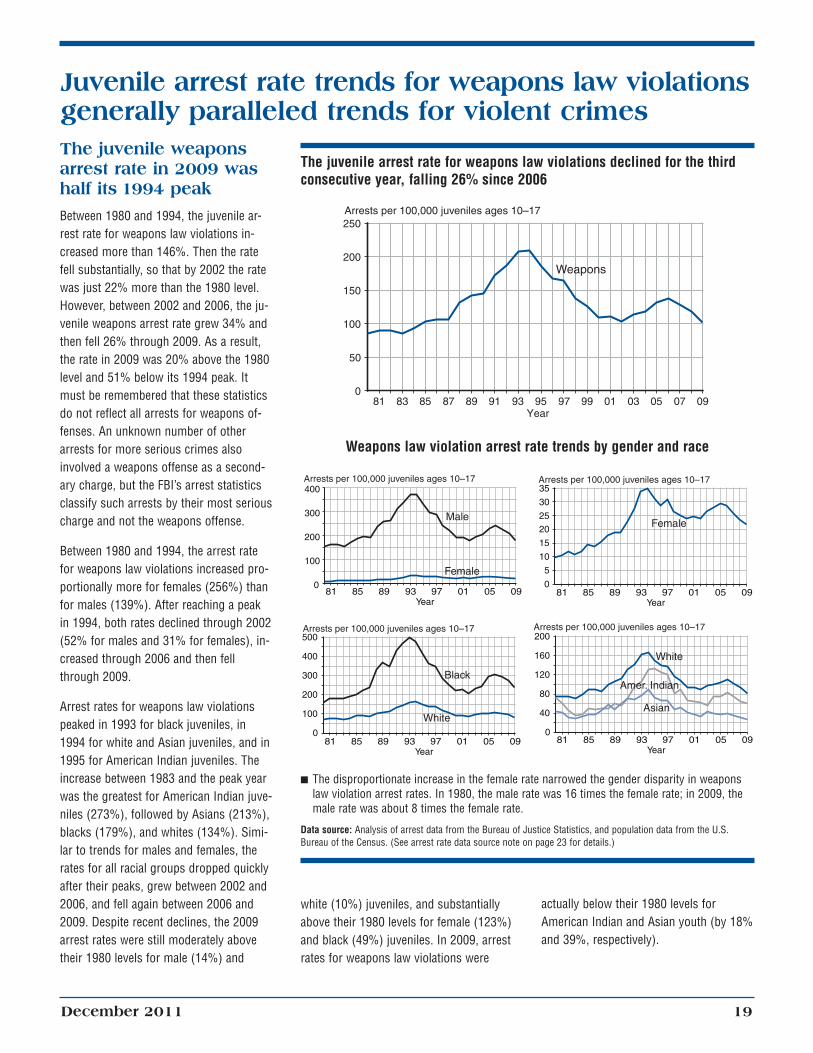
Juvenile arrest rate trends for weapons law violations generally paralleled trends for violent crimes The juvenile weapons arrest rate in 2009 was half its 1994 peak
Between 1980 and 1994, the juvenile arrest rate for weapons law violations increased more than 146%. Then the rate fell substantially, so that by 2002 the rate was just 22% more than the 1980 level. However, between 2002 and 2006, the juvenile weapons arrest rate grew 34% and then fell 26% through 2009. As a result, the rate in 2009 was 20% above the 1980 level and 51% below its 1994 peak. It must be remembered that these statistics do not reflect all arrests for weapons offenses. An unknown number of other arrests for more serious crimes also involved a weapons offense as a secondary charge, but the FBI’s arrest statistics classify such arrests by their most serious charge and not the weapons offense.
Between 1980 and 1994, the arrest rate for weapons law violations increased proportionally more for females (256%) than for males (139%). After reaching a peak in 1994, both rates declined through 2002 (52% for males and 31% for females), increased through 2006 and then fell through 2009.
Arrest rates for weapons law violations peaked in 1993 for black juveniles, in 1994 for white and Asian juveniles, and in 1995 for American Indian juveniles. The increase between 1983 and the peak year was the greatest for American Indian juveniles (273%), followed by Asians (213%), blacks (179%), and whites (134%). Similar to trends for males and females, the rates for all racial groups dropped quickly after their peaks, grew between 2002 and 2006, and fell again between 2006 and 2009. Despite recent declines, the 2009 arrest rates were still moderately above their 1980 levels for male (14%) and
The juvenile arrest rate for weapons law violations declined for the third consecutive year, falling 26% since 2006
150
100
50
0
Arrests per 100,000 juveniles ages 10–17 250
200
81 83 85 87 89 91 93 95 97 99 01 03 05 07 09 Year
Weapons
Weapons law violation arrest rate trends by gender and race
Arrests per 100,000 juveniles ages 10–17 Arrests per 100,000 juveniles ages 10–17
Male
Female
300
35
30 400
25
200 20
15
10100 5
00
Female
81 85 89 93 97 01 05 09 81 85 89 93 97 01 05 09 Year Year
Arrests per 100,000 juveniles ages 10–17 Arrests per 100,000 juveniles ages 10–17
Black
White
200500
160400
120300
80200
40100
0 81 85 89 93 97 01 05 09 81 85 89 93 97 01 05 09
Year Year
0
White
Amer. Indian
Asian
Q The disproportionate increase in the female rate narrowed the gender disparity in weapons law violation arrest rates. In 1980, the male rate was 16 times the female rate; in 2009, the male rate was about 8 times the female rate.
Data source: Analysis of arrest data from the Bureau of Justice Statistics, and population data from the U.S. Bureau of the Census. (See arrest rate data source note on page 23 for details.)
white (10%) juveniles, and substantially actually below their 1980 levels for above their 1980 levels for female (123%) American Indian and Asian youth (by 18% and black (49%) juveniles. In 2009, arrest and 39%, respectively). rates for weapons law violations were
December 2011 19
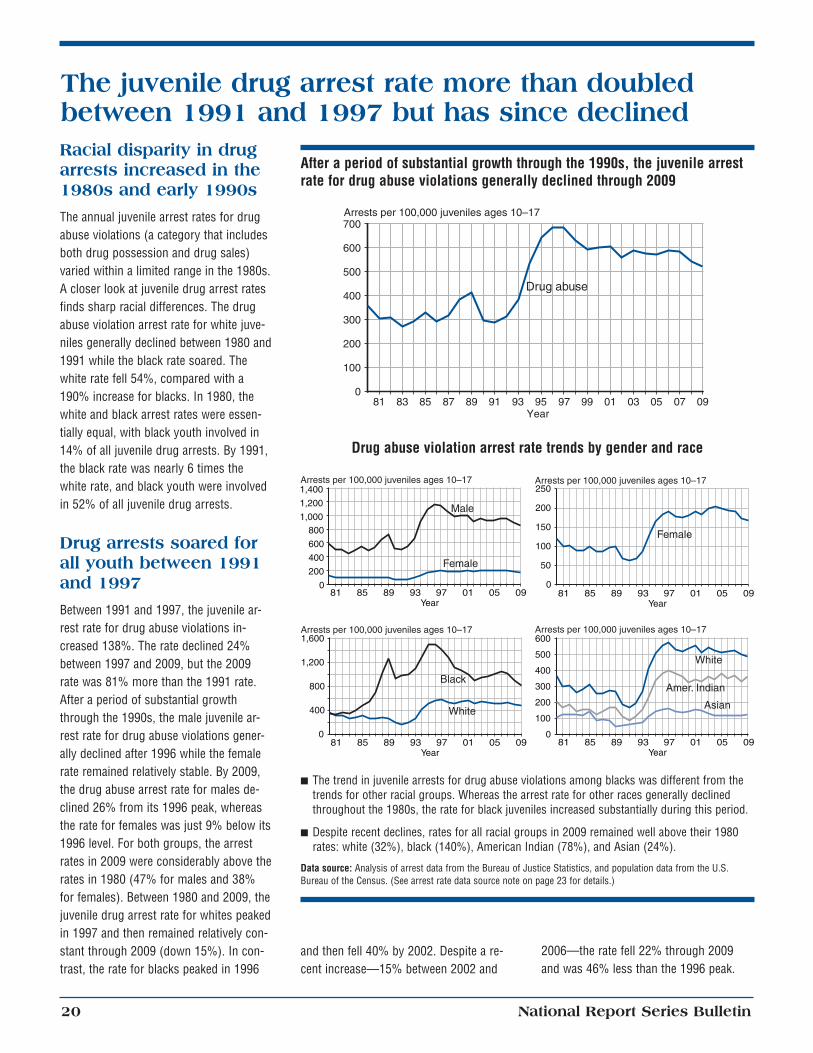
The juvenile drug arrest rate more than doubled between 1991 and 1997 but has since declined Racial disparity in drug arrests increased in the 1980s and early 1990s
The annual juvenile arrest rates for drug abuse violations (a category that includes both drug possession and drug sales) varied within a limited range in the 1980s. A closer look at juvenile drug arrest rates finds sharp racial differences. The drug abuse violation arrest rate for white juveniles generally declined between 1980 and 1991 while the black rate soared. The white rate fell 54%, compared with a 190% increase for blacks. In 1980, the white and black arrest rates were essentially equal, with black youth involved in 14% of all juvenile drug arrests. By 1991, the black rate was nearly 6 times the white rate, and black youth were involved in 52% of all juvenile drug arrests.
Drug arrests soared for all youth between 1991 and 1997
Between 1991 and 1997, the juvenile arrest rate for drug abuse violations increased 138%. The rate declined 24% between 1997 and 2009, but the 2009 rate was 81% more than the 1991 rate. After a period of substantial growth through the 1990s, the male juvenile arrest rate for drug abuse violations generally declined after 1996 while the female rate remained relatively stable. By 2009, the drug abuse arrest rate for males declined 26% from its 1996 peak, whereas the rate for females was just 9% below its 1996 level. For both groups, the arrest rates in 2009 were considerably above the rates in 1980 (47% for males and 38% for females). Between 1980 and 2009, the juvenile drug arrest rate for whites peaked in 1997 and then remained relatively constant through 2009 (down 15%). In contrast, the rate for blacks peaked in 1996
After a period of substantial growth through the 1990s, the juvenile arrest rate for drug abuse violations generally declined through 2009
Arrests per 100,000 juveniles ages 10–17 700
600
500
400
300
200
100
0 81 83 85 87 89 91 93 95 97 99 01 03 05 07 09
Year
Drug abuse violation arrest rate trends by gender and race
Arrests per 100,000 juveniles ages 10–17 Arrests per 100,000 juveniles ages 10–17
Male
Female
2501,400
1,200
1,000 200
150800
600
400 100
50200
0 0 81 85 89 93 97 01 05 09 81 85 89 93 97 01 05 09
Year Year
Female
Arrests per 100,000 juveniles ages 10–17 Arrests per 100,000 juveniles ages 10–17 1,600 600
500 1,200
400
800 300
400 200
100
0 0 81 85 89 93 97 01 05 09 81 85 89 93 97 01 05 09
Amer.
White
Indian
Asian
Year Year
Q The trend in juvenile arrests for drug abuse violations among blacks was different from the trends for other racial groups. Whereas the arrest rate for other races generally declined throughout the 1980s, the rate for black juveniles increased substantially during this period.
Q Despite recent declines, rates for all racial groups in 2009 remained well above their 1980 rates: white (32%), black (140%), American Indian (78%), and Asian (24%).
Data source: Analysis of arrest data from the Bureau of Justice Statistics, and population data from the U.S. Bureau of the Census. (See arrest rate data source note on page 23 for details.)
Drug abuse
Black
White
and then fell 40% by 2002. Despite a re- 2006—the rate fell 22% through 2009 cent increase—15% between 2002 and and was 46% less than the 1996 peak.
National Report Series Bulletin 20
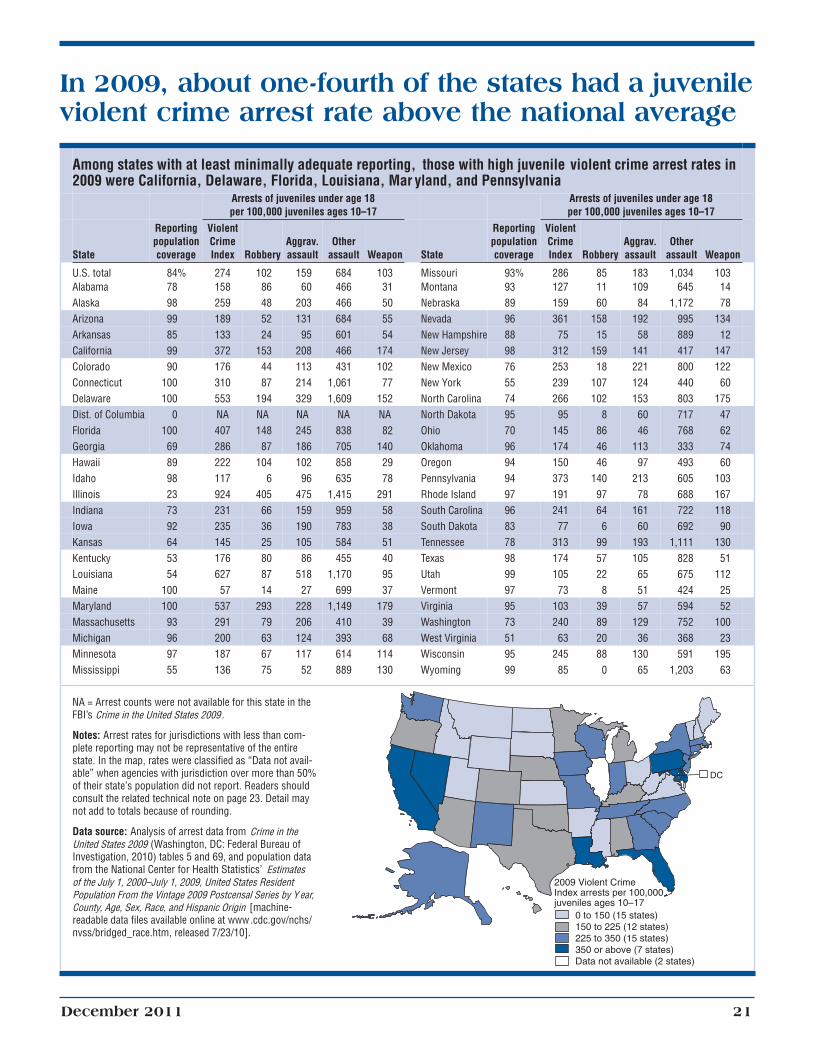
In 2009, about one-fourth of the states had a juvenile violent crime arrest rate above the national average
Among states with at least minimally adequate reporting, 2009 were California, Delaware, Florida, Louisiana, Mar yland,
Arrests of juveniles under age 18 per 100,000 juveniles ages 10–17
those with high juvenile and Pennsylvania
Reporting population
State coverage
violent crime arrest rates in
Arrests of juveniles under age 18 per 100,000 juveniles ages 10–17
Reporting Violent population Crime Aggrav. Other
State coverage Index Robbery assault assault Weapon
Violent Crime Aggrav. Other Index Robbery assault assault Weapon
U.S. total 84% 274 102 159 Alabama 78 158 86 60 Alaska 98 259 48 203
684 466 466
103 31 50
Missouri Montana Nebraska
93% 93 89
286 85 183 1,034 127 11 109 645 159 60 84 1,172
103 14 78
Arizona 99 189 52 131 684 55 Nevada 96 361 158 192 995 134Arkansas 85 133 24 95 601 54 New Hampshire 88 75 15 58 889 12California 99 372 153 208 466 174 New Jersey 98 312 159 141 417 147Colorado 90 176 44 113 431 102 New Mexico 76 253 18 221 800 122Connecticut 100 310 87 214 1,061 77 New York 55 239 107 124 440 60Delaware 100 553 194 329 1,609 152 North Carolina 74 266 102 153 803 175Dist. of Columbia 0 NA NA NA NA NA North Dakota 95 95 8 60 717 47Florida 100 407 148 245 838 82 Ohio 70 145 86 46 768 62Georgia 69 286 87 186 705 140 Oklahoma 96 174 46 113 333 74Hawaii 89 222 104 102 858 29 Oregon 94 150 46 97 493 60Idaho 98 117 6 96 635 78 Pennsylvania 94 373 140 213 605 103Illinois 23 924 405 475 1,415 291 Rhode Island 97 191 97 78 688 167Indiana 73 231 66 159 959 58 South Carolina 96 241 64 161 722 118Iowa 92 235 36 190 783 38 South Dakota 83 77 6 60 692 90Kansas 64 145 25 105 584 51 Tennessee 78 313 99 193 1,111 130Kentucky 53 176 80 86 455 40 Texas 98 174 57 105 828 51Louisiana 54 627 87 518 1,170 95 Utah 99 105 22 65 675 112Maine 100 57 14 27 699 37 Vermont 97 73 8 51 424 25Maryland 100 537 293 228 1,149 179 Virginia 95 103 39 57 594 52Massachusetts 93 291 79 206 410 39 Washington 73 240 89 129 752 100Michigan 96 200 63 124 393 68 West Virginia 51 63 20 36 368 23Minnesota 97 187 67 117 614 114 Wisconsin 95 245 88 130 591 195Mississippi 55 136 75 52 889 130 Wyoming 99 85 0 65 1,203 63
NA = Arrest counts were not available for this state in theFBI’s Crime in the United States 2009 .
Notes: Arrest rates for jurisdictions with less than complete reporting may not be representative of the entire state. In the map, rates were classified as “Data not available” when agencies with jurisdiction over more than 50% of their state’s population did not report. Readers should consult the related technical note on page 23. Detail may not add to totals because of rounding.
Data source: Analysis of arrest data from Crime in theUnited States 2009 (Washington, DC: Federal Bureau ofInvestigation, 2010) tables 5 and 69, and population data from the National Center for Health Statistics’ Estimates of the July 1, 2000–July 1, 2009, United States ResidentPopulation From the Vintage 2009 Postcensal Series by Y ear,County, Age, Sex, Race, and Hispanic Origin [machinereadable data files available online at www.cdc.gov/nchs/nvss/bridged_race.htm, released 7/23/10].
2009 Violent CrimeIndex arrests per 100,000juveniles ages 10–17
0 to 150 (15 states)150 to 225 (12 states)225 to 350 (15 states)350 or above (7 states)Data not available (2 states)
DC
December 2011 21
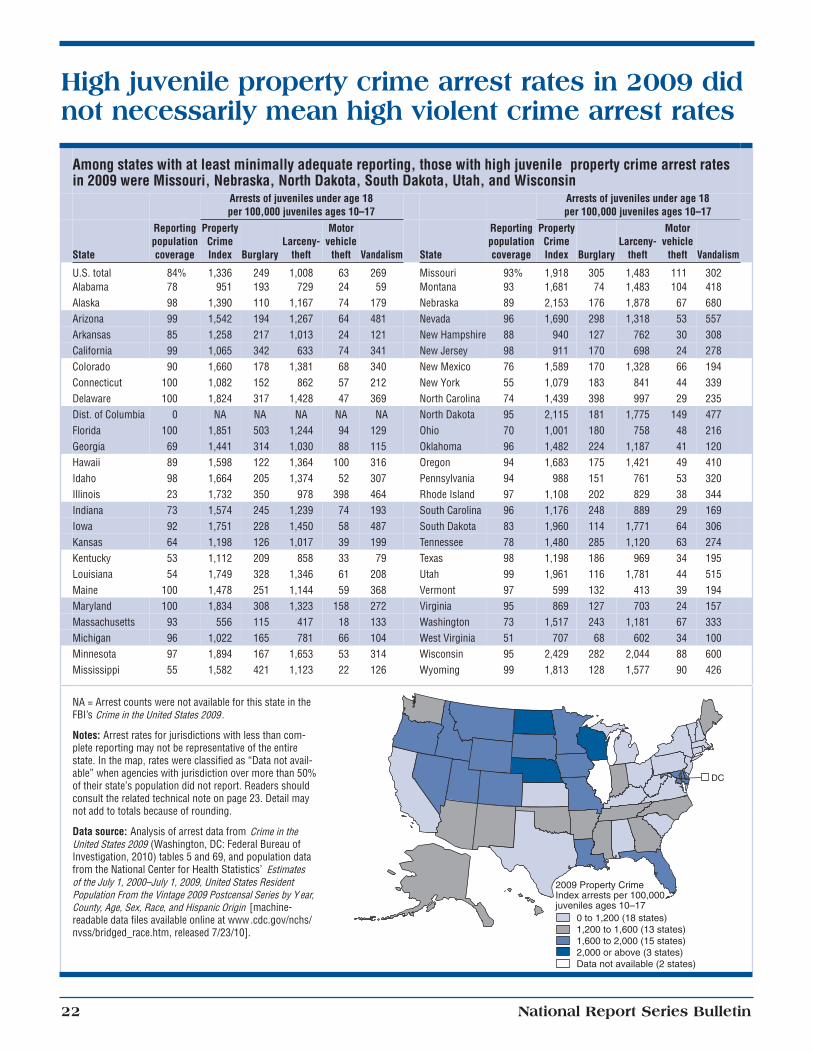
High juvenile property crime arrest rates in 2009 did not necessarily mean high violent crime arrest rates
Among states with at least minimally adequate reporting, in 2009 were Missouri, Nebraska, North Dakota, South Dakota,
Arrests of juveniles under age 18 per 100,000 juveniles ages 10–17
those with high juvenile Utah, and Wisconsin
Reporting population
State coverage
property crime arrest rates
Arrests of juveniles under age 18 per 100,000 juveniles ages 10–17
Reporting Property Motor population Crime Larceny- vehicle
State coverage Index Burglary theft theft Vandalism
Property Motor Crime Larceny- vehicle Index Burglary theft theft Vandalism
U.S. total 84% 1,336 249 1,008 Alabama 78 951 193 729 Alaska 98 1,390 110 1,167
63 24 74
269 59
179
Missouri Montana Nebraska
93% 93 89
1,918 305 1,483 111 1,681 74 1,483 104 2,153 176 1,878 67
302 418 680
Arizona 99 1,542 194 1,267 64 481 Nevada 96 1,690 298 1,318 53 557Arkansas 85 1,258 217 1,013 24 121 New Hampshire 88 940 127 762 30 308California 99 1,065 342 633 74 341 New Jersey 98 911 170 698 24 278Colorado 90 1,660 178 1,381 68 340 New Mexico 76 1,589 170 1,328 66 194Connecticut 100 1,082 152 862 57 212 New York 55 1,079 183 841 44 339Delaware 100 1,824 317 1,428 47 369 North Carolina 74 1,439 398 997 29 235Dist. of Columbia 0 NA NA NA NA NA North Dakota 95 2,115 181 1,775 149 477Florida 100 1,851 503 1,244 94 129 Ohio 70 1,001 180 758 48 216Georgia 69 1,441 314 1,030 88 115 Oklahoma 96 1,482 224 1,187 41 120Hawaii 89 1,598 122 1,364 100 316 Oregon 94 1,683 175 1,421 49 410Idaho 98 1,664 205 1,374 52 307 Pennsylvania 94 988 151 761 53 320Illinois 23 1,732 350 978 398 464 Rhode Island 97 1,108 202 829 38 344Indiana 73 1,574 245 1,239 74 193 South Carolina 96 1,176 248 889 29 169Iowa 92 1,751 228 1,450 58 487 South Dakota 83 1,960 114 1,771 64 306Kansas 64 1,198 126 1,017 39 199 Tennessee 78 1,480 285 1,120 63 274Kentucky 53 1,112 209 858 33 79 Texas 98 1,198 186 969 34 195Louisiana 54 1,749 328 1,346 61 208 Utah 99 1,961 116 1,781 44 515Maine 100 1,478 251 1,144 59 368 Vermont 97 599 132 413 39 194Maryland 100 1,834 308 1,323 158 272 Virginia 95 869 127 703 24 157Massachusetts 93 556 115 417 18 133 Washington 73 1,517 243 1,181 67 333Michigan 96 1,022 165 781 66 104 West Virginia 51 707 68 602 34 100Minnesota 97 1,894 167 1,653 53 314 Wisconsin 95 2,429 282 2,044 88 600Mississippi 55 1,582 421 1,123 22 126 Wyoming 99 1,813 128 1,577 90 426
NA = Arrest counts were not available for this state in theFBI’s Crime in the United States 2009 .
Notes: Arrest rates for jurisdictions with less than complete reporting may not be representative of the entire state. In the map, rates were classified as “Data not available” when agencies with jurisdiction over more than 50% of their state’s population did not report. Readers should consult the related technical note on page 23. Detail may not add to totals because of rounding.
Data source: Analysis of arrest data from Crime in theUnited States 2009 (Washington, DC: Federal Bureau ofInvestigation, 2010) tables 5 and 69, and population data from the National Center for Health Statistics’ Estimates of the July 1, 2000–July 1, 2009, United States ResidentPopulation From the Vintage 2009 Postcensal Series by Y ear,County, Age, Sex, Race, and Hispanic Origin [machinereadable data files available online at www.cdc.gov/nchs/nvss/bridged_race.htm, released 7/23/10].
2009 Property CrimeIndex arrests per 100,000juveniles ages 10–17
0 to 1,200 (18 states)1,200 to 1,600 (13 states)1,600 to 2,000 (15 states)2,000 or above (3 states)Data not available (2 states)
DC
National Report Series Bulletin 22
Notes
Technical note
Although juvenile arrest rates may largely reflect juvenile behavior, many other factors can affect the magnitude of these rates. Arrest rates are calculated by dividing the number of youth arrests made in the year by the number of youth living in the jurisdiction. Therefore, jurisdictions that arrest a relatively large number of nonresident juveniles would have a higher arrest rate than jurisdictions where resident youth behave similarly. Jurisdictions (especially small ones) that are vacation destinations or that are centers for economic activity in a region may have arrest rates that reflect the behavior of nonresident youth more than that of resident youth.
Other factors that influence arrest rates in a given area include the attitudes of citizens toward crime, the policies of local law enforcement agencies, and the policies of other components of the justice system. In many areas, not all law enforcement agencies report their arrest data to the FBI. Rates for such areas are necessarily based on partial information and may not be accurate.
Comparisons of juvenile arrest rates across jurisdictions can be informative. Because of factors noted, however, comparisons should be made with caution.
Arrest rate data source
Analysis of arrest data from Snyder, H., and Mulako-Wantota, J., Bureau of Justice Statistics, Arrest Data Analysis Tool [available online at www.bjs.gov/index. cfm?ty=datool&surl=/arrests/index.cfm,
released 9/22/11]; population data for 1980–1989 from the U.S. Census Bureau, U.S. Pop u la tion Es ti mates by Age, Sex, Race, and His pan ic Origin: 1980 to 1999 [machine-readable data files available online, re leased 4/11/00]; population data for 1990–1999 from the National Center for Health Statistics (prepared by the U.S. Census Bureau with support from the National Cancer Institute), Bridged-Race Intercensal Estimates of the July 1, 1990–July 1, 1999, United States Resident Population by County, Single-Year of Age, Sex, Race, and Hispanic Origin [machine-readable data files available online at www.cdc.gov/nchs/nvss/bridged_race. htm, released 7/26/04]; and population data for 2000–2009 from the National Center for Health Statistics (prepared under a collaborative arrangement with the U.S. Census Bureau), Estimates of the July 1, 2000–July 1, 2009, United States Resident Population From the Vintage 2009 Postcensal Series by Year, County, Age, Sex, Race, and Hispanic Origin [machine-readable data files available online at www.cdc.gov/nchs/nvss/bridged_race. htm, released 7/23/10].
Data coverage
FBI arrest data in this bulletin are counts of arrests detailed by age of arrestee and offense categories from all law enforcement agencies that reported complete data for the calendar year. (See Crime in the United States 2009 for offense definitions.) The proportion of the U.S. population covered by these reporting agencies ranged from 63% to 94% between 1980 and 2009, with 2009 coverage of 80%.
Visit OJJDP’s Statistical Briefing Book for more information on juvenile arrests
OJJDP’s online Statistical Briefing Book (SBB) offers access to a wealth of information about juvenile crime and victimization and about youth involved in the juvenile justice system. Visit the “Law Enforcement and Juvenile Crime” section of the SBB at ojjdp.gov/ojstatbb/crime/faqs.asp for more information about juvenile arrest rate trends detailed by offense, gender, and race, including a spreadsheet of all juvenile arrest rates used in this bulletin.
Estimates of the number of persons in each age group in the reporting agencies’ resident populations assume that the resident population age profiles are like the nation’s. Reporting agencies’ total populations were multiplied by the U.S. Census Bureau’s most current estimate of the proportion of the U.S. population for each age group.
The reporting coverage for the total United States (84%) in the tables on pages 21 and 22 includes all states reporting arrests of persons younger than age 18. This is greater than the coverage in the rest of the bulletin (80%) for various reasons. For example, a state may provide arrest counts of persons younger than age 18 but not provide the age detail required to support other subpopulation estimates.
December 2011 23
U.S. Department of Justice
Office of Justice Programs
Office of Juvenile Justice and Delinquency Prevention
PRESORTED STANDARD POSTAGE & FEES PAID
DOJ/OJJDP PERMIT NO. G–91
Washington, DC 20531
Official Business Penalty for Private Use $300
National Report Series Bulletin NCJ 236477
Acknowledgments
This bulletin was written by Charles Puzzanchera, Senior Research Associate, and Benjamin Adams, Research Associate, with assistance from Melissa Sickmund, Ph.D., Chief of Systems Research, at the National Center for Juvenile Justice, with funds provided by OJJDP to support the National Juvenile Justice Data Analysis Project. The authors gratefully acknowledge the assistance provided by the Bureau of Justice Statistics, specifically Howard Snyder, Ph.D., BJS Statistician.
This bulletin was prepared under cooperative agreement number 2010–MU–FX–K058 from the Office of Juvenile Justice and Delinquency Prevention (OJJDP), U.S. Department of Justice.
Points of view or opinions expressed in this document are those of the authors and do not necessarily represent the official position or policies of OJJDP or the U.S. Department of Justice.
The Office of Juvenile Justice and Delinquency Prevention is a component of the Office of Justice Pro grams, which also includes the Bu reau of Jus tice As sis tance; the Bu reau of Jus tice Sta tis tics; the National In sti tute of Justice; the Office for Victims of Crime; and the Office of Sex Offender Sentencing, Monitoring, Apprehending, Registering, and Tracking.