just-in-time and lean -...
TRANSCRIPT

Just-in-Time and Lean
I/JNU OLE
Index
Content ..................................................II
List of Figures .......................................VIII
List of Tables .........................................X
Abbreviations .......................................XI
Case Study ............................................146
Bibliography .........................................154
Self Assessment Answers .....................157
Book at a Glance
II/JNU OLE
Contents
Chapter I ...........................................................................................................1Introduction to Just in Time (JIT) .................................................................1Aim ....................................................................................................................1Objectives ..........................................................................................................1Learning outcome ............................................................................................11.1 Introduction to Just in Time (JIT) Concept ............................................2 1.1.1 History and Philosophy of Just in Time (JIT) ...............................2 1.1.2 Cultural Aspect ..............................................................................31.2 Just in Time (JIT) Approaches .................................................................4 1.2.1 Cycle Time Reduction...................................................................4 1.2.2 Waste Reduction ...........................................................................4 1.2.3 Flow Breakdowns .........................................................................61.3 Scope of Just in Time (JIT) .......................................................................6 1.3.1 JIT Application Profile ..................................................................8 1.3.2 Seven Wastes in JIT ....................................................................111.4 Elements of JIT ........................................................................................12 1.4.1 People Involvement ....................................................................12 1.4.2 Plants ...........................................................................................13 1.4.3 Systems .......................................................................................13 1.4.4 Purchasing ...................................................................................141.5 Goals of JIT ..............................................................................................141.6 Benefits and Limitations of JIT ..............................................................16 1.6.1 Benefits of JIT .............................................................................16 1.6.2 Limitations of JIT .......................................................................171.7 Implementation of JIT Concept ............................................................19 1.7.1 Keys to Successful Implementation of JIT .................................201.8 Understanding and Controlling Variation .............................................22 1.8.1 Sources of Variation ....................................................................22 1.8.2 Causes of Variation .....................................................................23 1.8.3 Variability ...................................................................................23 1.8.3.1 Forms of Variability ......................................................24 1.8.3.2 Responses to Variability ................................................24 1.8.3.3 Reducing Variability ......................................................26Summary .........................................................................................................27References .......................................................................................................28Recommended Reading .................................................................................28Self Assessment ..............................................................................................29
III/JNU OLE
Chapter II .......................................................................................................31Push and Pull Systems ...................................................................................31Aim ..................................................................................................................31Objectives ........................................................................................................31Learning outcome ..........................................................................................312.1 Introduction to Materials Requirement Planning (MRP) “Push” System .............................................................................32 2.1.1 Need for MRP .............................................................................32 2.1.2 Terms Used in Material Resource Planning (MRP) ....................332.2 Basic Material Requirement Planning Concepts ..................................342.3 Factors Affecting the Computation of MRP ..........................................352.4 Objectives of MRP System .....................................................................372.5 Prerequisites and Assumptions of MRP .................................................382.6 Inputs to MRP ..........................................................................................40 2.6.1 Master Production Schedule (MPS) ...........................................40 2.6.2 Bill of Material (BOM) ..............................................................41 2.6.3 Inventory Record File .................................................................412.7 MRP Outputs ............................................................................................43 2.7.1 Primary Outputs ..........................................................................44 2.7.2 Secondary Outputs ......................................................................44 2.7.3 Inventory Forecast ......................................................................442.8 MRP Logic in Brief ..................................................................................45 2.8.1 Advantages and Disadvantages of MRP .....................................462.9 Explaining Push and Pull Models ...........................................................46 2.9.1 Understanding Push Model .........................................................47 2.9.1.1 Advantages of “Push” Model .......................................48 2.9.1.2 Disadvantages of “Push” Model ...................................48 2.9.2 Understanding the Pull Model ....................................................49 2.9.2.1 Advantages of “Pull” Model .........................................49 2.9.2.2 Disadvantages of “Pull” Model .....................................502.10 Evaluation of MRP Push versus JIT Pull ............................................51 2.10.1 Combining MRP and JIT ..........................................................52Summary .........................................................................................................53References .......................................................................................................54Recommended Reading .................................................................................54Self Assessment ..............................................................................................55
IV/JNU OLE
Chapter III ......................................................................................................57Just-In-Time (JIT) and Competitive Advantage .........................................57Aim ..................................................................................................................57Objectives ........................................................................................................57Learning outcome ..........................................................................................573.1 Relationship between JIT and Competitive Advantage .......................58 3.1.1 JIT Contribution to Competitive Advantage ...............................583.2 Main Advantage of Material Requirement Planning (MRP) and Just-In-Time (JIT) ...............................................................613.3 MRP and JIT Comparison ......................................................................613.4 Advantages and disadvantages of JIT and MRP ..................................62 3.4.1 Advantages of JIT .......................................................................62 3.4.2 Disadvantages of JIT ...................................................................63 3.4.3 Limitations and Advantages of MRP ..........................................643.5 Limitations and Implementation Barriers of JIT .................................64Summary .........................................................................................................67References .......................................................................................................68Recommended Reading .................................................................................68Self Assessment ...............................................................................................69
V/JNU OLE
Chapter IV ......................................................................................................71JIT Layout ......................................................................................................71Aim ..................................................................................................................71Objectives ........................................................................................................71Learning outcome ..........................................................................................714.1 Plant Layout .............................................................................................72 4.1.1 Objectives of Plant Layout ..........................................................72 4.1.2 Principles of Plant Layout ...........................................................734.2 Classification of Layout ...........................................................................74 4.2.1 Process Layout ............................................................................74 4.2.2 Product Layout ............................................................................76 4.2.3 Combination Layout ...................................................................78 4.2.4 Fixed Position Layout .................................................................78 4.2.5 Group Layout ( Cellular Layout) ................................................794.3 Service Layout ..........................................................................................814.4 JIT Layout ................................................................................................82 4.4.1 Distance Reduction .....................................................................84 4.4.2 Increased Flexibility ....................................................................84 4.4.3 Impact on Employees ..................................................................84 4.4.4 Reduced Space and Inventory .....................................................854.5 JIT Layouts and Design Flows ................................................................854.6 JIT Applications for Line Flow ...............................................................864.7 JIT Applications for JIT Shops ...............................................................86Summary .........................................................................................................88References .......................................................................................................89Recommended Reading .................................................................................89Self Assessment ..............................................................................................90
VI/JNU OLE
Chapter V ........................................................................................................92SMED and Kanban ........................................................................................92Aim ..................................................................................................................92Objectives ........................................................................................................92Learning outcome ..........................................................................................925.1 Introduction to Single Minute of Die (SMED) ......................................93 5.1.1 History of SMED ........................................................................935.2 Implementation of SMED .......................................................................94 5.2.1 Formal Method of SMED ...........................................................965.3 Introduction to Kanban ...........................................................................96 5.3.1 A Brief History of Kanban ..........................................................97 5.3.2 Reasons for Implementing Kanban Scheduling ..........................97 5.3.3 Kanban Implementation Process ...............................................100 5.3.4 Keys to successful Implementation of Kanban .........................102 5.3.5 Forming Kanban Team ..............................................................1025.4 Conduct Data Collection .......................................................................104 5.4.1 Gather Data ...............................................................................104 5.4.2 Analyse the Data .......................................................................1055.5 Size the Kanban......................................................................................105 5.5.1 Determining the Replenishment Cycle .....................................106 5.5.2 Implications of Scrap, Unplanned Downtime and Changeover Times on Replenishment Intervals .......................106 5.5.3 Calculating the Buffer ..............................................................106 5.5.4 Calculating the Number of Kanban Containers ........................107 5.5.5 Perform a Reality Check ...........................................................1075.6 Developing a Kanban Design ................................................................1075.7 Training for Kanban ..............................................................................109 5.7.1 Developing the Training Material .............................................110 5.7.2 Serving as a Coach and Mentor ................................................110 5.7.3 Initial Start-up and Common Pitfalls ........................................1105.8 Auditing the Kanban..............................................................................1125.9 Improving the Kanban ..........................................................................112Summary .......................................................................................................115References .....................................................................................................116Recommended Reading ...............................................................................116Self Assessment .............................................................................................117
VII/JNU OLE
Chapter VI ....................................................................................................119Lean Systems ................................................................................................119Aim ................................................................................................................119Objectives ......................................................................................................119Learning outcome ........................................................................................1196.1 Introduction to Lean Manufacturing ...................................................120 6.1.1 Objectives of Lean Manufacturing ...........................................120 6.1.2 Key Principles of Lean Manufacturing .....................................122 6.1.3 Elements of Lean ......................................................................123 6.1.4 Characteristics of Successful Lean Manufacturing ...................123 6.1.5 Advantages and Disadvantages of Lean Manufacturing ...........124 6.1.6 Lawson Lean Manufacturing Solutions ....................................125 6.1.7 Nine Myths about Lean .............................................................1276.2 History of Lean Systems ........................................................................128 6.2.1 Lean Manufacturing Tools and Techniques ..............................131 6.2.2 Cellular Manufacturing .............................................................137 6.2.3 Continuous Improvement .........................................................137 6.2.4 Just-In-Time ..............................................................................138 6.2.5 Production Smoothing ..............................................................139 6.2.6 Standardisation of Work ............................................................139 6.2.7 Total Productive Maintenance ..................................................139 6.2.8 Other Waste Reduction Techniques ..........................................1406.3 Implementing Lean ................................................................................141Summary .......................................................................................................142References .....................................................................................................143Recommended Reading ...............................................................................143Self Assessment .............................................................................................144
VIII/JNU OLE
List of Figures
Fig. 1.1 JIT concept............................................................................................2Fig. 1.2 Approaches of JIT ................................................................................4Fig. 1.3 Seven root causes of waste ...................................................................5Fig. 1.4 Waste reduction ....................................................................................6Fig. 1.5 Scope of JIT ..........................................................................................7Fig. 1.6 JIT and choice of process .....................................................................9Fig. 1.7 Order to delivery cycle .......................................................................10Fig. 1.8 Seven wastes .......................................................................................11Fig. 1.9 Parts of MRP .......................................................................................14Fig. 1.10 Manufacturing objectives for JIT .....................................................15Fig. 1.11 Algorithm for JIT implementation ....................................................19Fig. 1.12 Sources of variation ..........................................................................22Fig. 1.14 Categories of opportunities ...............................................................25Fig. 2.1 Types of inventory systems ................................................................32Fig. 2.2 Concepts of material requirement planning ........................................34Fig. 2.3 Product structure for a truck ...............................................................36Fig. 2.4 MRP system ........................................................................................40Fig. 2.5 Segments of file ..................................................................................42Fig. 2.6 Inventory record file ...........................................................................42Fig. 2.7 Item master data segment ...................................................................43Fig. 2.8 Parts of output of MRP system ...........................................................44Fig. 2.9 Two predominant systems in supply chain operations .......................46Fig. 2.10 Operational flow ...............................................................................47Fig. 2.11 Pull model .........................................................................................49Fig. 2.12 Complexity as a determinant of an appropriate planning and control system ...................................................................................51Fig. 2.13 Combined MRP and JIT approach to production .............................52Fig. 3.1 Effects of JIT on layout. JIT layout with GT ......................................59Fig. 4.1 Principles of plant layout ....................................................................73Fig. 4.2 Classification of layout .......................................................................74Fig. 4.3 Process layout .....................................................................................75Fig. 4.4 Product layout .....................................................................................76Fig. 4.5 Combination layout for making different types and sizes of gears ....78Fig. 4.6 Fixed position layout ..........................................................................79Fig. 4.7 Group layout or Cellular layout ..........................................................80Fig. 4.8 Service layout for car servicing ..........................................................81Fig. 4.9 Layout for hospitality service .............................................................82Fig. 4.10 Three operators in U-line .................................................................83Fig. 4.11 Three operators in U-tine arrangement for 360 degree mobility .....84Fig. 4.12 Relationship between lot site and set-up coat ...................................86Fig. 5.1 Eight techniques of implementing SMED ..........................................95
Just-in-Time and Lean
IX/JNU OLE
Fig. 5.2 Stages for SMED improvement ..........................................................95Fig. 5.3 Seven steps in implementing Kanban ...............................................100Fig. 5.4 Steps in team formation ....................................................................103Fig. 5.5 The data collection process ...............................................................104Fig. 5.6 Designing the Kanban ......................................................................108Fig. 5.7 Expanded kanban process flow ........................................................109Fig. 6.1 Key principles of lean manufacturing ..............................................122Fig. 6.2 Five elements that enable a lean approach .......................................123Fig. 6.3 Main solutions and components delivered by Lawson ....................125
X/JNU OLE
List of Tables
Table 1.1 Causes of breakdowns ........................................................................6Table 1.2 Differences between the flexible and rigid system ..........................17Table 2.1 Prerequisites and assumptions of MRP ............................................39Table 2.2 MRP inputs and outputs ...................................................................45Table 6.1 The components in the Lawson M3 Enterprise Application System .......................................................126Table 6.2 The myths and realities of lean ......................................................128
Just-in-Time and Lean
XI/JNU OLE
Abbreviation
BOM - Bill Of MaterialERP - Enterprise Resource PlanningFIFO - First-In-First-OutGF - Group TechnologyISF - Inventory Status FileJIT - Just-In-TimeMPS - Master Production ScheduleMRP - Material Requirement PlanningOTED - One-Touch Exchange of DieQCO - Quick ChangeoverSMED - Single Minute Exchange of DiesSPT - Shortest Processing Time FirstTPM - Total Productive ManagementTPS - Toyota Production SystemVSM - Value Stream MappingWIP - Work-In-Progress

1/JNU OLE
Chapter I
Introduction to Just in Time (JIT)
Aim
The aim of this unit is to:
introduce the concept of JIT•
enlistthebeneftsandlimitationsofjust-in-time•
explain the implementation of the JIT concept•
Objectives
The objectives of this unit are to:
describe the history and philosophy of just-in-time •
highlight the elements of JIT•
discuss the concept of variability•
explain the causes, and sources of variation•
Learning outcome
At the end of this unit, you will be able to:
understand the scope of JIT concept•
discuss the keys to successful implementation of just-in-time •
evaluate the just-in-time approaches•
identify the • seven wastes in JIT concept
2/JNU OLE
1.1 Introduction to Just in Time (JIT) Concept
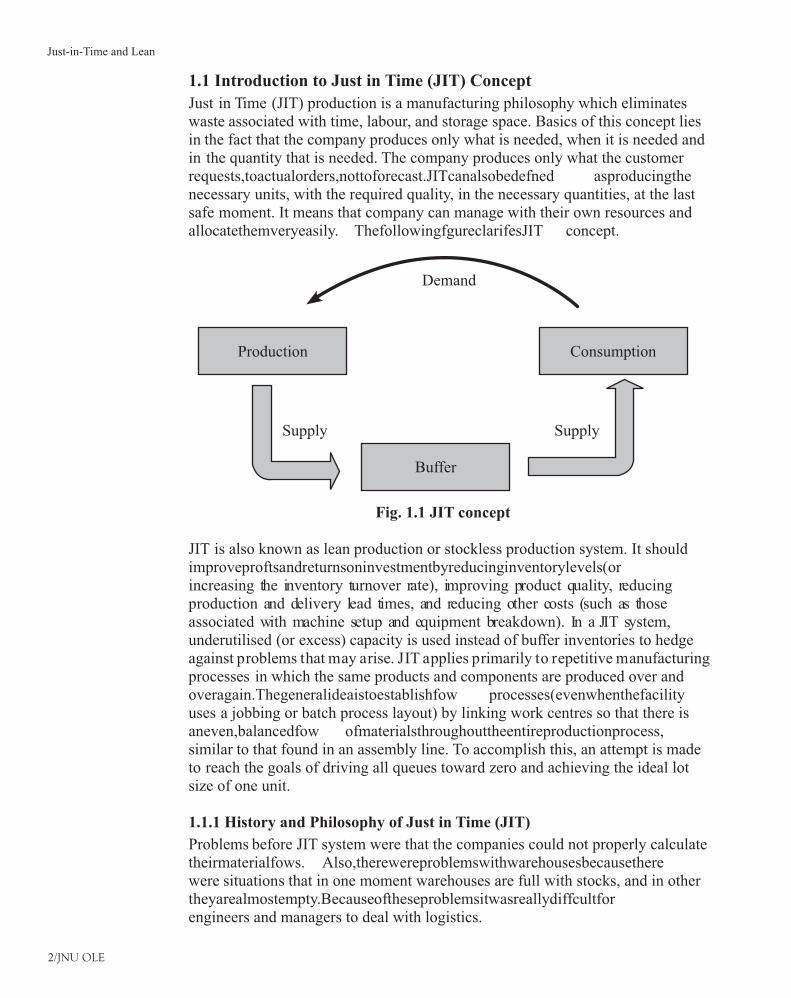
Just in Time (JIT) production is a manufacturing philosophy which eliminates waste associated with time, labour, and storage space. Basics of this concept lies in the fact that the company produces only what is needed, when it is needed and in the quantity that is needed. The company produces only what the customer requests,toactualorders,nottoforecast.JITcanalsobedefned asproducingthenecessary units, with the required quality, in the necessary quantities, at the last safe moment. It means that company can manage with their own resources and allocatethemveryeasily. ThefollowingfgureclarifesJIT concept.
Demand
Production Consumption
Buffer
Supply Supply
Fig. 1.1 JIT concept
JIT is also known as lean production or stockless production system. It should improveproftsandreturnsoninvestmentbyreducinginventorylevels(orincreasing the inventory turnover rate), improving product quality, reducing production and delivery lead times, and reducing other costs (such as those associated with machine setup and equipment breakdown). In a JIT system, underutilised (or excess) capacity is used instead of buffer inventories to hedge against problems that may arise. JIT applies primarily to repetitive manufacturing processes in which the same products and components are produced over and overagain.Thegeneralideaistoestablishfow processes(evenwhenthefacilityuses a jobbing or batch process layout) by linking work centres so that there is aneven,balancedfow ofmaterialsthroughouttheentireproductionprocess,similar to that found in an assembly line. To accomplish this, an attempt is made to reach the goals of driving all queues toward zero and achieving the ideal lot size of one unit.
1.1.1 History and Philosophy of Just in Time (JIT)
Problems before JIT system were that the companies could not properly calculate theirmaterialfows. Also,therewereproblemswithwarehousesbecausetherewere situations that in one moment warehouses are full with stocks, and in other theyarealmostempty.Becauseoftheseproblemsitwasreallydiffcultforengineers and managers to deal with logistics.
Just-in-Time and Lean
3/JNU OLE
JIT,however,isnotnew.ThetechniquewasfrstusedbytheFordMotorCompanyduring 1920s, but the technique was subsequently adopted and publicised by Toyota Motor Corporation of Japan as part of its Toyota production System (TPS). In 1954, Japanese giant Toyota implemented this concept in order to reduce wasteful overstocking in car production.
Just-in-time (JIT) inventory systems are not just a simple method that a company has to buy in to; it has a whole philosophy that the company must follow. The ideas in this philosophy come from many different disciplines including; statistics, industrial engineering, production management and behavioural science. In the JIT inventory philosophy there are views with respect to how inventory is looked upon, what it says about the management within the company, and the main principle behind JIT.
Firstly, inventory is seen as incurring costs instead of adding value, contrary •to traditional thinking. Under the philosophy, businesses are encouraged to eliminate inventory that doesn’t add value to the product.
Secondly, it sees inventory as a sign of poor management as it is simply •there to hide problems within the production system. These problems include backlogsatworkcentres,lackoffexibility foremployeesandequipment,and inadequate capacity among other things.
In short, the just-in-time inventory system is all about having “the right material, at the right time, at the right place, and in the exact amount.”
1.1.2 Cultural Aspect
Itisnecessarytoconsiderseveralfactorsthatinfuence theJapaneseculture,andthat surely accelerated the evolution of JIT. Heiko (1989) suggested different Japanese characteristics, from which the most relevant are as under:
Lack of space:• In Japan, generally there is not much room for most activities, naturally the reduction of inventories was welcomed by the management.
Commitment to consumers:• Consumer’s satisfaction has always been a priority. JIT is a pull production system which minimises the waiting time of each buyer. This time starts when the buyer places the request for new products.
Overcrowded living conditions:• Lead time shortages and maximum effciencyareaconsequenceofJapanese’srequirementstoimprovetheirliving conditions, either inside the company or within the society.
Environment cleanliness:• in addition to the former, small places force Japanese people to reduce wastes, another basic constituent of JIT.
4/JNU OLE
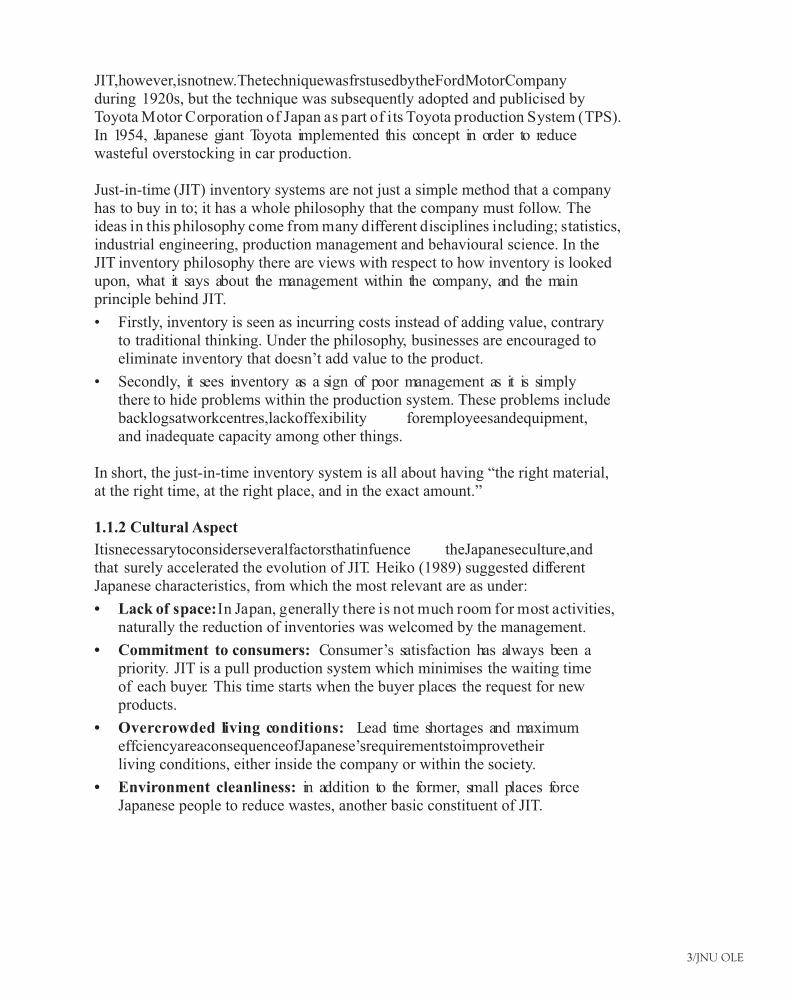
1.2 Just in Time (JIT) Approaches
ThethreepossibleapproachesofJIT areshowninthefgurebelow.
Reducing manufacturing and administrative cycle times
Reducing all waste
Reducingthepulledfowbreakdowns
Fig. 1.2 Approaches of JIT
1.2.1 Cycle Time Reduction
Thecycletimerepresentsthetimebetweenthecustomerdemandanditsfnaldelivery:
Manufacturing cycle time includes the machining, transportation, inspection •and warehousing. Classical tools are used to reduce these cycle times such as SMED, TPM, 5s and so on.
Administrative cycles are less visible since they frequently occur in the •background. They include order entries, purchase entries and follow-up, payments, credit notes and so on.
1.2.2 Waste Reduction
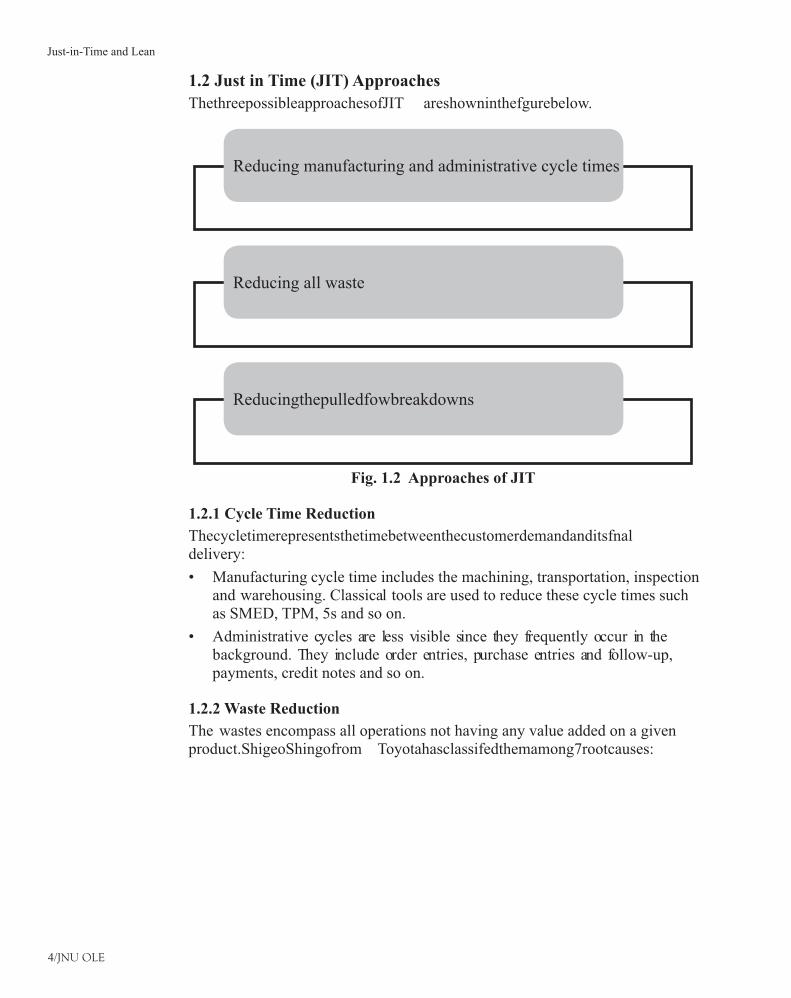
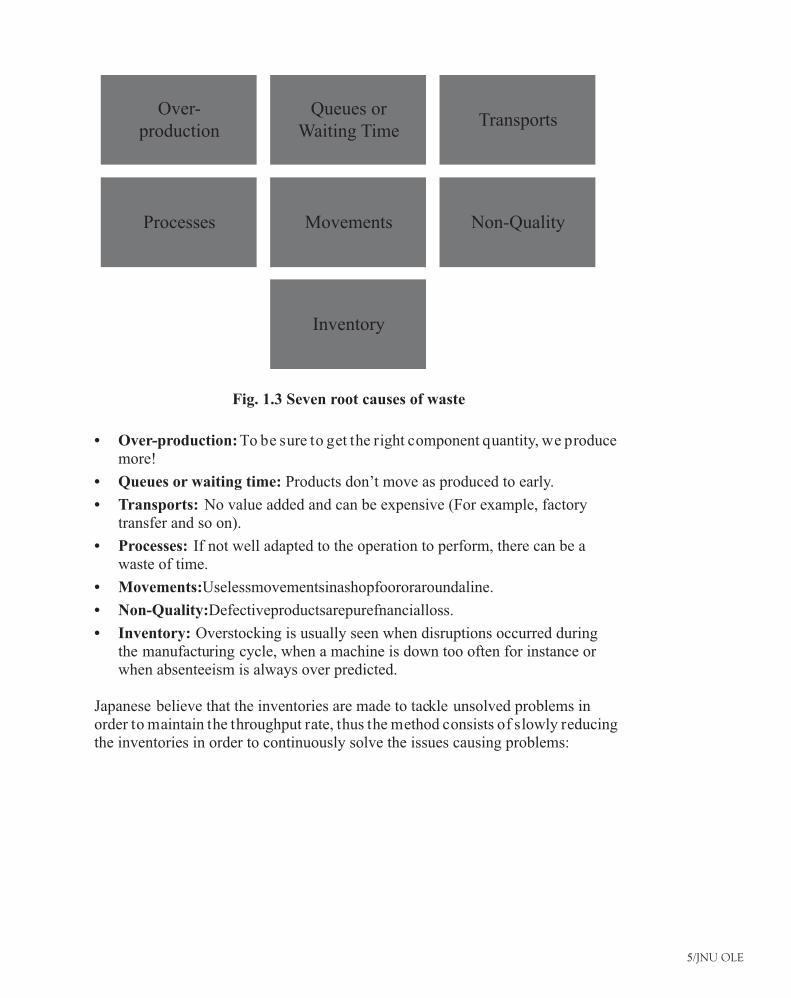
The wastes encompass all operations not having any value added on a given product.ShigeoShingofrom Toyotahasclassifedthemamong7rootcauses:
Just-in-Time and Lean
5/JNU OLE
Over-production
Processes
Queues or Waiting Time
Movements
Inventory
Transports
Non-Quality
Fig. 1.3 Seven root causes of waste
Over-production:• To be sure to get the right component quantity, we produce more!
Queues or waiting time:• Products don’t move as produced to early.
Transports:• No value added and can be expensive (For example, factory transfer and so on).
Processes:• If not well adapted to the operation to perform, there can be a waste of time.
Movements:• Uselessmovementsinashopfoororaroundaline.
Non-Quality:• Defectiveproductsarepurefnancialloss.
Inventory:• Overstocking is usually seen when disruptions occurred during the manufacturing cycle, when a machine is down too often for instance or when absenteeism is always over predicted.
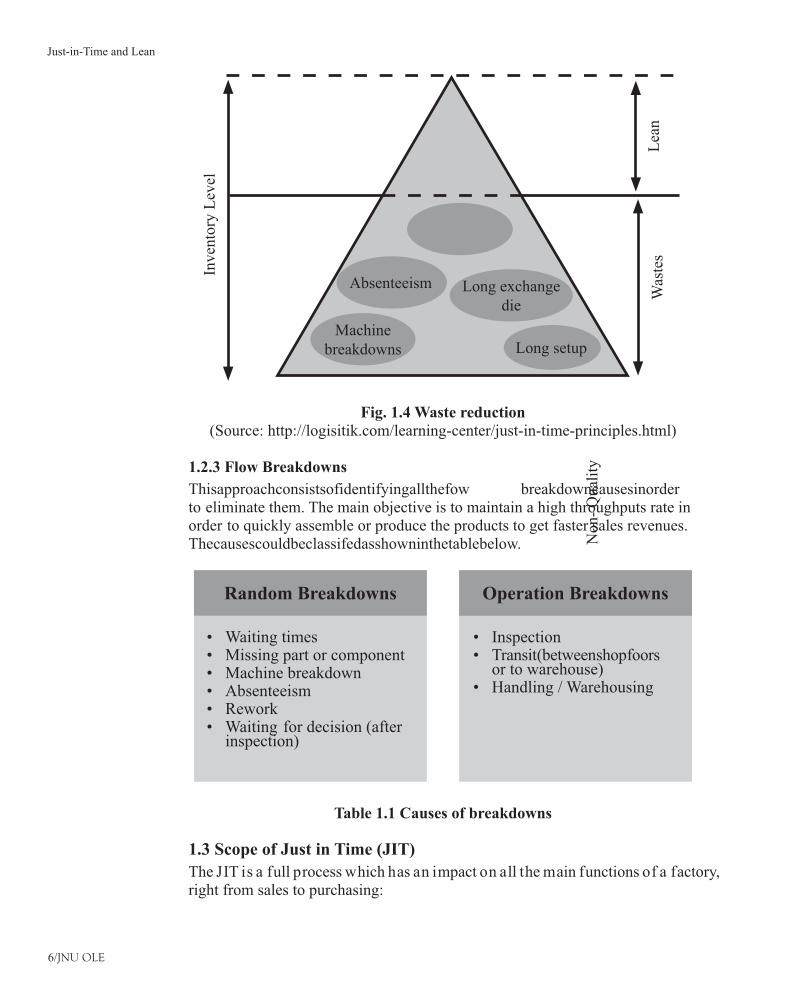
Japanese believe that the inventories are made to tackle unsolved problems in order to maintain the throughput rate, thus the method consists of slowly reducing the inventories in order to continuously solve the issues causing problems:
6/JNU OLE
Inve
ntor
y L
evel
Lea
n
Non
- Q
uali
ty
Was
tes
Absenteeism
Machine breakdowns
Long exchange die
Long setup
Fig. 1.4 Waste reduction(Source: http://logisitik.com/learning-center/just-in-time-principles.html)
1.2.3 Flow Breakdowns
Thisapproachconsistsofidentifyingallthefow breakdowncausesinorderto eliminate them. The main objective is to maintain a high throughputs rate in order to quickly assemble or produce the products to get faster sales revenues. Thecausescouldbeclassifedasshowninthetablebelow.
Random Breakdowns
Waiting times•Missing part or component•Machine breakdown•Absenteeism•Rework•Waiting for decision (after •inspection)
Inspection•Transit(betweenshopfoors•or to warehouse)Handling / Warehousing
Operation Breakdowns
•
Table 1.1 Causes of breakdowns
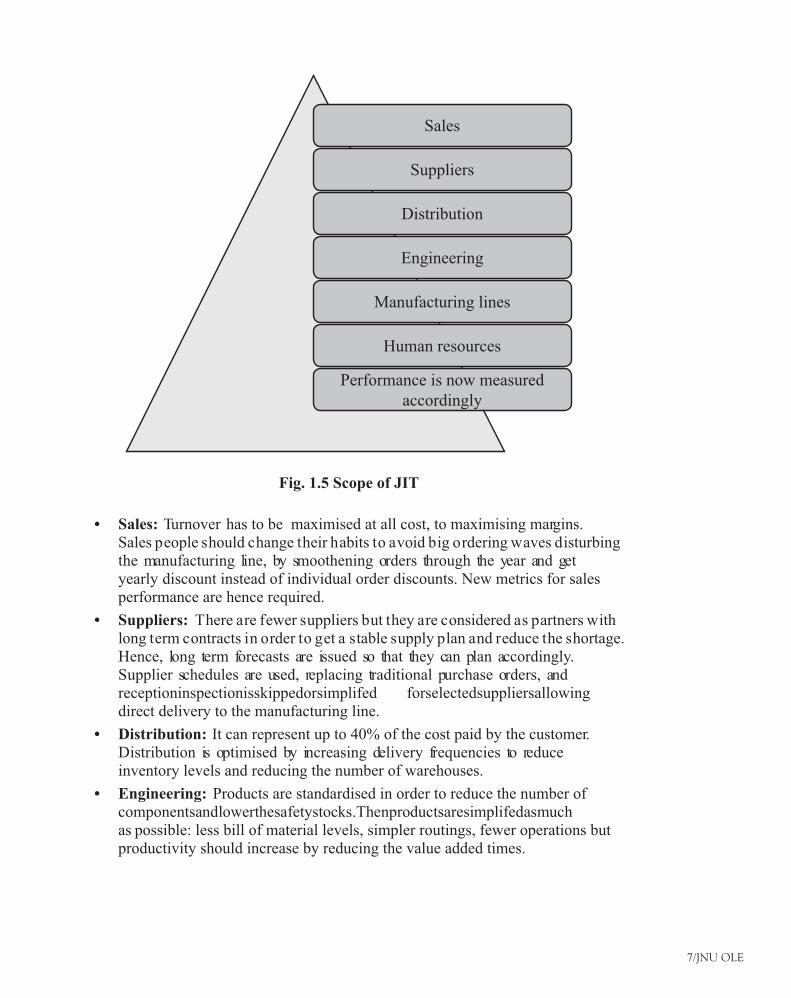
1.3 Scope of Just in Time (JIT)
The JIT is a full process which has an impact on all the main functions of a factory, right from sales to purchasing:
Just-in-Time and Lean
7/JNU OLE
Sales
Suppliers
Distribution
Engineering
Manufacturing lines
Human resources
Performance is now measured accordingly
Fig. 1.5 Scope of JIT
Sales:• Turnover has to be maximised at all cost, to maximising margins. Sales people should change their habits to avoid big ordering waves disturbing the manufacturing line, by smoothening orders through the year and get yearly discount instead of individual order discounts. New metrics for sales performance are hence required.
Suppliers:• There are fewer suppliers but they are considered as partners with long term contracts in order to get a stable supply plan and reduce the shortage. Hence, long term forecasts are issued so that they can plan accordingly. Supplier schedules are used, replacing traditional purchase orders, and receptioninspectionisskippedorsimplifed forselectedsuppliersallowingdirect delivery to the manufacturing line.
Distribution:• It can represent up to 40% of the cost paid by the customer. Distribution is optimised by increasing delivery frequencies to reduce inventory levels and reducing the number of warehouses.
Engineering:• Products are standardised in order to reduce the number of componentsandlowerthesafetystocks.Thenproductsaresimplifedasmuchas possible: less bill of material levels, simpler routings, fewer operations but productivity should increase by reducing the value added times.
8/JNU OLE
Manufacturing lines:• Machines are grouped by products family and not by their functions anymore. The raw material and components are stored on the line itself, replacing a central warehouse (and high inventory). Preventive maintenanceisdonetoreducethenumberofmachinebreakdowns,fexibilityand reduced exchange die are searched, non-quality is avoided and machining setupissimplifed.
Human resources:• The workforce is back in the middle of the production process. Continuous improvement is performed at all levels every day. The work environment is optimised, less noisy, clean, safety and more improved. Workers are taking decisions over the lines in order to improve the manufacturinglayoutandthelineeffciency.
Performance is now measured accordingly• : Team performance instead of individual, manufacturing schedule adherence per product rather than total quantity produced of all items. The JIT is rather a philosophy or a concept than a simple method. All departments are involved to change from traditional manufacturing to lean production.
1.3.1JITApplicationProfle
Just-In-Time (JIT) has assumed a kind of mystique of an oriental philosophy. Much of it is plain common sense-as more American and European companies arediscoveringtotheirbeneft. GeneralMotors,IBM,Hewlett-Packard,GeneralElectric, and Black and Decker are among the big US companies that have adopted JIT production methods. European companies are joining them; Britain’s state owned Rover Group is the latest recruit. Its car division has announced that ‘preferred suppliers’ will get long-term contracts to prove the bids which make up more than half of its production costs.
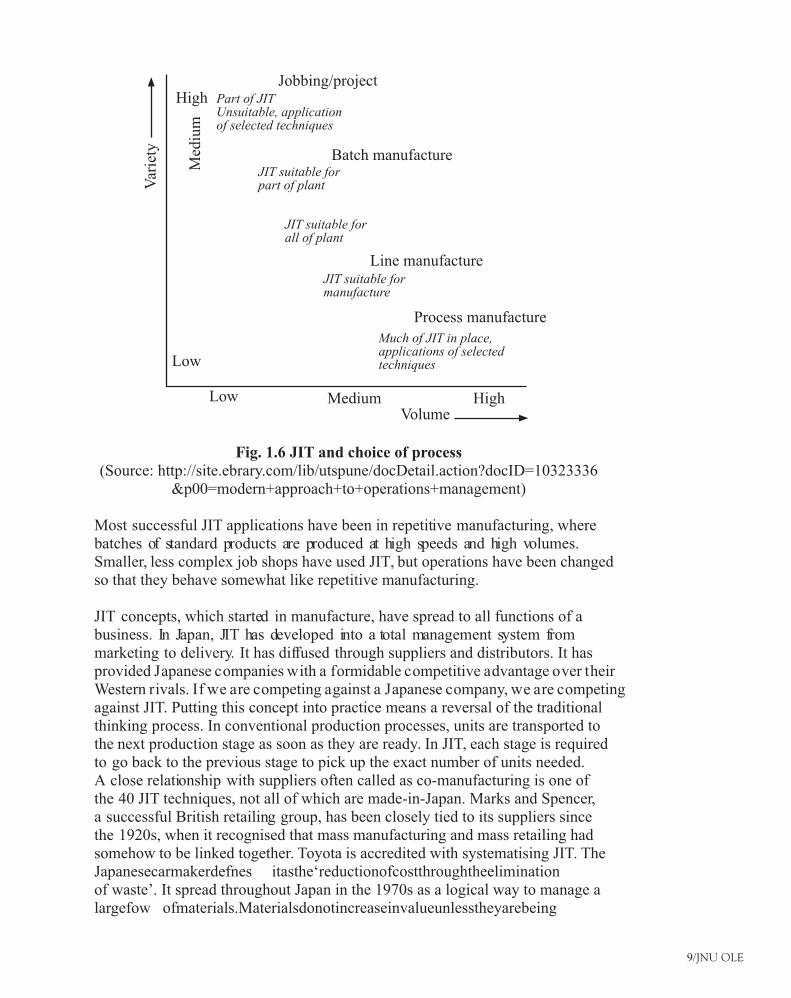
OnemisconceptionofJITisthatitislimitedtothefowline/large-batchenvironmentof the automotive industry. Once the automotive company has started along the JITroute,thereseemstobenoareawhichdoesnotbeneft fromJITprincipleslike the elimination of waste. JIT applies very well to the tool-room (job-shop) as it does to the assembly line. Techniques for eliminating waste can be applied to good effect outside manufacturing as well, such as in sales and distribution. Thefollowingfgure illustratesthesuitabilityofJITforarangeofprocesschoiceenvironments. Those at the centre of the diagram are prime candidates for JIT manufacturing. Those at the top left or bottom right will be suitable for selected applications. In the case of job-shops, such applications may include total quality, workforcefexibility,andthepromotionoffowinmanufacture.
Just-in-Time and Lean
9/JNU OLE
Jobbing/projectPart of JIT Unsuitable, application of selected techniques
JIT suitable for part of plant
JIT suitable for all of plant
JIT suitable for manufacture
Much of JIT in place, applications of selected
Batch manufacture
techniques
Line manufacture
Process manufacture
High
HighVolume
Var
iety
Med
ium
Medium
Low
Low
Fig. 1.6 JIT and choice of process(Source: http://site.ebrary.com/lib/utspune/docDetail.action?docID=10323336
&p00=modern+approach+to+operations+management)
Most successful JIT applications have been in repetitive manufacturing, where batches of standard products are produced at high speeds and high volumes. Smaller, less complex job shops have used JIT, but operations have been changed so that they behave somewhat like repetitive manufacturing.
JIT concepts, which started in manufacture, have spread to all functions of a business. In Japan, JIT has developed into a total management system from marketing to delivery. It has diffused through suppliers and distributors. It has provided Japanese companies with a formidable competitive advantage over their Western rivals. If we are competing against a Japanese company, we are competing against JIT. Putting this concept into practice means a reversal of the traditional thinking process. In conventional production processes, units are transported to the next production stage as soon as they are ready. In JIT, each stage is required to go back to the previous stage to pick up the exact number of units needed. A close relationship with suppliers often called as co-manufacturing is one of the 40 JIT techniques, not all of which are made-in-Japan. Marks and Spencer, a successful British retailing group, has been closely tied to its suppliers since the 1920s, when it recognised that mass manufacturing and mass retailing had somehow to be linked together. Toyota is accredited with systematising JIT. The Japanesecarmakerdefnes itasthe‘reductionofcostthroughtheeliminationof waste’. It spread throughout Japan in the 1970s as a logical way to manage a largefow ofmaterials.Materialsdonotincreaseinvalueunlesstheyarebeing
10/JNU OLE
processed.Soprofts areincreasedwheninventoryandsafetystocksarereducedor replaced by small, frequent deliveries. Unlike automation, JIT is not capital intensive.Thevolumeofmaterialsfowing throughafactoryisreducedbyJIT,making bottlenecks and other problems more visible.
The results of just-in-time inventory management are apparent: cost reduction, increasedspeedtomarketandidentifcationofbottlenecksintheworkfow.Effective implementation, however, requires a different way of thinking about relationships with suppliers, bringing them into a cooperative endeavour with the recognition of mutual goals. Corporate culture must promote an inquiring attitude andaninterestinfnding betterwaystodothingsthroughcommunicationandcooperation.TheFordandToyotaexamplesillustrateafnal importantpointforknowledge management: Some of the best ideas for process improvement can come from tapping the brains of those closest to the situation. Generally JIT manufacturing system is:
to have only required inventory when needed•
to improve quality to zero defects•
to reduce lead times by reducing setup times•
to incrementally revise operations themselves•
to accomplish these things at a minimum cost •
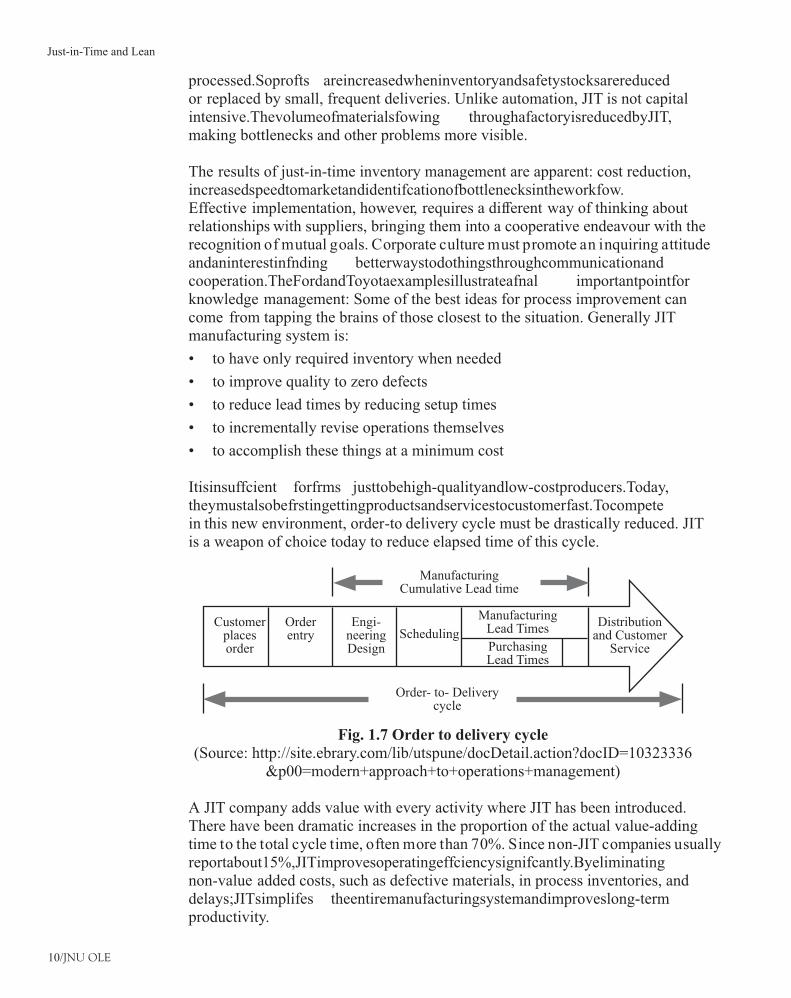
Itisinsuffcient forfrms justtobehigh-qualityandlow-costproducers.Today,theymustalsobefrstingettingproductsandservicestocustomerfast.Tocompetein this new environment, order-to delivery cycle must be drastically reduced. JIT is a weapon of choice today to reduce elapsed time of this cycle.
Manufacturing Cumulative Lead time
Customer places order
Order entry
Engi-neering Design
Scheduling
Manufacturing Lead Times
Purchasing Lead Times
Distribution and Customer
Service
Order- to- Delivery cycle
Fig. 1.7 Order to delivery cycle(Source: http://site.ebrary.com/lib/utspune/docDetail.action?docID=10323336
&p00=modern+approach+to+operations+management)
A JIT company adds value with every activity where JIT has been introduced. There have been dramatic increases in the proportion of the actual value-adding time to the total cycle time, often more than 70%. Since non-JIT companies usually reportabout15%,JITimprovesoperatingeffciencysignifcantly.Byeliminatingnon-value added costs, such as defective materials, in process inventories, and delays;JITsimplifes theentiremanufacturingsystemandimproveslong-termproductivity.
Just-in-Time and Lean
11/JNU OLE
Recently, the business strategy commonly referred to as just-in-time has become more and more dominant in many aspects of business. Many corporations have beguntousethesystemtoimproveeffciency andcustomerservice.Althoughthe system has been criticised as a lofty idea or a theory rather than an attainable businesspractice,thecompanythathaveimplementedtheideahaveproftedfrom it.
JIT has been found to be so effective that it increases productivity, work performance and product quality, while saving costs and it helps companies spotlight those areas that are falling behind and need improvement. It also slashes inventory,freesupspaceonthefactoryfoor andshineablindingspotlightonthedelivery and quality performance of parts suppliers. Therefore, the result of JIT wassmallerinventoriesofbothpartsandfnal products,billionsofdollarswerefreed up for investment purposes. This protects companies during the lean years when demand may exceed production.
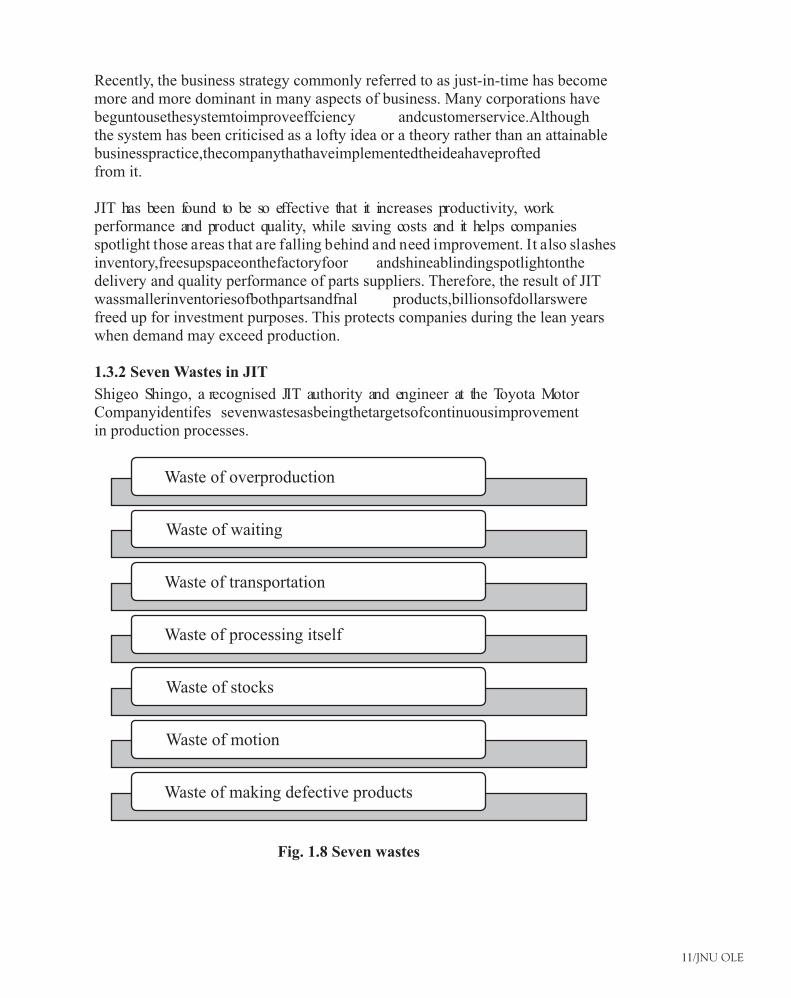
1.3.2 Seven Wastes in JIT
Shigeo Shingo, a recognised JIT authority and engineer at the Toyota Motor Companyidentifes sevenwastesasbeingthetargetsofcontinuousimprovementin production processes.
Waste of overproduction
Waste of waiting
Waste of transportation
Waste of processing itself
Waste of stocks
Waste of motion
Waste of making defective products
Fig. 1.8 Seven wastes
12/JNU OLE
Waste of overproduction:• Eliminate by reducing setup times, synchronising quantities and timing between processes, compacting layout, visibility, and so forth. Make only what is needed now.
Waste of waiting:• Eliminatethroughsynchronisingworkfow asmuchaspossible,andbalanceunevenloadsbyfexibleworkersandequipment.
Waste of transportation:• Establish layouts and locations to make transport and handling unnecessary if possible. Then rationalise transport and material handling that cannot be eliminated.
Waste of processing itself:• First question why this part or product should be made at all, then why each process is necessary. Extend thinking beyond economy of scale or speed.
Waste of stocks:• Reduce by shortening setup times and reducing lead times, by synchronisingworkfows andimprovingworkskills,andevenbysmoothingfuctuations indemandfortheproduct.Reducingalltheotherwastesreducesthe waste of stocks.
Waste of motion:• Study motion for economy and consistency. Economy improves productivity, and consistency improves quality. First improve the motions, then mechanise or automate. Otherwise there is danger of automating waste.
Waste of making defective products:• Develop the production process to prevent defects from being made so as to eliminate inspection. At each process, accept no defects and make no defects. Make process failsafe to do this. From a quality process comes a quality product automatically.
1.4 Elements of JIT
JIT manufacturing consists of several components or elements which must be integrated together to function in harmony to achieve the JIT goals. These elements include the human resources and the production, purchasing, manufacturing, planning and organising functions of an organisation.
1.4.1 People Involvement
Obtaining support and agreement from all individuals involved in the achievement of organisational goals is fundamental for JIT success. It requires involving, and informing, all groups who have interest in the company. This can greatly reduce the amount of time and effort involved in implementing JIT and can minimise the likelihood of creating implementation problems. Support and agreement should be obtained from the following groups:
Stockholders and owners of the company:• Emphasis should be placed onthelong-termrealisationofproft, andsoshort-termearningsshouldbeploughedbackintothecompanytofnancethevariouschangesandinvestmentcommitments necessary for JIT success. It should be made clear that most of thebeneftsassociatedwithJIT willonlyberealisedoverthelongrun.
Just-in-Time and Lean
13/JNU OLE
Labour organisation:• All employees and labour unions should be informed about the goals of JIT and made aware of how the new system will affect working practices. This is important in winning the union and worker’s support to assist with the implementation and to remove potential problems anddiffculties. Failuretoinvolvelabourorganisationwillresultinalackofunderstanding of management motives and causing fears of job loss on the part of the labour.
Management support:• This involves the support of management from all levels. Striving for continuous improvement is not only required of the employeesontheshopfoor,butmustalsobeinherentinmanagement’sattitude.
Government support:• Government can lend support to companies wishing toimplementJITbyextendingtaxandotherfnancial incentives.Thiscanprovide motivation for companies to become innovative as it bears some of thefnancialburdenassociatedwiththecostsofimplementingJIT.
Organisation theory suggests the hypothesis that people will be more compelled to work toward goals when they are included in the development of the goals. Onto this hypothesis JIT builds the idea of involving employees at different levels in the organisation.
1.4.2 Plants
Numerous changes take place in the layout of the “new” plant. Some changes are easy to achieve as the so called productions cells, in which the machinery is located in a way that helps reducing the time it takes to move materials from one process to another.
Nevertheless,theintroductionofKanban(Japanesenameofthecardsthatconfrmmaterial requirements), self-inspection, Material Requirement Planning (“MRP”) and MRP II (in case they were not already in use) and job enrichment within plant workers, involve structural change; thus they are far from being simple to implement.
MRP I involves a computer system for building inventory, scheduling the production and to administrate inputs. On the other side MRP II, which stands for Manufacturing Resource Planning includes the MRP I’s activities plus marketing andpurchasingoperationsandthefnancingfunction.
1.4.3 Systems
Systems within an organisation refer to the technology and processes used to link, plan and co-ordinate the activities and materials used in production. Two such systems are MRP (material requirements planning) and MRP II (manufacturing resource planning).
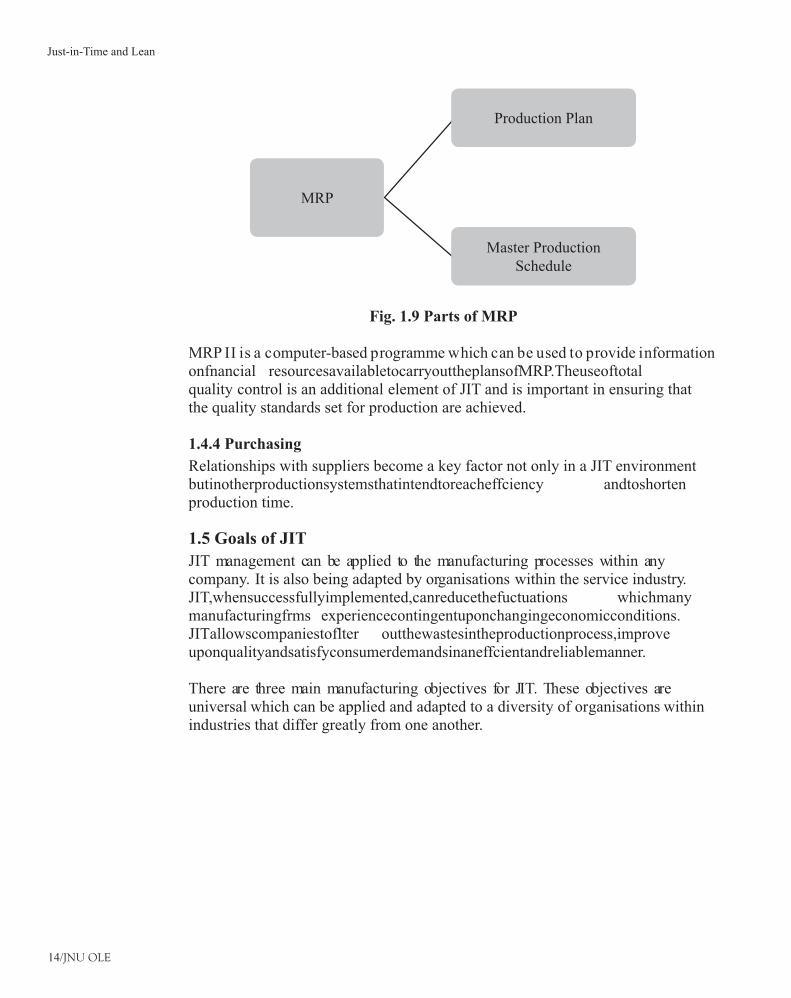
MRP is a computer-based method for managing the materials required out a schedule. Planning for MRP can be broken down essentially into two parts:
14/JNU OLE
MRP
Production Plan
Master Production Schedule
Fig. 1.9 Parts of MRP
MRP II is a computer-based programme which can be used to provide information onfnancial resourcesavailabletocarryouttheplansofMRP.Theuseoftotalquality control is an additional element of JIT and is important in ensuring that the quality standards set for production are achieved.
1.4.4 Purchasing
Relationships with suppliers become a key factor not only in a JIT environment butinotherproductionsystemsthatintendtoreacheffciency andtoshortenproduction time.
1.5 Goals of JIT
JIT management can be applied to the manufacturing processes within any company. It is also being adapted by organisations within the service industry. JIT,whensuccessfullyimplemented,canreducethefuctuations whichmanymanufacturingfrms experiencecontingentuponchangingeconomicconditions.JITallowscompaniestoflter outthewastesintheproductionprocess,improveuponqualityandsatisfyconsumerdemandsinaneffcientandreliablemanner.
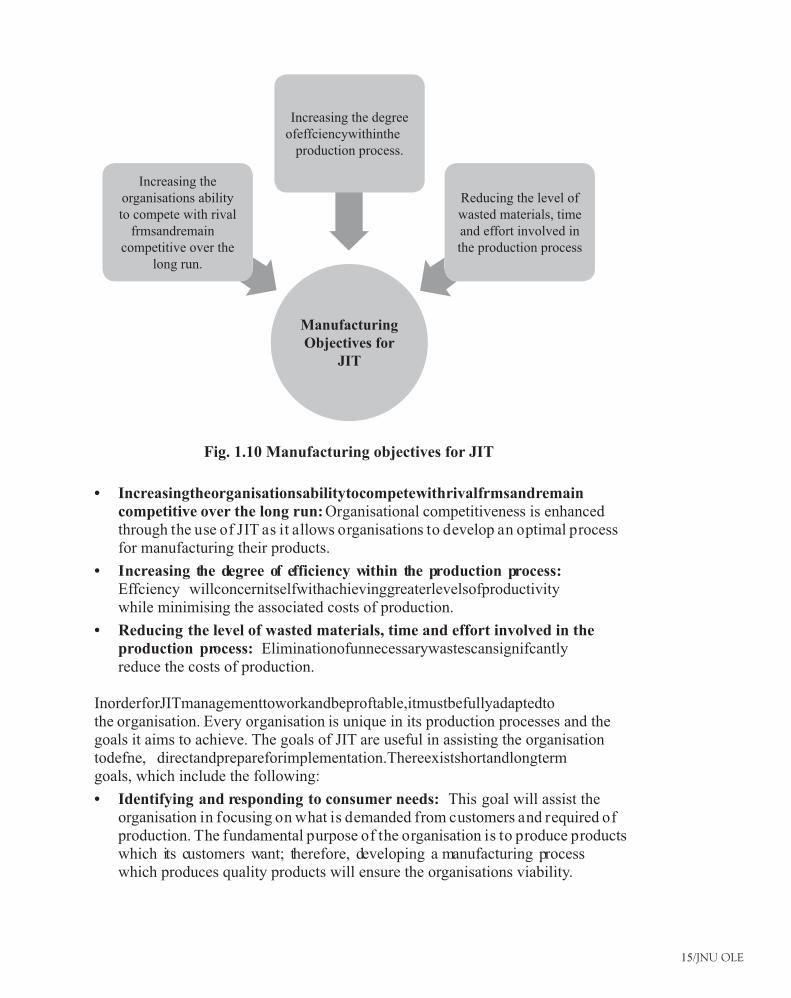
There are three main manufacturing objectives for JIT. These objectives are universal which can be applied and adapted to a diversity of organisations within industries that differ greatly from one another.
Just-in-Time and Lean
15/JNU OLE
Increasing the organisations ability to compete with rival
frmsandremaincompetitive over the
long run.
Increasing the degree ofeffciencywithinthe
production process.
Reducing the level of wasted materials, time and effort involved in the production process
Manufacturing Objectives for
JIT
Fig. 1.10 Manufacturing objectives for JIT
Increasingtheorganisationsabilitytocompetewithrivalfrmsandremain•competitive over the long run: Organisational competitiveness is enhanced through the use of JIT as it allows organisations to develop an optimal process for manufacturing their products.
Increasing the degree of efficiency within the production process: •Effciency willconcernitselfwithachievinggreaterlevelsofproductivitywhile minimising the associated costs of production.
Reducing the level of wasted materials, time and effort involved in the •production process: Eliminationofunnecessarywastescansignifcantlyreduce the costs of production.
InorderforJITmanagementtoworkandbeproftable,itmustbefullyadaptedtothe organisation. Every organisation is unique in its production processes and the goals it aims to achieve. The goals of JIT are useful in assisting the organisation todefne, directandprepareforimplementation.Thereexistshortandlongtermgoals, which include the following:
Identifying and responding to consumer needs: • This goal will assist the organisation in focusing on what is demanded from customers and required of production. The fundamental purpose of the organisation is to produce products which its customers want; therefore, developing a manufacturing process which produces quality products will ensure the organisations viability.
16/JNU OLE
Aiming for the optimal quality or cost relationship:• Achieving quality should not be done to the point where it does not pay off for the organisation. Therefore, emphasis should be placed on developing a manufacturing process that aims for zero defects.
Eliminating unnecessary wastes: • These are wastes that do not add value to the product.
Aiming for the development of trusting relationships between the •suppliers:Thiswillassistinthecreationofamoreeffcientcompanyintermsof inventory and materials, timeliness of deliveries and reassurance that the materials will be available when required.
Designingtheplantformaximumeffciency andeaseofmanufacturing:•This involves the use of machinery and labour that are absolutely essential to the manufacturing process.
Adopting the Japanese work ethic of aiming for continuous improvement even •though high standards are already achieved.
JIT can offer organisations a competitive advantage which can take the form of offeringconsumershigherqualityproductsthanthoseofferedbytherivalfrms,or providing a superior service or developing a superior means of production whichallowstheorganisationtobecomeeffcientandproductive.
1.6BeneftsandLimitationsofJIT
ThebeneftsandthelimitationsofJIT aregivenbelow.
1.6.1BeneftsofJIT
Benefts thatJITconceptcanprovidetothecompanyarehugeandverydiverse.ThemainbeneftsofJIT arelistedbelow:
Reduced set up times in warehouse:• The company in this case can focus on other processes that might need improvement.
Improvedfows ofgoodsin/through/outwarehouse:• Employees will be able to process goods faster.
Employeeswhopossessmulti-skillsareutilisedmoreeffciently• : The company can use workers in situations when they are needed, when there is a shortage of workers and a high demand for a particular product.
Better consistency of scheduling and consistency of employee work •hours: If there is no demand for a product at the time, workers don’t have to be working. This can save the company money by not having to pay workers for a job not completed or could have them focus on other jobs around the warehouse that would not necessarily be done on a normal day.
Increased emphasis on supplier relationships:• Having a trustworthy supplier relationship is important for the company because it is possible to rely on goods being there when they are needed.
Just-in-Time and Lean
17/JNU OLE
Supplies continue around the clock keeping workers productive and •businesses focused on turnover : Employees will work hard to meet the company goals.
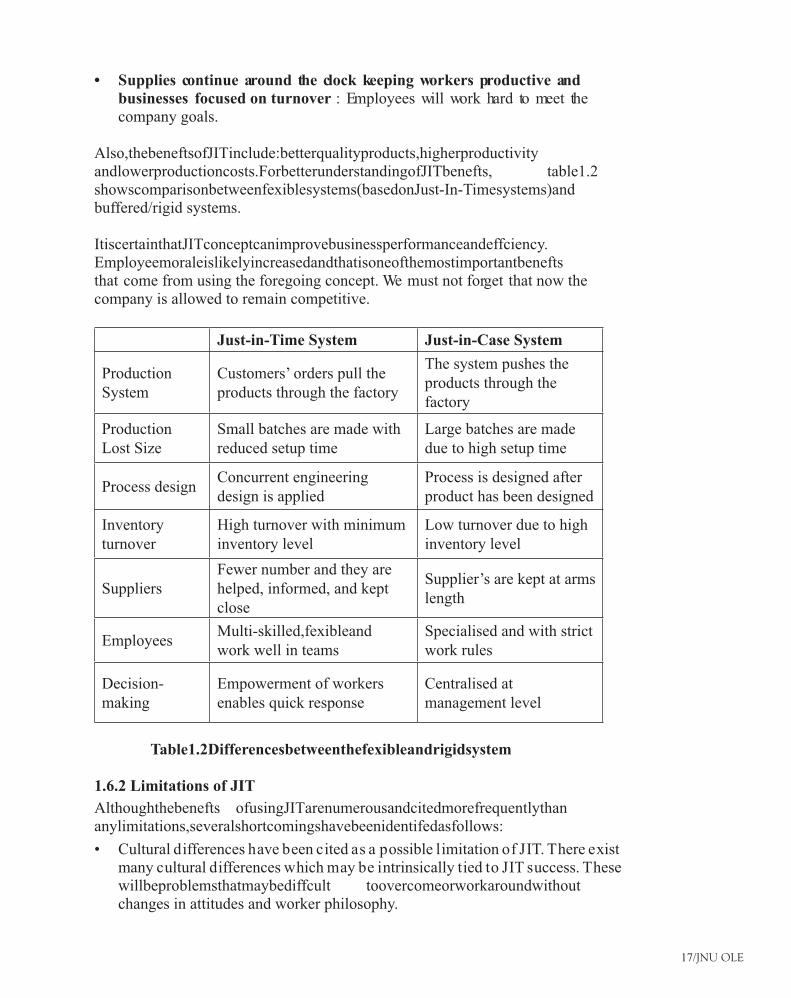
Also,thebeneftsofJITinclude:betterqualityproducts,higherproductivityandlowerproductioncosts.ForbetterunderstandingofJITbenefts, table1.2showscomparisonbetweenfexiblesystems(basedonJust-In-Timesystems)andbuffered/rigid systems.
ItiscertainthatJITconceptcanimprovebusinessperformanceandeffciency.Employeemoraleislikelyincreasedandthatisoneofthemostimportantbeneftsthat come from using the foregoing concept. We must not forget that now the company is allowed to remain competitive.
Just-in-Time System Just-in-Case System
Production System
Customers’ orders pull the products through the factory
The system pushes the products through the factory
Production Lost Size
Small batches are made with reduced setup time
Large batches are made due to high setup time
Process designConcurrent engineering design is applied
Process is designed after product has been designed
Inventory turnover
High turnover with minimum inventory level
Low turnover due to high inventory level
SuppliersFewer number and they are helped, informed, and kept close
Supplier’s are kept at arms length
EmployeesMulti-skilled,fexibleandwork well in teams
Specialised and with strict work rules
Decision- making
Empowerment of workers enables quick response
Centralised at management level
Table1.2Differencesbetweenthefexibleandrigidsystem
1.6.2 Limitations of JIT
Althoughthebenefts ofusingJITarenumerousandcitedmorefrequentlythananylimitations,severalshortcomingshavebeenidentifedasfollows:
Cultural differences have been cited as a possible limitation of JIT. There exist •many cultural differences which may be intrinsically tied to JIT success. These willbeproblemsthatmaybediffcult toovercomeorworkaroundwithoutchanges in attitudes and worker philosophy.
18/JNU OLE
The traditional approach to manufacturing involves the use of large inventories •with safety stocks. Safety stocks can act as a buffer for companies to fall back on to offset inaccurate demand forecasts. This has the potential to cause problems for the organisation which relies heavily on safety stocks to absorb any increases in demand.
Thebeneftsassociatedwithincreasedemployeeinvolvementandparticipation•resulting from the use of quality circles may be evident in Japanese organisation.Thebenefts associatedwithJITmaybeculturallyboundandsomewhat limited to the Japanese environment.
Loss of individual autonomy has been suggested as another possible short-•coming of JIT. Loss of autonomy has largely been attributed to limited cycle times or the time between recurring activities. Buffers such as slack or idle time aresignifcantly reducedresultingingreateramountsofstressandpressureplaced upon the worker to perform. Reduced cycle times force workers to adjust immediately to changes in demand without taking their needs into consideration.
Loss of team autonomy is a possible result of reducing buffer inventories. •Thisservestoreducethefexibility ofworkerstodiscusspossiblesolutionsto problems.
Loss of autonomy over methods involves the idea that, under JIT, employees •must adhere to strict methods of production in order to maintain the system.
JITsuccessmaybeindustryspecifc.•
Resistance to change may be experienced since JIT involves an organisational •level of change which will affect almost every member of the organisation.
In addition to improving communication and informing employees, several precautions managers can take to help avoid the negative impact of introducing JIT are:
First, managers should understand and become fully aware of the •shortcomings of JIT and how these could possibly affect their organisation during implementation. It should also be realised that JIT is not a remedy forallproblems,butameansofloweringcostsandimprovingeffciency ofproduction. Therefore, the goals an organisation sets for itself should be in line with JIT capability.
Theorganisationshouldallowforchangesandfexibility onceJITisfully•implemented. Successful implementation does not mean that changes will no longer occur, changes must occur for JIT to remain successful over the long run.
The managers must recognise that JIT involves changes in attitude which must •affectorinfuence theorganisationalcultureandrefect thevalueswhicharerequired to make success.
Just-in-Time and Lean
19/JNU OLE
1.7 Implementation of JIT Concept
We can observe implementation of the JIT concept as a process which must be taken seriously. How a company will implement the JIT concept depends on many factors.
For example, if a company has more than 100,000 workers and production in different places, then the implementation of JIT needs to be done in interaction with all departments. It is obvious that for large companies more time will be spent. On the other hand, smaller companies have the opportunity to implement the JIT concept much faster because their organisation structure is not so complicated. But it does not mean that smaller companies are better in JIT implementation.
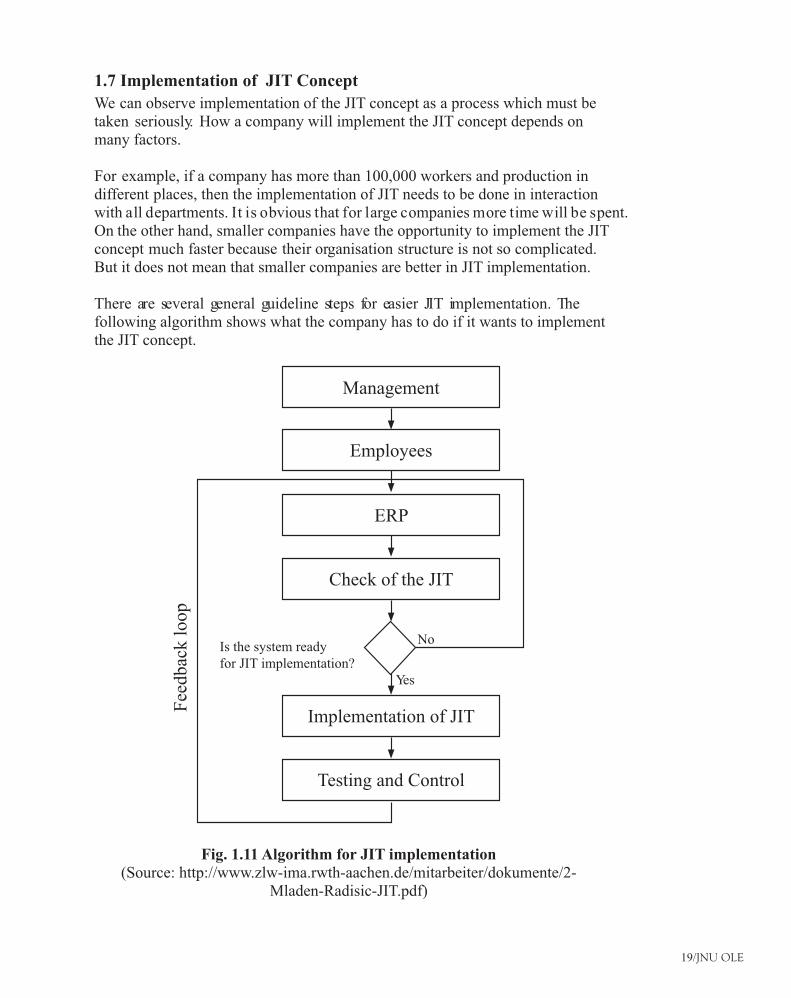
There are several general guideline steps for easier JIT implementation. The following algorithm shows what the company has to do if it wants to implement the JIT concept.
Management
Employees
ERP
Check of the JIT
Is the system ready
Implementation of JIT
for JIT implementation?
No
Yes
Testing and Control
Fee
dba
ck l
oop
Fig. 1.11 Algorithm for JIT implementation(Source: http://www.zlw-ima.rwth-aachen.de/mitarbeiter/dokumente/2-
Mladen-Radisic-JIT.pdf)
20/JNU OLE
First of al• l, top management must accept idea of the JIT. Without their permission it is not possible to move on with the whole process. They are responsibleforensuringfnancial resourcesfortheproject.Perhapsthemostdiffcult thingforengineersistoconvincemanagersthatthecompanyunderconsideration really needs implementation of the JIT concept in order to improve business processes. Convincing managers to allow evaluation of JIT is not only a problem that comes from human.
Second step for a company is success which is connected with the fact that •employeesalsohavetounderstandsignifcance ofthenewconcept.Veryimportant in this step is to explain to workers that JIT is not something unimportant for their work. It is desirable to hold a series of training sessions to familiarise employees with the fundamentals of the JIT concept. When we succeed to explain to our human resources the importance of the new concept and if they become cognizant about it, now it is possible to continue.
The third step would be the setup of ERP (Enterprise Resource Planning). ERP •is a system which integrates all data and processes of an organization into a singleunifed system.Itisimpossiblenowadaystorunsuccessfulproductionwithout strong support of an information system. So, it means that ERP requests the software and hardware systems with a secure and huge data base which is able to collect all information about resources. With a centralised data base it is much easier to manage all enterprise resources. It is especially important for logistics because, as we mentioned before, logistics can be considered as a tool for getting resources, like products, services, and people, where they are needed and when they are desired.
If the ERP system is well established, the next step would be to test our own •system. Now all preconditions of the JIT implementation are considered and we aretryingtofgureout:arethereanydiffcultiestostartwithimplementation.Inthis step one question comes up: “Is the system ready for JIT implementation?” When the answer is NO, it is recommendable to go back and make the changes. If the answer is YES, everything is prepared for the implementation process. Concerning the technical and physical parts of the implementation, maybe the most important thing which is worth mentioning is that during the process the organisation must not rush.
The last step is testing and control. For successful existence and developing •of the JIT system there must be continuous control. Without control things can sway from the right direction. Of course, feedback loops also exist and they are very important for the whole process.
1.7.1 Keys to Successful Implementation of JIT
There are some prerequisites for successful JIT implementation. Industries need to do the following:
Stabilise and level the Master Production Schedule (MPS) with uniform •plant loading: Create a uniform load on all work centres through constant daily production (establish freeze windows to prevent changes in the production plan for some period of time) and mixed model assembly (produce roughly the same mix of products each day, using a repeating sequence if several products areproducedonthesameline).Meetdemandfuctuations throughend-iteminventory rather than throughfuctuationsinproductionlevel.
Just-in-Time and Lean
21/JNU OLE
Reduce or eliminate setup times:• The process of JIT is to produce parts in a lot size of 1. In many cases this is not economically feasible because of the cost of set up compared with inventory carrying cost. The JIT solution to this problem is to reduce the setup time as much as possible ideally to zero. Bringing down the set up time for machine is the key factor to implement JIT system. This concept is popularly known by the name ‘Single Minute Exchange of Dies (SMED)’. This means the maximum time taken in changing a die to switch over from one type of component to another should be in single digit (0 to 9). This is possible by off-line set up of the dies. Aim for ‘one-touch’ setup - which is possible through better planning, process redesign, and product redesign.
Reduce lot sizes (manufacturing and purchase):• Reducing setup times allows economical production of smaller lots. Close cooperation with suppliers is necessary to achieve reductions in order lot sizes for purchased items, since this will require more frequent deliveries.
Reduce lead times (production and delivery):• Production lead times can be reduced by moving work stations closer together, applying group technology and cellular manufacturing concepts, reducing queue length (reducing the number of jobs waiting to be processed at a given machine), and improving the coordination and cooperation between successive processes. Delivery lead times can be reduced through close cooperation with suppliers, possibly by inducing suppliers to locate closer to the factory.
Preventive maintenance:• Use machine and worker idle time to maintain equipment and prevent breakdowns.
Flexible work force:• Workers should be trained to operate several machines, to perform maintenance tasks, and to perform quality inspections. In general, the attitude of respect for people leads to giving workers more responsibility for their own work.
Require supplier quality assurance and implement a zero defects quality •program: Errors leading to defective items must be eliminated, since there are no buffers of excess parts. A quality at the source (jidoka) program must be implemented to give workers the personal responsibility for the quality of the work they do, and the authority to stop production when something goes wrong. Techniques such as “JIT lights” (to indicate line slowdowns or stoppages) and “tally boards” (to record and analyse causes of production stoppages and slowdowns to facilitate correcting them later) may be used.
Small-lot (single unit) conveyance:• Use a control system such as a Kanban (card) system to convey parts between work stations in small quantities (ideally, one unit at a time). In its largest sense, JIT is not the same thing as a Kanban system, and a Kanban system is not required to implement JIT (some companies have instituted a JIT program along with a MRP system), although JIT is required to implement a Kanban system and the two concepts are frequently equated with one another.
22/JNU OLE
1.8 Understanding and Controlling Variation
Variation is a basic phenomenon of nature. This affects all entities including products and processes. Variation is found in all stages of product life cycle including design and development, manufacturing, service and supplier processes. Controlling process variation is a key to achieving Six Sigma quality.
Variation is responsible for the difference between one unit of product and another. Itcanalsobedefnedasthedifferencebetweenspecifcationsandcustomerrequirements. Variation is present in all processes. When it is present in one or more characteristics of a product or process, it causes poor quality and customer dissatisfaction.
Products and processes are expected to vary because no two things are exactly alike. Differences result from material characteristics, methods, people, machine and environmental factors.
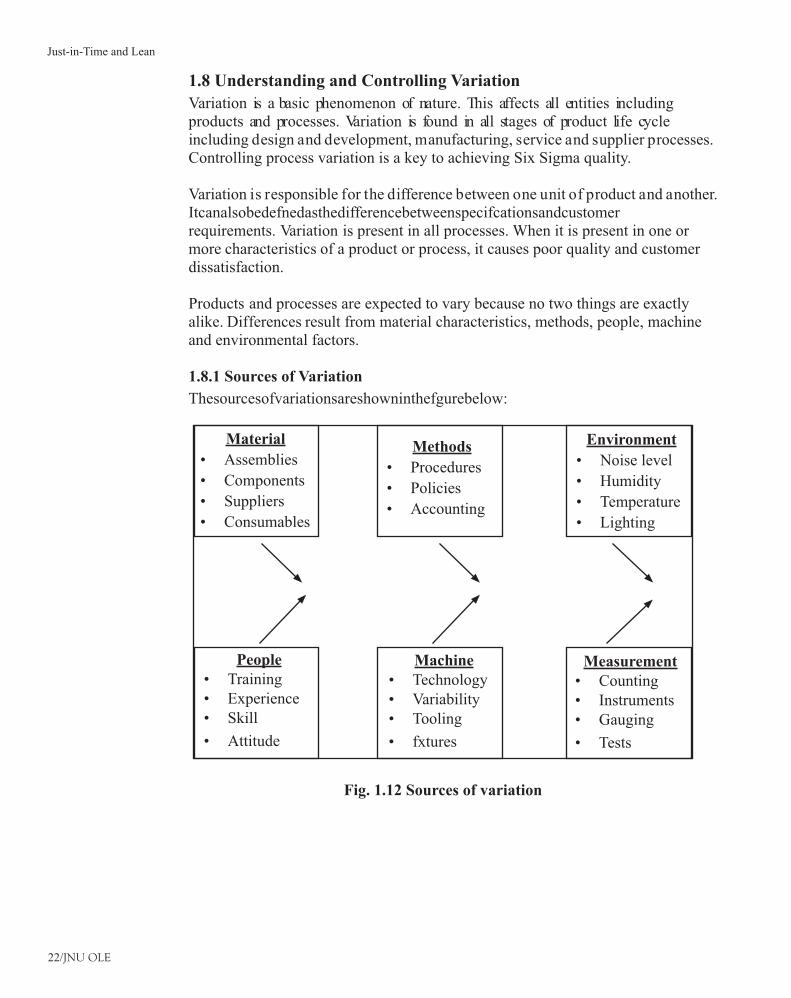
1.8.1 Sources of Variation
Thesourcesofvariationsareshowninthefgurebelow:
Material
Assemblies•
Components•
Suppliers•
Consumables•
Methods
Procedures•
Policies•
Accounting•
Environment
Noise level•
Humidity•
Temperature•
Lighting•
PeopleTraining•Experience•Skill•
Attitude•
MachineTechnology•Variability•Tooling •
fxtures•
MeasurementCounting•Instruments•Gauging •
Tests•
Fig. 1.12 Sources of variation
Just-in-Time and Lean
23/JNU OLE
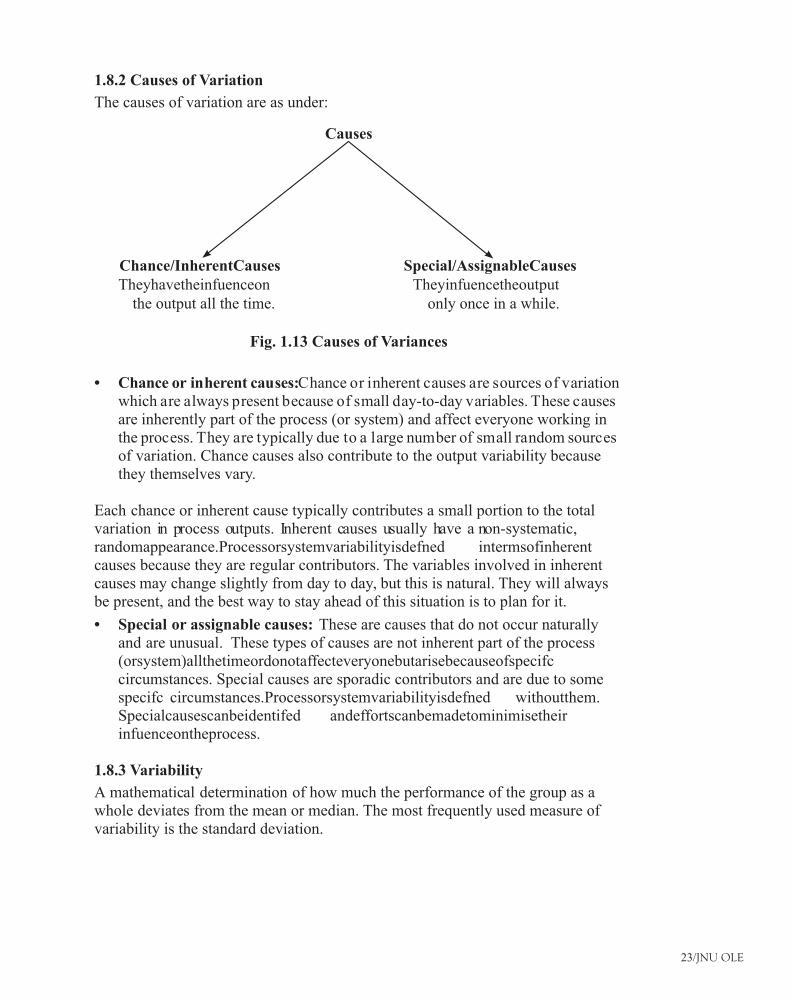
1.8.2 Causes of Variation
The causes of variation are as under:
Causes
Chance/InherentCausesTheyhavetheinfuenceon
the output all the time.
Special/AssignableCausesTheyinfuencetheoutput
only once in a while.
Fig. 1.13 Causes of Variances
Chance or inherent causes:• Chance or inherent causes are sources of variation which are always present because of small day-to-day variables. These causes are inherently part of the process (or system) and affect everyone working in the process. They are typically due to a large number of small random sources of variation. Chance causes also contribute to the output variability because they themselves vary.
Each chance or inherent cause typically contributes a small portion to the total variation in process outputs. Inherent causes usually have a non-systematic, randomappearance.Processorsystemvariabilityisdefned intermsofinherentcauses because they are regular contributors. The variables involved in inherent causes may change slightly from day to day, but this is natural. They will always be present, and the best way to stay ahead of this situation is to plan for it.
Special or assignable causes:• These are causes that do not occur naturally and are unusual. These types of causes are not inherent part of the process (orsystem)allthetimeordonotaffecteveryonebutarisebecauseofspecifccircumstances. Special causes are sporadic contributors and are due to some specifc circumstances.Processorsystemvariabilityisdefned withoutthem.Specialcausescanbeidentifed andeffortscanbemadetominimisetheirinfuenceontheprocess.
1.8.3 Variability
A mathematical determination of how much the performance of the group as a whole deviates from the mean or median. The most frequently used measure of variability is the standard deviation.
24/JNU OLE
1.8.3.1 Forms of Variability
The different forms of variability are:
Demand:• Customer demand (internal or external) is an obvious and pervasive form of variability. It often creates inventory blocks that move through the system.
When lots or batches move through a manufacturing system, they interrupt •production for changeovers and these interruptions are a form of variability. Material handling methods may also create batches.
Variable routing:• When a single factory produces many different products or parts with different processing requirements, each may follow a unique route or sequence. Predicting the workload and queues at each work centre under such conditions is problematic at best. When other forms of variability enter the picture, such prediction is impossible at best. When other forms of variability enter the picture, such prediction is impossible and queues build as compensation.
Breakdowns:• Machine outages interrupt production with unpredictable consequences. During breakdowns, inventory often builds upstream while downstreamoperationsbecomestarvedforwork.Themaintenancedefcienciesthat cause breakdowns often contribute to quality defects as well.
Quality defects:• When defects become known, the production sequence is interrupted while the defects are corrected. They may also cause unexpected workloads for repair.
Humanamplifcation:• People often exacerbate existing system variability. For example, supervisors overproduce the schedule to compensate for possible breakdowns and quality defects. Schedulers over schedule for many of the same reasons. This creates larger batches and greater delays.
1.8.3.2 Responses to Variability
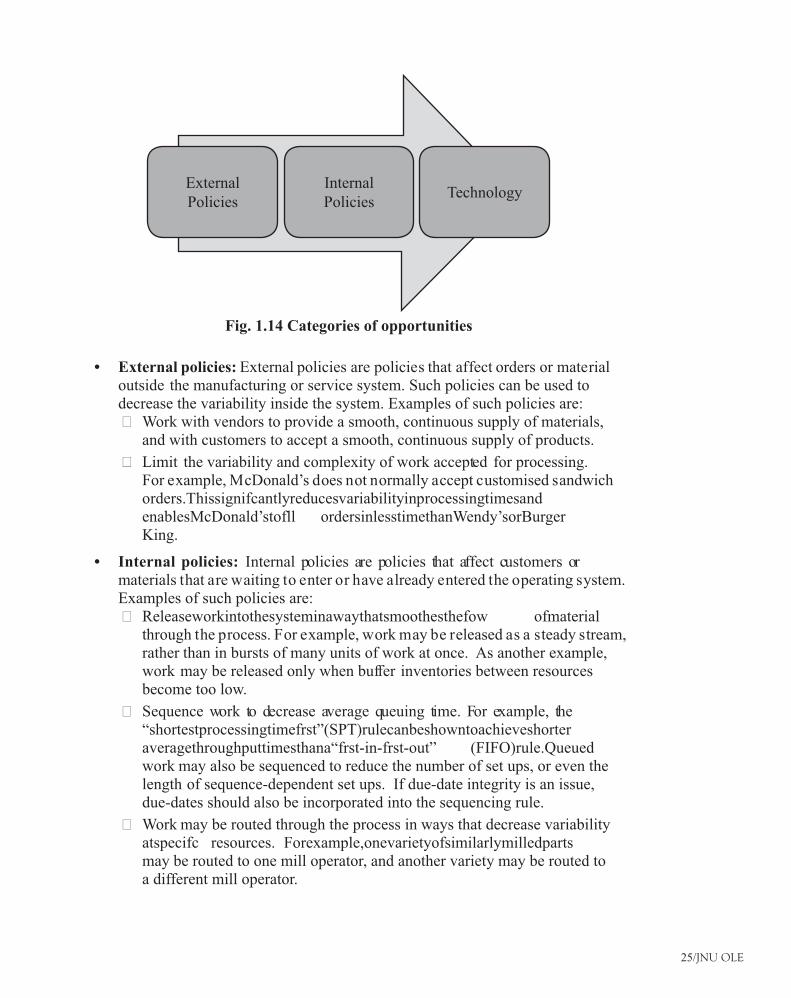
As the variability in a process becomes more severe, it becomes more and more diffcult toachievehighutilisationandlowinventorysimultaneously. Possibleresponses to this situation include turning away business and foregoing potential production, building extra capacity, or simply allowing queues and inventories to be large. However, generally there are opportunities to decrease the variability effectively,smoothoutthefowofmaterials,ordecreasetheinventoryrequirementsneeded to achieve a given throughput rate. These opportunities will be divided into three categories:
Just-in-Time and Lean
25/JNU OLE
External Policies
Internal Policies
Technology
Fig. 1.14 Categories of opportunities
External policies: • External policies are policies that affect orders or material outside the manufacturing or service system. Such policies can be used to decrease the variability inside the system. Examples of such policies are:
Work with vendors to provide a smooth, continuous supply of materials, ?and with customers to accept a smooth, continuous supply of products.
Limit the variability and complexity of work accepted for processing. ?For example, McDonald’s does not normally accept customised sandwich orders.ThissignifcantlyreducesvariabilityinprocessingtimesandenablesMcDonald’stofll ordersinlesstimethanWendy’sorBurgerKing.
Internal policies: • Internal policies are policies that affect customers or materials that are waiting to enter or have already entered the operating system. Examples of such policies are:
Releaseworkintothesysteminawaythatsmoothesthefow ofmaterial ?through the process. For example, work may be released as a steady stream, rather than in bursts of many units of work at once. As another example, work may be released only when buffer inventories between resources become too low.
Sequence work to decrease average queuing time. For example, the ?“shortestprocessingtimefrst”(SPT)rulecanbeshowntoachieveshorteraveragethroughputtimesthana“frst-in-frst-out” (FIFO)rule.Queuedwork may also be sequenced to reduce the number of set ups, or even the length of sequence-dependent set ups. If due-date integrity is an issue, due-dates should also be incorporated into the sequencing rule.
Work may be routed through the process in ways that decrease variability ?atspecifc resources. Forexample,onevarietyofsimilarlymilledpartsmay be routed to one mill operator, and another variety may be routed to a different mill operator.
26/JNU OLE
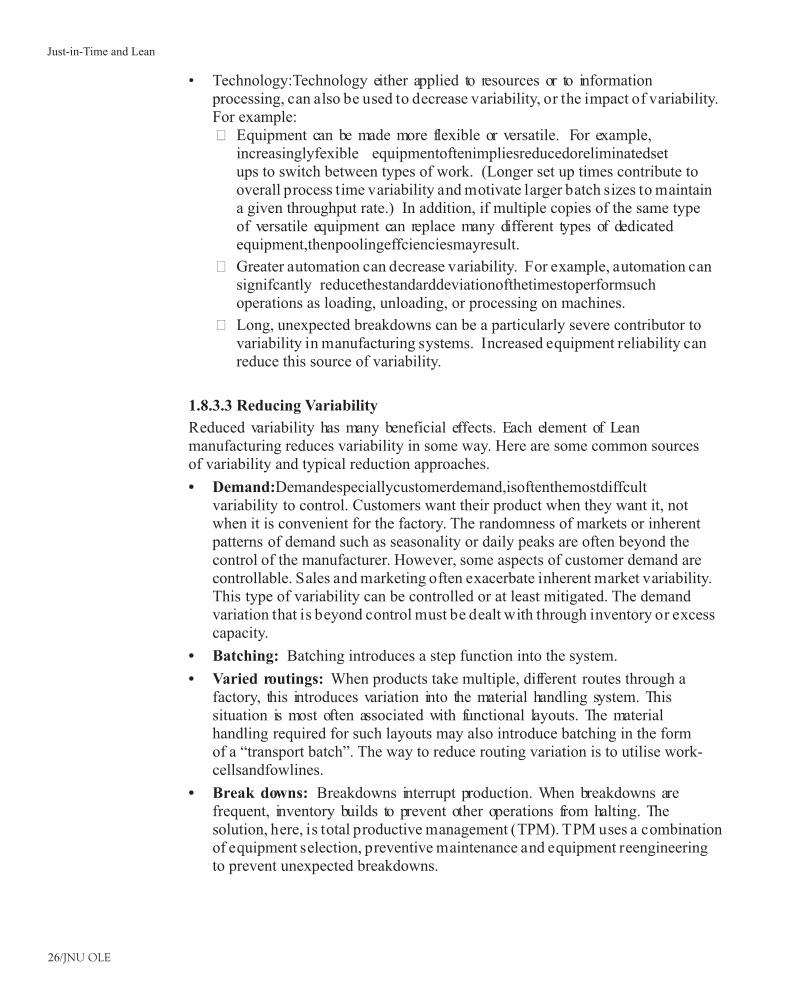
Technology:Technology either applied to resources or to information •processing, can also be used to decrease variability, or the impact of variability. For example:
Equipment can be made more flexible or versatile. For example, ?increasinglyfexible equipmentoftenimpliesreducedoreliminatedsetups to switch between types of work. (Longer set up times contribute to overall process time variability and motivate larger batch sizes to maintain a given throughput rate.) In addition, if multiple copies of the same type of versatile equipment can replace many different types of dedicated equipment,thenpoolingeffcienciesmayresult.
Greater automation can decrease variability. For example, automation can ?signifcantly reducethestandarddeviationofthetimestoperformsuchoperations as loading, unloading, or processing on machines.
Long, unexpected breakdowns can be a particularly severe contributor to ?variability in manufacturing systems. Increased equipment reliability can reduce this source of variability.
1.8.3.3 Reducing Variability
Reduced variability has many beneficial effects. Each element of Lean manufacturing reduces variability in some way. Here are some common sources of variability and typical reduction approaches.
Demand:• Demandespeciallycustomerdemand,isoftenthemostdiffcultvariability to control. Customers want their product when they want it, not when it is convenient for the factory. The randomness of markets or inherent patterns of demand such as seasonality or daily peaks are often beyond the control of the manufacturer. However, some aspects of customer demand are controllable. Sales and marketing often exacerbate inherent market variability. This type of variability can be controlled or at least mitigated. The demand variation that is beyond control must be dealt with through inventory or excess capacity.
Batching:• Batching introduces a step function into the system.
Varied routings:• When products take multiple, different routes through a factory, this introduces variation into the material handling system. This situation is most often associated with functional layouts. The material handling required for such layouts may also introduce batching in the form of a “transport batch”. The way to reduce routing variation is to utilise work-cellsandfowlines.
Break downs: • Breakdowns interrupt production. When breakdowns are frequent, inventory builds to prevent other operations from halting. The solution, here, is total productive management (TPM). TPM uses a combination of equipment selection, preventive maintenance and equipment reengineering to prevent unexpected breakdowns.
Just-in-Time and Lean
27/JNU OLE
Summary
Just in Time (JIT) production is a manufacturing philosophy which eliminates •waste associated with time, labour, and storage space. Basics of the concept are that the company produces only what is needed, when it is needed and in the quantity that is needed.
JIT is also known as lean production or stockless production system. •
JIT applies primarily to repetitive manufacturing processes in which the same •products and components are produced over and over again.
The three possible approaches of JIT are: reducing manufacturing and •administrativecycletimes,reducingallwaste,andreducingthepulledfowbreakdowns
Most successful JIT applications have been in repetitive manufacturing, where •batches of standard products are produced at high speeds and high volumes. Smaller, less complex job shops have used JIT, but operations have been changed so that they behave somewhat like repetitive manufacturing.
The results of just-in-time inventory management are apparent: cost reduction, •increasedspeedtomarketandidentifcationofbottlenecksintheworkfow.
Generally JIT manufacturing system is: to have only required inventory when •needed, to improve quality to zero defects, to reduce lead times by reducing setup times, to incrementally revise operations themselves, and to accomplish these things at a minimum cost.
Seven wastes in JIT are: waste of overproduction, waste of waiting, waste •of transportation, waste of processing, waste of stocks, waste of motion, and waste of making defective products.
Elements of Just-In-Time are: people involvement, plants, systems, and •purchasing.
Variation is a basic phenomenon of nature. This affects all entities including •products and processes. Variation is found in all stages of product life cycle including design and development, manufacturing, service and supplier processes.
Causes of variation are chance or inherent causes, and special or assignable •causes.
Chance or inherent causes are sources of variation which are always present •because of small day-to-day variables. These causes are inherently part of the process (or system) and affect everyone working in the process. They are typically due to a large number of small random sources of variation.
Special causes are sporadic contributors and are due to some specific •circumstances.
Variability is a mathematical determination of how much the performance of •the group as a whole deviates from the mean or median. The most frequently used measure of variability is the standard deviation.
28/JNU OLE
References
Ignousoet, 2010. • Just in Time [Video Online] Available at : <http://www.youtube.com/watch?v=i6wS4TAF2es> [Accessed 1 July 2011].
Wsbmilc, 2008. • The Advantages of JIT [Video Online] Available at: < http://www.youtube.com/watch?v=XkWIG12nfcI&NR=1> [Accessed 1 July 2011].
Logistil.com, 2009. • Just-In-Time principles [Online] Available at: <http://logisitik.com/learning-center/just-in-time-principles.html> [Accessed 1 July 2011].
Broyles, D., 2005. • Just-In-Time Inventory Management Strategy & Lean Manufacturing [Online] Available at: <http://www.academicmind.com/unpublishedpapers/business/operationsmanagement/2005-04-000aaf-just-in-time-inventory-management.html> [Accessed 1 July 2001].
Roy, R., 2005. • Modern Approach to Operations Management . New Age International.
Recommended Reading
Hay, E., 1988. • Just-In-Time Breakthrough: Implementing the New Manufacturing Basics. John Wiley & Sons Inc.
Hutchins, D., 1998. • Just in Time. 2nd ed., Gower Pub Co.
Wild, T., 1998. • Best Practice in Inventory Management. Wiley.
Just-in-Time and Lean
29/JNU OLE
Self Assessment
JIT applies primarily to ____________manufacturing processes in which the 1. same products and components are produced over and over again.
similara.
repetitiveb.
differentc.
everyd.
Which of the following statements are false?2. Variation is a basic phenomenon of nature. a.
Controlling process variation is a key to achieving Six Sigma quality.b.
Thevolumeofmaterialsfowing throughafactoryisincreasedbyJIT,c. making bottlenecks and other problems more visible.
In JIT, each stage is required to go back to the previous stage to pick up d. the exact number of units needed.
_______ is a system which integrates all data and processes of an organization 3. intoasingleunifedsystem.
ERPa.
SEDb.
JITc.
TPMd.
JIT management is applied to which of the following process in a 4. company?
Packaginga.
Distributionb.
Productionc.
Manufacturingd.
Reduced __________ force workers to adjust immediately to changes in 5. demand without taking their needs into consideration.
lead timea.
cycle timeb.
variationc.
qualityd.
30/JNU OLE
Which of the following statements is true?6. As the variability in a process becomes more severe, it becomes more and a. more easy to achieve high utilization and low inventory simultaneously.
Variation is responsible for the similarity between one unit of product and b. another.
Products and processes are expected to vary because no two things are c. exactly alike.
Manufacturing process variation is a key to achieving Six Sigma quality.d.
Which of the following process variation is a key to achieving six sigma 7. quality?
Productiona.
Manufacturingb.
Controllingc.
Packagingd.
The most frequently used measure of variability is the _________.8. standard deviationa.
TPMb.
CPMc.
PERTd.
Inherent causes usually have a nonsystematic, ___________appearance.9. orderlya.
standardb.
variablec.
randomd.
Which of the following is the other name of the Just-In-System?10. Standard deviationa.
Critical Path Methodb.
Stockless production systemc.
SMEDd.
Just-in-Time and Lean
31/JNU OLE
Chapter II
Push and Pull Systems
Aim
The aim of this unit is to:
introduce the concept of material requirement planning (MRP)•
explain the “pull” model of inventory management•
discuss the inputs and outputs of material requirement planning (MRP)•
Objectives
The objectives of this unit are to:
highlight the basic material requirement concepts•
identify factors affecting the computation of MRP•
describe the “push” model•
Learning outcome
At the end of this unit, you will be able to:
evaluate the difference between MRP push model and JIT pull model•
analyse the advantages and disadvantages of push and pull models•
discu• ss how the combination of push and pull works
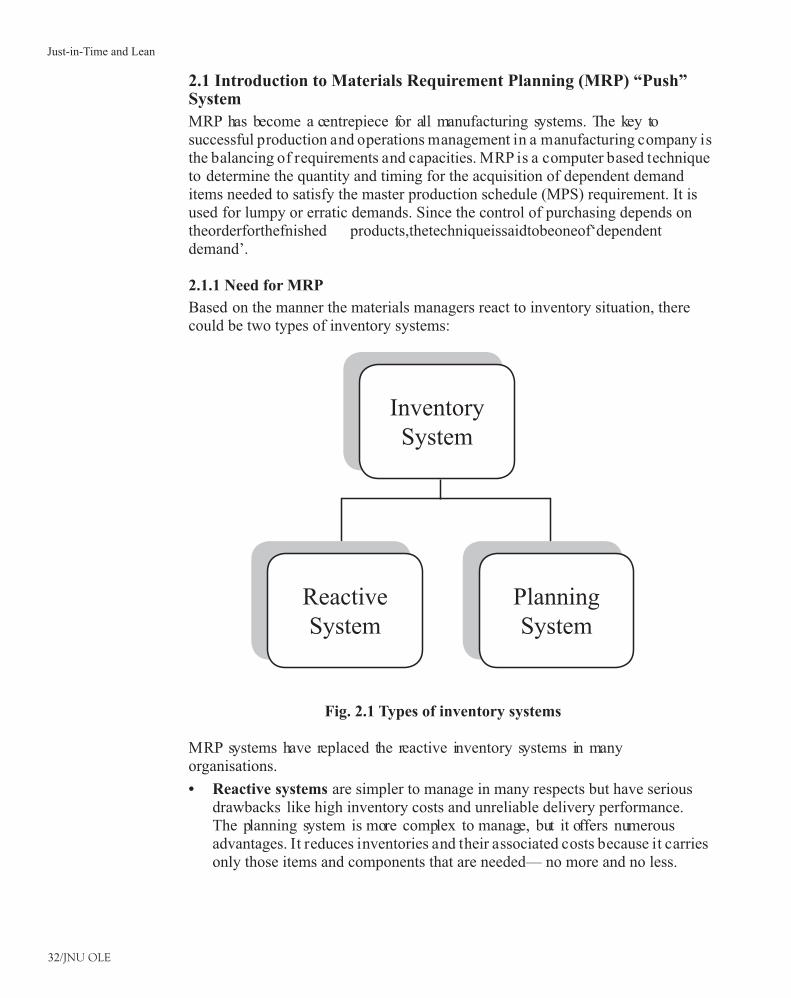
32/JNU OLE
2.1 Introduction to Materials Requirement Planning (MRP) “Push” System
MRP has become a centrepiece for all manufacturing systems. The key to successful production and operations management in a manufacturing company is the balancing of requirements and capacities. MRP is a computer based technique to determine the quantity and timing for the acquisition of dependent demand items needed to satisfy the master production schedule (MPS) requirement. It is used for lumpy or erratic demands. Since the control of purchasing depends on theorderforthefnished products,thetechniqueissaidtobeoneof‘dependentdemand’.
2.1.1 Need for MRP
Based on the manner the materials managers react to inventory situation, there could be two types of inventory systems:
Inventory System
Reactive System
Planning System
Fig. 2.1 Types of inventory systems
MRP systems have replaced the reactive inventory systems in many organisations.
Reactive systems• are simpler to manage in many respects but have serious drawbacks like high inventory costs and unreliable delivery performance. The planning system is more complex to manage, but it offers numerous advantages. It reduces inventories and their associated costs because it carries only those items and components that are needed— no more and no less.
Just-in-Time and Lean
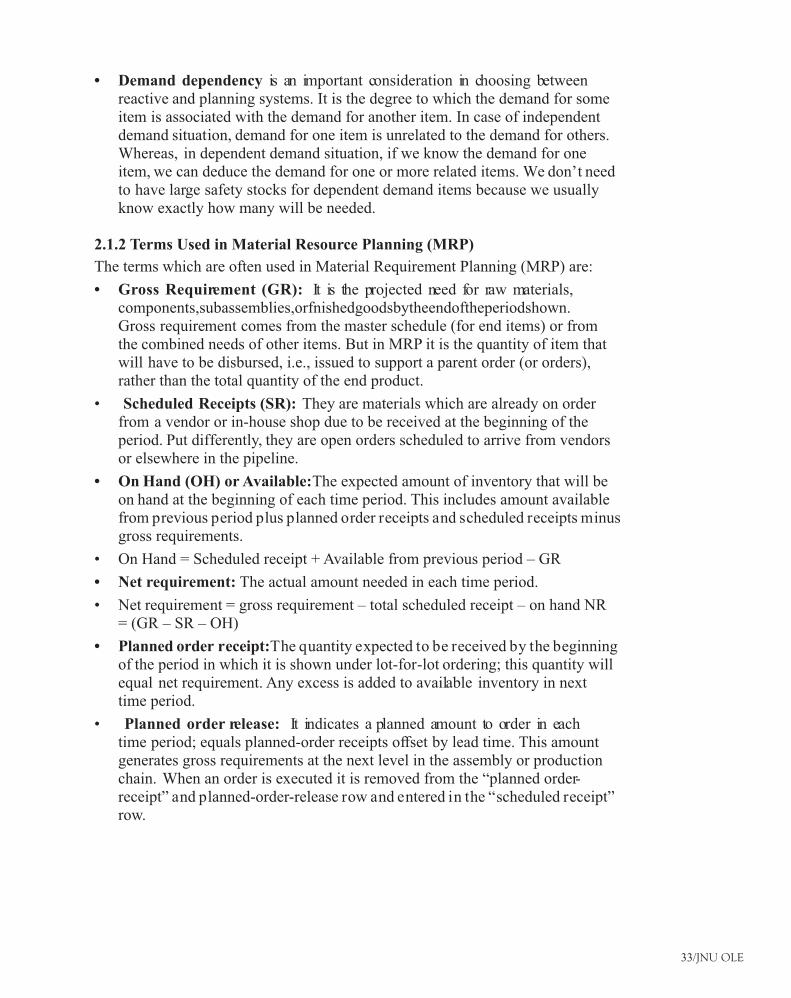
33/JNU OLE
Demand dependency• is an important consideration in choosing between reactive and planning systems. It is the degree to which the demand for some item is associated with the demand for another item. In case of independent demand situation, demand for one item is unrelated to the demand for others. Whereas, in dependent demand situation, if we know the demand for one item, we can deduce the demand for one or more related items. We don’t need to have large safety stocks for dependent demand items because we usually know exactly how many will be needed.
2.1.2 Terms Used in Material Resource Planning (MRP)
The terms which are often used in Material Requirement Planning (MRP) are:
Gross Requirement (GR):• It is the projected need for raw materials, components,subassemblies,orfnishedgoodsbytheendoftheperiodshown.Gross requirement comes from the master schedule (for end items) or from the combined needs of other items. But in MRP it is the quantity of item that will have to be disbursed, i.e., issued to support a parent order (or orders), rather than the total quantity of the end product.
• Scheduled Receipts (SR): They are materials which are already on order from a vendor or in-house shop due to be received at the beginning of the period. Put differently, they are open orders scheduled to arrive from vendors or elsewhere in the pipeline.
On Hand (OH) or Available:• The expected amount of inventory that will be on hand at the beginning of each time period. This includes amount available from previous period plus planned order receipts and scheduled receipts minus gross requirements.
On Hand = Scheduled receipt + Available from previous period – GR •
Net requirement:• The actual amount needed in each time period.
Net requirement = gross requirement – total scheduled receipt – on hand NR •= (GR – SR – OH)
Planned order receipt:• The quantity expected to be received by the beginning of the period in which it is shown under lot-for-lot ordering; this quantity will equal net requirement. Any excess is added to available inventory in next time period.
• Planned order release: It indicates a planned amount to order in each time period; equals planned-order receipts offset by lead time. This amount generates gross requirements at the next level in the assembly or production chain. When an order is executed it is removed from the “planned order-receipt” and planned-order-release row and entered in the “scheduled receipt” row.
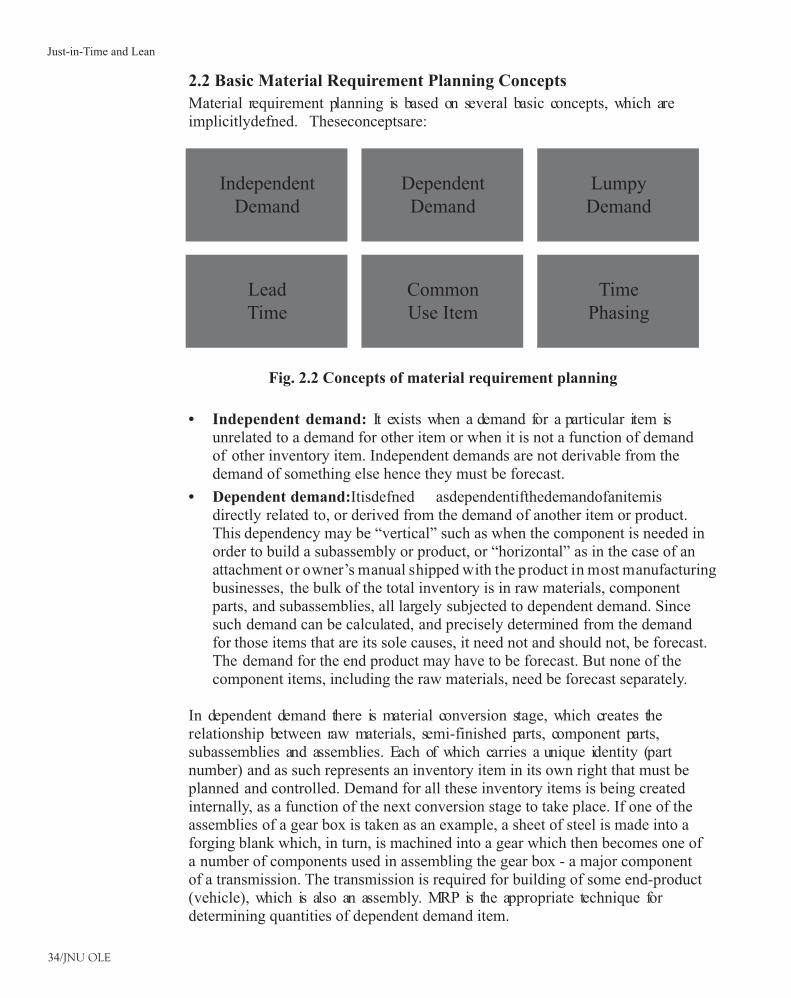
34/JNU OLE
2.2 Basic Material Requirement Planning Concepts
Material requirement planning is based on several basic concepts, which are implicitlydefned. Theseconceptsare:
Independent Demand
Lead Time
Dependent Demand
Common Use Item
Lumpy Demand
Time Phasing
Fig. 2.2 Concepts of material requirement planning
Independent demand:• It exists when a demand for a particular item is unrelated to a demand for other item or when it is not a function of demand of other inventory item. Independent demands are not derivable from the demand of something else hence they must be forecast.
Dependent demand:• Itisdefned asdependentifthedemandofanitemisdirectly related to, or derived from the demand of another item or product. This dependency may be “vertical” such as when the component is needed in order to build a subassembly or product, or “horizontal” as in the case of an attachment or owner’s manual shipped with the product in most manufacturing businesses, the bulk of the total inventory is in raw materials, component parts, and subassemblies, all largely subjected to dependent demand. Since such demand can be calculated, and precisely determined from the demand for those items that are its sole causes, it need not and should not, be forecast. The demand for the end product may have to be forecast. But none of the component items, including the raw materials, need be forecast separately.
In dependent demand there is material conversion stage, which creates the relationship between raw materials, semi-finished parts, component parts, subassemblies and assemblies. Each of which carries a unique identity (part number) and as such represents an inventory item in its own right that must be planned and controlled. Demand for all these inventory items is being created internally, as a function of the next conversion stage to take place. If one of the assemblies of a gear box is taken as an example, a sheet of steel is made into a forging blank which, in turn, is machined into a gear which then becomes one of a number of components used in assembling the gear box - a major component of a transmission. The transmission is required for building of some end-product (vehicle), which is also an assembly. MRP is the appropriate technique for determining quantities of dependent demand item.
Just-in-Time and Lean
35/JNU OLE
Lumpy demand:• Manufacturing is frequently done on an intermittent basis in lots,ormodels,ofonetypeoranother.Thecomponentsofafnished productare needed only when the product is being manufactured. Thus, there may be large demands on inventory at some times and none at other times, making the demand ‘lumpy’. When the demand occurs in large steps, it is referred to as “lumpy demand.” MRP is an appropriate approach for dealing with inventory situations characterised by lumpy demand.
Lead time of item:• The lead-time for a certain job is the time that must be allowedtocompletethejobfromstarttofnish. Inmanufacturing,lead-timeis divided into ordering lead-time and manufacturing lead-time. An ordering lead time for an item is the time required from initiation of the purchase requisition to receipt of the item from the vendor. In this case if the item is raw material that is stocked by the vendor, the ordering lead time should be relatively short. If the item must be fabricated by the vendor, the lead time may be substantial, perhaps several months.
Manufacturing lead time is the time needed to process the part through ?thesequenceofmachinesspecifed ontheroutesheet.Itincludesnotonlythe operation time but also the non-productive time that must be allowed. In MRP, lead times are used to determine starting dates for assembling fnal productsandsub-assemblies,forproducingcomponentpartsandforordering raw materials.
The various individual lead times of inventory item that makes up the ?product is also another factor that affect material requirements.
Common use items: • In manufacturing, one raw material is often used to produce more than one component type. And a component type may be used onmorethanonefnal product.MRPcollectsthesecommonuseitemsfromdifferent products to affect economies in ordering the raw materials and manufacturing the components.
Time phasing: • Time phasing means adding the time dimension to inventory statusdatabyrecording,andstoringtheinformationoneitherspecifc datesor planning periods with which the respective quantities are associated.
2.3 Factors Affecting the Computation of MRP
The computation of material requirement is affected by the following factors:
Product structure• : product structure imposes the principal constraint on the computation of requirements due to its content of several manufacturing levels of materials, component parts, and subassemblies. This computation requires asimpleproceduretobefollowed.Aprocedurewhichclearlyidentifes thestructure of the product by using a bill of material with different levels or using parent-child relationship. The product level or manufacturing level is related to the way the product is structured, i.e., manufactured.
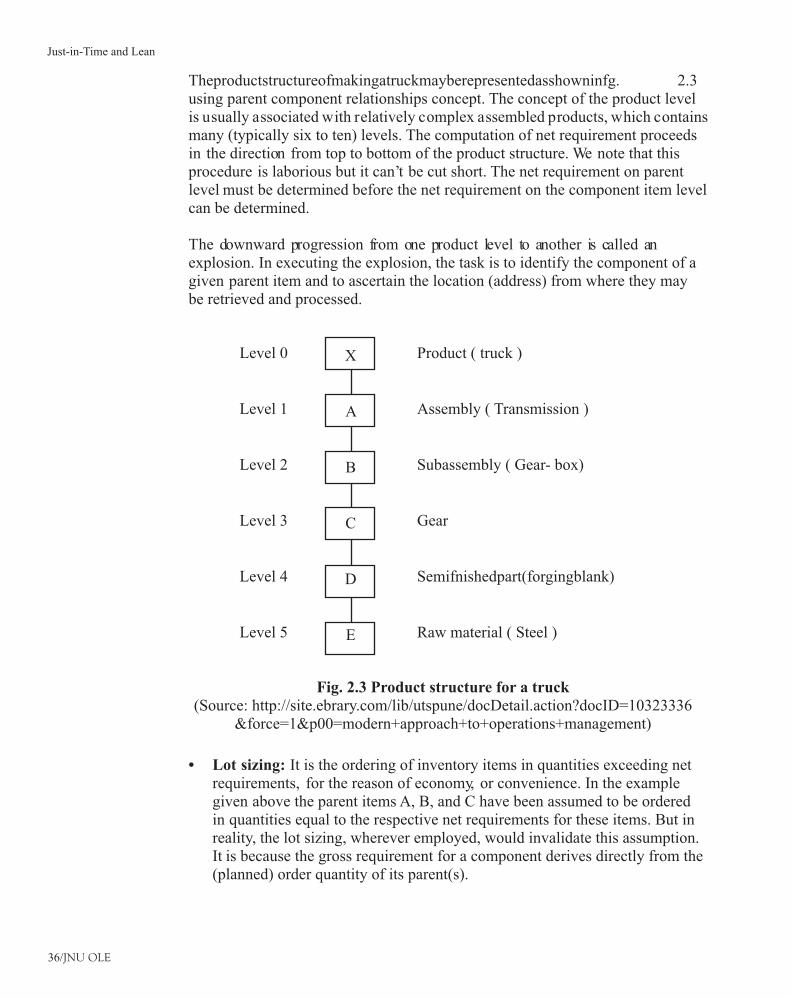
36/JNU OLE
Theproductstructureofmakingatruckmayberepresentedasshowninfg. 2.3using parent component relationships concept. The concept of the product level is usually associated with relatively complex assembled products, which contains many (typically six to ten) levels. The computation of net requirement proceeds in the direction from top to bottom of the product structure. We note that this procedure is laborious but it can’t be cut short. The net requirement on parent level must be determined before the net requirement on the component item level can be determined.
The downward progression from one product level to another is called an explosion. In executing the explosion, the task is to identify the component of a given parent item and to ascertain the location (address) from where they may be retrieved and processed.
Level 0
Level 1
Level 2
Level 3
Level 4
Level 5
Product ( truck )
Assembly ( Transmission )
Subassembly ( Gear- box)
Gear
Semifnishedpart(forgingblank)
Raw material ( Steel )
X
A
B
C
D
E
Fig. 2.3 Product structure for a truck(Source: http://site.ebrary.com/lib/utspune/docDetail.action?docID=10323336
&force=1&p00=modern+approach+to+operations+management)
Lot sizing:• It is the ordering of inventory items in quantities exceeding net requirements, for the reason of economy, or convenience. In the example given above the parent items A, B, and C have been assumed to be ordered in quantities equal to the respective net requirements for these items. But in reality, the lot sizing, wherever employed, would invalidate this assumption. It is because the gross requirement for a component derives directly from the (planned) order quantity of its parent(s).
Just-in-Time and Lean
37/JNU OLE
Lot sizing is a particular technique used to determine the order quantities for a given inventory item. The general rule of MRP logic states that: The mutual parent-component relationship of items on contiguous product levels dictates that the net requirement on the parent level, as well as its coverage by planned order, be computed before the gross requirement on component level can be correctly determined. An MRP system should include lot sizing as a part of the procedure.
Recurrence of requirements within planning horizon:• The timing of end-item requirements across a planning horizon of typically, a year span or longer, and recurrence of these requirements within such a time span also affect the material requirements. The planning horizon of the MRP usually covers a time span large enough to contain multiple (recurring) requirements for a given end item which also complicates the computation of component requirements.
2.4 Objectives of MRP System
The primary objective of this system is to determine gross and net requirements, i.e., discrete period demand for each item of inventory, so as to be able to generate information needed for correct inventory order action— an action of new type or a revision of previous action in procurement and shop orders. The essential data elements accompanying this action are:
Item identity (part number) •
Order quantity •
Date of order release •
Date of order completion (due date) •
Taking the above data, an analysis is made by MRP system for action that affects the system such as:
Increase in order quantity •
Decrease in order quantity•
Order cancellation •
Advancement of order due date •
Deferment of order due date •
Ordersuspension(indefnitedeferment)•
In any manufacturing operation, the questions of what materials and components are needed, in what quantities, and when-and the answer to these questions are vital. An MRP system is designed to provide just these answers. MRP provides the following:
Inventory reduction:• MRP determines how many of components are needed and when, in order to meet the master schedule.
Reduction in production and delivery lead time:• MRPidentifes materialsand components quantities, timings, availabilities, and procurement and production actions required to meet delivery deadlines. By coordinating
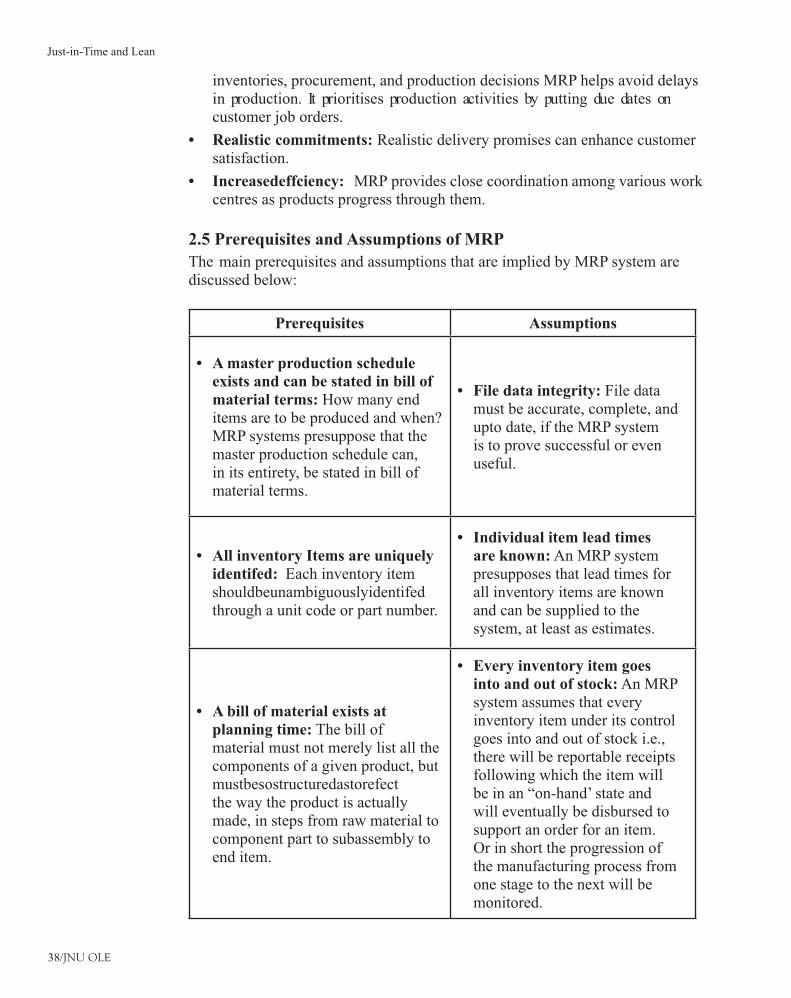
38/JNU OLE
inventories, procurement, and production decisions MRP helps avoid delays in production. It prioritises production activities by putting due dates on customer job orders.
Realistic commitments:• Realistic delivery promises can enhance customer satisfaction.
Increasedeffciency:• MRP provides close coordination among various work centres as products progress through them.
2.5 Prerequisites and Assumptions of MRP
The main prerequisites and assumptions that are implied by MRP system are discussed below:
Prerequisites Assumptions
A master production schedule •exists and can be stated in bill of material terms: How many end items are to be produced and when? MRP systems presuppose that the master production schedule can, in its entirety, be stated in bill of material terms.
File data integrity:• File data must be accurate, complete, and upto date, if the MRP system is to prove successful or even useful.
All inventory Items are uniquely •identifed: Each inventory item shouldbeunambiguouslyidentifedthrough a unit code or part number.
Individual item lead times •are known: An MRP system presupposes that lead times for all inventory items are known and can be supplied to the system, at least as estimates.
A bill of material exists at •planning time: The bill of material must not merely list all the components of a given product, but mustbesostructuredastorefectthe way the product is actually made, in steps from raw material to component part to subassembly to end item.
Every inventory item goes •into and out of stock: An MRP system assumes that every inventory item under its control goes into and out of stock i.e., there will be reportable receipts following which the item will be in an “on-hand’ state and will eventually be disbursed to support an order for an item. Or in short the progression of the manufacturing process from one stage to the next will be monitored.
Just-in-Time and Lean
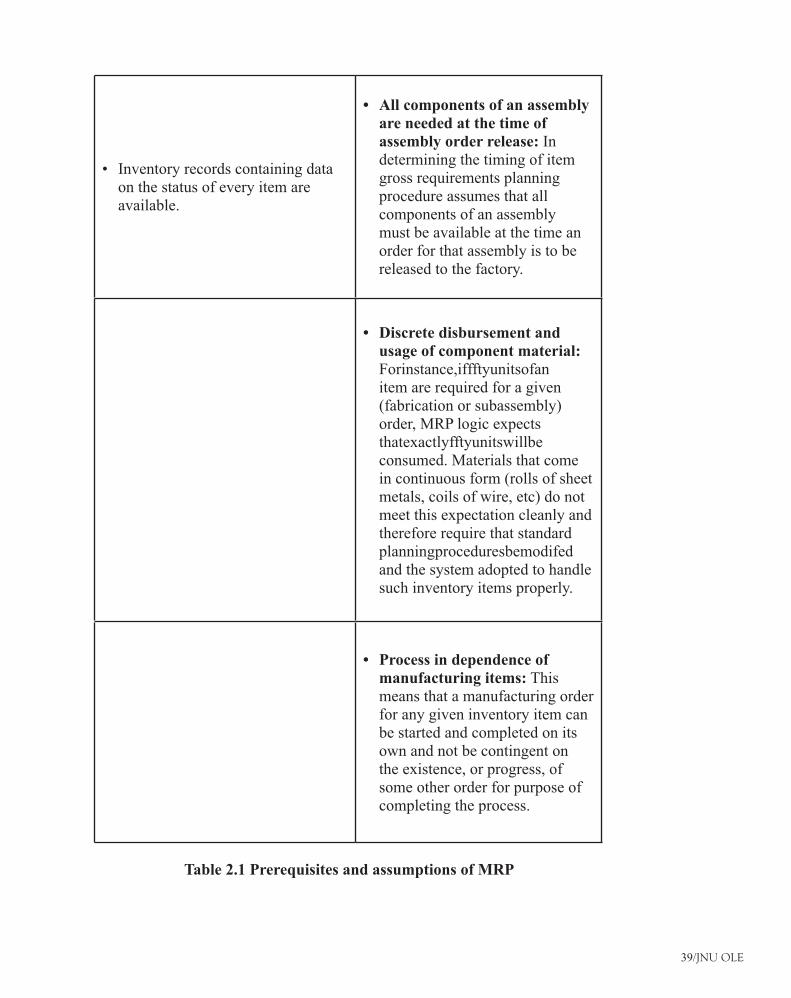
39/JNU OLE
Inventory records containing data •on the status of every item are available.
All components of an assembly •are needed at the time of assembly order release: In determining the timing of item gross requirements planning procedure assumes that all components of an assembly must be available at the time an order for that assembly is to be released to the factory.
Discrete disbursement and •usage of component material: Forinstance,iffftyunitsofanitem are required for a given (fabrication or subassembly) order, MRP logic expects thatexactlyfftyunitswillbeconsumed. Materials that come in continuous form (rolls of sheet metals, coils of wire, etc) do not meet this expectation cleanly and therefore require that standard planningproceduresbemodifedand the system adopted to handle such inventory items properly.
Process in dependence of •manufacturing items: This means that a manufacturing order for any given inventory item can be started and completed on its own and not be contingent on the existence, or progress, of some other order for purpose of completing the process.
Table 2.1 Prerequisites and assumptions of MRP
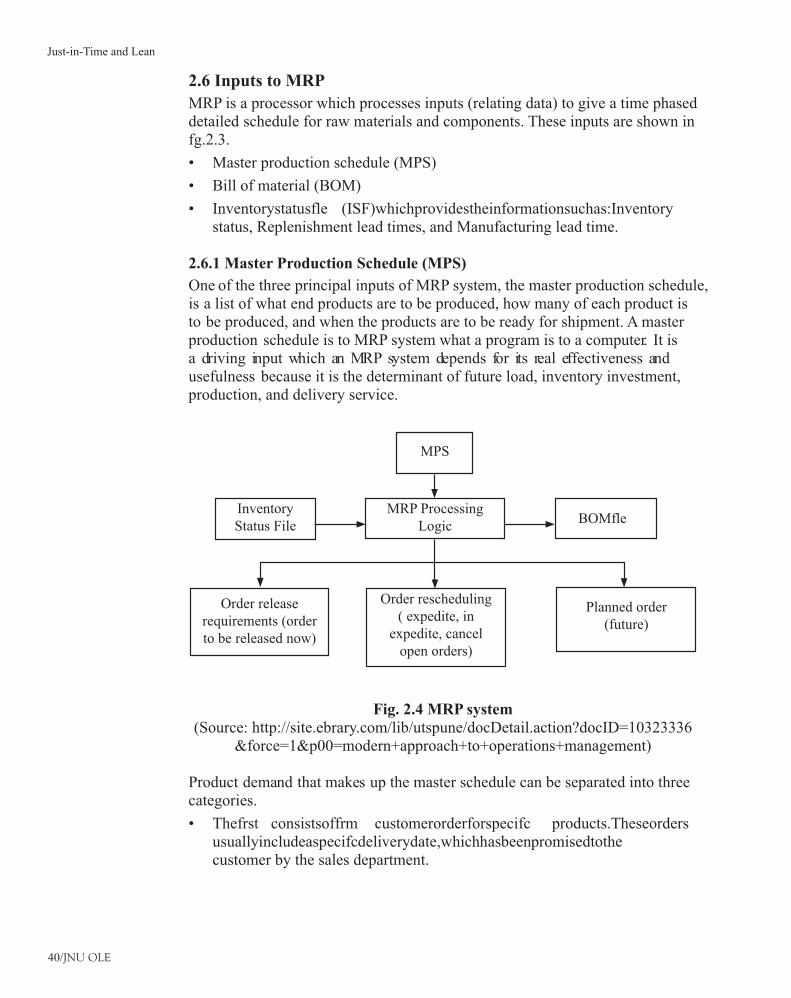
40/JNU OLE
2.6 Inputs to MRP
MRP is a processor which processes inputs (relating data) to give a time phased detailed schedule for raw materials and components. These inputs are shown in fg.2.3.
Master production schedule (MPS) •
Bill of material (BOM) •
Inventorystatusfle (ISF)whichprovidestheinformationsuchas:Inventory•status, Replenishment lead times, and Manufacturing lead time.
2.6.1 Master Production Schedule (MPS)
One of the three principal inputs of MRP system, the master production schedule, is a list of what end products are to be produced, how many of each product is to be produced, and when the products are to be ready for shipment. A master production schedule is to MRP system what a program is to a computer. It is a driving input which an MRP system depends for its real effectiveness and usefulness because it is the determinant of future load, inventory investment, production, and delivery service.
MPS
Inventory Status File
MRP Processing Logic
BOMfle
Order release requirements (order to be released now)
Order rescheduling ( expedite, in
expedite, cancel open orders)
Planned order (future)
Fig. 2.4 MRP system(Source: http://site.ebrary.com/lib/utspune/docDetail.action?docID=10323336
&force=1&p00=modern+approach+to+operations+management)
Product demand that makes up the master schedule can be separated into three categories.
Thefrst consistsoffrm customerorderforspecifc products.Theseorders•usuallyincludeaspecifcdeliverydate,whichhasbeenpromisedtothecustomer by the sales department.
Just-in-Time and Lean
41/JNU OLE
The second category is forecasted demand. Based on statistical techniques •applied to past demand, estimates provided by the sales staff, and other sources, thefrmwillgenerateaforecastofdemandforitsvariousproductlines.
The third category is demand for individual component parts, which will be •usedasrepairpartsandarestockedbythefrm’sservicedepartment.Thethirdcategory is excluded from the master schedule because it doesn’t represent demands for end products.
For the purpose of material requirements planning, the time periods of the master production schedule must be identical to those on which the MRP system is based. The sales forecast and the master production schedule that management and the marketing organisation use are often developed and stated in terms of months or quarters. They are also stated in terms of product models. The MPS must then be brokendownandrestatedintermsofweeksandspecifc end-itemnumbers.Theperiod of time that the master production spans is the planning horizon which maybedividedintoafrm portionandatentativeportion.Thefrm portionisdetermined by the cumulative (procurement and manufacturing) lead time.
2.6.2 Bill of Material (BOM)
Computation of the raw material and component requirements for end products listed in the master schedule is done by the product structure. The product structure isspecifed bythebillofmaterials,whichisalistingofcomponentpartsandsubassembliesthatmakeupeachproduct.Aflewhichlistsallassembliestogetheristhebill-of-materialsfle.Thestructureofanassembledproductcanbepicturedby taking a simple product in which a group of individual components make up two subassemblies, which in turn make up the product. The product structure is in the form of a pyramid in which lower level feeding into the levels above the items at each successively higher level are called the parents of the items in the level directly below.
2.6.3 Inventory Record File
It comprises the individual item inventory records containing the status data requiredforthedeterminationofnetrequirements.Thisfle iskeptupdatebythepositionof inventorytransactionswhich refectthe variousinventoryeventstaking place. Each transaction (stock receipt, disbursement, scrap, etc) changes the status of the respective inventory item.
In addition to the status data, the inventory records also contain so-called planning factors used principally for the size and timing of planned orders. Planning factors include item lead time, safety stock (if any), scrap allowance, lot-sizing algorithms, etc. The item lead time for raw materials, components and assemblies mustbeestablishedintheinventoryrecordfle inwhichtheorderingleadtimecan be determined from purchasing records and the manufacturing lead time can bedeterminedfromtheprocessroutesheets(orroutingfle).
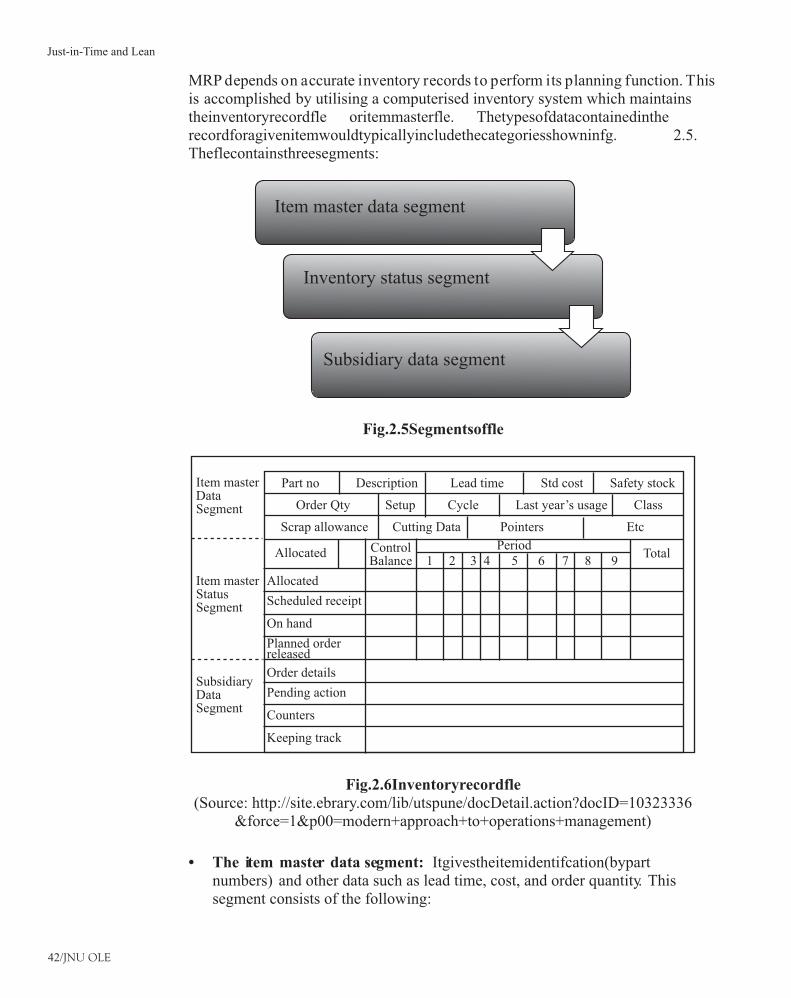
42/JNU OLE
MRP depends on accurate inventory records to perform its planning function. This is accomplished by utilising a computerised inventory system which maintains theinventoryrecordfle oritemmasterfle. Thetypesofdatacontainedintherecordforagivenitemwouldtypicallyincludethecategoriesshowninfg. 2.5.Theflecontainsthreesegments:
Item master data segment
Inventory status segment
Subsidiary data segment
Fig.2.5Segmentsoffle
Item master Data Segment
Part no Description Lead time Std cost Safety stock
Order Qty Setup Cycle Last year’s usage Class
Scrap allowance Cutting Data Pointers Etc
Allocated
Scheduled receipt
On hand
Planned order released
Order details
Pending action
Counters
Keeping track
Item master Status Segment
Subsidiary Data Segment
Allocated Control Balance
PeriodTotal
1 2 3 4 5 6 7 8 9
Fig.2.6Inventoryrecordfle(Source: http://site.ebrary.com/lib/utspune/docDetail.action?docID=10323336
&force=1&p00=modern+approach+to+operations+management)
The item master data segment:• Itgivestheitemidentifcation(bypartnumbers) and other data such as lead time, cost, and order quantity. This segment consists of the following:
Just-in-Time and Lean
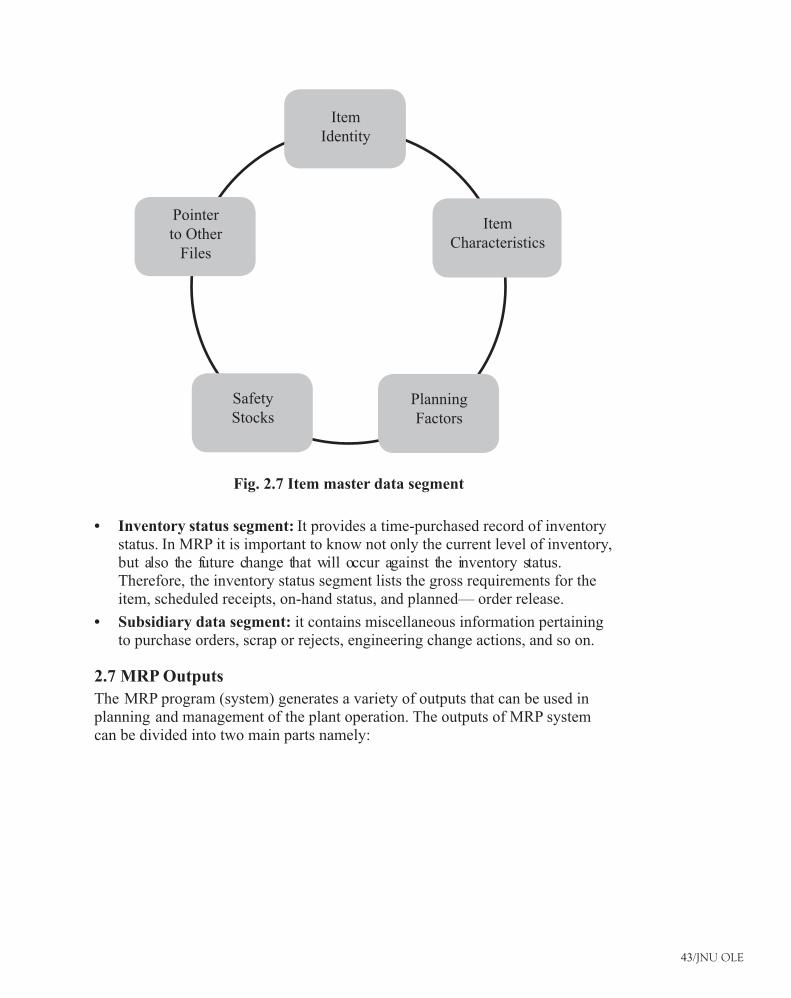
43/JNU OLE
Item Identity
Item Characteristics
Planning Factors
Safety Stocks
Pointer to Other
Files
Fig. 2.7 Item master data segment
Inventory status segment:• It provides a time-purchased record of inventory status. In MRP it is important to know not only the current level of inventory, but also the future change that will occur against the inventory status. Therefore, the inventory status segment lists the gross requirements for the item, scheduled receipts, on-hand status, and planned— order release.
Subsidiary data segment:• it contains miscellaneous information pertaining to purchase orders, scrap or rejects, engineering change actions, and so on.
2.7 MRP Outputs
The MRP program (system) generates a variety of outputs that can be used in planning and management of the plant operation. The outputs of MRP system can be divided into two main parts namely:
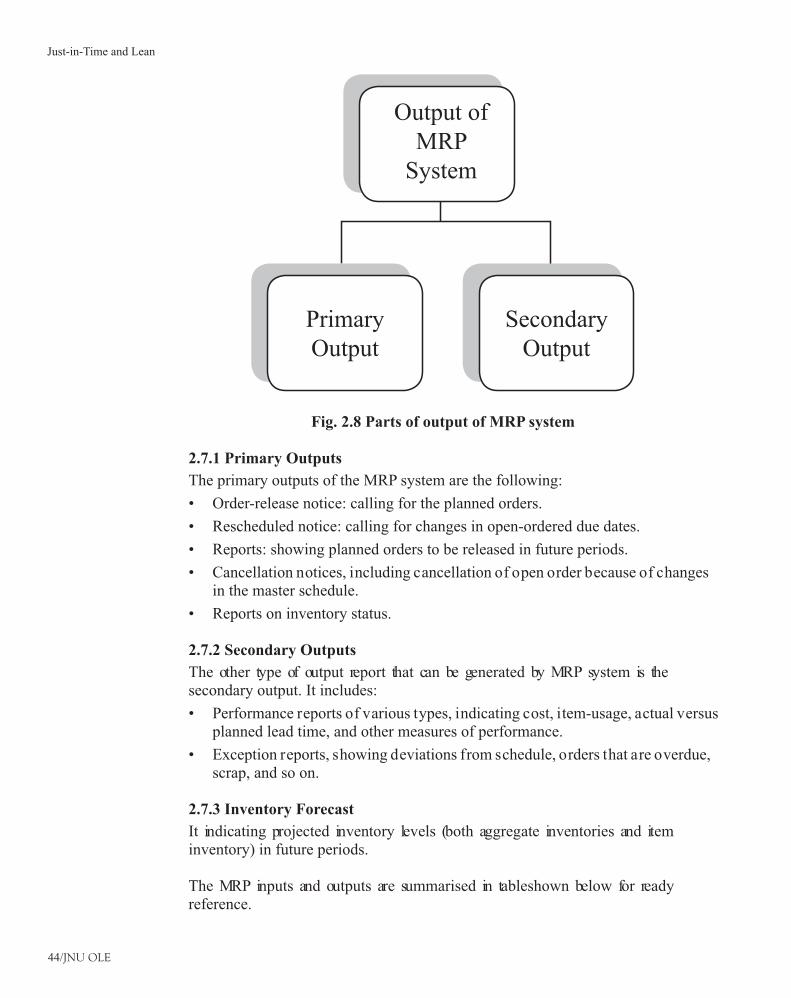
44/JNU OLE
Output of MRP
System
Primary Output
Secondary Output
Fig. 2.8 Parts of output of MRP system
2.7.1 Primary Outputs
The primary outputs of the MRP system are the following:
Order-release notice: calling for the planned orders. •
Rescheduled notice: calling for changes in open-ordered due dates. •
Reports: showing planned orders to be released in future periods. •
Cancellation notices, including cancellation of open order because of changes •in the master schedule.
Reports on inventory status.•
2.7.2 Secondary Outputs
The other type of output report that can be generated by MRP system is the secondary output. It includes:
Performance reports of various types, indicating cost, item-usage, actual versus •planned lead time, and other measures of performance.
Exception reports, showing deviations from schedule, orders that are overdue, •scrap, and so on.
2.7.3 Inventory Forecast
It indicating projected inventory levels (both aggregate inventories and item inventory) in future periods.
The MRP inputs and outputs are summarised in tableshown below for ready reference.
Just-in-Time and Lean
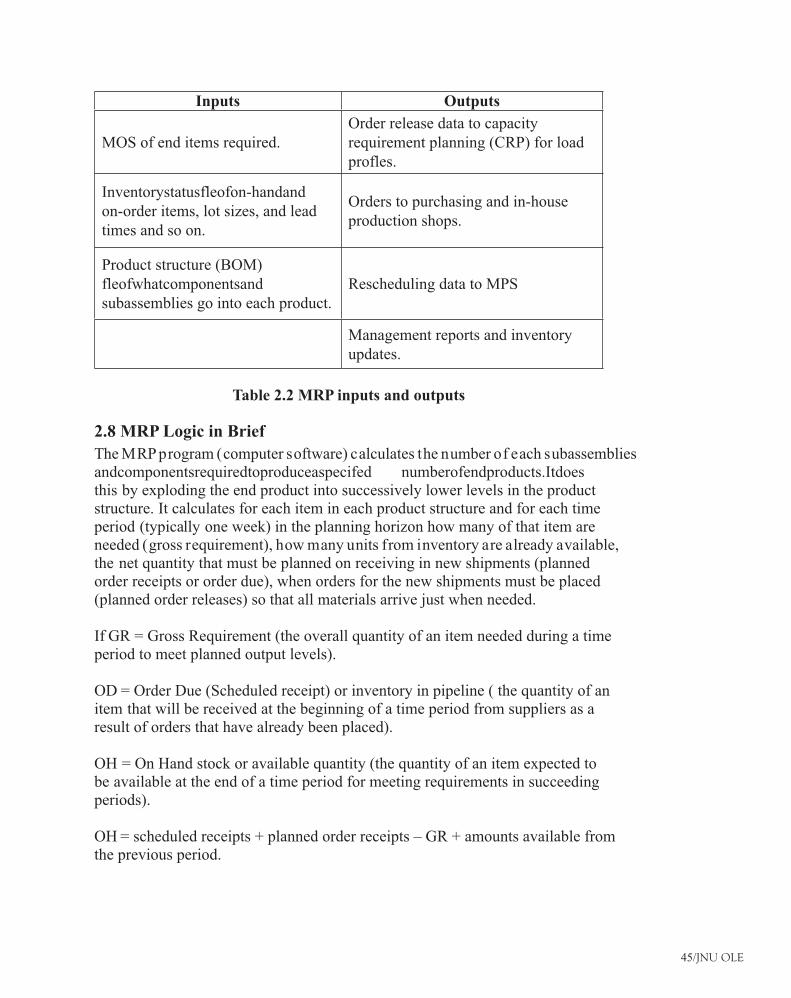
45/JNU OLE
Inputs Outputs
MOS of end items required.Order release data to capacity requirement planning (CRP) for load profles.
Inventorystatusfleofon-handandon-order items, lot sizes, and lead times and so on.
Orders to purchasing and in-house production shops.
Product structure (BOM) fleofwhatcomponentsandsubassemblies go into each product.
Rescheduling data to MPS
Management reports and inventory updates.
Table 2.2 MRP inputs and outputs
2.8 MRP Logic in Brief
The MRP program (computer software) calculates the number of each subassemblies andcomponentsrequiredtoproduceaspecifed numberofendproducts.Itdoesthis by exploding the end product into successively lower levels in the product structure. It calculates for each item in each product structure and for each time period (typically one week) in the planning horizon how many of that item are needed (gross requirement), how many units from inventory are already available, the net quantity that must be planned on receiving in new shipments (planned order receipts or order due), when orders for the new shipments must be placed (planned order releases) so that all materials arrive just when needed.
If GR = Gross Requirement (the overall quantity of an item needed during a time period to meet planned output levels).
OD = Order Due (Scheduled receipt) or inventory in pipeline ( the quantity of an item that will be received at the beginning of a time period from suppliers as a result of orders that have already been placed).
OH = On Hand stock or available quantity (the quantity of an item expected to be available at the end of a time period for meeting requirements in succeeding periods).
OH = scheduled receipts + planned order receipts – GR + amounts available from the previous period.
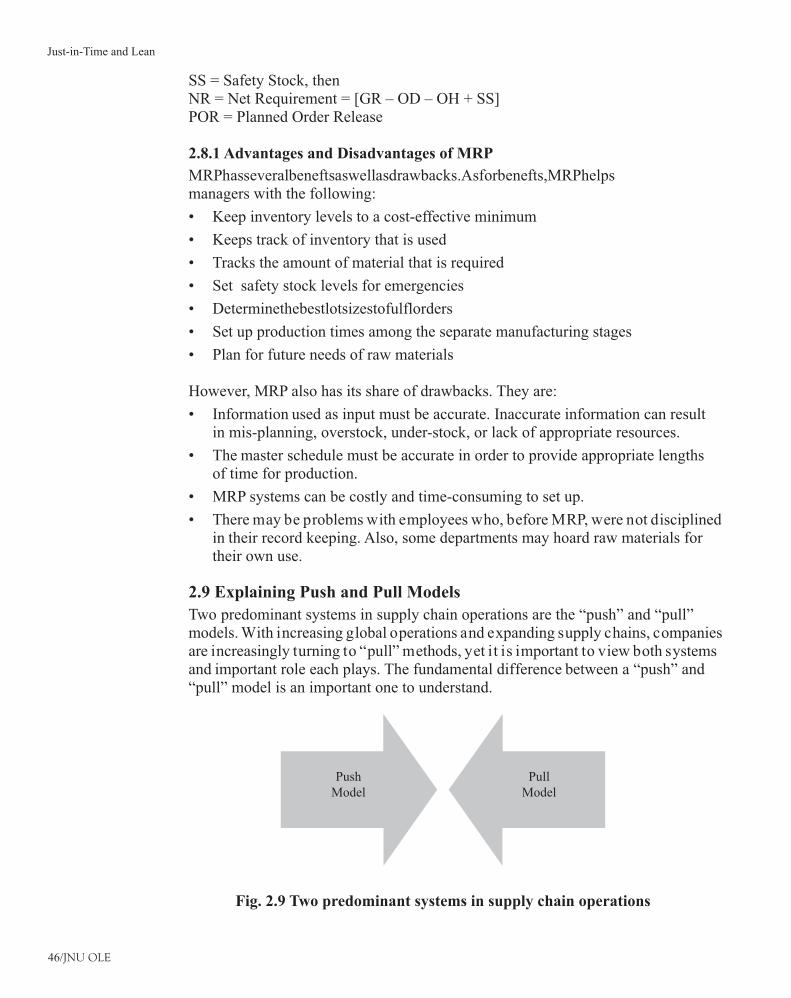
46/JNU OLE
SS = Safety Stock, then NR = Net Requirement = [GR – OD – OH + SS] POR = Planned Order Release
2.8.1 Advantages and Disadvantages of MRP
MRPhasseveralbeneftsaswellasdrawbacks.Asforbenefts,MRPhelpsmanagers with the following:
Keep inventory levels to a cost-effective minimum•
Keeps track of inventory that is used•
Tracks the amount of material that is required•
Set safety stock levels for emergencies•
Determinethebestlotsizestofulflorders•
Set up production times among the separate manufacturing stages•
Plan for future needs of raw materials•
However, MRP also has its share of drawbacks. They are:
Information used as input must be accurate. Inaccurate information can result •in mis-planning, overstock, under-stock, or lack of appropriate resources.
The master schedule must be accurate in order to provide appropriate lengths •of time for production.
MRP systems can be costly and time-consuming to set up.•
There may be problems with employees who, before MRP, were not disciplined •in their record keeping. Also, some departments may hoard raw materials for their own use.
2.9 Explaining Push and Pull Models
Two predominant systems in supply chain operations are the “push” and “pull” models. With increasing global operations and expanding supply chains, companies are increasingly turning to “pull” methods, yet it is important to view both systems and important role each plays. The fundamental difference between a “push” and “pull” model is an important one to understand.
Push Model
Pull Model
Fig. 2.9 Two predominant systems in supply chain operations
Just-in-Time and Lean
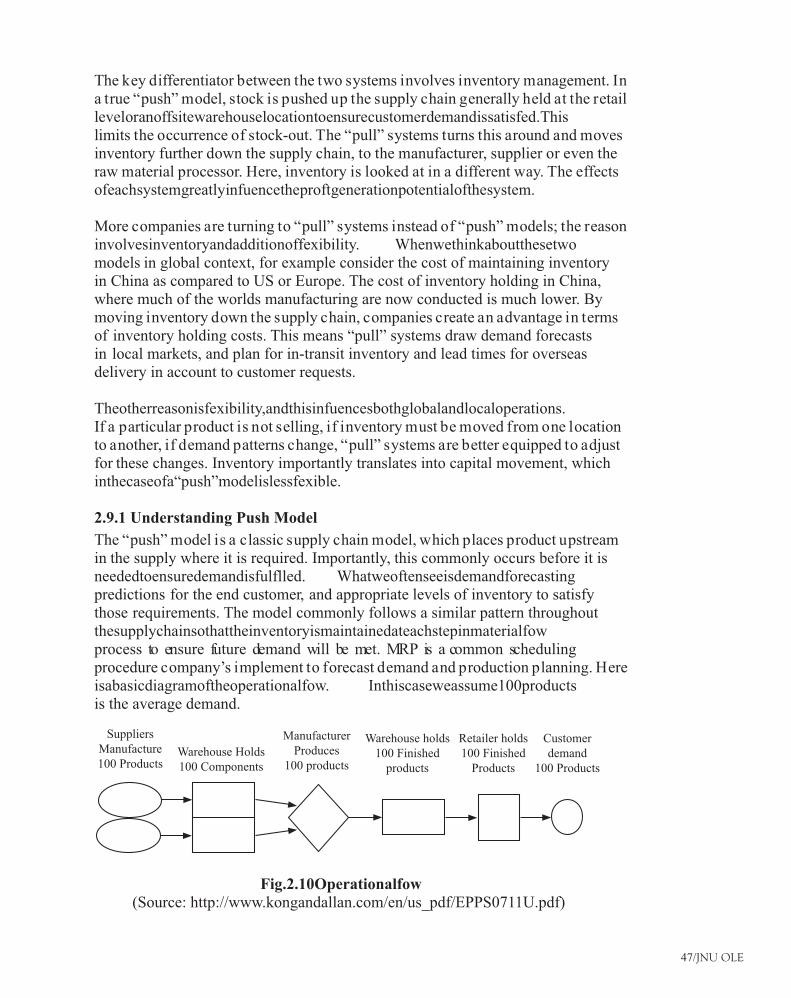
47/JNU OLE
The key differentiator between the two systems involves inventory management. In a true “push” model, stock is pushed up the supply chain generally held at the retail leveloranoffsitewarehouselocationtoensurecustomerdemandissatisfed.Thislimits the occurrence of stock-out. The “pull” systems turns this around and moves inventory further down the supply chain, to the manufacturer, supplier or even the raw material processor. Here, inventory is looked at in a different way. The effects ofeachsystemgreatlyinfuencetheproftgenerationpotentialofthesystem.
More companies are turning to “pull” systems instead of “push” models; the reason involvesinventoryandadditionoffexibility. Whenwethinkaboutthesetwomodels in global context, for example consider the cost of maintaining inventory in China as compared to US or Europe. The cost of inventory holding in China, where much of the worlds manufacturing are now conducted is much lower. By moving inventory down the supply chain, companies create an advantage in terms of inventory holding costs. This means “pull” systems draw demand forecasts in local markets, and plan for in-transit inventory and lead times for overseas delivery in account to customer requests.
Theotherreasonisfexibility,andthisinfuencesbothglobalandlocaloperations.If a particular product is not selling, if inventory must be moved from one location to another, if demand patterns change, “pull” systems are better equipped to adjust for these changes. Inventory importantly translates into capital movement, which inthecaseofa“push”modelislessfexible.
2.9.1 Understanding Push Model
The “push” model is a classic supply chain model, which places product upstream in the supply where it is required. Importantly, this commonly occurs before it is neededtoensuredemandisfulflled. Whatweoftenseeisdemandforecastingpredictions for the end customer, and appropriate levels of inventory to satisfy those requirements. The model commonly follows a similar pattern throughout thesupplychainsothattheinventoryismaintainedateachstepinmaterialfowprocess to ensure future demand will be met. MRP is a common scheduling procedure company’s implement to forecast demand and production planning. Here isabasicdiagramoftheoperationalfow. Inthiscaseweassume100productsis the average demand.
Suppliers Manufacture 100 Products
Warehouse Holds 100 Components
Manufacturer Produces
100 products
Warehouse holds 100 Finished
products
Retailer holds 100 Finished
Products
Customer demand
100 Products
Fig.2.10Operationalfow(Source: http://www.kongandallan.com/en/us_pdf/EPPS0711U.pdf)
48/JNU OLE
In most general sense, the “push” model literally pushes product upstream to ensure each customer in the supply chain has the product they need. Some common product segments we see the “push” model used in are household goods like bathing soap, toilet soap or commodity products such as oil or electricity. They are products, which in most cases we today cannot live without.
2.9.1.1 Advantages of “Push” Model
The advantages of the “push” model are found in risk reduction made possible •bymaintaininghigherinventorylevels.Incaseoflowproft margin,highvolume products, the cost of stock-out is high, as commonly customers will look to another immediately available option. Most consumers will purchase anothersimilarproductthatfulfls theirdemandrequirements.Thisistheprimary reason why particular companies utilise “push” models.
Another advantage of the “push” model is control and predictability for the •supply chain. Many companies have historically relied on the model for this reason. If demand for products such as bath soap is fairly stable, then the manufacturing and transportation process can be structured to closely control material movement and holding. Inventory is also much easier to manage, maintain and control as all that is needed is an optimal reorder point at which replenishmentoccurs.Thedownstreamproducestheproducttofulflthereplenishment requirements, and the model can be stabilised.
A last potential advantage for “push” models looks at transportation as an •economies of scale business. If in-transit inventory is shipped in larger quantities, then it is generally believed that the price per unit of shipment will be reduced. Here we consider a different type of inventory, in-transit inventory, withthesamepurposeofpreparingsatisfactoryproducttofulfl demand.Thegoal here however is to reduce the transportation and logistics cost per unit, the same cannot be said for warehoused inventory. In order to ensure that the “push” model is effectively managed, transportation consolidation and effciency mustbecloselymonitoredtoensureproft marginsarenotlost.Manyintheindustryhaverealisedthatgreatereffciencies canactuallybeachieved by reducing in-transit shipping levels.
2.9.1.2 Disadvantages of “Push” Model
The disadvantages of the ‘push” model are, high penalties in terms of lost •profts,andhigherinventoryholdingcosts,throughoutthesupplychain.Thinkabout obsolete products for example, with a “push” model, when a product becomes obsolete, the entire inventory must be sold at a large discount or taken as a loss. Commonly retailers face this problem at the end of a season, holiday peaks, or fashion season. In utilising a “push” model, the end seller can sometimes over predict demand, forcing the manufacturer to over produce, and the loss incurred comes from both clearing product below market price, and from cash liquidity loss from investing in excess inventory.
Just-in-Time and Lean
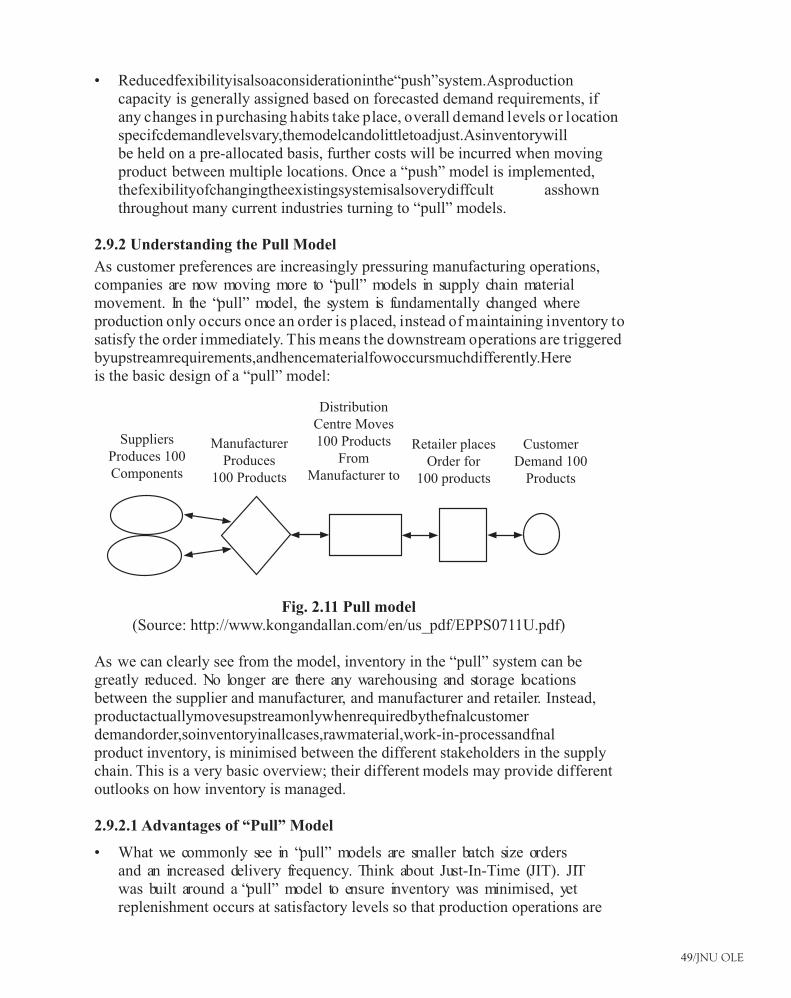
49/JNU OLE
Reducedfexibilityisalsoaconsiderationinthe“push”system.Asproduction•capacity is generally assigned based on forecasted demand requirements, if any changes in purchasing habits take place, overall demand levels or location specifcdemandlevelsvary,themodelcandolittletoadjust.Asinventorywillbe held on a pre-allocated basis, further costs will be incurred when moving product between multiple locations. Once a “push” model is implemented, thefexibilityofchangingtheexistingsystemisalsoverydiffcult asshownthroughout many current industries turning to “pull” models.
2.9.2 Understanding the Pull Model
As customer preferences are increasingly pressuring manufacturing operations, companies are now moving more to “pull” models in supply chain material movement. In the “pull” model, the system is fundamentally changed where production only occurs once an order is placed, instead of maintaining inventory to satisfy the order immediately. This means the downstream operations are triggered byupstreamrequirements,andhencematerialfowoccursmuchdifferently.Hereis the basic design of a “pull” model:
Suppliers Produces 100 Components
Manufacturer Produces
100 Products
Distribution Centre Moves 100 Products
From Manufacturer to
Retailer places Order for
100 products
Customer Demand 100
Products
Fig. 2.11 Pull model(Source: http://www.kongandallan.com/en/us_pdf/EPPS0711U.pdf)
As we can clearly see from the model, inventory in the “pull” system can be greatly reduced. No longer are there any warehousing and storage locations between the supplier and manufacturer, and manufacturer and retailer. Instead, productactuallymovesupstreamonlywhenrequiredbythefnalcustomerdemandorder,soinventoryinallcases,rawmaterial,work-in-processandfnalproduct inventory, is minimised between the different stakeholders in the supply chain. This is a very basic overview; their different models may provide different outlooks on how inventory is managed.
2.9.2.1 Advantages of “Pull” Model
What we commonly see in “pull” models are smaller batch size orders •and an increased delivery frequency. Think about Just-In-Time (JIT). JIT was built around a “pull” model to ensure inventory was minimised, yet replenishment occurs at satisfactory levels so that production operations are
50/JNU OLE
not slowed or delayed. With lower inventory, this means lower holding costs, increased resource availability in terms of manufacturing space, and greater capitalfexibility. Withreducedinventory,companiesgenerallyhavemorecash on hand or operational investments, process improvement projects and expansionary development.
Anotheradvantageofthe“pull”modelisanincreaseinfexibility.As•production is dictated directly by end customer orders, “pull” systems commonly allow a company the ability to adjust to demand changes and purchasing requirements. For example, if customers prefer one colour of car over another, the “pull” model is built to produce to the colour demands of aspecifc customer.Inthe“push”system,variouscoloursareallproducedat once and inventory is immediately moved to the dealer’s location. In this case,theriskassociatedwithunsoldcarsisgreatlyreducedbythefexibilitycreated in the “pull” model.
2.9.2.2 Disadvantages of “Pull” Model
Primary disadvantage of “pull” model is a higher probability of stock-out and •lower level of control. While considering a “pull” model, a company should always understand that if production is triggered by customer orders, then to minimise the lead time, in-transit inventory must satisfy the customer’s immediateneeds.Thismeansfnished productshouldalreadybeonitswayto the customer, when the customer order is placed. Herein lays the increased risk of stock-out.
Productmovementcontrolisalsomuchloweranddiffculttomanagein•a “pull” model. When inventory is maintained onsite, it is fairly easy to control.Wheninventoryismanagedin-transit,thediffculties arecommonlymultiplied and the predictability of delivery reduced. Distribution centres are a good example as once product enters the inbound docking it is immediately deconsolidated and then reconsolidated for outbound delivery. There is a high level of error that can take place in this process. At the same time, as in-transit inventoryishardertomonitor,companiesoftenhaveamorediffcult timetracking inventory levels. This occurs because they only focus on on-hand inventory, not including in-transit inventory. The control over the system must be managed in an entirely different way, and most companies face challenges here when moving from pre-existing models.
Both “push” and “pull” models have their place in current supply chain operations. Eachmodeltrulydependsontheproductcharacteristics,fexibilityrequired,demand variability, stock-out penalty, lead time, customer drivers and a whole range of other considerations. If appropriately used, these models can create incrediblyeffectiveoperationalmaterialfowsystemstominimisecostsandmaintainincreasingrevenueandproft generation.Ifhowever,transitionsoccurfrom one model to the other without understanding the direct implications and potential challenges, many systematic problems can occur increasing lead times and supply chain costs.
Just-in-Time and Lean
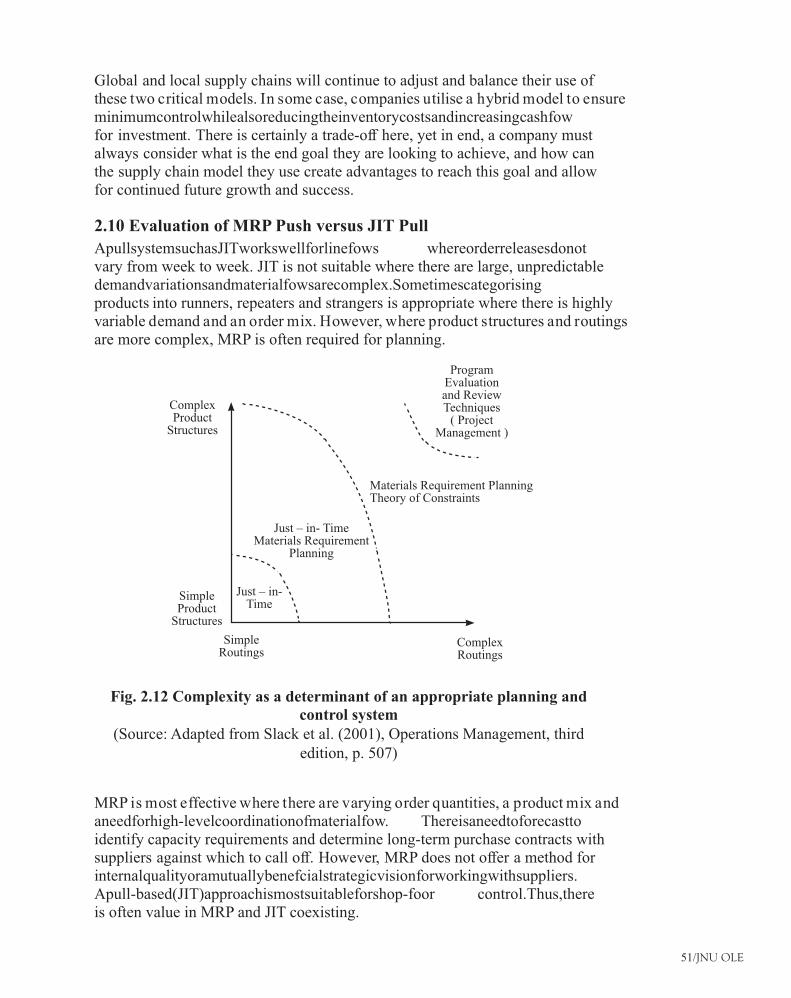
51/JNU OLE
Global and local supply chains will continue to adjust and balance their use of these two critical models. In some case, companies utilise a hybrid model to ensure minimumcontrolwhilealsoreducingtheinventorycostsandincreasingcashfowfor investment. There is certainly a trade-off here, yet in end, a company must always consider what is the end goal they are looking to achieve, and how can the supply chain model they use create advantages to reach this goal and allow for continued future growth and success.
2.10 Evaluation of MRP Push versus JIT Pull
ApullsystemsuchasJITworkswellforlinefows whereorderreleasesdonotvary from week to week. JIT is not suitable where there are large, unpredictable demandvariationsandmaterialfowsarecomplex.Sometimescategorisingproducts into runners, repeaters and strangers is appropriate where there is highly variable demand and an order mix. However, where product structures and routings are more complex, MRP is often required for planning.
Complex Product
Structures
Simple Product
Structures
Just – in- Time
Just – in- TimeMaterials Requirement
Planning
Materials Requirement PlanningTheory of Constraints
Program Evaluation and Review Techniques
( Project Management )
Simple Routings
Complex Routings
Fig. 2.12 Complexity as a determinant of an appropriate planning and control system
(Source: Adapted from Slack et al. (2001), Operations Management, third edition, p. 507)
MRP is most effective where there are varying order quantities, a product mix and aneedforhigh-levelcoordinationofmaterialfow. Thereisaneedtoforecasttoidentify capacity requirements and determine long-term purchase contracts with suppliers against which to call off. However, MRP does not offer a method for internalqualityoramutuallybenefcialstrategicvisionforworkingwithsuppliers.Apull-based(JIT)approachismostsuitableforshop-foor control.Thus,thereis often value in MRP and JIT coexisting.
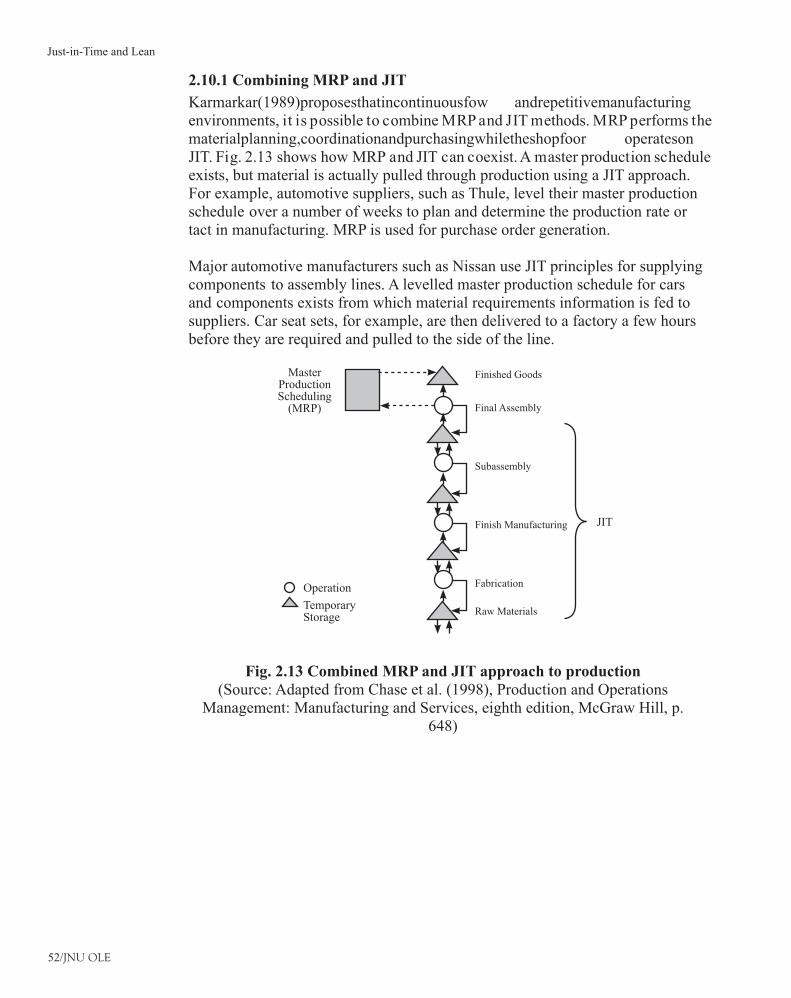
52/JNU OLE
2.10.1 Combining MRP and JIT
Karmarkar(1989)proposesthatincontinuousfow andrepetitivemanufacturingenvironments, it is possible to combine MRP and JIT methods. MRP performs the materialplanning,coordinationandpurchasingwhiletheshopfoor operatesonJIT. Fig. 2.13 shows how MRP and JIT can coexist. A master production schedule exists, but material is actually pulled through production using a JIT approach. For example, automotive suppliers, such as Thule, level their master production schedule over a number of weeks to plan and determine the production rate or tact in manufacturing. MRP is used for purchase order generation.
Major automotive manufacturers such as Nissan use JIT principles for supplying components to assembly lines. A levelled master production schedule for cars and components exists from which material requirements information is fed to suppliers. Car seat sets, for example, are then delivered to a factory a few hours before they are required and pulled to the side of the line.
Master Production Scheduling
(MRP)
Finished Goods
JIT
Final Assembly
Subassembly
Finish Manufacturing
FabricationOperation
Raw MaterialsTemporary Storage
Fig. 2.13 Combined MRP and JIT approach to production(Source: Adapted from Chase et al. (1998), Production and Operations
Management: Manufacturing and Services, eighth edition, McGraw Hill, p. 648)
Just-in-Time and Lean
53/JNU OLE
Summary
MRP is a computer based technique to determine the quantity and timing •for the acquisition of dependent demand items needed to satisfy the master production schedule (MPS) requirement.
Based on the manner the materials managers react to inventory situation, there •could be two types of inventory systems: reactive and planning
Reactive systems are simpler to manage in many respects but have serious •drawbacks like high inventory costs and unreliable delivery performance.
Demand dependency is an important consideration in choosing between •reactive and planning systems. It is the degree to which the demand for some item is associated with the demand for another item.
Gross requirement is the projected need for raw materials, components, •subassemblies,orfnishedgoodsbytheendoftheperiodshown.
Scheduled receipts are materials already on order from a vendor or in-house •shop due to be received at the beginning of the period.
The quantity expected to be received by the beginning of the period in which it •is shown under lot-for-lot ordering; this quantity will equal net requirement.
Independent demand exists when a demand for a particular item is unrelated •to a demand for other item or when it is not a function of demand of other inventory item.
Dependentdemandisdefnedasdependentifthedemandofanitemisdirectly•related to, or derived from the demand of another item or product.
Thecomponentsofafnished productareneededonlywhentheproductis•being manufactured. Thus, there may be large demands on inventory at some times and none at other times, making the demand ‘lumpy’. When the demand occurs in large steps, it is referred to as “lumpy demand.”
The lead-time for a certain job is the time that must be allowed to complete the •jobfromstarttofnish. Inmanufacturing,lead-timeisdividedintoorderinglead-time and manufacturing lead-time.
Time phasing means adding the time dimension to inventory status data by •recording,andstoringtheinformationoneitherspecifc datesorplanningperiods with which the respective quantities are associated.
Product structure imposes the principal constraint on the computation of •requirements, due to its content of several manufacturing levels of materials, component parts, and subassemblies.
Lot sizing is the ordering of inventory items in quantities exceeding net •requirements, for the reason of economy, or convenience.
The inputs to MRP are: master production schedule, Bill of material, and •inventorystatusfle.
The master production schedule is a list of what end products are to be •produced, how many of each product is to be produced, and when the products are to be ready for shipment.
54/JNU OLE
Theproductstructureisspecifed bythebillofmaterials,whichisalistingof•componentpartsandsubassembliesthatmakeupeachproduct.Afle whichlistsallassembliestogetheristhebill-of-materialsfle.
Inventoryrecordflecomprisestheindividualiteminventoryrecordscontaining•the status data required for the determination of net requirements.
The MRP program (system) generates a variety of outputs that can be used in •planning and management of the plant operation. The outputs of MRP system can be divided into two main parts: primary output, and secondary output
The “push” model is a classic supply chain model, which places product •upstream in the supply where it is required. Importantly, this commonly occurs beforeitisneededtoensuredemandisfulflled.
In the “pull” model, the system is fundamentally changed where production •only occurs once an order is placed, instead of maintaining inventory to satisfy the order immediately. This means the downstream operations are triggered by upstreamrequirements,andhencematerialfowoccursmuchdifferently.
ApullsystemsuchasJITworkswellforlinefowswhereorderreleasesdonot•vary from week to week. JIT is not suitable where there are large, unpredictable demandvariationsandmaterialfowsarecomplex.
References
velaction.com, 2010. • Lean term: Push System [pdf] Available at: <http://www.velaction.com/push-system-lean-pdf/> [Accessed 6 July 2011].
askdeb.com, 2011. • MRP Inventory Management [Online] Available at: <http://www.askdeb.com/inventory-management/mrp/> [Accessed 6 July 2011].
riramb2011, 2008. • Push vs. Pull [Video Online] Available at: <http://www.youtube.com/watch?v=688wwU9F-xc&NR=1> [Accessed 6 July 2011].
javiermasini, 2009. • Push vs. Pull [Video Online] Available at: <http://www.youtube.com/watch?v=Y_OOE8Dz7NI> [Accessed 6 July 2011].
Russell, R., 2010. • Operations Management: Creating Value Along the Supply Chain. 7th ed., Wiley
Heizer, J., 2010. • Operations Management. 9th ed., Prentice Hall
Recommended Reading
Basu, R., 2005. • Total Operations Solutions. Butterworth-Heinemann.
Brown, S. 2000. • Strategic Operations Management . Butterworth-Heinemann.
Dennis, P., 2002. • Lean Production Simplifed: A Plain-Language Guide to the World’s Most Powerful Production System. Productivity Press.
Just-in-Time and Lean
55/JNU OLE
Self Assessment
_________is a particular technique used to determine the order quantities for 1. a given inventory item.
MRPa.
Lot sizingb.
Bills of materialc.
JITd.
Which of the following statements if false?2. MRP is a common scheduling procedure company’s implement to forecast a. demand and production planning
The MRP program (system) generates a variety of inputs that can be used b. in planning and management of the plant operation.
Manufacturing lead time is the time needed to process the part through the c. sequenceofmachinesspecifedontheroutesheet.
Manufacturing is frequently done on an intermittent basis in lots, or models, d. of one type or another.
The downward progression from one product level to another is called 3. _______.
eventa.
movementb.
explosionc.
evidenced.
WhichofthefollowinglinefowisnotsuitableforJIT?4. wheretherearelarge,unpredictabledemandvariationsandmaterialfowsa. are complex
wherethereisaneedforhigh-levelcoordinationofmaterialfowb.
where order releases do not vary from week to weekc.
where product structures and routings are more complexd.
What is involved as a key differentiator between the “push” and “pull” 5. systems?
manufacturinga.
demandb.
inventory managementc.
materialfowd.
56/JNU OLE
Productmovementcontrolisalsomuchloweranddiffcult tomanageina6. ______model.
pusha.
pullb.
material requirement planningc.
bills of materiald.
Which of the following statements if true?7. Independent demands are derivable from the demand of something else a. hence they must be forecast.
MRP is the appropriate technique for determining quantities of dependent b. demand item.
The lead-time for a certain job is the time that must be allowed to complete c. in pieces.
In manufacturing, one raw material is often used to produce one component d. type.
A pull-based (JIT) approach is most suitable for _________control.8. inventorya.
manufacturingb.
movementc.
shop-foord.
In manufacturing, lead-time is divided into ________lead-time and 9. manufacturing lead-time.
totala.
movementb.
planningc.
orderingd.
__________is an important consideration in choosing between reactive and 10. planning systems.
lead-timea.
demand dependencyb.
lumpy demandc.
gross requirementd.
Just-in-Time and Lean
57/JNU OLE
Chapter III
Just-In-Time (JIT) and Competitive Advantage
Aim
The aim of this unit is to:
elucidate the relationship between JIT and competitive advantage•
enlist the advantages of JIT•
discuss the JIT contribution to competitive advantage•
Objectives
The objectives of this unit are to:
highlight the advantages of material requirement planning (MRP)•
identify the disadvantages of JIT•
explain the implementation barriers of just-in-time•
Learning outcome
At the end of this unit, you will be able to:
compare JIT and MRP•
enlist the advantages and disadvantages of JIT •
understand• the limitation of material requirement planning (MRP)
58/JNU OLE
3.1 Relationship between JIT and Competitive Advantage
Just-In-Time can offer organisations a competitive advantage which can take the form of offering consumers higher quality products than those offered by the rival frms,orprovidingasuperiorserviceordevelopingasuperiormeansofproductionwhichallowstheorganisationtobecomeincreasinglyeffcient orproductive.Lubben (1988) suggests three ways in which JIT can assist management in obtaining a competitive advantage.
Integrating and optimising: • This involves reducing the operations and resources which do not facilitate production.
Improving continuously:• This involves continually trying to improve processes and systems.
Understanding the customer:• This entails reducing the cost of products and satisfying consumer needs.
3.1.1 JIT Contribution to Competitive Advantage
JIT contribution to the competitive advantage involves the following areas:SuppliersJust as employees are required to change, so are the company’s suppliers. Under JIT, suppliers are treated in the same was as internal work centres. Suppliers receive Kanban cards and special containers, and they are expected to make frequent deliveries just in time for the next production stage. Suppliers are viewed as external factory and as part of the production team.
With a JIT system, several deliveries might be made each day, provided the supplier is located in the same vicinity. Suppliers located at a distance may have local warehouses where they receive bulk shipments and then break them down for frequent deliveries to the customer. This is not desirable, however, since too much inventory builds up in the pipeline and reaction time is too long. Local suppliers with short lead ties are preferred.
With the JIT system there is a tendency to use fewer suppliers. This is done to establish a long-term relationship with the supplier and to ensure the quality of parts needed. A complete reversal of thinking is needed here since we would ordinarily assume that fewer suppliers might price-gouge the customer, and more sources are needed to keep the suppliers honest. Supplier’s prices, however, can be kept in line with long-term contracts that include negotiated price stability. This requires a totally different type of supplier-customer relationship than the one in past.
Layout and equipmentInstallation of a JIT system has a natural effect on layout and equipment. The plant evolvestowardamorestreamlinedfowandautomatedplantbecauselotsizesarereduced and problems are constantly resolved making automation possible.
Just-in-Time and Lean
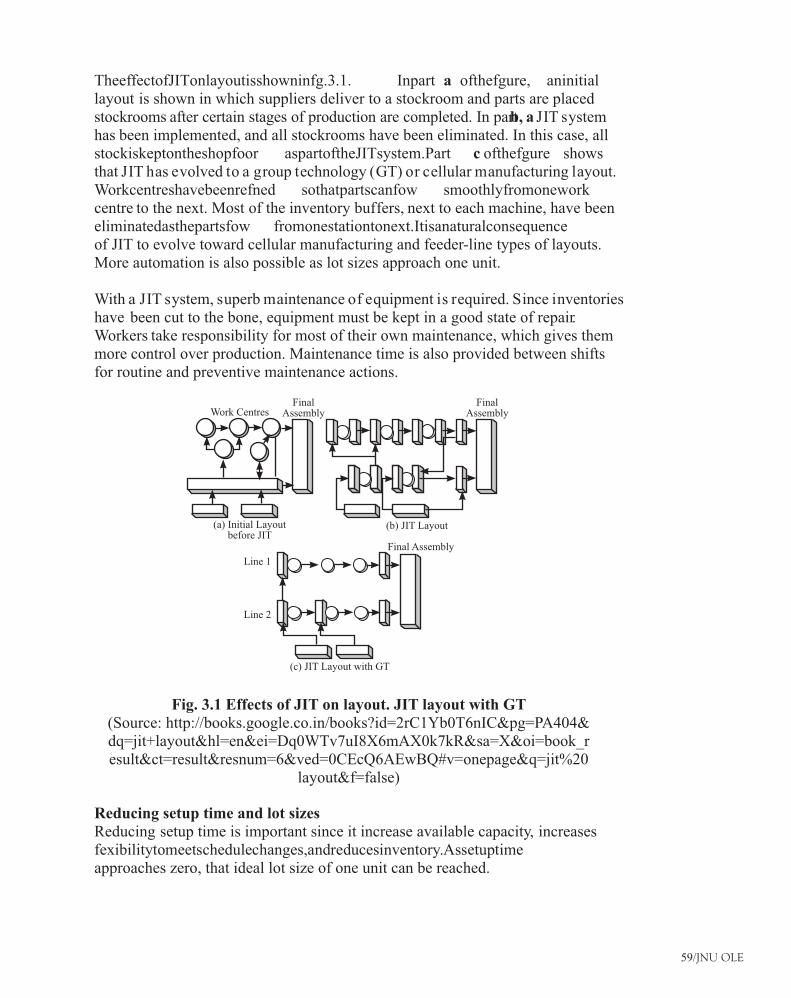
59/JNU OLE
TheeffectofJITonlayoutisshowninfg.3.1. Inpart a ofthefgure, aninitiallayout is shown in which suppliers deliver to a stockroom and parts are placed stockrooms after certain stages of production are completed. In part b, a JIT system has been implemented, and all stockrooms have been eliminated. In this case, all stockiskeptontheshopfoor aspartoftheJITsystem.Part c ofthefgure showsthat JIT has evolved to a group technology (GT) or cellular manufacturing layout. Workcentreshavebeenrefned sothatpartscanfow smoothlyfromoneworkcentre to the next. Most of the inventory buffers, next to each machine, have been eliminatedasthepartsfow fromonestationtonext.Itisanaturalconsequenceof JIT to evolve toward cellular manufacturing and feeder-line types of layouts. More automation is also possible as lot sizes approach one unit.
With a JIT system, superb maintenance of equipment is required. Since inventories have been cut to the bone, equipment must be kept in a good state of repair. Workers take responsibility for most of their own maintenance, which gives them more control over production. Maintenance time is also provided between shifts for routine and preventive maintenance actions.
Work CentresFinal
AssemblyFinal
Assembly
Final Assembly
(a) Initial Layout before JIT
(b) JIT Layout
(c) JIT Layout with GT
Line 1
Line 2
Fig. 3.1 Effects of JIT on layout. JIT layout with GT(Source: http://books.google.co.in/books?id=2rC1Yb0T6nIC&pg=PA404&dq=jit+layout&hl=en&ei=Dq0WTv7uI8X6mAX0k7kR&sa=X&oi=book_result&ct=result&resnum=6&ved=0CEcQ6AEwBQ#v=onepage&q=jit%20
layout&f=false)
Reducing setup time and lot sizesReducing setup time is important since it increase available capacity, increases fexibilitytomeetschedulechanges,andreducesinventory.Assetuptimeapproaches zero, that ideal lot size of one unit can be reached.
60/JNU OLE
In conventional repetitive production, we have concentrated on reducing run times per unit and more or less ignored setup time. When long runs of thousands of units are anticipated, run times naturally are more important than setup times. A better solution is to concentrate on reducing both setup times and run times. This requires additional attention by engineers, managers, and workers to setup process itself. Since setup time has received so little attention, phenomenal reductions are possible.
Single setups are being sought in many companies. Single setup refers to a setup time having a single digit in minutes. One-touch setups are also being pursued, which refers to a setup of less than 1 minute. These low setup times can be achieved by two steps. First, external and internal setups are separated. The term “internal setup” refers to actions that require the machine to be stopped, while “external setup” can be done while the machine is operating.
After separating internal and external setups, many setups are converted from internal and external. For example, race cars are quickly fuelled, tires are changed, and the windshields washed in short pit stops by highly coordinated and trained pit crews. Reducing setup times, lot sizes, and lead times is the engine that drives JIT. These reductions make it possible to remove Kanban cards and thus decrease inventory on a continual basis.
Effect on workersOne of the critical things needed to make a JIT system work is multifunction workers. In most cases, each worker must be able to operate several machines in a group, to make the parts required. Since parts are not produced unless they are needed, the worker must be able to shut off the machine and move to another job where parts are needed. The worker must also be able to set up machines, do routine maintenance, and inspect the parts. This ordinarily requires workers who are cross-trained in several skills.
Movingtowardafexible workforcemayrequirechangingthewayworkersarepaid and rewarded. Traditional pay systems are often based on seniority and job skill level. New pay systems are needed that reward workers on the basis of the number of different jobs they can perform. This will encourage workers to learn differentskillsandbecomemorefexible.Special efforts are needed to use JIT in a union environment. Labour unions often areorganisedalongskillorcraftlines,andtheydonottendtoencouragefexibilityin the workforce. As a result, management will need to work closely with unions to develop the kind of workforce needed for JIT.
Methods are needed to engage the workers and engineers actively in problem solving activities. In JIT systems, quality teams and suggestion systems are used for this purpose. An environment of participation must be created in order togetallemployeestocontributetowardproblemsolvingontheshopfoor.
Just-in-Time and Lean
61/JNU OLE
JIT cannot be implemented without full worker understanding and cooperation. Management must ensure that workers understand their new roles and accept the JIT approach to manufacturing. So, many changes are required, as indicated above, that JIT cannot possibly succeed without the active and enthusiastic support of all managers, the HR function, and employees. JIT is not simply another program but a whole new approach to manufacturing.
3.2 Main Advantage of Material Requirement Planning (MRP) and Just-In-Time (JIT)
MRPandJITeachhavebenefts. Mostofthemajormanufacturingfrms useMRP.Amongthefrms usingMRP,manyrepetitivemanufacturingalsouseJITtechniques. Although JIT is best suited to repetitive manufacturing, MRP is used in everything from custom job shops to assembly-line production. A challenge arisesinintegratingtheshop-foor improvementapproachesofJITwithanMRP-based planning and control system. The MRP and JIT combination creates what might be considered a hybrid manufacturing system. MRP takes forecasts for end product demand into account. In an environment in which substantial variation of sales are anticipated, MRP has a substantial advantage.
The emphasis on both MRP and JIT is for the reduction of waste in the production process. Both systems achieve improvements in inventory levels. It is the intent of MRP and JIT systems to prevent lost production time, although MRP is more responsivetofuctuationsinproductionasitisachange-basedsystem.Productionunder the JIT system may be hampered by lack of capacity if unexpected orders are received.
3.3 MRP and JIT Comparison
MRP and JIT (materials resource planning and just in time processing) are two methods of controlling production and inventory levels for manufacturers. MRP focusesonproductionoffnished goodsbasedonforecastrequirements,whileJIT focuses on production as a response to actual orders. Both MRP and JIT rely heavily on computerised information processing.
Materials resource planning is a comprehensive system of raw materials ordering and production scheduling of equipment and manpower based on forecast orders. It incorporates changes to orders into its scheduling process to produce a dynamic production schedule. MRP embraces the concept of dependent demand: forexample,ifproductionoffnished productArequiresthreeunitsofproductB, and production of product B in turn requires four units of product C and six ofproductD,thenaproductionlevelofaspecifc numberofunitsofproductArequires all the corresponding units of products B, C, and D to reach completion. For a complicated manufacturing process that includes many components, an advantage of MRP is its ability to successfully organize the production of each component so parts are ready when needed and the production process doesn’t stallforlackoffnishedcomponents.
62/JNU OLE
In contrast, JIT is a manufacturing process that responds to actual orders. It relies on the timely delivery of exactly the right raw materials in the right place to allow for production as orders are received. An advantage of JIT is its reduction of the amountofrawmaterialandfnished goodsonhand,whichcanreducecarryingcosts and the likelihood of spoiled or damaged inventory. It focuses on accurate production and leaves little room for production errors. A disadvantage of JIT is that if suppliers fail to deliver raw material as scheduled, a halt in production can occur because of the limited inventory in stock.
Different goals of MRP and JIT mean that each system works better under certain conditions. MRP is well-suited to a production line that operates on a batch or special order basis. The system’s ability to constantly adjust for changing requirements makes it react well to variable orders. The JIT system works well in an environment of repetitive orders of similar products. Suppliers can more easily respond to prompt delivery schedules for routine orders of similar materials.
3.4 Advantages and disadvantages of JIT and MRP
The advantages and disadvantages of JIT and MRP are as under.
3.4.1 Advantages of JIT
Advocates of JIT claim it is a revolutionary concept that all manufacturers will have to adopt in order to remain competitive. JIT encompasses the successful execution of all production activities required to produce a product, from designing todelivery.Itsbeneftsaremany:
Shortens lead time•
Reduces time spent on non-process work•
Eliminates waste and rework and consequently reduces requirements for raw •materials, person, power and machine capacity.
Increases worker motivation and teamwork•
Reduces inventory. As a result:•frees up working capital for other projects ?
less space is needed ?
customer responsiveness increases ?
Reduces or eliminates setup times•
Reduces lot sizes (manufacturing and purchase): Reducing setup times allows •economical production of smaller lots; close cooperation with suppliers is necessary to achieve reductions in order lot sizes for purchased items, since this will require more frequent deliveries.
Problemclarifcation•
Cost savings•Materials cost savings ? : Materials cost savings is basically the reduction of costs incorporated with purchasing, receiving, inspection, and stockroom costs. Elements in Materials Cost Saving are:
Just-in-Time and Lean
63/JNU OLE
reduction of suppliers-
long-term contracts-
reduce order scheduling-
simplify receiving systems-
eliminate unpacking-
eliminate inspection-
eliminate inventory stocking-
eliminate excess material-
Manufacturing cost savings ? :Manufacturingcostsavingsidentifessavingin the engineering, production, and the quality control activities. A major part of manufacturing cost savings is keeping a high level of quality; quality reduces cost and increases revenue.
Sales cost savings: Sales cost saving comes in the form of reducing overlap ?between the supplier and the customer, which is inspection and testing. The mosteffectivesituationthatthesalesdepartmentcanestablishisfndingcustomers that also use JIT systems.
Total product cycle time drops•
Product quality improves•
Reduces scrap and rework•
Smootherproductionfow•
Lessinventoryofrawmaterials,work-in-progressandfnishedgoods.•
Higher productivity•
Higher worker participation•
More skilled workforce, able and willing to switch roles•
Reduced space requirement•
Improved relationships with suppliers•
3.4.2 Disadvantages of JIT
There are often a number of diadvantages that also have to be overcome to achieve thefnalgoal.
The JIT method demands a much disciplined assembly-line process. The entire •factory has to be in sync to successfully exploit its methods. Manufacturers can afford fewer errors in the delivery of the supplier’s component; if a part isn’t there, the assembly line stops, and that can result in the loss of manpower and cash.
Changes in production planning, inaccurate forecasting procedures resulting •in under or over forecasting of demand, equipment failures creating capacity problems and employee absenteeism all create problems in implementing JIT.
64/JNU OLE
JIT requires special training and the reorganisation of policies and •procedures.
Theorganisationalculturesvaryfromfrmtofrm.Therearesomeculturesthat•tietoJITsuccessbutitisdiffcult foranorganisationtochangeitscultureswithin a short time.
Resistance to change: JIT involves a change throughout the whole organisation, •but human nature resists changing. The most common resistances are emotional resistance and rational resistance. Emotional resistances are those psychological feeling which hinder performance such as anxiety. Rational resistanceisthedefcientoftheneededinformationfortheworkerstoperformthe job well.
JITrequiresworkerstobemulti-skilledandfexibletochange.•
3.4.3 Limitations and Advantages of MRP
An MRP system provides tight and accurate control over the many complex and interdependent activities of the plant. All activities are synchronised such that parts are being manufactured (or received from vendors, if purchased) exactly when they are needed for the next stage of production. This system avoids the problems of excess work-in-process (WIP) inventory, unavailability of components when needed, grossly uneven utilization of resources, and so on.
3.5 Limitations and Implementation Barriers of JIT
LimitationsandimplementationbeneftsofJIT areasfollows:
AttitudesJIT requires a cooperative, participative spirit between managers, workers, suppliers, and their customers. It also requires long term-commitment by top management, as well as trust and mutual respect between managers and workers, and between customers and suppliers. Such concepts are foreign in some companies and industries; to accept them would be nothing short of revolution.
In traditional plants frontline workers are given limited, singular responsibility for assembling parts or running machines. Contrast to this the JIT workers also have the responsibility for continuous improvement. Quality problems and waste arise from many sources and it is impossible to get to all of them without substantial worker involvement. Broadened worker involvement results from a transfer of responsibilities and authority from support staff, supervisors, and managers to frontline workers. The transfer is successful only when staff, supervisors, and managers accept the proposition that workers are capable of handling more authority and that their handling of it is good for the company. The workers too must accept this concept. In companies where resistance change is widespread and insurmountable, JIT will fail. In companies where such concepts are widely accepted,thefewworkersandmanagerswhoremainopposedandfexible willeither quit or have to be terminated.
Just-in-Time and Lean
65/JNU OLE
JIT is a team-oriented philosophy, and in that regard it is very much like TQM. In JIT organisations, teams of workers, cross-functional staff, suppliers and customers are involved in all kinds of projects such as waste reduction, workcell improvement, product and process design, setup reduction, and supplier and customer relations. Every area of the organisation is affected, and managers and workers who are unwilling to break down traditional walls between areas and with workers and suppliers will be incapable of implementing JIT.
Time commitmentMostJITprogramstaketimetoshowbenefts, especiallyfnancial benefts. Inone study of companies implementing JIT, 59% indicated they were still 6 months to 3 years from full implementation, and 26% were more than 3 years away. In anotherstudy,timerequiredforJITprogramstoyieldsignifcant benefts anddeterioration of top management commitment and support are the two major barriers to implementing JIT.
Inshortrun,thebeneftsofimprovedquality,agility,andcycletimearetransparent,andfnancially, JITshowsupsolelyasacost.Intermsofpaybackperiod,JITcanappear risky, not because of the capital expense involved, but because of the time and expense in training and development programs as well as improvement and waste-reduction projects. In JIT, chronic problems such as machine breakdowns, mistakes in production procedures, and poor organisation are eliminated through steady, continual effort and team projects, but that takes time.
Quality commitmentA prerequisite for JIT success is commitment to quality. Commitment to quality requires changes in policies affecting procurement, production processes, product design, problem troubleshooting, and relationships with suppliers. For example, instead of just price, criteria for suppliers must include guarantees for high-quality productsintermsofabilitytomeetspecifcations, deliverydates,anddeliveryquantities.Failuretofnd suppliersthatcanmeetJITrequirementsorthatarewilling to adapt to them can be major obstacle to implementing JIT.
Quality must be designed into the product and the production process, and that in turn requires adopting a new product/process design methodology. Also frontline workers must be given time to troubleshoot and resolve quality problems at the source. Companies that espouse quality but fail to support it in terms of quality design and manufacturing practices cannot attain the quality levels assumed for most JIT practices.
66/JNU OLE
Variation reduction and stabilityJIT seeks to increase stability by reducing variation in inputs, internal processes, and customer demand. It seeks to smooth production because level production is easier to schedule, less wasteful, and less costly than irregular, lumpy production. In turn, it seeks to reduce variation of inputs through improved supplier relationships and of internal processes through preventive maintenance, production levelling, and small-lot and pull production. Demand variation is reduced through better forecasting and closer ties with customers. Sales and production people work together to accomplish these goals.
In some custom-produced and job-shop environments, however, the demands, lead times, and production rates are highly variable. In such environments, JITpracticessuchaspullproductionandsmall-lotproductionarediffcult orimpossible to implement.
Misunderstanding JITBecause JIT emphasises inventory reduction, some people believe that JIT’s prime focus is inventory, and its goal is small inventory. It is not. The JIT prescription is to reduce inventory slowly, identify problems, then change policies and practices to remove the problems; having done so, then reduce inventory a little bit more, and so on. But confusing means with ends, companies try to reduce inventories without resolving the problems. When the production system comes to a screeching halt, as it surely will, they blame JIT.
A further misunderstanding about JIT is that it is a physical system to be implemented. Implementing JIT, they believe, is equivalent to tearing out whatever production system is in place and installing a pull process with Kanban cards and small containers. While it is true that a physical pull process with Kanban control is an important feature of JIT production, such a system does not represent the entirely of JIT, nor is it a necessary component of JIT. A JIT program that focuses on long-term commitment and cultural change devoted to waste reduction and customer-oriented quality can succeed even without a pull system; a JIT program that tries to implement a pull system but excludes all the rest will almost surely fail.
Just-in-Time and Lean
67/JNU OLE
Summary
Just-In-Time can offer organisations a competitive advantage which can take •the form of offering consumers higher quality products than those offered bytherivalfrms, orprovidingasuperiorserviceordevelopingasuperiormeans of production which allows the organisation to become increasingly effcientorproductive.
JIT contribution to the competitive advantage involves areas such as: •suppliers, layout and equipment, reducing setup time and lot sizes, and effect on workers
Under JIT, suppliers are treated in the same way as internal work centres. •Suppliers receive Kanban cards and special containers, and they are expected to make frequent deliveries just in time for the next production stage.
Installation of a JIT system has a natural effect on layout and equipment. The •plantevolvestowardamorestreamlinedfow andautomatedplantbecauselot sizes are reduced and problems are constantly resolved making automation possible.
Reducing setup time is important since it increase available capacity, increases •fexibility tomeetschedulechanges,andreducesinventory.Assetuptimeapproaches zero, that ideal lot size of one unit can be reached.
One of the critical things needed to make a JIT system work is multifunction •workers. In most cases, each worker must be able to operate several machines in a group, going from one to the next to make the parts required.
MRPandJITeachhavebenefts. Mostofthemajormanufacturingfrms use•MRP.Ofthefrms usingMRP,manyrepetitivemanufacturingalsouseJITtechniques. Although JIT is best suited to repetitive manufacturing, MRP is used in everything from custom job shops to assembly-line production.
MRPfocusesonproductionoffnishedgoodsbasedonforecastrequirements,•while JIT focuses on production as a response to actual orders.
Materials resource planning is a comprehensive system of raw materials •ordering and production scheduling of equipment and manpower based on forecast orders.
Advocates of JIT claim it is a revolutionary concept that all manufacturers will •have to adopt in order to remain competitive. JIT encompasses the successful execution of all production activities required to produce a product, from designing to delivery.
The JIT method demands a much disciplined assembly-line process. The entire •factory has to be in sync to successfully exploit its methods. Manufacturers can afford fewer errors in the delivery of the supplier’s component; if a part isn’t there, the assembly line stops, and that can result in the loss of manpower and cash
An MRP system provides tight and accurate control over the many complex •and interdependent activities of the plant.
68/JNU OLE
A prerequisite for JIT success is commitment to quality. Commitment to quality •requires changes in policies affecting procurement, production processes, product design, problem troubleshooting, and relationships with suppliers.
JIT seeks to increase stability by reducing variation in inputs, internal •processes, and customer demand.
References
What Is the Difference Between MRP and JIT• [Online] Available at: < http://www.wisegeek.com/what-is-the-difference-between-mrp-and-jit.htm> [Accessed 12 July 2011]
Cheng, T. and Podolsky, S., 1996. • Just-In-Time Manufacturing – An Introduction. 2nd ed., Chapman & Hall.
Vollman, T. and Berry, W., 2004. • Manufacturing Planning And Control Systems For Supply Chain Managemen : The Defnitive Guide for Professionals. 2004. 5th ed., McGraw-Hill.
virtualstrategist, 2008. • How to Develop Competitive Advantage [Video Online] Available at :< http://www.youtube.com/watch?v=S9O2oPbT3fs> [Accessed 12 July 2011].
wsbmllc, 2008. • The Advantages of JIT [Video Online] Available at: <http://www.youtube.com/watch?v=XkWIG12nfcI> [Accessed 12 July 2011].
businesslink.gov.uk, 2010. • Manufacturing innovation [Online] Available at : < http://www.businesslink.gov.uk/bdotg/action/detail?itemId=1074405965&type=RESOURCES> [Accessed 12 July 2011].
Recommended Reading
Hayes, R., and Wheelwright, S., 1988. • Dynamic Manufacturing: Creating the Learning Organization. Free Press.
Hirano, H., 2009. • JIT Implementation Manual -The Complete Guide to Just-In-Time Manufacturing. 2nd ed., Productivity Press.
Jacobs, F., 2011. • Manufacturing Planning and Control for Supply Chain Management. McGraw-Hill Professional.
Just-in-Time and Lean
69/JNU OLE
Self Assessment
Workers take responsibility for most of their own maintenance, which gives 1. them more control over __________.
inventorya.
productionb.
equipmentsc.
deliveryd.
One of the critical things needed to make a JIT system work is ______________2. workers.
multifunctiona.
competitiveb.
effcientc.
committedd.
Which of the following statements is false?3. Installation of a JIT system has a natural effect on layout and equipment. a.
Demand variation is reduced through better forecasting and closer ties b. with customers.
JIT is a team-oriented philosophy, and in that regard it is very much like c. PERT
JIT requires a cooperative, participative spirit between managers, workers, d. suppliers, and their customers.
JIT is a __________process that responds to actual orders.4. forecastinga.
layoutb.
variationc.
manufacturingd.
Which of the following statements is true?5. MRP is well-suited to an assembly line that operates on a batch or special a. order basis.
The JIT system works well in an environment of new orders of similar b. products.
With a JIT system, maintenance of equipment is not required. c.
Traditional pay systems are often based on seniority and job skill level.d.
70/JNU OLE
Which of the following is created with the combination of MRP and JIT?6. hybrid manufacturing systema.
modern manufacturing systemb.
participative manufacturing systemc.
quality manufacturing systemd.
Single setup refers to a setup time has a single digit in _______.7. hoursa.
secondsb.
daysc.
minutesd.
JIT cannot be implemented without full ________ understanding and 8. cooperation.
managementa.
workerb.
customerc.
systemd.
As setup time approaches __________, that ideal lot size of one unit can be 9. reached.
zeroa.
maximumb.
minimumc.
limitd.
______is well-suited to a production line that operates on a batch or special 10. order basis.
JIT a.
TQMb.
MRPc.
CPMd.
Just-in-Time and Lean
71/JNU OLE
Chapter IV
JIT Layout
Aim
The aim of this unit is to:
introduce to the concept of plant layout•
discuss the principles of plant layout•
explain the concept of service layout•
Objectives
The objectives of this unit are to:
describethelayoutclassifcation•
describe the concept of JIT layout•
identify the objectives of plant layout•
Learning outcome
At the end of the unit, you will be able to:
understandJITlayoutsanddesignfow•
enlist JIT applications for JIT shops•
identi• fytheJIT applicationsforlinefow
72/JNU OLE
4.1 Plant Layout
Plant layout refers to the physical arrangement of production facilities. It is the confgurationofdepartments,workcentresandequipmentintheconversionprocess.Itisafoor planofthephysicalfacilities,whichareusedinproduction.According to Moore “Plant layout is a plan of an optimum arrangement of facilities including personnel, operating equipment, storage space, material handling equipment and all other supporting services along with the design of best structure to contain all these facilities”.
A typical manufacturing plant has a number of diverse activities interacting with each other. Thus, raw materials arrive at a shipping dock, they are unpacked and checked in a quality control area, they may then be processed through several processingareas,andfnallythefnishedproductagainpassesthroughtheshippingdock.Inadditiontoareasspecifcallyrelatedtoproduction,theremustbedressingrooms,lunchrooms,andrestroomsforemployees;offcesforsupervision,design,and production control; and space for inventory and aisles. In fact, a plant may beviewedasalargenumberoffnite geometricareasarrangedonthefoor spaceof the building. The problem of arranging these areas in an effective manner is the facility layout problem.
4.1.1 Objectives of Plant Layout
Theprimarygoaloftheplantlayoutistomaximisetheproft byarrangementofall the plant facilities to the best advantage of total manufacturing of the product. The objectives of plant layout are:
Streamlinethefowofmaterialsthroughtheplant.•
Facilitate the manufacturing process.•
Maintain high turnover of in-process inventory.•
Minimise materials handling and cost.•
Effective utilisation of men, equipment and space.•
Make effective utilisation of cubic space.•
Flexibility of manufacturing operations and arrangements.•
Provide for employee convenience, safety and comfort.•
Minimise investment in equipment.•
Minimise overall production time.•
Maintainfexibilityofarrangementandoperation.•
Facilitate the organisational structure.•
Just-in-Time and Lean
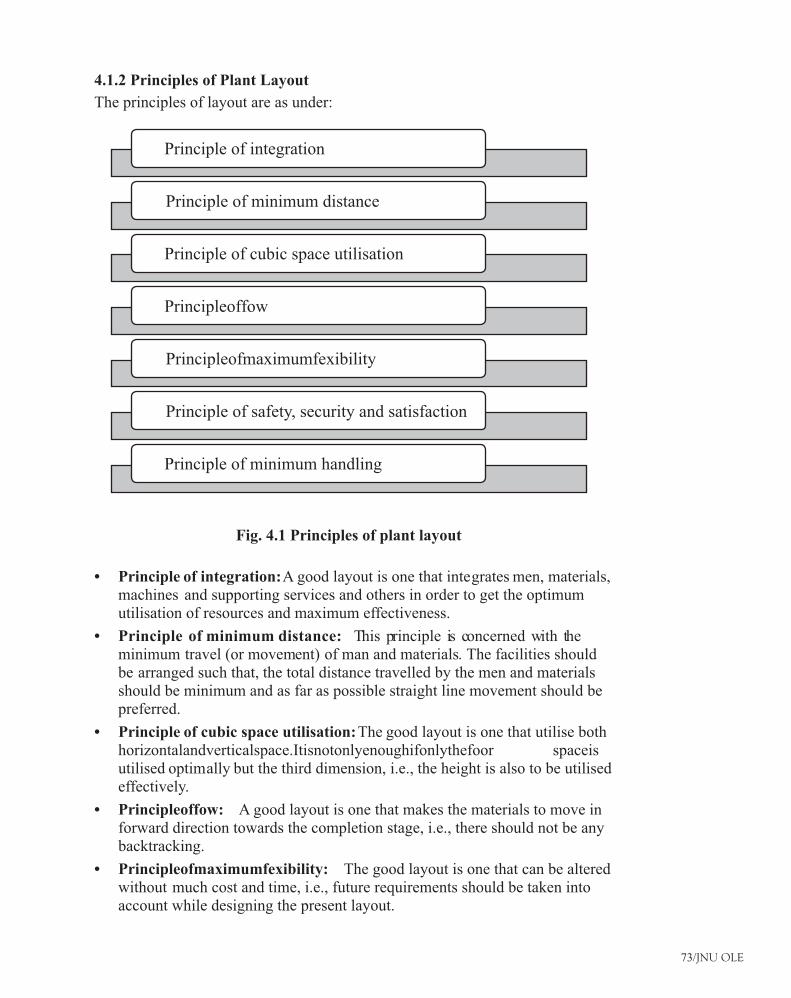
73/JNU OLE
4.1.2 Principles of Plant Layout
The principles of layout are as under:
Principle of integration
Principle of minimum distance
Principle of cubic space utilisation
Principleoffow
Principleofmaximumfexibility
Principle of safety, security and satisfaction
Principle of minimum handling
Fig. 4.1 Principles of plant layout
Principle of integration:• A good layout is one that integrates men, materials, machines and supporting services and others in order to get the optimum utilisation of resources and maximum effectiveness.
Principle of minimum distance:• This principle is concerned with the minimum travel (or movement) of man and materials. The facilities should be arranged such that, the total distance travelled by the men and materials should be minimum and as far as possible straight line movement should be preferred.
Principle of cubic space utilisation: • The good layout is one that utilise both horizontalandverticalspace.Itisnotonlyenoughifonlythefoor spaceisutilised optimally but the third dimension, i.e., the height is also to be utilised effectively.
Principleoffow:• A good layout is one that makes the materials to move in forward direction towards the completion stage, i.e., there should not be any backtracking.
Principleofmaximumfexibility:• The good layout is one that can be altered without much cost and time, i.e., future requirements should be taken into account while designing the present layout.
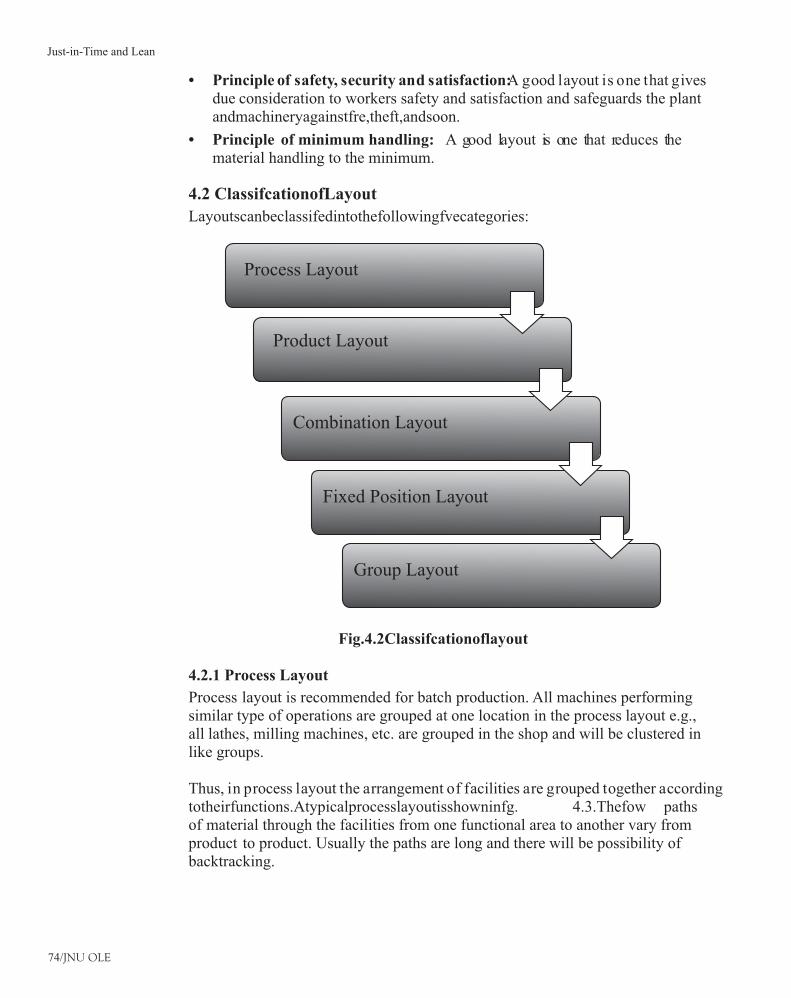
74/JNU OLE
Principle of safety, security and satisfaction:• A good layout is one that gives due consideration to workers safety and satisfaction and safeguards the plant andmachineryagainstfre,theft,andsoon.
Principle of minimum handling: • A good layout is one that reduces the material handling to the minimum.
4.2 ClassifcationofLayout
Layoutscanbeclassifedintothefollowingfvecategories:
Process Layout
Product Layout
Combination Layout
Fixed Position Layout
Group Layout
Fig.4.2Classifcationoflayout
4.2.1 Process Layout
Process layout is recommended for batch production. All machines performing similar type of operations are grouped at one location in the process layout e.g., all lathes, milling machines, etc. are grouped in the shop and will be clustered in like groups.
Thus, in process layout the arrangement of facilities are grouped together according totheirfunctions.Atypicalprocesslayoutisshowninfg. 4.3.Thefow pathsof material through the facilities from one functional area to another vary from product to product. Usually the paths are long and there will be possibility of backtracking.
Just-in-Time and Lean
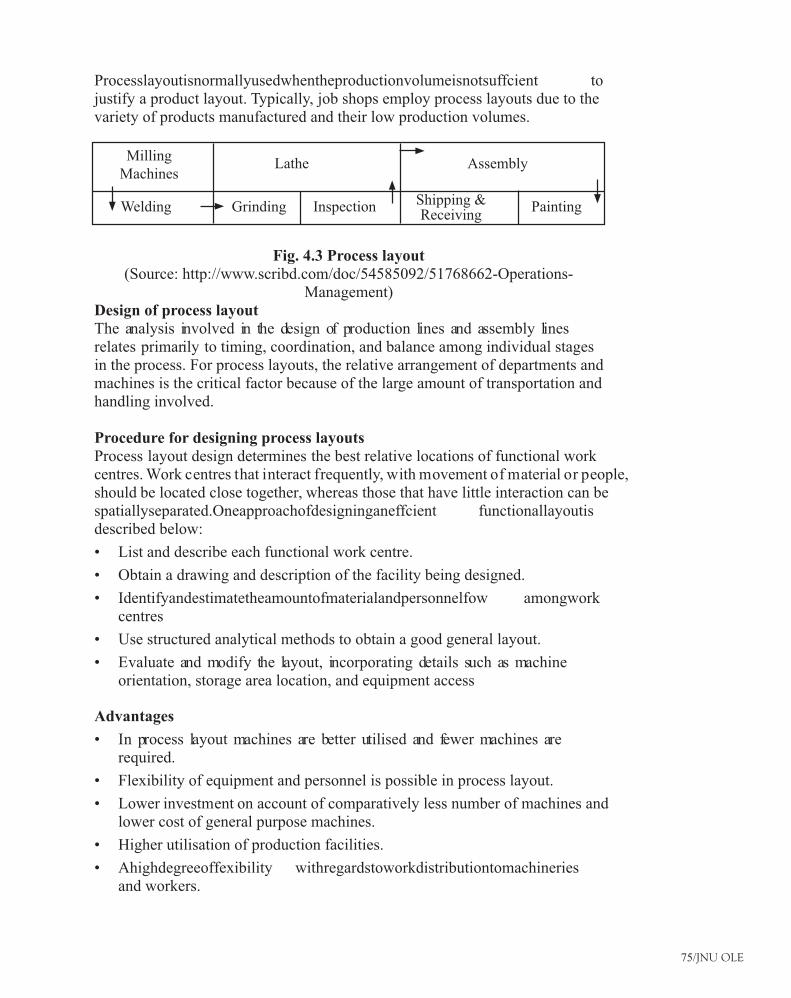
75/JNU OLE
Processlayoutisnormallyusedwhentheproductionvolumeisnotsuffcient tojustify a product layout. Typically, job shops employ process layouts due to the variety of products manufactured and their low production volumes.
Milling Machines
Welding
Lathe
Grinding Inspection
Assembly
PaintingShipping & Receiving
Fig. 4.3 Process layout(Source: http://www.scribd.com/doc/54585092/51768662-Operations-
Management)Design of process layoutThe analysis involved in the design of production lines and assembly lines relates primarily to timing, coordination, and balance among individual stages in the process. For process layouts, the relative arrangement of departments and machines is the critical factor because of the large amount of transportation and handling involved.
Procedure for designing process layoutsProcess layout design determines the best relative locations of functional work centres. Work centres that interact frequently, with movement of material or people, should be located close together, whereas those that have little interaction can be spatiallyseparated.Oneapproachofdesigninganeffcient functionallayoutisdescribed below:
List and describe each functional work centre.•
Obtain a drawing and description of the facility being designed.•
Identifyandestimatetheamountofmaterialandpersonnelfow amongwork•centres
Use structured analytical methods to obtain a good general layout.•
Evaluate and modify the layout, incorporating details such as machine •orientation, storage area location, and equipment access
Advantages
In process layout machines are better utilised and fewer machines are •required.
Flexibility of equipment and personnel is possible in process layout.•
Lower investment on account of comparatively less number of machines and •lower cost of general purpose machines.
Higher utilisation of production facilities.•
Ahighdegreeoffexibility withregardstoworkdistributiontomachineries•and workers.
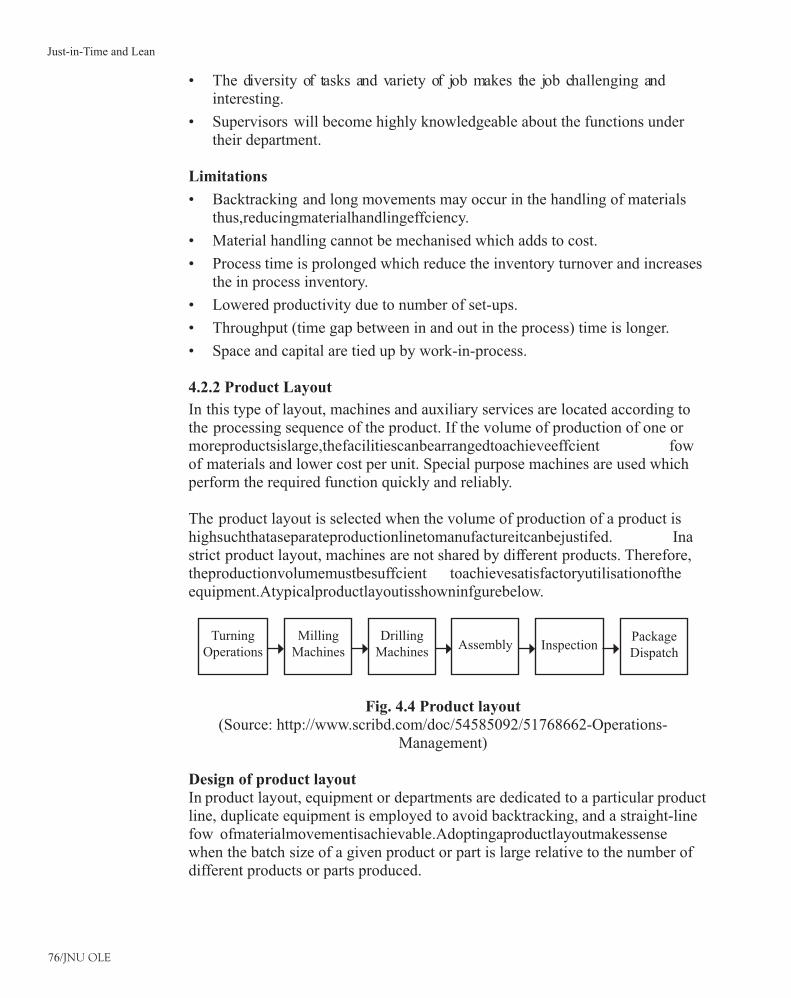
76/JNU OLE
The diversity of tasks and variety of job makes the job challenging and •interesting.
Supervisors will become highly knowledgeable about the functions under •their department.
Limitations
Backtracking and long movements may occur in the handling of materials •thus,reducingmaterialhandlingeffciency.
Material handling cannot be mechanised which adds to cost.•
Process time is prolonged which reduce the inventory turnover and increases •the in process inventory.
Lowered productivity due to number of set-ups.•
Throughput (time gap between in and out in the process) time is longer.•
Space and capital are tied up by work-in-process.•
4.2.2 Product Layout
In this type of layout, machines and auxiliary services are located according to the processing sequence of the product. If the volume of production of one or moreproductsislarge,thefacilitiescanbearrangedtoachieveeffcient fowof materials and lower cost per unit. Special purpose machines are used which perform the required function quickly and reliably.
The product layout is selected when the volume of production of a product is highsuchthataseparateproductionlinetomanufactureitcanbejustifed. Inastrict product layout, machines are not shared by different products. Therefore, theproductionvolumemustbesuffcient toachievesatisfactoryutilisationoftheequipment.Atypicalproductlayoutisshowninfgurebelow.
Turning Operations
Milling Machines
Drilling Machines
Assembly InspectionPackage Dispatch
Fig. 4.4 Product layout(Source: http://www.scribd.com/doc/54585092/51768662-Operations-
Management)
Design of product layoutIn product layout, equipment or departments are dedicated to a particular product line, duplicate equipment is employed to avoid backtracking, and a straight-line fow ofmaterialmovementisachievable.Adoptingaproductlayoutmakessensewhen the batch size of a given product or part is large relative to the number of different products or parts produced.
Just-in-Time and Lean
77/JNU OLE
Assembly lines are a special case of product layout. In a general sense, the term assembly line refers to progressive assembly linked by some material-handling device. The usual assumption is that some form of pacing is present and the allowable processing time is equivalent for all workstations. Within this broad defnition,thereareimportantdifferencesamonglinetypes.Afewoftheseare material handling devices (belt or roller conveyor, overhead crane); line confguration(U-shape,straight,branching);pacing(mechanical,human);productmix (one product or multiple products); workstation characteristics (workers may sit, stand, walk with the line, or ride the line); and length of the line (few or many workers). The range of products partially or completely assembled on lines includes toys, appliances, autos, clothing and a wide variety of electronic components. In fact, virtually any product that has multiple parts and is produced in large volume uses assembly lines to some degree.
Amore-challengingproblemisthedeterminationoftheoptimumconfgurationofoperatorsandbuffersinaproductionfow process.Amajordesignconsiderationin production lines is the assignment of operation so that all stages are more or less equally loaded.
Assembly-line systems work well when there is a low variance in the times required to perform the individual subassemblies. If the tasks are somewhat complex, resulting in a higher assembly-time variance, operators down the line may not beabletokeepupwiththefow ofpartsfromtheprecedingworkstationormayexperience excessive idle time. An alternative to a conveyor-paced assembly-line is a sequence of workstations linked by gravity conveyors, which act as buffers between successive operations.
AdvantagesThe advantages can be discussed as below:
Thefowofproductwillbesmoothandlogicalinfowlines.•
In-process inventory is less.•
Throughput time is less.•
Minimum material handling cost.•
Simplifedproduction,planningandcontrolsystemsarepossible.•
Less space is occupied by work transit and for temporary storage.•
Reduced material handling cost due to mechanised handling systems and •straightfow.
Perfect line balancing which eliminates bottlenecks and idle capacity.•
Manufacturingcycleisshortduetouninterruptedfowofmaterials.•
Small amount of work-in-process inventory.•
Unskilled workers can learn and manage the production.•
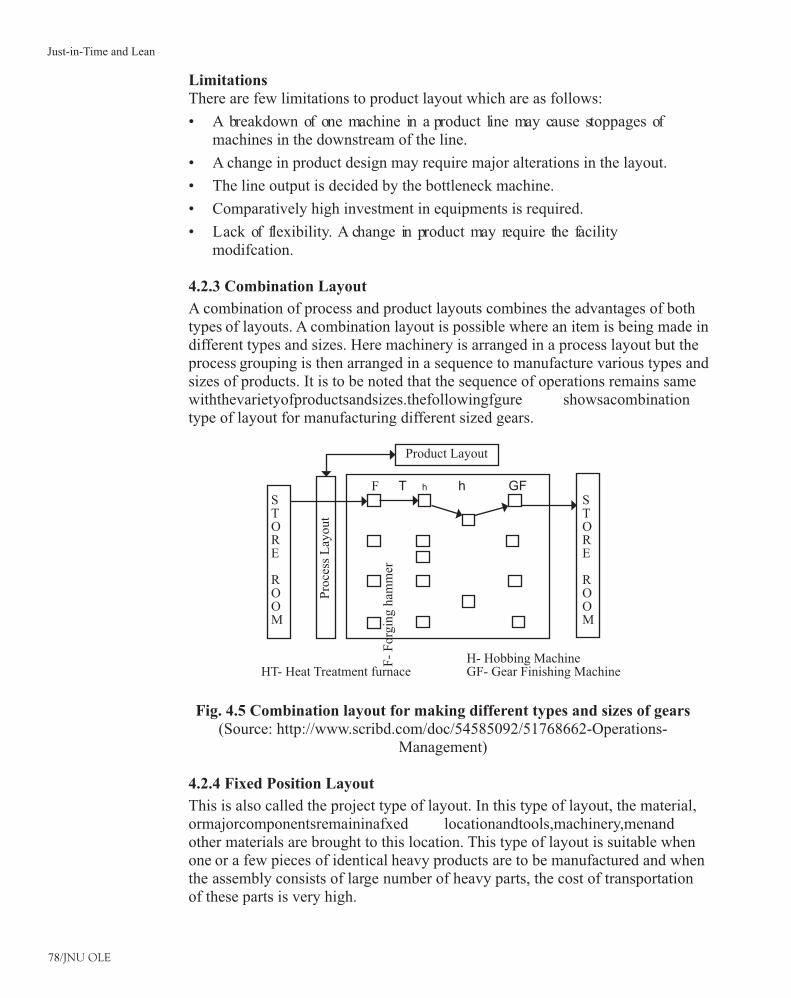
78/JNU OLE
LimitationsThere are few limitations to product layout which are as follows:
A breakdown of one machine in a product line may cause stoppages of •machines in the downstream of the line.
A change in product design may require major alterations in the layout.•
The line output is decided by the bottleneck machine.•
Comparatively high investment in equipments is required.•
Lack of flexibility. A change in product may require the facility •modifcation.
4.2.3 Combination Layout
A combination of process and product layouts combines the advantages of both types of layouts. A combination layout is possible where an item is being made in different types and sizes. Here machinery is arranged in a process layout but the process grouping is then arranged in a sequence to manufacture various types and sizes of products. It is to be noted that the sequence of operations remains same withthevarietyofproductsandsizes.thefollowingfgure showsacombinationtype of layout for manufacturing different sized gears.
Product Layout
Pro
cess
Lay
out
F-
For
ging
ham
mer
HT- Heat Treatment furnaceH- Hobbing MachineGF- Gear Finishing Machine
STORE ROOM
STORE ROOM
F T h h GF
Fig. 4.5 Combination layout for making different types and sizes of gears(Source: http://www.scribd.com/doc/54585092/51768662-Operations-
Management)
4.2.4 Fixed Position Layout
This is also called the project type of layout. In this type of layout, the material, ormajorcomponentsremaininafxed locationandtools,machinery,menandother materials are brought to this location. This type of layout is suitable when one or a few pieces of identical heavy products are to be manufactured and when the assembly consists of large number of heavy parts, the cost of transportation of these parts is very high.
Just-in-Time and Lean
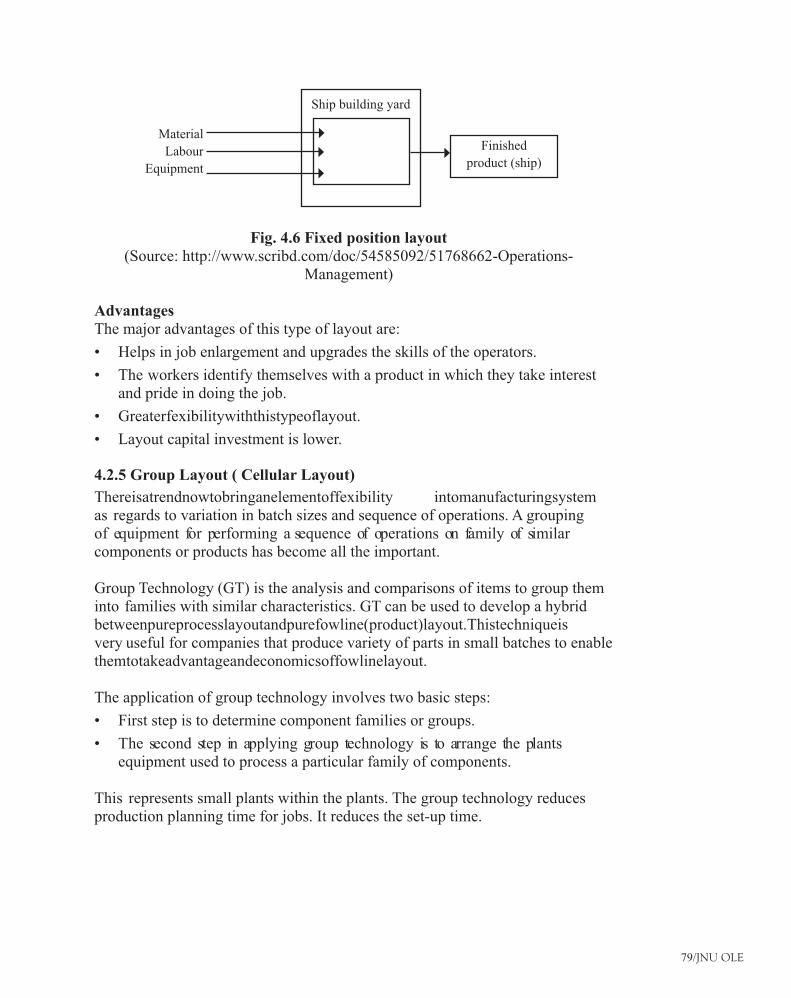
79/JNU OLE
Material
Labour
Equipment
Ship building yard
Finished
product (ship)
Fig. 4.6 Fixed position layout(Source: http://www.scribd.com/doc/54585092/51768662-Operations-
Management)
AdvantagesThe major advantages of this type of layout are:
Helps in job enlargement and upgrades the skills of the operators.•
The workers identify themselves with a product in which they take interest •and pride in doing the job.
Greaterfexibilitywiththistypeoflayout.•
Layout capital investment is lower.•
4.2.5 Group Layout ( Cellular Layout)
Thereisatrendnowtobringanelementoffexibility intomanufacturingsystemas regards to variation in batch sizes and sequence of operations. A grouping of equipment for performing a sequence of operations on family of similar components or products has become all the important.
Group Technology (GT) is the analysis and comparisons of items to group them into families with similar characteristics. GT can be used to develop a hybrid betweenpureprocesslayoutandpurefowline(product)layout.Thistechniqueisvery useful for companies that produce variety of parts in small batches to enable themtotakeadvantageandeconomicsoffowlinelayout.
The application of group technology involves two basic steps:
First step is to determine component families or groups. •
The second step in applying group technology is to arrange the plants •equipment used to process a particular family of components.
This represents small plants within the plants. The group technology reduces production planning time for jobs. It reduces the set-up time.
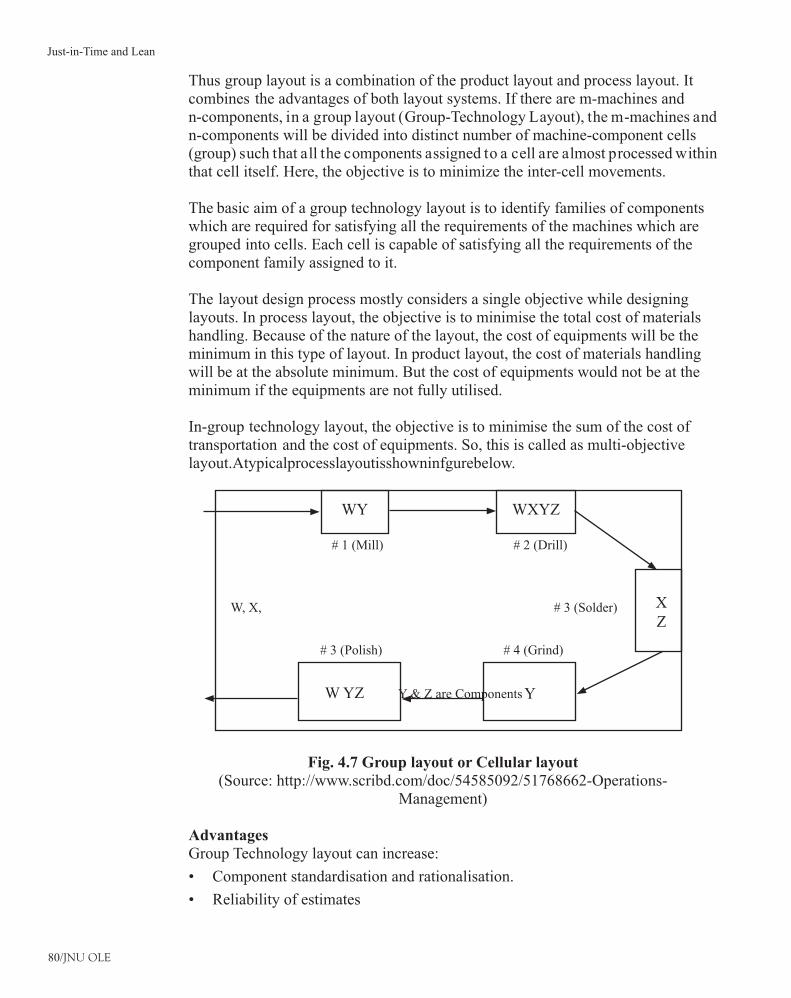
80/JNU OLE
Thus group layout is a combination of the product layout and process layout. It combines the advantages of both layout systems. If there are m-machines and n-components, in a group layout (Group-Technology Layout), the m-machines and n-components will be divided into distinct number of machine-component cells (group) such that all the components assigned to a cell are almost processed within that cell itself. Here, the objective is to minimize the inter-cell movements.
The basic aim of a group technology layout is to identify families of components which are required for satisfying all the requirements of the machines which are grouped into cells. Each cell is capable of satisfying all the requirements of the component family assigned to it.
The layout design process mostly considers a single objective while designing layouts. In process layout, the objective is to minimise the total cost of materials handling. Because of the nature of the layout, the cost of equipments will be the minimum in this type of layout. In product layout, the cost of materials handling will be at the absolute minimum. But the cost of equipments would not be at the minimum if the equipments are not fully utilised.
In-group technology layout, the objective is to minimise the sum of the cost of transportation and the cost of equipments. So, this is called as multi-objective layout.Atypicalprocesslayoutisshowninfgurebelow.
WY WXYZ
W, X,
W YZ Y & Z are Components
# 1 (Mill) # 2 (Drill)
# 3 (Solder)
# 4 (Grind)# 3 (Polish)
Y
XZ
Fig. 4.7 Group layout or Cellular layout(Source: http://www.scribd.com/doc/54585092/51768662-Operations-
Management)
Advantages Group Technology layout can increase:
Component standardisation and rationalisation.•
Reliability of estimates•
Just-in-Time and Lean
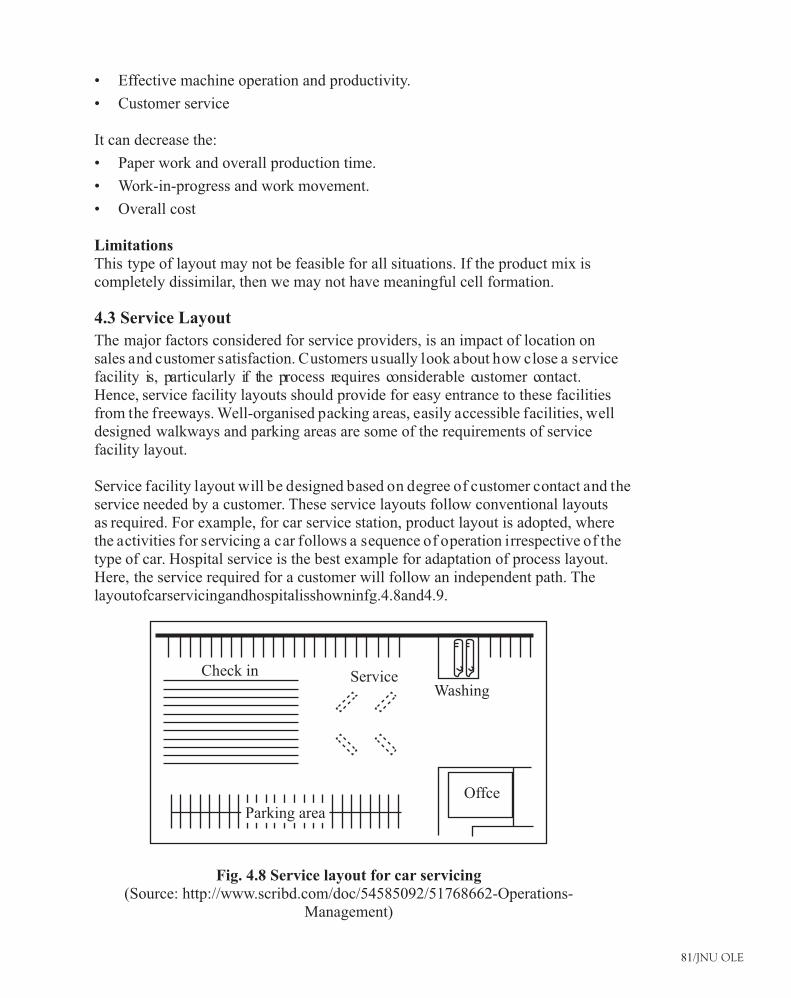
81/JNU OLE
Effective machine operation and productivity.•
Customer service•
It can decrease the:
Paper work and overall production time.•
Work-in-progress and work movement.•
Overall cost•
LimitationsThis type of layout may not be feasible for all situations. If the product mix is completely dissimilar, then we may not have meaningful cell formation.
4.3 Service Layout
The major factors considered for service providers, is an impact of location on sales and customer satisfaction. Customers usually look about how close a service facility is, particularly if the process requires considerable customer contact. Hence, service facility layouts should provide for easy entrance to these facilities from the freeways. Well-organised packing areas, easily accessible facilities, well designed walkways and parking areas are some of the requirements of service facility layout.
Service facility layout will be designed based on degree of customer contact and the service needed by a customer. These service layouts follow conventional layouts as required. For example, for car service station, product layout is adopted, where the activities for servicing a car follows a sequence of operation irrespective of the type of car. Hospital service is the best example for adaptation of process layout. Here, the service required for a customer will follow an independent path. The layoutofcarservicingandhospitalisshowninfg.4.8and4.9.
Check in ServiceWashing
OffceParking area
Fig. 4.8 Service layout for car servicing(Source: http://www.scribd.com/doc/54585092/51768662-Operations-
Management)
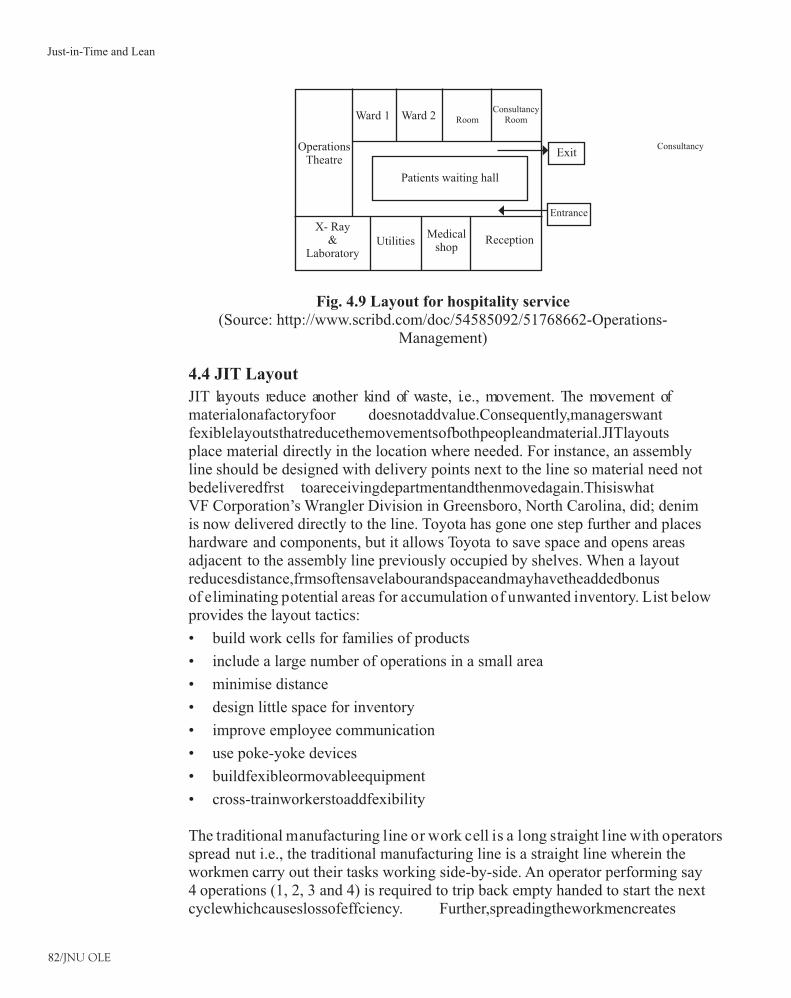
82/JNU OLE
Operations Theatre
Ward 1
Patients waiting hall
X- Ray &
LaboratoryUtilities
Medical shop
Reception
Ward 2
Consultancy Exit
Entrance
RoomConsultancy
Room
Fig. 4.9 Layout for hospitality service(Source: http://www.scribd.com/doc/54585092/51768662-Operations-
Management)
4.4 JIT Layout
JIT layouts reduce another kind of waste, i.e., movement. The movement of materialonafactoryfoor doesnotaddvalue.Consequently,managerswantfexiblelayoutsthatreducethemovementsofbothpeopleandmaterial.JITlayoutsplace material directly in the location where needed. For instance, an assembly line should be designed with delivery points next to the line so material need not bedeliveredfrst toareceivingdepartmentandthenmovedagain.ThisiswhatVF Corporation’s Wrangler Division in Greensboro, North Carolina, did; denim is now delivered directly to the line. Toyota has gone one step further and places hardware and components, but it allows Toyota to save space and opens areas adjacent to the assembly line previously occupied by shelves. When a layout reducesdistance,frmsoftensavelabourandspaceandmayhavetheaddedbonusof eliminating potential areas for accumulation of unwanted inventory. List below provides the layout tactics:
build work cells for families of products •
include a large number of operations in a small area•
minimise distance•
design little space for inventory•
improve employee communication•
use poke-yoke devices•
buildfexibleormovableequipment•
cross-trainworkerstoaddfexibility•
The traditional manufacturing line or work cell is a long straight line with operators spread nut i.e., the traditional manufacturing line is a straight line wherein the workmen carry out their tasks working side-by-side. An operator performing say 4 operations (1, 2, 3 and 4) is required to trip back empty handed to start the next cyclewhichcauseslossofeffciency. Further,spreadingtheworkmencreates
Just-in-Time and Lean
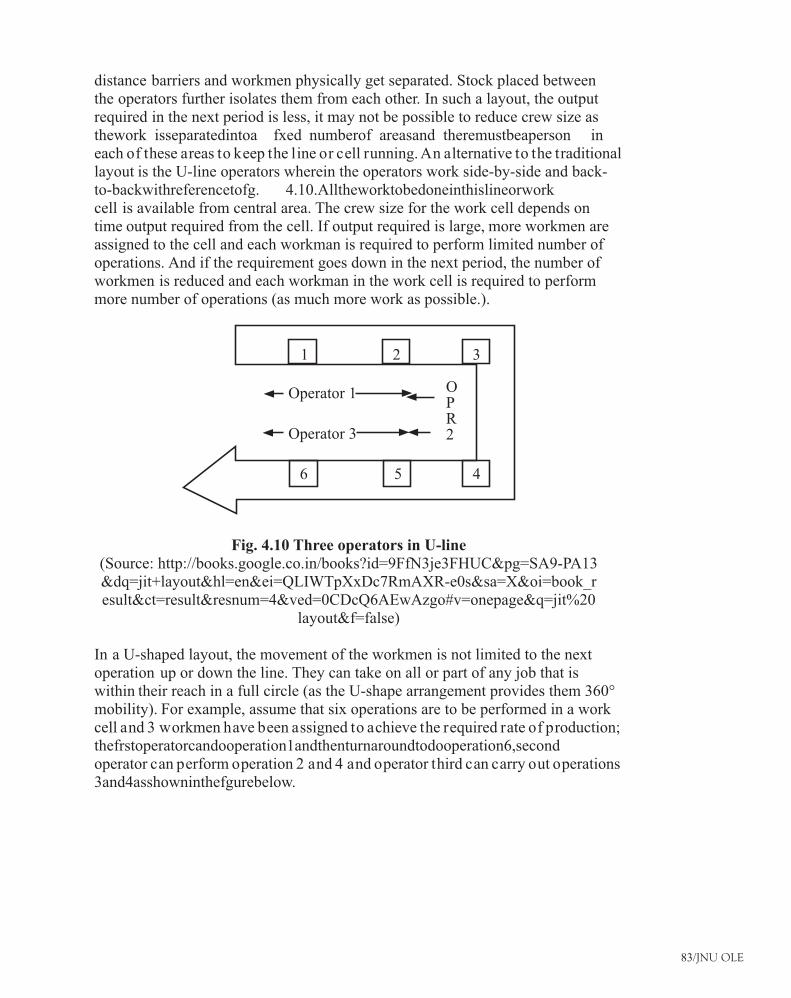
83/JNU OLE
distance barriers and workmen physically get separated. Stock placed between the operators further isolates them from each other. In such a layout, the output required in the next period is less, it may not be possible to reduce crew size as thework isseparatedintoa fxed numberof areasand theremustbeaperson ineach of these areas to keep the line or cell running. An alternative to the traditional layout is the U-line operators wherein the operators work side-by-side and back-to-backwithreferencetofg. 4.10.Alltheworktobedoneinthislineorworkcell is available from central area. The crew size for the work cell depends on time output required from the cell. If output required is large, more workmen are assigned to the cell and each workman is required to perform limited number of operations. And if the requirement goes down in the next period, the number of workmen is reduced and each workman in the work cell is required to perform more number of operations (as much more work as possible.).
1 2 3
456
Operator 1
Operator 3
OPR2
Fig. 4.10 Three operators in U-line (Source: http://books.google.co.in/books?id=9FfN3je3FHUC&pg=SA9-PA13&dq=jit+layout&hl=en&ei=QLIWTpXxDc7RmAXR-e0s&sa=X&oi=book_result&ct=result&resnum=4&ved=0CDcQ6AEwAzgo#v=onepage&q=jit%20
layout&f=false)
In a U-shaped layout, the movement of the workmen is not limited to the next operation up or down the line. They can take on all or part of any job that is within their reach in a full circle (as the U-shape arrangement provides them 360° mobility). For example, assume that six operations are to be performed in a work cell and 3 workmen have been assigned to achieve the required rate of production; thefrstoperatorcandooperation1andthenturnaroundtodooperation6,secondoperator can perform operation 2 and 4 and operator third can carry out operations 3and4asshowninthefgurebelow.
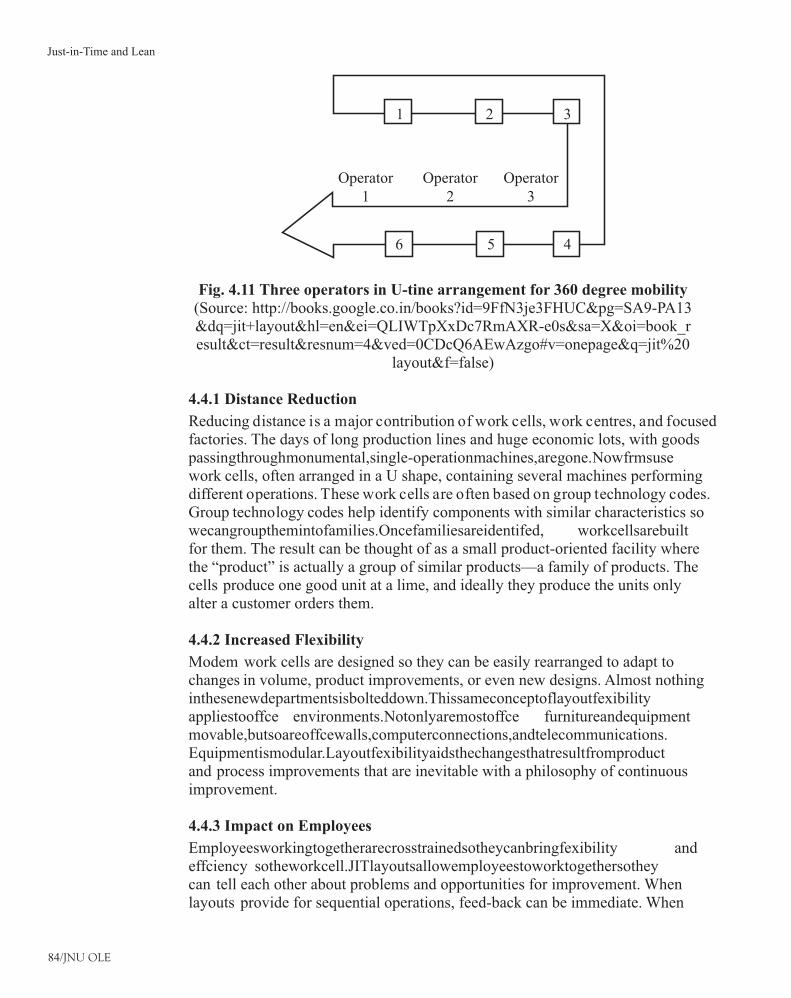
84/JNU OLE
1 2 3
456
Operator 1
Operator 2
Operator 3
Fig. 4.11 Three operators in U-tine arrangement for 360 degree mobility (Source: http://books.google.co.in/books?id=9FfN3je3FHUC&pg=SA9-PA13&dq=jit+layout&hl=en&ei=QLIWTpXxDc7RmAXR-e0s&sa=X&oi=book_result&ct=result&resnum=4&ved=0CDcQ6AEwAzgo#v=onepage&q=jit%20
layout&f=false)
4.4.1 Distance Reduction
Reducing distance is a major contribution of work cells, work centres, and focused factories. The days of long production lines and huge economic lots, with goods passingthroughmonumental,single-operationmachines,aregone.Nowfrmsusework cells, often arranged in a U shape, containing several machines performing different operations. These work cells are often based on group technology codes. Group technology codes help identify components with similar characteristics so wecangroupthemintofamilies.Oncefamiliesareidentifed, workcellsarebuiltfor them. The result can be thought of as a small product-oriented facility where the “product” is actually a group of similar products—a family of products. The cells produce one good unit at a lime, and ideally they produce the units only alter a customer orders them.
4.4.2 Increased Flexibility
Modem work cells are designed so they can be easily rearranged to adapt to changes in volume, product improvements, or even new designs. Almost nothing inthesenewdepartmentsisbolteddown.Thissameconceptoflayoutfexibilityappliestooffce environments.Notonlyaremostoffce furnitureandequipmentmovable,butsoareoffcewalls,computerconnections,andtelecommunications.Equipmentismodular.Layoutfexibilityaidsthechangesthatresultfromproductand process improvements that are inevitable with a philosophy of continuous improvement.
4.4.3 Impact on Employees
Employeesworkingtogetherarecrosstrainedsotheycanbringfexibility andeffciency sotheworkcell.JITlayoutsallowemployeestoworktogethersotheycan tell each other about problems and opportunities for improvement. When layouts provide for sequential operations, feed-back can be immediate. When
Just-in-Time and Lean
85/JNU OLE
workers produce units one at a time, they test each product or component at each subsequent production stage machines in work cells with self-testing poke-yoke functions detect defects and stop automatically when they occur. Before JIT, defective products were replaced from inventory. Because surplus inventory is notkeptinJITfacilities,therearenosuchhollers.Gettingitrightthefrst timeis critical.
4.4.4 Reduced Space and Inventory
Because JIT layouts reduce travel distance, they also reduce inventory by removing space for inventory. When there is little space inventory must be moved in very small lots or even single units, unit’s are always moving because there is no storage. Forinstance,eachmonthSecurityPacifc Corporation’sfocusedfacilitysort’s7 million checks, processes 5 million statements, and mails 190,000 customer statements. With a JIT layout, mail processing time has been reduced by 33%, salarycostsbytensofthousandsofdollarsperyear,foor spaceby50%,andin-process waiting lines by 75% to 90%. Storage including shelves and drawers has been removed.
4.5 JIT Layouts and Design Flows
JITrequirestheplantlayouttobedesignedtoensurebalancedworkfow witha minimum of work-in-progress inventory. Each workstation is a part of the production line, whether or not a physical line actually exists. Capacity is balanced, using the same logic for an assembly line and operations are linked through a pull system. In addition, the system designer must visualise how all aspects of the internal and external logistics system tie to the layout.
Preventivemaintenanceisemphasizedtoensurethatthefowsarenotinterruptedby downtime or malfunctioning equipments. Preventive maintenance involves periodic inspection and repair design to keep a machine reliable. Operators perform much of the maintenance because they are most familiar with their machines and because machines are easier to repair as JIT operations favour simple machines rather than one large complex one.
The reduction in set-up and change over time is necessary to achieve a smooth fow. Exhibitshowstherelationshipbetweenlotsizeandset-upcosts.Undera traditional approach, set-up cost is treated as constant and the optimal order quantity is shown as six. Under the Kanban approach of JIT, setup cost is treated as variable and the optimal order quantity is reduced. In the Exhibit, the order quantity has been reduced from six two under JIT by employing set-up time-saving procedures. This organisation will ultimately strive for a lot size of one.
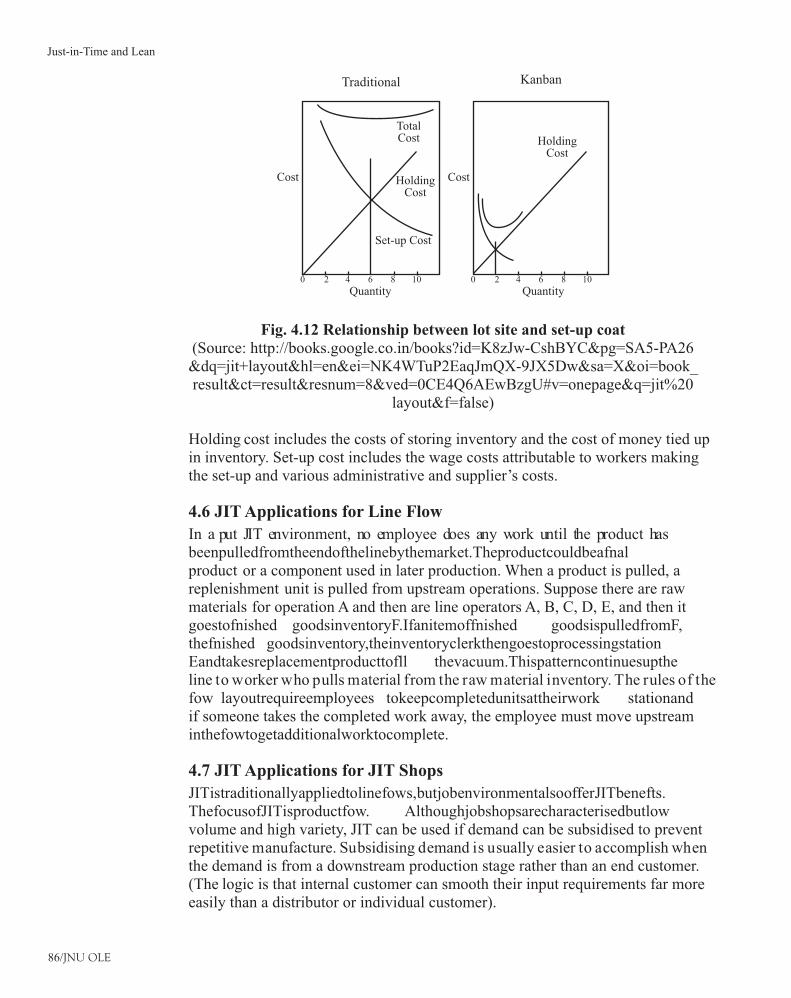
86/JNU OLE
Traditional
Cost
Total Cost
Holding Cost
Holding Cost
Set-up Cost
Quantity Quantity
Kanban
Cost
0 2 4 6 8 10 0 2 4 6 8 10
Fig. 4.12 Relationship between lot site and set-up coat(Source: http://books.google.co.in/books?id=K8zJw-CshBYC&pg=SA5-PA26&dq=jit+layout&hl=en&ei=NK4WTuP2EaqJmQX-9JX5Dw&sa=X&oi=book_result&ct=result&resnum=8&ved=0CE4Q6AEwBzgU#v=onepage&q=jit%20
layout&f=false)
Holding cost includes the costs of storing inventory and the cost of money tied up in inventory. Set-up cost includes the wage costs attributable to workers making the set-up and various administrative and supplier’s costs.
4.6 JIT Applications for Line Flow
In a put JIT environment, no employee does any work until the product has beenpulledfromtheendofthelinebythemarket.Theproductcouldbeafnalproduct or a component used in later production. When a product is pulled, a replenishment unit is pulled from upstream operations. Suppose there are raw materials for operation A and then are line operators A, B, C, D, E, and then it goestofnished goodsinventoryF.Ifanitemoffnished goodsispulledfromF,thefnished goodsinventory,theinventoryclerkthengoestoprocessingstationEandtakesreplacementproducttofll thevacuum.Thispatterncontinuesuptheline to worker who pulls material from the raw material inventory. The rules of the fow layoutrequireemployees tokeepcompletedunitsattheirwork stationandif someone takes the completed work away, the employee must move upstream inthefowtogetadditionalworktocomplete.
4.7 JIT Applications for JIT Shops
JITistraditionallyappliedtolinefows,butjobenvironmentalsoofferJITbenefts.ThefocusofJITisproductfow. Althoughjobshopsarecharacterisedbutlowvolume and high variety, JIT can be used if demand can be subsidised to prevent repetitive manufacture. Subsidising demand is usually easier to accomplish when the demand is from a downstream production stage rather than an end customer. (The logic is that internal customer can smooth their input requirements far more easily than a distributor or individual customer).
Just-in-Time and Lean
87/JNU OLE
Factory machining centres, paint shops and shirt making are examples of job-shop-typeoperationsthatprocesspartsandcomponentsbeforetheyreachfnalproduction stages. By way of example, consider a production system. If a work centre produces nine different parts used by several product varieties that are produced just in time, the work centre keeps containers of completed output of all nine parts at the centre to be picked up by users. Operators can make periodic rounds throughout the facility (hourly or more frequently) to pick up empty containers and drop them off at the corresponding upstream work centre and to pick up full containers. These handling procedures can be manual or automated, but either way, these periodic pickups and drop-offs allow the system to operate in a just-in-time mode.
88/JNU OLE
Summary
Plant layout refers to the physical arrangement of production facilities. •Itistheconfguration ofdepartments,workcentresandequipmentintheconversionprocess.Itisafoor planofthephysicalfacilities,whichareusedin production.
Theprimarygoaloftheplantlayoutistomaximisetheproft byarrangement•of all the plant facilities to the best advantage of total manufacturing of the product.
Principles of plant layout are: principle of integration, principle of minimum •distance,principleofcubicspaceutilisation,principleoffow, principleofmaximumfexibility,principleofsafety,securityandsatisfaction,andprincipleof minimum handling.
Layoutscanbeclassifed intofve categories:processlayout,productlayout,•combinationlayout,fxedpositionlayout,andgrouplayout.
Process layout is recommended for batch production. All machines performing •similar type of operations are grouped at one location in the process layout.
Processlayoutisnormallyusedwhentheproductionvolumeisnotsuffcient•to justify a product layout. Typically, job shops employ process layouts due to the variety of products manufactured and their low production volumes.
The analysis involved in the design of production lines and assembly lines •relates primarily to timing, coordination, and balance among individual stages in the process.
In product layout, machines and auxiliary services are located according to •the processing sequence of the product. If the volume of production of one ormoreproductsislarge,thefacilitiescanbearrangedtoachieveeffcientfowofmaterialsandlowercostperunit.
The product layout is selected when the volume of production of a product is •highsuchthataseparateproductionlinetomanufactureitcanbejustifed.
In product layout, equipment or departments are dedicated to a particular •product line, duplicate equipment is employed to avoid backtracking, and a straight-linefowofmaterialmovementisachievable
A combination of process and product layouts combines the advantages of •both types of layouts. A combination layout is possible where an item is being made in different types and sizes. Here, machinery is arranged in a process layout but the process grouping is then arranged in a sequence to manufacture various types and sizes of products.
Fixed position layout is also called the project type of layout. In this type of •layout,thematerial,ormajorcomponentsremaininafxedlocationandtools,machinery, men and other materials are brought to this location
Ingrouplayoutthereisatrendnowtobringanelementoffexibility into•manufacturing system as regards to variation in batch sizes and sequence of operations. A grouping of equipment for performing a sequence of operations on family of similar components or products has become all the important.
Just-in-Time and Lean
89/JNU OLE
Group Technology (GT) is the analysis and comparisons of items to group •them into families with similar characteristics.
Service facility layouts should provide for easy entrance to these facilities •from the freeways. Well-organized packing areas, easily accessible facilities, well designed walkways and parking areas are some of the requirements of service facility layout.
JIT layouts reduce another kind of waste i.e., movement. The movement of •materialonafactoryfoor doesnotaddvalue.JITlayoutsplacematerialdirectly in the location where needed.
In a put JIT environment, no employee does any work until the product has •been pulled from the end of the line by the market.
References
ignousoms, 2010. • Facility layout [Video Online] Available at : < http://www.youtube.com/watch?v=f721jY_MPPo&NR=1> [Accessed 12 July 2011].
mahematics, 2007. • Prof. Shivanandan Plant Layout [Video Online] Available at: <http://www.youtube.com/watch?v=9rfqwRM6NGw&NR=1> [Accessed 12 July 2011].
Bicheno, J., 1997. • Operations Management: An Active Learning Approach . Wiley-Blackwell.
Kumar, S. & Suresh, N., 2009. • Operations Management. New age international publishers.
ateneonline.it, 2003. • technical note fve – FACILITY LAYOUT [Online] Available at: <http://www.ateneonline.it/chase2e/studenti/tn/6184-7_tn05.pdf> [Accessed 12 July 2011].
me.utexas.edu. • Facility Layout [Online] Available at: <http://www.me.utexas.edu/~jensen/ORMM/omie/design/unit/layout/layout.pdf> [Accessed 12 July 2011].
Recommended Reading
Meredith, J., 2002. • Introducing Operations Management. Wiley.
Shim, J., 1999. • Operations Management. Barron’s Educational Series.
Schniederjans, M., 1999. • Advanced Topics in Just-In-Time Management . Quorum Books.
90/JNU OLE
Self Assessment
____________is the analysis and comparisons of items to group them into 1. families with similar characteristics.
service layouta.
plant layoutb.
group technologyc.
JIT layoutd.
Whichofthefollowingisknownasfxedpositionlayout?2. Project type of layouta.
Group layoutb.
Process layoutc.
Product layoutd.
Process layout design determines the best relative locations of __________3. work centres.
fxeda.
productb.
groupc.
functionald.
Which of the following statements is true?4. A typical manufacturing plant has a number of diverse activities interacting a. with each other.
Process layout is recommended for unit production. b.
In process layout machines are under utilised and fewer machines are c. required.
Assembly lines are a special case of process layout.d.
Group technology can be used to develop a ______between pure process 5. layoutandpurefowline(product)layout.
groupa.
relationb.
hybridc.
interactiond.
“A good layout is one that makes the materials to move in forward direction 6. towardsthecompletionstage”defneswhichofthefollowingprinciple?
Principle of integrationa.
Principleoffowb.
Principle of minimum handlingc.
Principleofmaximumfexibilityd.
Just-in-Time and Lean
91/JNU OLE
Which of the following statements is false?7. Processlayoutisnormallyusedwhentheproductionvolumeissuffcienta. to justify a product layout.
The term assembly line refers to progressive assembly linked by some b. material-handling device.
Assembly-line systems work well when there is a low variance in the times c. required to perform the individual subassemblies.
A combination layout is possible where an item is being made in different d. types and sizes.
JITrequirestheplantlayouttobedesignedtoensurebalancedworkfowwith8. a minimum of ___________ inventory.
possiblea.
work-in-progressb.
fnishedc.
productd.
______fexibilityaidsthechangesthatresultfromproductandprocess9. improvements that are inevitable with a philosophy of continuous improvement.
Inventorya.
Processb.
Layoutc.
Productd.
Themovementof________onafactoryfoordoesnotaddvalue.10. workersa.
equipmentb.
materialc.
inventoryd.
92/JNU OLE
Chapter V
SMED and Kanban
Aim
The aim of this unit is to:
introduce the concept of single minute of die (SMED)•
explain the implementation of single minute of die (SMED)•
discuss the concept of kanban•
Objectives
The objectives of this unit are to:
state the formal method of single minute of die (SMED)•
highlight the reasons for implementing kanban scheduling•
describe the kanban implementation process•
discuss the history of kanban and SMED•
Learning outcome
At the end of the unit, you will be able to:
identify the keys to successful implementation of kanban•
recognise the steps for forming a kanban team•
understan• d the development of kanban design
Just-in-Time and Lean
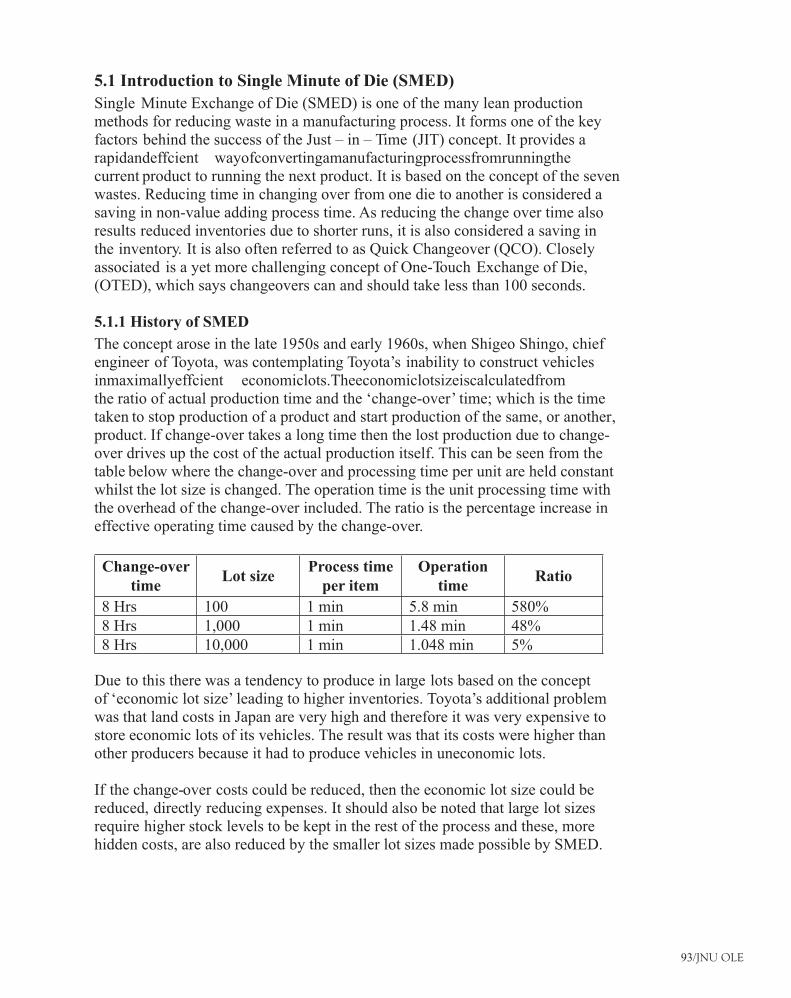
93/JNU OLE
5.1 Introduction to Single Minute of Die (SMED)
Single Minute Exchange of Die (SMED) is one of the many lean production methods for reducing waste in a manufacturing process. It forms one of the key factors behind the success of the Just – in – Time (JIT) concept. It provides a rapidandeffcient wayofconvertingamanufacturingprocessfromrunningthecurrent product to running the next product. It is based on the concept of the seven wastes. Reducing time in changing over from one die to another is considered a saving in non-value adding process time. As reducing the change over time also results reduced inventories due to shorter runs, it is also considered a saving in the inventory. It is also often referred to as Quick Changeover (QCO). Closely associated is a yet more challenging concept of One-Touch Exchange of Die, (OTED), which says changeovers can and should take less than 100 seconds.
5.1.1 History of SMED
The concept arose in the late 1950s and early 1960s, when Shigeo Shingo, chief engineer of Toyota, was contemplating Toyota’s inability to construct vehicles inmaximallyeffcient economiclots.Theeconomiclotsizeiscalculatedfromthe ratio of actual production time and the ‘change-over’ time; which is the time taken to stop production of a product and start production of the same, or another, product. If change-over takes a long time then the lost production due to change-over drives up the cost of the actual production itself. This can be seen from the table below where the change-over and processing time per unit are held constant whilst the lot size is changed. The operation time is the unit processing time with the overhead of the change-over included. The ratio is the percentage increase in effective operating time caused by the change-over.
Change-over time
Lot sizeProcess time
per itemOperation
time Ratio
8 Hrs 100 1 min 5.8 min 580%8 Hrs 1,000 1 min 1.48 min 48%8 Hrs 10,000 1 min 1.048 min 5%
Due to this there was a tendency to produce in large lots based on the concept of ‘economic lot size’ leading to higher inventories. Toyota’s additional problem was that land costs in Japan are very high and therefore it was very expensive to store economic lots of its vehicles. The result was that its costs were higher than other producers because it had to produce vehicles in uneconomic lots.
If the change-over costs could be reduced, then the economic lot size could be reduced, directly reducing expenses. It should also be noted that large lot sizes require higher stock levels to be kept in the rest of the process and these, more hidden costs, are also reduced by the smaller lot sizes made possible by SMED.
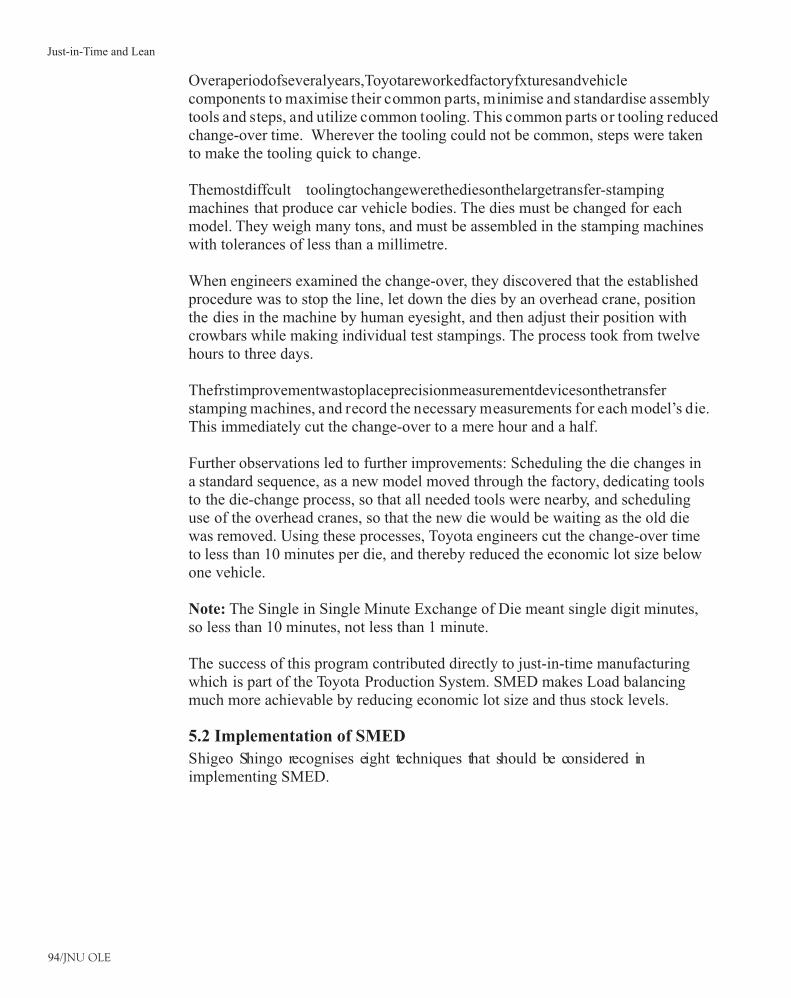
94/JNU OLE
Overaperiodofseveralyears,Toyotareworkedfactoryfxturesandvehiclecomponents to maximise their common parts, minimise and standardise assembly tools and steps, and utilize common tooling. This common parts or tooling reduced change-over time. Wherever the tooling could not be common, steps were taken to make the tooling quick to change.
Themostdiffcult toolingtochangewerethediesonthelargetransfer-stampingmachines that produce car vehicle bodies. The dies must be changed for each model. They weigh many tons, and must be assembled in the stamping machines with tolerances of less than a millimetre.
When engineers examined the change-over, they discovered that the established procedure was to stop the line, let down the dies by an overhead crane, position the dies in the machine by human eyesight, and then adjust their position with crowbars while making individual test stampings. The process took from twelve hours to three days.
Thefrstimprovementwastoplaceprecisionmeasurementdevicesonthetransferstamping machines, and record the necessary measurements for each model’s die. This immediately cut the change-over to a mere hour and a half.
Further observations led to further improvements: Scheduling the die changes in a standard sequence, as a new model moved through the factory, dedicating tools to the die-change process, so that all needed tools were nearby, and scheduling use of the overhead cranes, so that the new die would be waiting as the old die was removed. Using these processes, Toyota engineers cut the change-over time to less than 10 minutes per die, and thereby reduced the economic lot size below one vehicle.
Note: The Single in Single Minute Exchange of Die meant single digit minutes, so less than 10 minutes, not less than 1 minute.
The success of this program contributed directly to just-in-time manufacturing which is part of the Toyota Production System. SMED makes Load balancing much more achievable by reducing economic lot size and thus stock levels.
5.2 Implementation of SMED
Shigeo Shingo recognises eight techniques that should be considered in implementing SMED.
Just-in-Time and Lean
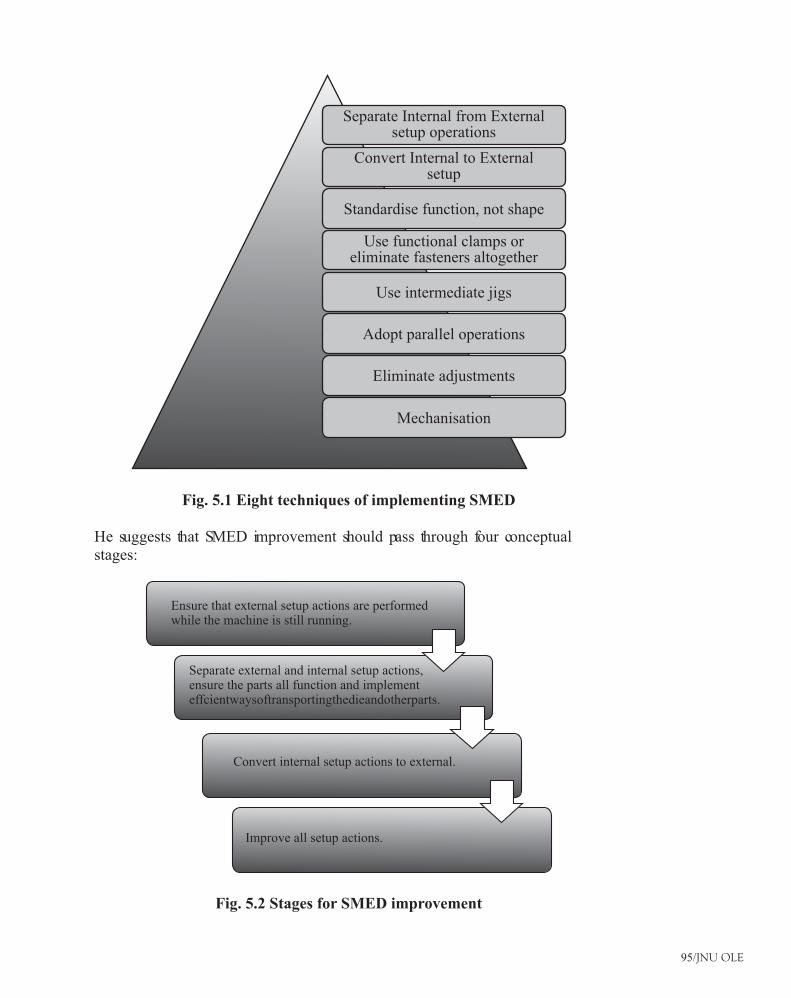
95/JNU OLE
Separate Internal from External setup operations
Convert Internal to External setup
Standardise function, not shape
Use functional clamps or eliminate fasteners altogether
Use intermediate jigs
Adopt parallel operations
Eliminate adjustments
Mechanisation
Fig. 5.1 Eight techniques of implementing SMED
He suggests that SMED improvement should pass through four conceptual stages:
Ensure that external setup actions are performed while the machine is still running.
Separate external and internal setup actions, ensure the parts all function and implement effcientwaysoftransportingthedieandotherparts.
Convert internal setup actions to external.
Improve all setup actions.
Fig. 5.2 Stages for SMED improvement
96/JNU OLE
5.2.1 Formal Method of SMED
There are seven basic steps to reducing changeover using the SMED system: Observe the current methodology. 1. Separate the internal and external activities. Internal activities are those that 2. can only be performed when the process is stopped, while external activities can be done while the last batch is being produced, or once the next batch has started. For example, go and get the required tools for the job before the machine stops. Convert (where possible) internal activities into external ones (pre-heating of 3. tools is a good example of this). Streamline the remaining internal activities, by simplifying them. Focus on 4. fxings -ShigeoShingorightlyobservedthatit’sonlythelastturnofaboltthat tightens it - the rest is just movement. Streamline the external activities, so that they are of a similar scale to the 5. internal ones. Document the new procedure, and actions that are yet to be completed. 6. Do it all again: For each iteration of the above process, a 45% improvement 7. in set-up times should be expected, so it may take several iterations to cross the ten minute line. The SMED concept is credited to Shigeo Shingo, one of the main contributors to the consolidation of the Toyota Production System, along with Taiichi Ohno.
5.3 Introduction to Kanban
With kanban scheduling, the operators use visual signals to determine how much they run and when they stop or change over. The kanban rules also tell the operators what to do when they have problems and whom to go to when these problems arise. Finally, a well planned kanban has visual indicators that allow managers and supervisors to see the schedule status of the line at a glance.
Wedefnekanbanschedulingasdemandscheduling.Inprocessescontrolledby kanbans, the operators produce products based on actual usage rather than forecasted usage. Therefore, for a scheduling process to be considered a true kanban, the production process it controls must:
only produce product to replace the product consumed by its customer(s)•
only produce product based on signals sent by its customer(s)•
The kanban schedule replaces the traditional weekly or daily production schedule with in manufacturing operations. This schedule is replaced with visual signals and predetermined decision rules that allow the production operators to schedule the line. Think of kanban scheduling as an execution tool rather than a planning tool. The kanban, which can take many forms, directs the operation of the process on a day-to-day basis. Kanban scheduling does not replace material planning, but rather takes the material planning information and uses it to create the kanban. What kanban replaces is:
Just-in-Time and Lean
97/JNU OLE
The daily scheduling activities necessary to operate the production process. •
The need for production planners and supervisors to continuously monitor •schedule status to determine the next item to run and when to change over.
It thus frees up the materials planners, schedulers, and supervisors to manage exceptions and improve the process. Finally, it also places control at the value-added level and empowers the operators to control the line.
5.3.1 A Brief History of Kanban
The Japanese word kanban, which translates as ‘‘signboard’’ has become synonymous with demand scheduling. Kanban traces its roots to the early days of the Toyota production system. In the late 1940s and early 1950s, Taiichi Onho developed kanbans to control production between processes and to implement Just in Time (JIT) manufacturing at Toyota manufacturing plants in Japan. These ideas did not gain worldwide acceptance until the global recession in the 1970s. By using kanbans, he minimized the work in process (or WIP) between processes and reduced the cost associated with holding inventory.
Originally, Toyota used kanban to reduce costs and manage machine utilization. However, today Toyota continues to use the system not only to manage cost and fow, butalsotoidentifyimpedimentstofow andopportunitiesforcontinuousimprovement. Interestingly, Mr. Onho modelled many of the control points after U.S. supermarkets— hence the term kanban supermarkets.
It should be noted that the idea of JIT manufacturing was originally conceived by Kiichero Toyoda, founder of the Toyota Motor Company, and son of Sakichi Toyoda, the founder of the Toyota Company, the parent company. However, it was Mr. Onho who developed the strategy of kanban, which became one of the pillars of Toyota’s successful implementation of JIT manufacturing.
5.3.2 Reasons for Implementing Kanban Scheduling
ThebeneftsforKanbanSchedulingare:
Reduces inventory:• When we calculate the kanban quantities based on current conditions (downtime, scrap, and changeover times), we should see a decrease in inventory levels. From experience, inventories can be reduced by 25 percent to 75 percent. The exercise of calculating kanban quantities forces us to identify our real situation. It also forces to examine the comfort levels and informal rules that allow inventory levels to build up over time. Additionally,sincewewilluserealisticdata,wehaveameasureofconfdencethat the calculated quantities will allow us to successfully continue supplying our customers.
Fromafnancial side,theinventoryreductionnotonlysavesthecarryingcostsofthe inventory but also the physical space occupied by the existing inventory. The freed-up space can then be used for new business opportunities or may eliminate the need for planned expansions or leasing of offsite warehouses.
98/JNU OLE
Improvesfow:• Whenproperlyimplemented,kanbanimprovesthefowoftheoperation.Theimprovedfowresultsfromnotonlyreducinginventoryspace,butalsotheordercreatedbydesigningthekanbanmaterialfow. Theprocessofsettingupcontrolpoints,settingupfow lanes,hangingsigns,andsoon,provides directions for moving the material. The kanban process also gives the operators producing the parts guidance on what and when to produce.
Prevents overproduction:• In many production processes, control of production quantities can be haphazard. This lack of control can allow overproductionofparts,whichisoneofthesevenwastesidentifed intheToyota Production System (TPS). The kanban prevents overproduction by specifying the production container sizes and the maximum number of containers to be produced. This structure thus allows control without expensive or labour-intensive tracking systems.
The kanban uses visual signals that let operators know how many of each part to produce and what to produce next. These visual signals also tell operators (and their supervisors) when to stop and when to start production.
Places control at the operations level (with the operator):• Just as managers, supervisors, and materials planners can see the production schedule at a glance, so can the operators. Therefore, with proper rules and scheduling guidance, the operators can run the line. The kanban’s design tells them what to run, how much to run, and what sequence to run. Additionally, the visual nature of the kanban tells everyone immediately when the process is in trouble, so that someone can step in to make course corrections.
Therefore, once again kanban reduces one of the seven wastes— not properly utilising human resources. By creating a system that allows operators to control their production process, we proverbially harness their minds to help us succeed in the game of business.
This step can also lead to other opportunities for increased empowerment (and potentialproftability).Additionally,byallowingtheproductionoperatorstocontrol the line, we free up managers and schedulers to move on to other activities, such as waste elimination and supply chain management.
By the way, control of the line by production operators does not happen for free. Before the operators can run the line with the kanban, they will need training and mentoring. We cannot throw them the ‘‘keys’’ and expect them to operate the line like experienced schedulers. However, if the kanban design sticks with the theme of keeping it simple, then training will not be a problem.
Creates visual scheduling and management of the process: • With proper use of visual management techniques, the kanban system eliminates the need for a paperschedule.Thevisualkanbansignals(containers,cards,foor markings,and so on) tell the operator the items to be produced and the production sequence. The use of scheduling signals (yellow) and danger signals (red) also tell the operators:
Just-in-Time and Lean
99/JNU OLE
What and how many to run ?
When and who to call for help ?
These same visual indicators also tell managers and supervisors the schedule position of the process at a glance. This visual scheduling process thus allows managers, supervisors, and material planners to focus on production problems, future planning, and other continuous improvement activities rather than on the daily control of the production schedule.
Improves responsiveness to changes in demand: • The very nature of the kanban scheduling process sets up maximum and minimum inventory levels. These levels provide signals for when and when not to produce. These signals will stop production when demand decreases. Likewise, when orders begin to increase, the kanban inventory levels signal the restart of production. This addresses one of the main issues that make people build inventory during downturns— ‘‘What if I don’t recognize when to turn the faucet back on?’’
Minimises risk of inventory obsolescence:• Just as the kanban stops overproduction, it prevents you from building inventory that can become obsolete. The kanban signals to start production based on demand (or sales) and not on forecast. Therefore, we only build what we need. So when conditions or models change, we only need to manage the material in the production pipeline, not a vast warehouse inventory. Kanban scheduling’s visual nature also ensures that inventory does not get lost only to magically reappear in time for write-offs at the next physical inventory.
A subset of the obsolescence issue is freshness, which is an issue for many food items and some ‘‘nonconsumable goods.’’ The kanban structure controls the amount of inventory in the system and thus controls the material freshness. Rules forthekanbancanspecifcallyaddressthelifecycleofthegoodsandmanagementof the materials age.
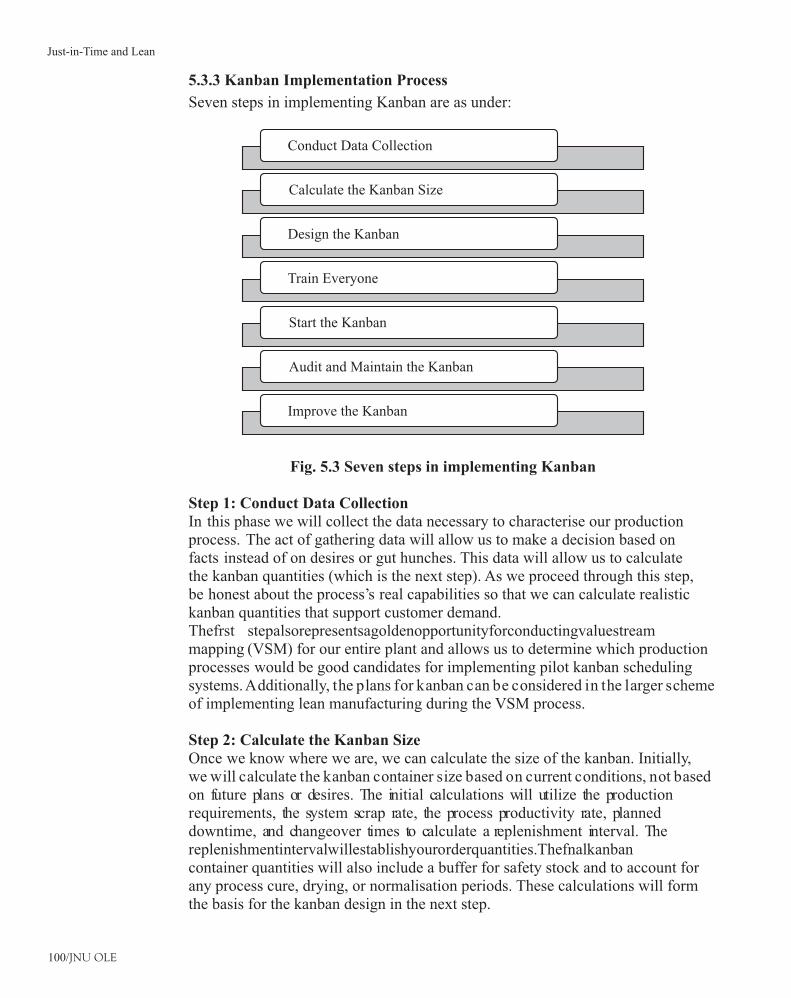
100/JNU OLE
5.3.3 Kanban Implementation Process
Seven steps in implementing Kanban are as under:
Conduct Data Collection
Calculate the Kanban Size
Design the Kanban
Train Everyone
Start the Kanban
Audit and Maintain the Kanban
Improve the Kanban
Fig. 5.3 Seven steps in implementing Kanban
Step 1: Conduct Data Collection In this phase we will collect the data necessary to characterise our production process. The act of gathering data will allow us to make a decision based on facts instead of on desires or gut hunches. This data will allow us to calculate the kanban quantities (which is the next step). As we proceed through this step, be honest about the process’s real capabilities so that we can calculate realistic kanban quantities that support customer demand. Thefrst stepalsorepresentsagoldenopportunityforconductingvaluestreammapping (VSM) for our entire plant and allows us to determine which production processes would be good candidates for implementing pilot kanban scheduling systems. Additionally, the plans for kanban can be considered in the larger scheme of implementing lean manufacturing during the VSM process.
Step 2: Calculate the Kanban Size Once we know where we are, we can calculate the size of the kanban. Initially, we will calculate the kanban container size based on current conditions, not based on future plans or desires. The initial calculations will utilize the production requirements, the system scrap rate, the process productivity rate, planned downtime, and changeover times to calculate a replenishment interval. The replenishmentintervalwillestablishyourorderquantities.Thefnalkanbancontainer quantities will also include a buffer for safety stock and to account for any process cure, drying, or normalisation periods. These calculations will form the basis for the kanban design in the next step.
Just-in-Time and Lean
101/JNU OLE
Step 3: Design the Kanban Once we have calculated the kanban quantities required to support production requirements based on current conditions, we’re ready to develop a design for the kanban. The completed kanban design will answer the question of how we will implement the kanban. The design will consider:
How will the material be controlled? •
What are the visual signals? •
What will be the rules for conducting the kanban? •
Who will handle the kanban transactions? •
Who will make the scheduling decisions? •
Who will resolve problems? •
What visual management items will be needed? •
What training will be required? •
What is the implementation schedule? •
The end product of this step should be a plan for implementation of the kanban, including implementation actions, action assignments, and schedule milestones.
Step 4: Train Everyone Before starting to schedule with kanban, don’t forget to train everyone on how the system will work and on their role in the process. Develop a simple presentation to explain the process and the visual signals. Also, review the rules during the training. Take the participants through what-if scenarios to help them understand their roles and the decision-making process. Conduct a dry run so that everyone knows how the kanban signals will be handled and what the signals mean. Keep the training focused on operating the kanban. Don’t try to make everyone a kanban expert— just train them on their piece of the puzzle.
Step 5: Start the Kanban Once we have a kanban design and training completed, we can start the kanban. Before we implement kanban scheduling, make sure that we have all our visual management pieces in place. Having the signals set up, control points marked, and the rules completed and coordinated before we start will avoid confusion and make training much easier. As we deploy the kanban, anticipate problems that may impact success and take action to prevent or mitigate these problems. Finally, during the deployment stage, develop a scheduling transition plan— determine the exact point for the change and the amount of inventory required to make the change.
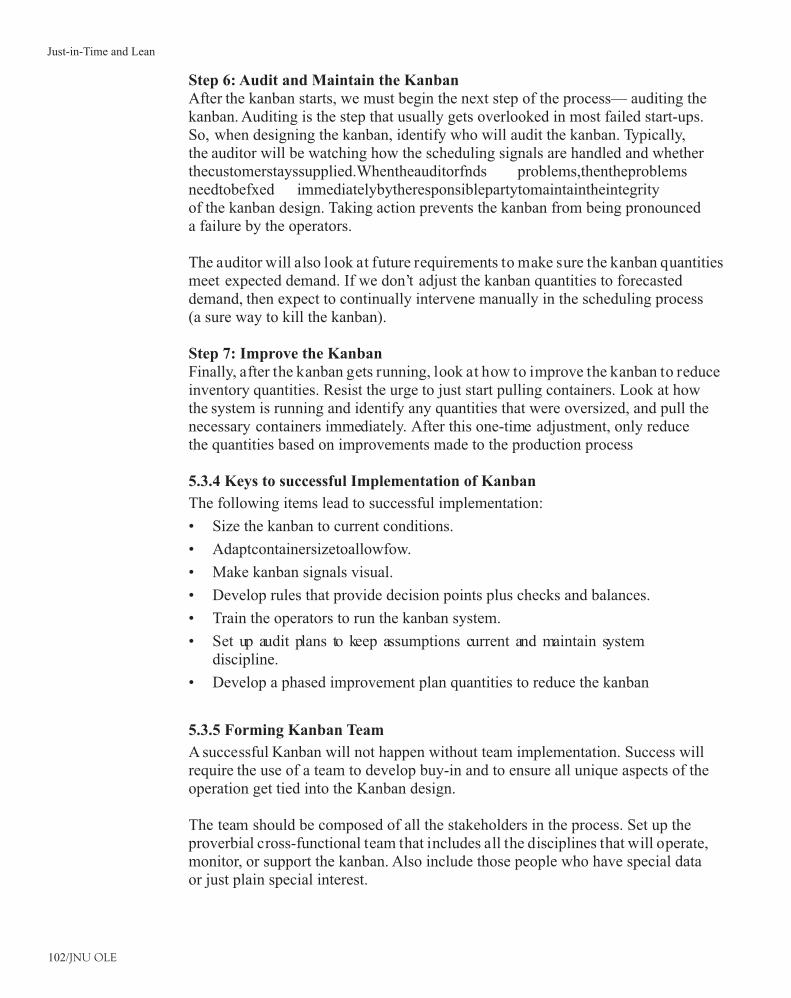
102/JNU OLE
Step 6: Audit and Maintain the Kanban After the kanban starts, we must begin the next step of the process— auditing the kanban. Auditing is the step that usually gets overlooked in most failed start-ups. So, when designing the kanban, identify who will audit the kanban. Typically, the auditor will be watching how the scheduling signals are handled and whether thecustomerstayssupplied.Whentheauditorfnds problems,thentheproblemsneedtobefxed immediatelybytheresponsiblepartytomaintaintheintegrityof the kanban design. Taking action prevents the kanban from being pronounced a failure by the operators.
The auditor will also look at future requirements to make sure the kanban quantities meet expected demand. If we don’t adjust the kanban quantities to forecasted demand, then expect to continually intervene manually in the scheduling process (a sure way to kill the kanban).
Step 7: Improve the Kanban Finally, after the kanban gets running, look at how to improve the kanban to reduce inventory quantities. Resist the urge to just start pulling containers. Look at how the system is running and identify any quantities that were oversized, and pull the necessary containers immediately. After this one-time adjustment, only reduce the quantities based on improvements made to the production process
5.3.4 Keys to successful Implementation of Kanban
The following items lead to successful implementation:
Size the kanban to current conditions. •
Adaptcontainersizetoallowfow.•
Make kanban signals visual. •
Develop rules that provide decision points plus checks and balances. •
Train the operators to run the kanban system. •
Set up audit plans to keep assumptions current and maintain system •discipline.
Develop a phased improvement plan quantities to reduce the kanban•
5.3.5 Forming Kanban Team
A successful Kanban will not happen without team implementation. Success will require the use of a team to develop buy-in and to ensure all unique aspects of the operation get tied into the Kanban design.
The team should be composed of all the stakeholders in the process. Set up the proverbial cross-functional team that includes all the disciplines that will operate, monitor, or support the kanban. Also include those people who have special data or just plain special interest.
Just-in-Time and Lean
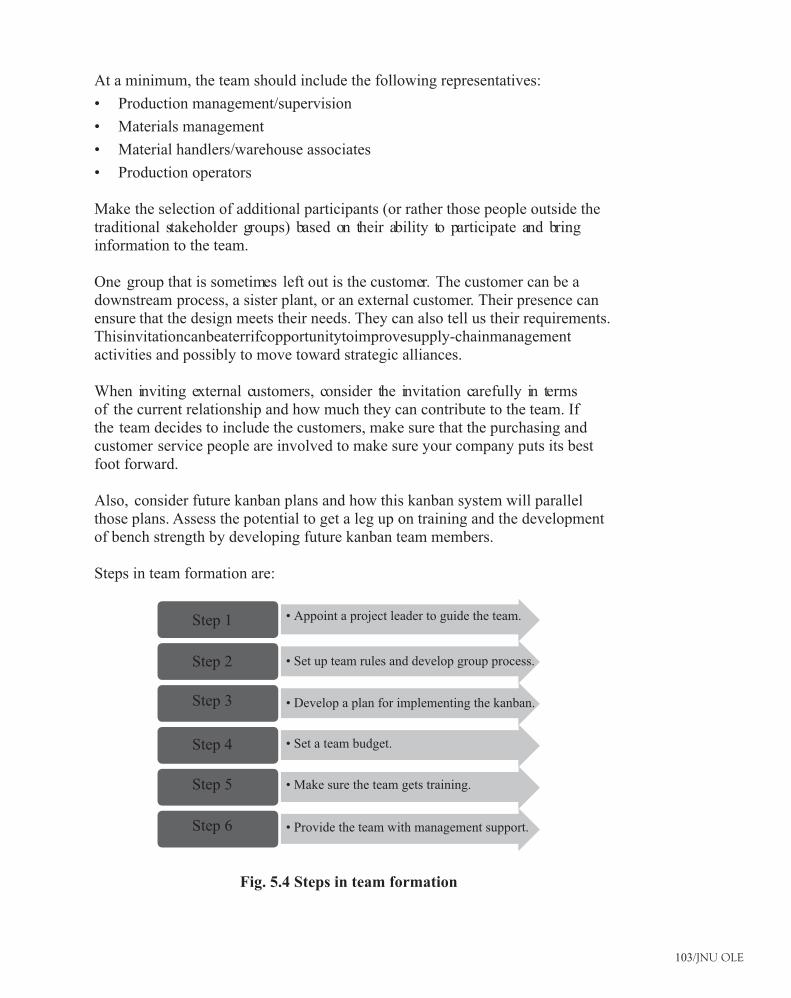
103/JNU OLE
At a minimum, the team should include the following representatives:
Production management/supervision •
Materials management •
Material handlers/warehouse associates •
Production operators•
Make the selection of additional participants (or rather those people outside the traditional stakeholder groups) based on their ability to participate and bring information to the team.
One group that is sometimes left out is the customer. The customer can be a downstream process, a sister plant, or an external customer. Their presence can ensure that the design meets their needs. They can also tell us their requirements. Thisinvitationcanbeaterrifcopportunitytoimprovesupply-chainmanagementactivities and possibly to move toward strategic alliances.
When inviting external customers, consider the invitation carefully in terms of the current relationship and how much they can contribute to the team. If the team decides to include the customers, make sure that the purchasing and customer service people are involved to make sure your company puts its best foot forward.
Also, consider future kanban plans and how this kanban system will parallel those plans. Assess the potential to get a leg up on training and the development of bench strength by developing future kanban team members.
Steps in team formation are:
Appoint a project leader to guide the team.Step 1 •
Set up team rules and develop group process.•
Develop a plan for implementing the kanban.•
Set a team budget.•
Make sure the team gets training.•
Provide the team with management support.
Step 2
•
Step 3
Step 4
Step 5
Step 6
Fig. 5.4 Steps in team formation
104/JNU OLE
5.4 Conduct Data Collection
Use this two-step process to ensure that we have necessary data for sizing the kanban:
gather data•
analyse data•
Changeover Time
Current State of the
Process
Process Downtime
Process Information- Description- Scrap- Production Rate
Fig. 5.5 The data collection process(Source: http://site.ebrary.com/lib/utspune/docDetail.action?docID=10044966
&p00=kanban)
5.4.1 Gather Data
The process of developing the current status of kanban candidates begins with gathering the necessary data to help characterize the potential process. To adequatelydefnetheprocesswewillneedthefollowinginformation:
number of parts produced by the process •
changeover times •
downtime •
scrap levels •
When collecting this data, be honest with yourselves. The data is intended to help us develop a usable design. If the data is inaccurate, then we will potentially doom the project to failure before it even starts. When starting the data collection process, use the following guidance to make sure the team collects the proper data:
Bespecifcaboutthedatarequired•
Assessthedatatoconfrmthatitmatchestheteam’sexperienceandknowledge•of the process
Just-in-Time and Lean
105/JNU OLE
5.4.2 Analyse the Data
Once we have the data consolidated, then it’s time to take a look at the data. Analyse the data for:
Consistency •
Accuracy •
Realism•
By consistency, we mean:
Are the units correct and are the numbers consistent with your •expectations?
Is everything recorded in the same measurement system, i.e., English or •metric?
Are the units mixed? •
Are the entries in the same dimensions— e.g., seconds versus minutes? •
Nothing slows down the kanban design process like trying to decipher unit problems. When considering accuracy, consider these items:
Are these the true scrap numbers, changeover numbers, downtime •numbers?
Haveweoverinfatedthenumbers?•
Have we lumped all the parts into the same category by giving them all the •same changeover time or scrap rate?
Also,lookatthedataforrealism.Doesthedatareallyrefect howwerunourprocess?
Make sure the numbers are consistent, accurate, and real. If we have misstated the numbers, it will become evident in the next phase when we calculate the kanban. We will see the errors when the calculated numbers tell us to increase inventory, or worse, when the errors tell us that we can cut our inventory in half.
5.5 Size the Kanban
There are two methods for sizing internal kanbans:
Thefrstmethodcalculatesthecontainerquantitiesbasedonthedatacollected.•This method allows us to optimise and potentially reduce the quantities based on the characteristics of our process.
The second method uses our existing production schedule and makes the •current production quantities the kanban quantities. This method allows for quicker implementation and less math, but does mot offer the potential for reducing levels.
106/JNU OLE
5.5.1 Determining the Replenishment Cycle
The scheduling interval and required production parts for the production process is referred to replenishment interval. It is the smallest batch size that our process can run and still keep the customer supplied. This interval essentially tells how long it takes to produce our adjusted production requirements. The replenishment interval is a function of the time available after considering our process parameter:
Production rate •
Changeover times •
Downtime (both planned and unplanned) •The replenishment cycle will ultimately be determined by the time left over for changeovers after subtracting required production run time from available production time. Therefore, the length of this cycle will be a function of how long it takes to ‘‘bank’’ enough changeover time to make all the necessary changeovers.
These production requirements also need to account for our scrap. When the required parts include the scrap, then the term becomes our ‘‘adjusted requirements.’’ These factors determine how many days, weeks, or months of inventory we keep on hand to supply the customer(s).
5.5.2 Implications of Scrap, Unplanned Downtime, and Changeover Times on Replenishment Intervals
Size the kanbans based on the current state of the production process. Undersizing of kanban can lead to:
Cause you to continually operate at danger levels•
Ultimately lead to your pronouncement of kanban as worthless and a waste •of time
5.5.3 Calculating the Buffer
The last step in the process of sizing the kanban is to calculate buffer. The buffers will provide us with the necessary lead time to produce the replenishment interval part quantities without stocking out our process or customer. The buffers also provide the necessary time required for process activities to occur. Buffer items that should be considered include:
Customer delivery requirements (and your promised service) •
Internal lead times •
Supplier lead times •
Comfort level •
Just-in-Time and Lean
107/JNU OLE
Buffers should be considered in terms of how much inventory is needed to prevent the item from impacting the customer deliveries. The secret is to hold enough inventories to protect the customer without holding too much inventory.
5.5.4 Calculating the Number of Kanban Containers
After we have determined how much buffer we require, then we are ready tocalculatethefnal kanbancontainerquantities.Tocalculatethenumberofcontainers, add together the buffer quantity and the replenishment interval, then multiplythisnumberbytheadjustedproductionquantity,andfnally dividebythe container capacity. Given below is the mathematical equation. To determine all the container quantities, repeat this calculation for each of the production part numbers produced by the process.
Where,
5.5.5 Perform a Reality Check
Some of the common pitfalls with initial calculations include:
Container sizes force added inventory •
Incorrect production data— production requirements, scrap, downtime, and •changeovers
Incorrect buffer assumptions •
Incorrect capacity assumptions •
The errors associated with each of these areas revolve around using data that refects‘‘whatwethinkhappens’’ versus‘‘whatreallyhappens.’’
5.6 Developing a Kanban Design
To successfully implement a kanban requires not only setting container quantities, but also the development of a design, deployment of the design, and training of the design.
While designing the kanban we should keep in mind three things:
Selecting the signalling mechanism for the kanban•
Developing the rules for operation of the kanban•
Creating the visual management plans for the kanban •
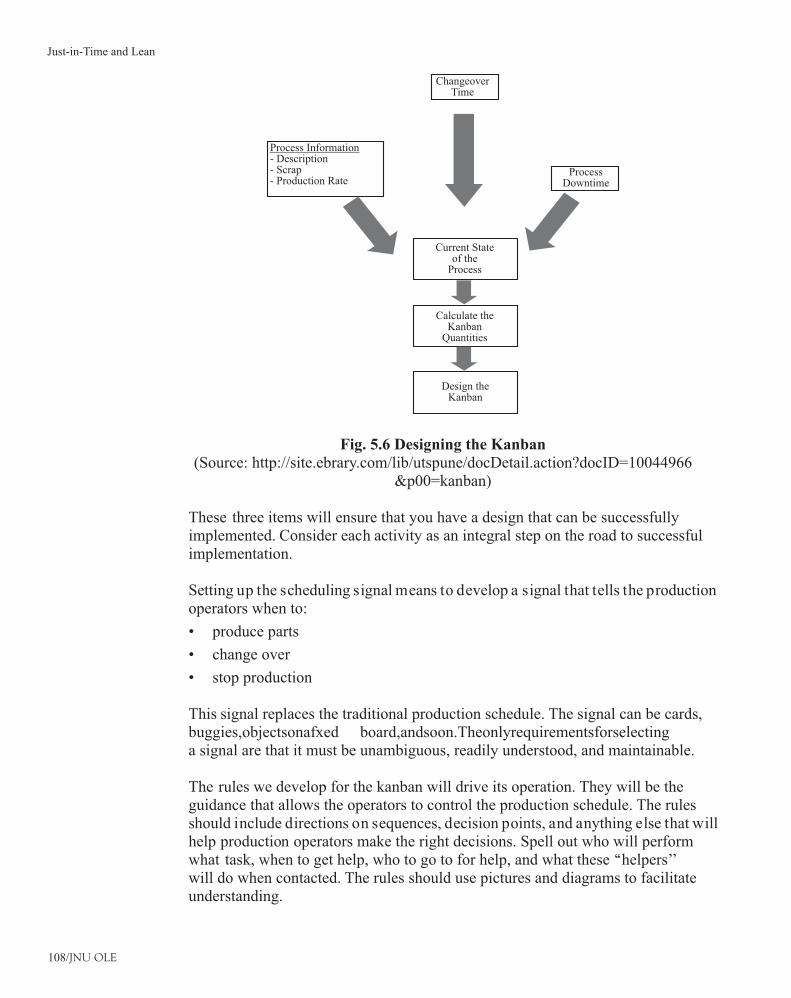
108/JNU OLE
Changeover Time
Current State of the
Process
Calculate the Kanban
Quantities
Design the Kanban
Process Downtime
Process Information- Description- Scrap- Production Rate
Fig. 5.6 Designing the Kanban(Source: http://site.ebrary.com/lib/utspune/docDetail.action?docID=10044966
&p00=kanban)
These three items will ensure that you have a design that can be successfully implemented. Consider each activity as an integral step on the road to successful implementation.
Setting up the scheduling signal means to develop a signal that tells the production operators when to:
produce parts •
change over •
stop production •
This signal replaces the traditional production schedule. The signal can be cards, buggies,objectsonafxed board,andsoon.Theonlyrequirementsforselectinga signal are that it must be unambiguous, readily understood, and maintainable.
The rules we develop for the kanban will drive its operation. They will be the guidance that allows the operators to control the production schedule. The rules should include directions on sequences, decision points, and anything else that will help production operators make the right decisions. Spell out who will perform what task, when to get help, who to go to for help, and what these ‘‘helpers’’ will do when contacted. The rules should use pictures and diagrams to facilitate understanding.
Just-in-Time and Lean
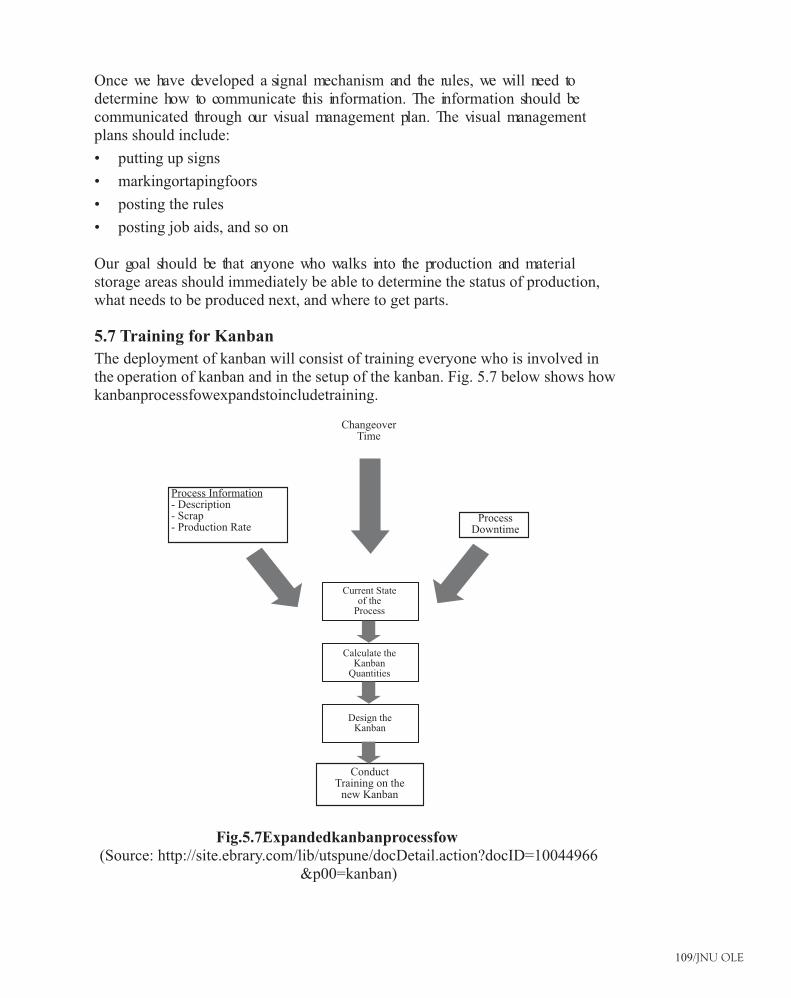
109/JNU OLE
Once we have developed a signal mechanism and the rules, we will need to determine how to communicate this information. The information should be communicated through our visual management plan. The visual management plans should include:
putting up signs•
markingortapingfoors•
posting the rules•
posting job aids, and so on•
Our goal should be that anyone who walks into the production and material storage areas should immediately be able to determine the status of production, what needs to be produced next, and where to get parts.
5.7 Training for Kanban
The deployment of kanban will consist of training everyone who is involved in the operation of kanban and in the setup of the kanban. Fig. 5.7 below shows how kanbanprocessfowexpandstoincludetraining.
Changeover Time
Conduct Training on the
new Kanban
Process Downtime
Process Information- Description- Scrap- Production Rate
Current State of the
Process
Calculate the Kanban
Quantities
Design the Kanban
Fig.5.7Expandedkanbanprocessfow(Source: http://site.ebrary.com/lib/utspune/docDetail.action?docID=10044966
&p00=kanban)
110/JNU OLE
5.7.1 Developing the Training Material
While creating the training, focus on how the kanban will work. An example of training manual outline is given below:
Kanban basics•
How kanban will work•What is the signal? ?
How will the material move? ?
Review of the rules ?
What are the scheduling decisions and the rules for making the decisions?•
Discusswhentocallforhelpandwhattodospecifcally whenencountering•a read signal?
Conduct a dry run.•
5.7.2 Serving as a Coach and Mentor
The last thing to remember as we roll out the training is that the role of a coach and a mentor is equally important. For many people, implementing kanban is a big step. Many operators have become dependent on the daily or weekly schedule. For manyofthemitisthefrst timetheyhavehadtomakedecisionsonaconsistentbasis at work.
Onthefip side,manyproductionmanagersandsupervisorsareusedtocallingall the shots. So when we transfer control of the line to the production operators, we have made a big culture change for the entire organization.
Therefore, the must coach and mentor all levels of the organization. Be sensitive to their concerns and fears.
5.7.3 Initial Start-up and Common Pitfalls
We need to take care of several items to ensure a successful implementation. We need to:
Confrmthedesignisimplemented•
Confrmtrainingiscomplete•
Check the inventories•
ConfrmthedesignisimplementedBefore starting the kanban, make sure that you have implemented the kanban design. To make sure you’re ready, verify the following items:
Are the kanban signals completed? •
Are the rules posted? •
Is the visual management information posted? •
Just-in-Time and Lean
111/JNU OLE
Havingthedesignimplementedsimplifestheprocessofchangingfromthecurrentscheduling system to the new kanban system. It also makes the training portion considerably easier since the operators and supervisors can readily connect the implemented kanban with the design presented during training.
If we implement the kanban without all the pieces in place, then make sure that everyone knows about the future additions and changes. Also, make sure we have awork-aroundplantohandledefciencies andhaveafrm dateforcompletingthe implementation.
ConfrmthattrainingiscompletedTraining is another key to implementing the design. Make sure that the training is scheduled and conducted. Also, make sure this training takes place on all affected shifts with all the participants— production operators, production supervisors, material handlers, and so on. Finally, set up a dry run of the kanban to identify any shortcomings of the design and to make sure everyone understands the process.
Checking the inventoriesChecking the inventories is the very last step before going live on kanban scheduling. In this step, determine whether the inventory level will support the transition to kanban scheduling. This assessment will determine whether we have enough inventories to let the system run on its own when we start the kanban.
Ifwehavesuffcient inventory,thenyouarereadytostart.Sticktoyouroriginalschedule and implement the kanban scheduling system.
Ifwedonothavesuffcient inventory,thendevelopaninventoryplanthatwillget us to the required level. Then you must slip the implementation date, and then pick a realistic new start date and get started building the necessary inventory.
Start-up issuesStart-up issues usually arise from miscommunications, lack of clarity about roles and responsibility, or not understanding the training. Do not let start-up problems causethedismissalofbenefts ofkanbanorlosefaithintheabilitytoimplementkanban. Once again, identify the problems and make corrections.
To help in getting through these pitfalls, given below is the list of four more common start-up problems:
Production operators and supervisors weren’t sure the kanban started •
Production operators didn’t follow the signals •
No one knew what to run because the kanban had no yellow signals or too •many red signals
Production operators cheated with the signals•
112/JNU OLE
5.8 Auditing the Kanban
Once the kanban has started, the next task becomes keeping it going and reducing the kanban quantities. The task of keeping the kanban going centres on the process of auditing and making corrections as problems are discovered.
The audit process consists of cycle counting and reviewing past production records. The cycle count will provide an up-to-the-minute inventory that can be compared to the signals to make sure they match. The review of production records will confrm thattheproductionoperatorsarefollowingthekanbansignals.Whenauditorsfnd aproblem,theymustimplementthenecessarychangesorseekhelpto get the kanban back on track. When the correction is not obvious, problem solving will be required to identify and correct the problem.
The auditing function also includes making sure the kanban size is adequate to support any production requirement changes. To determine whether the kanban size supports production requirements, compare the current production requirement’s forecast to the baseline quantities used to size the kanban. If the requirements have changed by 15 to 20 percent, then consider resizing the kanban.
The process of audit can be done in the following steps:
Formalising the audit process•
Finding the problem•
Assessing the impact of changing requirements on the kanban•
5.9 Improving the Kanban
One of the basic tenets of kanban is that once we implement, we should continuously improve the kanban by reducing the kanban quantities. A simple way to make this determination is to incrementally change each factor in the original kanban calculations to see how the replenishment interval changes.
Improving the processThe biggest improvement to the kanban replenishment interval, which in turn allows the biggest reduction in kanban containers, comes from reducing changeover times of the process.
Reducing Changeover Times To reduce changeover times you need to:
Improve the actions that occur while the process is down for changeover •
Perform as many changeover steps before the process stops•
Some of the actions to consider for improving the changeover include:
Coordinate the activities of the changeover participants •
Eliminate wasted motion •
Eliminate travel •
Just-in-Time and Lean
113/JNU OLE
Eliminate waiting •
Improve the start-up activities•
Reducing the ScrapAlthough reducing scrap may not yield as great a contribution to reducing kanban quantitiesasthereductioninchangeovertimes,ithasotherbenefts. Byreducingscrap we not only reduce kanban quantities, but we save scrap cost, improve customer relations, improve quality, and improve operator morale. Additionally, reducing scrap may allow us to reduce our safety stock due to the resultant reduced process variability.
Reducing downtimeJust like scrap reduction, downtime reduction requires a two prolonged approach
Permanently repair the chronic failures and improve the equipment’s general •condition.
Institute periodic maintenance to keep the equipment in like new condition. •
To achieve these two objectives, we suggest conducting a total productive maintenance (or TPM) workshop for the process. The TPM workshop will allow us to systemically approach the elimination of downtime. The workshop steps consist of:
Generating a repair and correction list that documents and tags all the •maintenance problems (called an abnormality list or yellow tag event).
Conducting a deep-cleaning event where all the operators physically remove •machine guards to literally clean the entire machine— inside and out.
Generating an access and contamination list of areas that are hard to reach for •cleaning and maintenance and where contamination sources (such as leaks or shavings) create cleaning and maintenance problems.
Generating job instructions for the operators (called TPM instructions) and •for the maintenance department (called preventive maintenance, or PM, instructions) to perform period maintenance on the process equipment.
Training of all the operators and maintenance technicians on the newly •implemented TPM and PM instructions.
Setting up a schedule for completing TPM and PM work instructions and •conducting periodic deep-cleaning events.
Incorporating process changes into the kanbanThe steps to reducing the kanban quantity include:
Recalculate the quantities with the new improvements. •
Assess whether the new quantities cause you to change your design. •
Communicate the changes to the operators and anyone else impacted by the •changes.
114/JNU OLE
Make the changes and get started. •
Keep auditing!•
Reducing buffersThe last area to assess for opportunities to reduce our kanban quantities is in the area of buffer reductions. Treat buffers separate from the other improvement areas because the replenishment interval is determined without considering the buffer. Additionally, the buffer is usually set by past practice and gut feel, with little or no calculations. In fact, these lead times are often entered into MRP scheduling systems and never visited again. The areas for focus when looking at buffer reductions are:
reducing the safety stocks•
reducing raw material lead times•
Just-in-Time and Lean
115/JNU OLE
Summary
Single Minute Exchange of Die (SMED) is one of the many lean production •methods for reducing waste in a manufacturing process. It forms one of the key factors behind the success of the Just – in – Time (JIT) concept
The concept of SMED arose in the late 1950s and early 1960s, when Shigeo •Shingo, chief engineer of Toyota, was contemplating Toyota’s inability to constructvehiclesinmaximallyeffcienteconomiclots.
With kanban scheduling, the operators use visual signals to determine how •much they run and when they stop or change over.
Kanban scheduling does not replace material planning, but rather takes the •material planning information and uses it to create the kanban.
The Japanese word kanban, which translates as ‘‘signboard,’’ has become •synonymous with demand scheduling. Kanban traces its roots to the early days of the Toyota production system.
Beneftsofkanbanschedulingare:reducesinventory,improvesfow,prevents•overproduction, places control at the operations level, creates visual scheduling and management of the process, improves responsiveness to changes in demand, and minimises risk of inventory obsolence
Seven steps in implementing kanban are: conduct data collection, calculate •the kanban size, train everyone, start the kanban, audit & maintain the kanban, and improve the kanban
A successful Kanban will not happen without team implementation. Success •will require the use of a team to develop buy-in and to ensure all unique aspects of the operation get tied into the Kanban design.
There is a two step process for collecting data for kanban namely: gather data •and analyse data
To successfully implement a kanban requires not only setting container •quantities, but also the development of a design, deployment of the design, and training of the design.
While designing the kanban we should keep in mind three things: selecting •the signalling mechanism for the kanban, developing the rules for operation of the kanban, and creating the visual management plans for the kanban
The deployment of kanban will consist of training everyone who is involved •in the operation of kanban and in the setup of the kanban
We need to take care of several items to ensure a successful implementation •ofkanbanWeneedto:confrm thedesignisimplemented,confrm trainingis complete, and check the inventories
The audit process of kanban consists of cycle counting and reviewing past •production records.
116/JNU OLE
One of the basic tenets of kanban is that once we implement, we should •continuously improve the kanban by reducing the kanban quantities. A simple way to make this determination is to incrementally change each factor in the original kanban calculations to see how the replenishment interval changes.
References
gembaacademy, 2009. • Quisk Changerover & SMED Overview [Video Online] Available at: < http://www.youtube.com/watch?v=jW-pl4HBxWM&playnext=1&list=PL738D3FD21583EF8D> [Accessed 13 July 2011].
Leannovation, 2009• . Kanban Explanation [Online video] Available at: < http://www.youtube.com/watch?v=tum1lLwy6gE> [Accessed 13 July 2011].
Girsih, B., • Single Minute Exchange of Die [Online] Available at: <http://www.productivity.in/knowledgebase/TQM/d.%20TQM%20Concepts/Single%20Minute%20Exchange%20of%20Dies.pdf> [Accessed 13 July 2011].
Kumar, S. & Suresh, N., 2009. • Operations Management. New age international publishers.
tplean.com, 2011. • Single Minute Exchange of Die (S.M.E.D) [Online] Available at: <http://tpslean.com/leantools/smed.htm> [Accessed 13 July 2011].
Sheldon, D., 2008. • Lean Materials Planning and Execution [Online] Available at: <http://books.google.co.in/books?id=0DFZW1jh2OYC&pg=PA35&dq=smed+in+lean&hl=en&ei=FeIWTv7oKsWemQWpl40E&sa=X&oi=book_result&ct=result&resnum=6&ved=0CEkQ6AEwBQ#v=onepage&q=smed%20&f=false> > [Accessed 13 July 2011].
Recommended Reading
Boyer, K. and Verma, R., 2009. • Operations and Supply Chain Management for the 21st Century. South-Western College Pub.
Gross, J. and McInnis, K., 2008. • Kanban Made Simple. Amacom.
Louis, R., 2006. • Custom Kanban: Designing the System to Meet the Needs of Your Environment. Productivity Press.
Just-in-Time and Lean
117/JNU OLE
Self Assessment
In kanban scheduling, the operators use ______signals to determine how much 1. they run and when they stop or change over.
picturea.
verbalb.
visualc.
processd.
SMED makes _______balancing much more achievable by reducing economic 2. lot size and thus stock levels.
inventorya.
loadb.
goodsc.
processd.
The deployment of kanban will consist of _________everyone who is involved 3. in the operation of kanban and in the setup of the kanban.
traininga.
workingb.
balancingc.
collectingd.
Which of the following statement is FALSE?4. The auditing function also includes making sure the kanban size is adequate a. to support any production requirement changes.
The audit process consists of cycle counting and reviewing past production b. records.
Start-up issues usually arise from miscommunications, lack of clarity about c. roles and responsibility, or not understanding the training.
Checkingtheinventoriesistheveryfrst stepbeforegoingliveonkanband. scheduling
Kanbanschedulingcanbedefnedas:5. product schedulinga.
process schedulingb.
manufacturing schedulingc.
demand schedulingd.
118/JNU OLE
The kanban prevents ________by specifying the production container sizes 6. and the maximum number of containers to be produced.
overproductiona.
delayb.
mistakesc.
reviewingd.
Which of the following statement is FALSE?7. The kanban schedule replaces the traditional weekly or daily production a. schedule with in manufacturing operations.
The kanban rules also tell the operators what to do when they have problems b. and whom to go to when these problems arise.
Kanban scheduling replaces material planning, but rather takes the material c. planning information and uses it to create the kanban.
The very nature of the kanban scheduling process sets up maximum and d. minimum inventory levels.
Whish of the following is the last step in the process of sizing the kanban?8. Calculating the Number of Kanban Containersa.
Perform a reality Checkb.
Developing a Kanban Designc.
Calculating the Bufferd.
The areas for focus when looking at buffer reductions are safety stock 9. assumptions and raw material ________.
lead timesa.
stockb.
storagec.
requirementd.
Which of the following is required for a successful kanban?10. kanban designa.
data collectionb.
team implementationc.
reality checkd.
Just-in-Time and Lean
119/JNU OLE
Chapter VI
Lean Systems
Aim
The aim of this unit is to:
introduce the concept of lean manufacturing•
discuss the concept of cellular manufacturing, continuous improvement,•
explain the key principles of lean manufacturing•
Objectives
The objectives of this unit are to:
evaluate the lean manufacturing tools and techniques•
identify the characteristics of successful lean manufacturing •
discuss the objectives, advantages and disadvantages of lean manufacturing•
Learning outcome
At the end of this unit, you will be able to:
understand the concepts of production smoothing, standardisation of work, •
and total productive maintenance
recognise the process of implementing lean•
descri• be the elements of lean
120/JNU OLE
6.1 Introduction to Lean Manufacturing
Lean Manufacturing is an operational strategy oriented toward achieving the shortest possible cycle time by eliminating waste. It is derived from the Toyota Production System and its key thrust is to increase the value-added work by eliminating waste and reducing incidental work. The technique often decreases the time between a customer order and shipment, and it is designed to radically improveproftability,customersatisfaction,throughputtime,andemployeemorale.
Thepopulardefnition ofleanmanufacturingandtheToyotaProductionSystemusually consists of the following:
It is a comprehensive set of techniques that, when combined and matured, •will allow you to reduce and then eliminate the seven wastes. This system notonlywillmakethecompanyleaner,butsubsequentlymorefexible andmore responsive by reducing waste.
Wikipediasays“Leanisthesetof‘tools’thatassistintheidentifcation and•steady elimination of waste, the improvement of quality, and production time and cost reduction. The Japanese terms from Toyota are quite strongly represented in ‘Lean.’ To solve the problem of waste, lean manufacturing has several ‘tools’ at its disposal.
6.1.1 Objectives of Lean Manufacturing
Lean Manufacturing, also called Lean Production, is a set of tools and methodologies that aims for the continuous elimination of all waste in the production process. Themainbeneftsofthisare:
lower production costs•
increased output •
shorter production lead times•
Morespecifcally,someofthegoalsinclude:
Defects and wastage: • Reduce defects and unnecessary physical wastage, including excess use of raw material inputs, preventable defects, costs associated with reprocessing defective items, and unnecessary product characteristics which are not required by customers.
Cycle times:• Reduce manufacturing lead times and production cycle times by reducing waiting times between processing stages, as well as process preparation times and product or model conversion times.
Inventory levels• : Minimise inventory levels at all stages of production, particularly works-in-progress between production stages. Lower inventories also mean lower working capital requirements.
Utilisation of equipment and space:• Use equipment and manufacturing space more efficiently by eliminating bottlenecks and maximising the rate of production though existing equipment, while minimizing machine downtime.
Just-in-Time and Lean
121/JNU OLE
Flexibility:• Havetheabilitytoproduceamorefexiblerangeofproductswithminimum changeover costs and changeover time.
Labour productivity:• Improve labour productivity, both by reducing the idle time of workers and ensuring that when workers are working, they are using their effort as productively as possible (including not doing unnecessary tasks or unnecessary motions).
Output:• In so far as reduced cycle times, increased labour productivity and elimination of bottlenecks and machine downtime can be achieved, companies cangenerallysignifcantlyincreasedoutputfromtheirexistingfacilities.
Mostofthesebenefts leadtolowerunitproductioncosts–forexample,moreeffective use of equipment and space leads to lower depreciation costs per unit produced, more effective use of labour results in lower labour costs per unit produced and lower defects lead to lower cost of goods sold.
Another way of looking at Lean Manufacturing is that it aims to achieve the same output with fewer inputs:
less time•
less space•
less human effort•
less machinery•
less materials•
less costs•
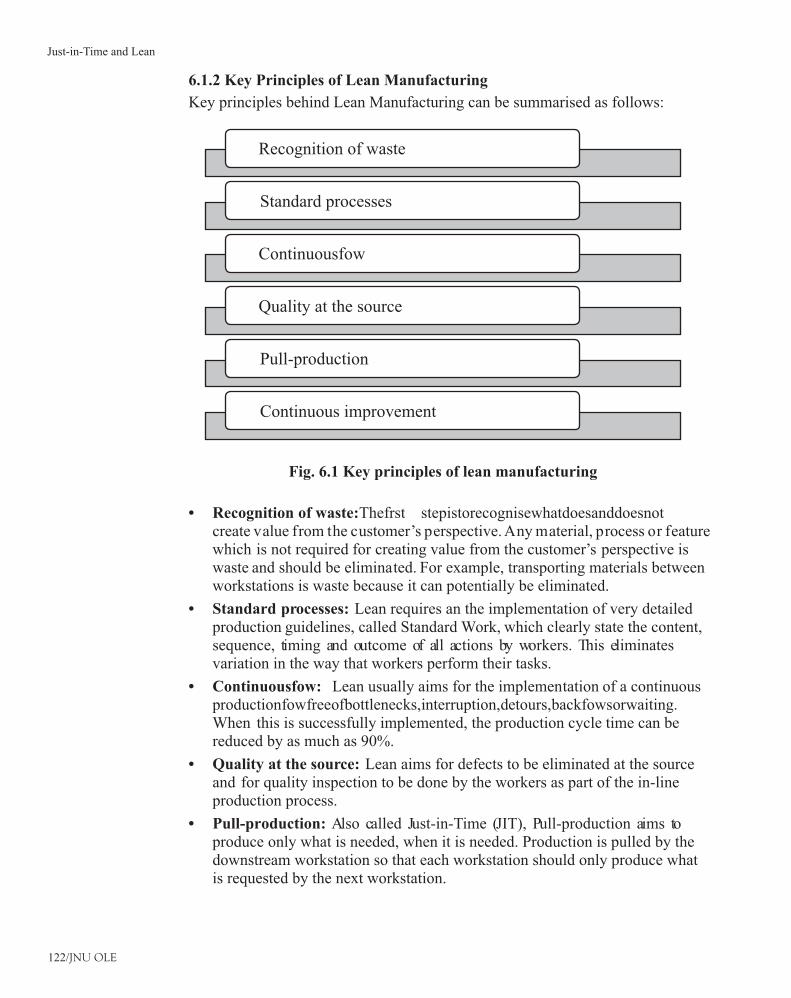
122/JNU OLE
6.1.2 Key Principles of Lean Manufacturing
Key principles behind Lean Manufacturing can be summarised as follows:
Recognition of waste
Standard processes
Continuousfow
Quality at the source
Pull-production
Continuous improvement
Fig. 6.1 Key principles of lean manufacturing
Recognition of waste:• Thefrst stepistorecognisewhatdoesanddoesnotcreate value from the customer’s perspective. Any material, process or feature which is not required for creating value from the customer’s perspective is waste and should be eliminated. For example, transporting materials between workstations is waste because it can potentially be eliminated.
Standard processes:• Lean requires an the implementation of very detailed production guidelines, called Standard Work, which clearly state the content, sequence, timing and outcome of all actions by workers. This eliminates variation in the way that workers perform their tasks.
Continuousfow:• Lean usually aims for the implementation of a continuous productionfowfreeofbottlenecks,interruption,detours,backfowsorwaiting.When this is successfully implemented, the production cycle time can be reduced by as much as 90%.
Quality at the source:• Lean aims for defects to be eliminated at the source and for quality inspection to be done by the workers as part of the in-line production process.
Pull-production:• Also called Just-in-Time (JIT), Pull-production aims to produce only what is needed, when it is needed. Production is pulled by the downstream workstation so that each workstation should only produce what is requested by the next workstation.
Just-in-Time and Lean
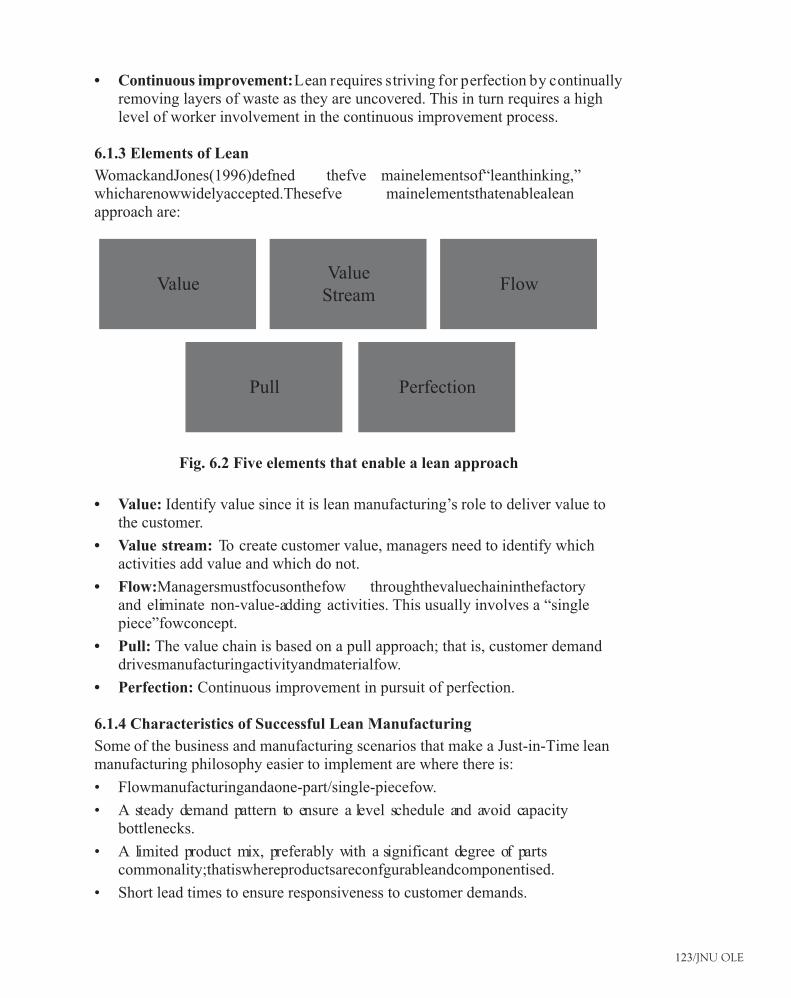
123/JNU OLE
Continuous improvement:• Lean requires striving for perfection by continually removing layers of waste as they are uncovered. This in turn requires a high level of worker involvement in the continuous improvement process.
6.1.3 Elements of Lean
WomackandJones(1996)defned thefve mainelementsof“leanthinking,”whicharenowwidelyaccepted.Thesefve mainelementsthatenablealeanapproach are:
ValueValue
Stream
Pull
Flow
Perfection
Fig. 6.2 Five elements that enable a lean approach
Value:• Identify value since it is lean manufacturing’s role to deliver value to the customer.
Value stream:• To create customer value, managers need to identify which activities add value and which do not.
Flow:• Managersmustfocusonthefow throughthevaluechaininthefactoryand eliminate non-value-adding activities. This usually involves a “single piece”fowconcept.
Pull:• The value chain is based on a pull approach; that is, customer demand drivesmanufacturingactivityandmaterialfow.
Perfection:• Continuous improvement in pursuit of perfection.
6.1.4 Characteristics of Successful Lean Manufacturing
Some of the business and manufacturing scenarios that make a Just-in-Time lean manufacturing philosophy easier to implement are where there is:
Flowmanufacturingandaone-part/single-piecefow.•
A steady demand pattern to ensure a level schedule and avoid capacity •bottlenecks.
A limited product mix, preferably with a significant degree of parts •commonality;thatiswhereproductsareconfgurableandcomponentised.
Short lead times to ensure responsiveness to customer demands.•
124/JNU OLE
High process and product quality to minimize rework and variations in material •requirements. Six- Sigma plays a major role in achieving high quality.
An ABC costing approach.•
However, it is still possible to take a lean approach where these conditions do not exist. While a lean manufacturing approach using Kanban is best suited to environments where there is stable demand, limited product mix and short lead times, a Theory of Constraints approach can be employed to support lean manufacturing in more complex production environments.
6.1.5 Advantages and Disadvantages of Lean Manufacturing
There are many inherent advantages in a lean manufacturing philosophy that have led to its extensive adoption. Four main advantages are:
An overriding focus on customer value-adding activities.•
The elimination of all categories of waste, effectively reducing the working •capital employed in delivering products to customers.
Reduced lead times and agility to respond to changes in demand due to a faster •materialfowthroughthefactory.
A focus on continuous improvement.•
As part of eliminating waste, inventories are reduced throughout the production processfromrawmaterialsupplies,throughwork-in-process,tofnished goods.This is achieved by the demand-based pull and replenishment of inventory only when there is demand for it. In contrast, when implementing MRPII, if the business processes and working practices are not reviewed, there is a risk of simply automating the waste. Lean manufacturing is not something that is implemented and left to run; it is a long-term journey in pursuit of perfection.
There is much to be said for the greater worker independence in the execution of plans under a lean philosophy. This leads to higher employee motivation and productivity as workers are asked to come up with solutions to problems as opposed tohavingtoworkwithfawed procedures.TotalqualityandSixSigmaalsoplaya major role in achieving lean manufacturing, since quality improvements play a key role in the battle to eliminate waste. However, these are outside the scope of this paper.
Disadvantages of lean manufacturingWhileleanmanufacturingyieldsmanybenefts, therearealsodrawbacksandsituations where it is not always the best approach.
Recording and accurately tracking inventory and material usage in an order-•less environment is a challenge, especially where material usage varies due to errors or the nature of the process, or there are very long lead times. The counter argument from the “lean gurus” is that recording variations is a waste since it does not add any value for the customer.
Capacityutilisationisoftensacrifced inconventionalJITenvironmentsin•favour of removing inventory. One solution to this is to create an annual hour’s contractwithstaffsothatcapacitycanbefexed.
Just-in-Time and Lean
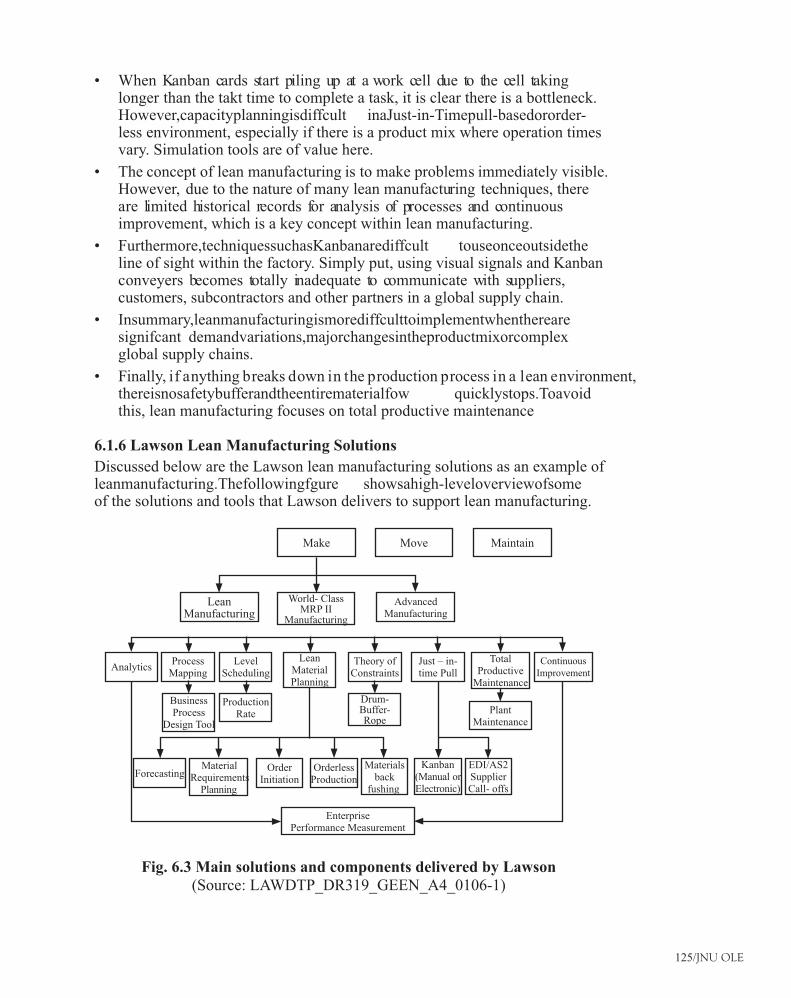
125/JNU OLE
When Kanban cards start piling up at a work cell due to the cell taking •longer than the takt time to complete a task, it is clear there is a bottleneck. However,capacityplanningisdiffcult inaJust-in-Timepull-basedororder-less environment, especially if there is a product mix where operation times vary. Simulation tools are of value here.
The concept of lean manufacturing is to make problems immediately visible. •However, due to the nature of many lean manufacturing techniques, there are limited historical records for analysis of processes and continuous improvement, which is a key concept within lean manufacturing.
Furthermore,techniquessuchasKanbanarediffcult touseonceoutsidethe•line of sight within the factory. Simply put, using visual signals and Kanban conveyers becomes totally inadequate to communicate with suppliers, customers, subcontractors and other partners in a global supply chain.
Insummary,leanmanufacturingismorediffculttoimplementwhenthereare•signifcant demandvariations,majorchangesintheproductmixorcomplexglobal supply chains.
Finally, if anything breaks down in the production process in a lean environment, •thereisnosafetybufferandtheentirematerialfow quicklystops.Toavoidthis, lean manufacturing focuses on total productive maintenance
6.1.6 Lawson Lean Manufacturing Solutions
Discussed below are the Lawson lean manufacturing solutions as an example of leanmanufacturing.Thefollowingfgure showsahigh-leveloverviewofsomeof the solutions and tools that Lawson delivers to support lean manufacturing.
Lean Manufacturing
Make Move Maintain
World- Class MRP II
Manufacturing
Advanced Manufacturing
AnalyticsProcess
Mapping
Forecasting
Level Scheduling
Production Rate
Order Initiation
Orderless Production
Materials back
fushing
Kanban (Manual or Electronic)
EDI/AS2 Supplier Call- offs
Drum- Buffer- Rope
Theory of Constraints
Just – in- time Pull
Plant
Continuous
Maintenance
Total
ImprovementProductive Maintenance
Lean Material Planning
Enterprise Performance Measurement
Business Process
Design Tool
Material Requirements
Planning
Fig. 6.3 Main solutions and components delivered by Lawson (Source: LAWDTP_DR319_GEEN_A4_0106-1)
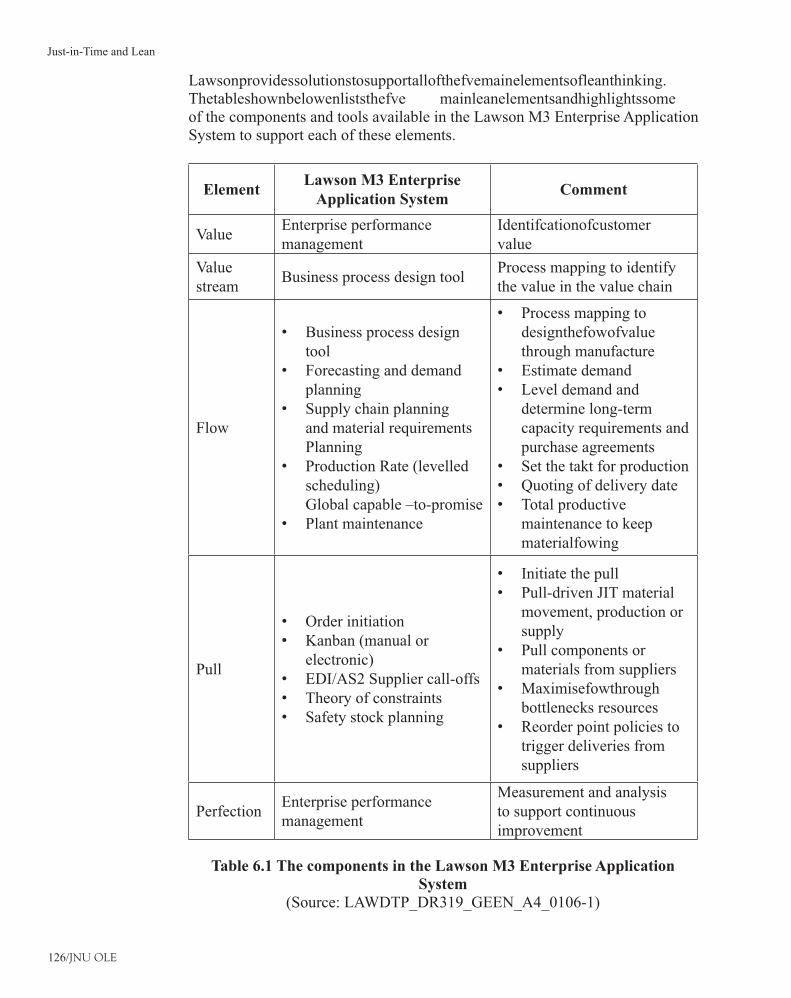
126/JNU OLE
Lawsonprovidessolutionstosupportallofthefvemainelementsofleanthinking.Thetableshownbelowenliststhefve mainleanelementsandhighlightssomeof the components and tools available in the Lawson M3 Enterprise Application System to support each of these elements.
ElementLawson M3 Enterprise
Application SystemComment
ValueEnterprise performance management
Identifcationofcustomervalue
Value stream
Business process design toolProcess mapping to identify the value in the value chain
Flow
Business process design •toolForecasting and demand •planningSupply chain planning •and material requirements PlanningProduction Rate (levelled •scheduling) Global capable –to-promisePlant maintenance•
Process mapping to •designthefowofvaluethrough manufactureEstimate demand•Level demand and •determine long-term capacity requirements and purchase agreementsSet the takt for production•Quoting of delivery date•Total productive •maintenance to keep materialfowing
Pull
Order initiation•Kanban (manual or •electronic)EDI/AS2 Supplier call-offs•Theory of constraints•Safety stock planning•
Initiate the pull•Pull-driven JIT material •movement, production or supplyPull components or •materials from suppliersMaximisefowthrough•bottlenecks resourcesReorder point policies to •trigger deliveries from suppliers
PerfectionEnterprise performance management
Measurement and analysis to support continuous improvement
Table 6.1 The components in the Lawson M3 Enterprise Application System
(Source: LAWDTP_DR319_GEEN_A4_0106-1)
Just-in-Time and Lean
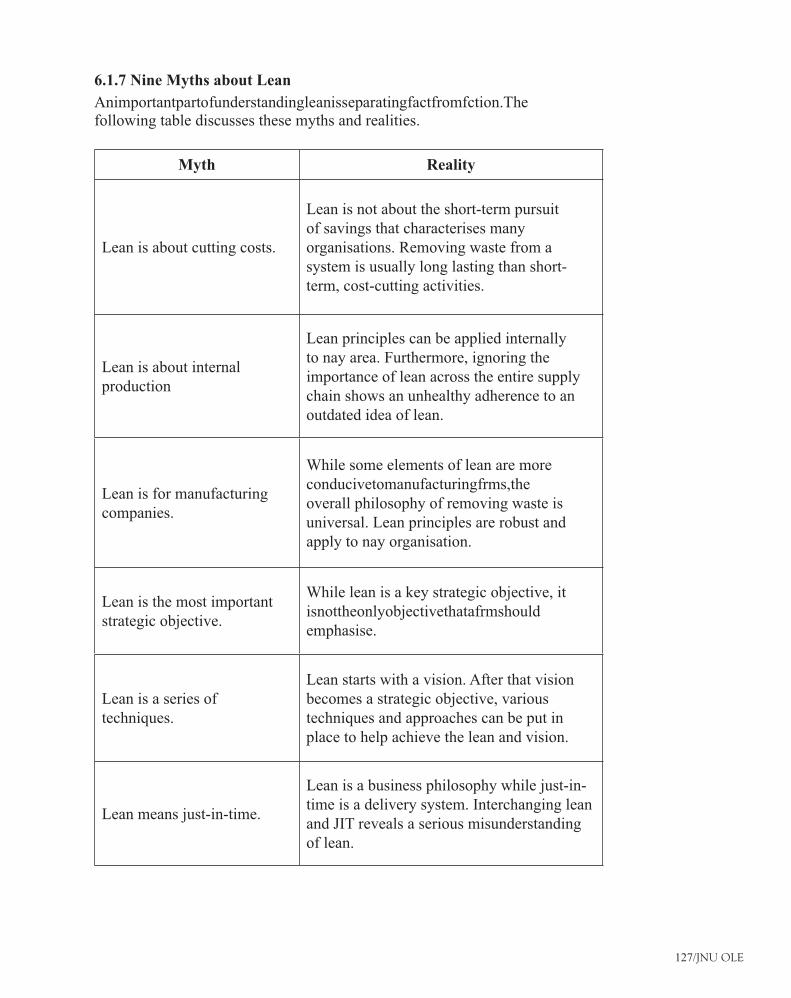
127/JNU OLE
6.1.7 Nine Myths about Lean
Animportantpartofunderstandingleanisseparatingfactfromfction.Thefollowing table discusses these myths and realities.
Myth Reality
Lean is about cutting costs.
Lean is not about the short-term pursuit of savings that characterises many organisations. Removing waste from a system is usually long lasting than short-term, cost-cutting activities.
Lean is about internal production
Lean principles can be applied internally to nay area. Furthermore, ignoring the importance of lean across the entire supply chain shows an unhealthy adherence to an outdated idea of lean.
Lean is for manufacturing companies.
While some elements of lean are more conducivetomanufacturingfrms,theoverall philosophy of removing waste is universal. Lean principles are robust and apply to nay organisation.
Lean is the most important strategic objective.
While lean is a key strategic objective, it isnottheonlyobjectivethatafrmshouldemphasise.
Lean is a series of techniques.
Lean starts with a vision. After that vision becomes a strategic objective, various techniques and approaches can be put in place to help achieve the lean and vision.
Lean means just-in-time.
Lean is a business philosophy while just-in-time is a delivery system. Interchanging lean and JIT reveals a serious misunderstanding of lean.
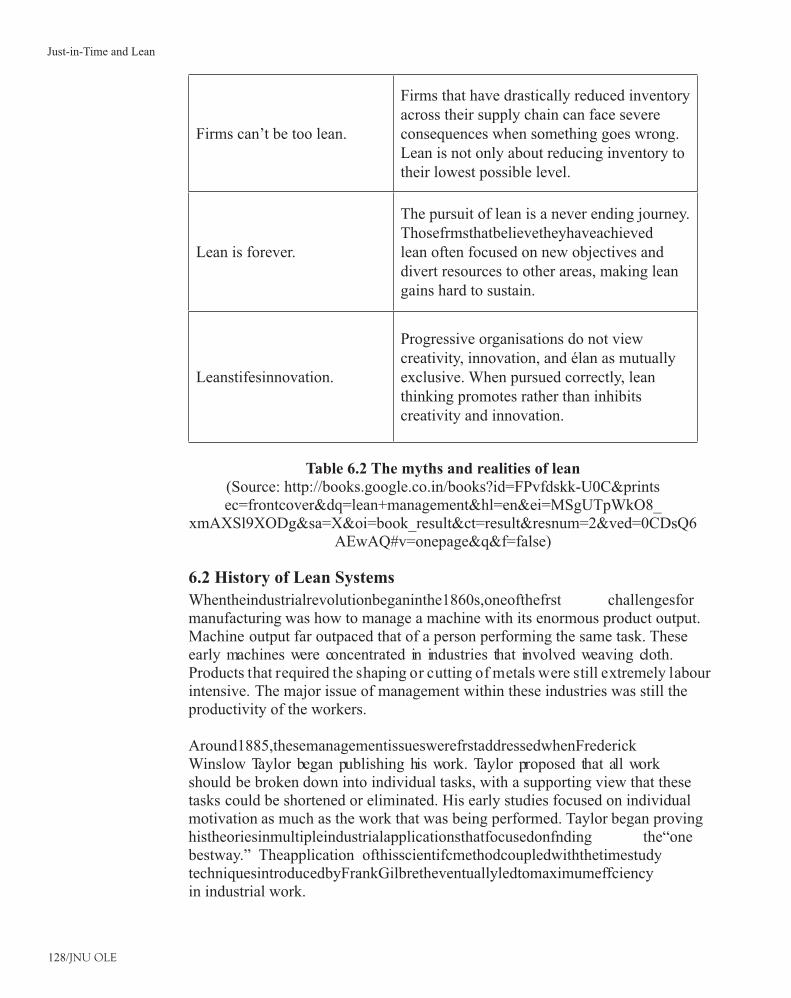
128/JNU OLE
Firms can’t be too lean.
Firms that have drastically reduced inventory across their supply chain can face severe consequences when something goes wrong. Lean is not only about reducing inventory to their lowest possible level.
Lean is forever.
The pursuit of lean is a never ending journey. Thosefrmsthatbelievetheyhaveachievedlean often focused on new objectives and divert resources to other areas, making lean gains hard to sustain.
Leanstifesinnovation.
Progressive organisations do not view creativity, innovation, and élan as mutually exclusive. When pursued correctly, lean thinking promotes rather than inhibits creativity and innovation.
Table 6.2 The myths and realities of lean(Source: http://books.google.co.in/books?id=FPvfdskk-U0C&printsec=frontcover&dq=lean+management&hl=en&ei=MSgUTpWkO8_
xmAXSl9XODg&sa=X&oi=book_result&ct=result&resnum=2&ved=0CDsQ6AEwAQ#v=onepage&q&f=false)
6.2 History of Lean Systems
Whentheindustrialrevolutionbeganinthe1860s,oneofthefrst challengesformanufacturing was how to manage a machine with its enormous product output. Machine output far outpaced that of a person performing the same task. These early machines were concentrated in industries that involved weaving cloth. Products that required the shaping or cutting of metals were still extremely labour intensive. The major issue of management within these industries was still the productivity of the workers.
Around1885,thesemanagementissueswerefrstaddressedwhenFrederickWinslow Taylor began publishing his work. Taylor proposed that all work should be broken down into individual tasks, with a supporting view that these tasks could be shortened or eliminated. His early studies focused on individual motivation as much as the work that was being performed. Taylor began proving histheoriesinmultipleindustrialapplicationsthatfocusedonfnding the“onebestway.” Theapplication ofthisscientifcmethodcoupledwiththetimestudytechniquesintroducedbyFrankGilbretheventuallyledtomaximumeffciencyin industrial work.
Just-in-Time and Lean
129/JNU OLE
The Henry Ford model of assembly line production caused a manufacturing transformation from individual craft production to mass production. This helped to create a marketplace based on economies of scale and scope. Later, giant organisations designed around functional specialisation and minute divisions of labour grew out of the need to meet the requirements of the new economies of scale. This dynamic reduced unit costs.
Ford also made contributions to mass production and consumption in the realm of process engineering. The hallmark of this system was standardisation. This meant the standardisation of components, manufacturing processes, and a simple, easy-to-manufacture standard product. Standardisation required nearly perfect interchange ability of parts. To achieve this, Ford exploited the advances being made in machine tools and gauging systems. These innovations facilitated the sequential building of products made on a moving, continuous assembly line.
By the 1930s, Ford’s standardised product, with his direct planning and control systems, was made obsolete by innovations in marketing and organisation at General Motors.
Albert P. Sloan is also credited with setting the standard for modern management organizations. He is best known for the multi-product organisation structure in which each major operating division serves as a distinct product market.
The challenge in manufacturing during the 1930s shifted to product variety. While manufacturing through the 1930s and 1940s was still driven by large quantity production runs, the huge production runs enjoyed by the 17 years of the Model T were no longer possible. Consumers were more and more the drivers of change in a product life cycle. As the 1950s began, demand for specialized products started to take hold. Not only were products more specialised, but they also had limited life cycles.
Up until this time, manufacturers had focused primarily on labour productivity to achieve a competitive advantage. Innovations in technology became the new productivity tools that allowed many manufacturers to remain competitive. This technology and productivity was a key differentiator between one manufacturer and another. This period marked the advent of technological changes in machine tool cutting points, synthetic abrasives, and multiple rotary cutting points, particularly in lathes and milling machines. These machine tool innovations and the Sloan return-on-investment performance measurements were custom made for each other.
130/JNU OLE
Batch manufacturing methods had arrived! In batch manufacturing, production run quantities are based on what makes a machine productive and not necessarily on what the market requires. This focus on economies of scale batch production continues to pit manufacturing departments against marketing departments throughoutallindustry.Thisconfict isstillevidentinmanufacturingcompaniestoday. Batch manufacturing had allowed machines to become productive when large quantities of a product were built.
During the 1950s, the commercial availability of computers began to have a profound effect on business information processing. Until the advent of the computer, the functions of logistics, inventory management, and production planning constituted a chronic, intractable problem for any discrete manufacturer engagedinmultiple-stageproductionofproductsfromrawmaterialtofnishedproduct.
Around the early 1960s, as computing power began to be more cost effective, early pioneers began the development and installation of the early computer based MRP systems. Today, the MRP system is the primary tool used for production planning,inventorycontrol,shopfoor control,costing,andcapacityplanningby the modern manufacturer.
While an MRP system is a valuable weapon in the manufacturing arsenal, practitionerscontinuetograpplewiththestillconfictingobjectivesofbatchmanufacturingandoptimisinginventories.Unlessfltered asasystemparameter,the MRP solution will solve for the smallest inventory and shortest manufacturing lead time. If followed precisely, MRP recommendations will yield the expected results.Modifcations, andworkrulesputinplacetooptimiseeffciency andutilisation of individual work centres, generally degrade the output of the MRP system. Compromise is the culprit of a diminished MRP system.
During the 1950s and 1960s in the Far East, particularly Japan, a different manufacturing model was being formulated. Leading this charge was the Toyota MotorCompany. ToyotacontendedthatthestandardthinkingofCost+Proft=SalesPricewasincorrect.ItbelievedthatProft =SalesPrice–Costs.Fromthispremise, Toyota began to create a manufacturing system that would concentrate on the management of costs. Cost became translated as waste, and wastes of all varieties were targeted for elimination.
Key areas targeted were work-in-process inventory and safety stock. While many companies in the United States and Europe were attempting to calculate the optimum batch sizes for production, Toyota worked toward the goal of being abletobuildamixofproductsinaone-piecefow. Havingthecapabilitytobuildamixofproductsinaone-piecefow (mixed-productLeanline)satisfed manykey objectives for Toyota, raising productivity and reducing costs and inventory while simultaneously creating rapid customer response.
Just-in-Time and Lean
131/JNU OLE
Through the 1960s and into the 1970s, these two models of manufacturing developed down separate paths. One sought better ways to manage batch production by making ongoing improvements to the MRP planning model, while theotherconcentratedonfnding andfne-tuning waystoallowaone-piecefowofamixofproducts.Soon,thebenefts achievedbythesetwodisparatestrategiesmade themselves apparent.
Into the 1980s, many product markets in the United States and Europe started to come under pressure from foreign manufacturers. Products were being brought to market with higher quality and lower price. The days of planned obsolescence were over. Consumers came to expect higher quality and lower prices as a requisite for purchase. Western manufacturers began to lose market share. Some manufacturers faded away while others began to look diligently for better ways to compete. Many abandoned the old batch manufacturing models in favour of the more responsive method of Lean manufacturing in pursuit of the goals of faster response, fewer inventories, higher quality, and reduced costs.
A study that was done at the Massachusetts Institute of Technology of the movement from mass production toward lean manufacturing awoke the US manufacturers from their sleep. The study underscored the great success of Toyota at NUMMI (New United Motor Manufacturing Inc.) and brought out the huge gap that existed between the Japanese and Western companies developed, produced anddistributedproductswithhalforlesshumaneffort,capitalinvestments,foorspace, tools, materials , time, and overall expense.
6.2.1 Lean Manufacturing Tools and Techniques
Lean emphasizes the learning by doing approach, where the members of a process improvement team are those most closely associated with adding value to the product.Thewholeprocessisbasedondefning customervalue,focusingonthevaluestream,makingvaluefow, andlettingcustomersdeterminetheproductorservice they want, with a relentless pursuit of perfection in a timely manner at an appropriate price.
We identify the value stream as a process, or series of steps, from concept to launch to production, and then the order to delivery and the disposition; in other words,fromtherawmaterialstodeliveryofthefnished producttothecustomer.Value stream steps can be value- added, non-value added, or non-value-added-but-necessary. Lean emphasizes the elimination or reduction of steps that do not have value. We start with the customer’s request, strive for no interruptions or waste, avoidbatchprocessing,andstriveforsmoothjust-in-timeone-piecefow.
132/JNU OLE
The tools which are productive for lean initiatives are as under:
One-Piece Flow1. One-piecefowdescribesthesequenceofproductoroftransactionalactivities(e.g.,insurance claims) through a process one unit at a time. In contrast, batch processing creates a large number of products or works on a large number of transactions at one time – sending them together as a group through each operational step.
Inone-piecefow, focusisontheproductoronthetransactionalprocess,ratherthanonthewaiting,transporting,andstorageofeither.One-piecefow methodsneed short changeover times and are conducive to a pull system.
One-piecefowadvantagesare:
Reduced customer order to shipment times•
Reduction of work in progress•
Early detection of defects•
Increasedfexibilityforcustomerproduct/transactionaldemands•
Reduced operating costs through exposure/elimination of non-value-added •waste
Aprojectprocessimprovementcouldbeaworkfow changethatreducesbatchsizeorchangesfrombatchprocessingtosingle-piecefow.
Poka-Yoke(ErrorProofng)2. A poka-yoke is a mechanism that works with Jidoka (means automation with a human touch) to either prevent a mistake or make a mistake obvious at a glance; for example, an operator who creates customized assemblies from small bins in front of him: One approach would be to give the operator a list of parts to assemble by taking them as needed from the bin. This approach can lead to assembly errors sinceheorshemightforgettoincludeoneofthepartsoraddpartsnotspecifed.A poka-yoke solution might be to install lights on all bins. When the operator is tocreateanewassembly,thebinsthatcontainthespecifedpartsfortheassemblywill be illuminated. The operator then systematically removes one part from each bin and places it in front of him. He does this until one part has been removed from each bin and he knows the assembly is complete when no parts remain in front.
Poka-yoke offers solutions to organisations that experience frequent discrepancies in the packaging of their products. For example, someone forgot to include instructions or forgot to include a mounting screw. Poka-yoke ideas or devices can be more effective than simple demands on workers to “be more careful.” Improvement focus should always be given to what can be done to error-proof a processmorethanoninspectingthequalityofthefnishedproduct.
Just-in-Time and Lean
133/JNU OLE
Visual Management3. Visual management can address both visual display and control. Visual displays present information, while visual control focuses on a need to act. Information needs to address items such as schedules, standard work, and quality and maintenance requirements. Visual control can address whether a production line is running according to plan; it can highlight problems.
In both manufacturing and transactional processes, visual management systems can include
Visual management techniques:
Expose waste for elimination or prevention•
Increase visibility and use of operational standards•
Enhanceeffciencythroughanorganizedworkplace•
Visual management organisations:
Improve quality through error prevention, detection, and resolution•
Increaseworkplaceeffciency•
Improve workplace safety•
Reduce total costs•
The 5S Method4. Creation of standardised work is a primary reason for using the 5S method. It offersabasichousekeepingdisciplinefortheshopfoorandtheoffce.Itincludesthefollowingfvesteps.
A. Sort: Clearly distinguish what is needed or not needed among the tools, supplies, and other materials.
Tag items if not used within a month or that are unnecessary to perform a task, •orthatarebrokenornotusable,orinsuffcientforanintendedpurpose.
Manufacturing: List all red-tagged items on a sheet of paper. Remove the red-•taggeditemsandplacetheminanidentifedred-tagstoragearea.Allitemsmustbe reviewed by the supervisor and initialled – if approved for removal.
B. Straighten: A marked space exists for all items in the work area, allowing for easy, immediate removal.
Organise remaining items in the work area by usage. Label daily usage items •on a shadow board. Place weekly usage items in labelled drawers, placing monthly usage items under the work station or in a cabinet labelled with pictures and text.
C. Shine: Work area is cleaned and kept in an orderly condition during working hours.
Determine what needs to be done to create a visually attractive workplace. •Keep the workstation clean and plan a weekly 10-minute cleaning maintenance for each area.
134/JNU OLE
Manufacturing illustration: Clean tools and paint machines as needed. Sweep •foor. Tightenanyloosefttings. Createspecifc cleaninginstructionsforthework environment, including which cleaning supplies to use and where. Add maintenance items to monthly schedule.
D. Standardise: Workmethod,tools,andidentifcationmarkingsmustbestandard and recognisable throughout the factory. 5S methods are to be applied consistently in a uniform and disciplined manner.
Identify source for waste disposal. Workers must look at their jobs and •machines while performing tasks to see where debris is created. Create discipline to prevent individuals from becoming the source of waste.
Manufacturing: Check machine(s) for oil leaks, standardize maintenance, and •check for broken but functional switches that need repair.
E. Sustain: 5S is a regular part of the working process with continuous actions required to maintain and improve the production environment. Established procedures are maintained with checklists. Areas must be kept clean so that everythingisclearlyidentifedasrequiredorunnecessary.
A maintenance list should be developed and discipline maintained.•
Create a check list that includes tagged items removed from the work station. •List remaining items and locations, document steps for the cleaning process, and list action items for preventive maintenance.
Value Stream Mapping5. Valuestreammapping,ormaterialandinformationfow,shouldplayaveryproductive role in the entire lean process since practitioners depict current and futureconditionswhentheydevelopplanstoinstallleansystems.Infniteattentionshouldbegiventoestablishingfow,eliminatingwaste,andaddingvalue.
Kaizen6. Kaizen is another pervasive tool since it is a focused methodology that uses teams for making improvements. If analysis indicates that this is the best systematic approach for an improvement project, then a Kaizen event should be undertaken. A continuous improvement process that empowers people to use their creativity, Kaizencanbeusedtofx specifc problems,workfow issues,oraparticularaspect of a business.
Based on quantitative analysis, a good starting point is to look at the way people work – identifying waste through a time and motion study of tasks with input from both workers and managers. Generic steps for conducting a Kaizen event are:
prepare and train the team•
analyze present methods•
brainstorm, test, and evaluate ideas•
implement and evaluate improvements•
results and follow• -up
Just-in-Time and Lean
135/JNU OLE
Kanban7. A system that creates product that is then sold after it is produced is called a push system. If there is no mechanism to keep work in work-in-progress below some level that is consistent with product demand, production output can become excessive, which can lead to many problems, including product storage.
In pull systems, products are created at a pace that matches customer demand. Kanbans are used to buffer variations in customer or next process step demands. A most familiar form of Kanban is the American-style supermarket where each product has a short-term buffer, replenished at the rate of customer demand. The Japanese word Kanban refers to the pulling of a product through a production process. The intent of Kanban is to signal a preceding process that the next process needs parts or material.
Rules to consider when operating an effective Kanban:
No withdrawal of parts is to occur without a Kanban where subsequent •processes are to withdraw only what is needed.
Defective parts are not to be used for later processes•
Preceding processes are to produce only the exact quantity of parts withdrawn •by successive processes.
Variability in the demand process should be minimized.•
Demand Management8. DemandManagementworksbestwhenthereisauniformfowofproductswithinthe system. While a company’s policies should encourage stability, unfortunately that is not always the case. For example, a reward system for product sales might encourage a spike in manufacturing demands at the end of each month.
If these signals are ready incorrectly, it can lead to supply chain problems in the form of an inaccurate product forecast. Accounting procedures can encourage management also to produce excess inventory in order to make the number on which they are evaluated look better.
Supply chain improvements can be expected when lead times are reduced, which would improve forecasting accuracy, and when there is a sharing of supply-chain information that leads to agreement-to uniform schedules.
Another improvement opportunity is to change internal policies that impact demand volume. For example, consider an end-of-the-month/quarter sales-target bonus policy that result in the sales department giving temporary price concessions so they meet their monthly/quarter sales targets. This policy could be a candidate for change, since the sales-force reward policy may be causing a manufacturing demand peak that leads to much overtime and quality issues.
136/JNU OLE
Heijunka9. Heijunka is a traditional lean scheduling methodology for environments that contain a repetitive mix of products or a family of products. Heijunka is a Kanban card post-box system that is usually at the pacemaker process. A Heijunka box provides process level scheduling or pacing, schedule visibility, and early problem highlighting.
Levelled production is customer order averaging so that small sequenced cycles produce the required volume and product mix. In a Heijunka box, customer monthly or weekly volume demands can be levelled into daily demands.
Pull systems and Heijunka work well hand-in-hand. However, system improvement may be needed for success, for example, through quick change over. When the visualsystemindicatesaproblem,promptidentifcationandcorrectionareabsolutely essential.
Continuous Flow and Cell Design10. The disadvantages of traditional batch production are the large amounts of work in progress, large conveyance time for parts, large lead times, and large liability for defects.
Small lot production removes the walls from batch production, and reduces work in progress, lead times, and conveyance. It can be impossible, however, to balance task durations for machine operations with this push system since one operator can spend a great deal of time waiting, and inventory can build up at a station.
Within U-shaped layouts, employees are cross-functionally trained and move with changing cell layouts. This means that one person can control the work in progress. Close proximity of workers also enhances communications, makes quick defective part detection possible, and workload adjustments can be made for volume changes.
Changeover Reduction11. One of Lean’s major objectives is reduction of lead time. To achieve this, the size of batches often needs reduction, which, in turn, creates a focus on reducing changeovertimes–i.e.,thetimefromthelastpieceofonebatchtothefrst pieceof the next batch.
Changeover time can have several components; for example, internal, when a machine is stopped, and external, which involves preparation. Other types of changeovers are manufacturing line changeover, maintenance operations, vehicle oraircraftloadingorunloading,andoffceoperations.
Just-in-Time and Lean
137/JNU OLE
It’s important not only to reduce the mean changeover time, but also to reduce its variability using a standardized process. Moving internal activities to external ones, when possible, permits more up time for a machine since the maximum amount of preparation is accomplished before it is stopped. Example applications for improving external activities are placing tools on carts near a die and using colour codes to avoid confusion. Example applications for improving internal activities are quick-change nuts and standardization of activities.
6.2.2 Cellular Manufacturing
Cellular manufacturing is one of the cornerstones when one wants to become lean. Cellular manufacturing is a concept that increases the mix of products with the minimum waste possible. A cell consists of equipment and workstations that are arrangedinanorderthatmaintainsasmoothfow ofmaterialsandcomponentsthroughtheprocess.Italsohasassignedoperatorswhoarequalifed andtrainedto work at that cell.
Arranging people and equipment into cells has great advantage in terms of achievingleangoals.Oneoftheadvantagesofcellsistheone-piecefowconcept, which states that each product moves through the process one unit at a time without sudden interruption, at a pace determined by the customer’s need. Extending the product mix is another advantage of cellular manufacturing. When customers demand a high variety of products as well as faster delivery rates, it isimportantintheprocesstoaccommodatetheirneeds.Thisfexibility canbeachieved through grouping similar products into families that van be processes on the same equipment in the same sequence. This will also shorten the time required fro changeover between products, which will encourage production in smaller lots.Otherbeneftsassociatedwithcellularmanufacturinginclude:
Inventory (especially WIP) reduction•
Reduced transport and material handling•
Better space utilisation•
Lead time reduction•
Identifcationofcausesofdefectsandmachineproblems•
Improved productivity•
Enhanced teamwork and communication•
Enhancedfexibilityandvisibility•
6.2.3 Continuous Improvement
Continuous improvement is another fundamental principle of lean manufacturing. Kaizen which is Japanese word for a continuous endeavour for perfection has become popular in the west as a paramount concept behind good management. Kaizen is a systematic approach to gradual, orderly, continuous improvement. In manufacturing settings improvements can take place in many forms such as reduction of inventory, and reduction of defective parts. One of the most effective tools of continuous improvement is 5S, which is the basis for an effective lean company.5Sisafrst,modularsteptowardseriouswastereductio n.
138/JNU OLE
Taken together, 5S means good housekeeping and better workplace organisation. Kaizentoolssuchas5Sarenotonlymeanstoincreaseproftability ofafrm butalso allow companies to reveal potential strengths and capabilities that are hidden before.
6.2.4 Just-In-Time
Closely associated with lean manufacturing is the principle of just-in-time, since it is a management idea that attempts to eliminate sources of manufacturing waste by producing the right part in the right place at the right time. This addresses waste such as work-in process material, defects, and poor scheduling of parts delivered. Inventoryandmaterialfow systemsaretypicallyclassifed aseitherpushorpullsystems. Customer demand is the driving force behind both systems. However, the major difference is in how each system handles customer demand.
Just-tin-Time is a tool that enables the internal process of a company of a company to adapt to sudden changes in the demand pattern by producing the right product at the right time, and in the right quantities. Moreover, just-in-time is a critical tool to manage the external activities of a company such as purchasing and distribution. It can be thought of as consisting of three elements:
JIT production:• Under JIT production raw material, subassemblies and fnished productinventoryarekepttoaminimumandtheleanmanufacturingprinciples are followed to eliminate inventory as a source of waste. Another type of waste that is eliminated under JIT production is overproduction. Since every process is producing is overproduction. Since every process is producing at a pace no higher than that of the subsequent process’s requirements, the need to produce more that what is needed is diminished.
JIT distribution:• JIT distribution requires the exchange of frequent, small lots of items between suppliers and customers, and must have an effective transportation management system because the transportation of inbound and outbound material can have a great effect on production when there is no buffer inventory. Under JIT distribution having a full truckload sometimes is diffcultduetothefrequentdeliveryofsmallerlots,whichinturnwillincreasethe transportation cost.
JIT purchasing:• Itisdefnedasthepurchaseofgoodssuchthattheirdeliveryimmediately precedes their demand, or as they are required for use. The idea of JIT purchasing runs counter to the traditional purchasing practices where materials are brought well in advance before their use. Under JIT purchasing activities such as supplier selection, product development and production lot sizing become very critical.
Just-in-Time and Lean
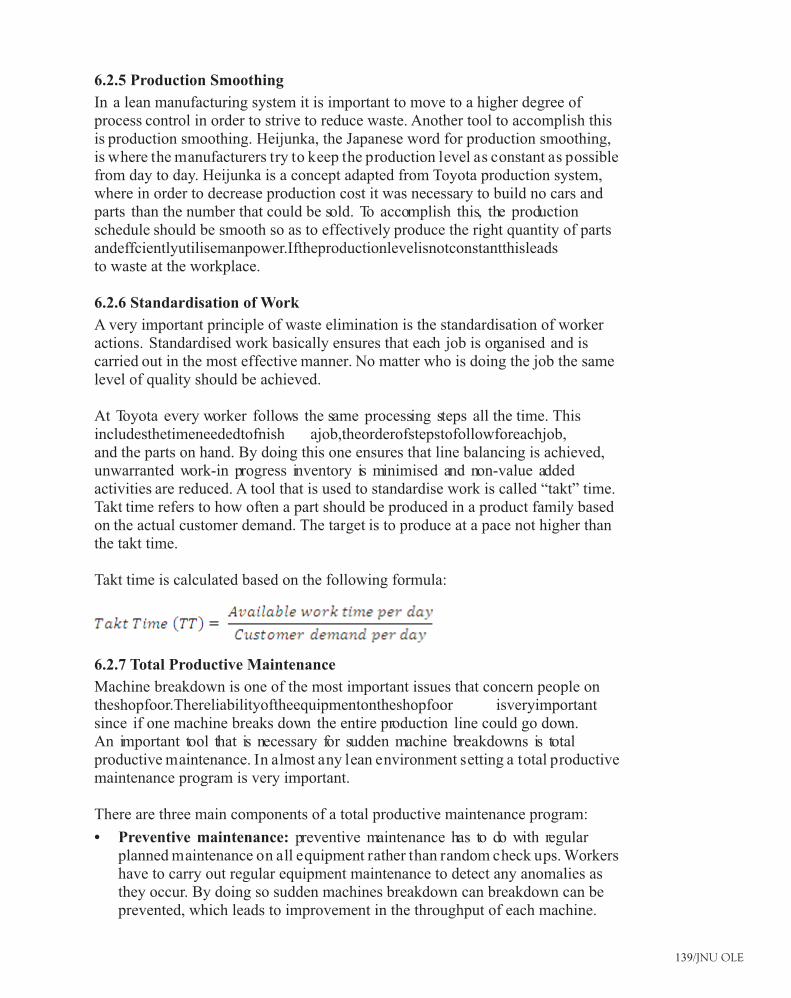
139/JNU OLE
6.2.5 Production Smoothing
In a lean manufacturing system it is important to move to a higher degree of process control in order to strive to reduce waste. Another tool to accomplish this is production smoothing. Heijunka, the Japanese word for production smoothing, is where the manufacturers try to keep the production level as constant as possible from day to day. Heijunka is a concept adapted from Toyota production system, where in order to decrease production cost it was necessary to build no cars and parts than the number that could be sold. To accomplish this, the production schedule should be smooth so as to effectively produce the right quantity of parts andeffcientlyutilisemanpower.Iftheproductionlevelisnotconstantthisleadsto waste at the workplace.
6.2.6 Standardisation of Work
A very important principle of waste elimination is the standardisation of worker actions. Standardised work basically ensures that each job is organised and is carried out in the most effective manner. No matter who is doing the job the same level of quality should be achieved.
At Toyota every worker follows the same processing steps all the time. This includesthetimeneededtofnish ajob,theorderofstepstofollowforeachjob,and the parts on hand. By doing this one ensures that line balancing is achieved, unwarranted work-in progress inventory is minimised and non-value added activities are reduced. A tool that is used to standardise work is called “takt” time. Takt time refers to how often a part should be produced in a product family based on the actual customer demand. The target is to produce at a pace not higher than the takt time.
Takt time is calculated based on the following formula:
6.2.7 Total Productive Maintenance
Machine breakdown is one of the most important issues that concern people on theshopfoor.Thereliabilityoftheequipmentontheshopfoor isveryimportantsince if one machine breaks down the entire production line could go down. An important tool that is necessary for sudden machine breakdowns is total productive maintenance. In almost any lean environment setting a total productive maintenance program is very important.
There are three main components of a total productive maintenance program:
Preventive maintenance:• preventive maintenance has to do with regular planned maintenance on all equipment rather than random check ups. Workers have to carry out regular equipment maintenance to detect any anomalies as they occur. By doing so sudden machines breakdown can breakdown can be prevented, which leads to improvement in the throughput of each machine.
140/JNU OLE
Corrective maintenance: • itdealswithdecisionssuchaswhethertofxorbuynew equipment. If a machine is always down and its components are always breaking down then it is better to replace those parts with newer ones. As a result the machine will last longer and its uptime will be higher.
Maintenance prevention:• it has to do with buying the right machine. If a machine is hard to maintain then workers will be reluctant to maintain the machine on a regular basis, which will result in a huge amount of lost money invested in that machine.
6.2.8 Other Waste Reduction Techniques
Some of the other waste reductions tools include zero defects, setup reduction, and line balancing. The goal of zero defects is to ensure that products are fault-free all the way, through continuous improvement of the manufacturing process. Human beings almost invariably will make errors. When errors are made and are not caught then defective parts will appear at the end of the process. However, if the errors can be prevented before they happen then defective parts can be avoided. One of the tools that the zero-defect principle uses is poke-yoke. Poke-yoke, which was developed by Shingo, is an autonomous defect control system that is put on a machine that inspects all parts to make sure that there are zero defects. The goal of poke-yoke is to observe the defective parts at the source, defect the cause of the defect, and to avoid moving the moving the defective part to the next workstation.
Ohno at Toyota developed SMED in 1950. Ohno’s idea was to develop a system that could exchange dies in a more speedy way. By the late 1950’s Ohno was able to reduce the time that was required to change dies from a day to three minutes. These are two types of setups:
Internal:• internal setup activities are those that can be carried out only while the machine is stopped while the machine is stopped.
External:• external setup activities are those that can be done while the machine is running.
The idea is to move as many activities as possible from internal to external. After allactivitiesareidentifedthenthenextstepistotrytosimplifytheseactivities.Byreducingthesetuptimemanybeneftscanberealised.First,die-changespecialistsare not needed. Inventory can be reduced by producing small batches and more variety of product mix can be run. Line balancing is considered a great weapon against waste, especially the wasted time of workers. The idea is to make every workstation produce the right volume of work that is sent to upstream workstations without any stoppage. This will guarantee that each workstation is working is a synchronised manner, neither faster nor slower than other workstations.
Just-in-Time and Lean
141/JNU OLE
6.3 Implementing Lean
Implementing of lean involves the following steps:
Senior Management InvolvementAsforanysignifcant processimprovementproject,thetotalcommitmentandsupport of the most senior management is essential. Problems will almost certainly arise during the implementation of lean production systems and those problems will likely only be solved if the senior management is fully committed to the successful implementation of lean.
Start with a Partial Implementation of LeanSome companies may initially implement only some of lean manufacturing and gradually shift towards a more complete implementation. In a 2004 survey of manufacturing companies in the U.S. by Industry Week Magazine, among companies which had commenced lean manufacturing programs, 39.1% reported implementing some aspects of lean, 55.0% reported implementing most aspects of lean and only 5.9% reported complete implementation of lean20.
Somesimplefrststepsmayinclude:
Measuring and monitoring machine capacity and output;•
Creatingmoreclearlydefnedproductionprocedures;•
Implementingthe5Ssystemforshopfoorhousekeeping;•
Streamlining the production layout.•
Start SmallWe recommend that companies try to implement lean as a test case at a small part of their operations before applying it through their entire operations, especially for the shift from a push-based to a pull-based system since this can potentially be disruptive. For example, the test case may be a single production line or a small series of processes. This will help to minimize the risk of disruption, help educate the staff on the principles of lean while also serving to convince others ofthebeneftsoflean.
Use an ExpertIt would be best to use the services of a lean manufacturing expert to help implement the lean manufacturing systems. In particular, the shift from a push-based to a pull-based production system can potentially be quite disruptive so it isbesttobeguidedbysomeonewhohassignifcantexperienceinthis.
Develop a planThe company should develop a detailed and clear implementation plan before proceeding with the conversion to lean manufacturing.
142/JNU OLE
Summary
Lean Manufacturing is an operational strategy oriented toward achieving the •shortest possible cycle time by eliminating waste.
Lean Manufacturing, also called Lean Production, is a set of tools and •methodologies that aims for the continuous elimination of all waste in the productionprocess.Themainbenefts ofthisare:lowerproductioncosts,increased output, and shorter production lead times.
Key principles of lean manufacturing: recognition of waste, standard processes, •continuousfow,qualityatthesource,pull-production,andcontinuousimprovement.
Elementsofleanare:value,valuestream,fow,pull,andperfection.•
Nine myths about lean are: it is about cutting costs, it is about internal •production, it is for manufacturing companies, it is the most important strategic objective, it is a series of techniques, it means just-in-time, it is forever, it stifesmotivation,andfrmscan’tbetoolean.
Into the 1980s, many product markets in the United States and Europe started •to come under pressure from foreign manufacturers. Products were being brought to market with higher quality and lower price.
Western manufacturers began to lose market share. Some manufacturers •faded away while others began to look diligently for better ways to compete. Many abandoned the old batch manufacturing models in favour of the more responsive method of Lean manufacturing in pursuit of the goals of faster response, fewer inventories, higher quality, and reduced costs.
Thetoolswhichareproductiveforleaninitiativesare:one-piecefow,•poka-yoke, visual management, 5S method, value stream mapping, kaizen, kanban,demandmanagement,heijunka,continuousfow andcelldesign,andchangeover reduction.
Cellular manufacturing is one of the cornerstones when one wants to become •lean. Cellular manufacturing is a concept that increases the mix of products with the minimum waste possible.
Continuous improvement is another fundamental principle of lean •manufacturing. Kaizen which is Japanese word for a continuous endeavour for perfection has become popular in the west as a paramount concept behind good management. Kaizen is a systematic approach to gradual, orderly, continuous improvement.
Closely associated with lean manufacturing is the principle of just-in-time, since •it is a management idea that attempts to eliminate sources of manufacturing waste by producing the right part in the right place at the right time.
Standardised work ensures that each job is organised and is carried out in •the most effective manner. No matter who is doing the job the same level of quality should be achieved.
An important tool that is necessary for sudden machine breakdowns is total •productive maintenance.
Just-in-Time and Lean
143/JNU OLE
There are three main components of a total productive maintenance •program: preventive maintenance, corrective maintenance, and maintenance prevention.
The other waste reductions tools include zero defects, setup reduction, and •line balancing.
Implementation of lean involves: senior management involvement, start with •a partial implementation of lean, start small, use an expert, and develop a plan.
References
Hobbs, P., 2003. • Lean Manufacturing Implementation : A Complete Execution Manual for Any Size Manufacturer [Online] Available at: <http://site.ebrary.com/lib/utspune/docDetail.action?docID=10326230&p00=lean+manufacturing> [Accessed 8 July 2011].
Breyfogle III, F., 2007. • Lean Tools That Improve Processes: An Overview [pdf]Availableat:<http://www.bptrends.com/publicationfles/FOUR%2003-07ART-LeanToolsThat%20ImproveProcesses-Breyfogle-Final.pdf> [Accessed 8 July 2011].
LeanManuTools, 2008. • Lean Manufacturing [Video Online] Available at : <http://www.youtube.com/watch?v=WEIeQRp4AHU> [Accessed 8 July 2011].
gembaacademy, 2009. • Introduction to Lean Manufacturing [Video Online]Available at: <http://www.youtube.com/watch?v=ZdHGTCXcJQU> [Accessed 8 July 2011].
Ruffa, S., 2008. • Going Lean: How the Best Companies Apply Lean Manufacturing Principles to Shatter Uncertainty, Drive Innovation, and Maximize Profts . AMACOM.
Pascal, D., 2007. • Lean Production Simplifed . 2nd ed., Productivity Press.
Recommended Reading
Carreira, B., 2004. • Lean Manufacturing That Works: Powerful Tools for Dramatically Reducing Waste and Maximizing Profits . McGraw-Hill Professional.
Mann, D., 2010. • Creating a Lean Culture: Tools to Sustain Lean Conversions. 2nd ed., Productivity Press.
Wilson, L., 2009. • How To Implement Lean Manufacturing. McGraw-Hill Professional.
144/JNU OLE
Self Assessment
Lean manufacturing is a set of tools and methodologies that aims for the 1. continuous elimination of all __________ in the production process.
stepsa.
wasteb.
inventoryc.
uncertaintyd.
Which of the following statements is false?2. Lower inventories also mean higher working capital requirements.a.
Leanusuallyaimsfortheimplementationofacontinuousproductionfowb. freeofbottlenecks,interruption,detours,backfowsorwaiting.
Pull-production aims to produce only what is needed, when it is needed. c.
Lean requires striving for perfection by continually removing layers of d. waste as they are uncovered.
A very important principle of waste elimination is the __________ of worker 3. actions.
eliminationa.
reductionb.
standardisationc.
implementationd.
The goal of __________ is to ensure that products are fault-free all the way, 4. through continuous improvement of the manufacturing process.
one-piecefowa.
visual managementb.
5S methodc.
zero defectsd.
Which of the following describes the concept of cellular manufacturing?5. increases the mix of products with the minimum waste possiblea.
each job is organised and is carried out in the most effective mannerb.
producetherightquantityofpartsandeffcientlyutilisemanpowerc.
producing the right product at the right time, and in the right quantitiesd.
Just-in-Time and Lean
145/JNU OLE
__________ time refers to how often a part should be produced in a product 6. family based on the actual customer demand.
leada.
taktb.
productionc.
standardd.
Which of the following statements is true?7. Machine breakdown is one of the least important issues that concern people a. ontheshopfoor.
An important tool that is necessary for sudden machine breakdowns is b. total preventive maintenance.
5S means good housekeeping and better workplace organisationc.
When customers demand a low variety of products as well as faster delivery d. rates, it is important in the process to accommodate their needs.
Which of the following is the Japanese word for production smoothing?8. poka-yokea.
kaizenb.
Heijunkac.
kanband.
Which of the following techniques depends upon the creation of standardised 9. work?
The 5S Methoda.
Value Stream Mappingb.
Kaizenc.
Demand Managementd.
A system that creates product that is then sold after it is produced is called a 10. _______system.
pulla.
pushb.
kanbanc.
JITd.
146/JNU OLE
Case Study I
Kanban ImplementationA Global manufacturing organisation in UK facility, was embarking on a lean manufacturing programme.
Business situationThe company was experiencing high inventory levels and poor customer delivery performance. It was using a traditional MRP system which grouped all supply requirements into weekly buckets. A supplier partnership programme had been launched separately which had driven down material lead times but these were ofnouseunlessthecompanycouldfnd awayofschedulingmaterialsmorefrequently than the business system allowed.
SolutionAkanbanreplenishmentprogrammewasidentifed asasolution.Tolaunchtheprogramme, a number of training workshops were held. These were structured using a game in which the attendees took on the roles of various employees within a manufacturing business. Different supply scenarios were played, starting with no kanban processes and then gradually introducing them. The aim was to demonstrate,fromapracticalperspective,thebenefts thatcouldbeachievedbyimplementing kanban.
Withinthisorganisation,kanbanwasimplementedintwomainareas.Thefrstof these was components purchased from third party vendors. For this, kanban training was conducted with key vendors and subsequently worked further downstream so their vendors also held kanbans to support the short lead time requirements.
The second main area of implementation was manufactured sub-assemblies (e.g. mouldings) transferred to assembly areas for consumption. As part of this internal kanbanimplementation,theshopfoor materialhandlerstookoverresponsibilityfor reordering their materials. However, as the planning department still maintained the data on the MRP system, the next phase of the implementation was to consider automation.
A team was formed to find and implement a solution, which comprised representativesfromtheshopfoor,planning,supplychaindevelopmentmanagerand a member of the business system software company. Bar-coding was the selectedsolutionasitsatisfedallkeyrequirements:
Visual signal for kanban status:• Simple barcode label with a ‘slider’ which the operator moved when taking the last items out of the bin. This revealed a ‘red’ signal which triggered replenishment actions
Eliminate manual processing:• Materials handler scanned the barcode of all labels with red signal (and moved the slider to another position to indicate action taken)
Just-in-Time and Lean
147/JNU OLE
Automatic creation of output documents:• Scanned information was transferred to MRP system and purchase schedule or production order was created automatically with relevant documents.
BeneftsAsthiswaspartofamulti-facetedprogrammetore-engineertheorderfulflmentprocess, it was not possible to directly attribute the improvements only to the kanban programme. However it was a contributing factor to the following improvements:
Customerdeliveryperformancetofrstpromiseimprovedfrom25%to•93%
Component inventory turns improved to 15•
Planning department removed and people redeployed to other areas of the •business.
In addition, we helped develop a robust kanban implementation process, which proved easily transferable to other parts of the global organisation. The kanban workshop was used to do initial training and then a pilot cell was selected to run the kanban. The concept of FMEA (Failure Mode and Effect Analysis) was integrated into the process, so that all potential concerns could be addressed before implementation.
(Source: http://www.vision4value.co.uk/KANBAN-IMPLEMENTATION.pdf)
Questions:What were the two main areas of kanban implementation?1.
Answer:
The two main areas were:
Thefrstofthesewascomponentspurchasedfromthirdpartyvendors.Forthis,•kanban training was conducted with key vendors and subsequently worked further downstream so their vendors also held kanbans to support the short lead time requirements.
The second main area of implementation was manufactured sub-assemblies •(For example, mouldings) transferred to assembly areas for consumption.
Whatwasselectedasasolutionandwhatrequirementsitfulflled?2.
Answer:
Bar-codingwastheselectedsolutionasitsatisfedallkeyrequirements:
Visual signal for kanban status: Simple barcode label with a ‘slider’ which •the operator moved when taking the last items out of the bin. This revealed a ‘red’ signal which triggered replenishment actions
Eliminate manual processing: Materials handler scanned the barcode of all •labels with red signal (and moved the slider to another position to indicate action taken)
148/JNU OLE
Automatic creation of output documents: Scanned information was transferred •to MRP system and purchase schedule or production order was created automatically with relevant documents.
What benefits did the company received after the implementation 3. programme?
Answer:
Kanban was a contributing factor to the following improvements:
Customerdeliveryperformancetofrstpromiseimprovedfrom25%to•93%
Component inventory turns improved to 15•
Planning department removed and people redeployed to other areas of the •business.
Just-in-Time and Lean
149/JNU OLE
Case Study II
JIT and lean manufacturingThere was a factory named “ABC” with a long established manufacturer of “traditional” board games and similar products such as puzzles, art and craft sets, painting by numbers and the like.
Thecompanywaslocatedinthemiddleofalargetowninamagnifcent seriesof very old building that were over 150 years old, they employed over a hundred staff and supplied direct to toy stores and other companies across the UK and Europe.
The company had a huge range of products, many hundreds of variants that they supplied from stock held in the largest part of their facility, the products themselves were assembled on simple production lines which basically selected all of the required components and placed them into the required packaging. There was a limited amount of injection molding to produce plastic game pieces, most component parts being brought in.
The process was very simple, the lines did not take long to set up and all components were close to hand, each “line” was run by only one to three people andeach“box”wasswiftlyflled andwrapped.Therewereanumberofsparelines that were being kitted up for production that the operators moved onto when theywerefnishedwiththeproducttheywereproducing.
Theotherhalfofthebusinessconcernedorderfulflment, operatorstooklistsoforders from the many customers and worked their way through the many rooms ofthewarehousetoassemblethespecifccustomerorders,generallyasmallpalletofproductscomprising20to30differentproductsofsinglefgurequantities.
Somefactsandfguresregardingtheoperationtoillustratesomeissues,theturnoverofthefactorywasalittleover2millionUKpoundseveryyear,afgurethat was declining due to competition in a price sensitive market. The business wasoperatingataloss!Stockholdingoffnished goodswasalmost2andahalfmillion UK pounds, over a years worth of stock sat in the warehouse! Each year thecompanywroteoffaround5%to10%ofthisfgureasbeingobsolete.
The production operators made up around 40% of the total staff of the company. Around 50% of the staff was employed in the warehouse, the remaining 10% beingemployedwithintheoffces.
150/JNU OLE
Accordingtotheownerconfded manycustomerslikedtheirproductsthereweremany cheaper products on the market and that although some of the other suppliers werelessfexible thantheywere,thecustomershadtopurchaseelsewheretoget the reduced prices. The business could not afford to reduce prices any further as they were already making a loss and needed to rapidly cut costs. They were considering making redundancies and were fearful that they would have to close all together.
(Source: http://howtoimplementleanmanufacturing.blogspot.com/2010/04/just-in-time-case-study.html)
Questions:Suggest a method for the above scenario so that the factory doesn’t have to 1. be shut down.What all steps the owner should take to maintain its competitive streak in the 2. market?What are the things that the owner need to care of while making the changes 3. in the factory setup?
Just-in-Time and Lean
151/JNU OLE
Case Study III
SMEDA Steel Tools Manufacturer in the mid-West of the USA instituted a Lean programme for inventory the production facility struggled. They were not able togetagoodproductmixouttothefnished goodsinventoryduetorelativelylongchangeovertimesforcuttingdies.Steeltool(fnal product)cuttingdiesneed to be replaced after every 4 Kanban batch runs of 225 pieces each. This frequent changeover, occurring once every hour of work is necessary to maintain and re-sharpen the cutting die’s cutting edges. Current changeover time for the cutting die was approximately 60 minutes and included the use of a single 10 ton forklift though the die weight was 5 tons. Nearly 50% of a working day was ‘wasted’ on changeovers not including the impact of the ‘inability’ to achieve a high product mix for agility to meet with product demand requirements of a Lean programme.
Some facts:
Long travel time/distance from maintenance room to machine line(s) with •an average of 200 metres travelled per die accounting for 10 minutes of changeover time
Toolcuttingcellwasraised1.5metresoffthefoorthushoistingofdie•necessitated a larger then absolutely necessary forklift and thus incurring morefoor spaceformovementandaslowerpaceofmovement(dieliftedtoutilize gravity during cutting process – hoisting both ways accounted for 15 minutes of changeover time)
Damage to die when transporting the rectangular shaped hardened steel •cuttingdiecausedpoorfts tocuttingmachineduringassembly(alsorelatedto hoisting)
Poorftscalledforavarietyofsecuringboltsizestobereadiedforinstallation•ofdie(securingboltshavetobemachinedtore-ftthedieafterdamagefrom transportation and hoisting which costs an average of 15 minutes for ‘customising’ new bolts)
Post installation inspection and test run of cuts yield acceptable rates of 95% •variance(innumberofpiecesconformingtospecifcations);lowerrateswouldmean a re-stripping and re-installation of a spare die (test runs took 10 minutes includingfnal setupandrunof5minutes).Diere-installationoccurredinapproximately 8% of die changes.
152/JNU OLE
Suggestions by the tooling supervisorThe tooling supervisor COE sought to shorten the travel time between the parts room and the actual line and recommended that the production line be re-aligned to bring it closer to the parts room as the parts room was purpose built and could not be dismantled as easily as the production cell. A secondary plan prior to the implementation of the cell re-alignment was to line up spare dies next to one side of the cutting cell. The latter was implemented immediately and this cut the external setup time down from 10 minutes (travel time, lifting and aligning) to 3 minutes (to lift, shift by 3 metres and align the die slab).
Raising the cutting cell platform to utilize gravity was an energy saving measure practiced by the plant. To reduce the hoisting time and damage possibilities COE recommended and the plant implemented that a pit of re-enforced concrete be dug with guide rails for the die slab installed so that the die slab could be lowered down instead of being hoisted higher for stripping and installation. This investment resulted in lower weight forklift requirements (down to 7 tons) and increased agility of the forklift around the work area thus reducing working times by 10 minutes to reach a 5 minute time for this step. The guide rails increased the safety of the tooling team while also reducing the time required to manually align the die to the cutting cell.
The purchase and use of hardened rubber ‘boots’ for the corners and sides of the die slabs reduced the damage of the die from some 15% occurrence to less than 1% occurrence and this decreased both the frequency of required re-installation of ‘new’ dies and the machining of bolts to hold the die in place for cutting. An overall reduction of average time in this aspect of changeover resulted in a 12 minute reduction to 3 minutes overall and also lowered costs in relation to the number of new bolts required since damage was considerably less.
Tolowerfnalsetup,inspectionandtestruntimeweexperimentedover4weekendsand many nights the possibility of utilize a simulacrum of hardened wax that could be cut in the tooling room. This simulacra and a horizontal machine setup instead of a vertical machine setup to utilize gravity allowed for the correction of variance is the cutting die to be increased from 95% accuracy to 99% accuracy while ensuringthatnodiecontaininghighvariancewassenttotheshopfoor. Testingand implementation over a period of 3 months showed a rate of re-installation that was less than 1% of changeovers during the implementation period.
The changes in projects costs and yieldsOverall the cutting die changeover time decreased from about 60 minutes to approximately 11 minutes with a dramatically lower rate of rejects for re-cut dies.
Primary improvements gained from the investments made on this project were an increase in product mix from 4 per shift to 7 per shift which enabled the production facility to meet varying customer demands as dictated by distribution
Just-in-Time and Lean
153/JNU OLE
centre Kanban systems. This represented an increase of OTIF delivery rates (to FG staging area) of 93% to 99.5% in terms of mix and volume. Operator productivity levels and machine up times were increased from approximately 50% to 85% as internally measured by the customer.
Secondary improvements included lower forklift movement (energy consumption) andasaferworkingenvironment(lessermachinemovementontheshopfoor).Movementsaroundtheshopfoor arealsonowslightlyquickerduetoasmallersized / tonnage forklift in use.
Before After
Cutting Die C/O Time 60 min 11 min
Product Mix per shift 4 products 7 products
OTIF Delivery Rate 93% 99.5%
Machine Up-Time 50% 85%
Machine Staff 8 7
Costs for this SMED implementation crossed a little over USD 100K for all the work and materials bought and used in the plant. This amount was recouped in a matter of 4 months from an accounting perspective which did not include intangibles such as improved workplace safety and the cost of re-installing re-cutdies.Customersatisfactionlevelswerenotmonetisedforbeneft accrualonthis project.
Tooling team productivity increased by some 20% and 1 (out of 8) tool maintenance personnel were re-assigned to another area of the plant. Today the tooling team operates on an excess capacity basis and spend more time on reducing the variation of re-cut dies. This work has generated an excess number of spare dies that is truly required by the plant which was then sold to a similar plant (different company) in Asia.
(Source: http://www.coe-partners.com/Articles/SMED%20Case%20Study.pdf)
Questions:What was the main problem faced by the manufacturing company?1. List the changes suggested by the tooling supervisor.2. What impact does these changes has on the project and yields?3.
154/JNU OLE
Bibliography
References
askdeb.com, 2011. • MRP Inventory Management [Online] Available at: <http://www.askdeb.com/inventory-management/mrp/> [Accessed 6 July 2011].
ateneonline.it, 2003. • technical note fve – FACILITY LAYOUT [pdf] Available at: <http://www.ateneonline.it/chase2e/studenti/tn/6184-7_tn05.pdf> [Accessed 12 July 2011]
Bicheno, J., 1997. • Operations Management: An Active Learning Approach . Wiley-Blackwell.
Breyfogle III, F., 2007. • Lean Tools That Improve Processes: An Overview [pdf]Availableat:<http://www.bptrends.com/publicationfles/FOUR%2003-07ART-LeanToolsThat%20ImproveProcesses-Breyfogle-Final.pdf> [Accessed 8 July 2011].
Broyles, D., 2005. • Just-In-Time Inventory Management Strategy & Lean Manufacturing [Online] Available at : <http://www.academicmind.com/unpublishedpapers/business/operationsmanagement/2005-04-000aaf-just-in-time-inventory-management.html> [Accesses 1 July 2001].
businesslink.gov.uk, 2010. • Manufacturing innovation [Online] Available at : < http://www.businesslink.gov.uk/bdotg/action/detail?itemId=1074405965&type=RESOURCES> [Accessed 12 July 2011]
Cheng, T. & Podolsky, S., 1996. • Just-In-Time Manufacturing – An Introduction. 2nd ed., Chapman & Hall.
gembaacademy, 2009. • Introduction to Lean Manufacturing [Video Online] Available at: <http://www.youtube.com/watch?v=ZdHGTCXcJQU> [Accessed 8 July 2011]
gembaacademy, 2009. • Quisk Changerover & SMED Overview [Video Online] Available at: < http://www.youtube.com/watch?v=jW-pl4HBxWM&playnext=1&list=PL738D3FD21583EF8D> [Accessed 13 July]
Girsih, B.. • Single Minute Exchange of Die [pdf] Available at: <http://www.productivity.in/knowledgebase/TQM/d.%20TQM%20Concepts/Single%20Minute%20Exchange%20of%20Dies.pdf> [Accessed 13 July 2011]
Heizer, J., 2010. • Operations Management. 9th ed., Prentice Hall
Hobbs, P., 2003. • Lean Manufacturing Implementation : A Complete Execution Manual for Any Size Manufacturer [Online] Available at: <http://site.ebrary.com/lib/utspune/docDetail.action?docID=10326230&p00=lean+manufacturing> [Accessed 8 July 2011]
Ignousoet, 2010. • Just in Time [Video Online] Available at: <http://www.youtube.com/watch?v=i6wS4TAF2es> [Accessed 1 July 2011].
ignousoms, 2010. • Facility layout [Video Online] Available at : < http://www.youtube.com/watch?v=f721jY_MPPo&NR=1> [Accessed 12 July 2011].
Just-in-Time and Lean
155/JNU OLE
javiermasini, 2009. • Push vs. Pull [Video Online] Available at: <http://www.youtube.com/watch?v=Y_OOE8Dz7NI> [Accessed 6 July 2011].
Kumar, S. & Suresh, N., 2009. • Operations Management. New age international publishers.
LeanManuTools, 2008. • Lean Manufacturing [Video Online] Available at : <http://www.youtube.com/watch?v=WEIeQRp4AHU> [Accessed 8 July 2011].
Leannovation, 2009• . Kanban Explanation [Video Online] Available at: < http://www.youtube.com/watch?v=tum1lLwy6gE> [Accessed 13 July 2011]
Logistil.com, 2009. • Just-In-Time principles [Online] Available at : <http://logisitik.com/learning-center/just-in-time-principles.html> [Accessed 1 July 2011].
mahematics, 2007. • Prof. Shivanandan Plant Layout [Video Online] Available at: <http://www.youtube.com/watch?v=9rfqwRM6NGw&NR=1> [Accessed 12 July 2011].
me.utexas.edu. • Facility Layout [Online] Available at: <http://www.me.utexas.edu/~jensen/ORMM/omie/design/unit/layout/layout.pdf> [Accessed 12 July 2011].
Pascal, D., 2007. • Lean Production Simplifed . 2nd ed., Productivity Press.
riramb2011, 2008. • Push vs. Pull [Video Online] Available at: <http://www.youtube.com/watch?v=688wwU9F-xc&NR=1> [Accessed 6 July 2011].
Roy, R., 2005. • Modern Approach to Operations Management . New Age International.
Ruffa, S., 2008. • Going Lean: How the Best Companies Apply Lean Manufacturing Principles to Shatter Uncertainty, Drive Innovation, and Maximize Profts . AMACOM.
Russell, R., 2010. • Operations Management: Creating Value Along the Supply Chain. 7th ed., Wiley.
tplean.com, 2011. • Single Minute Exchange of Die (S.M.E.D) [Online] Available at: <http://tpslean.com/leantools/smed.htm> [Accessed 13 July 2011].
velaction.com, 2010. • Lean term: Push System [Online] Available at: <http://www.velaction.com/push-system-lean-pdf/> [Accessed 6 July 2011].
virtualstrategist, 2008. • How to Develop Competitive Advantage [Video Online] Available at :< http://www.youtube.com/watch?v=S9O2oPbT3fs> [Accessed 12 July 2011].
Vollman, T. & Berry, W., 2004. • MANUFACTURING PLANNING AND CONTROL SYSTEMS FOR SUPPLY CHAIN MANAGEMENT : The Defnitive Guide for Professionals. 2004. 5th ed., McGraw-Hill.
wisegeek.com, 2011. • What Is the Difference Between MRP and JIT [Online] Available at: < http://www.wisegeek.com/what-is-the-difference-between-mrp-and-jit.htm> [Accessed 12 July 2011].
156/JNU OLE
Wsbmilc, 2008. • The Advantages of JIT [Video Online] Available at: < http://www.youtube.com/watch?v=XkWIG12nfcI&NR=1> [Accessed 1 July 2011].
Recommended Reading
Basu, R., 2005. • Total Operations Solutions. Butterworth-Heinemann.
Boyer, K. & Verma, R., 2009. • Operations and Supply Chain Management for the 21st Century. South-Western College Pub.
Brown, S. 2000. • Strategic Operations Management . Butterworth-Heinemann.
Carreira, B., 2004. • Lean Manufacturing That Works: Powerful Tools for Dramatically Reducing Waste and Maximizing Profits . McGraw-Hill Professional.
Dennis, P., 2002. • Lean Production Simplifed: A Plain-Language Guide to the World’s Most Powerful Production System. Productivity Press.
Gross, J. & McInnis, K., 2008. • Kanban Made Simple. Amacom.
Hay, E., 1988. • Just-In-Time Breakthrough: Implementing the New Manufacturing Basics. John Wiley & Sons Inc.
Hayes, R., & Wheelwright, S., 1988. • Dynamic Manufacturing: Creating the Learning Organization. Free Press.
Hirano, H., 2009. • JIT Implementation Manual -- The Complete Guide to Just-In-Time Manufacturing. 2nd ed., Productivity Press.
Hutchins, D., 1998. • Just in Time. 2nd ed., Gower Pub Co.
Jacobs, F., 2011. • Manufacturing Planning and Control for Supply Chain Management. McGraw-Hill Professional.
Louis, R., 2006. • Custom Kanban: Designing the System to Meet the Needs of Your Environment. Productivity Press.
Mann, D., 2010. • Creating a Lean Culture: Tools to Sustain Lean Conversions. 2nd ed., Productivity Press.
Meredith, J., 2002. • Introducing Operations Management. Wiley.
Schniederjans, M., 1999. • Advanced Topics in Just-In-Time Management . Quorum Books.
Shim, J., 1999. • Operations Management. Barron’s Educational Series.
Wild, T., 1998. • Best Practice in Inventory Management. Wiley.
Wilson, L., 2009. • How To Implement Lean Manufacturing. McGraw-Hill Professional.
Just-in-Time and Lean
157/JNU OLE
Self Assessment Answers
Chapter Ib1. c2. a3. d4. b5. c6. c7. a8. d9. c10.
Chapter IIb1. b2. c3. a4. c5. b6. b7. d8. d9. b10.
Chapter IIIb1. a2. c3. d4. d5. a6. d7. b8. a9. c10.
158/JNU OLE
Chapter IVc1. a2. d3. a4. c5. b6. a7. b8. c9. c10.
Chapter Vc1. b2. a3. d4. d5. a6. c7. d8. a9. c10.
Chapter VIb1. a2. c3. d4. a5. b6. c7. c8. a9. b10.
Just-in-Time and Lean